63
Health and Caregiving among the 50+: Ownership, Use and Interest in Mobile Technology January 2011

Health and Caregiving among the 50+:
Ownership, Use and Interest in Mobile Technology
January 2011

Health and Caregiving among the 50+:
Ownership, Use and Interest in Mobile Technology
Linda L. Barrett, Ph.D.
AARP Research and Strategic Analysis
Data collected by Knowledge Networks
Copyright©2011
AARP
Research & Strategic Analysis
601 E Street NW
Washington, DC 20049
http://www.aarp.org/research
Reprinting with permission

AARP is a nonprofit, nonpartisan social welfare organization with a membership that helps people 50+ have independence, choice and control in ways that are beneficial and affordable to them and society as a whole. AARP does not endorse candidates for public office or make contributions to either political campaigns or candidates. We produce AARP The Magazine, the definitive voice for 50+ Americans and the world's largest-circulation magazine with over 35.1 million readers; AARP Bulletin, the go-to news source for AARP's millions of members and Americans 50+; AARP VIVA, the only bilingual U.S. publication dedicated exclusively to the 50+ Hispanic community; and our website, AARP.org. AARP Foundation is an affiliated charity that provides security, protection, and empowerment to older persons in need with support from thousands of volunteers, donors, and sponsors. We have staffed offices in all 50 states, the District of Columbia, Puerto Rico, and the U.S. Virgin Islands.
Acknowledgements: The author would like to thank Margaret Hawkins, Issues Manager, Education and Outreach, and Bill Walsh, Senior Strategic Advisor, Research and Strategic Analysis for their work defining the substantive issues to be covered in this study and for reviewing the questionnaire and report. Thanks also go to Larry Osborn at Knowledge Networks for his assistance with data collection, Jennifer Leslie for her technical skills number checking and finalizing the report, and to Teresa A. Keenan, Ph.D. for peer review and comments.

Contents
Executive Summary ...................................................................................................................... 1
Conclusions ......................................................................................................................... 2
Methodological Summary .................................................................................................... 3
Detailed Findings .......................................................................................................................... 4
Cell Phone or Mobile Phone Ownership .............................................................................. 4
Ownership of Other Hand-held Devices .............................................................................. 5
Usage of Hand-held Mobile Devices ................................................................................... 7
Hand-held Devices Carried Away from Home ..................................................................... 10
Level of Interest in Using Mobile Technology to Track Health ............................................ 11
Caregivers ........................................................................................................................... 18
Caregivers’ Level of Interest in Using Mobile Technology ................................................... 19
Conclusions ......................................................................................................................... 20
Appendix A
Caregivers’ Ownership and Use of Hand-held Mobile Devices ........................................... 21
Annotated Questionnaire ................................................................................................................. 23
Knowledge Networks Field Report .................................................................................................. 47

Tables
Table 1 Mobile Technology Ownership by Gender and Age ………………………………….5
Table 2 Mobile Technology Ownership by Marital Status, Education, Income………………6
Table 3 Purpose for Using Cell Phone or Mobile Phone……………………………………….7
Table 4 Amount of time Laptop or Tablet Computer is Used in a Typical Day………………8
Table 5 Purpose for Using Laptop or Tablet Computer in a Typical Day……………………. 9
Table 6 Proportion of Respondents who Strongly or Somewhat Agree with statements about Perceived Benefits and Barriers to Using Mobile Devices to Send or Receive Health Information ..................................................................................... 17
Table 7 Caregivers’ Perceived Benefits and Barriers to Using a Mobile Device to Help Someone Age 50 +…………………………………………………………………19
Figures
Figure 1 Mobile Technology Ownership among the 50+ ................................................................ 4
Figure 2 Hand-held Device Taken When Leaving Home ............................................................... 10
Figure 3 Use or Interest in Using Mobile Technology to Track Health ........................................... 11
Figure 4 Use or Interest in Sending Health Indicators to Health Care Professional ....................... 12
Figure 5 Use or Interest in Allowing Selected People to Receive Information about One’s Location .................................................................................................................. 13
Figure 6 Use or Interest in Mobile Technology to Motivate or Adopt Healthy Behaviors ............... 14
Figure 7 Use or Interest in Mobile Technology to Remind You to Engage in Healthy Behaviors ............................................................................................................ 15
Figure 8 Use or Interest in Receiving Text-message Alerts (Health Tips) ...................................... 16

Health and Caregiving among the 50+: Ownership, Use and Interest in Mobile Technology; January 2011 1
Health and Caregiving among the 50+:
Ownership, Use and Interest in Mobile Technology
Executive Summary
The purpose of this study is to examine the ownership, usage, and interest in hand-held mobile technology among the 50+ population. We are especially interested in learning whether people 50+ take mobile devices with them when they leave home, and their current usage or interest in using mobile devices to manage their health or the health of someone 50+ they assist.
This survey shows that cell phones are the mobile technology of choice among people age 50+. While cell phones could be a productive means of communicating with this audience there are some mixed findings about respondents’ receptivity about how they are used. While a minority of the 50+ currently use a mobile technology to track their health, a substantial proportion are at least somewhat interested in doing so. Interest waned, however, when we asked about using mobile technology to share health information with a health care professional, tracking one’s location with a GPS, and using mobile technology to motivate or adopt healthy behaviors. The results show caregivers’ interest also varies.
Mobile Technology Ownership: The majority of people age 50+ own some type of mobile technology (89%) and nearly eight out of ten (79%) people report owning a cell phone. Laptop or tablet computer come in second place (42%) followed by, portable media players (16%), hand-held global positioning systems (15%), smart phones (7%), and portable electronic book readers (3%). More than four in five (87%) mobile technology owners say that when they leave their home they usually take a hand-held device with them. Not surprisingly, cell phones are the most frequently mentioned mobile device that respondents say they take with them when they leave home (88%). Smart phones are a distant second again, based on vastly lower rates of smart phone ownership (7%).
Mobile Technology and Health: Approximately half of people age 50+ use or are interested in using mobile technology to support their health. About one in ten (11%) currently uses a mobile technology to track their health measures over time such as their weight, blood sugar, or blood pressure, and another four in ten (42%) say they are either very or somewhat interested in doing the same.1 Although only four percent already use their mobile device to share this information with their health professional, about four in ten are interested in doing so (39%). These findings suggest there is a substantial audience interested in using mobile technology, especially cell phones, to support and track their health. However, it is important to note that the results are mixed. Between 47 percent and 73 percent of adults age 50+ indicate a lack of interest in using these devices to support their health.
1 Although 11% did not currently own any of the devices we asked about, we included them in the questions about interest in using technology.

Health and Caregiving among the 50+: Ownership, Use and Interest in Mobile Technology; January 2011 2
Mobile Technology and Caregiving: When we turn our attention to caregivers, we find one in five (20%) adults say they provide assistance to someone age 50+ with activities of daily living (ADLs) and three in ten (30%) say they provide assistance to someone age 50+ with instrumental activities of daily living (IADLs).2 Among people who provide assistance to someone age 50+ with ADLs or IADLs about one in six (17%) say they currently use any mobile technology to help track the health of the person they help.3 Not surprisingly, among those who currently use any mobile technology to track the health of the person they help, the vast majority (89%) report using a cell phone or mobile phone to accomplish this task, and about one-third (34%) report they currently use a laptop or table computer to do the same.
When asked about mobile technology that allows the caregiver to be informed if the person they assist needs help, only three percent report currently using this technology but almost four in ten (39%) say they are very interested or somewhat interested in using one of these technologies. Similarly, while only one percent said they already use technology that can inform them if the person they assist experiences a change in their usual routine, more than one-third (36%) say they are very or somewhat interested in using one of these technologies. About three percent currently use a mobile technology to be informed about health indicators of the person they assist and nearly four in ten (37%) say they are very or somewhat interested in using these technologies. This suggests that although current usage is relatively low, nearly four in ten caregivers are at least somewhat interested in knowing more about technologies that could help them with their caregiving responsibilities.
Conclusions
The 50+ population is often portrayed in a limited number of stereotypes while, in fact, we know it is a heterogeneous group. While caregivers and care recipients are less heterogeneous than the total 50+ population, they do have a range of needs which are often related to the degree to which they require or give assistance. Therefore, it is not surprising that some of the results from this survey are mixed. The findings suggest that while cell phones have been widely adopted, the usage of other hand-held devices is lower and the use of these devices for health purposes varies. The detailed results show that there are niches of people within the overall group who are more or less interested in using hand-held devices for health purposes. Often demographic variables help to define levels of interest or usage (older or younger, widowed or married). This suggests the need to consider segmenting this population based on the needs and interest of both the 50+ population and the subset of people who are caregivers.
2 Activities of daily living include helping someone get in and out of bed, help getting dressed, help getting to and from the toilet, help getting in or out of the bathtub or shower, help dealing with incontinence or diapers, help by feeding him or her, help giving medicines, pills, or injections, and instrumental activities of daily living include help managing finances (such as paying bills, or filling out insurance claims), help grocery shopping, helping doing housework (like dishes, laundry, or straightening up), help preparing meals, help providing transportation by driving or helping get the person transportation, help arranging or supervising services from an agency, such as nurses or aids. 3 Mobile technology includes a mobile phone, smart phone, laptop or tablet computer, hand-held global positioning system, portable media player, or portable electronic book reader.

Health and Caregiving among the 50+: Ownership, Use and Interest in Mobile Technology; January 2011 3
Three examples of how these findings can be applied to specific sub-groups stand-out. First,
The oldest adults in this study, women, widows and those with lower educational levels are especially likely to carry cell phones with them when they leave home, but are much less likely to be smart phone owners. Therefore, rather than developing smart phone applications, focusing on cell phone use among this segment of the 50+ population could provide a productive way to target health promotion programs to an audience that could use and benefit from this outreach.
Another example is that one in ten people 50+ already uses a mobile device to track their health. Women 50+, African Americans 50+, and the affluent are especially interested in using mobile technology to track their health over time (weight, blood sugar, blood pressure) but do not currently do so. Consequently this group appears to be a niche audience that would be receptive to messages about this issue and how to begin using such devices to track their health.
Finally, nine in ten caregivers 50+ who assist someone 50+ currently use cell phones, but eight in ten (83%) caregivers say they do not use any mobile device to help track the health of the person they assist. Given the high cell phone usage among this group, helping them to understand and use the technology they already have to help them in their caregiver role is a win-win situation.
These are just a few examples of how this study can guide our educational efforts to reach these sub-groups with education about how mobile technologies can help improve their health care and the health of those 50+ they assist. Other examples can be found in the detailed results section of this report.
Methodological Summary
AARP staff designed the questionnaire which Knowledge Networks used to collect data from 2,014 of their panel members age 50+. The data were collected between October 13 and October 20, 2010. The survey completion rate was 65.7%. An expanded summary of the methodology appears at the end of the report. The numbers in the figures and tables may not add up to 100 percent due to rounding.

Health and Caregiving among the 50+: Ownership, Use and Interest in Mobile Technology; January 2011 4
Detailed Findings
People age 50+ are more likely to own and use a cell phone than any other hand-held device we asked them about. About four in five people age 50+ say they own a cell phone or mobile phone and about half as many say they own a laptop or tablet computer. Less than one in five says they own any of the remaining devices.
Figure 1
Mobile Technology Ownership among the 50+
Q1. Do you currently own any of the following devices? (multiple responses allowed)
Source: Health and Caregiving among the 50+: Ownership, Use and Interest in Mobile Technology, AARP, January 2011.
N = 2014
Cell Phone or Mobile Phone Ownership
Cell phone ownership among the 50+ is high regardless of a several demographic factors including:
age (78% of those 50-64 years, 82% of those 65-74 years, and 78% of those 75+), gender (77% of males and 81% of females), and race (78% of White non-Hispanics, 84% of African Americans, 87% of Hispanics and 76%
of other non-Hispanics).
11%
3%
7%
15%
16%
42%
79%
0% 20% 40% 60% 80% 100%
None of the above
Portable electronic book reader
Smart phone
Hand‐held GPS
Portable media player
Laptop or tablet computer
Cell phone or mobile phone

Health and Caregiving among the 50+: Ownership, Use and Interest in Mobile Technology; January 2011 5
Cell phone ownership varies by other demographic factors such as:
marital status (single never-married adults are significantly less likely to own a cell phone at 60% vs. 83% of those who are married or living with a partner, 78% of those who are widowed, and 77% of those who are separated or divorced),
education (82% of people whose highest educational attainment is high school vs. 75% who have some college), and
income (69% of those who earn under $30,000 per year vs. 85% of those who earn $30,000 to less than $50,000, 84% of those who earn $50,000 to less than $60,000, 87% of those who earn $60,000 to less than $75,000 and 83% of those who earn $75,000 or more per year).
Ownership of Other Hand-held Devices
When we look at the ownership of these mobile technologies by standard demographic variables, some general patterns emerge (see Table 1 and Table 2).
Table 1
Mobile Technology Ownership by Gender and Age
Q1 Do you currently own any of the following devices?
Gender Age Total (A)
Male (B)
Female (C)
50-64 (D)
65-74 (E)
75+ (F)
Laptop/Tablet Computers 42% 46% C* 39% 45% E 42% 33% Portable Media Players 16 18 C 14 21 EF 9 5 Hand-held GPS 15 20 C 11 17 F 14 F 8 Smart Phone 7 9 C 5 9 EF 3 2 Portable Electronic Book Player 3 2 3 3 F 3 1 Source: Health and Caregiving among the 50+: Ownership, Use and Interest in Mobile Technology, AARP, January 2011.
N = 2014
*A capital letter next to a proportion in a cell indicates that the proportion is significantly different from its counterpart in the column labeled with the capital letter.
Mobile technologies are more likely to be owned by:
Men (for example, 46% of men own laptop/tablet computers vs. 39% of women) People between the ages of 50-64 years (for example, 45% of people 50-64 own a laptop
or tablet computer vs. 42% of people 65-74 years) People with a higher education (for example 52% of college graduates vs. 34% of those
with a high school education or less) People who earn $75,000 or more per year (for example 52% of those with an annual
income of $75,000+ vs. 36% of those with an annual income under $30,000 or 39% of those with an annual income between $30,000 to under $50,000)

Health and Caregiving among the 50+: Ownership, Use and Interest in Mobile Technology; January 2011 6
Table 2
Mobile Technology Ownership by Marital Status, Education and Income
Q1 Do you currently own any of the following devices?
Marital Status Education Income Married
(G)
Widow
(H)
Sep or Divrc’d
(I)
Single
(J)
HS or less (K)
Some college
(L)
College grad +
(M)
<30K
(R)
30-<50K (S)
50-<60K (T)
60-<75K (U)
75K+
(V)
Laptop or Tablet Computer
43% H* 33% 42% 46% H 34% 47%K 52% K 36% 39%R 45%R 48%R 52%
RS
Portable Media Player
18 H 7 15 H 17 H 11 17 K 23 KL
8 13 R 17 R 24 RS 28
RST
Hand- held GPS
19 HIJ 7 12 10 11 14 23 KL
4 14 21 R 20 R 29
RSUSmart Phone
7 H 2 6 10 H 3 6 K 14 KL
3 4 8R 6 17
RSTUPortable Electronic Book Player
3 <1 2 4 1 2 6
KL
2 2 1 2 6 RSta
b
None of the above
9 14 12 19 SI 12 M 13 M 8 20 STUV
8 9 7 5
Source: Health and Caregiving among the 50+: Ownership, Use and Interest in Mobile Technology, AARP, January 2011.
N = 2014
*A capital letter next to a proportion in a cell indicates that the proportion is significantly different from its counterpart in the column labeled with the capital letter.

Health and Caregiving among the 50+: Ownership, Use and Interest in Mobile Technology; January 2011 7
Usage of Hand-held Mobile Devices
Among those 50+ who own a cell or mobile phone, usage on a typical day ranges from a low of zero minutes (7%) to a high of five hours or more (3%). Given this range of time, the median is a more accurate measure of usage of cell phones by owners on a typical day than the mean or average.4 The median usage of a cell or mobile phone among owners on a typical day is 30 minutes and it does not significantly vary by the demographic characteristics of cell phone owners.
Table 3
Purpose for Using Cell Phone or Mobile Phone
Q 2a What do you usually use this device for?
Total Gender Age (A) Male
(B) Female
(C) 50-64
(D) 65-74
(E) 75+**
(F)
Make or receive calls 84% 87% (C)* 81% 80% 90% D 87% Send or receive text messages
9 7 11 (B) 13 EF 4 3
Other 7 5 8 6 6 9 Source: Health and Caregiving among the 50+: Ownership, Use and Interest in Mobile Technology, AARP, January 2011.
N = 1633
*A capital letter next to a proportion in a cell indicates that the proportion is significantly different from its counterpart in the column labeled with the capital letter.
**small base
Among adults age 50+ who own a cell or mobile phone, more than eight in ten use it to make or receive telephone calls.
Nearly nine in ten men use their cell phone to make or receive calls compared to eight in ten women.
Those who are between ages 65 to 74 years are more likely to say they use their cell or mobile phone to make or receive calls than those who are between 50-64 years.
People who are between 50 to 64 years are more likely to say they use their cell or mobile phone to send or receive text messages than those who are older than them.
4 The median is the point at which half of the sample is below and half the sample is above that number. Given the broad range of minutes used in a typical day, and the large standard deviation, the median is a more accurate measure of typical usage than the mean.

Health and Caregiving among the 50+: Ownership, Use and Interest in Mobile Technology; January 2011 8
As noted earlier, about four in ten people (42%) age 50+ say they own a laptop or tablet computer. Among those 50+ who own a laptop or tablet computer, usage on a typical day ranges from a low of zero minutes (3%) to a high of five hours or more (10%). The median usage of a laptop or tablet computer among owners on a typical day is 110 minutes (just under two hours).
Table 4
Amount of time Laptop or Tablet Computer is used in a Typical Day
Q4 How much time do you spend in a typical day using your Laptop or Tablet Computer?
Total Gender Age
(A) Male (B)
Female (C)
50-64 (D)
65-74 (E)
75+** (F)
0-30 minutes 21 25 C 18 19 26 28 31-60 minutes 18 19 18 17 22 19 61minutes - <3 hours
35 32 38 33 38 41
3 hours – <5 hours
14 11 17 15 12 10
5 hours + 10 11 10 15 EF 3 2 Source: Health and Caregiving among the 50+: Ownership, Use and Interest in Mobile Technology, AARP, January 2011.
N = 896
*A capital letter next to a proportion in a cell indicates that the proportion is significantly different from its counterpart in the column labeled with the capital letter.
**small base
When we look at the proportion of laptop or tablet computer users who spend varying amounts of time using this device on a typical day, we see that:
a greater proportion of men say they spend 30 minutes or less on their laptop or tablet computer compared to women.
People age 50-64 are more likely to use their laptop or tablet computer for 5 hours or more on a typical day compared to those age 65+. Originally, we speculated this finding is due to pre-retirees spending more time on the computer at work than those who are not employed. However, people who report their occupation as “not working or other” spend more time on their computer, on average, than those who are employed (186 minutes vs. 149 minutes). Given our current economic situation, it is possible that the people who are unemployed and report high computer usage are looking for job opportunities or networking in the hope of finding employment.

Health and Caregiving among the 50+: Ownership, Use and Interest in Mobile Technology; January 2011 9
Among those 50+ who own a laptop or tablet computer, about four in ten people 50+ say they use their laptop or tablet computer to connect to the Internet while almost three in ten say they use the device to send or receive e-mail messages.
Table 5
Purpose for Using Laptop or Tablet Computer in a Typical Day
Q4a What do you most often use this device for?
Total Gender Age
(A) Male (B)
Female (C)
50-64 (D)
65-74 (E)
75+** (F)
Send or receive e-mail 28% 26% 30% 23% 29% 44%DE*Use Internet 39 43 C 35 41 42 28 Create documents 5 7 3 7 E 2 2 Read books/magazines
<1 1 <1 1 <1 <1
Look at photos/videos 4 4 3 3 4 4 Play games/listen to music
12 7 16 B 12 11 8
Other 13 13 12 13 12 13 Source: Health and Caregiving among the 50+: Ownership, Use and Interest in Mobile Technology, AARP, January 2011.
N = 896
*A capital letter next to a proportion in a cell indicates that the proportion is significantly different from its counterpart in the column labeled with the capital letter.
**small base
Men are more likely than women to say they use their laptop or tablet computer to connect to the Internet while women are more likely than men to say they use this device to play games or listen to music.
Older respondents are more likely to say they use this device to send or receive e-mail messages, but we must use caution interpreting this finding because of the small base among people age 75+ that use these devices.
Few (15%) people age 50+ say they own a hand-held GPS. Among those who do own such a device, three-fourths use it for half an hour or less in a typical day. The median usage is five minutes in a typical day.
Among those who own a portable media player the average usage on a typical day is 76 minutes. Younger adults are more likely to use a portable media player to play games or listen to music than retirement age adults (83% of those 50 – 64 years vs. 65% of those 65-74 years – caution small base).
Less than one in ten people 50+ own a smart phone. Although the proportions are small, among those who are 50-64 years of age, smart phone ownership is significantly higher among this group than among those who are 65+ (9% of those 50-64 own a smart phone vs. 3% of those 64-74 and 2% of those 75+). Smart phone owners use this device a median of 60 minutes on a typical day.

Health and Caregiving among the 50+: Ownership, Use and Interest in Mobile Technology; January 2011 10
The largest proportion (42%) use their smart phone to make or receive telephone calls, followed by sending or receiving e-mail messages (29%), to send or receive text messages (15%) or to get access to the Internet (8%).
Only three percent of respondents 50+ own a portable electronic book reader. Among people who own a portable electronic book reader, usage on a typical day is 90 minutes.
Hand-held Devices Carried Away from Home
Almost nine in ten (87%) people age 50+ who own one of the mobile devices we asked about, say they take a mobile device with them when they leave home.
The oldest group in this study is more likely than their younger counterparts to say they do not take a handheld device with them when they leave home (19% of those 75+ years vs. 13% of those 65-74 years and 11% of those 50-64 years).
Those who are married are more likely than those in other marital situations to say they do take a hand-held device with them (90% of married respondents vs. 84% of those separated or divorced and 78% of those single-never married).
People reporting the lowest annual income are more likely than those at higher income levels to say they do not take a hand-held device with them when they leave home (19% of those with an annual income of less than $30,000 vs.11% of those with $30,000 - $50,000 and 10% of those with $60,000 to less than $75,000 and 9% of those with more than $75,000 per year). Those who earned between $50,000 and $60,000 were not significantly different from other groups.
Among those 50+ who own a mobile device, a cell phone or mobile phone is the technology of choice when they leave home. This is undoubtedly largely due to the fact that cell phone ownership is more common than ownership of any of the other hand-held devices we asked about.
Figure 2
Hand-held Device Taken When Leaving Home Q9 What type of hand-held device do you usually take with you (when leaving home)?
Source: Health and Caregiving among the 50+: Ownership, Use and Interest in Mobile Technology, AARP, January 2011.
N = 1626
<1%
1%
2%
2%
7%
88%
0% 20% 40% 60% 80% 100%
Portable electronic book reader
Laptop or tablet computer
Portable media player
Hand‐held GPS
Smart phone
Cell phone or mobile phone

Health and Caregiving among the 50+: Ownership, Use and Interest in Mobile Technology; January 2011 11
While the proportion of people who carry cell phones with them when they leave home is relatively high, regardless of demographic characteristics, they are especially likely to be:
Women (91% of women say they take a cell phone with them vs. 85% of men) Older (93% of people age 75 and 91% of people 65-74 say they take a cell phone with
them vs. 85% of those 50-64) Widowed (96% of widows vs. 87% of those who are married or living with a partner and
89% of those who are separated or divorced) With less education (93% of those with a high school degree or less vs. 88% of those with
some college or 80% of those who are college graduates or post graduates)
Virtually all of the smart phone users say they carry them when they leave home. Smart phone carriers are more likely to be:
Male (10% vs. 4% female) Younger (10% 50 - 64 vs. 4% 65 – 74 and 1% 75+) Single (15% vs. 7% married or living with a partner, 3% widowed, 7% separated or divorced) College graduates or post-graduates (14% vs. 3% of those with a high school education or
less, and 7% of those with some college
More affluent (16% of those with an annual income of $75,000 or more vs. 2% of those with an annual income of less than $30,000, 4% of those with an annual income between $30,000 – less than $50,000, 6% of those with an annual income between $50,000-$60,000)
Level of Interest in Using Mobile Technology to Track Health
While only one in ten respondents already use mobile technology to track their health over time, four in ten of those who do not currently use such technology express an interest in doing so.
Figure 3
Use or Interest in Using Mobile Technology to Track Health
Q10. There are many types of mobile technology available today that allow you to track your health over time including measures such as your weight, your blood sugar, your blood pressure. How interested are you in having one of these devices?
Source: Health and Caregiving among the 50+: Ownership, Use and Interest in Mobile Technology, AARP, January 2011.
N = 2014
35%
12%
30%
12%
11%
0% 20% 40% 60% 80% 100%
Not at all interested
Somewhat uninterested
Somewhat Interested
Very interested
All ready use
}= 42%
}=47%

Health and Caregiving among the 50+: Ownership, Use and Interest in Mobile Technology; January 2011 12
Women age 50+ (46%) are more likely than men age 50+ (38%) to say they are at least somewhat interested in using a mobile technology to track their health over time.
More than half of African Americans (58%) age 50+ are at least somewhat interested in using mobile technology to track their health compared to White non-Hispanics (39%).
People age 50+ who earn more than $75,000 per year are more likely than those who have an annual income of less than $60,000 (51% of those who have $75,000+ income per year vs. 36% of those with $50,000-<$60,000, 39% of those with $30,000 - <$50,000, and 41% of those <$30,000) to say they are at least somewhat interested in using mobile technology to track their health.
A minority of people 50+ already use a mobile technology to send information about their health status (such as their weight, blood sugar, blood pressure) to a health care professional. Approximately four in ten are at least somewhat interested in using this technology and over half of those not currently using the technology are somewhat uninterested or not at all interested.
Figure 4
Use or Interest in Sending Health Indicators to Health Care Professional
Q 11 There are many types of mobile technology available today that allow you to send your health status (such as your weight, your blood sugar, your blood pressure) to a health care professional. How interested are you in having one of these devices?
Source: Health and Caregiving among the 50+: Ownership, Use and Interest in Mobile Technology, AARP, January 2011.
N = 2014
Race influences one’s interest in using these technologies.
A greater proportion of African Americans (61%) and Hispanic Americans age 50+ (59%) are more likely to be at least somewhat interested in sending their health status to a health care professional than White non-Hispanics (34%) and those who self-identified as being from other ethnic backgrounds (39%).
41%
15%
28%
11%
4%
0% 20% 40% 60% 80% 100%
Not at all interested
Somewhat uninterested
Somewhat interested
Very interested
Already Use
}=56%
}=39%

Health and Caregiving among the 50+: Ownership, Use and Interest in Mobile Technology; January 2011 13
Older adults 50+ appear to be even less interested in using a GPS system to send people they select information about their location. Only about one in a hundred already use this technology and more than six in ten of the remaining people say they are somewhat uninterested or not at all interested in using a GPS to allow selected people to locate them.
Figure 5
Use or Interest in Allowing Selected People to Receive Information about One’s Location
Q 12 There are types of mobile technology that allow people, who you select, to receive information about your location through a hand-held global positioning system. How interested are you in having one of these devices?
Source: Health and Caregiving among the 50+: Ownership, Use and Interest in Mobile Technology, AARP, January 2011.
N = 2014
Just as with interest in sending health indicators to a health care professional, race influences one’s interest in using a GPS to allow someone else to track their location.
African American non-Hispanics (50%) and Hispanics (51%) age 50+ are more likely to say they are at least somewhat interested in allowing someone they select to receive information about their location than are White non-Hispanics (32% and those that identified themselves as other non-Hispanics (32%).
One-quarter (24%) of single-never married people 50+ are likely to say they are at least somewhat uninterested in allowing someone they choose to receive information about their location through a GPS compared to about half as many of those who are widowed (13%).
46%
17%
26%
9%
1%
0% 20% 40% 60% 80% 100%
Not at all interested
Somewhat uninterested
Somewhat interested
Very interested
Already use

Health and Caregiving among the 50+: Ownership, Use and Interest in Mobile Technology; January 2011 14
Those with high incomes are more likely than their less affluent counterparts to say they are not interested in using this technology (21% of those with an income of $75,000+ and 22% of those with an income between $60,000-75,000 vs. those with an annual income less than $30,000 14%).
Adults age 50+ are about as disinterested in having mobile technology motivate or help them to adopt healthy behaviors (such as maintaining a diet or exercising) as they were with allowing others to receive information about their location. Less than one percent already uses this type of technology, and while about three in ten indicate at least some interest, more than two-thirds say they are somewhat uninterested or not at all interested.
Figure 6
Use or Interest in Mobile Technology to Motivate or Adopt Healthy Behaviors
Q13 There are many types of mobile technology that can send you messages to help motivate you to adopt (or continue) healthy behaviors such as maintaining your diet or exercising. How interested are you in having one of these devices?
Source: Health and Caregiving among the 50+: Ownership, Use and Interest in Mobile Technology, AARP, January 2011.
N = 2014
A greater proportion of women (33%) are at least somewhat interested in using one of these technologies than men (26%).
A greater proportion of younger adults are more likely than older adults to be at least somewhat interested in receiving messages to help motivate them about adopting healthy behaviors (33% of those 50-64 vs. 24% of those 65-74 and 25% of those 75+)
A greater proportion of African Americans, Hispanics and Other non-Hispanic people are at least somewhat interested in receiving these messages than White non-Hispanics (60%, 41%, 35% vs. 24%).
51%
18%
21%
9%
<1%
0% 20% 40% 60% 80% 100%
Not at all interested
Somewhat uninterested
Somewhat interested
Very interested
Already use
}=30%
}=69%

Health and Caregiving among the 50+: Ownership, Use and Interest in Mobile Technology; January 2011 15
People 50+ appear somewhat more interested in using mobile technology to help remind them to engage in healthy behaviors such as taking their medicine on time, or scheduling a preventative examination or test. Two percent already use technology for this purpose, about four in ten indicate at least some interest, but almost six in ten indicate they are somewhat uninterested or not at all interested.
Figure 7
Use or Interest in Mobile Technology to Remind You to Engage in Healthy Behaviors
Q 14 There are types of mobile technology that can remind you to do such things as take your medicine on time, or schedule a preventative examination or test. How interested are you in having one of these devices?
Source: Health and Caregiving among the 50+: Ownership, Use and Interest in Mobile Technology, AARP, January 2011.
N = 2014
Women (43%) are more likely than men (34%) to be at least somewhat interested in having a device that can remind them to take their medicine on time or schedule a preventative exam.
African Americans (60%) are more likely than White non-Hispanics (34%) to be at least somewhat interested in having a device that can remind them to take their medicine on time or schedule a preventative exam.
44%
15%
26%
13%
2%
0% 20% 40% 60% 80% 100%
Not at all interested
Somewhat uninterested
Somewhat interested
Very interested
Already Use
}=59%
}=39%

Health and Caregiving among the 50+: Ownership, Use and Interest in Mobile Technology; January 2011 16
Among the 50+ almost none are using text-message alerts for health tips. Only about one-quarter indicates interest in this opportunity and more than seven in ten say they are somewhat uninterested or not at all interested.
Figure 8
Use or Interest in Receiving Text-message Alerts (Health Tips)
Q 15 How interested are you in receiving text-message alerts, such as health tips, reminders to take your medicine, or schedule preventative tests or health care appointments through a cell phone or smart phone?
Source: Health and Caregiving among the 50+: Ownership, Use and Interest in Mobile Technology, AARP, January 2011.
N = 2014
Women (29%) are more likely than men (24%) to be at least somewhat interested in receiving text-message alerts through a cell phone or smart phone to remind them to take their medicine or schedule a preventative test.
One-third (33%) of widowed people are likely to be at least somewhat interested in receiving text-message alerts through a cell phone or smart phone to remind them to take their medicine or schedule a preventative test compared to one-quarter (24%) of those who are married or living with a partner.
Half of African Americans (50%) and four in ten Hispanics (41%) say they are at least somewhat interested in receiving text-message alerts through a cell phone or smart phone to remind them to take their medicine or schedule a preventative test which is significantly greater than among White non-Hispanics (22%).
More than nine in ten (94%) say there are no other health related services they would like to get via a mobile technology.
58%
15%
18%
8%
1%
0% 20% 40% 60% 80% 100%
Not at all interested
Somewhat uninterested
Somewhat interested
Very interested
Already use
}=73%
}=26%

Health and Caregiving among the 50+: Ownership, Use and Interest in Mobile Technology; January 2011 17
We asked respondents to rate sixteen items on a four-point scale ranging from strongly agree to strongly disagree. Table 6 shows that seven out of the top ten items are perceived barriers to using mobile devices to send or receive health information. Cost and the utility are the factors identified by the largest proportion of people as barriers to their using technology to support their health. Concern about having their personal privacy invaded too much is another top issue. On the other hand, only about four out of ten respondents say they agree these technologies can improve their health.
Table 6
Proportion of Respondents who Strongly or Somewhat Agree with Statements about Perceived Benefits and Barriers to Using Mobile Devices to Send or Receive Health
Information
Please tell us how much you agree or disagree with each of the following statements by using the following scale: strongly agree, somewhat agree, somewhat disagree, strongly disagree:
Q17a-q In general, using a mobile device to send or receive health information would:
Perceived Benefit or Barrier
% Somewhat agree
% Strongly agree
% Total
Cost too much to buy 43% 32% 74% Not be something I need 39 33 72% Cost too much to maintain 46 25 70% Invade my privacy too much 38 26 64% Be something I could rely on 40 7 46% Not be available to me 36 10 46% Give my family/friends more peace of mind 36 8 45% Be hard to learn how to use 33 11 44% Make me lose the ability to do things for myself 29 15 43% Save me time 36 7 43% Make me look like I need help 31 11 42% Give me more peace of mind 34 7 42% Improve my health 34 7 41% Make me feel safer 33 7 41% Make me more comfortable 31 6 38% Save me money 21 4 25% Other 6 5 11%
Source: Health and Caregiving among the 50+: Ownership, Use and Interest in Mobile Technology, AARP, January 2011.
N=2014

Health and Caregiving among the 50+: Ownership, Use and Interest in Mobile Technology; January 2011 18
Caregivers
We define caregivers as people who provide help to someone age 50+ with an activity of daily living (ADL) or instrumental activity of daily living (IADL). 5 One out of five (20%) people in this sample of people age 50+ say they provided help to someone age 50+ in the past year with an ADL. Three in ten (30%) say they provided help to someone age 50+ in the past year with an IADL.
We asked caregivers of the 50+ whether they currently use any mobile technology (such as a mobile phone, smart phone, laptop or tablet computer, hand-held global positioning system, portable media player, or portable electronic book reader) to assist them in tracking the health of the person they help. The majority, eight out of ten (83%) say they do not use any mobile device to help track the health of the person they help. The balance, one in six (17%), caregivers say they currently use any of these mobile technologies to help them track the health of the person age 50+ that they help.
Among the minority who use any technology to assist them in their caregiving role, almost nine in ten (89%) say they use a cell phone or mobile phone. About one-third (34%) use a laptop or tablet computer. Less than one in ten use a portable media player (7%), hand-held GPS (4%) or smart phone (2%).
When we asked caregivers to tell us how much they agreed or disagreed with a series of potential benefits and barriers to using mobile technology to help the person they assist, we found that almost three-fourths (74%) strongly or somewhat agree that using a mobile technology to help someone they assist would cost too much to buy, and two-thirds (65%) strongly or somewhat agree they cost too much to maintain. Approximately six in ten (62%) strongly or somewhat agree these may not be something they need.
Caregivers also see some benefits to using these devices. For example, more than half strongly or somewhat agree the mobile technology would be something they could rely on (56%), would give my family/friends more peace of mind (54%), would give them peace of mind (52%), would make them more comfortable (51%) and would save them time (50%).
We asked respondents to rate sixteen items on a four-point scale ranging from strongly agree to strongly disagree. Table 7 (next page) shows that six out of the top ten items are perceived barriers to using mobile devices to help someone age 50+ they assist. Once again, cost and utility are the factors identified by the largest proportion of people as barriers to using technology in this way.
5 Activities of daily living include helping someone get in and out of bed, help getting dressed, help getting to and from the toilet, help getting in or out of the bathtub or shower, help dealing with incontinence or diapers, help by feeding him or her, help giving medicines, pills, or injections, and instrumental activities of daily living include help managing finances (such as paying bills, or filling out insurance claims), help grocery shopping, helping doing housework (like dishes, laundry, or straightening up), help preparing meals, help providing transportation by driving or helping get the person transportation, help arranging or supervising services from an agency, such as nurses or aids.

Health and Caregiving among the 50+: Ownership, Use and Interest in Mobile Technology; January 2011 19
Table 7
Caregivers’ Perceived Benefits and Barriers to
Using a Mobile Device to Help Someone Age 50+
Please tell us how much you agree or disagree with each of the following statements by using the following scale: strongly agree, somewhat agree, somewhat disagree, strongly disagree.
Q. 21a-q In general, using a mobile technology to help someone I assist would:
Perceived Benefit or Barrier
% Somewhat Agree
% Strongly Agree
% Total
Cost too much to buy 47 27 74% Cost too much to maintain 44 21 65 Not be something I need 42 20 62 Be something I can rely on 48 9 56 Give my family/friends more peace of mind 42 12 54 Give me peace of mind 42 11 52 Make me more comfortable 40 11 51 Save me time 39 10 50 Invade my privacy too much 32 17 49 Make me feel safer 39 10 49 Not be available to me 37 11 47 Be hard to learn how to use 30 9 39 Improve my health 30 6 36 Make me lose the ability to do things for myself 24 8 33 Make me look like I need help 24 8 32 Save me money 23 5 28 Other 8 3 11
Source: Health and Caregiving among the 50+: Ownership, Use and Interest in Mobile Technology, AARP, January 2011.
N = 667
Caregivers’ Level of Interest in Using Mobile Technology
We asked caregivers about their level of interest in using a type of mobile technology that would allow them to be informed if the person age 50+ they assist needs help (for example, he or she may have fallen, forgotten to take prescription medicine, or wandered away from home). While few (3%) currently use these devices, about four in ten (39%) are somewhat or very interested in using one of them.
We also asked caregivers about their level of interest in using a mobile technology that would allow them to be informed if the person age 50+ they assist has experienced a change in their usual routine (for example, he or she may not have gotten out of bed around their usual time, or may not have prepared meals at their usual time, or may have gotten out of bed an unusual number of times during the night). While only one percent of caregivers already use a device like this, more than one-third (36%) are very or somewhat interested in using a device like this. The findings also show that conversely, more than six in ten (61%) are somewhat uninterested, or not at all interested in using a device like this.

Health and Caregiving among the 50+: Ownership, Use and Interest in Mobile Technology; January 2011 20
Conclusions
The 50+ population is often portrayed in a limited number of stereotypes while, in fact, we know it is a heterogeneous group. While caregivers and care recipients are less heterogeneous than the total 50+ population, they do have a range of needs which are often related to the degree to which they require or give assistance. Therefore, it is not surprising that some of the results from this survey are mixed. The findings suggest that while cell phones have been widely adopted, the usage of other hand-held devices is lower and the use of these devices for health purposes varies. The detailed results show that there are niches of people within the overall group who are more or less interested in using hand-held devices for health purposes. Often demographic variables help to define levels of interest or usage (older or younger, widowed or married). This suggests the need to consider segmenting this population based on the needs and interest of both the 50+ population and the subset of people who are caregivers.
Three examples of how these findings can be applied to specific sub-groups stand-out. First,
The oldest adults in this study, women, widows and those with lower educational levels are especially likely to carry cell phones with them when they leave home, but are much less likely to be smart phone owners. Therefore, rather than developing smart phone applications, focusing on cell phone use among this segment of the 50+ population could provide a productive way to target health promotion programs to an audience that could use and benefit from this outreach.
Another example is that one in ten people 50+ already uses a mobile device to track their health. Women 50+, African Americans 50+, and the affluent are especially interested in using mobile technology to track their health over time (weight, blood sugar, blood pressure) but do not currently do so. Consequently this group appears to be a niche audience that would be receptive to messages about this issue and how to begin using such devices to track their health.
Finally, nine in ten caregivers 50+ who assist someone 50+ currently use cell phones, but eight in ten (83%) caregivers say they do not use any mobile device to help track the health of the person they assist. Given the high cell phone usage among this group, helping them to understand and use the technology they already have to help them in their caregiver role is a win-win situation.
These are just a few examples of how this study can guide our educational efforts to reach these sub-groups with education about how mobile technologies can help improve their health care and the health of those 50+ they assist. Other examples can be found in the detailed results section of this report.

Health and Caregiving among the 50+: Ownership, Use and Interest in Mobile Technology; January 2011 21
Appendix A
Caregivers’ Ownership and Use of Hand-held Mobile Devices
Almost nine in ten (91%) caregivers own at least one of the mobile devices we asked about. Among these caregivers, eight in ten (81%) own a cell or mobile phone, four in ten (44%) own a laptop or tablet computer. Less than one in five owns a hand-held GPS (17%) or portable media player (17%). Less than one in ten owns a smart phone (7%) or portable electronic book reader (3%).
Caregivers who own a cell or mobile phone spend a median of 30 minutes on a typical day using the phone.
Caregivers most often use their phone to make or receive calls (85%). Fewer (9%) use their cell phone to send or receive text messages. Caregivers who own smart phones use these phones for a median of 90 minutes on a typical day. They use their smart phone to make or receive calls (51%), send or receive e-mail messages (31%), get access to the Internet (9%), or send or receive text messages (7%).
Caregivers who own laptop or tablet computers spend a median of 120 minutes or two hours in a typical day using this device. Caregivers most often say they use this device to use the Internet (40%), send or receive e-mail messages (23%), less than one in five uses this device to play games or listen to music (14%), create documents (6%), look at photographs or videos (4%) or for other uses (13%).
Caregivers who own a hand-held GPS use it a median of five minutes in a typical day. Caregivers who own a portable media player use it a median of 60 minutes in a typical day. Caregivers who own a portable media player are somewhat less likely to use it to play games or listen to music than non-caregivers (74 minutes for caregivers vs. 85 minutes for non-caregivers).
When caregivers leave their homes nine out of ten (89%) take a mobile device we asked about with them, much like the majority of non-caregivers (86%) in this sample. It is not surprising that caregivers are more likely to take a cell or mobile phone (86%) than any other hand-held mobile device when they leave home (86% vs. 6% who take a smart phone, 1% who take a laptop or tablet computer, 3% who take a hand-held GPS, and 2% who take a portable media player).
Level of Interest in Using Mobile Technology for Themselves
About one in ten caregivers (13%) already use a mobile technology that allows them to track their health overtime. Slightly more than half (52%) are at least somewhat interested in this technology.
Only a small minority (4%) of caregivers currently use a mobile technology that allows them to send their health status to a health care professional. However, nearly half (49%) of the balance of caregivers are at least somewhat interest in this technology.
Less than two percent of caregivers currently use a hand-held GPS system, while four in ten (43%) are at least somewhat interested in this technology.

Health and Caregiving among the 50+: Ownership, Use and Interest in Mobile Technology; January 2011 22
Less than one percent of caregivers currently use one of these technologies to get messages motivating healthy behaviors, however, almost four in ten (38%) are at least somewhat interested in such use.
Approximately two percent already use a mobile technology to get reminders about taking prescriptions drugs or scheduling preventative health screenings. Slightly more than half (52%) are at least somewhat interested in receiving such reminders.
One percent currently get health tips via text message alerts, yet nearly four in ten (37%) are at least somewhat interested in doing so.
On the other hand, between one third and six in ten (35% to 62%) are at least somewhat disinterested in using hand-held mobile devices for any of the purposed identified above.

Health and Caregiving among the 50+: Ownership, Use and Interest in Mobile Technology; January 2011 23
Annotated Questionnaire
AARP Mobile Health Survey
Field period: October 13 – October 20, 2010
N interviews (weighted): 2014
Qualification rate (overall): 99.8% (2019 completed, 2014 qualified)
All results include qualified respondents and are weighted. “Refused” responses are counted towards the bases.
KEY DEMOGRAPHICS Gender Total
Male 46. 3%
Female 53. 7%
Education level (AARP categories) Total
Less than high school 14.3%
High School 33.3%
Some college 24.9%
Bachelor's degree or higher 27.5%
Race/Ethnicity Total
White, Non-Hispanic 76.4%
Black, Non-Hispanic 9.7%
Other, Non-Hispanic 4.5%
Hispanic 8.5%
2+ Races, Non-Hispanic 0.8%

Health and Caregiving among the 50+: Ownership, Use and Interest in Mobile Technology; January 2011 24
We are interested in understanding the extent to which people age 50 and older have and use mobile technology. We are also interested in understanding how willing they are to use new mobile technologies as they become available. Mobile technology includes any handheld item, such as a cell phone, smart phone, laptop or tablet computer, global positioning system, portable media player, or portable electronic book reader. [PROMPT ONCE; TERMINATE IF SKIPPED] Q1. Do you currently own any of the following devices?
Total
Cell phone or mobile phone 79.0%
Smart phone (cell phone with multiple applications such as an IPhone or Blackberry)
6.6%
Laptop or tablet computer (such as an IPad) 42.1%
Hand-held global positioning system 14.9%
Portable media player (such as an IPod or MP3 player)
15.7%
Portable electronic book reader (such as a Kindle)
2.6%
None of the above [SP] 11.4%
Refused 0.0%
[IF Q1A = 1 NUMBER BOXES] [NUMBER BOX, 0-24] [NUMBER BOX, 0-59] Q2. How much time do you spend in a typical day using your cell phone or mobile phone?
Total
0 Minutes 6.8%
1-30 Minutes 48.8%
31-60 Minutes 18.4%
61-180 Minutes (3 Hours) 18.7%
181-300 Minutes (5 Hours) 3.8%
More than 300 Minutes (5+ Hours) 3.0%
Refused 0.5%

Health and Caregiving among the 50+: Ownership, Use and Interest in Mobile Technology; January 2011 25
[IF Q1A = 1, SP] Q2a. What do you most often use this device for?
Total
Make or receive phone calls 83.7%
Send or receive text messages 8.8%
Other ( please specify) 6.7%
Refused 0.8%
[IF Q1B = 1] [NUMBER BOX, 0-24] [NUMBER BOX, 0-59] Q3. How much time do you spend in a typical day using your smart phone (e.g., IPhone or Blackberry)?
Total
0 Minutes 14.2%
1-30 Minutes 8.8%
31-60 Minutes 27.9%
61-180 Minutes (3 Hours) 30.8%
181-300 Minutes (5 Hours) 10.9%
More than 300 Minutes (5+ Hours) 7.4%
Refused 0.0%
[IF Q1B = 1, SP] Q3a. What do you most often use this device for?
Total
Make or receive phone calls 41.7%
Send or receive e-mail messages 29.2%
Send or receive text messages 14.6%
Get access to Internet 7.8%
Other (please specify) 4.8%
Refused 2.0%

Health and Caregiving among the 50+: Ownership, Use and Interest in Mobile Technology; January 2011 26
[IF Q1C = 1; NUMBER BOXES]
[NUMBER BOX, 0-24] [NUMBER BOX, 0-59] Q4. How much time do you spend in a typical day using your laptop or tablet computer (e.g., IPad)?
Total
0 Minutes 3.0%
1-30 Minutes 18.4%
31-60 Minutes 18.4%
61-180 Minutes (3 Hours) 35.2%
181-300 Minutes (5 Hours) 13.7%
More than 300 Minutes (5+ Hours) 10.2%
Refused 1.2%
[IF Q1C = 1, SP] Q4a. What do you most often use this device for?
Total
Send or receive e-mail messages 27.6%
Use the internet 39.2%
Create documents 4.9%
Get access to read e-books or magazines
0.4%
Look at photographs or videos 3.5%
Play games or listening to music 11.5%
Other (please specify) 12.5%
Refused 0.4%
Health and Caregiving among the 50+: Ownership, Use and Interest in Mobile Technology; January 2011 27
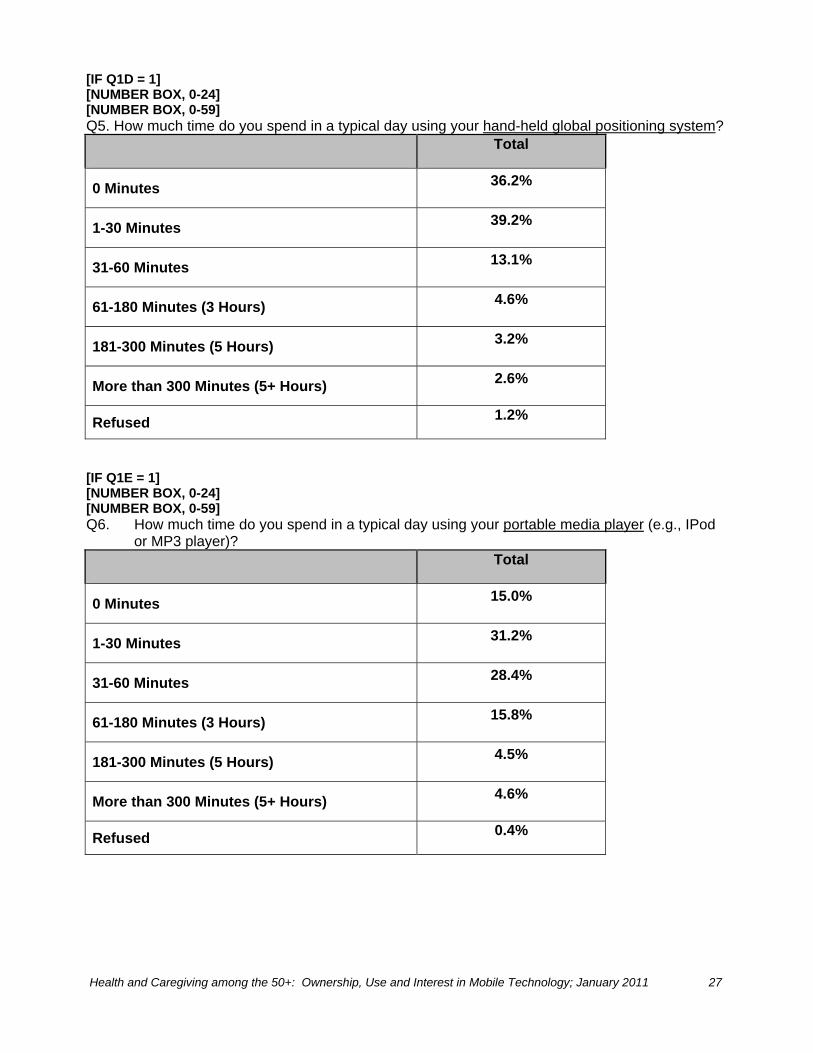
[IF Q1D = 1] [NUMBER BOX, 0-24] [NUMBER BOX, 0-59] Q5. How much time do you spend in a typical day using your hand-held global positioning system?
Total
0 Minutes 36.2%
1-30 Minutes 39.2%
31-60 Minutes 13.1%
61-180 Minutes (3 Hours) 4.6%
181-300 Minutes (5 Hours) 3.2%
More than 300 Minutes (5+ Hours) 2.6%
Refused 1.2%
[IF Q1E = 1] [NUMBER BOX, 0-24] [NUMBER BOX, 0-59] Q6. How much time do you spend in a typical day using your portable media player (e.g., IPod
or MP3 player)? Total
0 Minutes 15.0%
1-30 Minutes 31.2%
31-60 Minutes 28.4%
61-180 Minutes (3 Hours) 15.8%
181-300 Minutes (5 Hours) 4.5%
More than 300 Minutes (5+ Hours) 4.6%
Refused 0.4%

Health and Caregiving among the 50+: Ownership, Use and Interest in Mobile Technology; January 2011 28
[IF Q1E = 1, SP] Q6a. What do you most often use this device for?
Total
Listen to e-books 6.8%
Look at photographs or videos 1.9%
Play games or listening to music 80.6%
Other (please specify) 9.6%
Refused 1.2%
[IF Q1F = 1] [NUMBER BOX, 0-24] [NUMBER BOX, 0-59] Q7. How much time do you spend in a typical day using your portable book reader (e.g., Kindle)?
Total
0 Minutes 2.6%
1-30 Minutes 21.2%
31-60 Minutes 24.1%
61-180 Minutes (3 Hours) 36.9%
181-300 Minutes (5 Hours) 7.6%
More than 300 Minutes (5+ Hours) 5.1%
Refused 2.7%
[IF Q1G NE 1 AND Q1 NOT SKIPPED; SP] Q8. When you leave your home do you usually take any of the following handheld devices with
you: a cell phone, smart phone, laptop or tablet computer, hand-held global positioning system, portable media player, or portable electronic book reader?
Total
Yes 86.9%
No 12.9%
Refused 0.2%

Health and Caregiving among the 50+: Ownership, Use and Interest in Mobile Technology; January 2011 29
[IF Q8 = 1, SP] Q9. What type of handheld device are you most likely to take with you?
Total
Cell phone or mobile phone 87.8%
Smart phone (cell phone with multiple applications such as an IPhone or Blackberry)
6.9%
Laptop or tablet computer (such as an IPad) 0.6%
Hand-held global positioning system 1.9%
Portable media player (such as an IPod or MP3 player) 1.9%
Portable electronic book reader (such as a Kindle) 0.3%
Refused 0.5%
We are now going to describe new types of mobile technology. Please indicate your level of interest by selecting one response to each statement on the following screens indicating whether you are very interested, somewhat interested, somewhat uninterested, not at all interested.
Q10. There are many types of mobile technology available today that allow you to track your health over time including measures such as your weight, your blood sugar, your blood pressure. How interested are you in using one of these technologies?
Total
Already Use 10.8%
Very interested 12.2%
Somewhat interested 30.0%
Somewhat uninterested 11.7%
Not at all interested 34.7%
Refused 0.6%

Health and Caregiving among the 50+: Ownership, Use and Interest in Mobile Technology; January 2011 30
Q11. There are many types of mobile technology available today that allow you to send your health status (such as your weight, your blood sugar, your blood pressure) to a health care professional). How interested are you in using one of these technologies?
Total
Already Use 3.8%
Very interested 11.2%
Somewhat interested 27.6%
Somewhat uninterested 15.2%
Not at all interested 41.1%
Refused 1.1%
Q12. There are types of mobile technology that allow people, who you select, to receive information
about your location through a hand-held global positioning system. How interested are you in using one of these technologies?
Total
Already Use 1.4%
Very interested 9.3%
Somewhat interested 25.8%
Somewhat uninterested 17.4%
Not at all interested 45.6%
Refused 0.5%

Health and Caregiving among the 50+: Ownership, Use and Interest in Mobile Technology; January 2011 31
Q13. There are many types of mobile technology that can send you messages to help you motivate you to adopt (or continue) healthy behaviors such as maintaining your diet or exercising. How interested are you in using one of these technologies?
Total
Already Use 0.3%
Very interested 9.2%
Somewhat interested 20.5%
Somewhat uninterested 18.3%
Not at all interested 50.5%
Refused 1.1%
Q14. There are types of mobile technology that can remind you to do such things as take your
medicine on time, or schedule a preventative examination or test. How interested are you in using one of these technologies?
Total
Already Use 1.5%
Very interested 13.0%
Somewhat interested 25.8%
Somewhat uninterested 15.0%
Not at all interested 44.1%
Refused 0.7%

Health and Caregiving among the 50+: Ownership, Use and Interest in Mobile Technology; January 2011 32
Q15. How interested are you in receiving text-message alerts, such as health tips, reminders to take you medicine, or schedule preventive tests or health care appointments through a cell phone or smart phone?
Total
Already Use 0.8%
Very interested 8.4%
Somewhat interested 18.1%
Somewhat uninterested 14.8%
Not at all interested 57.5%
Refused 0.5%
Q16. Are there any other health related services you would like to get via a mobile technology?
Total
Yes 5.7%
No 94.0%
Refused 0.2%
[IF Q16 = 1; MEDIUM TEXT BOX] Q16A. What other health related services would you like to get via a mobile technology? [RANDOMIZE AND RECORD] Please tell us how much you agree or disagree with each of the following statements by using the following scale.
In general, using a mobile device to send or receive health information would: Q17a. make me feel safer
Total
Strongly agree 7.2%
Somewhat agree 33.4%
Somewhat disagree 32.9%
Strongly disagree 24.1%
Refused 2.4%

Health and Caregiving among the 50+: Ownership, Use and Interest in Mobile Technology; January 2011 33
Q17b. save me time
Total
Strongly agree 6.9%
Somewhat agree 36.3%
Somewhat disagree 31.6%
Strongly disagree 22.0%
Refused 3.1%
Q17c. save me money
Total
Strongly agree 4.0%
Somewhat agree 21.2%
Somewhat disagree 43.2%
Strongly disagree 29.5%
Refused 2.1%
Q17d. make me more comfortable
Total
Strongly agree 6.1%
Somewhat agree 31.4%
Somewhat disagree 36.2%
Strongly disagree 23.6%
Refused 2.5%

Health and Caregiving among the 50+: Ownership, Use and Interest in Mobile Technology; January 2011 34
Q17e. give me more peace of mind
Total
Strongly agree 7.4%
Somewhat agree 34.4%
Somewhat disagree 31.5%
Strongly disagree 24.3%
Refused 2.4%
Q17f. give my family/friends more peace of mind
Total
Strongly agree 8.3%
Somewhat agree 36.3%
Somewhat disagree 30.7%
Strongly disagree 23.1%
Refused 1.7%
Q17g. improve my health
Total
Strongly agree 7.4%
Somewhat agree 33.6%
Somewhat disagree 33.9%
Strongly disagree 23.0%
Refused 2.1%

Health and Caregiving among the 50+: Ownership, Use and Interest in Mobile Technology; January 2011 35
Q17h. be something I could rely on
Total
Strongly agree 6.7%
Somewhat agree 39.7%
Somewhat disagree 31.4%
Strongly disagree 19.8%
Refused 2.4%
Q17i. not be available to me
Total
Strongly agree 9.9%
Somewhat agree 35.7%
Somewhat disagree 35.0%
Strongly disagree 16.7%
Refused 2.7%
Q17j. cost too much to buy
Total
Strongly agree 31.9%
Somewhat agree 42.5%
Somewhat disagree 16.3%
Strongly disagree 7.0%
Refused 2.2%

Health and Caregiving among the 50+: Ownership, Use and Interest in Mobile Technology; January 2011 36
Q17k. cost too much to maintain
Total
Strongly agree 24.7%
Somewhat agree 45.5%
Somewhat disagree 18.9%
Strongly disagree 8.4%
Refused 2.6%
Q17l. be hard to learn how to use
Total
Strongly agree 11.3%
Somewhat agree 32.8%
Somewhat disagree 34.4%
Strongly disagree 19.2%
Refused 2.3%
Q17m. invade my privacy too much
Total
Strongly agree 25.7%
Somewhat agree 37.8%
Somewhat disagree 25.0%
Strongly disagree 9.5%
Refused 2.0%

Health and Caregiving among the 50+: Ownership, Use and Interest in Mobile Technology; January 2011 37
Q17n. make me look like I need help
Total
Strongly agree 10.9%
Somewhat agree 31.2%
Somewhat disagree 34.9%
Strongly disagree 20.7%
Refused 2.4%
Q17o. make me lose the ability to do things for myself
Total
Strongly agree 14.5%
Somewhat agree 28.9%
Somewhat disagree 33.5%
Strongly disagree 21.2%
Refused 1.9%
Q17p. not be something I need
Total
Strongly agree 33.0%
Somewhat agree 39.0%
Somewhat disagree 18.1%
Strongly disagree 7.8%
Refused 2.1%

Health and Caregiving among the 50+: Ownership, Use and Interest in Mobile Technology; January 2011 38
Q17q. other (please specify): [TXT]
Total
Strongly agree 4.8%
Somewhat agree 6.1%
Somewhat disagree 6.0%
Strongly disagree 7.4%
Refused 75.7%
In the past year have you provided any of the following types of help to someone age 50 or older? Q18a. help getting in and out of bed, help getting dressed, help getting to and from the toilet, help getting in or out of the bathtub or shower, help dealing with incontinence or diapers, help by feeding him or her, help giving medicines, pills, or injections.
Total
Yes 20.1%
No 78.6%
Refused 1.2%
Q18b. help managing finances such as paying bills, or filling out insurance claims, help grocery shopping, help doing housework, like dishes, laundry, or straightening up, help preparing meals, help providing transportation by driving or helping get the person you help get transportation, help arranging or supervising services from an agency, such as nurses or aids.
Total
Yes 30.4%
No 68.6%
Refused 1.0%

Health and Caregiving among the 50+: Ownership, Use and Interest in Mobile Technology; January 2011 39
[IF Q18A OR Q18B = 1; SP] Q19. Do you currently use any mobile technology (such as a mobile phone, smart phone, laptop or tablet computer, hand-held global positioning system, portable media player, or portable electronic book reader) to help you track the health of the person age 50+ whom you help?
Total
Yes 16.6%
No 83.2%
Refused 0.2%
[IF Q19 = 1; MP] Q20. Which mobile technologies do you currently use?
Total
Cell phone or mobile phone 89.4%
Smart phone (cell phone with multiple applications such as an IPhone or Blackberry)
1.6%
Laptop or tablet computer (such as an IPad) 33.7%
Hand-held global positioning system 4.4%
Portable media player (such as an IPod or MP3 player) 6.7%
Portable electronic book reader (such as a Kindle) 0.6%
None of the above [SP] 3.5%
Refused 0.0%

Health and Caregiving among the 50+: Ownership, Use and Interest in Mobile Technology; January 2011 40
Please tell us how much you agree or disagree with each of the following statements by using the following scale. In general, using a mobile device to help someone age 50+ whom I assist would:
Q21a. make me feel safer
Total
Strongly agree 7.7%
Somewhat agree 34.4%
Somewhat disagree 32.9%
Strongly disagree 20.4%
Refused 4.7%
Q21b. save me time
Total
Strongly agree 8.0%
Somewhat agree 37.5%
Somewhat disagree 30.3%
Strongly disagree 18.8%
Refused 5.5%
Q21c. save me money
Total
Strongly agree 4.0%
Somewhat agree 21.0%
Somewhat disagree 44.8%
Strongly disagree 25.0%
Refused 5.3%

Health and Caregiving among the 50+: Ownership, Use and Interest in Mobile Technology; January 2011 41
Q21d. make me more comfortable
Total
Strongly agree 7.7%
Somewhat agree 35.9%
Somewhat disagree 31.4%
Strongly disagree 19.9%
Refused 5.1%
Q21e. give me more peace of mind
Total
Strongly agree 8.5%
Somewhat agree 36.1%
Somewhat disagree 30.5%
Strongly disagree 19.7%
Refused 5.2%
Q21f. give my family/friends more peace of mind
Total
Strongly agree 9.6%
Somewhat agree 37.7%
Somewhat disagree 28.1%
Strongly disagree 19.0%
Refused 5.6%

Health and Caregiving among the 50+: Ownership, Use and Interest in Mobile Technology; January 2011 42
Q21g. improve my health
Total
Strongly agree 4.8%
Somewhat agree 25.8%
Somewhat disagree 38.6%
Strongly disagree 25.5%
Refused 5.3%
Q21h. be something I could rely on
Total
Strongly agree 6.6%
Somewhat agree 41.5%
Somewhat disagree 30.3%
Strongly disagree 16.4%
Refused 5.2%
Q21i. not be available to me
Total
Strongly agree 11.0%
Somewhat agree 33.7%
Somewhat disagree 33.6%
Strongly disagree 15.4%
Refused 6.3%

Health and Caregiving among the 50+: Ownership, Use and Interest in Mobile Technology; January 2011 43
Q21j. cost too much to buy
Total
Strongly agree 25.3%
Somewhat agree 43.0%
Somewhat disagree 18.0%
Strongly disagree 8.5%
Refused 5.2%
Q21k. cost too much to maintain
Total
Strongly agree 21.5%
Somewhat agree 42.2%
Somewhat disagree 21.6%
Strongly disagree 9.4%
Refused 5.3%
Q21l. be hard to learn how to use
Total
Strongly agree 10.2%
Somewhat agree 30.7%
Somewhat disagree 34.3%
Strongly disagree 18.8%
Refused 5.9%

Health and Caregiving among the 50+: Ownership, Use and Interest in Mobile Technology; January 2011 44
Q21m. invade my privacy too much
Total
Strongly agree 19.0%
Somewhat agree 33.6%
Somewhat disagree 29.4%
Strongly disagree 13.0%
Refused 5.0%
Q21n. make me look like I need help
Total
Strongly agree 10.0%
Somewhat agree 25.6%
Somewhat disagree 37.4%
Strongly disagree 21.8%
Refused 5.2%
Q21o. make me lose the ability to do things for myself
Total
Strongly agree 9.8%
Somewhat agree 25.8%
Somewhat disagree 36.7%
Strongly disagree 22.3%
Refused 5.4%

Health and Caregiving among the 50+: Ownership, Use and Interest in Mobile Technology; January 2011 45
Q21p. not be something I need
Total
Strongly agree 26.0%
Somewhat agree 38.9%
Somewhat disagree 21.6%
Strongly disagree 8.6%
Refused 4.9%
Q21q. other: please specify: [TXT]
Total
Strongly agree 3.2%
Somewhat agree 6.2%
Somewhat disagree 6.6%
Strongly disagree 8.0%
Refused 75.9%
Q22. There are many types of mobile technology that allow you to be informed if the person age 50+ that you assist needs help (for example, he or she may have fallen, forgotten to take prescription medicine, or wandered away from home). How interested are you in using one of these technologies?
Total
Already Use 3.1%
Very interested 12.9%
Somewhat interested 25.6%
Somewhat uninterested 13.1%
Not at all interested 44.3%
Refused 1.0%

Health and Caregiving among the 50+: Ownership, Use and Interest in Mobile Technology; January 2011 46
Q23. There are many types of mobile technology that allow you to be informed if the person age 50+ you assist has experienced a change in their usual routine (for example, he or she may not have gotten out of bed around their usual time, or may not have prepared meals at their usual time, or may have gotten out of bed an unusual number of times during the night). How interested are you in using one of these technologies?
Total
Already Use 1.1%
Very interested 11.1%
Somewhat interested 25.1%
Somewhat uninterested 15.2%
Not at all interested 45.3%
Refused 2.1%
Q24. There are many types of mobile technology that allow you to be informed about some health indicators of the person age 50+ you assist (such as their weight, blood sugar, or blood pressure). How interested are you in using one of these technologies?
Total
Already Use 2.8%
Very interested 12.6%
Somewhat interested 24.1%
Somewhat uninterested 14.1%
Not at all interested 44.8%
Refused 1.6%

Health and Caregiving among the 50+: Ownership, Use and Interest in Mobile Technology; January 2011 47
Field Report
Project: Mobile Health Survey
Submitted to: Linda Barrett, Ph.D.
American Association of Retired Persons
From: Knowledge Networks
Date Submitted: October 29, 2010
KN Project Director: Larry Osborn
KN Account Executive: Joe Garrett
KN Project Number: K2890

Health and Caregiving among the 50+: Ownership, Use and Interest in Mobile Technology; January 2011 48
Study Design & Documentation
Introduction
Knowledge Networks conducted the Mobile Health Survey on behalf of the American Association of Retired Persons (AARP). Specifically, the study examined the use of mobile technologies in older adults. The survey was conducted on KnowledgePanel®, and was fielded between October 13 and October 20, 2010, and participants completed the survey in 10 minutes (median). Besides standard measures taken by KN to enhance survey cooperation, including a standardized three-day reminder, a series of customized reminders was sent throughout the field period.
Sample Definition
The target population consisted of non-institutionalized U.S. residents aged 50 and older. To sample the population, Knowledge Networks randomly sampled households from its KnowledgePanel, a probability-based web panel designed to be representative of the United States. Survey Completion and Sample Sizes
The number of respondents sampled and participating in the survey and the survey completion rate are presented in the table below.
Key Survey Response Statistics
Number Sampled
Number of Completed Surveys
Survey Completion Rate
3,064
2,014
65.7%
Data File Deliverables and Descriptions
Knowledge Networks prepared and delivered a fully formatted SPSS file containing the collected data, KN demographic profile data, and the appropriate variable and value labels. In addition, KN prepared and delivered post-stratification statistical weights. A series of data-only variables in the file provide information about the order of questions or response categories in the survey. The variable names for these items include the word “order” to make them easily identifiable.

Health and Caregiving among the 50+: Ownership, Use and Interest in Mobile Technology; January 2011 49
The table below shows the name and description of each of the supplemental, demographic, and other profile variables included in the files.
Supplemental Variables: Weights, Profile Data, and Other Variable Name Variable Description
CASEID Case ID
WEIGHT Poststratification weight
TM_START Interview start time
TM_FINISH Interview finish time
DURATION Interview duration in minutes
PPAGE Age
PPAGECAT Age - 7 Categories
PPAGECT4 Age - 4 Categories
PPEDUC Education (Highest Degree Received)
PPEDUCAT Education (Categorical)
PPETHM Race / Ethnicity
PPGENDER Gender
PPHHHEAD Household Head
PPHHSIZE Household Size
PPHOUSE Housing Type
PPINCIMP Household Income
PPMARIT Marital Status
PPMSACAT MSA Status
PPREG4 Region 4 - Based on State of Residence
PPREG9 Region 9 - Based on State of Residence
PPRENT Ownership Status of Living Quarters
PPSTATEN State
PPT01 Presence of Household Members - Children 0-2
PPT25 Presence of Household Members - Children 2-5
PPT612 Presence of Household Members - Children 6-12
PPT1317 Presence of Household Members - Children 13-17
PPT18OV Presence of Household Members - Adults 18+
PPWORK Current Employment Status
PPNET HH Internet Access
XPPRACEM Race, Census categories
LAPTOPS Flag. KN-Provided Laptop

Health and Caregiving among the 50+: Ownership, Use and Interest in Mobile Technology; January 2011 50
Key Personnel
Key personnel on the study include: Mike Dennis – Executive Vice President, Government & Academic Research. M. Dennis is based in the Menlo Park office of Knowledge Networks. Phone number: (650) 289-2160 Email: [email protected] Joe Garrett – Vice President, Research Development. J. Garrett is based in Washington, D.C. Phone number: (703) 830-0613 Email: [email protected] Charles DiSogra – Vice President, Chief Statistician. C. DiSogra is based in the Menlo Park office of Knowledge Networks. Phone number: (650) 289-2185 Email: [email protected] Larry Osborn – Associate Vice President. L. Osborn is based in the Chicago office of Knowledge Networks. Phone number: (312) 416-3666 Email: [email protected]

Health and Caregiving among the 50+: Ownership, Use and Interest in Mobile Technology; January 2011 51
Knowledge Networks Methodology
Introduction
Knowledge Networks has recruited the first online research panel that is representative of the entire U.S. population. Panel members are randomly recruited by probability-based sampling, and households are provided with access to the Internet and hardware if needed. Knowledge Networks selects households using random-digit dial (RDD) and address-based sampling methods. Once a person is recruited to the panel, they can be contacted by e-mail (instead of by phone or mail). This permits surveys to be fielded very quickly and economically. In addition, this approach reduces the burden placed on respondents, since e-mail notification is less obtrusive than telephone calls, and most respondents find answering Web questionnaires to be more interesting and engaging than being questioned by a telephone interviewer.
Panel Recruitment Methodology
Beginning recruitment in 1999, Knowledge Networks (KN) established the first online research panel (now called KnowledgePanel®) based on probability sampling that covers both the online and offline populations in the U.S. The panel members are randomly recruited by telephone and by self-administered mail and web surveys. Households are provided with access to the Internet and hardware if needed. Unlike other Internet research that covers only individuals with Internet access who volunteer for research, Knowledge Networks surveys are based on a dual sampling frame that includes both listed and unlisted phone numbers, telephone and non-telephone households, and cell-phone-only households. The panel is not limited to current Web users or computer owners. All potential panelists are randomly selected to join the KnowledgePanel; unselected volunteers are not able to join. RDD and ABS Sample Frames Knowledge Networks initially selects households using random digit dialing (RDD) sampling and address-based sampling (ABS) methodology. In this section, we will describe the RDD-based methodology, while the ABS methodology is described in a separate section below. KnowledgePanel recruitment methodology uses the quality standards established by selected RDD surveys conducted for the Federal Government (such as the CDC-sponsored National Immunization Survey).
Knowledge Networks utilizes list-assisted RDD sampling techniques based on a sample frame of the U. S. residential landline telephone universe. For efficiency purposes, Knowledge Networks excludes only those banks of telephone numbers (a bank consists of 100 numbers) that have less than 2 directory listings. Additionally, an oversample is conducted among a stratum telephone exchanges that have high concentrations of African-American and Hispanic households based on Census data. Note that recruitment sampling is done without replacement, thus numbers already fielded do not get fielded again.

Health and Caregiving among the 50+: Ownership, Use and Interest in Mobile Technology; January 2011 52
A telephone number for which a valid postal address can be matched occurs in about 70% of the sample. These address-matched cases are all mailed an advance letter informing them that they have been selected to participate in KnowledgePanel. For efficiency purposes, the unmatched numbers are under-sampled at a current rate of 0.75 relative to the matched numbers. Both the oversampling mentioned above and this under-sampling of non-address households are adjusted appropriately in the panel’s weighting procedures.
Following the mailings, the telephone recruitment begins for all sampled phone numbers using trained interviewer/recruiters. Cases sent to telephone interviewers are dialed for up to 90 days, with at least 14 dial attempts on cases where no one answers the phone, and on numbers known to be associated with households. Extensive refusal conversion is also performed. The recruitment interview, about 10 minutes long, begins with informing the household member that they have been selected to join KnowledgePanel. If the household does not have a computer and access to the Internet, they are told that in return for completing a short survey weekly, they will be provided with a laptop computer (previously a WebTV device was provided) and free monthly Internet access. All members in a household are then enumerated, and some initial demographic and background information on prior computer and Internet use are collected.
Households that inform interviewers that they have a home computer and Internet access are asked to take their surveys using their own equipment and Internet connection. Incentive points per survey, redeemable for cash, are given to these “PC” respondents for completing their surveys. Panel members who were provided with either a WebTV earlier or currently a laptop computer (both with free Internet access) do not participate in this per survey points incentive program. However, all panel members do receive special incentive points for select surveys to improve response rates and for all longer surveys as a modest compensation for burden.
For those panel members receiving a laptop computer (as with the former WebTV), prior to shipment, each unit is custom configured with individual email accounts, so that it is ready for immediate use by the household. Most households are able to install the hardware without additional assistance, though Knowledge Networks maintains a telephone technical support line. The Knowledge Networks Call Center contacts household members who do not respond to email and attempts to restore both contact and cooperation. PC panel members provide their own email addresses and we send their weekly surveys to that email account.
All new panel members are sent an initial survey to both welcome them as new panel members but also to familiarize them with how online survey questionnaires work. They also complete a separate profile survey that collects essential demographic information such as gender, age, race, income, and education to create a personal member profile. This information can be used to determine eligibility for specific studies, is used for weighting purposes, and operationally need not be gathered with each and every survey. This information is updated annually with each panel member. Once completed new member is “profiled,” they are designated as “active” and ready to be sampled for client studies. [Note: Parental or legal guardian consent is also collected for conducting surveys with teenage panel members, ages 13-17.]

Health and Caregiving among the 50+: Ownership, Use and Interest in Mobile Technology; January 2011 53
Once a household is contacted by phone—and additional household members recruited via their email address—panel members are sent surveys linked through a personalized email invitation (instead of by phone or mail). This permits surveys to be fielded quickly and economically, and also facilitates longitudinal research. In addition, this approach reduces the burden placed on respondents, since email notification is less obtrusive than telephone calls, and allows research subjects to participate in research when it is convenient for them.
Address-Based Sampling (ABS) Methodology
When KN started KnowledgePanel panel recruitment in 1999, the state of the art in the industry was that probability-based sampling could be cost effectively carried out using a national random-digit dial (RDD) sample frame. The RDD landline frame at the time allowed access to 96% of the U.S. population. This is no longer the case. We introduced the ABS sample frame to rise to the well-chronicled changes in society and telephony in recent years. The following changes have reduced the long-term scientific viability of the landline RDD sampling methodology: declining respondent cooperation to telephone surveys; do not call lists; call screening, caller-ID devices and answering machines; dilution of the RDD sample frame as measured by the working telephone number rate; and finally, the emergence and exclusion of cell-phone-only households (CPOHH) because they have no landline phone.
According to the Center for Disease Control, approximately 25% of U.S. households cannot be contacted through RDD sampling: 22% as a result of CPOHH status and 3% because they have no phone service whatsoever. Among some segments of society, the sample noncoverage is substantial: more than one-third of young adults, ages 18-24, reside in CPOHHs.
After conducting an extensive pilot project in 2008, we made the decision to add an address-based sample (ABS) frame in response to the growing number of cell-phone only households that are outside of the RDD frame. Before conducting the ABS pilot, we also experimented with supplementing our RDD samples with cell-phone samples. However, this approach was not cost effective for you our clients and raised a number of other operational, data quality, and liability issues (e.g., calling people’s cell phones while they were driving).
The key advantage of the ABS sample frame is that it allows sampling of almost all U.S. households. An estimated 98% of households are “covered” in sampling nomenclature. Regardless of household telephone status, they can be reached and contacted via the mail. Second, our ABS pilot project revealed some other advantages beyond the expected improvement in recruiting adults from CPOHHs:
Improved sample representativeness for minority racial and ethnic groups Improved inclusion of lower educated and low income households Exclusive inclusion of CPOHHs that have neither a landline telephone nor Internet
access (approximately 4% to 6% of US households).

Health and Caregiving among the 50+: Ownership, Use and Interest in Mobile Technology; January 2011 54
ABS involves probability-based sampling of addresses from the U.S. Postal Service’s Delivery Sequence File. Randomly sampled addresses are invited to join KnowledgePanel through a series of mailings and in some cases telephone follow-up calls to non-responders when a telephone number can be matched to the sampled address. Invited households can join the panel by one of several means:
by completing and mailing back a paper form in a postage-paid envelope; by calling a toll-free hotline maintained by Knowledge Networks; or by going to a designated KN web-site and completing an online recruitment form.
After initially accepting the invitation to join the panel, respondents are then “profiled” online answering key demographic questions about themselves. This profile is maintained using the same procedures established for the RDD-recruited research subjects. Respondents not having an Internet connection are provided a laptop computer and free Internet service. Respondents sampled from ABS frame, like those from the RDD frame are provided the same privacy terms and confidentiality protections that we have developed over the years and have been reviewed by dozens of Institutional Review Boards.
Large-scale ABS sampling for our KnowledgePanel recruitment began in April, 2009. As a result, KnowledgePanel will be improving its sample coverage of CPOHHs and young adults.
Because we will have recruited panelists from two different sample frames – RDD and ABS – we are taking several technical steps to merge samples sourced from these frames. Our approach preserves the representative structure of the overall panel for the selection of individual client study samples. An advantage of mixing ABS frame panel members in any KnowledgePanel sample is a reduction in the variance of the weights. ABS-sourced sample tends to align more true to the overall population demographic distributions and thus the associated adjustment weights are somewhat more uniform and less varied. This variance reduction efficaciously attenuates the sample’s design effect and confirms a real advantage for study samples drawn from KnowledgePanel with its dual frame construction.
Survey Administration
For client surveys, samples are drawn at random from among active panel members. Depending on the study, eligibility criteria will be applied or in-field screening of the sample will be carried out. Sample sizes can range widely depending on the objectives and design of the study.
Once assigned to a survey, members receive a notification email letting them know there is a new survey available for them to take. This email notification contains a link that sends them to the survey questionnaire. No login name or password is required. The field period depends on the client’s needs, and can range anywhere from a few hours to several weeks.

Health and Caregiving among the 50+: Ownership, Use and Interest in Mobile Technology; January 2011 55
After three days, automatic email reminders are sent to all non-responding panel members in the sample. Additional email reminders were sent out throughout the field period, as needed. If email reminders do not generate a sufficient response, an automated telephone reminder call may be initiated. The usual protocol is to wait at least three-four days after the email reminder before calling. To assist panel members with their survey taking, each individual has a personalized “home page” that lists all the surveys that were assigned to that member and have yet to be completed.
Knowledge Networks also operates an ongoing, modest, incentive program to encourage participation and create member loyalty. Members can enter special raffles or can be entered into special sweepstakes with both cash and other prizes to be won.
The typical survey commitment for panel members is one survey per week or four per month with a duration of 10-15 minutes per survey. Some client surveys exceed this time and in the case of longer surveys an additional incentive may be provided.
Survey Sampling from KnowledgePanel
Once Panel Members are recruited and profiled, they become eligible for selection for specific client surveys. In most cases, the specific survey sample represents a simple random sample from the panel, for example, a general population survey. Customized stratified random sampling based on profile data may also be conducted as required by the study design.
The general sampling rule is to assign no more than one survey per week to members. Allowing for rare weekly exceptions, this limits a member’s total assignments per month to 4 or 6 surveys. In certain cases, a survey sample calls for pre-screening, that is, members are drawn from a subsample of the panel (such as, females, Republicans, grocery shoppers, etc.). In such cases, care is taken to ensure that all subsequent survey samples drawn that week are selected in such a way as to result in a sample that remains representative of the panel distributions.
For this survey, a nationally representative sample of adults (18 and over) in seven Chicago-area counties was selected.
Sample Weighting
The design for a KnowledgePanel® sample begins as an equal probability sample with several enhancements incorporated to improve efficiency. Since any alteration in the selection process is a deviation from a pure equal probability sample design, statistical weighting adjustments are made to the data to offset known selection deviations. These adjustments are incorporated in the sample’s base weight.

Health and Caregiving among the 50+: Ownership, Use and Interest in Mobile Technology; January 2011 56
There are also several sources of survey error that are an inherent part of any survey process, such as non-coverage and non-response due to panel recruitment methods and to inevitable panel attrition. We address these sources of sampling and non-sampling error using a panel demographic post-stratification weight as an additional adjustment.
Lastly, a set of study-specific post-stratification weights are constructed for the study data to adjust for the study’s sample design and survey non-response.
A description of these types of weights follows.
The Base Weight
In a KnowledgePanel sample there are seven known sources of deviation from an equal probability of selection design. These are corrected in the Base Weight and are described below.
1. Under-sampling of telephone numbers unmatched to a valid mailing address An address match is attempted on all the Random Digit Dial (RDD) generated telephone numbers in the sample after the sample has been purged of business and institutional numbers and screened for non-working numbers. The success rate for address matching is in the 60-70% range. The telephone numbers with valid addresses are sent an advance letter, notifying the household that they will be contacted by phone to join KnowledgePanel. The remaining, unmatched numbers are under-sampled as a recruitment efficiency strategy. Advance letters improve recruitment success rates. Under-sampling stopped between July 2005 and April 2007. It was resumed in May 2007 with a sampling rate of 0.75.
2. RDD selection proportional to the number of telephone landlines reaching the household As part of the field data collection operation, information is collected on the number of separate telephone landlines in each selected household. A multiple line household’s selection probability is down weighted by the inverse of its number of landlines.
3. Some minor oversampling of Chicago and Los Angeles due to early pilot surveys Two pilot surveys carried out in Chicago and Los Angeles when the panel was first being built increased the relative size of the sample from these two cities. With natural attrition and growth in size, the impact is disappearing over time. It remains part of our base adjustment weighting because of a small number of extant panel members from that nascent panel cohort.
4. Early oversampling the four largest states and central region states At the time when the panel was first being built, survey demand in the four largest states (California, New York, Florida, and Texas) required over-sampling during January-October 2000. Similarly, the central region states were over-sampled for a brief period. These now diminishing effects still remain in the panel membership and thus require weighting adjustments for these geographic areas.

Health and Caregiving among the 50+: Ownership, Use and Interest in Mobile Technology; January 2011 57
5. Under-sampling of households not covered by the MSN® TV service network Certain small areas of the U.S. are not serviced by MSN® , thus the MSN®TV units distributed to non-Internet households prior to January 2009 could not be used for those recruited non-Internet households. Overall, the result is a small residual under-sample in those geographic areas requiring a minor weighting adjustment for those locations. Since January 2010, laptop computers with dial-up access are being distributed to non-Internet households thus eliminating this under-coverage component.
6. RDD oversampling of African-American and Hispanic telephone exchanges As of October 2001, over-sampling of telephone exchanges with a higher density of minority households (specifically African American and Hispanic) was implemented to increase panel membership for those groups. These exchanges were oversampled at approximately twice the rate of other exchanges. This over-sampling is corrected in the base weight.
7. Address-based sample phone match adjustment
Towards the end of 2008, Knowledge Networks began recruiting panel members using an address-based sample (ABS) frame in addition to RDD recruitment. Once recruitment through the mail, including follow-up mailings to ABS non-respondents was completed, a telephone recruitment was added. Non-responding ABS households where a landline telephone number could be matched to an address were subsequently called and a telephone recruitment initiated. This effort results in a slight overall disproportionate number of landline households being recruited in a given ABS sample. A base weight adjustment is applied to return the ABS recruitment panel members to the sample’s correct national proportion of phone-match and no phone-match households.
8. ABS oversample stratification adjustment
In late 2009 the ABS sample began incorporating a geographic stratification design. Census blocks with high density minority communities were oversampled (Stratum 1) and the balance of the census blocks (Stratum 2) were relatively undersampled. The definition of high density, minority community and the relative proportion between strata differed among specific ABS samples. An appropriate base weight adjustment is applied to each sample to correct for this stratified design.
The Panel Demographic Post-stratification Weight
To reduce the effects of any non-response and non-coverage bias in the overall panel membership, a post-stratification adjustment is applied using demographic distributions from the most recent data from the Current Population Survey (CPS). Benchmark distributions for Internet Access among the U.S. population of adults had been obtained from KnowledgePanel recruitment data since this measurement is not collected as part of the monthly CPS. However, as of June 2010, a special CPS supplement (October 2009) collected and reported an Internet access measurement and this replaces the recruitment source and is used as a benchmark for panel weighting.

Health and Caregiving among the 50+: Ownership, Use and Interest in Mobile Technology; January 2011 58
The post-stratification variables include:
Gender (Male/Female) Age (18-29, 30-44, 45-59, and 60+) Race/Hispanic ethnicity (White/Non-Hispanic, Black/Non-Hispanic, Other/Non-Hispanic,
2+ Races/Non-Hispanic, Hispanic) Education (Less than High School, High School, Some College, Bachelor and beyond) Census Region (Northeast, Midwest, South, West) Metropolitan Area (Yes, No) Internet Access (Yes, No)
This weighting adjustment is applied prior to the selection of any client sample from KnowledgePanel. These weights constitute the starting weights for any client survey selected from the panel.
Study-Specific Post-Stratification Weights
Once all the study data are returned from the field, we proceeded with a post-stratification process to adjust for any survey non-response and also any non-coverage due to the study-specific sample design. For the current study, demographic and geographic distributions for the non-institutionalized, civilian population in the eligible target area from KnowledgePanel as a whole are used as benchmarks in this adjustment.
The following benchmark distributions were utilized for this post-stratification adjustment:
Gender (Male/Female) Age (50-64, 65-74, 75+) Race/Hispanic ethnicity (White/Non-Hispanic, Black/Non-Hispanic, Other/Non-Hispanic,
2+ Races/Non-Hispanic, Hispanic) Education (Less than High School, High School, Some College, Bachelor and beyond) Census Region (Northeast, Midwest, South, West) Metropolitan Area (Yes, No) Internet Access (Yes, No)
Comparable distributions are calculated using all completed cases from the field data. Since study sample sizes are typically too small to accommodate a complete cross-tabulation of all the survey variables with the benchmark variables, an iterative proportional fitting is used for the post-stratification weighting adjustment. This procedure adjusts the sample data back to the selected benchmark proportions. Through an iterative convergence process, the weighted sample data are optimally fitted to the marginal distributions.
After this final post-stratification adjustment, the distribution of the calculated weights are examined to identify and, if necessary, trim outliers at the extreme upper and lower tails of the weight distribution. The post-stratified and trimmed weights are then scaled to the sum of the total sample size of all eligible respondents.


