Table of Grade Distribution by Gender
Grade UG E E+ D D+ C C+ B B+ A A+ NR Total
Male n 7 5 61 201 326 511 577 524 501 352 193 0 3,258
% 0.2 0.2 1.9 6.2 10.0 15.7 17.7 16.1 15.4 10.8 5.9 0.0 100.0
Female n 14 7 86 353 594 1,051 1,424 1,578 1,858 2,133 1,549 0 10,647
% 0.1 0.1 0.8 3.3 5.6 9.9 13.4 14.8 17.5 20.0 14.5 0.0 100.0
Gender X n 0 0 1 0 0 0 0 2 2 2 0 0 7
% 0.0 0.0 14.3 0.0 0.0 0.0 0.0 28.6 28.6 28.6 0.0 0.0 100.0
Total n 21 12 148 554 920 1,562 2,001 2,104 2,361 2,487 1,742 0 13912
% 0.2 0.1 1.1 4.0 6.6 11.2 14.4 15.1 17.0 17.9 12.5 0.0 100
Score Ranges 0-9 10-12 13-27 28-41 42-48 49-55 56-63 64-71 72-81 82-93 94-100 N/A Max 100
Mean 70.2
Std Dev 18.4
Median B
301
572
1
874
3,559
11,219
8
14786
Gender X
Total
Gender X numbers are too low for a graph to be meaningful
Health and Human Development
Graded Assessment 1
COURSEWORK UNIT 3
2017
Not Assessed:
Summary Statistics:
Male
Female
Gender X
Total
For privacy reasons, a gender with less than 5 students assessed has been assigned to the category of NR (Not Reported).
Total Enrolments incl.
Not Assessed:
Male
Female
No graph is supplied for this GA as student numbers are too small for a graph to be meaningfull.
0
5
10
15
20
25
UG E E+ D D+ C C+ B B+ A A+
%
Grade Distribution
Male Female Total
The Victorian Curriculum and Assessment Authority provides high quality
curriculum, assessment and reporting to enable learning for life.
© Victorian Curriculum and Assessment Authority, 2018
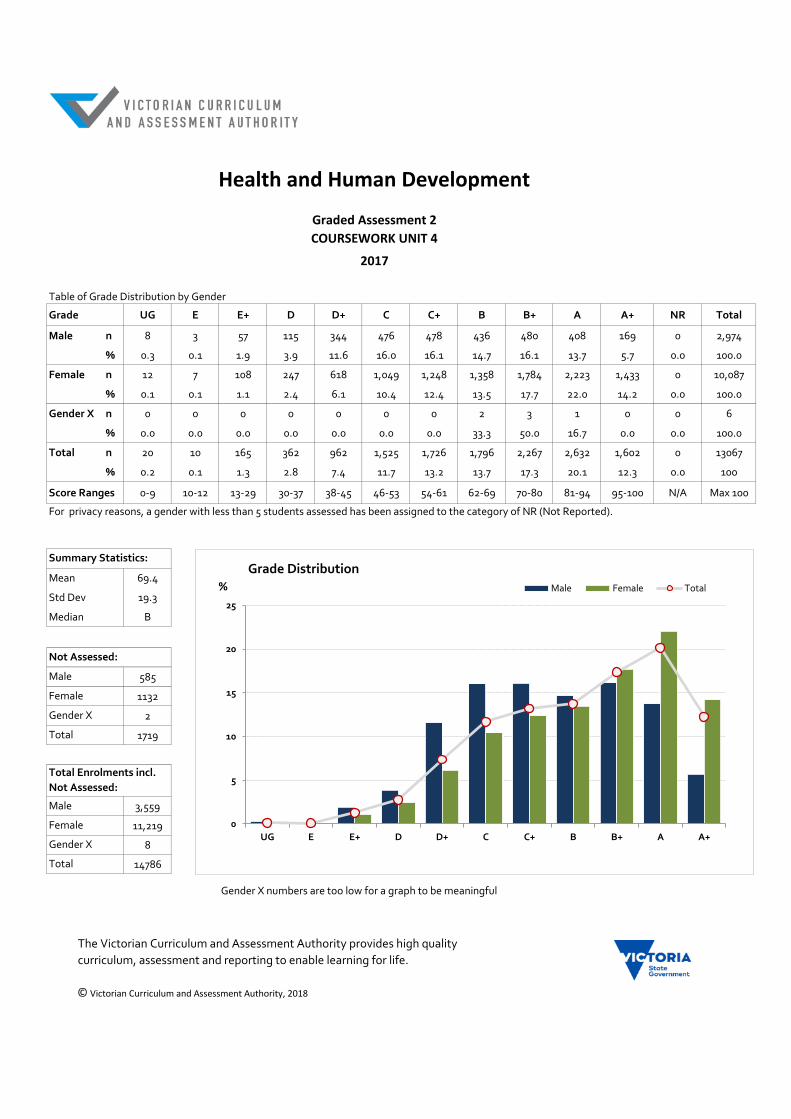
Table of Grade Distribution by Gender
Grade UG E E+ D D+ C C+ B B+ A A+ NR Total
Male n 8 3 57 115 344 476 478 436 480 408 169 0 2,974
% 0.3 0.1 1.9 3.9 11.6 16.0 16.1 14.7 16.1 13.7 5.7 0.0 100.0
Female n 12 7 108 247 618 1,049 1,248 1,358 1,784 2,223 1,433 0 10,087
% 0.1 0.1 1.1 2.4 6.1 10.4 12.4 13.5 17.7 22.0 14.2 0.0 100.0
Gender X n 0 0 0 0 0 0 0 2 3 1 0 0 6
% 0.0 0.0 0.0 0.0 0.0 0.0 0.0 33.3 50.0 16.7 0.0 0.0 100.0
Total n 20 10 165 362 962 1,525 1,726 1,796 2,267 2,632 1,602 0 13067
% 0.2 0.1 1.3 2.8 7.4 11.7 13.2 13.7 17.3 20.1 12.3 0.0 100
Score Ranges 0-9 10-12 13-29 30-37 38-45 46-53 54-61 62-69 70-80 81-94 95-100 N/A Max 100
Mean 69.4
Std Dev 19.3
Median B
585
1132
2
1719
3,559
11,219
8
14786
Gender X
Total
Gender X numbers are too low for a graph to be meaningful
Health and Human Development
Graded Assessment 2
COURSEWORK UNIT 4
2017
Not Assessed:
Summary Statistics:
Male
Female
Gender X
Total
For privacy reasons, a gender with less than 5 students assessed has been assigned to the category of NR (Not Reported).
Total Enrolments incl.
Not Assessed:
Male
Female
No graph is supplied for this GA as student numbers are too small for a graph to be meaningfull.
0
5
10
15
20
25
UG E E+ D D+ C C+ B B+ A A+
%
Grade Distribution
Male Female Total
The Victorian Curriculum and Assessment Authority provides high quality
curriculum, assessment and reporting to enable learning for life.
© Victorian Curriculum and Assessment Authority, 2018
Table of Grade Distribution by Gender
Grade UG E E+ D D+ C C+ B B+ A A+ NR Total
Male n 44 53 170 299 440 494 498 371 246 177 109 0 2,901
% 1.5 1.8 5.9 10.3 15.2 17.0 17.2 12.8 8.5 6.1 3.8 0.0 100.0
Female n 70 104 328 565 964 1,271 1,555 1,476 1,344 1,271 965 0 9,913
% 0.7 1.0 3.3 5.7 9.7 12.8 15.7 14.9 13.6 12.8 9.7 0.0 100.0
Gender X n 0 0 0 0 0 2 0 2 1 1 0 0 6
% 0.0 0.0 0.0 0.0 0.0 33.3 0.0 33.3 16.7 16.7 0.0 0.0 100.0
Total n 114 157 498 864 1,404 1,767 2,053 1,849 1,591 1,449 1,074 0 12820
% 0.9 1.2 3.9 6.7 11.0 13.8 16.0 14.4 12.4 11.3 8.4 0.0 100
Score Ranges 0-12 13-19 20-31 32-44 45-60 61-79 80-100 101-121 122-140 141-160 161-200 N/A Max 200
Mean 97.2
Std Dev 43.3
Median C+
658
1306
2
1966
3,559
11,219
8
14786
Gender X
Total
Gender X numbers are too low for a graph to be meaningful
Health and Human Development
Graded Assessment 3
WRITTEN EXAMINATION
2017
Not Assessed:
Summary Statistics:
Male
Female
Gender X
Total
For privacy reasons, a gender with less than 5 students assessed has been assigned to the category of NR (Not Reported).
Total Enrolments incl.
Not Assessed:
Male
Female
No graph is supplied for this GA as student numbers are too small for a graph to be meaningfull.
0
2
4
6
8
10
12
14
16
18
20
UG E E+ D D+ C C+ B B+ A A+
%
Grade Distribution
Male Female Total
The Victorian Curriculum and Assessment Authority provides high quality
curriculum, assessment and reporting to enable learning for life.
© Victorian Curriculum and Assessment Authority, 2018