32
Health and Living Conditions in Eight Indian Cities 2005-06 National Family Health Survey (NFHS-3), India
| Date post: | 22-Dec-2015 |
| Category: |
Documents |
| Upload: | jesse-green |
| View: | 223 times |
| Download: | 0 times |
Health and Living Conditions in Eight Indian Cities
2005-06 National Family Health Survey (NFHS-3), India
Objective
To examine the intercity and intracity differentials in the health and living conditions of population by slum/non-slum residence and economic status in eight big cities of India
NFHS-3, India

Contents
• Need to focus on urban health by slum/non-slum residence and by economic status
• Differentials in living conditions
• Differentials in health status
• Spousal violence
NFHS-3, India

Need to Focus on Urban Health The urban population in India is expected to increase to
more than 550 million by 2030
Currently, a sizable proportion of the population in most Indian cities lives in slum areas
The increasing slum population is seen an indication of worsening living conditions and increasing poverty in Indian cities
The increasing concentration of the population in slums and urban poverty have drawn a strong interest in urban health in general, and the health of slum dwellers and the urban poor in particular
NFHS-3, India

Data on slum/non-slum areas in NFHS-3
Due to the growth of the urban population and a strong interest in urban health, as well as the Millennium Development Goal on improving the lives of slum dwellers, in NFHS-3 eight cities (i.e. Chennai, Delhi, Hyderabad, Indore, Kolkata, Meerut, Mumbai, and Nagpur) were selected for providing slum/non-slum estimates
NFHS-3, India

Proportion of Slum Population
According to 2001 Census, these eight cities together possessed nearly 30 percent of the total enumerated slum population of the country
NFHS-3, India

Sample
Slum/non-slum areas in cities are defined according to the census definition and supervisor’s observation
The poor in these cities include those belonging to the lowest quartile of the wealth index, which is calculated on the basis of ownership of a number of household assets, housing quality and important housing facilities for the urban sample as a whole at all India level. This definition of the poor is not the same as the population living below the poverty line.
NFHS-3, India
Contents
• Need to focus on urban health by slum/non-slum residence and by economic status
• Differentials in living conditions
• Differentials in health status
• Spousal violence
NFHS-3, India

Proportions of Slum Households and Poor Households in Selected Cities, India, 2005-06
Delhi Meerut Kolkata Indore Mumbai Nagpur Hy-der-abad
Chennai
20
4333
20
56
34
18 1814 16 14 12 821
13 17
Slum Poor
In every city there are many more slum households than poor households.
NFHS-3, India

Percentage of Poor Households in Slum/Non-slum Areas
Delhi Meerut Kolkata Indore Mumbai Nagpur Hy-der-abad
Chennai
42
23 23
9 10
29
17
32
510 8 12
3
15 11 12
Slum Non-slum
• Poverty is more prevalent in slum areas than in non-slum areas in every city except Indore
• Disparity in the proportion of poor between slum and non-slum areas is largest in Delhi followed by Chennai
NFHS-3, India

Distribution of the Poor between Slum and Non-slum Areas
Delhi Meerut Kolkata Indore Mumbai Nagpur Hy-der-abad
Chennai
68 66 61
16
79
53
2437
32 35 40
84
21
47
7663
Non-slum Slum
NFHS-3, India

Household Living Conditions
As expected, slums have poorer housing quality than non-slum areas whether we consider construction material, residential crowding or ventilation. However, the poor have the worst housing conditions on all counts.
There is not much difference between slum and non-slum households in the accessibility of piped water supply
NFHS-3, India

Household Living Conditions The use of improved toilet facilities is not very high
in most of these cities. In almost all cities, the accessibility to proper sanitation facilities is much worse in slum areas than in non-slum areas. A higher proportion of slum dwellers and members of poor households defecate in the open.
A majority of households in these cities use clean fuel (LPG, electricity or bio gas) for cooking. Differentials in the use of clean cooking fuels between slum and non-slum households are large in most cities.
NFHS-3, India

Delhi Meerut Kolkata Indore Mumbai Nagpur Hy-der-abad
Chennai
52 47
65
13
3244
33
55
1020
3015 15 20 25 25
8492 98
73
9689 88 92
Slum Non-slum Poor
Percentage of Households Using Kerosene and Solid Fuels
NFHS-3, India

Percentage of Poor Households Possessing a BPL Card
Hyderabad
Nagpur
Indore
Kolkata
Delhi
Chennai
Mumbai
Meerut
34
24
16
12
6
5
2
1
Except for Hyderabad (24%) and Nagpur (16%), only a small proportion of households (6% or less) have a BPL card
NFHS-3, India

Contents
• Need to focus on urban health by slum/non-slum residence and by economic status
• Differentials in living conditions
• Differentials in health status
• Spousal violence
NFHS-3, India
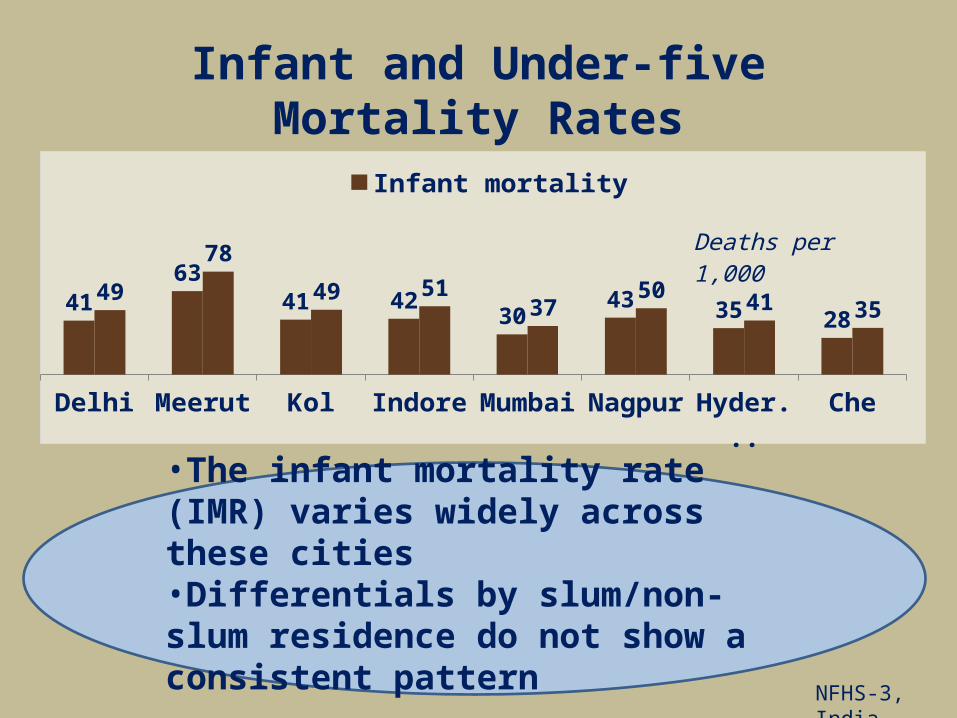
Infant and Under-five Mortality Rates
Delhi Meerut Kolkata Indore Mumbai Nagpur Hy-der-abad
Chennai
4163
41 4230
43 35 2849
78
49 5137
50 41 35
Infant mortality Under-five mortality
Deaths per 1,000
•The infant mortality rate (IMR) varies widely across these cities•Differentials by slum/non-slum residence do not show a consistent pattern
NFHS-3, India
Nagpur
Mumbai
Meerut
Kolkata
Indore
Hyderabad
Delhi
Chennai
57
69
35
63
74
53
52
89
76
73
50
71
76
62
67
74
Non-slum Slum
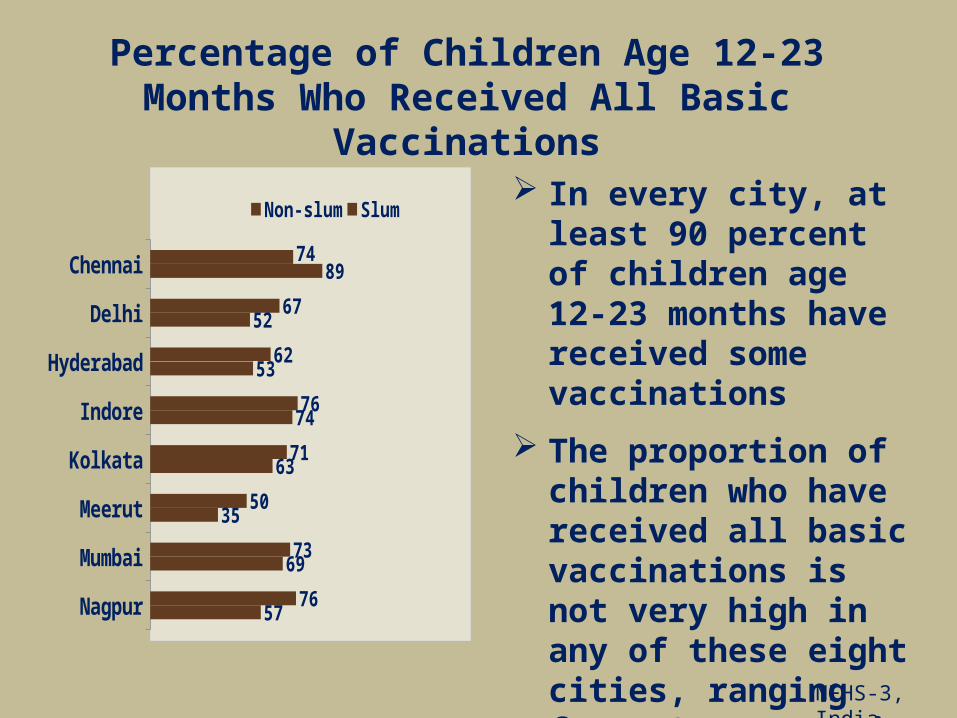
Percentage of Children Age 12-23 Months Who Received All Basic Vaccinations
In every city, at least 90 percent of children age 12-23 months have received some vaccinations
The proportion of children who have received all basic vaccinations is not very high in any of these eight cities, ranging from 43 percent in Meerut to 78 percent in Chennai
NFHS-3, India

Percentage of Women Who Had Three or More Antenatal Care Visits
Delhi Meerut Kolkata Indore Mumbai Nagpur Hy-der-abad
Chennai
58 6181 84
9081
91 9980
61
90 8593 94 91
100
4132
68 66
92
7382
99
Slum Non-slum Poor
NFHS-3, India

Percentage of Women Who Received All Recommended Antenatal Care
Delhi Meerut Kolkata Indore Mumbai Nagpur Hy-der-abad
Chennai
14 1625 29
18 1729
4135
26 29 3222
40 4152
4 412 13 13
7
2530
Slum Non-slum Poor
Although the utilization of all antenatal care services differs substantially across the cities,
between their slum and non-slum areas, in almost all cases poor women are the least likely to receive
every antenatal care serviceNFHS-3, India

Place of Delivery
Delhi Meerut Kolkata Indore Mumbai Nagpur Hy-der-abad
Chennai
42 43
81 80 82 81 90 99
7161
9376
93 87 95100
25 18
62
31
7463
80100
Slum Non-slum Poor
At least 60 percent of deliveries in these cities took place in health facilities, except in Meerut
where only 46 percent of deliveries were conducted in health facilities. Institutional
deliveries were nearly universal in Chennai and Hyderabad.
NFHS-3, India

Maternal CareAll indicators of delivery and postnatal care
are consistently better in non-slum areas than in slum areas in all cities except Indore and Chennai, where there is essentially no difference in the utilization of postnatal care
The utilization of delivery and postnatal services is lowest among poor women in all cities except Chennai. The differences are particularly striking in Meerut and Delhi.
NFHS-3, India
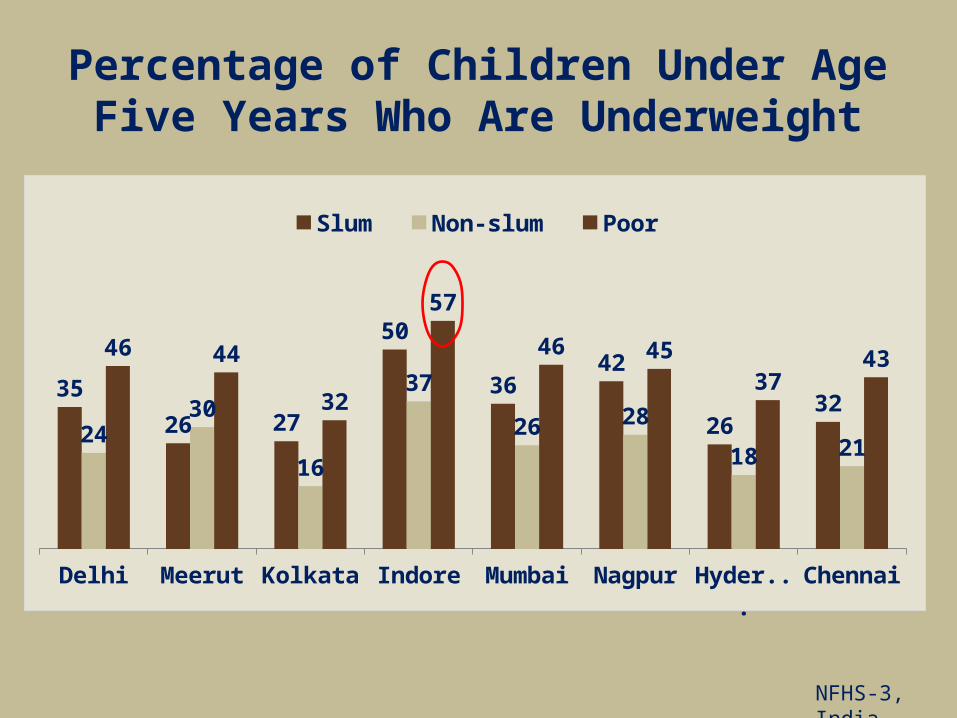
Percentage of Children Under Age Five Years Who Are Underweight
Delhi Meerut Kolkata Indore Mumbai Nagpur Hy-der-abad
Chennai
35
26 27
50
3642
2632
2430
16
37
26 28
18 21
46 44
32
57
46 4537
43
Slum Non-slum Poor
NFHS-3, India

Percentage of Children Age 6-59 Months Who have Anaemia
Delhi Meerut Kolkata Indore Mumbai Nagpur Hy-der-abad
Chennai
71 6955 60
50
7159
72
5267
55 5347
58 5360
67 7366 72
52
7864
83
Slum Non-slum Poor
There is not much variation in the anaemia status of children ranging from
49% in Mumbai to 68% in MeerutNFHS-3, India

Percentage of Children Age 0-71 Months Who Received Any Service from An Anganwadi Centre
Indore
Nagpur
Chennai
Kolkata
Mumbai
Delhi
Meerut
Hy-der-abad
31
30
21
19
17
10
7
4 The percentage of children that are covered by an AWC varies substantially across these cities, ranging from 12% in Meerut to 95% in Chennai
NFHS-3, India

Nutritional Status of Women
Delhi Meerut Kolkata Indore Mumbai Nagpur Hy-der-abad
Chennai
14 20 1625 22
3121 16
58 50 5453 50
50
4645
27 30 30 22 27 1933 39
Thin Normal Overweight
NFHS-3, India

Anaemia Among Poor Women
Meerut Mumbai Indore Hy-der-abad
Delhi Chennai Nagpur Kolkata
42 44 50 51 51 54 5665
Percentage
Anaemia is widespread among women in every city, ranging within a narrow band
from 40% in Indore to 55% in Kolkata
NFHS-3, India

Contents
• Need to focus on urban health by slum/non-slum residence and by economic status
• Differentials in living conditions
• Differentials in health status
• Spousal violence
NFHS-3, India

Spousal Violence Among Ever-married Women
Delhi Meerut Kolkata Indore Mumbai Nagpur Hy-der-abad
Chennai
28
49
36 3523
34 30
62
12
27 22
38
15 1726
3637
67
49
64
2533
42
68
Slum Non-slum PoorPercentage
NFHS-3, India

Conclusions and RecommendationsIn general, most, but not all, of the selected
indicators of living environment and health status of the population in eight cities are better in non-slum areas than in slum areas. Nevertheless, the
urban poor in every city are in the most disadvantaged position with respect of almost all of the selected indicators. Since a large proportion of the poor population in every one of the eight cities does not live in slums, there is an imperative need
to have a more inclusive policy that extends services to all poor people in addition to slum dwellers.
NFHS-3, India

Contd…Since inter-city disparities in most indicators
are much sharper than the intra-city disparities by residence or economic status, for evidence-based planning, it is important to have reliable
disaggregated data on environmental and health conditions in individual cities and for different groups within these cities similar to the information provided in NFHS-3 for eight
selected cities.
NFHS-3, India

THANK YOU


