HEALTH AND NUTRITION-RELATED CHARACTERISTICS OF FACULTY AND STAFF WHO UTILIZED THE NUTRITION ASSESSMENT LABORATORY AS PART OF THE WORKING WELL WORKSITE WELLNESS PROGRAM AT BALL STATE UNIVERSITY A THESIS SUBMITTED TO THE GRADUATE SCHOOL IN PARTIAL FULFILLMENT OF THE REQUIREMENTS FOR THE DEGREE MASTER OF SCIENCE BY REBEKAH VUKOVICH DR. CAROL FRIESEN - ADVISOR BALL STATE UNIVERSITY MUNCIE, IN MAY 2017
Transcript
HEALTH AND NUTRITION-RELATED CHARACTERISTICS OF FACULTY AND STAFF
WHO UTILIZED THE NUTRITION ASSESSMENT LABORATORY AS PART OF THE
WORKING WELL WORKSITE WELLNESS PROGRAM AT BALL STATE UNIVERSITY
A THESIS
SUBMITTED TO THE GRADUATE SCHOOL
IN PARTIAL FULFILLMENT OF THE REQUIREMENTS
FOR THE DEGREE
MASTER OF SCIENCE
BY
REBEKAH VUKOVICH
DR. CAROL FRIESEN - ADVISOR
BALL STATE UNIVERSITY
MUNCIE, IN
MAY 2017
ii
ABSTRACT
THESIS: Health and Nutrition-Related Characteristics of Faculty and Staff Who Utilized
the Nutrition Assessment Laboratory as Part of the Working Well Worksite Wellness Program at Ball State University
STUDENT: Rebekah Vukovich DEGREE: Master of Science COLLEGE: College of Health DATE: May 2017
PAGES: 164
The overall state of health in the United States is poor, with a growing incidence of
obesity and chronic diseases. The health of employees affects an employer through productivity
changes and as health care costs are high for both individuals and employers. For these reasons,
it is beneficial for employers to be aware of the health risks of their employees and proactive in
prevention and treatment. The purpose of this study was to identify the nutrition and health-
related characteristics of faculty and staff at a mid-major university who completed an
enrollment survey for the Nutrition Assessment Lab (NAL). The NAL, staffed by an RD or RD-
eligible graduate student, offers nutrition education, nutrition counseling, and biometric
screening services to Ball State University employees. Results from the Nutrition Assessment
Lab Working Well Enrollment Form, collected from 2010-2016, indicated the primary reasons
participants came to the lab were to lose weight (65.1%; n=151) and to improve overall diet
(56.9%; n=132). The majority of participants were female (81%), white (86.5%), and were
classified as professionals (27.2%) or professors (25%). Over two-thirds (67.9%) of the
participants were overweight or obese. Measured biochemical data indicated 43.1% had elevated
total cholesterol, 65.7% had elevated LDL cholesterol, 30.5% had elevated triglycerides, and
iii
22% had low HDL levels. Results of dietary intake found that only 6.9% of participants reported
consuming five or more servings of fruits and vegetables per day. The Stages of Change results
indicated the largest percentage of employees who came to the NAL were in the early-action or
late-action stage. The results of this study will be used to evaluate the NAL’s current services, to
justify its continued need, and to improve the services provide by the NAL to better meet the
health needs of university employees.
iv
ACKNOWLEDGEMENTS
I would like to recognize the many that have helped me complete my Master’s degree in
Nutrition and Dietetics and my graduate thesis. I have my learned a great deal about nutrition,
research, and educational and counseling strategies in the past two years, through coursework,
hands-on experiences, and this project. I am grateful for the experiences I have had at Ball State
University.
First, I would like to thank Dr. Friesen, my graduate advisor, Nutrition Assessment Lab
supervisor, and committee chair. Thank you for the many hours of advising, planning, and
editing. Dr. Friesen, I truly appreciate the guidance, encouragement, support, and feedback over
the past two years. You continually encourage students and push them to higher standards.
Second, I would to thank all my committee members, Dr. Brandon Kistler, Dr. Alan Yen,
and Mrs. Rhonda Wilson. Thank you for your insight and your aid in the process of my thesis.
Third, an immense thank you to my family and friends who have provided support and
encouragement as I work toward my master’s degree. I especially want to thank my mother who
has provided constant support in my academic journey. She has been a steadfast voice of truth
and encouragement and reminding me to always seek the Lord for guidance and strength.
v
TABLE OF CONTENTS
PAGE
ABSTRACT ................................................................................................................................. ii
ACKNOWLEDGEMENTS ........................................................................................................... iv
TABLE OF CONTENTS .................................................................................................................v
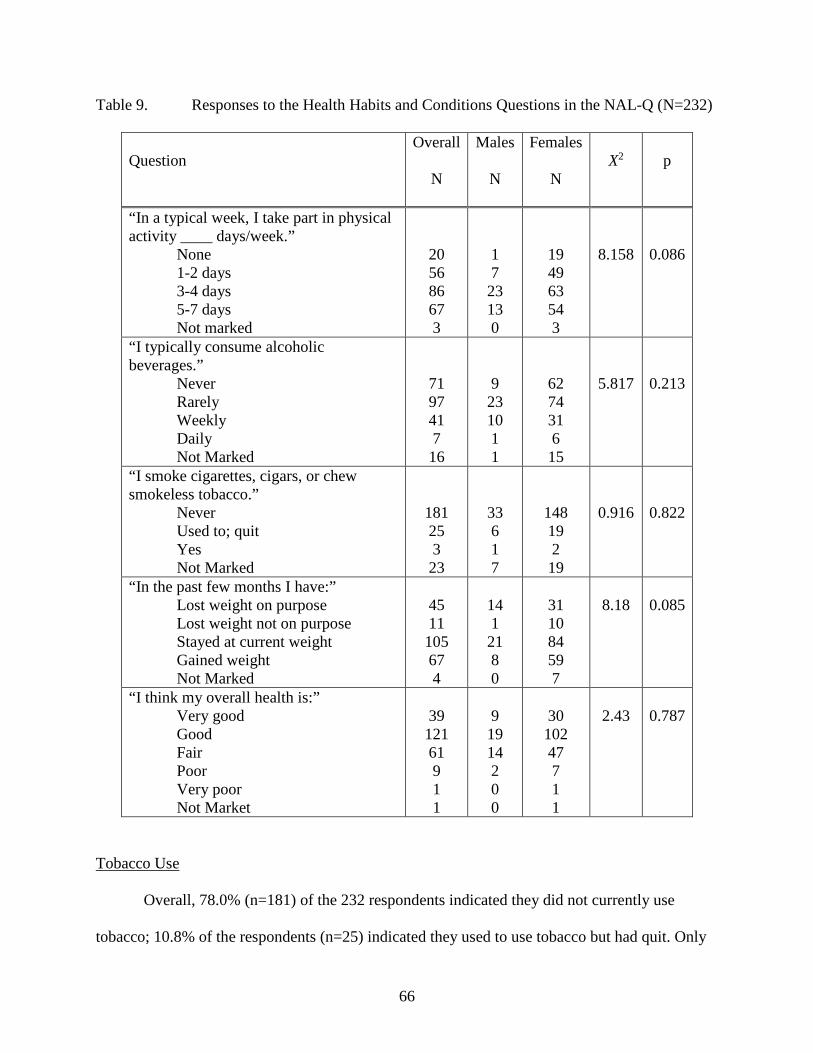
Of the 15 participants with high total cholesterol levels, one-third (n=5; 33.3%) either did
not mark or did not know they had high levels when asked to indicate, “My health conditions
are” from a list of options in the NAL questionnaire. Of these, two (40%) were male and 3 (60%)
were female. There was no difference in the percent of participants who had high cholesterol
levels – but did not know it – by gender (X2=1.877; p =0.171).
52
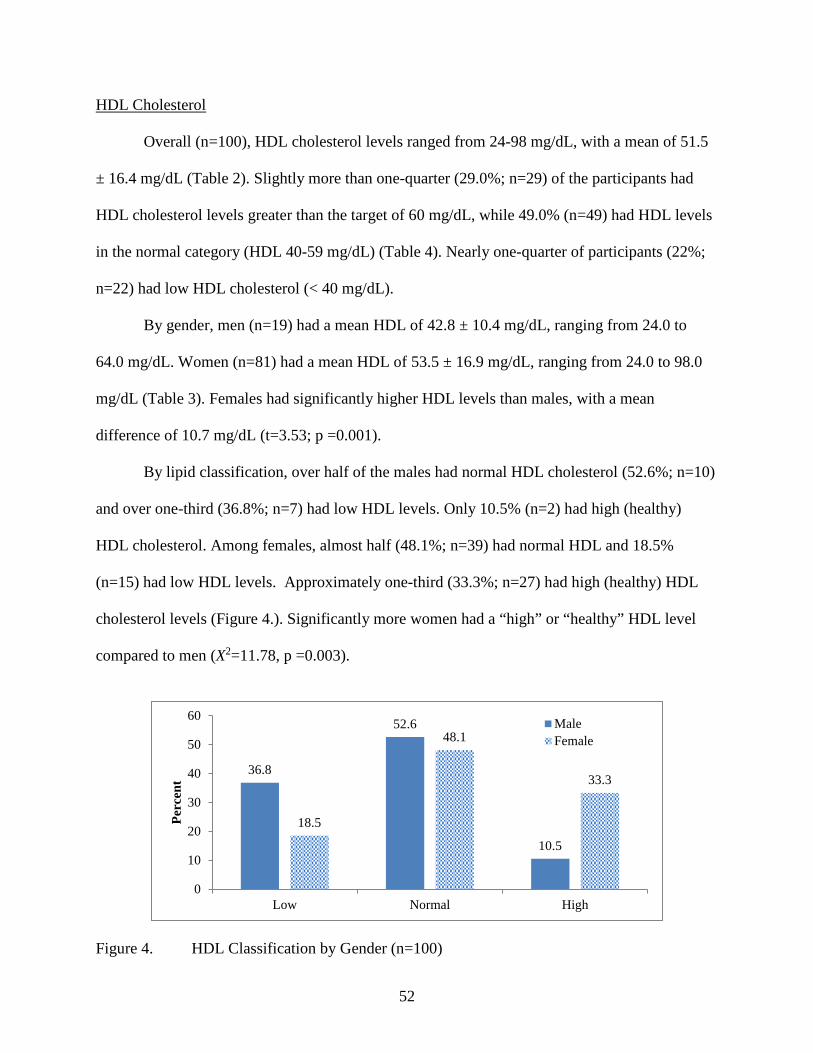
HDL Cholesterol
Overall (n=100), HDL cholesterol levels ranged from 24-98 mg/dL, with a mean of 51.5
± 16.4 mg/dL (Table 2). Slightly more than one-quarter (29.0%; n=29) of the participants had
HDL cholesterol levels greater than the target of 60 mg/dL, while 49.0% (n=49) had HDL levels
in the normal category (HDL 40-59 mg/dL) (Table 4). Nearly one-quarter of participants (22%;
n=22) had low HDL cholesterol (< 40 mg/dL).
By gender, men (n=19) had a mean HDL of 42.8 ± 10.4 mg/dL, ranging from 24.0 to
64.0 mg/dL. Women (n=81) had a mean HDL of 53.5 ± 16.9 mg/dL, ranging from 24.0 to 98.0
mg/dL (Table 3). Females had significantly higher HDL levels than males, with a mean
difference of 10.7 mg/dL (t=3.53; p =0.001).
By lipid classification, over half of the males had normal HDL cholesterol (52.6%; n=10)
and over one-third (36.8%; n=7) had low HDL levels. Only 10.5% (n=2) had high (healthy)
HDL cholesterol. Among females, almost half (48.1%; n=39) had normal HDL and 18.5%
(n=15) had low HDL levels. Approximately one-third (33.3%; n=27) had high (healthy) HDL
cholesterol levels (Figure 4.). Significantly more women had a “high” or “healthy” HDL level
compared to men (X2=11.78, p =0.003).
Figure 4. HDL Classification by Gender (n=100)
36.8
52.6
10.5
18.5
48.1
33.3
0
10
20
30
40
50
60
Low Normal High
Perc
ent
MaleFemale
53
LDL Cholesterol
The mean LDL cholesterol level among participants (n=88) was 119.6 ± 37.5 mg/dL,
with a range of 36-208 mg/dL (Table 2). Only one-third (35.2%; n=31) of participants had
optimal LDL cholesterol levels (<100 mg/dL) (Table 4). More than one in five (20.4%) had near
optimal, 30.7% had borderline high, 9.1% had high, and 4.5% had very high LDL(Table 4).
Among males (n=19), the mean LDL cholesterol was 134.8 ± 34.2 mg/dL, ranging from
83 to 201. Among females (n=69), the mean LDL cholesterol was 115.4 ± 37.5 mg/dL, ranging
from 36 to 208 mg/dL. Males had a significantly higher LDL cholesterol level (t=2.03; p =0.045)
than females (Table 3).
By classification, 21.1% of males (n=4) had optimal LDL cholesterol, 21.1% (n=4) had
near optimal LDL levels, 31.6% (n=6) had borderline high LDL levels, 21.1% (n=4) had high
LDL levels, and 5.3% (n=1) had a very high LDL cholesterol level. Among females, 39.1%
(n=27) had optimal cholesterol levels, 20.3% (n=14) had near optimal LDL levels, 30.4% (n=21)
had borderline high LDL levels, 5.8% (n=4) had high LDL levels, and 4.3% (n=3) had very high
LDL cholesterol levels (Figure 5). There was no difference in the distribution of LDL cholesterol
levels between men and women (X2=5.234, p = 0.264).
54
Figure 5. Classification of LDL Cholesterol Levels by Gender (n=88)
Triglycerides
The mean triglyceride level among those with measured levels (n=95) was 144.2 ± 98.6
mg/dL, with a range of 45-547 mg/dL (Table 2). Over two-thirds (69.5%) of the participants had
optimal triglycerides (<150 mg/dL) (Table 4).
By gender, men (n=20), on average, had triglycerides levels of 125.2 ± 59.1 mg/dL,
ranging from 63 to 288 mg/dL. Women (n=75), on average, had triglyceride levels of 149.3 ±
106.5 mg/dL, ranging from 45 to 547 mg/dL. There was no difference in triglycerides by gender
(t=1.34; p =0.186) (Table 3).
By classification, 80% (n=16) of the 20 men had optimal triglyceride levels, 10% (n=2)
had borderline high triglycerides, and 10% (n=2) had high triglyceride levels. No males had a
triglyceride level classified as “very high.” Among females, 66.7% (n=50) had optimal
triglycerides, while 10.7% (n=8) had borderline high, 20.0% (n=15) had high triglycerides, and
2.7% (n=2) had very high triglyceride levels (Figure 6) (Table 4). There was no difference in the
classification of triglyceride levels between men and women (X2=1.826, p = 0.609).
21.1 21.1
31.6
21.1
5.3
39.1
20.3
30.4
5.84.3
0
5
10
15
20
25
30
35
40
45
Optimal Near Opt Bord High High Very High
Perc
ent
MaleFemale
55
Of the 19 participants who had high (n=2 male; n=15 female) or very high (n=2 females)
triglyceride levels, 14 (74%) (1 male; 13 females) either did not mark or did not know they had
high triglyceride levels when asked to indicate, “My health conditions are” from a list of options
in the NAL questionnaire. There was a significant difference in the percent of participants who
had high triglyceride levels – but did not know it – by gender (X2=4.26; p =0.039).
Figure 6. Classification of Triglyceride by Gender (n=95)
Total Cholesterol/HDL Cholesterol Ratio
Overall, among the participants for whom a TC/HDL ratio was recorded (n=42), the
mean ratio was 4.6 ± 1.4, with a range from 2.0 to 8.2 (Table 2). Only 19% (n=8) had an optimal
TC/HDL ratio of ≤3.5 (Table 4).
By gender, the TC/HDL ratio for males (n=12) was 4.8 ± 1.2, with a range of 2.7 to 6.7
(Table 3). Only 16.7% (n=2) of males had an optimal TC/HDL ratio. Among females (n=30), the
average TC/HDL ratio was 4.5 ± 1.5, with a range of 2.0 to 8.2. Only 20% (n=6) of women had
an optimal TC/HDL ratio. There was no significant difference in the TC/HDL ratio by gender
(t=0.57; p =0.572).
80
10 10
0
66.7
10.7
20
2.70
10
20
30
40
50
60
70
80
90
Optimal Bord High High Very High
Perc
ent
Male
Female
56
Blood Glucose
The mean blood glucose level among those with recorded values (n=94) was 90.5 ± 12.7
mg/dL, with a range of 61-146 mg/dL (Table 2). The majority of participants (80.9%; n=76) had
a blood glucose level within the optimal range (<100 mg/dL) (Table 4). Seventeen participants
(18.1%) had impaired blood glucose (≥100 to <126), while only one (1.1%) participant was in
the range of diabetes (≥126 mg/dL) (Table 4).
By gender, the mean blood glucose among males (n=20) was 95.4 ± 10.7 mg/dL, ranging
from 77 to 118 mg/dL. Among females (n=74), the mean blood glucose was 89.2 ± 13.0 mg/dL,
ranging from 61 to 146. There was no difference in blood glucose levels by gender (t=1.95; p
=0.054) (Table 3). By health risk classification, among males, 70% (n=14) had optimal fasting
glucose levels and 30% (n=6) had impaired fasting glucose levels (Figure 7) (Table 4). Among
females, 83.8% (n=62) had optimal glucose, while 14.9% (n=11) had impaired and 1.4% (n=1)
had high glucose levels (Figure 7) (Table 4). There was no significance in the blood glucose
classification by gender (X2=2.65; p = 0.268). Fourteen of the 17 (82%) participants with
impaired fasting glucose either did not know or did not indicate they had pre-diabetes or diabetes
on the NAL-Q.
57
Figure 7. Classification of Fasting Blood Glucose by Gender (n=94)
RQ#1-d: Clinical Measures
Clinical measures taken included systolic blood pressure, diastolic blood pressure, T-
score, and Z-score. All clinical values are presented overall and by gender. An Independent
samples t-test was used to test the differences in clinical measures between males and females.
Systolic Blood Pressure
Among all participants with recorded blood pressure (n=85), mean systolic blood
pressure (SBP) was 122.1 ± 15.4 mmHg, ranging from 92 to 169 mmHg (Table 5). Nearly half
(49.4%; n=42) of all participants had SPB less than or equal to 120 mmHg (Table 6).
70
30
0
83.3
14.9
1.40
10
20
30
40
50
60
70
80
90
Optimal Impaired High
Perc
ent
Male
Female
58
Table 5 Overall Clinical Data of NAL participants
Measure n Mean ± SD Target Range Systolic Blood Pressure (mmHg)
85 122.1 ± 15.4 < 120 mmHg* 92-169
Diastolic Blood Pressure (mmHg)
86 75.2 ± 11.1 ≤ 80 mmHg* 54-105
T-Score#
21 -0.83 ± 1.1 ≥ -1# -3 - 1
Z-Score#
25 -0.32 ± 0.94 > -2.0# -2 - 1
*Target values based on current American Heart Association Guidelines # T-and Z score target values based on the International Society for Clinical Densitometry
Table 6. Blood Pressure Classification Overall and by Gender
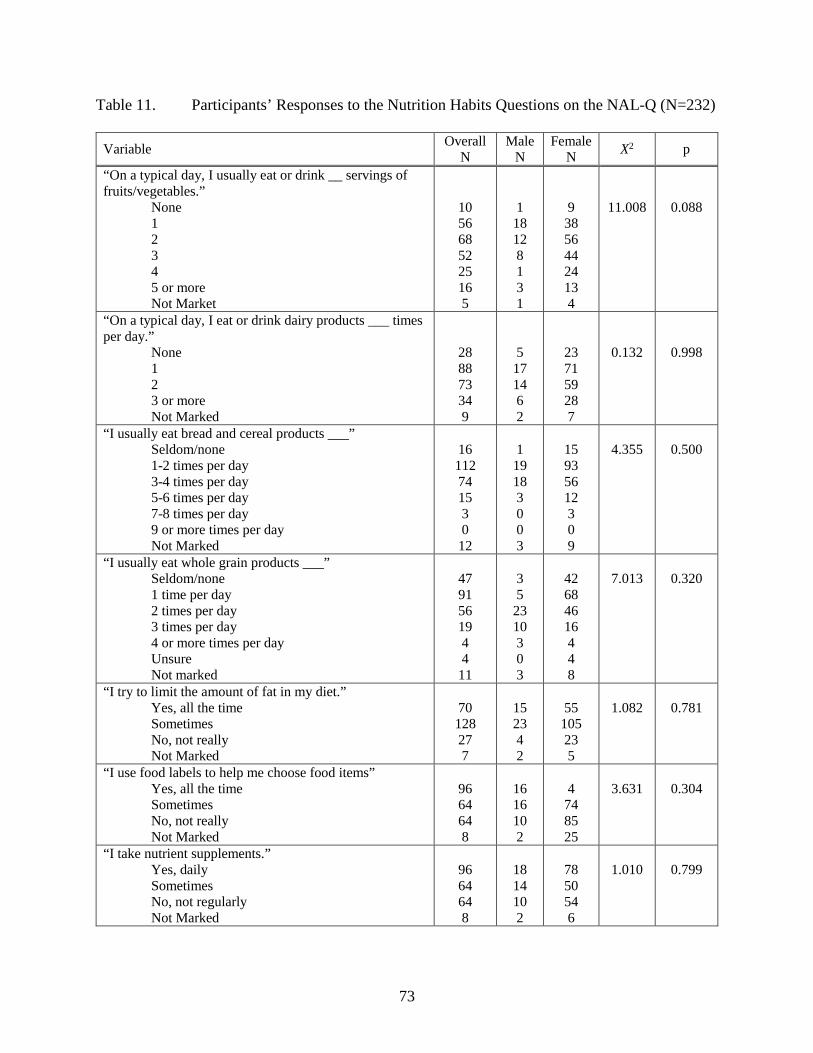
The NAL-Q included eight questions about nutrition habits of the clients who come to the
Nutrition Assessment Laboratory. Six of the questions addressed the client’s dietary intake of
fruit and vegetables, dairy products, grains products, and whole grains. Three questions
72
addressed whether or not participants limit their dietary fat, use food labels, or take nutrient
supplements. The results are analyzed both overall and by gender.
Servings of Fruits and Vegetables
In response to the question, “On a typical day, I usually eat or drink __ servings of fruits
and vegetables per day,” the largest percentage (29.3%; n=68) of participants indicated they
consumed two servings per day of fruits and vegetables. The mean intake of fruit and vegetables
was 2.25 ± 1.35 servings per day. Only 6.9% (n=16) of the participants reported consuming the
recommended five or more servings of fruits and vegetables per day. Although not meeting the
goal, 10.8% (n=25) reported consuming fruits and vegetables 4 times per day, with an additional
22.4% (n=52) reported consuming fruits and vegetables 3 times per day. More than one out of
every four participant reported they only ate fruits and vegetables once per day (24.1%; n=56) or
not at all (4.3%; n=10) (Table 11).
By gender, the largest percentage (40.9%; n=18) of males reported consuming only one
serving of fruits and vegetables per day. The mean intake of fruit and vegetables among males
was 1.91 ± 1.27 servings per day. Only 6.8% (n=3) of the men reported consuming the
recommended 5 or more servings of fruits and vegetables per day. Although not meeting the
goal, 2.3% (n=1) reported consuming fruits and vegetables 4 times per day, with an additional
18.2% (n=8) reported consuming fruits and vegetables 3 times per day. Slightly more than one
out of every four men (27.3%; n=12) consumed two servings of fruits and vegetables per day.
Forty-three percent of the male participants reported they only ate fruits and vegetables once per
day (40.9%; n=18) or not at all (2.3%; n=1) (Figure 11).
73
Table 11. Participants’ Responses to the Nutrition Habits Questions on the NAL-Q (N=232)
Variable Overall N
Male N
Female N X2 p
“On a typical day, I usually eat or drink __ servings of fruits/vegetables.” None 1 2 3 4 5 or more Not Market
10 56 68 52 25 16 5
1 18 12 8 1 3 1
9 38 56 44 24 13 4
11.008
0.088
“On a typical day, I eat or drink dairy products ___ times per day.” None 1 2 3 or more Not Marked
28 88 73 34 9
5 17 14 6 2
23 71 59 28 7
0.132
0.998
“I usually eat bread and cereal products ___” Seldom/none 1-2 times per day 3-4 times per day 5-6 times per day 7-8 times per day 9 or more times per day Not Marked
16 112 74 15 3 0
12
1
19 18 3 0 0 3
15 93 56 12 3 0 9
4.355
0.500
“I usually eat whole grain products ___” Seldom/none 1 time per day 2 times per day 3 times per day 4 or more times per day Unsure Not marked
47 91 56 19 4 4
11
3 5
23 10 3 0 3
42 68 46 16 4 4 8
7.013
0.320
“I try to limit the amount of fat in my diet.” Yes, all the time Sometimes No, not really Not Marked
70 128 27 7
15 23 4 2
55
105 23 5
1.082
0.781
“I use food labels to help me choose food items” Yes, all the time Sometimes No, not really Not Marked
96 64 64 8
16 16 10 2
4
74 85 25
3.631
0.304
“I take nutrient supplements.” Yes, daily Sometimes No, not regularly Not Marked
96 64 64 8
18 14 10 2
78 50 54 6
1.010
0.799
74
Among women, the largest percentage (29.8%; n=44) of females reported consuming two
servings of fruits and vegetables per day. The mean intake of fruit and vegetables among females
was 2.34 ± 1.35 servings per day. There was no difference in fruit and vegetable consumption by
gender (t=1.89; p =0.06). Similar to the men, only 6.9% (n=13) of the women reported
consuming the receommended 5 or more servings of fruits and vegetables per day. Although not
meeting the goal, 12.8% (n=24) of the women reported consuming fruits and vegetables 4 times
per day, with an additional 23.4% (n=44) consuming fruits and vegetables 3 times per day.
Slightly more than one out of every four women (29.8%; n=56) reported consuming two servings
of fruits and vegetables per day. Twenty-five percent of the female participants reported they
only ate fruits and vegetables once per day (20.2%; n=38) or not at all (4.8%; n=9) (Figure 11).
There was no difference in serving per day of fruits and vegetables by gender (X2=11.008; p
=.088).
Figure 11. Percent of Participants by Gender in Response to the Question, “On a typical day,
I usually eat or drink ___ servings of fruits and vegetables.” (N=232)
2.3 2.3
40.9
27.3
18.2
2.3
6.8
2.14.8
20.2
29.8
23.4
12.8
6.9
0
5
10
15
20
25
30
35
40
45
Not marked None One Two Three Four Five +
Perc
ent
Males
Females
75
Servings of Dairy
In response to the question, “On a typical day, I eat or drink dairy products ___ times per
day, the largest percentage (37.9%; n=88) of participants reported consuming dairy products
once per day (Figure 12). The mean number of dairy food consumed per day was 1.41 ± 1.01.
Only 14.7% (n=34) consumed the recommended three servings of dairy foods per day (Table
11).
By gender, the mean intake of dairy foods among males was 1.39 ± 1.02 servings per
day. The largest percentage of males (38.6%; n=17) consumed one serving of dairy products per
day; 31.8% (n=14) reported consuming two servings per day, and 11.4% (n=5) reported having
no servings of dairy per day. Only 13.6% (n=6) of the respondents indicated they consumed the
recommended three servings of dairy products per day.
Females, on average, reported consuming 1.41 ± 1.01 servings of dairy foods per day.
There was no difference in dairy consumption by gender (t=0.169; p =0.866). Ssimilar to men,
the largest percentage of women (37.8%; n=71) only consumed one serving of dairy products per
day, followed by 31.4% (n=59) having two servings per day, and 12.2% (n=23) having no
servings of dairy per day. Only 14.9% (n=28) of the women reported consuming the
recommended three servings of dairy products per day. There was no difference by gender in the
self-reported number of servings of dairy foods consumed daily (X2=0.132; p =.998).
76
Figure 12. Percent of Participants by Gender in Response to the Question, “On a typical day,
I usually eat or drink dairy products (e.g. milk, cheese, and yogurt) ___ times per day.” (N=232)
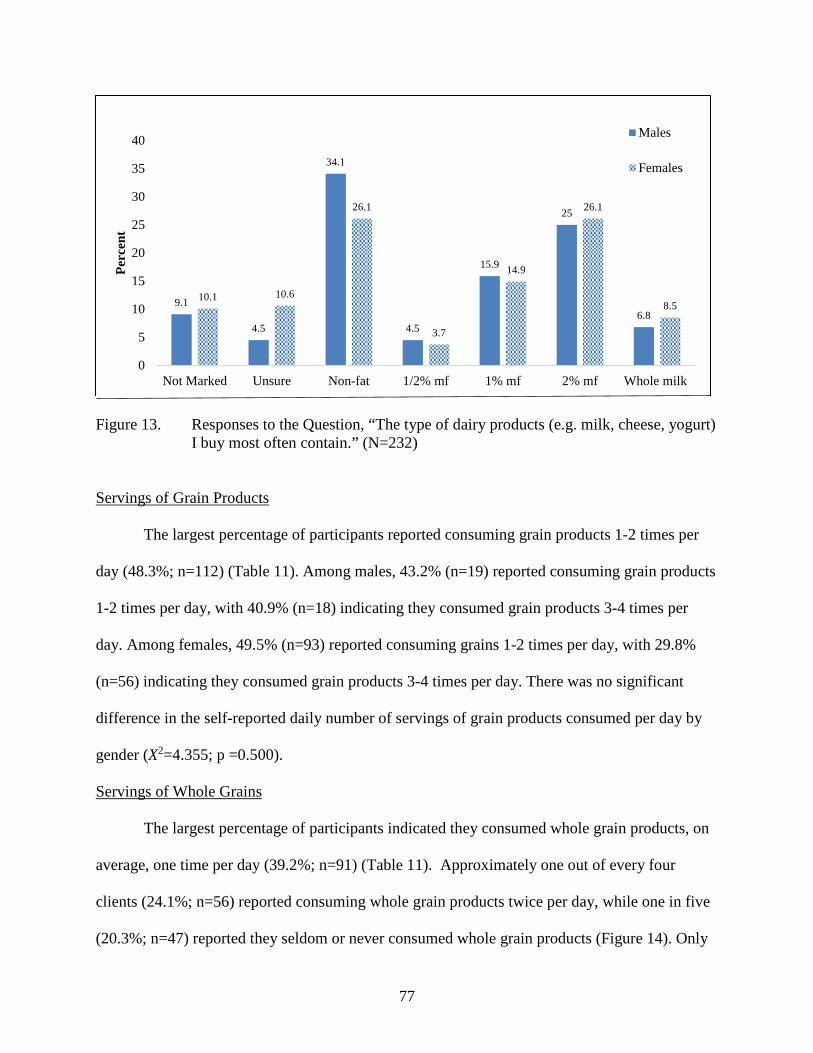
Type of Dairy Products Purchased (Percent Fat)
Overall, the largest percentage of participants (27.6%; n=64) reported buying nonfat
dairy products most often (Figure 13), followed closely by 2% milk fat (25.9%; n=60). One out
of every 10 clients did not know what percent milkfat products they purchase (9.5%; n=22).
Among males, non-fat dairy products were the most common type of dairy products
purchased (34.1%; n=15) followed by 2% milkfat products (25%; n=11). Among females, the
type of dairy fat products purchased was equally distributed between non-fat (26.1%; n=49) and
2% dairy fat (26.1%; n=49). There was no difference in the type of dairy products purchased by
gender (X2=2.493; p =.869).
77
Figure 13. Responses to the Question, “The type of dairy products (e.g. milk, cheese, yogurt)
I buy most often contain.” (N=232) Servings of Grain Products
The largest percentage of participants reported consuming grain products 1-2 times per
day (48.3%; n=112) (Table 11). Among males, 43.2% (n=19) reported consuming grain products
1-2 times per day, with 40.9% (n=18) indicating they consumed grain products 3-4 times per
day. Among females, 49.5% (n=93) reported consuming grains 1-2 times per day, with 29.8%
(n=56) indicating they consumed grain products 3-4 times per day. There was no significant
difference in the self-reported daily number of servings of grain products consumed per day by
gender (X2=4.355; p =0.500).
Servings of Whole Grains
The largest percentage of participants indicated they consumed whole grain products, on
average, one time per day (39.2%; n=91) (Table 11). Approximately one out of every four
clients (24.1%; n=56) reported consuming whole grain products twice per day, while one in five
(20.3%; n=47) reported they seldom or never consumed whole grain products (Figure 14). Only
9.9% (n=23) of the clients reported meeting the recommendation by consuming three or more
servings of whole grain products per day.
By gender, over half (52.3%; n=23) of the males reported consuming whole grains only
one time per day, with an additional 22.7% (n=10) indicating they consumed whole grains two
times per day. Only 6.8% (n=3) of the males consumed the recommended three servings of
whole grains per day.
Slightly more than one out of every three female clients (36.2%; n=68) reported
consuming whole grain products only one time per day, with an additional 24.5% (n=46)
consuming whole grain products two times per day. Only 10.6% (n=20) of the females consumed
the recommended three servings of whole grains per day. There was no significant difference in
the number of servings of whole grain products consumed per day by gender (X2=7.013; p
=.320).
Figure 14. Responses to the Question, “I usually eat whole grain products ___ time per day (Ex. Brown rice, whole wheat bread, oatmeal, all bran cereal).” (N=232)
6.8
11.4
52.3
22.7
6.8
0
4.3
22.3
36.2
24.5
8.5
2.1
0
10
20
30
40
50
60
Not marked Seldom/ None One Two Three Four +
Perc
ent
Males
Females
79
Attempt to Limit Fat in the Diet
The vast majority (85.3%; n=198) of participants indicated they try to limit the amount of
fat in their diet, with more than half (55.2%; n=128) indicating they “sometimes,” try to limit
their fat and an additional 30.2% (n=70) indicating they try to limit the amount of fat in their diet
“all the time” (Table 11).
By gender, over half (52.3%; n=23) of the male respondents indicated they “sometimes”
or “always” (34.1%; n=15) try to limit the fat in their diet. Approximately 9.1% (n=4) indicated
they did not try to limit the fat in their diet. Among the females, over half (55.9%; n=105)
indicated they “sometimes” or “always” (29.3%; n=55) try to limit the fat in their diets.
Approximately 12.2% (n=23) indicated they did not try to limit the fat in their diet. There was no
difference in the intention of the participants to limit the fat in their diet by gender (X2=1.082; p
=0.781).
Use of Food Labels
When asked if they use food labels choose foods, overall, almost half of the participants
(43.5%; n=101) indicated “sometimes,” with slightly more than one-third (38.8%; n=90) of the
participants (n=232) indicated they use food labels “all the time.” Only 15.1% (n=35) of the
participants indicated “no, not really” when asked if they use food labels to help choose foods
(Table 11).
By gender, an equal proportion of males (36.4%; n=16) indicated they use food labels
“all the time” and “sometimes” to choose foods. Almost one-quarter of males (22.7%; n=10)
indicated they really do not use food labels. Among females, almost half of the respondents
(45.2%; n=85) indicated they “sometimes” use food labels to choose foods. Slightly fewer
(39.4%; n=74) indicated they use food label “all the time” to choose foods. Only 13.3% (n=25)
80
of the females indicated they really do not use food labels. There was no difference in the use of
food labels to choose foods by gender (X2=3.631; p =.304).
Nutrient Supplements
Less than half (41.4%) of the participants (n=232) reported taking nutrient supplements
daily, with 27.6% (n=64) responding “sometimes,” and an equal proportion (27.6%; n=64)
indicating “no, not really” (Table 11).
By gender, 40.9% (n=18) of males indicated they take nutrient supplements “all the
time,” with 31.8% (n=14) indicating they “sometimes” take nutrient supplements. Slightly more
than one of every five (22.7%; n=44) males indicated they did not take nutrient supplements.
Among females, 41.5% (n=78) responded they take nutrient supplements “all the time” with an
additional 26.6% (n=50) indicating they take nutrient supplements “sometimes.” Slightly more
than one of every four females indicated they did not take nutrient supplements. There was no
difference in the use of nutrient supplements by gender (X2=1.010; p =0.799).
RQ#5 Stages in Prochaska's Stages of Change Theory for Various Health Habits
The NAL-Q included questions that addressed the participants’ current Stage of Change
regarding seven nutrition and health-related habits. The six responses to the questions were as
follows: “I don’t do it and I don’t think about it,” “I think about it but do not do it,” “I feel ready
to start,” “I do this sometimes,” “I usually do this,” and “I do this all the time.” These responses
correspond to the Stages of Change stages of pre-contemplation, contemplation, preparation,
early-action, action, and maintenance.
81
Able to improve the types of healthy food eaten
In response to the statement, “I am able to improve the types of healthy foods I eat,” the
largest percentage of participants (30.6%; n=71) reported, “I do this sometimes,” indicating they
were in the early-action stage. Slightly fewer (28.9%; n=67) reported, “I usually do this” (late-
action stage). More than one out of every five participants (22.8%; n=53) reported they “feel
ready to start,” indicating they were in the preparation stage (Table 12). Only 9.5% (n=21) of
participants were in the pre-contemplation (2.2%; n=5) of contemplation stage (6.9%; n=16).
82
Table 12. Responses to “Statement of Readiness” Questions on the NAL-Q Where the Shaded Area Indicates the Most Prevalent Response
The Dietary Guidelines Advisory Committee (DGAC) scientific report also recommends
replacing solid animal fats with non-tropical vegetable oils and nuts (Millen et al., 2015). The
DGAC report states that “dietary advice should put the emphasis on optimizing types of dietary
fat and not reducing total fat” (Millen et al., 2015).
In the present study, 30.2% of participants indicated limiting fat in their diet all the time
and 55.2% sometimes limit fat. This is higher than results from the 2014 Gallup Consumption
Habits survey which found that 56% of Americans are trying to avoid fat in their diet, while 22%
include fat, and 21% don’t think about it (Dugan, 2014).
Using Food Labels
In the present study, 81.9% of participants responded using the food labels either all the
time or sometimes when choosing food items and there was no difference by gender. Todd
(2014) found that among working adults, 42% reported using the Nutrition Facts Panel some or
all of the time when shopping for food. From a systematic review by Campos, Doxey, and
Hammond (2011), 75% of the general population in the U.S. use nutrition labels in some
capacity and women reported using labels more frequently than men did. There are associations
between individuals who report greater use of nutrition labels and those who have healthier
eating habits, are more concerned with dietary guidelines, have more nutrition knowledge, are
controlling weight, and have a diagnosis of a disease (Campos et al., 2011). Observational
115
studies have found as association between use of nutrition labels and healthier diets; lower fat,
sodium, and cholesterol consumption; and increased fiber, iron, and vitamin C (Campos et al.,
2011).
Nutrient Supplements
In the present study, 41.4% of participants reported taking nutrient supplements daily.
This is similar to Bailey, Gahche, Miller, Thomas, and Dwyer (2013) who found that nearly half
(49%) of adults reported using a dietary supplement product within the past 30 days. Bailey et al.
(2013) found that nearly half of adults reported using a dietary supplement within the past 30
days, of which multivitamins were the most common. In the present study, there was no
difference by gender (men=40.9%; women=41.4%) who reported taking nutrient supplements.
This is inconsistent with Bailey et al. (2013) who found more women (54.4%) than men (43.1%)
took dietary supplements.
Bailey et al. (2013) found that the most common reasons that adults reported using
dietary supplements were to “improve overall health” (45%) and to “maintain health” (33%).
Data from 2007-10 NHANES found that the most common type of dietary supplement was
multivitamins, which individuals took to “maintain health” or to “supplement the diet” Bailey et
al. (2013). Among U.S. adults, the second most common supplement was calcium (11.6%)
followed by omega-3’s/fish oil (9.8%). Bailey et al. (2013) found that of the supplements taken,
less than one-quarter (23%) were based on the advice of a health care professional.
Summary
The majority of NAL participants are not meeting current recommendations for dietary
intake for fruits and vegetables, dairy, and whole grains. More than nine of ten NAL participants
are not meeting recommendations for fruit and vegetables, as evidenced by reporting consuming
116
less than five servings of fruit and vegetables per day. Only 14.7% consumed three servings of
dairy products per day, which is the recommendation from the Dietary Guidelines. Less than
10% are consuming the recommended intake of whole grains, three or more servings per day.
Nearly one-third of participants always try to limit fat in their diet, nearly 82% use food labels,
and nearly 42% take nutrient supplements daily. Due to the association between poor dietary
habits and incidence of chronic diseases, the NAL should continue efforts aimed at enhancing
nutrition knowledge and behavior change in employees.
RQ#5. Stages of Change
Stages of Change
The NAL-Q addressed participants’ Stage of Change for seven nutrition and health
behaviors. The six statements of readiness on the NAL-Q correspond with the Stages of Change
model, including pre-contemplation, contemplation, preparation, early-action, late-action, and
maintenance.
Glanz et al. (1998) found that individuals who are in the later stages of change for dietary
behaviors show a trend toward greater participation in nutrition interventions. Similarly, Spencer,
Wharton, Moyle, and Adams (2007) discusses how there is a relationship between later stages in
the model, such as preparation, action, and maintenance, and a greater focus on health and
health-related behaviors. Individuals in the pre-contemplation stage (“I don’t do and I don’t think
about it”) are unaware of the need for change are typically uninterested in change (Glanz et al.,
1998). In a review of 21 population studies, the Stages of Change construct was effective in
describing measured dietary intake or food-related habits.
117
The first statement, “I don’t do and I don’t think about it” correlates with the first stage,
pre-contemplation, in which “an individual may or may not be aware that a behavior change is
needed and has no intention of changing in the next six months” (Spencer et al., 2007). For six of
the seven health and nutrition behaviors, the percentage of participants in the pre-contemplation
stage was less than 8%. For the nutrition behavior that addressed the intake of non-fat dairy
products, 15.5% were in pre-contemplation. This may be because individuals who are not
consuming non-fat dairy may be avoiding them due to a dislike or lactose-intolerance.
Individuals in the pre-contemplation stage are not ready for behavior change, however an
appropriate intervention may simply focus on increasing the awareness of the need to change
(Molaison, 2002).
The percentage of individuals in the contemplation stage for the seven nutrition and
health habits ranges from 6.0 to 13.4%. Individuals in the contemplation stage are also not ready
for behavior change, and therefore the concentration should be on addressing possible barriers
(Molaison, 2002). The low percentages of participants in the pre-contemplation and
contemplation stage in the present study supports the theory that individuals in these stages are
not aware or interested in seeking guidance for change, and thus not seeking out the services of
the NAL.
The largest percentage of participants were in the preparation stage (34.9%) for weight
loss. This was the only behavior in which the largest percentage of participants were in the
preparation stage. This indicates that those who are ready to focus on weight loss are seeking the
services of the NAL, whereas those who are not interested in weight loss or who have already
been successful are not. In the preparation stage, the intervention should encourage a switch from
thinking about change to actually changing the behavior (Molaison, 2002). In addition, the health
118
educator or clinician working with the client should discuss reasonable lifestyle changes. Only
1.7% of participants are in the maintenance stage for weight loss, indicating that those who have
already made and maintained change are not seeking services with the NAL.
For three of the seven health behaviors (improving types of healthy food, servings of
vegetables, and whole grains) the majority of the participants were in the early-action stage. For
two of the health behaviors (servings of fruit and physical activity) the majority of participants
were in the late-action stage. In regards to nonfat dairy products, there was an equal percentage
of participants in the early-action and late-action stage.
Among NAL participants, 38.8% indicated consuming 2-3 servings of fruit per day as
“usually” or “all the time” do this. Nearly half of participants (47.9%) are in the preparation or
early-action stage for consuming 2-3 servings of fruit per day. This is the segment of the
population where intervention efforts should be focused. Spencer et al. (2007) indicates that
studies show a consistent pattern of increases in fruit and vegetable intake across the stages of
change. Evidence is present that dietary behavior interventions based on participants’ stage of
change can be an effective model (Spencer et al., 2007).
Overall, this indicates that participants are coming to the Nutrition Assessment Lab ready
to make changes. The results of the NAL participants’ Stage of Change confirm the theory that
individuals who are in the pre-action or action stage will seek information and engage in
behavior change activities. The NAL can focus on addressing individuals in the action stage
while also provide continued support for individuals in the maintenance stage. The NAL needs to
have a stronger focus on moving participants from their current stage of change, for the
identified issue, to the next stage. Further follow-up data collected from participants returning to
119
the NAL should be gathered in order to evaluate their progress and the effectiveness of the NAL
services.
Summary
The data collected in the NAL-Q can be utilized by program planners to identify areas of
concern within the population at this university. It can also be used to evaluate current programs
and potentially develop new programs. For example, data from this population would suggest
that efforts should be focused on weight management (67.5% overweight based on BMI) rather
than tobacco use (1.3% current tobacco use) or alcohol intake (1.3% consume alcohol daily).
Summary
In summary, the results of this study indicated the health and nutrition characteristics of
NAL participants are suboptimal. The biochemical and clinical lab resulst are similar to those
seen in nationwide studies. The behaviors, including both nutrition and physical activity, of
participants need improvement. The stages of change of NAL participants is consistent with
previous data indicating they seeking information and ready to make behavior chagne.
120
CHAPTER 6
CONCLUSIONS, LIMITATIONS, AND FUTURE RESEARCH
The purpose of this study is to identify the nutrition and health-related
characteristics of faculty and staff at a mid-major university who received services in the
Nutrition Assessment Lab, a component of the Working Well worksite wellness program,
between fall semester 2010 and summer semester 2016. This chapter summarizes the results,
identifies the study’s limitations, and presents ideas for future research.
Conclusions
The health characteristics of U.S. adults have been well document and it clearly indicates
that the status is poor. This research sought to identify the nutrition and health-related
characteristics of employees at a particular mid-major university in the Midwest who participated
in the Nutrition Assessment Lab between the academic years 2007-08 to 2015-16. This research
also identified the demographic characteristics of participants and the factors associated with
their participation. Furthermore, this research also evaluated employees’ stage of change toward
certain nutrition and health habits while gathering an understanding of what services employees
were interested in utilizing.
This research aimed to identify the demographics, health conditions, and nutrition status
of employees who participated in the Nutrition Assessment Lab. Based on the Nutrition
121
Assessment Lab Questionnaire (NAL-Q), the majority of participants were white females and
over half were either professionals or professors. According to the recorded anthropometric
measures, over half of participants were overweight or obese. Of the biochemical measures, the
mean LDL cholesterol and mean total cholesterol/HDL ratio were above recommended levels.
Nearly 70% of participants had LDL cholesterol above the optimal range and nearly 30% had
triglycerides above optimal. Nearly 20% had elevated blood glucose. For clinical measures, over
half of participants had elevated systolic blood pressure and over one-quarter had elevated
diastolic blood pressure. Significant differences between males and females were noted for LDL-
cholesterol, HDL-cholesterol, and systolic blood. These results indicate that, based on these
select criteria, the participants did not have optimal health.
The percentage of NAL participants who had high total cholesterol, LDL cholesterol,
triglycerides, and low HDL cholesterol was higher than comparable results of all U.S. adults; in
contrast, the prevalence of impaired fasting glucose and diabetes among NAL participants was
lower than the national average.
When asked why participants came to the NAL, the majority of respondents indicated,
“to lose weight” and “improve overall diet.” This is not surprising when considering the current
rate of overweight and obesity among NAL participants. Over half of the participants were
interested in receiving menu-planning advice and nearly half were interested in learning more
about healthy eating.
When evaluating the health habits and conditions of NAL participants, two-thirds of
participants take part in physical activity at least three days per week. Regarding alcohol intake,
the majority of participants consumed alcohol “rarely” or “never.” Only slightly more than 1%
122
currently uses tobacco. The most prevalent self-reported health conditions on the NAL-Q were
high cholesterol and high blood pressure.
When evaluating the nutrition habits of NAL participants, a large majority are not
consuming the recommended intake of fruits and vegetables, dairy, or whole grains. A large
percentage is consuming fruits and vegetables less than five times per day. Nearly two-thirds of
participants are consuming whole grain products only once or twice a day. This indicates a need
for nutrition education and behavioral change strategies in this population.
Many of the participants who came to the NAL were in the action stage and were
thinking about or were already practicing some positive lifestyle actions related to selected
nutrition and health habits. Of note, about one-third of participants “feel ready to start” losing
weight.
Limitations of the Study:
As the researcher examines the results of the study, several limitations must be
considered:
• The study was conducted at one Midwestern university and may not adequately portray
the characteristics, interests, and nutrition habits and conditions of all university
employees.
• The nutrition and health habits results are self-reported.
• Although the completion of the NAL-Q is a part of the standard protocol in the NAL, not
all participants completed the survey.
• The services of the NAL-Q are voluntary and not all participants had all of the
measurements (body composition, blood pressure, bone density, etc.) taken.
123
• A CardioChek was previously used to measure lipid panel and then replaced with a
Cholestech around January 2011.
• In some instances, not all of the lab values, such as HDL and LDL, were recorded due to
the limitations of the Cholestech equipment (i.e., if the value was out of range, the
instrument did not provide the value)..
• Missing values for the biometric screening results were left missing (i.e., were not
imputed), resulting in unequal responses for most categories.
• In a few case, the technical assumption requiring a minimum of five subjects per cell for
Chi Square analyses was violated is due to the low number of male participants.
Recommendations for Further Research
Based on the results of the present study, additional research on the characteristics of
NAL participants is warranted. The following suggestions are made both for future research and
to improve the services provided by thte Nutrition Assessment Laboratory:
• The survey should be given to all participants who engage with the NAL.
• The NAL-Q should be given to participants each new academic year and/or after
they have participated in NAL programs for six months as a means to collect
follow-up data.
• The Stages of Change questions should be included on all follow-up surveys.
• The NAL-Q anthropometric measurements should include waist circumference,
as it is a criteria for metabolic syndrome criteria.
• Lower participation by service and shift workers may related to having a less
flexible schedule. Worksite wellness programs, including the one in the present
124
study, should evaluate effective strategies to engage with service employees and
night shift workers. This may include making the programs more accessible by
offering them different locations and times. Furthermore, programs should
evaluate the wellness needs and goals of employees in these positions, as they
may be different from other positions.
• A question should be added to the NAL-Q that asks participants to identify their
personal goal(s). This information will help the graduate assistant in the NAL to
address the clients’ goals. In addition, it can guide the NAL in offering relevant
services and programs that align with the goals of the clientele.
• Regular follow-up with clients will be important for the longevity of the NAL and
the personal success of the clients. A protocol for follow-up, including when and
how, should be established for the Graduate Assistants managing the NAL.
Summary
In summary, although all faculty and staff are encouraged to use the services of the
Nutrition Assessment Laboratory, the nutrition and health characteristics of participants who
sought services at the Nutrition Assessment Lab were suboptimal, with many having health risks
and suboptimal dietary habits. The most prevalent conditions of NAL participants were high
cholesterol and high blood pressure. Overall, participants were most interested in improving
cholesterol, losing weight, and menu planning. Those who engaged in the NAL were most often
in the preparation or action stage of change for various health habits. The results indicate that the
NAL participants at this Midwest University were seeking information and were ready for
behavior change. Continued services through the NAL will be beneficial to their personal health
125
and wellness. It is important for wellness programs to understand the characteristics and interests
of participants as it may enhance the effectiveness and evaluation of current services. Further
research is needed to evaluate if the results and findings in this study are consistent with other
university wellness programs and if the current nutrition services are effective interventions for
behavior change and improved health outcomes.
126
REFERENCES
Abargouei, A. S., Janghorbani, M., Salehi-Marzijarani, M., & Esmaillzadeh, A. (2012). Effect of dairy consumption on weight and body composition in adults: A systematic review and meta-analysis of randomized controlled clinical trials. Int J Obes, 36(12), 1485-1493. doi:10.1038/ijo.2011.269
Adams, P., Kirzinger, W., & Martinez, M. (2013). Summary health statistics for the U.S. population: National Health Interview Survey, 2012. Retrieved from http://www.cdc.gov/nchs/data/series/sr_10/sr10_259.pdf
Aguilar, M., Bhuket, T., Torres, S., Liu, B., & Wong, R. J. (2015). Prevalence of the metabolic syndrome in the United States, 2003-2012. JAMA, 313(19), 1973-1974. doi:10.1001/jama.2015.4260
Alberti, K. G. M. M., Zimmet, P., & Shaw, J. (2006). Metabolic syndrome—a new world-wide definition. A consensus statement from the International Diabetes Federation. Diabetic Medicine, 23(5), 469-480. doi:10.1111/j.1464-5491.2006.01858.x
Albertson, A. M., Reicks, M., Joshi, N., & Gugger, C. K. (2016). Whole grain consumption trends and associations with body weight measures in the United States: Results from the cross sectional National Health and Nutrition Examination Survey 2001–2012. Nutrition Journal, 15(8). doi:10.1186/s12937-016-0126-4
Aldana, S. G., Merrill, R. M., Price, K., Hardy, A., & Hager, R. (2005). Financial impact of a comprehensive multisite workplace health promotion program. Preventive Medicine, 40(2), 131-137. Retrieved from http://dx.doi.org/10.1016/j.ypmed.2004.05.008
Alere. (n.d.). Alere Cholestech LDX System. Retrieved from http://www.alere.com/en/home/product-details/cholestech-ldx-system.html?c=US
American Diabetes Association. (2009). Diagnosis and classification of diabetes mellitus. Diabetes Care, 33(Supplement 1), S62-S69. Retrieved from http://care.diabetesjournals.org/content/33/Supplement_1/S62.abstract
American Heart Association. (2008). Policy position statement on effective worksite wellness programs. Retrieved from https://www.heart.org/idc/groups/heart-public/@wcm/@hcm/documents/downloadable/ucm_308067.pdf
Anderko, L., Roffenbender, J., Goetzel, R., Millard, F., Wildenhaus, K., DeSantis, C., & Novelli, W. (2012). Promoting prevention through the Affordable Care Act: Workplace wellness. Preventing Chronic Disease, 9. doi:http://dx.doi.org/10.5888/pcd9.120092
Anderson, L. M., Quinn, T. A., Glanz, K., Ramirez, G., Kahwati, L. C., Johnson, D. B., . . . Katz, D. L. (2009). The effectiveness of worksite nutrition and physical activity interventions for controlling employee overweight and obesity: A systematic review. Am J Prev Med, 37(4), 340-357. doi:10.1016/j.amepre.2009.07.003
Anthem., & Stevens, K. (2016). BSU Chronic Employees [Data set]. Retrieved from: email communication January 2017
Assistant Secretary for Public Affairs. (2015). Key Features of the Affordable Care Act Retrieved from http://www.hhs.gov/healthcare/facts-and-features/key-features-of-aca-by-year/index.html
Ausburn, T. F., LaCoursiere, S., Crouter, S. E., & McKay, T. (2014). Review of worksite weight management programs. Workplace Health & Safety, 62(3), 122-126. doi:http://dx.doi.org/10.3928/21650799-20140219-06
Baicker, K., Cutler, D., & Song, Z. (2010). Workplace wellness programs can generate savings. Health Affairs, 29(2), 304-311. doi:10.1377/hlthaff.2009.0626
Bailey, R. L., Gahche, J. J., Miller, P. E., Thomas, P. R., & Dwyer, J. T. (2013). Why U.S. adults use dietary supplements. JAMA Internal Medicine, 173(5), 355-361. doi:10.1001/jamainternmed.2013.2299
Benjamin, E. J., Blaha, M. J., Chiuve, S. E., Cushman, M., Das, S. R., Deo, R., . . . Muntner, P. (2017). Heart disease and stroke statistics—2017 update: A report from the American Heart Association. Circulation, 135(6), e1-e458. Retrieved from http://circ.ahajournals.org/content/early/2017/01/25/CIR.0000000000000485.abstract
Bish, C. L., Blanck, H. M., Serdula, M. K., Marcus, M., Kohl, H. W., & Khan, L. K. (2005). Diet and physical activity behaviors among Americans trying to lose weight: 2000 Behavioral Risk Factor Surveillance System. Obesity Research, 13(3), 596-607. doi:10.1038/oby.2005.64
Blumenthal, D., Abrams, M., & Nuzum, R. (2015). The Affordable Care Act at 5 years. New England Journal of Medicine, 372(25), 2451-2458. doi:10.1056/NEJMhpr1503614
Bodenheimer, T., Chen, E., & Bennett, H. D. (2009). Confronting the growing burden of chronic disease: Can the U.S. health care workforce do the job? Health Affairs, 28(1), 64-74. doi:10.1377/hlthaff.28.1.64
Borah, B. J., Egginton, J. S., Shah, N. D., Wagie, A. E., Olsen, K. D., Yao, X., & Lopez-Jimenez, F. (2015). Association of worksite wellness center attendance with weight loss and health care cost savings: Mayo Clinic's experience. Journal of Occupational and Environmental Medicine, 57(3), 229-234. doi:10.1097/JOM.0000000000000392
Bowman, S., Clemens, J., Friday, J., Thoerig, R., & Moshfegh, A. (2014). Food patterns equivalents intakes from food: Mean amounts consumed per individual, What We Eat in America, NHANES 2011-2012; Tables 1-4. Worldwide Web Site: Food Surveys Research Group. Retrieved from www.ars.usda.gov/Services/docs.htm?docid=23871
Bruening, M., Udarbe, A. Z., Yakes Jimenez, E., Stell Crowley, P., Fredericks, D. C., & Edwards Hall, L. A. (2015). Academy of Nutrition and Dietetics: Standards of practice and standards of professional performance for Registered Dietitian Nutritionists (competent, proficient, and expert) in public health and community nutrition. Journal of the Academy of Nutrition and Dietetics, 115(10), 1699-1709.e1639. doi:10.1016/j.jand.2015.06.374
Bullard, K. M., Saydah, S. H., Imperatore, G., Cowie, C. C., Gregg, E. W., Geiss, L. S., . . . Caspersen, C. J. (2013). Secular changes in U.S. prediabetes prevalence defined by hemoglobin A1c and fasting plasma glucose. Diabetes Care, 36(8), 2286-2293. doi:10.2337/dc12-2563
Burton, W. N., Chen, C.-Y., Conti, D. J., Schultz, A. B., Pransky, G., & Edington, D. W. (2005). The association of health risks with on-the-job productivity Journal of Occupational and Environmental Medicine, 47(8), 769-777. doi:10.1097/0l.jom.0000169088.03301.e4
Burwell, S. M., Frieden, T. R., & Rothwell, C. J. (2016). Health, United States, 2015: With special features on racial and ethnic disparities. Retrieved from https://www.cdc.gov/nchs/data/hus/hus15.pdf
Butler, C. E., Clark, B. R., Burlis, T. L., Castillo, J. C., & Racette, S. B. (2015). Physical activity for campus employees: A university worksite wellness program. Journal of physical activity & health, 12(4), 470-476. doi:10.1123/jpah.2013-0185
Byers, T., Mullis, R., Anderson, J., Dusenbury, L., Gorsky, R., Kimber, C., . . . Perry, G. (1995). The costs and effects of a nutritional education program following work-site cholesterol screening. American Journal of Public Health, 85(5), 650-655. Retrieved from http://www.ncbi.nlm.nih.gov/pmc/articles/PMC1615435/
Campos, S., Doxey, J., & Hammond, D. (2011). Nutrition labels on pre-packaged foods: A systematic review. Public Health Nutrition, 14(8), 1496-1506. doi:http://dx.doi.org/10.1017/S1368980010003290
Cancelliere, C., Cassidy, J., Ammendolia, C., & Côté, P. (2011). Are workplace health promotion programs effective at improving presenteeism in workers? A systematic review and best evidence synthesis of the literature. BMC Public Health, 11(1), 1-11. doi:10.1186/1471-2458-11-395
Carey, M., Markham, C., Gaffney, P., Boran, C., & Maher, V. (2006). Validation of a point of care lipid analyser using a hospital based reference laboratory. Ir J Med Sci, 175(4), 30-35.
Carroll, M. D., Frayar, C. D., & Kit, B. K. (2015). Total and high-denstiy lipoprotein cholesterol in adults: United States, 2011-2014 NCHS Data Brief, no 226. Hyattsville, MD.
Carroll, M. D., Kit, B. K., & Lacher, D. A. (2015). Trends in elevated triglyceride in adults: United States, 2001-2012. Retrieved from Hyattsville, MD: https://www.cdc.gov/nchs/products/databriefs/db198.htm
CDC. (2011). Vital signs: Prevalence, treatment, and control of high levels of low-density lipoprotein cholesterol - United States, 1999--2002 and 2005--2008. Retrieved from http://www.cdc.gov/mmwr/preview/mmwrhtml/mm6004a5.htm?s_cid=mm6004a5_w
CDC. (2014a). Potentially preventable deaths from the five leading causes of death - United States, 2008-2010. Morbidity and Mortality Weekly Report, 63(17), 369-374. Retrieved from http://www.cdc.gov/mmWR/preview/mmwrhtml/mm6317a1.htm
CDC. (2014b). Summary Health Statisitics: National Health Interview Survey, 2014. Retrieved from https://ftp.cdc.gov/pub/Health_Statistics/NCHS/NHIS/SHS/2014_SHS_Table_A-18.pdf
CDC. (2015). BRFSS Prevalence & Trends Data (online) Retrieved from https://www.cdc.gov/brfss/brfssprevalence/. https://www.cdc.gov/brfss/brfssprevalence/.
CDC. (2016). Healthy People 2020 Objectives for the Nation. Retrieved from https://www.healthypeople.gov/2020/About-Healthy-People
CDC/NCHS. (2015). National Health Interview Survey, 2014. Retrieved from http://www.cdc.gov/nchs/data/nhis/earlyrelease/earlyrelease201506_07.pdf
Centers for Disease Contorl and Prevention. (2012). Defining Adult Overweight and Obesity. Retrieved from http://www.cdc.gov/obesity/adult/defining.html
Centers for Disease Control and Prevention, National Center for Chronic Disease Prevention, & Health Promotion Division of Population Health. (2015). BRFSS Prevalence & Trends Data Retrieved from https://www.cdc.gov/brfss/brfssprevalence/.
Centers for Medicaid & Medicare Services. National health expenditures projections 2012-2022. Retrieved from https://www.cms.gov/research-statistics-data-and-systems/statistics-trends-and-reports/nationalhealthexpenddata/downloads/proj2012.pdf
Cholestech Coporation. Cholestech LDX System User Manual. Hayward, CA.
Commission on Dietetic Registration. (2016). Registration eligibility general information. Retrieved from https://www.cdrnet.org/certifications/registration-eligibility-general-information-rde
Cowdery, J. E., Suggs, L. S., & Parker, S. (2007). Application of a Web-based tailored health risk assessment in a work-site population. Health Promot Pract, 8(1), 88-95. doi:10.1177/1524839905278892
Dale, R. A., Jensen, L. H., & Krantz, M. J. (2008). Comparison of two point-of-care lipid analyzers for use in global cardiovascular risk assessments. Ann Pharmacother, 42(5), 633-639. doi:10.1345/aph.1K688
Davis, C. E., Williams, D. H., Oganov, R. G., Tao, S. C., Rywik, S. L., Stein, Y., & Little, J. A. (1996). Sex differences in high density lipoprotein cholesterol in six countries. American Journal of Epidemiology, 143(11), 1100-1106.
Dugan, A. (2014). Americans still avoid fat more than carbs. Well-being. Retrieved from gallup.com website: http://www.gallup.com/poll/174176/americans-avoid-fat-carbs.aspx
Evan, S., & Eibner, C. (September 2016). Donal Trump's health care reform proposals: Anticipated effects on insurance coverage, out-of-pocket costs, and the federal deficit. The Commonwealth Fund. Retrieved from
Fox, J. B., & Shaw, F. E. (2015). Clinical preventive services coverage and the Affordable Care Act. American Journal of Public Health, 105(1), E7-E10. Retrieved from https://search.proquest.com/docview/1644457276?accountid=8483
Frayar, C. D., Carroll, M. D., & Ogden, C. L. (2016). Prevalance of overweight, obesity, and extreme obesity among adults aged 20 and over: United States, 1960-1962 through 2013-2014. Retrieved from http://www.cdc.gov/nchs/data/hestat/obesity_adult_13_14/obesity_adult_13_14.pdf
Freid, V., Bernstein, A., & Bush, M. (2012). Multiple chronic conditions among adults aged 45 and over: Trends over the past 10 years. NCHS data brief, no. 100 (Vol. 100). Hyattsville, MD: National Center for Health Statistics.
Fronstin, P., Employee Benefit Research Institute, & Roebuck, M. C. (2015). Financial incentives, workplace wellness program participation, and utilization of health care services and spending. EBRI Issue Brief(No. 417), 4-20. Retrieved from https://www.ebri.org/pdf/briefspdf/EBRI_IB_417.Aug15.Wellness.pdf
Fryar, C., Gu, Q., Ogden, C., & Flegal, K. (2016). Anthropometric reference data for children and adults: United States. National Center for Health Statistics. Vital health statistics, 3(39), 8-16. Retrieved from https://stacks.cdc.gov/view/cdc/40572
Geaney, F., Kelly, C., Di Marrazzo, J. S., Harrington, J. M., Fitzgerald, A. P., Greiner, B. A., & Perry, I. J. (2016). The effect of complex workplace dietary interventions on employees' dietary intakes, nutrition knowledge and health status: A cluster controlled trial. Preventive Medicine, 89, 76-83. doi:10.1016/j.ypmed.2016.05.005
Gibbons, R. J., Jones, D. W., Gardner, T. J., Goldstein, L. B., Moller, J. H., & Yancy, C. W. (2008). The American Heart Association's 2008 statement of principles for healthcare reform. Circulation, 118(21), 2209-2218. doi:10.1161/circulationaha.108.191092
Glanz, K., Patterson, R. E., Kristal, A. R., Feng, Z., Linnan, L., Heimendinger, J., & Hebert, J. R. (1998). Impact of work site health promotion on stages of dietary change: The Working Well Trial. Health Education & Behavior, 25(4), 448-463.
Guenther, P. M., Bowman, S. A., & Goldman, J. D. (2010). Alcoholic beverage consumption by adults 21 years and over in the United States: Results from the National Health and
Hedden, S. L., Kennet, J., Lipari, R., Medley, G., & Tice, P. (2015). Behavioral health trends in the United States: Results from the 2014 national survey on drug us and health. Retrieved from https://www.samhsa.gov/data/sites/default/files/NSDUH-FRR1-2014/NSDUH-FRR1-2014.pdf
International Society for Clinical Densitometry. (2015). 2015 ISCD Official Positions - Adult Retrieved from http://www.iscd.org/official-positions/2015-iscd-official-positions-adult/
Jensen, J. D. (2011). Can worksite nutritional interventions improve productivity and firm profitability? A literature review. Perspectives in Public Health, 131(4), 184-192. doi:10.1177/1757913911408263
Jylhä, M. (2009). What is self-rated health and why does it predict mortality? Towards a unified conceptual model. Social Science & Medicine, 69(3), 307-316. doi:http://dx.doi.org/10.1016/j.socscimed.2009.05.013
Kelly, T. L., Wilson, K. E., & Heymsfield, S. B. (2009). Dual Energy X-Ray Absorptiometry body composition reference values from NHANES. PLOS ONE, 4(9), e7038. doi:10.1371/journal.pone.0007038
Li, C., Ford, E. S., Zhao, G., Balluz, L. S., & Giles, W. H. (2009). Estimates of body composition with dual-energy X-ray absorptiometry in adults. Am J Clin Nutr, 90(6), 1457-1465. doi:10.3945/ajcn.2009.28141
Lloyd-Jones, D. M., Hong, Y., Labarthe, D., Mozaffarian, D., Appel, L. J., Van Horn, L., . . . Rosamond, W. D. (2010). Defining and setting national goals for cardiovascular health promotion and disease reduction. Circulation, 121(4), 586-613. doi:http://dx.doi.org/10.1161/CIRCULATIONAHA.109.192703
Looker, A. C., Borrud, L. G., Dawson-Hughes, B., Shepherd, J. A., & Wright, N. C. (2012). Ostoeporosis or low bone mass at the femur neck or lumbar spine in older adulst: United States, 2005-2008. NCHS Data Brief(93).
Lucas, J., & Benson, V. (2015). Tables of summary health statistics for the U.S. population: 2015 National Health Interview Survey. Retrieved from http://www.cdc.gov/nchs/nhis/SHS/tables.htm.
Masters, R. K., Reither, E. N., Powers, D. A., Yang, Y. C., Burger, A., & Link, B. G. (2013). The impact of obesity on US mortality levels: The importance of age and cohort factors in population estimates. American Journal of Public Health, 103(10), 1895-1901. doi:10.2105/AJPH.2013.301379
Mattke, S., Schnyer, C., & Van Busum, K. R. (2012). A review of the U.S. workplace wellness market. Retrieved from http://www.dol.gov/ebsa/pdf/workplacewellnessmarketreview2012.pdf
McCarthy, J. (2015). Fewer Americans say they want to lose weight. November 27, 2015. Retrieved from http://www.gallup.com/poll/186920/fewer-americans-say-lose-weight.aspx
Menke, A., Casagrande, S., Geiss, L., & Cowie, C. C. (2015). Prevalence of and trends in diabetes among adults in the United States, 1988-2012. JAMA, 314(10), 1021-1029. doi:10.1001/jama.2015.10029
Merrill, R. M., & Sloan, A. (2014). Effectiveness of a health promotion program among employees in a western United States school district. Journal of Occupational and Environmental Medicine, 56(6), 639-644. doi:10.1097/JOM.0000000000000153
Michaels, C. N., & Greene, A. M. (2013). Worksite wellness: Increasing adoption of workplace health promotion programs. Health promotion practice, 14(4), 473-479. doi:10.1177/1524839913480800
Milani, R. V., & Lavie, C. J. (2009). Impact of worksite wellness intervention on cardiac risk factors and one-year health care costs. The American Journal of Cardiology, 104, 1389-1392. doi:10.1016/j.amjcard.2009.07.007
Millen, B., Lichtenstein, A., Abrams, S., Adams-Campbell, L., Anderson, C., Brenna, J., . . . Story, M. (2015). Scientific Report of the 2015 Dietary Guidelines Advisory Committee
Retrieved from https://health.gov/dietaryguidelines/2015-scientific-report/06-chapter-1/
Molaison, E. F. (2002). Stages of change in clinical nutrition practice. Nutr Clin Care, 5(5), 251-257.
Moore, L. V., & Thompson, F. E. (2015). Adults meeting fruit and vegetable intake recommendations - United States, 2013. Morbidity and Mortality Weekly Report 2015, 64(26), 709-713. Retrieved from https://www.cdc.gov/Mmwr/pdf/wk/mm6426.pdf
Moriarty, J. P., Branda, M. E., Olsen, K. D., Shah, M. D., Borah, B. J., Wagie, A. E., . . . Naessens, J. M. (2012). The effects of incremental costs of smoking and obesity on health care costs among adults. Journal of Occupational and Environmental Medicine, 54(3), 286-291. doi:10.1097/JOM.Ob01 3e318246fl f4
Mozaffarian, D., Benjamin, E. J., Go, A. S., Arnett, D. K., Blaha, M. J., Cushman, M., . . . Turner, M. B. (2014). Heart disease and stroke statistics—2015 Update. Circulation. doi:
http://dx.doi.org/10.1161/CIR.0000000000000152
Mozaffarian, D., & Ludwig, D. S. (2015). The 2015 US Dietary Guidelines: Lifting the ban on total dietary fat. JAMA, 313(24), 2421-2422. doi:10.1001/jama.2015.5941
National Cancer Institute. (2015). Usual Dietary Intakes: Food Intakes U.S. Population, 2007-10. Retrieved from http://epi.grants.cancer.gov/diet/usualintakes/pop/2007-10/
National Center for Health Statistics. (2015). Summary Health Statistics: National Health Interview Survey, 2015. Retrieved from https://ftp.cdc.gov/pub/Health_Statistics/NCHS/NHIS/SHS/2015_SHS_Table_A-12.pdf
National Center for Health Statistics. (2016). Healthy People 2020 midcourse review Retrieved from Hyattsville, MD:
National Institute of Health. (2001). ATP III At-A-Glance: Quick Desk Reference. Retrieved from http://www.nhlbi.nih.gov/health-pro/guidelines/current/cholesterol-guidelines/quick-desk-reference-html
National Osteoporosis Foundation. (2016). Bone Density Exam/Testing. Retrieved from https://www.nof.org/patients/diagnosis-information/bone-density-examtesting/
NIH Osteoporosis and Related Bone Diseases. (2015). Bone mass measurements: What the numbers mean. Retrieved from http://www.niams.nih.gov/health_info/bone/bone_health/bone_mass_measure.asp
Nwankwo, T., Yoon, S. S., Burt, V., & Gu, Q. (2013). Hypertension among adults in the United States: National Health and Nutrition Examination Survey, 2011-2012. NCHS Data Brief(133), 1-8.
Ogden, C. L., Carroll, M. D., Fryar, C. D., & Flegal, K. M. (2015). Prevalence of obesity among adults and youth: United States, 2011-2014. NCHS Data Brief(219), 1-7. Retrieved from http://www.cdc.gov/nchs/products/databriefs/db219.htm
Omron. (2003). Frequently Asked Questions. Retrieved from http://www.omron-healthcare.com/en/products/bloodpressuremonitoring#
Plüddemann, A., Thompson, M., Price, C. P., Wolstenholme, J., & Heneghan, C. (2012). Point-of-care testing for the analysis of lipid panels: primary care diagnostic technology update. The British Journal of General Practice, 62(596), e224-e226. doi:10.3399/bjgp12X630241
Prochaska, J. O., Butterworth, S., Redding, C. A., Burden, V., Perrin, N., Leo, M., . . . Prochaska, J. M. (2008). Initial efficacy of MI, TTM tailoring and HRI's with multiple behaviors for employee health promotion. Prev Med, 46(3), 226-231. doi:10.1016/j.ypmed.2007.11.007
Prochaska, J. O., DiClemente, C. C., & Norcross, J. C. (1992). In search of how people change. Applications to addictive behaviors. Am Psychol, 47(9), 1102-1114.
Prochaska, J. O., Redding, C. A., & Evers, K. (2002). The Transtheoretical Model and Stages of Change. In K. Glanz, B.K. Rimer & F.M. Lewis (Eds.), Health Behavior and Health Education: Theory, Research, and Practice (3rd ed.). San Francisco, CA: Jossey-Bass, Inc
Prochaska, J. O., & Velicer, W. F. (1997). The transtheoretical model of health behavior change. American Journal of Health Promotion, 12(1), 38-48.
Prospective Studies Collaboration. (2009). Body-mass index and cause-specific mortality in 900 000 adults: Collaborative analyses of 57 prospective studies. The Lancet, 373(9669), 1083-1096. doi:http://dx.doi.org/10.1016/S0140-6736(09)60318-4
Rehm, C. D., Penalvo, J. L., Afshin, A., & Mozaffarian, D. (2016). Dietary intake among US adults, 1999-2012. JAMA, 315(23), 2542-2553. doi:10.1001/jama.2016.7491
Rigsby, A., Gropper, D. M., & Gropper, S. S. (2009). Success of women in a worksite weight loss program: Does being part of a group help? Eating Behaviors, 10(2), 128-130. doi:http://dx.doi.org/10.1016/j.eatbeh.2009.01.002
Robroek, S. J., van Lenthe, F. J., van Empelen, P., & Burdorf, A. (2009). Determinants of participation in worksite health promotion programmes: A systematic review. International Journal of Behavioral Nutrition and Physical Activity, 6(1), 26. doi:10.1186/1479-5868-6-26
Rongen, A., Robroek, S. J. W., Lenthe, F. J. v., & Burdorf, A. (2013). Workplace health promotion a meta-analysis of effectiveness. American Journal of Preventative Medicine, 44(4), 406-415. Retrieved from http://dx.doi.org/10.1016/j.amepre.2012.12.007
Rosamond, W., Flegal, K., Furie, K., Go, A., Greenlund, K., Haase, N., . . . Hong, Y. (2008). Heart Disease and Stroke Statistics—2008 Update: A Report From the American Heart Association Statistics Committee and Stroke Statistics Subcommittee. Circulation, 117(4), e25-e146. doi:10.1161/circulationaha.107.187998
Rosinger, A., Carroll, M. D., Lacher, D., & Ogden, C. L. (2016). Trends in total cholesterol, triglycerides, and low-density lipoprotein in US adults, 1999-2014. JAMA Cardiology, E1. doi:10.1001/jamacardio.2016.4396
Schoeborn, C. A., Adams, P. F., & Peregoy, J. A. (2013). Health behaviors of adults: United States, 2008-2010. Vital and health statistics 10(257). Retrieved from https://www.cdc.gov/nchs/data/series/sr_10/sr10_257.pdf
Seca. (n.d. ). Seca 225. Hamburg, Germany.
Shaw, F., Asomugha, C., Conway, P., & Sein, A. (2014). The Patient Protection and Affordable Care Act: Opportunities for prevention and public health. Lancet, 384, 75-82
Sluijs, I., Forouhi, N. G., Beulens, J. W., van der Schouw, Y. T., Agnoli, C., Arriola, L., . . . Wareham, N. J. (2012). The amount and type of dairy product intake and incident type 2 diabetes: Results from the EPIC-InterAct Study. Am J Clin Nutr, 96(2), 382-390. doi:10.3945/ajcn.111.021907
Sommers, B. D., Gunja, M. Z., Finegold, K., & Musco, T. (2015). Changes in self-reported insurance coverage, access to care, and health under the Affordable Care Act. JAMA, 314(4), 366-374. doi:10.1001/jama.2015.8421
Song, X., Quek, R. G. W., Gandra, S. R., Cappell, K. A., Fowler, R., & Cong, Z. (2015). Productivity loss and indirect costs associated with cardiovascular events and related clinical procedures BMC Health Services Research, 15(10), 245. doi:10.1186/s12913-015-0925-x
Spencer, L., Wharton, C., Moyle, S., & Adams, T. (2007). The transtheoretical model as applied to dietary behaviour and outcomes. Nutr Res Rev, 20(1), 46-73. doi:10.1017/s0954422407747881
Tanita Corporation. Body Composition Analyzer BC-418 Instruction Manual (pp. 23). Arlington Heights, Illinois: Tanitia Corporation of America, Inc
Tanita Corporation. Tanita Body Composition Analyzer Technical Notes (Vol. Arlington Heights, IL): Tanita Corporation of American.
Todd, J. E. (2014). Changes in eating patterns and diet quality among working-age adults, 2005-2010: U.S. Department of Agriculture, Economic Research Service
Trust for America's Health and Robert Wood Johnson Foundation. (2016). The State of Obesity 2016. Retrieved from
Tucker, J. M., Welk, G. J., & Beyler, N. K. (2011). Physical activity in U.S.: Adults compliance with the Physical Activity Guidelines for Americans. Am J Prev Med, 40(4), 454-461. doi:10.1016/j.amepre.2010.12.016
Tuma, P. A. (2012). An overview of the intentions of health care reform. J Acad Nutr Diet, 112(3), S56-63. doi:10.1016/j.jand.2011.12.012
Turner, S. L., Thomas, A. M., Wagner, P. J., & Moseley, G. C. (2008). A collaborative approach to wellness: Diet, exercise, and education to impact behavior change. Journal of the American Academy of Nurse Practitioners, 20(6), 339-344. doi:10.1111/j.1745-7599.2008.00325.x
U.S. department of Agriculture, & Agriculture Research Service. (2014). Food patterns equivalents intakes from food: Mean amounts consumed per individual, by gender and age, What We Eat in America, NHANES 2011-2012. Retrieved from www.ars.usda.gov/ba/bhnrc/fsrg
U.S. Department of Health and Human Services. (2008). 2008 Physical activity guidelines for Americans. Retrieved from Washington, D.C. : https://health.gov/paguidelines/guidelines/
U.S. Department of Health and Human Services. (2016, September 5, 2016). Healthy People 2020. Retrieved from https://www.healthypeople.gov/2020/About-Healthy-People
U.S. Department of Health and Human Services and U.S. Department of Agriculture. (December 2015). 2015-2020 Dietary Guidelines for Americans. Washington, D.C. Retrieved from http://health.gov/dietaryguidelines/2015/guidelines/
U.S. Dept. of HHS. (2010). Educational and Community-Based Programs. Retrieved from https://www.healthypeople.gov/2020/topics-objectives/topic/educational-and-community-based-programs/objectives
van Dongen, J. M., Proper, K. I., van Wier, M. F., van der Beek, A. J., Bongers, P. M., van Mechelen, W., & van Tulder, M. W. (2012). A systematic review of the cost-effectiveness of worksite physical activity and/or nutrition programs. Scand J Work Environ Health, 38(5), 393-408. doi:10.5271/sjweh.3275
Verweij, L. M., Coffeng, J., van Mechelen, W., & Proper, K. I. (2011). Meta-analyses of workplace physical activity and dietary behaviour interventions on weight outcomes. Obesity Reviews, 12(6), 406-429. doi:10.1111/j.1467-789X.2010.00765.x
Ward, B. W., Clarke, T. C., Nugent, C. N., & Shiller, J. S. (2016). Early release of selected estimates based on data from the Janurary -March 2015 National Health Interview Survey. National Center for Health Statistics. Retrieved from http://www.cdc.gov/nchs/nhis.htm.
Ward, B. W., Schiller, J. S., & Goodman, R. A. (2014). Multiple chronic conditions among US adults: A 2012 update. Preventing Chronic Disease, 11, E62. doi:10.5888/pcd11.130389
Working Well. (2011). Working Well Graduate Assistanship Resource Manual: Ball State University
Xu, J., Murphy, S., Kochanek, K., & Bastian, B. (2016). Deaths: Final Data for 2013. Hyattsville, MD: National Center for Health Statistics.