98
Acquired Infections 2009 –2013 Oregon Report Health Care PUBLIC HEALTH DIVISION 971-673-1111 (phone) 971-673-1100 (fax) www.healthoregon.org/acd

Acquired Infections2009–2013 Oregon Report
Health Care
PUBLIC HEALTH DIVISION971-673-1111 (phone)971-673-1100 (fax)www.healthoregon.org/acd

1
Table of contents
Executive summary ....................................................................................................................................... 2
Background ................................................................................................................................................... 4
Internal and external validation .................................................................................................................... 7
Limitations of this report .............................................................................................................................. 8
Future implications ....................................................................................................................................... 8
The SIR......................................................................................................................................................... 10
Guidelines for understanding this report ................................................................................................... 12
Health care-associated infections (HAI) ...................................................................................................... 13
Central line-associated bloodstream infections (CLABSIs) ......................................................................... 15
Surgical site infections (SSI) ........................................................................................................................ 25
Hospital onset Clostridium difficile infection LabID (HO-CDI) ..................................................................... 57
Dialysis events ............................................................................................................................................. 62
Health care worker influenza vaccination .................................................................................................. 72
Surgical Care Improvement Project (SCIP) .................................................................................................. 80
Appendices: HAI forest plots and hospital responses. ............................................................................... 84
HAI forest plots ....................................................................................................................................... 84
Hospital comments ................................................................................................................................. 93

2
Executive summary
In 2007, the Oregon Legislative Assembly passed House Bill 2524 with the aim of keeping Oregonians free of infections acquired during the administration of health care. Oregon established a mandatory HAI reporting program that would:
• Raise awareness of HAIs • Promote transparency of health care information • Aid hospitals in reducing and preventing HAIs
In January of 2009, the Oregon Health Authority (OHA) Health Care-Associated Infection reporting program and an associated Advisory Committee (HAIAC) were formed to support these aims. The HAIAC is a diverse group of stakeholders with relevant expertise to promote prevention of harm to individuals accessing health care. The HAI program establishes reporting rules for Oregon medical facilities, which presently include the following health care outcome and process measures: Health care outcome measures
• Central line-associated bloodstream infections (CLABSI) Adult intensive care units (reporting since 2009) Neonatal intensive care units (reporting since 2011)
• Surgical site infections (SSIs) associated with the following procedures: CBGB – Coronary artery bypass grafting (reporting since 2009) CBGC – Coronary artery bypass grafting (reported from 2009–2010) COLO – Colon surgery (reporting since 2011) HPRO – Hip prosthesis (reporting since 2011) HYST – Abdominal hysterectomy (reporting since 2011) KPRO – Knee prosthesis (reporting since 2009) LAM – Laminectomy (reporting since 2011)
• CDI LabID – Clostridium difficile Laboratory Identification Event (reporting since 2012)
Health care-associated infections (HAIs) are potentially life threatening yet preventable infections, which strike approximately one in 20 hospitalized patients. The Centers for Disease Control and Prevention (CDC) estimates that in 2011 there were 722,000 cases and 75,000 deaths attributed to HAIs. The overall annual direct medical costs of HAIs in the U.S. hospitals range from $28.4 to 33.8 billion.

3
• DE – Dialysis Event (reporting since 2013) Health care process measures
• Health care worker influenza vaccination rate (reporting since 2009) • Surgical Care Improvement Project measures (SCIP) (reporting since 2009)
o SCIP1 – Prophylactic antibiotic received within one hour prior to surgical incision
o SCIP2 – Prophylactic antibiotic selection for surgical patients o SCIP3 – Prophylactic antibiotics discontinued within 24 hours after surgery end o SCIP4 – Cardiac surgery patients with controlled 6 a.m. postoperative blood
glucose o SCIP9 – Urinary catheter removal by postoperative day 2 o SCIP10 – Surgery patient with perioperative temperature management
• Infection Prevention Annual Survey (reporting since 2009) In 2013, 60 Oregon hospitals, one long-term acute care (LTAC) facility and 51 dialysis facilities reported HAI data to OHA. Also in 2013, 60 hospitals, 85 ambulatory surgical centers (ASC) and 139 long-term care facilities (LTCF) reported influenza vaccination rates. Overall, Oregon performed better than the national baseline for CLABSIs, SSIs and C. difficile LabID events. Oregon dialysis facilities reported fewer bloodstream infections (BSI) and fewer BSIs related to types of vascular access (ARB) than the national mean of all dialysis facilities reporting to NHSN. Health care worker influenza vaccination rates increased 8% for all facilities (hospitals, ambulatory surgical centers, long-term care facilities). All SCIP measures showed above 95% compliance. The 2013 infection prevention (IP) annual survey revealed Oregon has an average of 1 FTE per 110 hospital beds and IPs spend 40% of their time doing NHSN surveillance.
4
Background Health care-associated infections (HAIs) are infections associated with treatment for other conditions in medical settings. Oregon hospitals report HAIs to OHA using the CDC National Health Safety Network (NHSN). This is an online surveillance and prevention system created to track HAIs in medical facilities across the United States. SCIP measure data are collected from the Centers for Medicare & Medicaid Services (CMS) Hospital Compare database. Additional information about NHSN and CMS Hospital Compare can be found at: www.cdc.gov/nhsn/www.medicare.gov/hospitalcompare/search.html
In 2009, Oregon hospitals began reporting 4 NHSN-defined HAIs; CLABSIs, CBGBs (chest only and chest/donor site) and KPROs. Since that time, 8 other HAIs have been added to mandatory reporting, two of which are new to reporting in 2014. Surveillance of CBGCs for the chest incision only was dropped from reporting requirements in 2011.
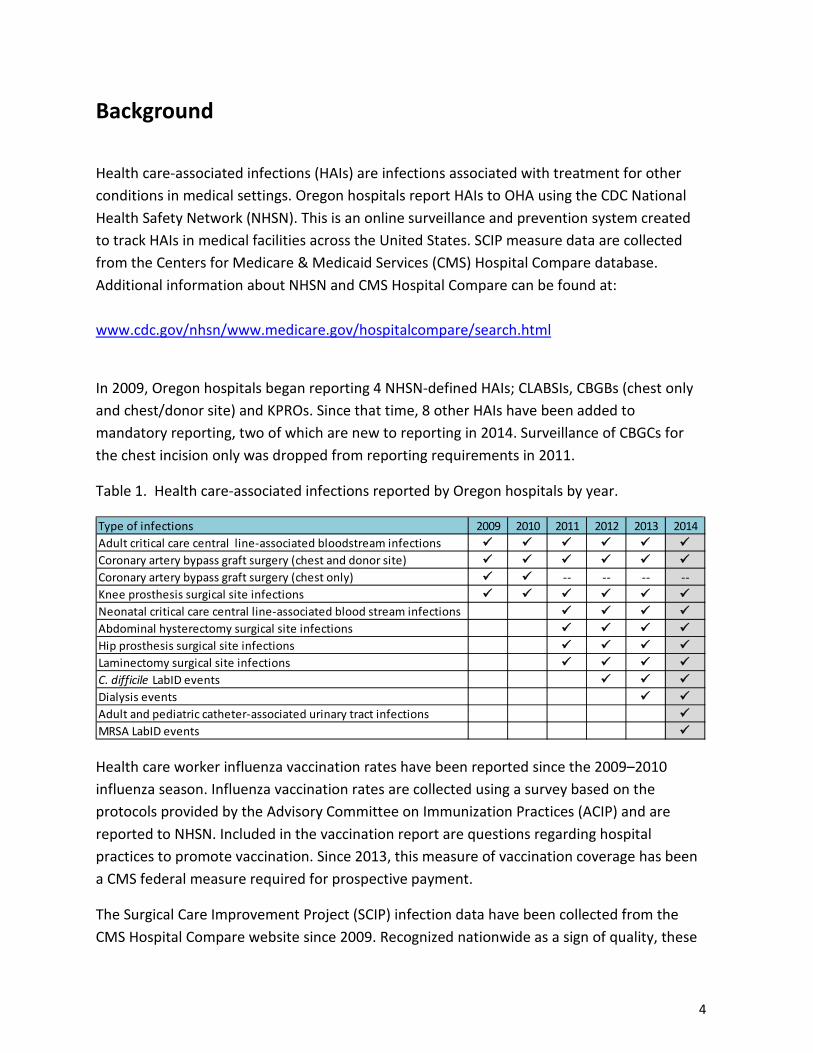
Table 1. Health care-associated infections reported by Oregon hospitals by year.
Health care worker influenza vaccination rates have been reported since the 2009–2010 influenza season. Influenza vaccination rates are collected using a survey based on the protocols provided by the Advisory Committee on Immunization Practices (ACIP) and are reported to NHSN. Included in the vaccination report are questions regarding hospital practices to promote vaccination. Since 2013, this measure of vaccination coverage has been a CMS federal measure required for prospective payment.
The Surgical Care Improvement Project (SCIP) infection data have been collected from the CMS Hospital Compare website since 2009. Recognized nationwide as a sign of quality, these
Type of infections 2009 2010 2011 2012 2013 2014Adult critical care central line-associated bloodstream infections Coronary artery bypass graft surgery (chest and donor site) Coronary artery bypass graft surgery (chest only) -- -- -- --Knee prosthesis surgical site infections Neonatal critical care central line-associated blood stream infections Abdominal hysterectomy surgical site infections Hip prosthesis surgical site infections Laminectomy surgical site infections C. difficile LabID events Dialysis events Adult and pediatric catheter-associated urinary tract infections MRSA LabID events

5
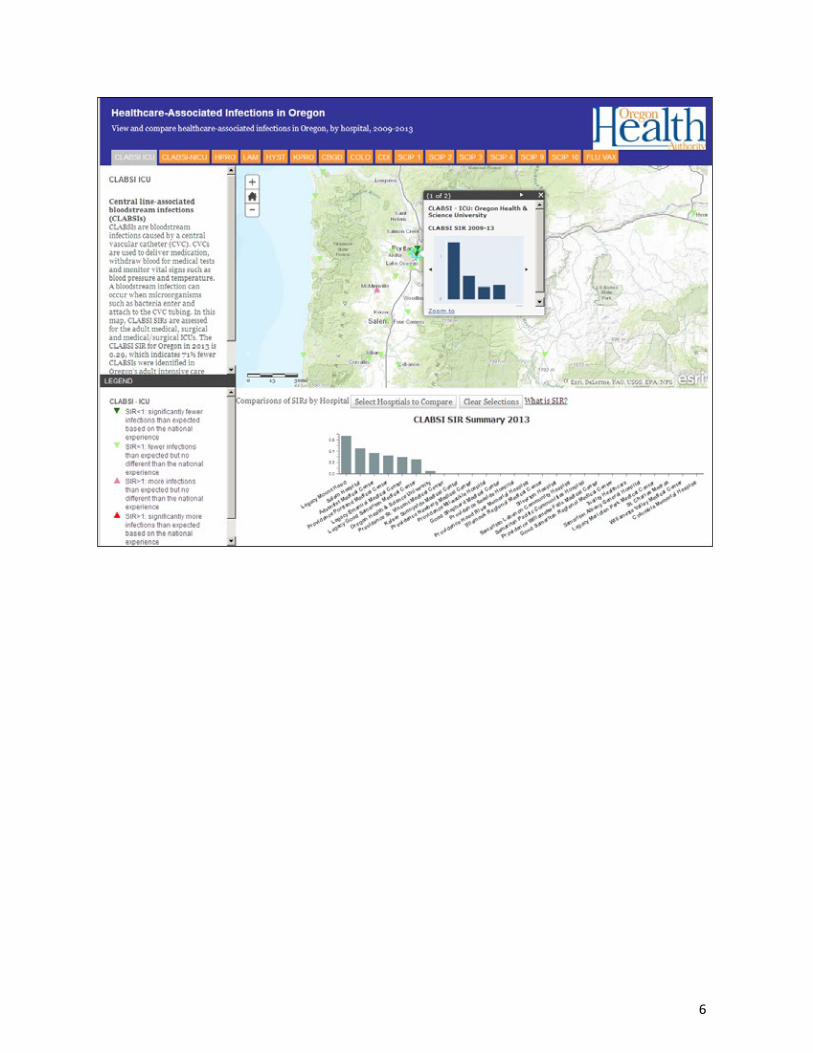
measures were developed by CMS, a federal agency and The Joint Commission (JC), an independent, not-for-profit organization. Hospitals complete the NHSN Patient Safety Annual Hospital Survey to assess the impact of mandatory HAI reporting on infection prevention personnel. Online Department of Health hospital infection map New to the Oregon Health Authority HAI website is an interactive map of hospitals in Oregon with their corresponding health care-associated infection information. Hospital infection information can be obtained from this website, including the hospital’s number of infections, number of procedures, the rate and SIR. Another feature is the ability to compare infection information between hospitals by selecting regions of interest. This map can be found at: http://public.health.oregon.gov/DiseasesConditions/CommunicableDisease/HAI/Pages/index.aspx
6
7
Internal and external validation Hospital review Oregon hospitals had the opportunity to verify the accuracy of their data. The aggregate numbers of infections and denominators as well as possible data errors for SSIs were sent to each hospital to be reviewed by the chief executive officer and the lead infection prevention professional. The possible data error elements were defined as:
1. Any missing required data elements 2. Any procedure duration less than 5 minutes 3. Procedure duration greater than*:
a. CBGB > 846 minutes b. COLO > 668 minutes c. HPRO > 380 minutes d. HYST > 479 minutes e. KPRO > 354 minutes f. LAM > 615 minutes
4. CBGB classified as anything other than “clean” 5. CBGB with an ASA score other than 1 or 2 6. CBGB classified as a trauma surgical procedure 7. Any HPRO, KPRO or LAMs with a wound class other than “clean” 8. COLO procedure classified as “clean” 9. Any surgical wound class designated as “unknown”
Facilities were given 14 days to provide any corrections prior to publication. In addition, facilities were given the opportunity to submit written comments to be included in the annual report. * http://www.cdc.gov/nhsn/PDFs/Newsletters/NHSN_NL_OCT_2010SE_final.pdf
External validation The Oregon Health Authority’s Public Health Division is currently validating intensive care unit (ICU) CLABSI data by retrospective chart review. This evaluation is similar to the statewide validation of ICU CLABSIs reported for 2009. In both the current and 2009 CLABSI validation, hospitals were assessed for consistency and reliability of applying NHSN definitions to patients identified with blood cultures testing positive for a microorganism.
8
http://public.health.oregon.gov/DiseasesConditions/CommunicableDisease/HAI/Documents/clabsi-oh-article.pdf
Limitations of this report There are two significant limitations of this report:
1. Each facility’s data is self-reported. The OHA implemented both internal and external validation to maintain data integrity.
2. The ability to detect HAI cases varies between facilities. This can be due to several causes including, but not limited to:
a. The amount of personnel and financial resources available to facilities for
surveillance; b. Hospitals may use different approaches to detecting HAIs. Differences in lab
reporting, diagnostic methods, post-discharge surveillance and other non-standardized methods can lead to differences in HAI detection; and
c. Differences in microbiologic diagnostic testing can cause differences in detection. For example, microbiology laboratories that have implemented more sensitive laboratory tests to detect C. difficile may report an increase in total numbers of positive specimens due to the increase in sensitivity of the test.
Future implications Decreases in several Oregon HAIs over the past 5 years is likely due to the extraordinary efforts of infection preventionists and quality personnel to educate hospital staff and implement process improvement programs. Prevention collaboratives have been established to continue reducing HAIs in Oregon that include:
• Acumentra Health (Oregon’s QIO) • Oregon Association of Hospitals and Health Systems (OAHHS) • Oregon Patient Safety Commission (OPSC) • Drug Resistant Organism Coordinated Regional Epidemiology network (DROP-CRE)
9
The efforts of these groups are aimed at reducing:
• Central line-associated bloodstream infections • Surgical site infections • Clostridium difficile infections • MRSA infections • Multidrug-resistant organism infections (MDROs)
A list of some Oregon efforts can be found on the CDC website: www.cdc.gov/HAI/stateplans/state-hai-plans/or.html

10
The SIR Prior to the 2012 report, Oregon only reported simple rates that did not account for the diversity of hospital populations. For example, the rate of HAIs in a hospital that has an older population is expected to have a higher rate of infection than a hospital with a younger population because older patients are at greater risk for infection for reasons other than the type of care given. The Standardized Infection Ratio (SIR) measurement is used to account for such differences in a health care population based on national data. How to interpret the SIR There are two important calculations for the SIR: the ratio itself and its confidence interval. SIR (ratio):
SIR = Observed HAI/Expected HAI
SIR = 1.0 means the number of infections observed during 2013 was the same as expected.
SIR > 1 means the number of infections observed during 2013 was higher than expected.
SIR < 1 means the number of infections observed during 2013 was lower than expected.
Confidence interval (CI): This is a range around the SIR estimate that conveys the level of confidence in the precision of the SIR estimate. If the confidence interval includes the value 1.0 (i.e.: 0.5–1.5), then the SIR estimate is considered not to be statistically different from the national baseline. If the confidence interval does not include 1.0 (0.5–0.8), then the SIR estimate is considered to be statistically different than the national baseline.

11
Example of the 2013 HAI tables in this report
Interpretation of 2013 HAI tables
Hospital A ▼SIR = 0.20 Confidence interval = 0.1-0.3 The SIR estimate for this hospital is 0.20. This means this hospital had 80% less HAIs than the national baseline. The CI is statistically significant which means the SIR estimate is statistically different than the national baseline.
Hospital B ▼SIR = 0.50 Confidence interval = 0.20-1.02 The SIR estimate for this hospital is 0.50. This means this hospital had 50% less HAIs than the national baseline. The CI includes 1.0 and is not statically significant. This means the SIR estimate is not statistically different than the national baseline.
Hospital C ▲SIR = 1.33 Confidence interval = 0.80-3.00 The SIR estimate for this hospital is 1.33. This means this hospital had 33% more HAIs than the national baseline. The CI includes 1.0 and is not statically significant. This means the SIR estimate is not statistically different than the national baseline.
Hospital D ▲SIR = 2.00 Confidence interval = 1.5-3.5 The SIR estimate for this hospital is 2.0. This means this hospital had 100% more HAIs than the national baseline. The CI is statistically significant which means the SIR estimate is statistically different than the national baseline.
Hospital NameObserved # of CLABSIs
Expected # of CLABSI
Hospital A 1.00 5.00 0.20 ▼Hospital B 1.00 2.00 0.50 ▼Hospital C 2.00 1.50 1.33 ▲Hospital D 2.00 1.00 2.00 ▲
HAI (2013)
CLABSI SIR
12
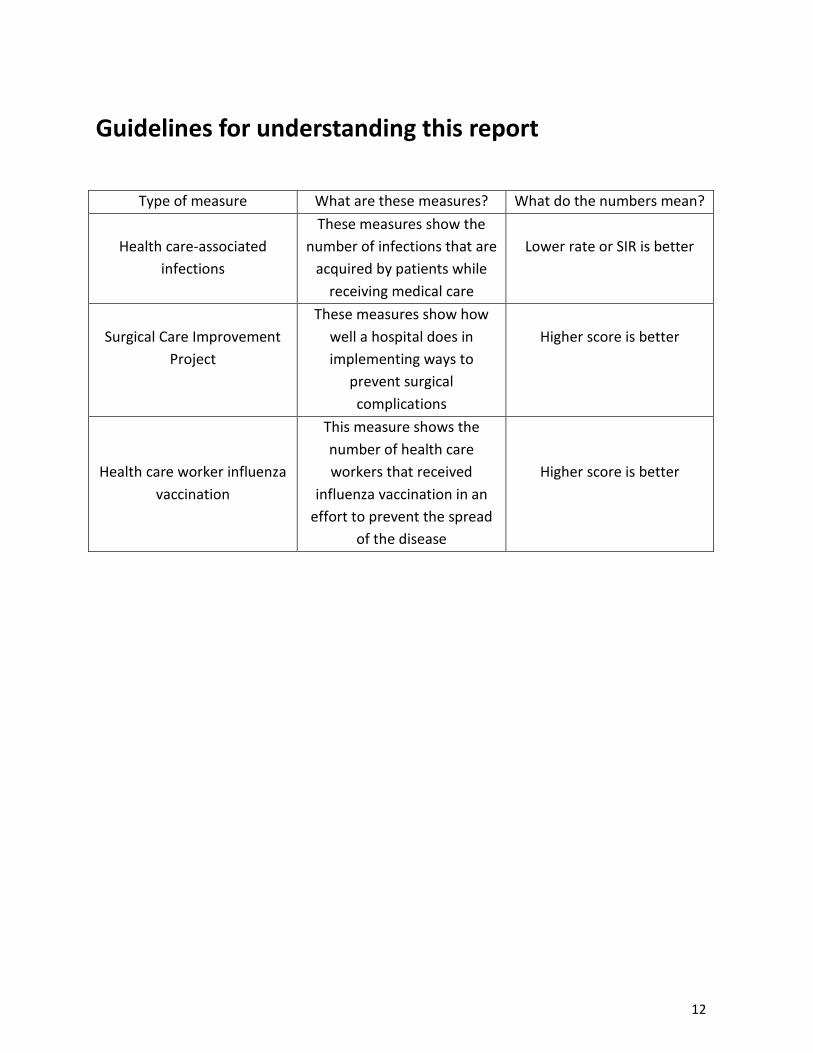
Guidelines for understanding this report
Type of measure What are these measures? What do the numbers mean?
Health care-associated
infections
These measures show the number of infections that are
acquired by patients while receiving medical care
Lower rate or SIR is better
Surgical Care Improvement
Project
These measures show how well a hospital does in implementing ways to
prevent surgical complications
Higher score is better
Health care worker influenza vaccination
This measure shows the number of health care workers that received
influenza vaccination in an effort to prevent the spread
of the disease
Higher score is better

13
Health care-associated infections (HAI) Exemptions Oregon hospitals were given the opportunity to request exemptions to reporting HAIs if they met the following criteria:
• Facilities that perform less than 20 of a given surgical procedure may request an exemption from reporting that specific surgical site infection type.
• Facilities that have less than 50 central line (CL) days per year may request an exemption from reporting CL-associated bloodstream infections.
All hospitals must report hospital-onset C. difficile infections, but may report quarterly instead of monthly if they received a waiver from CLABSI and SSI reporting for 2013. The exemption forms can be found on this website: http://public.health.oregon.gov/DiseasesConditions/CommunicableDisease/HAI/Reporting/Pages/Mandatory-Reporting.aspx

14
Table 2. Hospitals that applied and met criteria for HAI exemptions for 2013 reporting by hospital. (An “x” marks exemption status.)
NHSN ID NameAdult
CLABSICBGB COLO HPRO HYST KPRO LAM
13867 Adventist Medical Center11409 Asante Three Rivers Medical Center X X13917 Ashland Community Hospital14144 Asante Rogue Regional Medical Center *13654 Bay Area Hospital X13763 Blue Mountain Hospital X X X X X X X14061 Columbia Memorial Hospital X X13834 Coquille Valley Hospital District21425 Cottage Grove Community Hospital X14964 Curry General Hospital X X X X X X X13783 Good Samaritan Regional Medical Center13191 Good Shepherd Medical Center X X X X14338 Grande Ronde Hospital14223 Harney District Hospital X X X X X X X10400 Kaiser Permanente Sunnyside Medical Center33207 Kaiser Permanente Westside Medical Center14573 Lake District Hospital X X X X X X X10598 Legacy Emanuel Medical Center *10597 Legacy Good Samaritan Medical Center13821 Legacy Meridian Park Medical Center14002 Legacy Mount Hood Medical Center13414 Lower Umpqua Hospital District X X X X X X X13488 McKenzie-Willamette Medical Center14483 Mercy Medical Center14173 Mid-Columbia Medical Center X X X10074 Oregon Health & Science University *10997 Peace Harbor Hospital X X X34079 Pioneer Memorial Hospital - Heppner X13419 Pioneer Memorial Hospital - Prinevil le13382 Providence Hood River Memorial Hospital X X13313 Providence Medford Medical Center12445 Providence Milwaukie Hospital X X11121 Providence Newberg Medical Center13724 Providence Portland Medical Center13303 Providence Seaside Hospital10095 Providence St. Vincent Medical Center *13738 Providence Willamette Falls Medical Center X12648 Sacred Heart Medical Center - Riverbend *22132 Sacred Heart University District13910 Salem Hospital *13787 Samaritan Albany General Hospital
13720 Samari tan Lebanon Community Hospi ta l
13780 Samari tan North Lincoln Hospi ta l X X X X X X13722 Samari tan Paci fic Community Hospi ta l X X14224 Santiam Memoria l Hospi ta l X X X13984 Shriner's X X X X X X X13685 Si lverton Hospi ta l X X14288 Sky Lakes Medica l Center X14013 Southern Coos Hospi ta l and Heal th Center
15534 St. Alphonsus Medica l Center - Baker Ci ty X X X X13871 St. Alphonsus Medica l Center - Ontario
13618 St. Anthony Hospi ta l X X X13402 St. Charles Medica l Center - Bend *
13856 St. Charles Medica l Center - Madras
13418 St. Charles Medica l Center - Redmond
13383 Ti l lamook County Hospi ta l X X X13786 Tual i ty Community Hospi ta l
25132 Vibra Specia l ty Hospi ta l of Portland X X X X X X X13796 Wal lowa Memoria l Hospi ta l X X X X X X14087 West Va l ley Hospi ta l X X X X X X X13930 Wil lamette Val ley Medica l Center
* These 7 hospitals have neonatal ICUs and report data for CLABSIs in those units.
Facilities which perform less than 20 of a given surgical procedure may request an exemption from reporting that specific surgical site infection type. Facilities which have less than 50 central line (CL) days per year may request an exemption from reporting CL-associated bloodstream infections.

15
Central line-associated bloodstream infections (CLABSIs)
CLABSIs are bloodstream infections caused by a central vascular catheter (CVC). CVCs are used to deliver medication, withdraw blood for medical tests and monitor vital signs such as blood pressure and temperature. A bloodstream infection can occur when microorganisms such as bacteria enter and attach to the CVC tubing. In this document, CLABSI SIRs are assessed for the adult medical, surgical and medical/surgical ICUs and neonatal intensive care units (ICU).
Adult intensive care
The Oregon CLABSI SIR in adult intensive care units decreased by 65% over the last 5 years and remains statistically better than the national baseline. In 2013, there were a total of 29 adult intensive care unit CLABSIs identified in Oregon hospitals, in contrast to the 100.5 predicted for Oregon by NHSN.
The SIR for Oregon in 2013 is 29 ÷ 100.5 = 0.29.
In 2013, 71% less CLABSIs were identified in Oregon’s adult intensive care patients than the national experience.
Figure 1. Oregon adult ICU CLABSI SIRs for calendar years 2009 through 2013.

16
Table 3 and Figure 2 show that in 2013, 43 hospitals reported the CLABSI measurement in their hospitals adult intensive care unit. Sixteen hospitals (37%) reported at least one CLABSI in their ICUs and 27 (63%) hospitals reported zero CLABSIs. Three hospitals had an SIR statistically lower than the national baseline. Three hospitals in 2013 reported at least one CLABSI but had no SIR calculated because the expected number of CLABSIs was less than one.
Table 3. Oregon adult ICU observed and expected number of CLABSIs with associated SIR for calendar year 2013 by hospital.
Hospital NameObserved # of CLABSIs
Expected # of CLABSIs
Adventist Medical Center 1 2.75 0.36 ▼Asante Rogue Regional Medical Center 1 4.39 0.23 ▼Asante Three Rivers Medical Center 0 1.25 0.00 ▼Ashland Community Hospital 0 0.13 0.00 ▼Bay Area Hospital 0 0.80 0.00 ▼Columbia Memorial Hospital 0 0.08 0.00 ▼Coquille Valley Hospital District 0 0.05 0.00 ▼Good Samaritan Regional Medical Center 0 2.67 0.00 ▼Good Shepherd Medical Center 0 0.13 0.00 ▼Grande Ronde Hospital 0 0.21 0.00 ▼Kaiser Permanente Sunnyside Medical Center 0 2.87 0.00 ▼Legacy Emanuel Medical Center 3 10.40 0.29 ▼Legacy Good Samaritan Medical Center 1 3.98 0.25 ▼Legacy Meridian Park Medical Center 0 1.05 0.00 ▼Legacy Mount Hood Medical Center 1 1.51 0.66 ▼McKenzie-Willamette Medical Center 2 1.73 1.16 ▲Mercy Medical Center 0 2.05 0.00 ▼Oregon Health & Science University 1 21.46 0.05 ▼Peace Harbor Hospital 1 0.14 -- --
Pioneer Memorial Hospital - Prineville 0 0.07 0.00 ▼Providence Hood River Memorial Hospital 0 0.08 0.00 ▼Providence Medford Medical Center 2 3.45 0.58 ▼
Central Line-Associated Bloodstream Infection (CLABSI) 2013
CLABSI SIR

17
Hospital NameObserved # of CLABSIs
Expected # of CLABSIs
Providence Milwaukie Hospital 0 0.35 0.00 ▼Providence Newberg Medical Center 0 0.51 0.00 ▼Providence Portland Medical Center 2 6.21 0.32 ▼Providence Seaside Hospital 0 0.03 0.00 ▼Providence St. Vincent Medical Center 0 3.17 0.00 ▼Providence Willamette Falls Medical Center 0 0.59 0.00 ▼Sacred Heart Medical Center - Riverbend 1 10.99 0.09 ▼Salem Hospital 3 6.77 0.44 ▼Samaritan Albany General Hospital 0 1.07 0.00 ▼Samaritan Lebanon Community Hospital 0 0.49 0.00 ▼Samaritan Pacific Communities Hospital 0 0.29 0.00 ▼Silverton Hospital 0 0.20 0.00 ▼Sky Lakes Medical Center 2 1.93 1.04 ▲St. Alphonsus Medical Center - Ontario 0 0.20 0.00 ▼St. Anthony Hospital 1 0.38 -- --
St. Charles Medical Center - Bend 6 4.16 1.44 ▲St. Charles Medical Center - Madras 0 0.02 0.00 ▼St. Charles Medical Center - Redmond 0 0.30 0.00 ▼Tillamook County Hospital 0 0.04 0.00 ▼Tuality Community Hospital 0 1.01 0.00 ▼Willamette Valley Medical Center 1 0.94 -- --
Central Line-Associated Bloodstream Infection (CLABSI) 2013
CLABSI SIR
▼▼▲▲-- No SIR calculated because the expected number of infections is < 1 and facil ity had at least one infection in 2013
Footnote 1: The expected number of CLABSIs is a prediction based on the national HAI experience for all hospitals reporting to NHSN. The observed number is the total number of CLABSIs identified during 2013. The SIR = Observed ÷ Expected. It is better to have a lower SIR.
Footnote 2: NHSN does not calculate an SIR for hospitals whose expected number of infections is < 1.
SIR is < 1.0 and is less than the national baseline
SIR is ≤ 1.0 and is no different than the national baseline or facil ity had 0 CLABSIs
SIR is > 1.0 and is no different than the national baseline
SIR is > 1.0 and is greater than the national baseline

18
Figure 2. Oregon adult ICU
CLABSI SIRs for calendar year 2013.

19
Sixteen Oregon hospitals reported a decrease in adult ICU CLABSIs from 2009–2013. Four hospitals reported increases in CLABSIs between 2009–2013. Seventeen hospitals reported no CLABSIs between 2009–2013.
Table 4. Oregon SIR values for adult ICU CLABSIs for calendar years 2009 through 2013 by hospital.
Hospital Name 2009 2010 2011 2012 2013 Percent difference
Trend
Adventist Medical Center 0.81 0.50 0.37 0.00 0.36 -55.3%
Asante Rogue Regional Medical Center 0.81 0.30 0.27 0.00 0.23 -72.0%
Asante Three Rivers Medical Center 0.96 0.00 0.00 * 0.00 -100.0%
Ashland Community Hospital 0.00 0.00 0.00 * 0.00 --
Bay Area Hospital 0.00 0.00 0.00 0.00 0.00 --
Blue Mountain Hospital * * * Exempt Exempt --
Columbia Memorial Hospital * 0.00 0.00 0.00 0.00 --
Coquille Valley Hospital District * * * 0.00 0.00 --
Good Samaritan Regional Medical Center 0.30 0.28 0.32 1.33 0.00 -100.0%
Good Shepherd Medical Center 0.00 0.00 0.00 0.00 0.00 --
Grande Ronde Hospital 0.00 0.00 0.00 0.00 0.00 --
Harney District Hospital Exempt Exempt * Exempt Exempt --
Kaiser Permanente Sunnyside Medical Center 0.63 0.35 0.00 0.00 0.00 -100.0%
Legacy Emanuel Medical Center 0.86 0.69 0.79 0.39 0.29 -66.4%
Legacy Good Samaritan Medical Center 0.14 0.49 0.38 0.43 0.25 85.9%
Legacy Meridian Park Medical Center 1.88 0.00 0.00 0.77 0.00 -100.0%
Legacy Mount Hood Medical Center 1.15 1.16 0.00 1.86 0.66 -42.1%
McKenzie-Willamette Medical Center 2.73 0.73 0.00 0.00 1.16 -57.6%
Mercy Medical Center 1.24 0.91 0.39 0.45 0.00 -100.0%
Mid-Columbia Medical Center 0.00 0.00 0.00 0.00 Exempt --
Oregon Health & Science University 1.35 0.56 0.30 0.35 0.05 -96.5%
Peace Harbor Hospital * 0.00 0.00 0.00 * --
Pioneer Memorial Hospital - Prineville 0.00 0.00 0.00 0.00 0.00 --
Providence Hood River Memorial Hospital 0.00 * * 0.00 0.00 --
Adult ICU CLABSI Standardized Infection Ratio (2009–2013)SIR

20
Hospital Name 2009 2010 2011 2012 2013Percent
difference Trend
Providence Medford Medical Center 1.85 0.85 0.31 0.30 0.58 -68.6%
Providence Milwaukie Hospital 0.00 0.00 0.00 0.00 0.00 --
Providence Newberg Medical Center * 0.00 0.00 0.00 0.00 --
Providence Portland Medical Center 1.01 0.15 0.25 0.00 0.32 -68.2%
Providence Seaside Medical Center 0.00 0.00 * 0.00 0.00 --
Providence St. Vincent Medical Center 0.60 0.29 0.59 0.85 0.00 -100.0%
Providence Willamette Falls Medical Center 0.00 0.00 0.00 * 0.00 --
Sacred Heart Medical Center - Riverbend 1.09 0.72 0.42 0.19 0.09 -91.6%
Salem Hospital 0.21 0.00 0.24 0.00 0.44 116.1%
Samaritan Albany General Hospital 0.00 0.80 0.00 * 0.00 --
Samaritan Lebanon Community Hospital 0.00 0.00 0.00 0.00 0.00 --
Samaritan North Lincoln Hospital 0.00 0.00 * 0.00 Exempt --
Samaritan Pacific Communities Hospital 0.00 0.00 0.00 0.00 0.00 --
Silverton Hospital Exempt 0.00 0.00 0.00 0.00 --
Sky Lakes Medical Center 0.00 0.00 0.00 0.56 1.04 --
St. Alphonsus Medical Center - Baker City Exempt 0.00 * Exempt Exempt --
St. Alphonsus Medical Center - Ontario Exempt 0.00 0.00 0.00 0.00 --
St. Anthony Hospital 0.00 0.00 0.00 0.00 * --
St. Charles Medical Center - Bend 0.66 0.78 1.21 0.00 1.44 118.1%
St. Charles Medical Center - Madras 0.00 0.00 0.00 0.00 0.00 --
St. Charles Medical Center - Redmond 0.00 0.00 0.00 0.00 0.00 --
Tillamook 0.00 0.00 0.00 0.00 0.00 --
Tuality Community Hospital 2.00 0.00 1.77 0.00 0.00 -100.0%
Willamette Valley Medical Center 0.00 0.00 0.93 0.00 * --
* Expected number of infections <1 with no SIR calculated
Adult ICU CLABSI Standardized Infection Ratio (2009–2013)SIR

21
Neonatal intensive care (NICU)
The Oregon CLABSI SIR in neonatal ICUs decreased by 29% over the past 3 years and remains statistically better than the national baseline. In 2013, there were a total of 6 NICU CLABSIs identified in Oregon hospitals, in contrast to the 20.3 predicted by NHSN.
The SIR for Oregon in 2013 is 6 ÷ 20.3 = 0.30.
In 2013, 70% less CLABSIs were identified in Oregon’s neonatal intensive care patients than the national experience.
Figure 3. Oregon NICU CLABSI SIRs for calendar years 2011 through 2013.

22
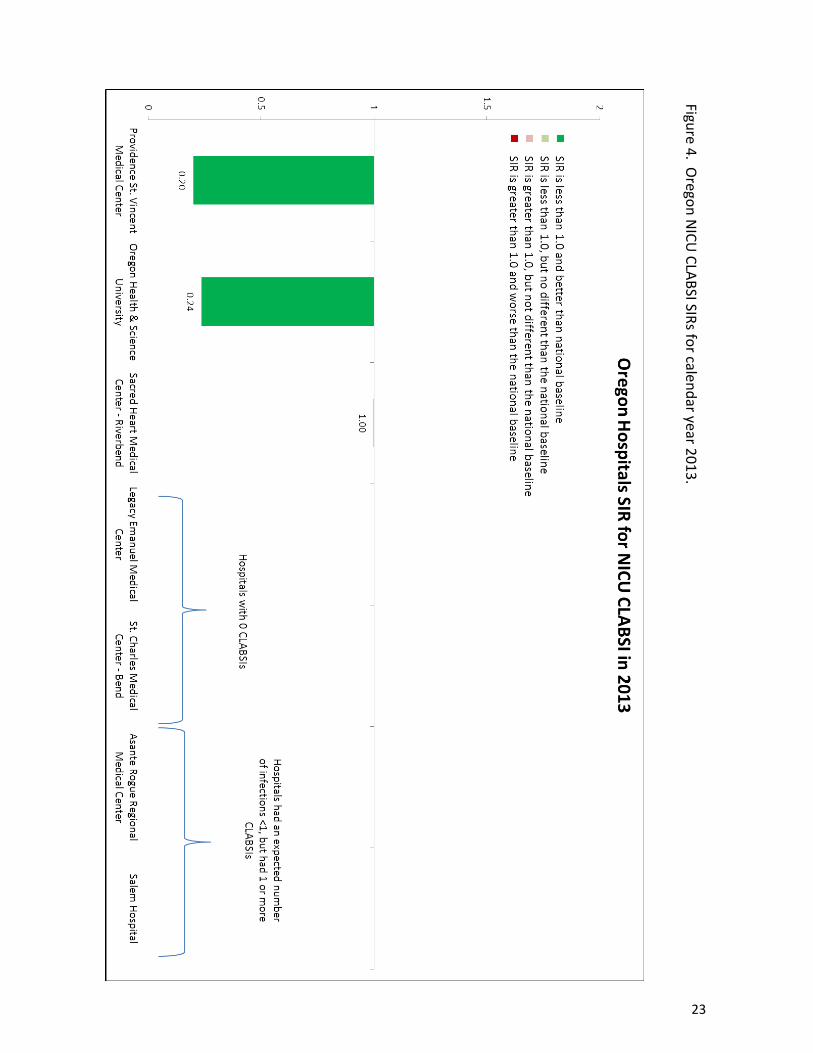
Table 5 and Figure 4 show that in 2013, 7 hospitals reported the CLABSI measurement for their neonatal intensive care unit. Five (71%) hospitals reported at least one CLABSI and 2 hospitals (29%) hospitals reported zero CLABSIs. Two hospitals had an SIR significantly lower than the national baseline. Three hospitals had no SIR calculated because the expected number of CLABSIs was less than one but did report at least on CLABSI in 2013.
Table 5. Oregon NICU observed and expected number of CLABSIs with associated SIR for calendar year 2013 by hospital.
Hospital NameObserved # of CLABSIs
Expected # of CLABSIs
Asante Rogue Regional Medical Center 1 0.62 0.00 --
Legacy Emanuel Medical Center 0 4.41 0.00 ▼Oregon Health & Science University 2 8.46 0.24 ▼Providence St. Vincent Medical Center 1 4.99 0.20 ▼Sacred Heart Medical Center - Riverbend 1 1.00 1.00 ▼Salem Hospital 1 0.48 0.00 --
St. Charles Medical Center - Bend 0 0.34 0.00 ▼
CLABSI SIR
Neonatal Critical Care Central Line-Associated Bloodstream Infection (CLABSI) 2013
▼▼▲▲-- No SIR calculated because the expected number of infections is < 1 and facil ity had at least one infection in 2013
Footnote 2: NHSN does not calculate an SIR for hospitals whose expected number of infections is < 1.
SIR is < 1.0 and is less than the national baseline
SIR is ≤ 1.0 and is no different than the national baseline or facil ity had 0 CLABSIs
SIR is > 1.0 and is no different than the national baseline
SIR is > 1.0 and is greater than the national baseline
Footnote 1: The expected number of CLABSIs is a prediction based on the national HAI experience for all hospitals reporting to NHSN. The observed number is the total number of CLABSIs identified during 2013. The SIR = Observed ÷ Expected. It is better to have a lower SIR.
23
Figure 4. Oregon N
ICU CLABSI SIRs for calendar year 2013.
24
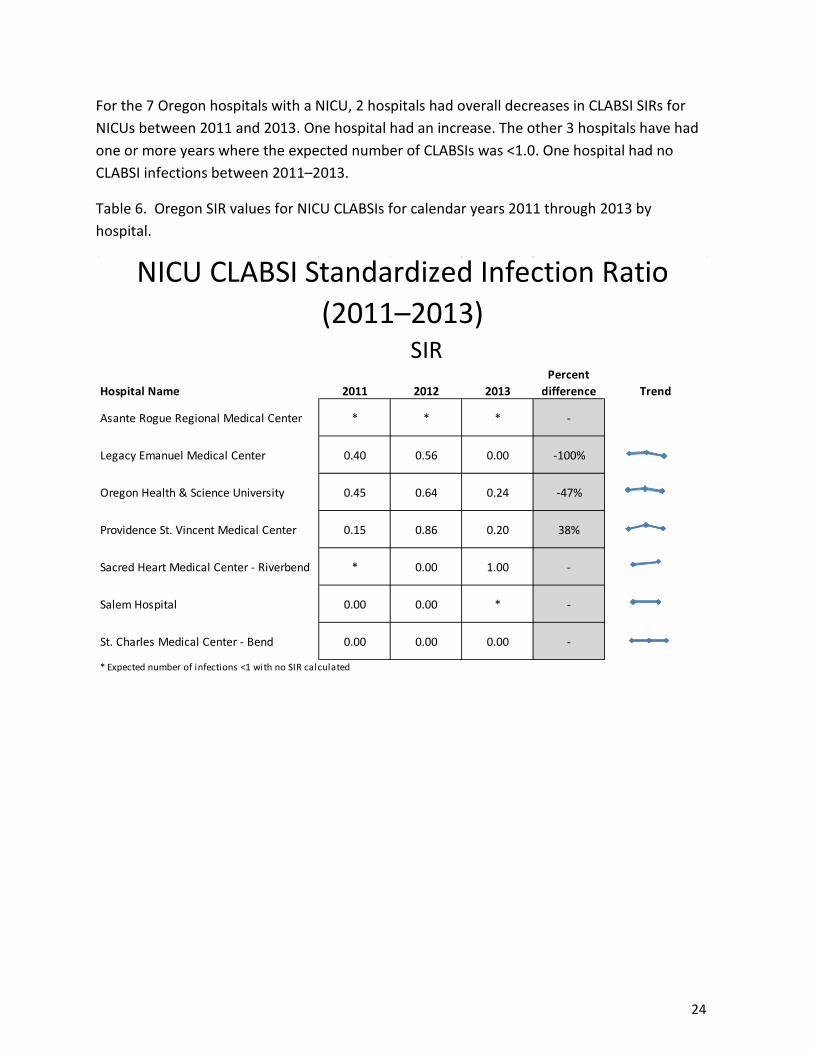
For the 7 Oregon hospitals with a NICU, 2 hospitals had overall decreases in CLABSI SIRs for NICUs between 2011 and 2013. One hospital had an increase. The other 3 hospitals have had one or more years where the expected number of CLABSIs was <1.0. One hospital had no CLABSI infections between 2011–2013.
Table 6. Oregon SIR values for NICU CLABSIs for calendar years 2011 through 2013 by hospital.
Hospital Name 2011 2012 2013Percent
difference Trend
Asante Rogue Regional Medical Center * * * -
Legacy Emanuel Medical Center 0.40 0.56 0.00 -100%
Oregon Health & Science University 0.45 0.64 0.24 -47%
Providence St. Vincent Medical Center 0.15 0.86 0.20 38%
Sacred Heart Medical Center - Riverbend * 0.00 1.00 -
Salem Hospital 0.00 0.00 * -
St. Charles Medical Center - Bend 0.00 0.00 0.00 -
* Expected number of infections <1 with no SIR calculated
NICU CLABSI Standardized Infection Ratio (2011–2013)
SIR
25
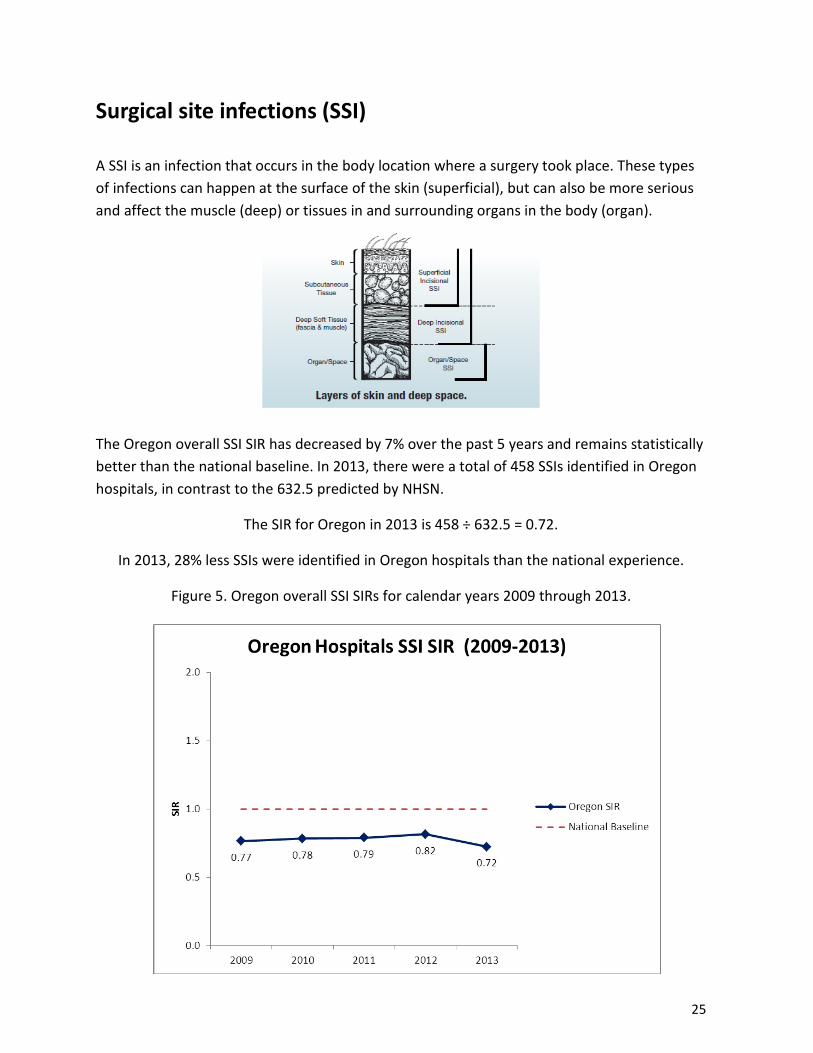
Surgical site infections (SSI) A SSI is an infection that occurs in the body location where a surgery took place. These types of infections can happen at the surface of the skin (superficial), but can also be more serious and affect the muscle (deep) or tissues in and surrounding organs in the body (organ).
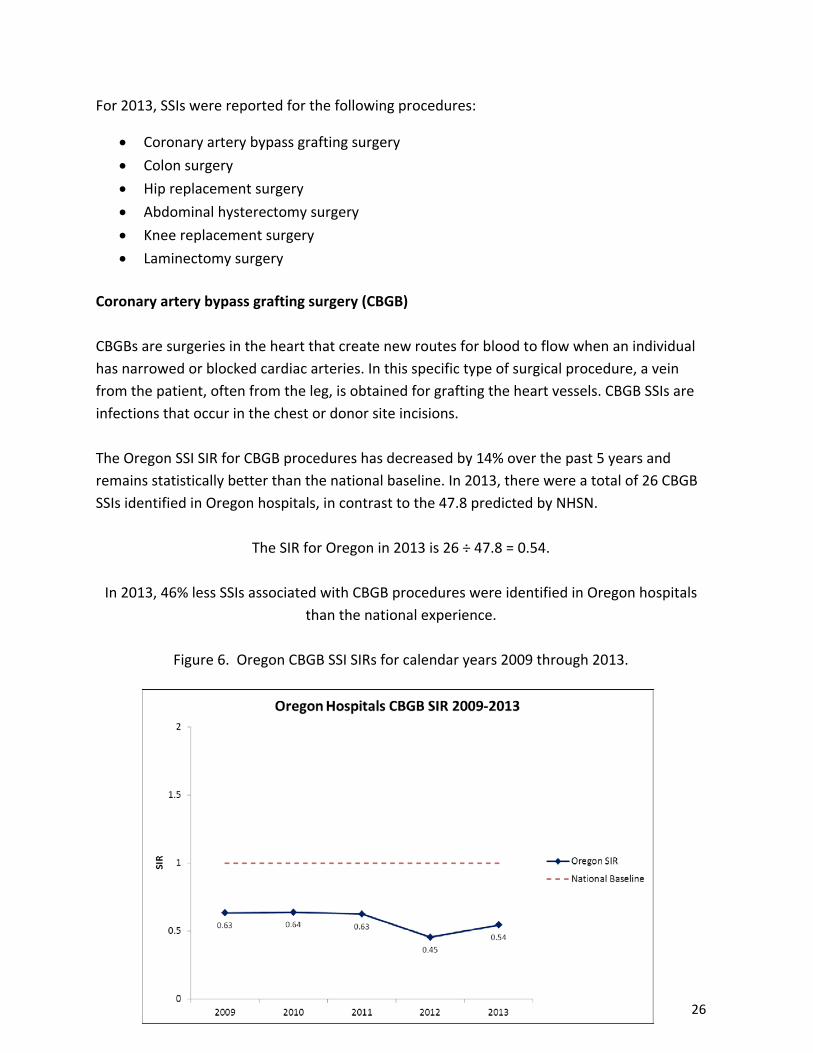
The Oregon overall SSI SIR has decreased by 7% over the past 5 years and remains statistically better than the national baseline. In 2013, there were a total of 458 SSIs identified in Oregon hospitals, in contrast to the 632.5 predicted by NHSN.
The SIR for Oregon in 2013 is 458 ÷ 632.5 = 0.72.
In 2013, 28% less SSIs were identified in Oregon hospitals than the national experience.
Figure 5. Oregon overall SSI SIRs for calendar years 2009 through 2013.
26
For 2013, SSIs were reported for the following procedures:
• Coronary artery bypass grafting surgery • Colon surgery • Hip replacement surgery • Abdominal hysterectomy surgery • Knee replacement surgery • Laminectomy surgery
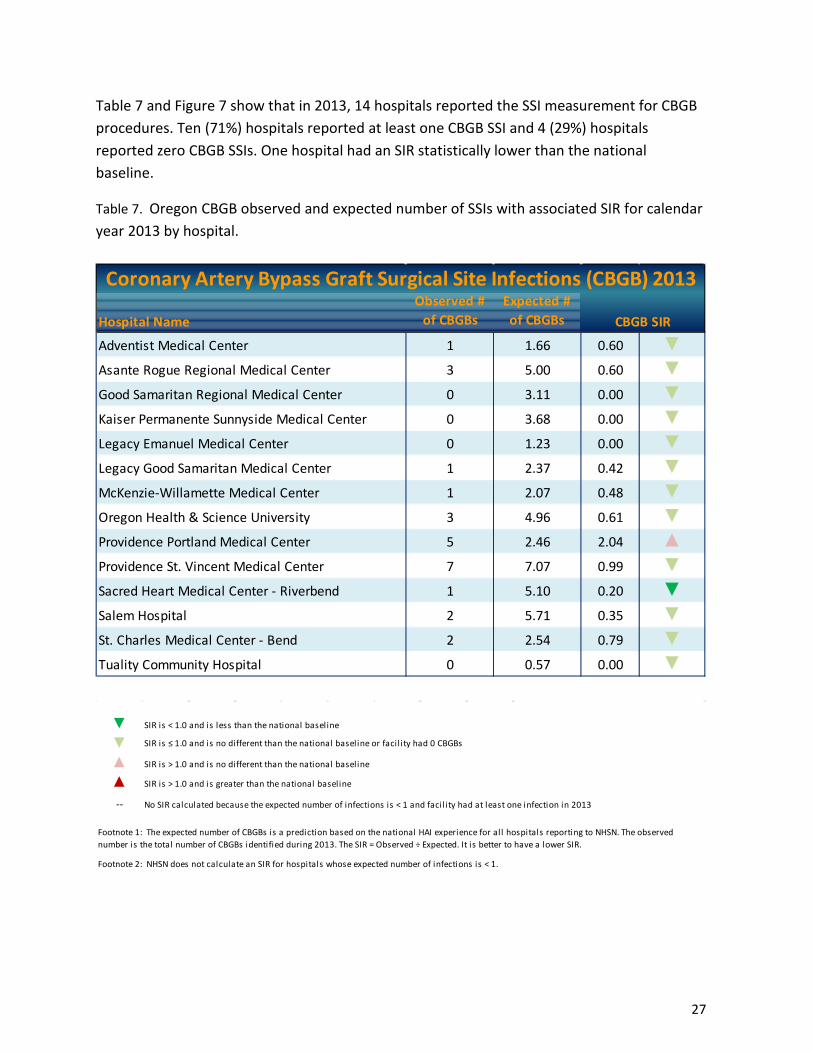
Coronary artery bypass grafting surgery (CBGB) CBGBs are surgeries in the heart that create new routes for blood to flow when an individual has narrowed or blocked cardiac arteries. In this specific type of surgical procedure, a vein from the patient, often from the leg, is obtained for grafting the heart vessels. CBGB SSIs are infections that occur in the chest or donor site incisions. The Oregon SSI SIR for CBGB procedures has decreased by 14% over the past 5 years and remains statistically better than the national baseline. In 2013, there were a total of 26 CBGB SSIs identified in Oregon hospitals, in contrast to the 47.8 predicted by NHSN.
The SIR for Oregon in 2013 is 26 ÷ 47.8 = 0.54.
In 2013, 46% less SSIs associated with CBGB procedures were identified in Oregon hospitals than the national experience.
Figure 6. Oregon CBGB SSI SIRs for calendar years 2009 through 2013.
27
Table 7 and Figure 7 show that in 2013, 14 hospitals reported the SSI measurement for CBGB procedures. Ten (71%) hospitals reported at least one CBGB SSI and 4 (29%) hospitals reported zero CBGB SSIs. One hospital had an SIR statistically lower than the national baseline.
Table 7. Oregon CBGB observed and expected number of SSIs with associated SIR for calendar year 2013 by hospital.
Hospital NameObserved #
of CBGBsExpected # of CBGBs
Adventist Medical Center 1 1.66 0.60 ▼Asante Rogue Regional Medical Center 3 5.00 0.60 ▼Good Samaritan Regional Medical Center 0 3.11 0.00 ▼Kaiser Permanente Sunnyside Medical Center 0 3.68 0.00 ▼Legacy Emanuel Medical Center 0 1.23 0.00 ▼Legacy Good Samaritan Medical Center 1 2.37 0.42 ▼McKenzie-Willamette Medical Center 1 2.07 0.48 ▼Oregon Health & Science University 3 4.96 0.61 ▼Providence Portland Medical Center 5 2.46 2.04 ▲Providence St. Vincent Medical Center 7 7.07 0.99 ▼Sacred Heart Medical Center - Riverbend 1 5.10 0.20 ▼Salem Hospital 2 5.71 0.35 ▼St. Charles Medical Center - Bend 2 2.54 0.79 ▼Tuality Community Hospital 0 0.57 0.00 ▼
CBGB SIR
Coronary Artery Bypass Graft Surgical Site Infections (CBGB) 2013
▼▼▲▲-- No SIR calculated because the expected number of infections is < 1 and facil ity had at least one infection in 2013
Footnote 2: NHSN does not calculate an SIR for hospitals whose expected number of infections is < 1.
SIR is < 1.0 and is less than the national baseline
SIR is ≤ 1.0 and is no different than the national baseline or facil ity had 0 CBGBs
SIR is > 1.0 and is no different than the national baseline
SIR is > 1.0 and is greater than the national baseline
Footnote 1: The expected number of CBGBs is a prediction based on the national HAI experience for all hospitals reporting to NHSN. The observed number is the total number of CBGBs identified during 2013. The SIR = Observed ÷ Expected. It is better to have a lower SIR.

28
Figure 7. Oregon CBGB SSI SIRs for calendar year 2013.

29
Oregon had 9 hospitals with CBGB SSI SIRs trending downward from 2009–2013. Five hospitals have SIRs trending upward.
Table 8. Oregon SIR values for CBGB SSIs for calendar years 2009 through 2013 by hospital.
Hospital Name 2009 2010 2011 2012 2013Percent
difference Trend
Adventist Medical Center Exempt Exempt 0.00 0.00 0.60 --
Asante Rogue Regional Medical Center 0.30 1.31 0.82 0.41 0.60 99%
Good Samaritan Regional Medical Center 0.94 0.61 0.56 0.33 0.00 -100%
Kaiser Permanente Sunnyside Medical Center 0.19 0.13 0.42 0.21 0.00 -100%
Legacy Emanuel Medical Center 1.54 0.00 0.00 0.80 0.00 -100%
Legacy Good Samaritan Medical Center 1.07 0.55 0.98 0.00 0.42 -60%
McKenzie-Willamette Medical Center 1.16 0.41 0.69 0.00 0.48 -58%
Oregon Health & Science University 1.24 1.52 1.55 1.18 0.61 -51%
Providence Portland Medical Center 0.00 0.00 0.00 0.00 2.04 --
Providence St. Vincent Medical Center 0.66 0.63 0.38 0.75 0.99 51%
Sacred Heart Medical Center - Riverbend 0.30 0.59 0.92 0.19 0.20 -34%
Salem Hospital 0.13 0.30 0.25 0.33 0.35 176%
St. Charles Medical Center - Bend 1.45 0.77 0.00 1.17 0.79 -46%
Tuality Community Hospital 1.84 * * 0.00 0.00 -100%
* Expected number of infections <1 with no SIR calculated
SIRCBGB SSI Standardized Infection Ratio (2009–2013)
30
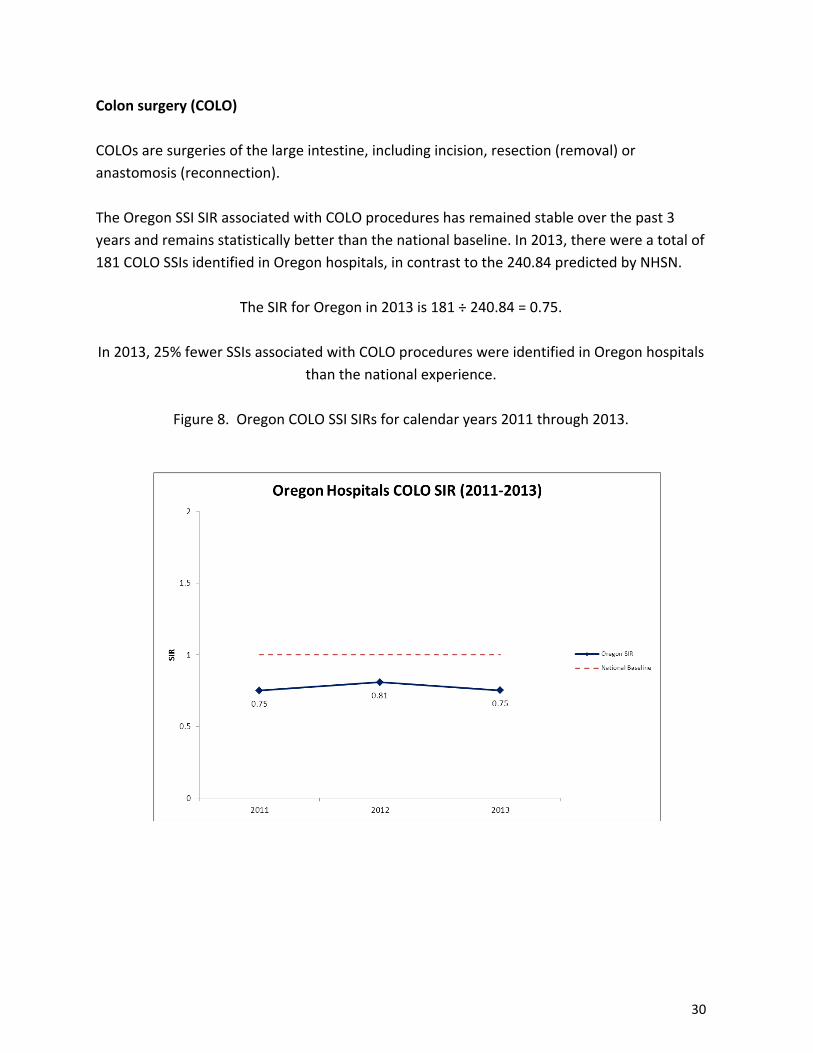
Colon surgery (COLO) COLOs are surgeries of the large intestine, including incision, resection (removal) or anastomosis (reconnection). The Oregon SSI SIR associated with COLO procedures has remained stable over the past 3 years and remains statistically better than the national baseline. In 2013, there were a total of 181 COLO SSIs identified in Oregon hospitals, in contrast to the 240.84 predicted by NHSN.
The SIR for Oregon in 2013 is 181 ÷ 240.84 = 0.75.
In 2013, 25% fewer SSIs associated with COLO procedures were identified in Oregon hospitals than the national experience.
Figure 8. Oregon COLO SSI SIRs for calendar years 2011 through 2013.
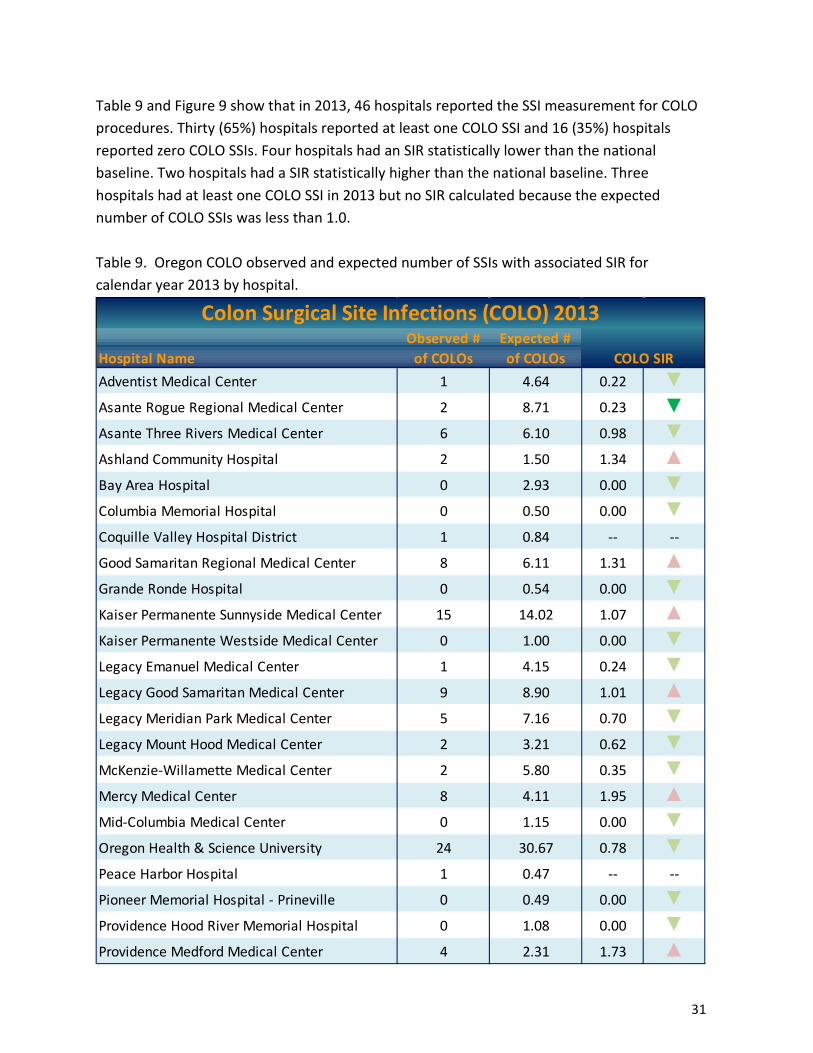
31
Table 9 and Figure 9 show that in 2013, 46 hospitals reported the SSI measurement for COLO procedures. Thirty (65%) hospitals reported at least one COLO SSI and 16 (35%) hospitals reported zero COLO SSIs. Four hospitals had an SIR statistically lower than the national baseline. Two hospitals had a SIR statistically higher than the national baseline. Three hospitals had at least one COLO SSI in 2013 but no SIR calculated because the expected number of COLO SSIs was less than 1.0. Table 9. Oregon COLO observed and expected number of SSIs with associated SIR for calendar year 2013 by hospital.
Hospital NameObserved #
of COLOsExpected # of COLOs
Adventist Medical Center 1 4.64 0.22 ▼Asante Rogue Regional Medical Center 2 8.71 0.23 ▼Asante Three Rivers Medical Center 6 6.10 0.98 ▼Ashland Community Hospital 2 1.50 1.34 ▲Bay Area Hospital 0 2.93 0.00 ▼Columbia Memorial Hospital 0 0.50 0.00 ▼Coquille Valley Hospital District 1 0.84 -- --
Good Samaritan Regional Medical Center 8 6.11 1.31 ▲Grande Ronde Hospital 0 0.54 0.00 ▼Kaiser Permanente Sunnyside Medical Center 15 14.02 1.07 ▲Kaiser Permanente Westside Medical Center 0 1.00 0.00 ▼Legacy Emanuel Medical Center 1 4.15 0.24 ▼Legacy Good Samaritan Medical Center 9 8.90 1.01 ▲Legacy Meridian Park Medical Center 5 7.16 0.70 ▼Legacy Mount Hood Medical Center 2 3.21 0.62 ▼McKenzie-Willamette Medical Center 2 5.80 0.35 ▼Mercy Medical Center 8 4.11 1.95 ▲Mid-Columbia Medical Center 0 1.15 0.00 ▼Oregon Health & Science University 24 30.67 0.78 ▼Peace Harbor Hospital 1 0.47 -- --
Pioneer Memorial Hospital - Prineville 0 0.49 0.00 ▼Providence Hood River Memorial Hospital 0 1.08 0.00 ▼Providence Medford Medical Center 4 2.31 1.73 ▲
Colon Surgical Site Infections (COLO) 2013
COLO SIR

32
Hospital NameObserved #
of COLOsExpected # of COLOs
Providence Milwaukie Hospital 4 2.08 1.92 ▲Providence Newberg Medical Center 2 1.63 1.23 ▲Providence Portland Medical Center 10 19.28 0.52 ▼Providence Seaside Hospital 0 0.09 0.00 ▼Providence St. Vincent Medical Center 25 24.07 1.04 ▲Providence Willamette Falls Medical Center 0 1.99 0.00 ▼Sacred Heart Medical Center - Riverbend 12 20.88 0.58 ▼Salem Hospital 10 21.75 0.46 ▼Samaritan Albany General Hospital 6 1.86 3.15 ▲Samaritan Lebanon Community Hospital 0 1.21 0.00 ▼Samaritan Pacific Communities Hospital 1 1.33 0.75 ▼Santiam Memorial Hospital 0 1.57 0.00 ▼Silverton Hospital 0 2.55 0.00 ▼Sky Lakes Medical Center 0 2.95 0.00 ▼St. Alphonsus Medical Center - Ontario 2 1.37 1.46 ▲St. Anthony Hospital 0 0.99 0.00 ▼St. Charles Medical Center - Bend 4 8.37 0.48 ▼St. Charles Medical Center - Madras 0 0.20 0.00 ▼St. Charles Medical Center - Redmond 2 3.18 0.63 ▼Tillamook County Hospital 0 0.73 0.00 ▼Tuality Community Hospital 1 2.04 0.49 ▼Wallowa Memorial Hospital 1 0.47 -- --
Willamette Valley Medical Center 6 2.09 2.87 ▲
Colon Surgical Site Infections (COLO) 2013
COLO SIR
▼▼▲▲-- No SIR calculated because the expected number of infections is < 1 and facil ity had at least one infection in 2013
Footnote 1: The expected number of COLOs is a prediction based on the national HAI experience for all hospitals reporting to NHSN. The observed number is the total number of COLOs identified during 2013. The SIR = Observed ÷ Expected. It is better to have a lower SIR.
SIR is < 1.0 and is less than the national baseline
SIR is ≤ 1.0 and is no different than the national baseline or facil ity had 0 COLOs
SIR is > 1.0 and is no different than the national baseline
SIR is > 1.0 and is greater than the national baseline
Footnote 2: NHSN does not calculate an SIR for hospitals whose expected number of infections is < 1.

33
Figure 9. Oregon CO
LO SSI SIRs for calendar year 2013.

34
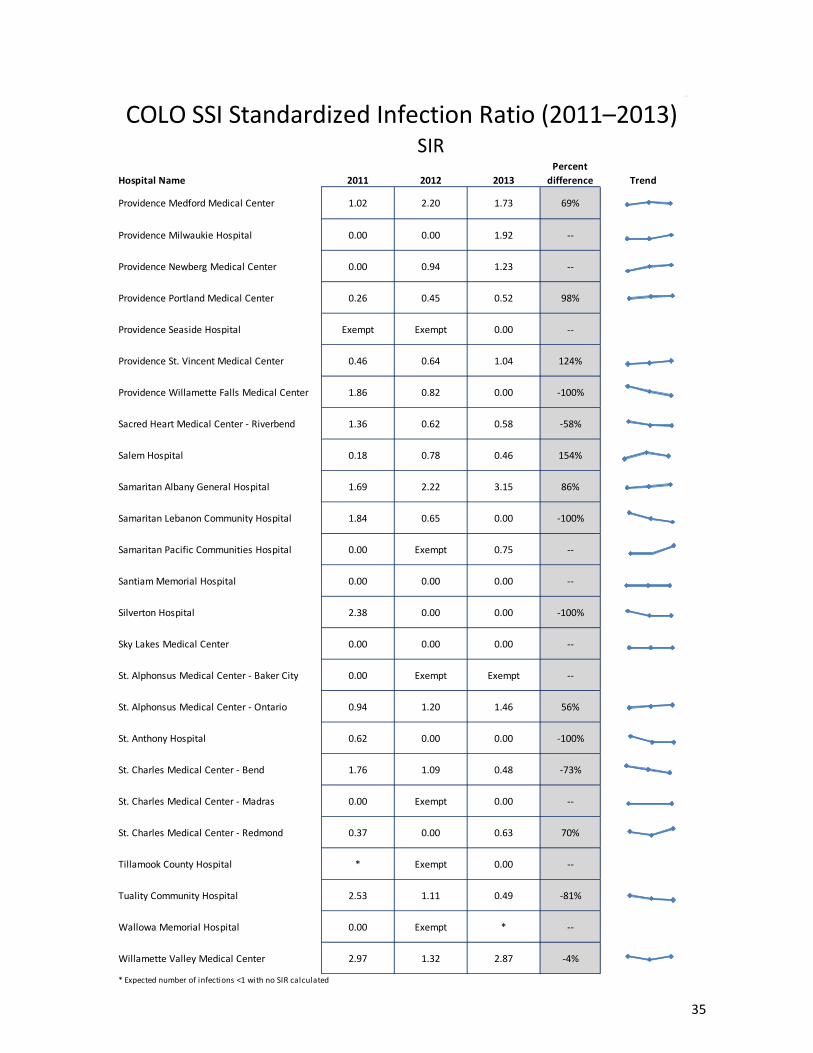
Oregon had 16 hospitals with COLO SSI SIRs trending downward from 2011–2013. A total of 18 hospitals have SIRs that have trended upward. Six hospitals reported zero COLO SSIs between 2011–2013.
Table 10. Oregon SIR values for COLO SSIs for calendar years 2011 through 2013 by hospital.
Hospital Name 2011 2012 2013Percent
difference Trend
Adventist Medical Center 0.00 0.00 0.22 --
Asante Rogue Regional Medical Center 0.31 0.70 0.23 -24%
Asante Three Rivers Medical Center 0.91 0.87 0.98 8%
Ashland Community Hospital 1.41 3.72 1.34 -5%
Bay Area Hospital 1.71 1.61 0.00 -100%
Blue Mountain Hospital 0.00 0.00 Exempt --
Columbia Memorial Hospital 0.00 Exempt 0.00 --
Coquille Valley Hospital 0.00 Exempt * --
Good Samaritan Regional Medical Center 0.73 1.11 1.31 79%
Good Shepherd Medical Center 0.00 Exempt Exempt --
Grande Ronde Hospital 1.79 2.65 0.00 -100%
Kaiser Permanente Sunnyside Medical Center 0.65 1.11 1.07 64%
Kaiser Permanente Westside Medical Center Exempt Exempt 0.00 --
Legacy Emanuel Medical Center 0.27 0.87 0.24 -11%
Legacy Good Samaritan Medical Center 0.99 0.76 1.01 2%
Legacy Meridian Park Medical Center 0.71 0.65 0.70 -1%
Legacy Mount Hood Medical Center 0.24 1.24 0.62 155%
Lower Umpqua Hospital District 0.00 Exempt Exempt --
McKenzie-Willamette Medical Center 0.60 0.00 0.35 -43%
Mercy Medical Center 0.96 2.02 1.95 102%
Mid-Columbia Medical Center 0.66 0.00 0.00 -100%
Oregon Health & Science University 0.68 0.79 0.78 16%
Peace Harbor Hospital * 4.61 * --
Pioneer Memorial Hospital - Prineville 0.00 Exempt 0.00 --
Providence Hood River Memorial Hospital * Exempt 0.00 --
COLO SSI Standardized Infection Ratio (2011–2013)SIR
35
Hospital Name 2011 2012 2013Percent
difference Trend
Providence Medford Medical Center 1.02 2.20 1.73 69%
Providence Milwaukie Hospital 0.00 0.00 1.92 --
Providence Newberg Medical Center 0.00 0.94 1.23 --
Providence Portland Medical Center 0.26 0.45 0.52 98%
Providence Seaside Hospital Exempt Exempt 0.00 --
Providence St. Vincent Medical Center 0.46 0.64 1.04 124%
Providence Willamette Falls Medical Center 1.86 0.82 0.00 -100%
Sacred Heart Medical Center - Riverbend 1.36 0.62 0.58 -58%
Salem Hospital 0.18 0.78 0.46 154%
Samaritan Albany General Hospital 1.69 2.22 3.15 86%
Samaritan Lebanon Community Hospital 1.84 0.65 0.00 -100%
Samaritan Pacific Communities Hospital 0.00 Exempt 0.75 --
Santiam Memorial Hospital 0.00 0.00 0.00 --
Silverton Hospital 2.38 0.00 0.00 -100%
Sky Lakes Medical Center 0.00 0.00 0.00 --
St. Alphonsus Medical Center - Baker City 0.00 Exempt Exempt --
St. Alphonsus Medical Center - Ontario 0.94 1.20 1.46 56%
St. Anthony Hospital 0.62 0.00 0.00 -100%
St. Charles Medical Center - Bend 1.76 1.09 0.48 -73%
St. Charles Medical Center - Madras 0.00 Exempt 0.00 --
St. Charles Medical Center - Redmond 0.37 0.00 0.63 70%
Tillamook County Hospital * Exempt 0.00 --
Tuality Community Hospital 2.53 1.11 0.49 -81%
Wallowa Memorial Hospital 0.00 Exempt * --
Willamette Valley Medical Center 2.97 1.32 2.87 -4%
* Expected number of infections <1 with no SIR calculated
COLO SSI Standardized Infection Ratio (2011–2013)SIR

36
Hip prosthesis (HPRO) HPROs are surgeries where all or part of a diseased hip joint is removed and replaced with an artificial joint. The Oregon HPRO SIR has decreased by 41% over the past 3 years and is currently statistically better than the national baseline. In 2013, there were a total of 67 HPRO SSIs identified in Oregon hospitals, in contrast to the 100.4 predicted by NHSN.
The SIR for Oregon in 2013 is 67 ÷ 100.4 = 0.67.
In 2013, Oregon had 33% less SSIs associated with HPRO procedures than the national experience.
Figure 10. Oregon HPRO SSI SIRs for calendar years 2011 through 2013.

37
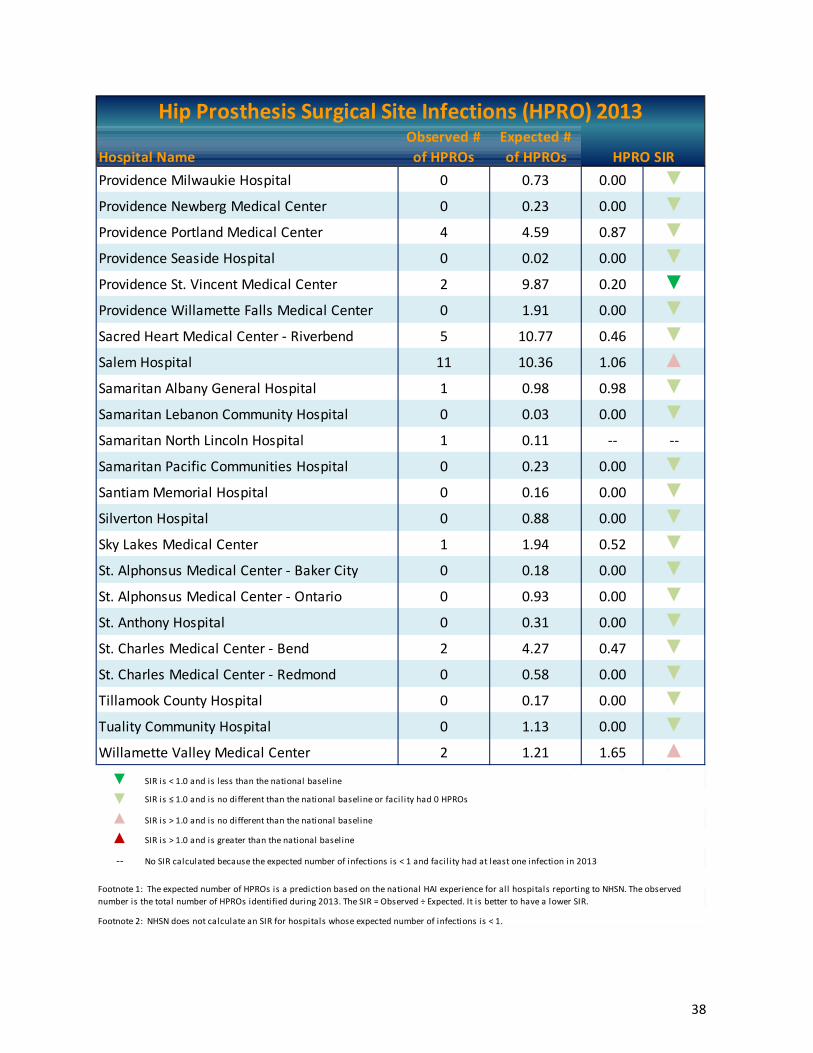
Table 11 and Figure 11 show in 2013, 47 hospitals reported the SSI measurement for HPRO procedures. Twenty-seven (57%) hospitals reported at least one HPRO SSI and 20 (43%) hospitals reported zero HPRO SSIs. One hospital had an SIR statistically lower than the national baseline. Seven hospitals had at least one HPRO SSI in 2013 but had no SIR calculated because the expected number of HPRO SSIs was less than 1.0. Table 11. Oregon HPRO observed and expected number of SSIs with associated SIR for calendar year 2013 by hospital.
Hospital NameObserved # of HPROs
Expected # of HPROs
Adventist Medical Center 2 3.17 0.63 ▼Asante Rogue Regional Medical Center 3 3.61 0.83 ▼Asante Three Rivers Medical Center 1 2.92 0.34 ▼Ashland Community Hospital 0 0.48 0.00 ▼Bay Area Hospital 1 1.70 0.59 ▼Columbia Memorial Hospital 1 0.10 -- --
Coquille Valley Hospital District 0 0.17 0.00 ▼Good Samaritan Regional Medical Center 0 3.80 0.00 ▼Good Shepherd Medical Center 1 0.88 -- --
Grande Ronde Hospital 1 0.19 -- --
Kaiser Permanente Sunnyside Medical Center 6 4.56 1.32 ▲Kaiser Permanente Westside Medical Center 2 2.78 0.72 ▼Legacy Emanuel Medical Center 1 0.80 -- --
Legacy Good Samaritan Medical Center 4 4.02 1.00 ▼Legacy Meridian Park Medical Center 2 4.30 0.47 ▼Legacy Mount Hood Medical Center 0 1.29 0.00 ▼McKenzie-Willamette Medical Center 1 1.98 0.51 ▼Mercy Medical Center 1 1.51 0.66 ▼Mid-Columbia Medical Center 1 0.52 -- --
Oregon Health & Science University 7 6.96 1.01 ▲Peace Harbor Hospital 1 0.40 -- --
Pioneer Memorial Hospital - Prineville 0 0.04 0.00 ▼Providence Hood River Memorial Hospital 0 0.52 0.00 ▼Providence Medford Medical Center 2 2.01 1.00 ▼
HPRO SIR
Hip Prosthesis Surgical Site Infections (HPRO) 2013
38
Hospital NameObserved # of HPROs
Expected # of HPROs
Providence Milwaukie Hospital 0 0.73 0.00 ▼Providence Newberg Medical Center 0 0.23 0.00 ▼Providence Portland Medical Center 4 4.59 0.87 ▼Providence Seaside Hospital 0 0.02 0.00 ▼Providence St. Vincent Medical Center 2 9.87 0.20 ▼Providence Willamette Falls Medical Center 0 1.91 0.00 ▼Sacred Heart Medical Center - Riverbend 5 10.77 0.46 ▼Salem Hospital 11 10.36 1.06 ▲Samaritan Albany General Hospital 1 0.98 0.98 ▼Samaritan Lebanon Community Hospital 0 0.03 0.00 ▼Samaritan North Lincoln Hospital 1 0.11 -- --
Samaritan Pacific Communities Hospital 0 0.23 0.00 ▼Santiam Memorial Hospital 0 0.16 0.00 ▼Silverton Hospital 0 0.88 0.00 ▼Sky Lakes Medical Center 1 1.94 0.52 ▼St. Alphonsus Medical Center - Baker City 0 0.18 0.00 ▼St. Alphonsus Medical Center - Ontario 0 0.93 0.00 ▼St. Anthony Hospital 0 0.31 0.00 ▼St. Charles Medical Center - Bend 2 4.27 0.47 ▼St. Charles Medical Center - Redmond 0 0.58 0.00 ▼Tillamook County Hospital 0 0.17 0.00 ▼Tuality Community Hospital 0 1.13 0.00 ▼Willamette Valley Medical Center 2 1.21 1.65 ▲
Hip Prosthesis Surgical Site Infections (HPRO) 2013
HPRO SIR
▼▼▲▲-- No SIR calculated because the expected number of infections is < 1 and facil ity had at least one infection in 2013
SIR is < 1.0 and is less than the national baseline
SIR is ≤ 1.0 and is no different than the national baseline or facil ity had 0 HPROs
SIR is > 1.0 and is no different than the national baseline
SIR is > 1.0 and is greater than the national baseline
Footnote 1: The expected number of HPROs is a prediction based on the national HAI experience for all hospitals reporting to NHSN. The observed number is the total number of HPROs identified during 2013. The SIR = Observed ÷ Expected. It is better to have a lower SIR.
Footnote 2: NHSN does not calculate an SIR for hospitals whose expected number of infections is < 1.
39
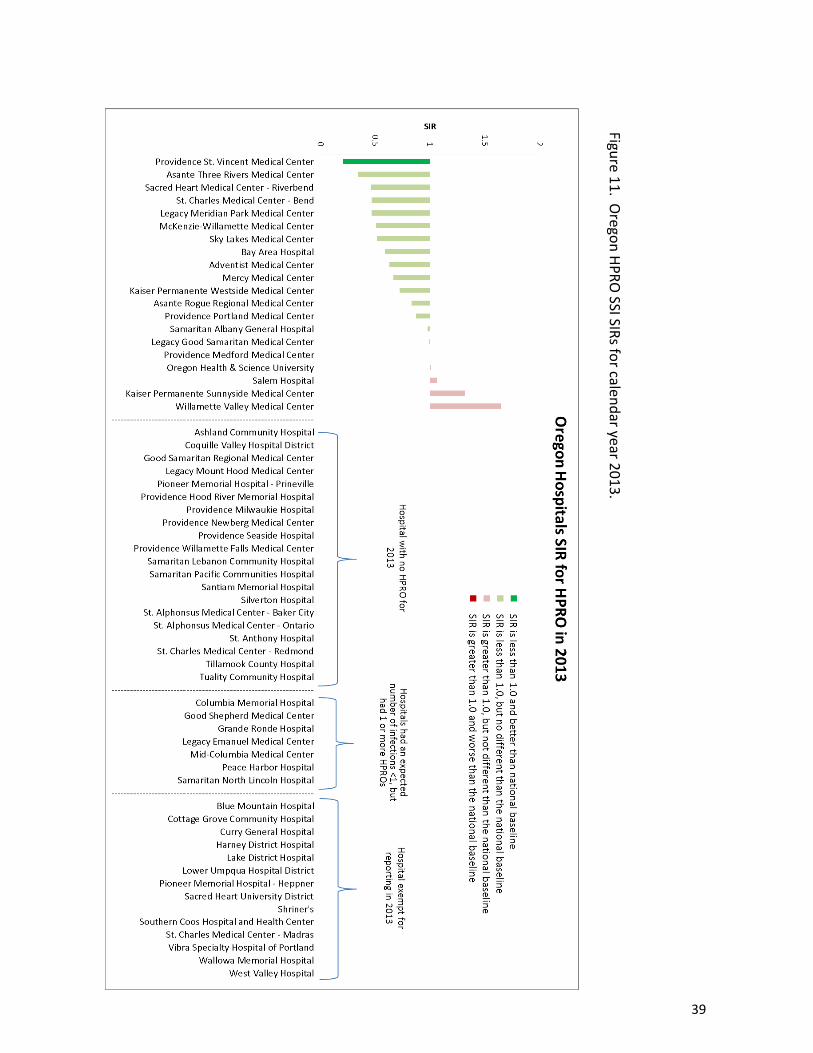
Figure 11. Oregon HPRO
SSI SIRs for calendar year 2013.
40
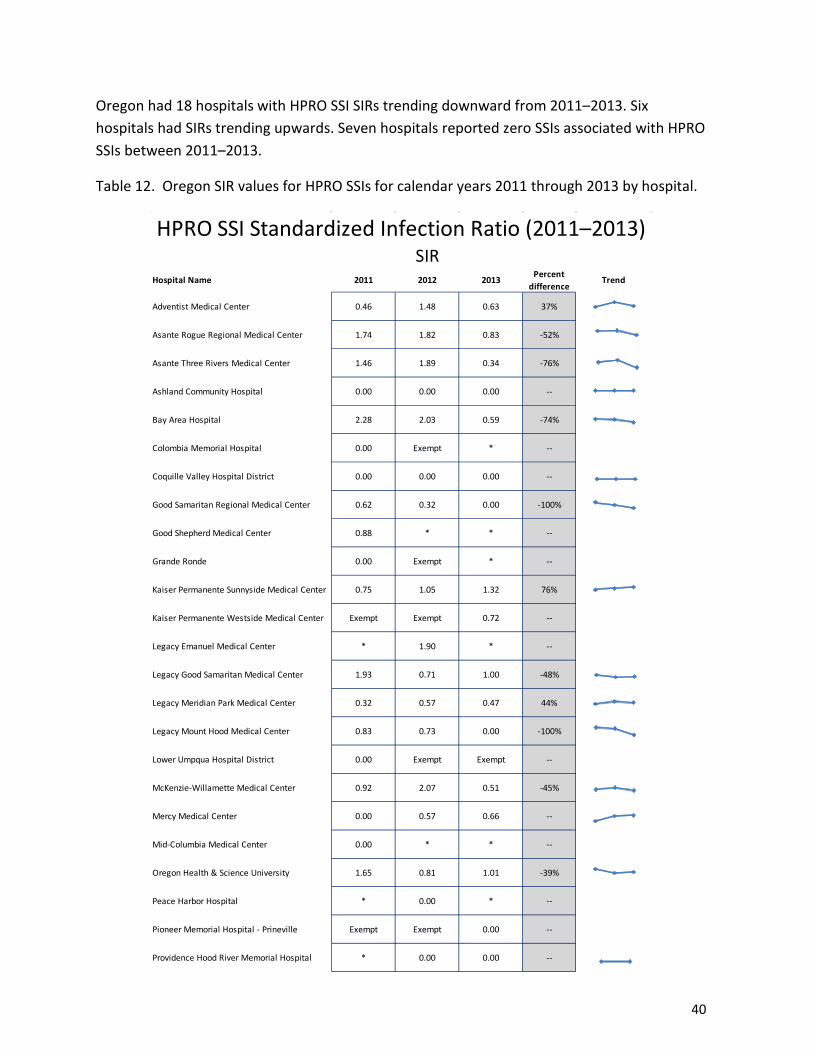
Oregon had 18 hospitals with HPRO SSI SIRs trending downward from 2011–2013. Six hospitals had SIRs trending upwards. Seven hospitals reported zero SSIs associated with HPRO SSIs between 2011–2013.
Table 12. Oregon SIR values for HPRO SSIs for calendar years 2011 through 2013 by hospital.
Hospital Name 2011 2012 2013 Percent difference
Trend
Adventist Medical Center 0.46 1.48 0.63 37%
Asante Rogue Regional Medical Center 1.74 1.82 0.83 -52%
Asante Three Rivers Medical Center 1.46 1.89 0.34 -76%
Ashland Community Hospital 0.00 0.00 0.00 --
Bay Area Hospital 2.28 2.03 0.59 -74%
Colombia Memorial Hospital 0.00 Exempt * --
Coquille Valley Hospital District 0.00 0.00 0.00 --
Good Samaritan Regional Medical Center 0.62 0.32 0.00 -100%
Good Shepherd Medical Center 0.88 * * --
Grande Ronde 0.00 Exempt * --
Kaiser Permanente Sunnyside Medical Center 0.75 1.05 1.32 76%
Kaiser Permanente Westside Medical Center Exempt Exempt 0.72 --
Legacy Emanuel Medical Center * 1.90 * --
Legacy Good Samaritan Medical Center 1.93 0.71 1.00 -48%
Legacy Meridian Park Medical Center 0.32 0.57 0.47 44%
Legacy Mount Hood Medical Center 0.83 0.73 0.00 -100%
Lower Umpqua Hospital District 0.00 Exempt Exempt --
McKenzie-Willamette Medical Center 0.92 2.07 0.51 -45%
Mercy Medical Center 0.00 0.57 0.66 --
Mid-Columbia Medical Center 0.00 * * --
Oregon Health & Science University 1.65 0.81 1.01 -39%
Peace Harbor Hospital * 0.00 * --
Pioneer Memorial Hospital - Prineville Exempt Exempt 0.00 --
Providence Hood River Memorial Hospital * 0.00 0.00 --
HPRO SSI Standardized Infection Ratio (2011–2013)SIR

41
Hospital Name 2011 2012 2013 Percent difference
Trend
Providence Medford Medical Center * 1.25 1.00 -20%
Providence Milwaukie Hospital 2.43 * 0.00 -100%
Providence Newberg Medical Center * 0.00 0.00 --
Providence Portland Medical Center 0.60 1.40 0.87 45%
Providence Seaside Medical Center 0.00 Exempt 0.00 --
Providence St. Vincent Medical Center 0.45 0.49 0.20 -55%
Providence Willamette Falls Medical Center 1.69 2.19 0.00 -100%
Sacred Heart Medical Center - Riverbend 0.52 1.07 0.46 -10%
Salem Hospital 1.46 1.02 1.06 -27%
Samaritan Albany General Hospital 0.91 0.80 0.98 7%
Samaritan Lebanon Community Hospital * Exempt 0.00 --
Samaritan North Lincoln Hospital 0.00 Exempt * --
Samaritan Pacific Communities Hospital 0.00 Exempt 0.00 --
Santiam Memorial Hospital 0.00 Exempt 0.00 --
Silverton Hospital * * 0.00 --
Sky Lakes Medical Center 0.74 1.19 0.52 -30%
St. Alphonsus Medical Center - Baker City 0.00 * 0.00 --
St. Alphonsus Medical Center - Ontario * 0.00 0.00 --
St. Anthony Hospital 0.00 0.00 0.00 --
St. Charles Medical Center - Bend 1.28 1.70 0.47 -63%
St. Charles Medical Center - Madras Exempt 0.00 Exempt
St. Charles Medical Center - Redmond * 0.00 0.00 --
Tillamook County Hospital * Exempt 0.00 --
Tuality Community Hospital 1.65 1.50 0.00 -100%
Willamette Valley Medical Center 2.79 0.74 1.65 -41%
* Expected number of infections <1 with no SIR calculated
HPRO SSI Standardized Infection Ratio (2011–2013)SIR

42
Abdominal hysterectomy (HYST) HYSTs are surgeries in which the uterus is removed through an incision in the lower abdomen. They may include removal of one or both ovaries and fallopian tubes. The Oregon SSI SIR associated with HYST procedures has increased 18% over the last 3 years and is currently statistically no different than the national baseline. In 2011 and 2012, the SIR for HYST SSIs was statistically better than the national baseline. In 2013, there were a total of 46 HYST SSIs identified in Oregon hospitals, in contrast to the 58.0 predicted by NHSN.
The SIR for Oregon in 2013 is 46 ÷ 58.0 = 0.79.
In 2013, Oregon had 21% fewer SSIs associated with HYST procedures than the national experience.
Figure 12. Oregon HYST SSI SIRs for calendar years 2011 through 2013.

43
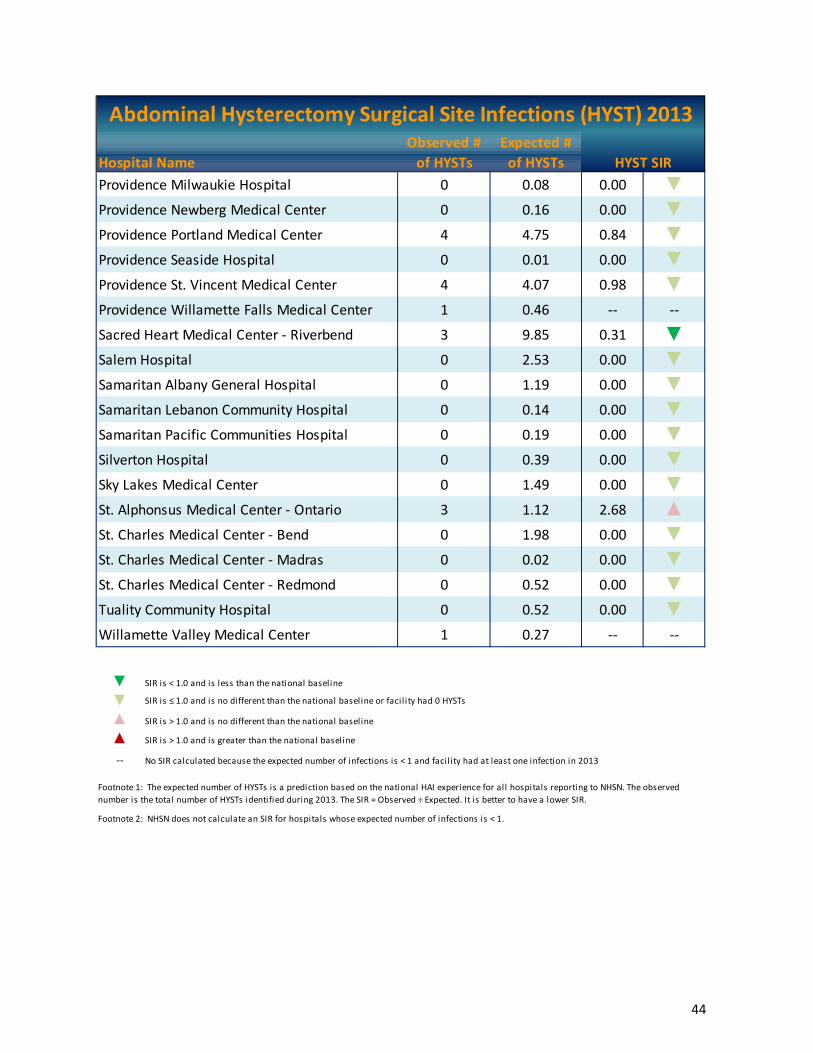
Table 13 and Figure 13 show that in 2013, 39 hospitals reported the SSI measurement for HYST procedures. Sixteen (41%) hospitals reported at least one HYST SSI and 23 (59%) hospitals reported zero HYST SSIs. One hospital had an SIR statistically lower than the national baseline and one hospital had an SIR statistically greater than the national baseline. Six hospitals had no SIR calculated because the expected number of HYST SSIs was less than 1.0, but did have at least one HYST SSI in 2013. Table 13. Oregon HYST observed and expected number of SSIs with associated SIR for calendar year 2013 by hospital.
Hospital NameObserved #
of HYSTsExpected #
of HYSTsAdventist Medical Center 1 1.99 0.50 ▼Asante Rogue Regional Medical Center 2 1.01 1.99 ▲Asante Three Rivers Medical Center 0 0.36 0.00 ▼Bay Area Hospital 0 0.54 0.00 ▼Columbia Memorial Hospital 0 0.20 0.00 ▼Good Samaritan Regional Medical Center 0 1.36 0.00 ▼Grande Ronde Hospital 1 0.28 -- --
Kaiser Permanente Sunnyside Medical Center 14 7.83 1.79 ▲Kaiser Permanente Westside Medical Center 3 0.77 -- --
Legacy Emanuel Medical Center 1 1.76 0.57 ▼Legacy Good Samaritan Medical Center 0 3.30 0.00 ▼Legacy Meridian Park Medical Center 0 0.77 0.00 ▼Legacy Mount Hood Medical Center 1 1.29 0.78 ▼McKenzie-Willamette Medical Center 1 0.89 -- --
Mercy Medical Center 2 0.83 -- --
Mid-Columbia Medical Center 0 0.29 0.00 ▼Oregon Health & Science University 4 4.66 0.86 ▼Pioneer Memorial Hospital - Prineville 0 0.04 0.00 ▼Providence Hood River Memorial Hospital 0 0.23 0.00 ▼Providence Medford Medical Center 0 0.31 0.00 ▼
HYST SIR
Abdominal Hysterectomy Surgical Site Infections (HYST) 2013
44
Hospital NameObserved #
of HYSTsExpected #
of HYSTsProvidence Milwaukie Hospital 0 0.08 0.00 ▼Providence Newberg Medical Center 0 0.16 0.00 ▼Providence Portland Medical Center 4 4.75 0.84 ▼Providence Seaside Hospital 0 0.01 0.00 ▼Providence St. Vincent Medical Center 4 4.07 0.98 ▼Providence Willamette Falls Medical Center 1 0.46 -- --
Sacred Heart Medical Center - Riverbend 3 9.85 0.31 ▼Salem Hospital 0 2.53 0.00 ▼Samaritan Albany General Hospital 0 1.19 0.00 ▼Samaritan Lebanon Community Hospital 0 0.14 0.00 ▼Samaritan Pacific Communities Hospital 0 0.19 0.00 ▼Silverton Hospital 0 0.39 0.00 ▼Sky Lakes Medical Center 0 1.49 0.00 ▼St. Alphonsus Medical Center - Ontario 3 1.12 2.68 ▲St. Charles Medical Center - Bend 0 1.98 0.00 ▼St. Charles Medical Center - Madras 0 0.02 0.00 ▼St. Charles Medical Center - Redmond 0 0.52 0.00 ▼Tuality Community Hospital 0 0.52 0.00 ▼Willamette Valley Medical Center 1 0.27 -- --
Abdominal Hysterectomy Surgical Site Infections (HYST) 2013
HYST SIR
▼▼▲▲-- No SIR calculated because the expected number of infections is < 1 and facil ity had at least one infection in 2013
SIR is > 1.0 and is greater than the national baseline
SIR is < 1.0 and is less than the national baseline
SIR is ≤ 1.0 and is no different than the national baseline or facil ity had 0 HYSTs
SIR is > 1.0 and is no different than the national baseline
Footnote 2: NHSN does not calculate an SIR for hospitals whose expected number of infections is < 1.
Footnote 1: The expected number of HYSTs is a prediction based on the national HAI experience for all hospitals reporting to NHSN. The observed number is the total number of HYSTs identified during 2013. The SIR = Observed ÷ Expected. It is better to have a lower SIR.
45
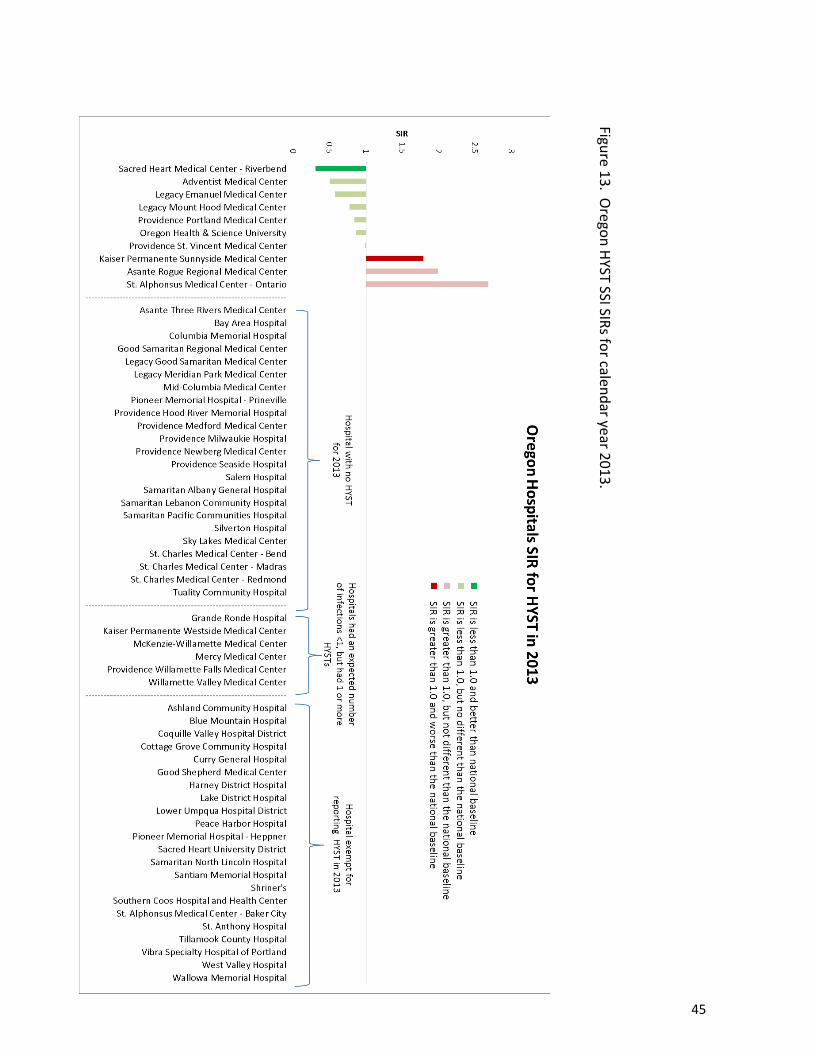
Figure 13. Oregon HYST SSI SIRs for calendar year 2013.
46
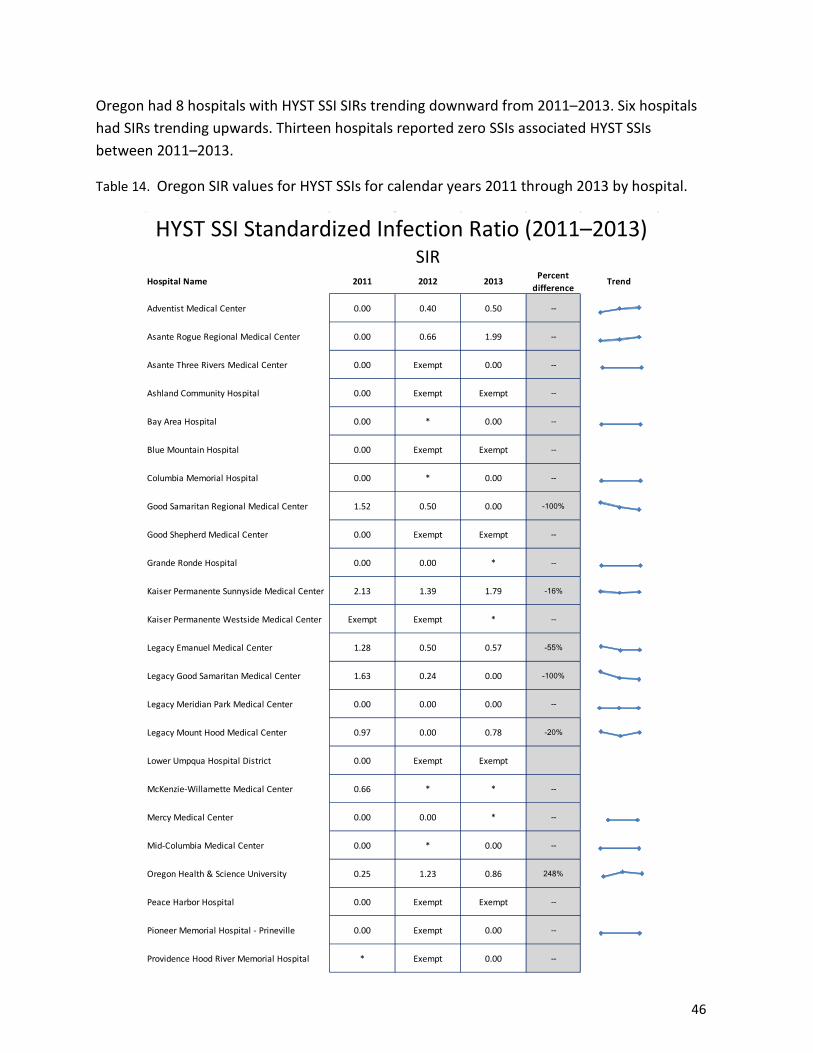
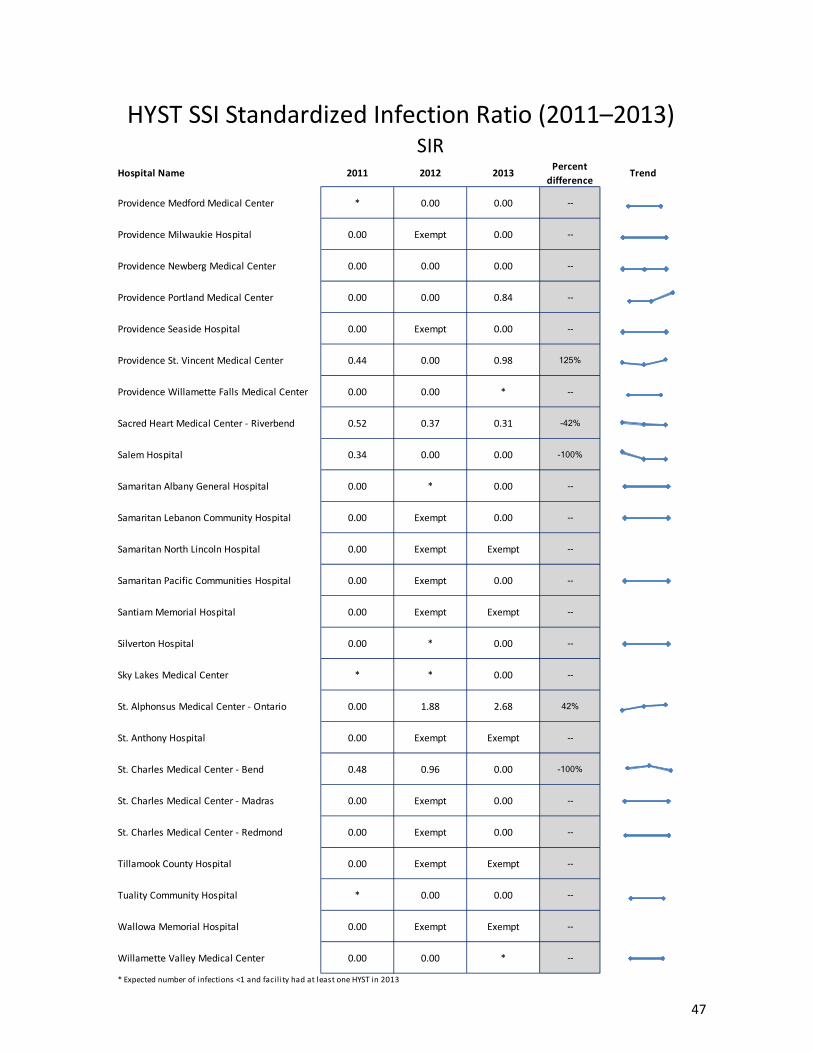
Oregon had 8 hospitals with HYST SSI SIRs trending downward from 2011–2013. Six hospitals had SIRs trending upwards. Thirteen hospitals reported zero SSIs associated HYST SSIs between 2011–2013.
Table 14. Oregon SIR values for HYST SSIs for calendar years 2011 through 2013 by hospital.
Hospital Name 2011 2012 2013 Percent difference
Trend
Adventist Medical Center 0.00 0.40 0.50 --
Asante Rogue Regional Medical Center 0.00 0.66 1.99 --
Asante Three Rivers Medical Center 0.00 Exempt 0.00 --
Ashland Community Hospital 0.00 Exempt Exempt --
Bay Area Hospital 0.00 * 0.00 --
Blue Mountain Hospital 0.00 Exempt Exempt --
Columbia Memorial Hospital 0.00 * 0.00 --
Good Samaritan Regional Medical Center 1.52 0.50 0.00 -100%
Good Shepherd Medical Center 0.00 Exempt Exempt --
Grande Ronde Hospital 0.00 0.00 * --
Kaiser Permanente Sunnyside Medical Center 2.13 1.39 1.79 -16%
Kaiser Permanente Westside Medical Center Exempt Exempt * --
Legacy Emanuel Medical Center 1.28 0.50 0.57 -55%
Legacy Good Samaritan Medical Center 1.63 0.24 0.00 -100%
Legacy Meridian Park Medical Center 0.00 0.00 0.00 --
Legacy Mount Hood Medical Center 0.97 0.00 0.78 -20%
Lower Umpqua Hospital District 0.00 Exempt Exempt
McKenzie-Willamette Medical Center 0.66 * * --
Mercy Medical Center 0.00 0.00 * --
Mid-Columbia Medical Center 0.00 * 0.00 --
Oregon Health & Science University 0.25 1.23 0.86 248%
Peace Harbor Hospital 0.00 Exempt Exempt --
Pioneer Memorial Hospital - Prineville 0.00 Exempt 0.00 --
Providence Hood River Memorial Hospital * Exempt 0.00 --
HYST SSI Standardized Infection Ratio (2011–2013)SIR
47
Hospital Name 2011 2012 2013 Percent difference
Trend
Providence Medford Medical Center * 0.00 0.00 --
Providence Milwaukie Hospital 0.00 Exempt 0.00 --
Providence Newberg Medical Center 0.00 0.00 0.00 --
Providence Portland Medical Center 0.00 0.00 0.84 --
Providence Seaside Hospital 0.00 Exempt 0.00 --
Providence St. Vincent Medical Center 0.44 0.00 0.98 125%
Providence Willamette Falls Medical Center 0.00 0.00 * --
Sacred Heart Medical Center - Riverbend 0.52 0.37 0.31 -42%
Salem Hospital 0.34 0.00 0.00 -100%
Samaritan Albany General Hospital 0.00 * 0.00 --
Samaritan Lebanon Community Hospital 0.00 Exempt 0.00 --
Samaritan North Lincoln Hospital 0.00 Exempt Exempt --
Samaritan Pacific Communities Hospital 0.00 Exempt 0.00 --
Santiam Memorial Hospital 0.00 Exempt Exempt --
Silverton Hospital 0.00 * 0.00 --
Sky Lakes Medical Center * * 0.00 --
St. Alphonsus Medical Center - Ontario 0.00 1.88 2.68 42%
St. Anthony Hospital 0.00 Exempt Exempt --
St. Charles Medical Center - Bend 0.48 0.96 0.00 -100%
St. Charles Medical Center - Madras 0.00 Exempt 0.00 --
St. Charles Medical Center - Redmond 0.00 Exempt 0.00 --
Tillamook County Hospital 0.00 Exempt Exempt --
Tuality Community Hospital * 0.00 0.00 --
Wallowa Memorial Hospital 0.00 Exempt Exempt --
Willamette Valley Medical Center 0.00 0.00 * --
* Expected number of infections <1 and facil ity had at least one HYST in 2013
HYST SSI Standardized Infection Ratio (2011–2013)SIR

48
Knee prosthesis (KPRO) KPROs are surgical procedures to remove damaged cartilage and bone in the knee joint and replace them with an artificial joint. The Oregon SSI SIR associated with KPRO procedures has decreased 16% over the past 5 years and is currently statistically better than the national baseline. In 2013, there were a total of 67 KPRO SSIs identified in Oregon hospitals, in contrast to the 91.0 predicted by NHSN.
The SIR for Oregon in 2013 is 67 ÷ 91.0 = 0.74.
In 2013, Oregon had 26% less SSIs associated with KPRO procedures than the national experience.
Figure 14. Oregon KPRO SSI SIRs for calendar years 2009 through 2013.

49
Table 15 and Figure 15 show that in 2013, 47 hospitals reported the SSI measurement for KPRO procedures. Twenty-five (53%) hospitals reported at least one KPRO SSI and 22 (47%) hospitals reported zero KPRO SSIs. Eight hospitals had least one KPRO SSI in 2013 but no SIR calculated because the expected number of KPRO SSIs was less than 1.0. Table 15. Oregon KPRO observed and expected number of SSIs with associated SIR for calendar year 2013 by hospital.
Hospital NameObserved #
of KPROsExpected # of KPROs
Adventist Medical Center 1 3.01 0.33 ▼Asante Rogue Regional Medical Center 5 4.00 1.25 ▲Asante Three Rivers Medical Center 1 2.15 0.47 ▼Ashland Community Hospital 2 0.74 -- --
Bay Area Hospital 0 1.56 0.00 ▼Columbia Memorial Hospital 0 0.36 0.00 ▼Coquille Valley Hospital District 0 0.64 0.00 ▼Good Samaritan Regional Medical Center 0 2.40 0.00 ▼Good Shepherd Medical Center 2 1.43 1.40 ▲Grande Ronde Hospital 1 0.20 -- --
Kaiser Permanente Sunnyside Medical Center 6 4.81 1.25 ▲Kaiser Permanente Westside Medical Center 7 3.95 1.77 ▲Legacy Emanuel Medical Center 0 0.54 0.00 ▼Legacy Good Samaritan Medical Center 2 2.00 1.00 ▼Legacy Meridian Park Medical Center 2 4.88 0.41 ▼Legacy Mount Hood Medical Center 0 1.18 0.00 ▼McKenzie-Willamette Medical Center 0 3.17 0.00 ▼Mercy Medical Center 3 1.39 2.16 ▲Mid-Columbia Medical Center 0 0.59 0.00 ▼Oregon Health & Science University 2 2.85 0.70 ▼Peace Harbor Hospital 0 0.33 0.00 ▼Providence Hood River Memorial Hospital 0 0.43 0.00 ▼Providence Medford Medical Center 1 1.26 0.79 ▼Providence Milwaukie Hospital 2 0.91 -- --
KPRO SIR
Knee Prosthesis Surgical Site Infections (KPRO) 2013

50
Hospital NameObserved #
of KPROsExpected # of KPROs
Providence Newberg Medical Center 0 0.56 0.00 ▼Providence Portland Medical Center 2 6.07 0.33 ▼Providence Seaside Hospital 0 0.17 0.00 ▼Providence St. Vincent Medical Center 4 4.55 0.88 ▼Providence Willamette Falls Medical Center 3 1.86 1.61 ▲Sacred Heart Medical Center - Riverbend 0 9.76 0.00 ▼Salem Hospital 8 7.35 1.09 ▲Samaritan Albany General Hospital 0 1.84 0.00 ▼Samaritan North Lincoln Hospital 0 0.18 0.00 ▼Samaritan Pacific Communities Hospital 1 0.15 -- --
Santiam Memorial Hospital 0 0.10 0.00 ▼Silverton Hospital 0 0.87 0.00 ▼Sky Lakes Medical Center 0 1.92 0.00 ▼Southern Coos Hospital and Health Center 0 0.01 0.00 ▼St. Alphonsus Medical Center - Baker City 1 0.17 -- --
St. Alphonsus Medical Center - Ontario 0 1.03 0.00 ▼St. Anthony Hospital 2 0.47 -- --
St. Charles Medical Center - Bend 6 6.49 0.92 ▼St. Charles Medical Center - Madras 0 0.05 0.00 ▼St. Charles Medical Center - Redmond 0 0.33 0.00 ▼Tillamook County Hospital 1 0.22 -- --
Tuality Community Hospital 1 1.15 0.87 ▼Willamette Valley Medical Center 1 0.77 -- --
Knee Prosthesis Surgical Site Infections (KPRO) 2013
KPRO SIR
▼▼▲▲-- No SIR calculated because the expected number of infections is < 1 and facil ity had at least one infection in 2013
Footnote 1: The expected number of KPROs is a prediction based on the national HAI experience for all hospitals reporting to NHSN. The observed number is the total number of KPROs identified during 2013. The SIR = Observed ÷ Expected. It is better to have a lower SIR.
Footnote 2: NHSN does not calculate an SIR for hospitals whose expected number of infections is < 1.
SIR is < 1.0 and is less than the national baseline
SIR is ≤ 1.0 and is no different than the national baseline or facil ity had 0 KPROs
SIR is > 1.0 and is no different than the national baseline
SIR is > 1.0 and is greater than the national baseline

51
Figure 15. Oregon KPRO
SSI SIRs for calendar year 2013.

52
Oregon had 8 hospitals with KPRO SIRs trending downward from 2009–2013. Fourteen hospitals had SIRs trending upwards. Nine hospitals reported zero KPRO SSIs between 2009–2013. Table 16. Oregon SIR values for KPRO SSIs for calendar years 2009 through 2013 by hospital.
Hospital Name 2009 2010 2011 2012 2013 Percent difference
Trend
Adventist Medical Center 0.00 0.00 0.00 0.00 0.33 --
Asante Rogue Regional Medical Center 2.83 2.29 0.67 0.96 1.25 -66%
Asante Three Rivers Medical Center 0.00 0.40 0.55 0.86 0.47 --
Ashland Community Hospital 0.00 * * 0.00 * --
Bay Area Hospital 3.68 2.17 0.00 3.47 0.00 -100%
Columbia Memorial Hospital 0.00 0.00 0.00 0.00 0.00 --
Coquille Valley Hospital District 0.00 0.00 0.00 0.00 0.00 --
Curry General Hospital 0.00 * 0.00 Exempt Exempt --
Good Samaritan Regional Medical Center 1.31 1.73 0.44 0.42 0.00 -100%
Good Shepherd Medical Center * 0.76 1.56 0.91 1.40 85%
Grande Ronde Hospital 0.00 0.00 0.00 0.00 * --
Kaiser Permanente Sunnyside Medical Cente 0.54 1.43 1.08 1.40 1.25 132%
Kaiser Permanente Westside Medical Cente Exempt Exempt Exempt Exempt 1.77 --
Legacy Emanuel Medical Center 0.00 0.00 * 0.00 0.00 --
Legacy Good Samaritan Medical Center 0.62 0.62 0.54 0.00 1.00 62%
Legacy Meridian Park Medical Center 2.37 0.84 0.23 0.00 0.41 -83%
Legacy Mount Hood Medical Center * * 0.96 0.84 0.00 -100%
Lower Umpqua Hospital District 0.00 0.00 0.00 0.00 Exempt --
McKenzie-Willamette Medical Center 0.48 1.36 1.17 1.89 0.00 39%
Mercy Medical Center 0.00 0.00 0.82 0.00 2.16 --
Mid-Columbia Medical Center * * 0.00 * 0.00 --
Oregon Health & Science University 1.18 0.00 0.97 0.67 0.70 -40%
Peace Harbor Hospital 0.00 0.00 0.00 0.00 0.00 --
Pioneer Memorial Hospital - Prineville 0.00 Exempt Exempt Exempt Exempt --
Providence Hood River Memorial Hospital * 0.00 * 0.00 0.00 --
KPRO SSI Standardized Infection Ratio (2009–2013)SIR

53
Hospital Name 2009 2010 2011 2012 2013 Percent difference
Trend
Providence Medford Medical Center 0.00 * 0.00 0.80 0.79 0%
Providence Milwaukie Hospital 0.00 * 1.78 * * --
Providence Newberg Medical Center 0.00 0.00 0.00 0.00 0.00 --
Providence Portland Medical Center 0.17 0.16 0.48 1.47 0.33 97%
Providence Seaside Hospital 0.00 * 0.00 Exempt 0.00 --
Providence St. Vincent Medical Center 0.76 1.11 0.79 1.33 0.88 16%
Providence Willamette Falls Medical Center 0.00 0.00 1.44 0.53 1.61 --
Sacred Heart Medical Center - Riverbend 0.85 1.11 1.30 0.83 0.00 -100%
Salem Hospital 0.80 0.37 2.27 1.14 1.09 36%
Samaritan Albany General Hospital 0.00 2.62 0.73 0.00 0.00 --
Samaritan Lebanon Community Hospital * * 0.00 Exempt ND --
Samaritan North Lincoln Hospital * 0.00 0.00 0.00 0.00 --
Samaritan Pacific Communities Hospital 0.00 0.00 0.00 Exempt * --
Santiam Memorial Hospital 0.00 0.00 0.00 Exempt 0.00 --
Silverton Hospital 0.00 * * 1.88 0.00 --
Sky Lakes Medical Center 0.00 0.00 0.00 0.00 0.00 --
Southern Coos Hospital and Health Center 0.00 0.00 0.00 Exempt 0.00 --
St. Alphonsus Medical Center - Baker City * 0.00 * * * --
St. Alphonsus Medical Center - Ontario 0.76 0.00 0.00 2.27 0.00 -100%
St. Anthony Hospital 0.00 0.00 0.00 0.00 * --
St. Charles Medical Center - Bend 0.40 0.57 0.74 1.30 0.92 130%
St. Charles Medical Center - Madras 0.00 Exempt Exempt Exempt 0.00 --
St. Charles Medical Center - Redmond 0.00 0.00 * 0.00 0.00 --
Tillamook County Hospital 0.00 * 0.00 * * --
Tuality Community Hospital 0.00 1.22 0.00 1.51 0.87 --
Willamette Valley Medical Center * 0.00 * * * --
* Expected number of infections <1 with no SIR calculated
KPRO SSI Standardized Infection Ratio (2009–2013)SIR
54
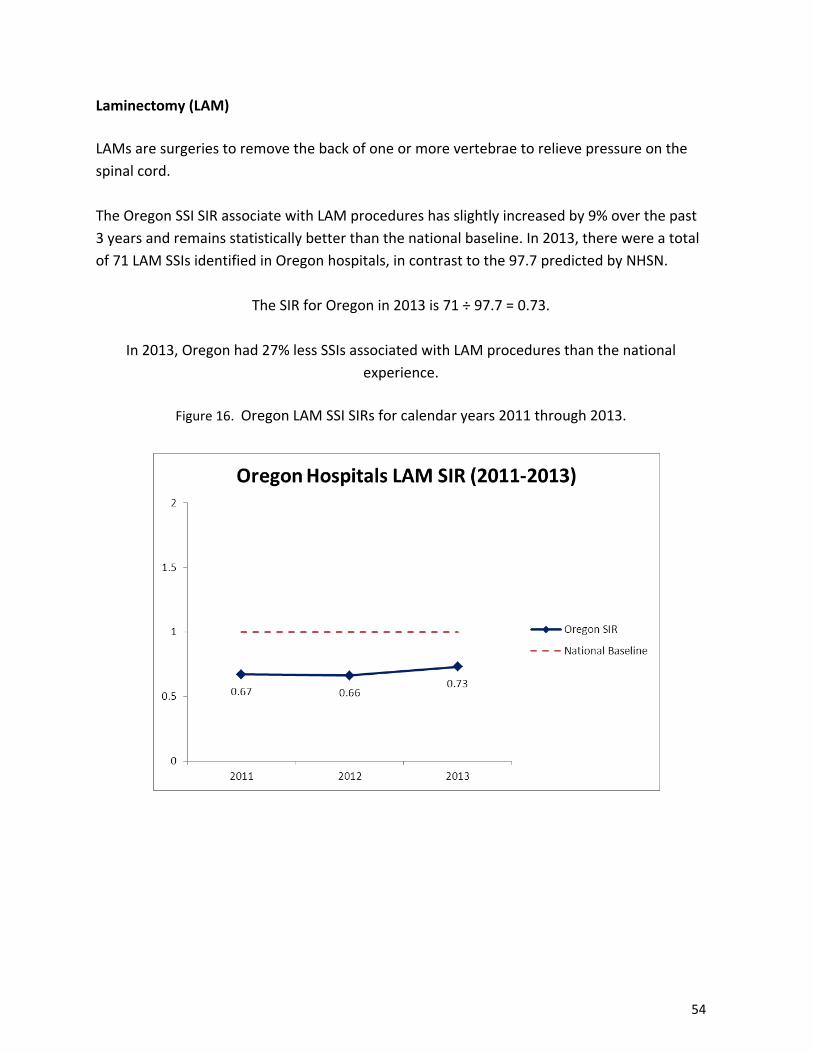
Laminectomy (LAM) LAMs are surgeries to remove the back of one or more vertebrae to relieve pressure on the spinal cord. The Oregon SSI SIR associate with LAM procedures has slightly increased by 9% over the past 3 years and remains statistically better than the national baseline. In 2013, there were a total of 71 LAM SSIs identified in Oregon hospitals, in contrast to the 97.7 predicted by NHSN.
The SIR for Oregon in 2013 is 71 ÷ 97.7 = 0.73.
In 2013, Oregon had 27% less SSIs associated with LAM procedures than the national experience.
Figure 16. Oregon LAM SSI SIRs for calendar years 2011 through 2013.

55
Table 17 and Figure 17 show that in 2013, 23 hospitals reported the SSI measurement for LAM procedures. Seventeen (74%) hospitals reported at least one LAM SSI and 6 (26%) hospitals reported zero LAM SSIs. One hospital had an SIR statistically lower than the national baseline. Three hospitals had at least one LAM SSI but no SIR calculated for 2013 because the expected number of LAM SSIs was less than 1.0. Table 17. Oregon LAM observed and expected number of SSIs with associated SIR for calendar year 2013 by hospital.
Hospital NameObserved #
of LAMsExpected #
of LAMsAdventist Medical Center 0 2.96 0.00 ▼Asante Rogue Regional Medical Center 1 3.30 0.30 ▼Ashland Community Hospital 1 0.53 -- --
Bay Area Hospital 1 0.82 -- --
Good Samaritan Regional Medical Center 3 2.46 1.22 ▲Kaiser Permanente Sunnyside Medical Center 7 7.58 0.92 ▼Legacy Emanuel Medical Center 1 4.23 0.24 ▼Legacy Good Samaritan Medical Center 0 2.84 0.00 ▼Legacy Meridian Park Medical Center 2 5.45 0.37 ▼Legacy Mount Hood Medical Center 0 3.34 0.00 ▼McKenzie-Willamette Medical Center 3 4.93 0.61 ▼Mercy Medical Center 1 0.28 -- --
Oregon Health & Science University 8 9.27 0.86 ▼Providence Medford Medical Center 3 2.96 1.02 ▲Providence Portland Medical Center 11 7.16 1.54 ▲Providence St. Vincent Medical Center 1 7.79 0.13 ▼Providence Willamette Falls Medical Center 0 0.40 0.00 ▼Sacred Heart Medical Center - Riverbend 11 14.19 0.78 ▼Salem Hospital 5 4.90 1.02 ▲Sky Lakes Medical Center 0 1.51 0.00 ▼St. Charles Medical Center - Bend 7 7.61 0.92 ▼Tuality Community Hospital 5 2.69 1.86 ▲Willamette Valley Medical Center 0 0.47 0.00 ▼
LAM SIR
Laminectomy Surgical Site Infections (LAM) 2013
▼▼▲▲-- No SIR calculated because the expected number of infections is < 1 and facil ity had at least one infection in 2013
Footnote 2: NHSN does not calculate an SIR for hospitals whose expected number of infections is < 1.
SIR is > 1.0 and is no different than the national baseline
SIR is > 1.0 and is greater than the national baseline
SIR is < 1.0 and is less than the national baseline
SIR is ≤ 1.0 and is no different than the national baseline or facil ity had 0 LAMs
Footnote 1: The expected number of LAMs is a prediction based on the national HAI experience for all hospitals reporting to NHSN. The observed number is the total number of LAMs identified during 2013. The SIR = Observed ÷ Expected. It is better to have a lower SIR.
56
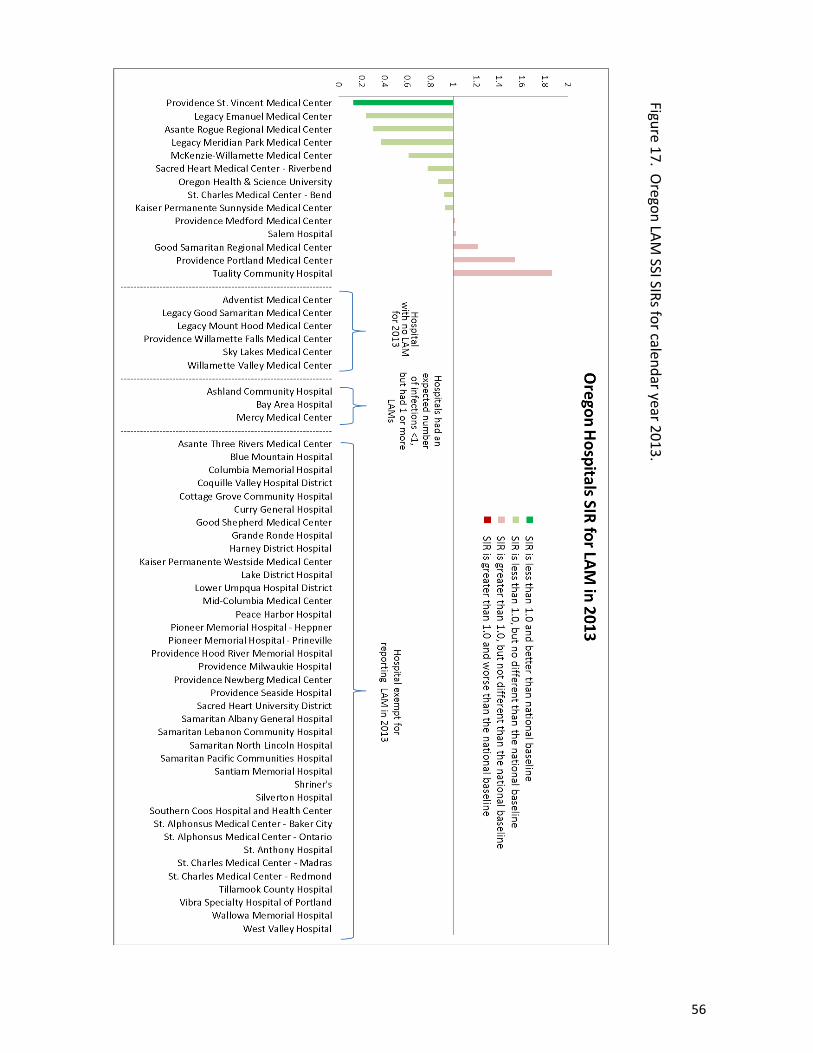
Figure 17. Oregon LAM
SSI SIRs for calendar year 2013.

57
Oregon had 8 hospitals with LAM SSI SIRs trending downward from 2011–2013. Six hospitals had SIRs trending upwards. Five hospitals had zero LAM SSIs between 2011–2013.
Table 18. Oregon SIR values for LAM SSIs for calendar years 2011 through 2013 by hospital.
Hospital Name 2011 2012 2013 Percent difference
Trend
Adventist Medical Center 0.00 0.00 0.00 --
Asante Rogue Regional Medical Center 0.00 0.00 0.30 --
Asante Three Rivers Medical Center 0.00 0.00 Exempt
Ashland Community Hospital 0.00 0.00 * --
Bay Area Hospital * * * --
Good Samaritan Regional Medical Center 0.60 0.62 1.22 103%
Kaiser Permanente Sunnyside Medical Cente 1.81 0.29 0.92 -49%
Legacy Emanuel Medical Center 0.63 0.28 0.24 -62%
Legacy Good Samaritan Medical Center 0.00 0.00 0.00 --
Legacy Meridian Park Medical Center 0.60 0.62 0.37 -38%
Legacy Mount Hood Medical Center 0.00 0.00 0.00 --
McKenzie-Willamette Medical Center 1.78 0.24 0.61 -66%
Mercy Medical Center 0.00 0.00 * --
Mid-Columbia Medical Center 0.00 Exempt Exempt --
Oregon Health & Science University 0.91 1.53 0.86 -5%
Providence Medford Medical Center 0.32 0.96 1.02 216%
Providence Portland Medical Center 0.29 0.52 1.54 436%
Providence St. Vincent Medical Center 0.12 0.51 0.13 6%
Providence Willamette Falls Medical Center 0.00 0.00 0.00 --
Sacred Heart Medical Center - Riverbend 0.43 0.18 0.78 82%
Salem Hospital 1.30 2.45 1.02 -21%
Sky Lakes Medical Center 0.31 1.78 0.00 -100%
St. Charles Medical Center - Bend 1.25 0.76 0.92 -26%
Tuality Community Hospital 0.61 1.40 1.86 206%
Willamette Valley Medical Center * * 0.00 --
* Expected number of infections <1 with no SIR calculated
LAM SSI Standardized Infection Ratio (2011–2013)SIR
58
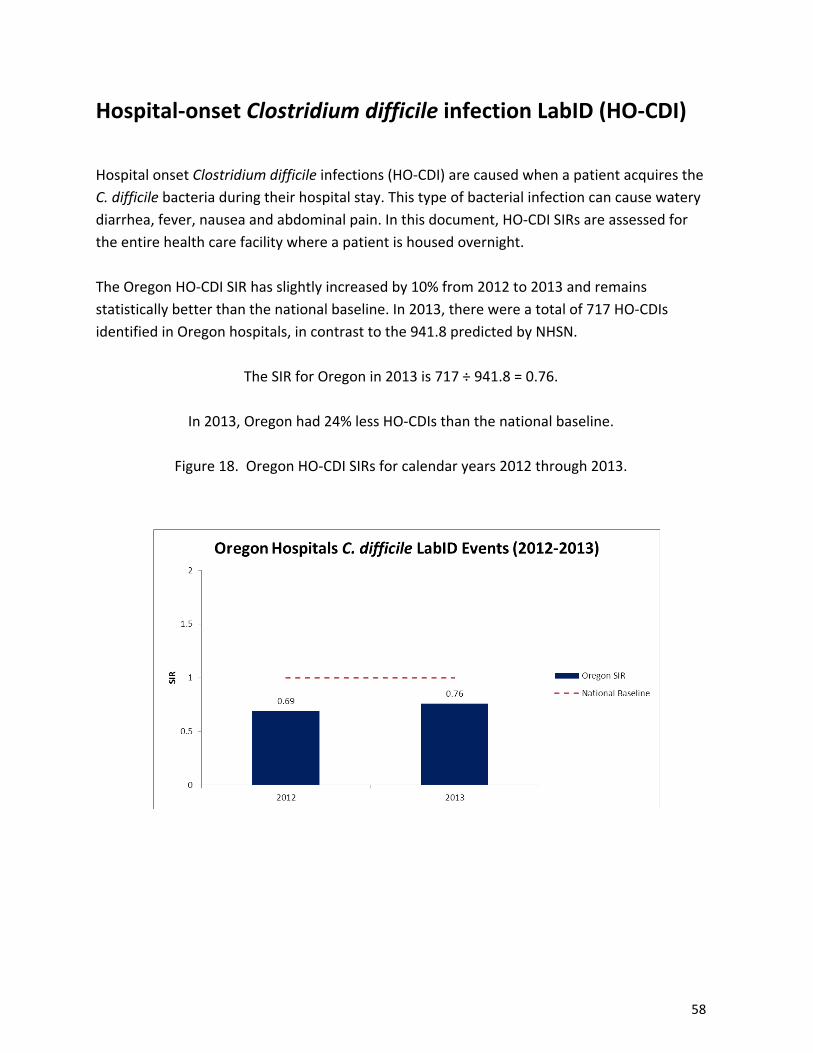
Hospital-onset Clostridium difficile infection LabID (HO-CDI)
Hospital onset Clostridium difficile infections (HO-CDI) are caused when a patient acquires the C. difficile bacteria during their hospital stay. This type of bacterial infection can cause watery diarrhea, fever, nausea and abdominal pain. In this document, HO-CDI SIRs are assessed for the entire health care facility where a patient is housed overnight. The Oregon HO-CDI SIR has slightly increased by 10% from 2012 to 2013 and remains statistically better than the national baseline. In 2013, there were a total of 717 HO-CDIs identified in Oregon hospitals, in contrast to the 941.8 predicted by NHSN.
The SIR for Oregon in 2013 is 717 ÷ 941.8 = 0.76.
In 2013, Oregon had 24% less HO-CDIs than the national baseline.
Figure 18. Oregon HO-CDI SIRs for calendar years 2012 through 2013.

59
Table 19 and Figure 19 show that in 2013, 60 hospitals reported the HO-CDI measurement. Forty-two hospitals (70%) reported at least one HO-CDI and 18 (30%) hospitals reported zero HO-CDIs. Ten hospitals had an SIR statistically lower than the national baseline. Four hospitals had an SIR statistically higher than the national baseline. Two had no SIR calculated because the expected number of HO-CDIs was less than 1.0, but did have at least one HO-CDI in 2013. Table 19. Oregon observed and expected number of HO-CDI with associated SIR for calendar year 2013 by hospital.
Hospital NameObserved # of HO-CDI
Expected # of HO-CDI
Adventist Medical Center 12 27.41 0.44 ▼Asante Rogue Regional Medical Center 40 33.11 1.21 ▲Asante Three Rivers Medical Center 11 15.53 0.71 ▼Ashland Community Hospital 1 2.10 0.48 ▼Bay Area Hospital 11 15.92 0.69 ▼Blue Mountain Hospital 0 0.49 0.00 ▼Columbia Memorial Hospital 0 1.68 0.00 ▼Coquille Valley Hospital District 0 1.68 0.00 ▼Cottage Grove Community Hospital 0 0.81 0.00 ▼Curry General Hospital 0 0.15 0.00 ▼Good Samaritan Regional Medical Center 10 23.46 0.43 ▼Good Shepherd Medical Center 2 2.92 0.68 ▼Grande Ronde Hospital 1 2.61 0.38 ▼Harney District Hospital 0 0.55 0.00 ▼Kaiser Permanente Sunnyside Medical Center 46 48.36 0.95 ▼Kaiser Permanente Westside Medical Center 4 5.51 0.73 ▼Lake District Hospital 1 0.94 -- --
Legacy Emanuel Medical Center 37 72.88 0.51 ▼Legacy Good Samaritan Medical Center 15 40.73 0.37 ▼Legacy Meridian Park Medical Center 6 18.72 0.32 ▼Legacy Mount Hood Medical Center 13 9.39 1.39 ▲Lower Umpqua Hospital District 0 0.13 0.00 ▼McKenzie-Willamette Medical Center 3 10.84 0.28 ▼Mercy Medical Center 15 14.10 1.06 ▲Mid-Columbia Medical Center 0 3.27 0.00 ▼Oregon Health & Science University 146 107.88 1.35 ▲Peace Harbor Hospital 1 2.19 0.46 ▼Pioneer Memorial Hospital - Heppner * 0 -- -- --
Pioneer Memorial Hospital - Prineville 0 1.21 0.00 ▼Providence Hood River Memorial Hospital 0 2.37 0.00 ▼
Hospital-Onset Clostridium difficile Laboratory Identification (HO-CDI) 2013
HO-CDI SIR

60
Hospital NameObserved # of HO-CDI
Expected # of HO-CDI
Providence Medford Medical Center 21 18.84 1.11 ▲Providence Milwaukie Hospital 3 6.39 0.47 ▼Providence Newberg Medical Center 3 5.14 0.58 ▼Providence Portland Medical Center 37 84.50 0.44 ▼Providence Seaside Hospital 2 2.69 0.74 ▼Providence St. Vincent Medical Center 40 90.74 0.44 ▼Providence Willamette Falls Medical Center 3 8.02 0.37 ▼Sacred Heart Medical Center - Riverbend 45 70.83 0.64 ▼Sacred Heart University District 6 13.41 0.45 ▼Salem Hospital 62 66.79 0.93 ▼Samaritan Albany General Hospital 7 6.06 1.16 ▲Samaritan Lebanon Community Hospital 7 3.55 1.97 ▲Samaritan North Lincoln Hospital 0 1.96 0.00 ▼Samaritan Pacific Communities Hospital 1 3.27 0.31 ▼Santiam Memorial Hospital 7 2.07 3.38 ▲Shriner's 0 1.82 0.00 ▼Silverton Hospital 0 3.87 0.00 ▼Sky Lakes Medical Center 23 14.95 1.54 ▲Southern Coos Hospital and Health Center 0 0.45 0.00 ▼St. Alphonsus Medical Center - Ontario 0 4.11 0.00 ▼St. Anthony Hospital 0 1.88 0.00 ▼St. Charles Medical Center - Bend 51 36.14 1.41 ▲St. Charles Medical Center - Madras 1 1.46 0.69 ▼St. Charles Medical Center - Redmond 8 3.15 2.54 ▲Tillamook County Hospital 2 1.37 1.46 ▲Tuality Community Hospital 9 10.86 0.83 ▼Vibra Specialty Hospital of Portland ** 11 -- -- --
Wallowa Memorial Hospital 0 0.62 0.00 ▼West Valley Hospital 3 0.20 -- --
Willamette Valley Medical Center 1 9.08 0.11 ▼
** Vibra Specialty Hospital of Portland - NHSN does not calculate an SIR for LTACs
Hospital-Onset Clostridium difficile Laboratory Identification (HO-CDI) 2013
* Pioneer Memorial Hospital (Heppner) & St. Alphonsus Medical Center (Baker City) - No information due to data entry issues
HO-CDI SIR
▼▼▲▲-- No SIR calculated because the expected number of infections is < 1 and facil ity had at least one infection in 2013
SIR is > 1.0 and is greater than the national baseline
SIR is < 1.0 and is less than the national baseline
SIR is ≤ 1.0 and is no different than the national baseline or facil ity had 0 HO-CDIs
SIR is > 1.0 and is no different than the national baseline
Footnote 1: The expected number of HO-CDIs is a prediction based on the national HAI experience for all hospitals reporting to NHSN. The observed number is the total number of HO-CDIs identified during 2013. The SIR = Observed ÷ Expected. It is better to have a lower SIR.
Footnote 2: NHSN does not calculate an SIR for hospitals whose expected number of infections is < 1.
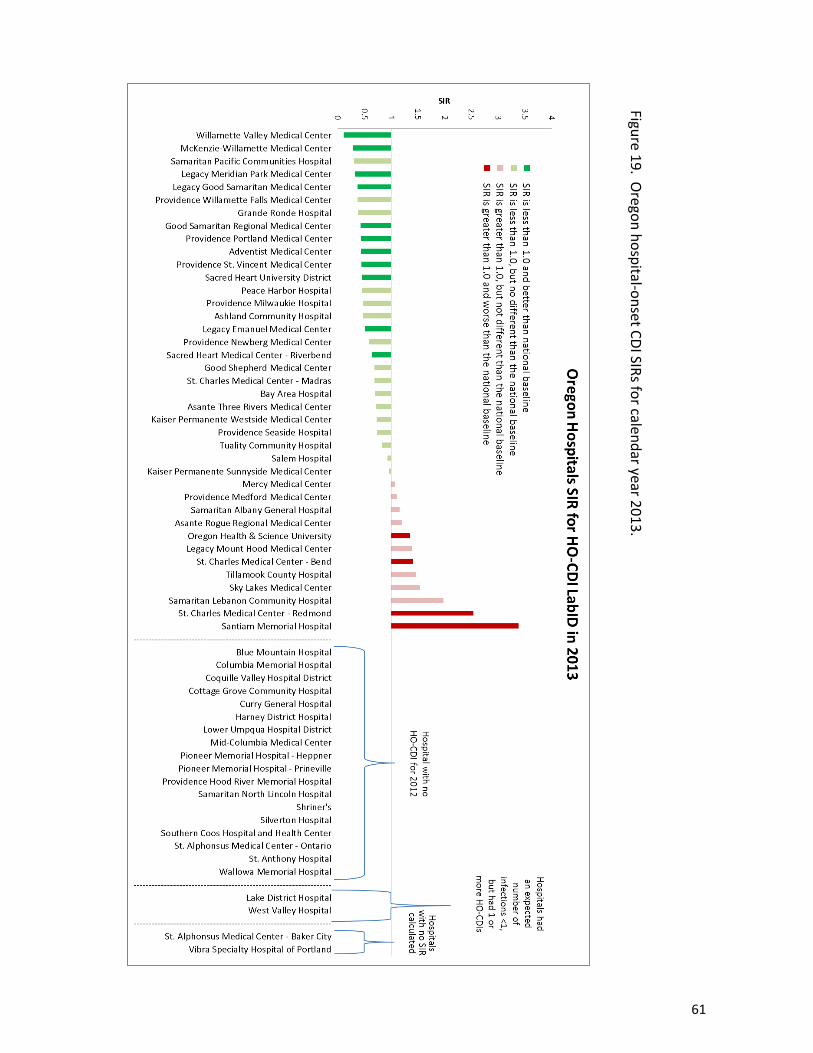
61
Figure 19. Oregon hospital-onset CDI SIRs for calendar year 2013.
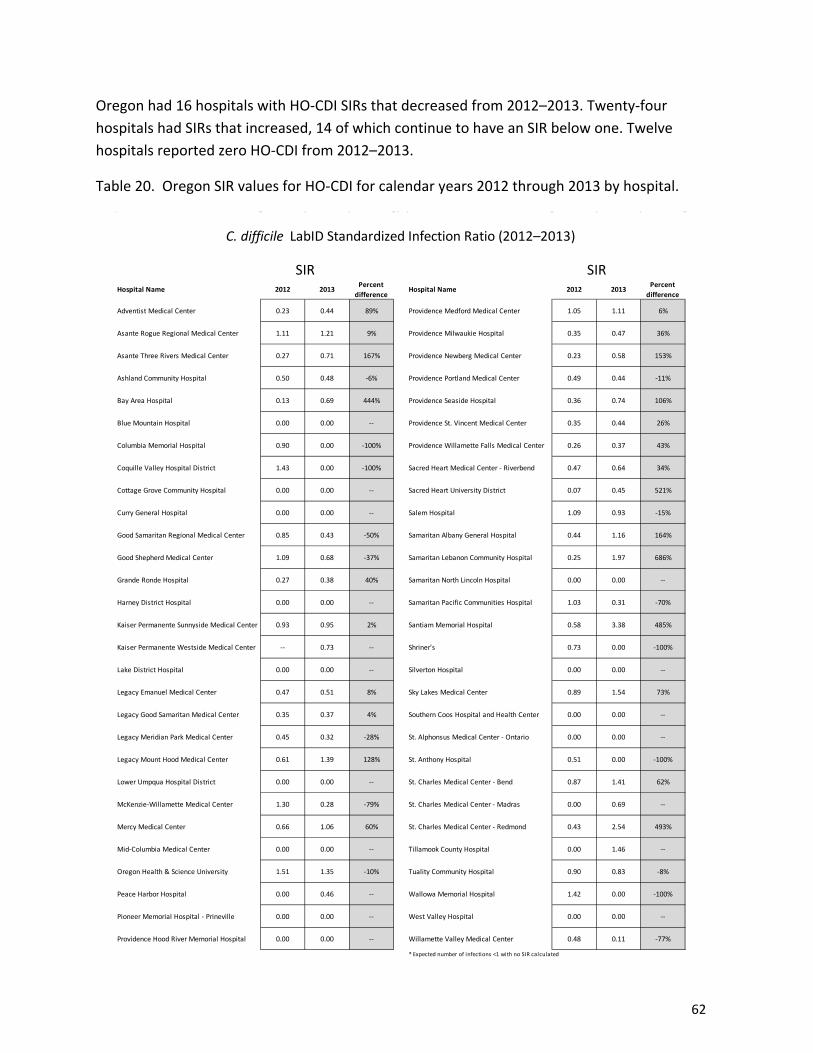
62
Oregon had 16 hospitals with HO-CDI SIRs that decreased from 2012–2013. Twenty-four hospitals had SIRs that increased, 14 of which continue to have an SIR below one. Twelve hospitals reported zero HO-CDI from 2012–2013.
Table 20. Oregon SIR values for HO-CDI for calendar years 2012 through 2013 by hospital.
Hospital Name 2012 2013 Percent difference
Hospital Name 2012 2013 Percent difference
Adventist Medical Center 0.23 0.44 89% Providence Medford Medical Center 1.05 1.11 6%
Asante Rogue Regional Medical Center 1.11 1.21 9% Providence Milwaukie Hospital 0.35 0.47 36%
Asante Three Rivers Medical Center 0.27 0.71 167% Providence Newberg Medical Center 0.23 0.58 153%
Ashland Community Hospital 0.50 0.48 -6% Providence Portland Medical Center 0.49 0.44 -11%
Bay Area Hospital 0.13 0.69 444% Providence Seaside Hospital 0.36 0.74 106%
Blue Mountain Hospital 0.00 0.00 -- Providence St. Vincent Medical Center 0.35 0.44 26%
Columbia Memorial Hospital 0.90 0.00 -100% Providence Willamette Falls Medical Center 0.26 0.37 43%
Coquille Valley Hospital District 1.43 0.00 -100% Sacred Heart Medical Center - Riverbend 0.47 0.64 34%
Cottage Grove Community Hospital 0.00 0.00 -- Sacred Heart University District 0.07 0.45 521%
Curry General Hospital 0.00 0.00 -- Salem Hospital 1.09 0.93 -15%
Good Samaritan Regional Medical Center 0.85 0.43 -50% Samaritan Albany General Hospital 0.44 1.16 164%
Good Shepherd Medical Center 1.09 0.68 -37% Samaritan Lebanon Community Hospital 0.25 1.97 686%
Grande Ronde Hospital 0.27 0.38 40% Samaritan North Lincoln Hospital 0.00 0.00 --
Harney District Hospital 0.00 0.00 -- Samaritan Pacific Communities Hospital 1.03 0.31 -70%
Kaiser Permanente Sunnyside Medical Center 0.93 0.95 2% Santiam Memorial Hospital 0.58 3.38 485%
Kaiser Permanente Westside Medical Center -- 0.73 -- Shriner's 0.73 0.00 -100%
Lake District Hospital 0.00 0.00 -- Silverton Hospital 0.00 0.00 --
Legacy Emanuel Medical Center 0.47 0.51 8% Sky Lakes Medical Center 0.89 1.54 73%
Legacy Good Samaritan Medical Center 0.35 0.37 4% Southern Coos Hospital and Health Center 0.00 0.00 --
Legacy Meridian Park Medical Center 0.45 0.32 -28% St. Alphonsus Medical Center - Ontario 0.00 0.00 --
Legacy Mount Hood Medical Center 0.61 1.39 128% St. Anthony Hospital 0.51 0.00 -100%
Lower Umpqua Hospital District 0.00 0.00 -- St. Charles Medical Center - Bend 0.87 1.41 62%
McKenzie-Willamette Medical Center 1.30 0.28 -79% St. Charles Medical Center - Madras 0.00 0.69 --
Mercy Medical Center 0.66 1.06 60% St. Charles Medical Center - Redmond 0.43 2.54 493%
Mid-Columbia Medical Center 0.00 0.00 -- Tillamook County Hospital 0.00 1.46 --
Oregon Health & Science University 1.51 1.35 -10% Tuality Community Hospital 0.90 0.83 -8%
Peace Harbor Hospital 0.00 0.46 -- Wallowa Memorial Hospital 1.42 0.00 -100%
Pioneer Memorial Hospital - Prineville 0.00 0.00 -- West Valley Hospital 0.00 0.00 --
Providence Hood River Memorial Hospital 0.00 0.00 -- Willamette Valley Medical Center 0.48 0.11 -77%
* Expected number of infections <1 with no SIR calculated
SIR SIR
C. difficile LabID Standardized Infection Ratio (2012–2013)

63
Dialysis events Oregon began reporting NHSN defined dialysis events (DE) in 2013. Surveillance occurs in outpatient hemodialysis centers where patients with kidney disease are treated. There are two types of measures to assess dialysis safety in this report:
• Bloodstream infections: Any positive blood culture • Access-related bloodstream infection: Positive blood culture with the suspected
source reported as the vascular access or an uncertain source. Each of these types of DEs are further sub-divided by the type of vascular access employed for hemodialysis. The different methods of vascular access are listed below in order from lowest to highest infection risk:
• Fistula – a surgically created direct connection between an artery and a vein. • Graft – a surgically created connection between an artery and a vein using implanted
material (typically synthetic tubing). • Tunneled central lines – a central venous catheter that travels a distance under the
skin from the point of insertion before entering a vein and terminates at or close to the heart or one of the great vessels (e.g., Hickman® or Broviac®).
• Non-tunneled central line – a central venous catheter that is fixed in place at the point of insertion and travels directly from the skin entry site to a vein and terminates close to the heart or one of the great vessels, typically intended for short term use.
Tables 21, and Tables 22–29 shows bloodstream infection (BSI) and access-related bloodstream infection (ARB) dialysis event data for 2013. Stratifying by access device, Oregon facilities had a pooled mean for BSIs of 0.25 for fistula devices, 0.48 for graft devices, 1.43 for tunneled central lines and 1.67 for non-tunneled central lines. For access-related bloodstream infections, Oregon facilities had a pooled mean for ARBs of 0.14 for fistula devices, 0.33 for graft devices, 1.32 for tunneled central lines and 1.67 for non-tunneled central lines. All of Oregon pooled means for both BSIs and ARBs are below the national pooled mean for all vascular devices. Table 21. Total number of BSIs and ARBs with associated facility and national pooled means.
InfectionsPatient months
Facility pooled mean
NHSN pooled mean
Above ▲ or
Below ▼ InfectionsPatient months
Facility pooled mean
NHSN pooled mean
Above ▲ or
Below ▼Fistula 60 23690 0.25 0.48 ▼ 33 23690 0.14 0.23 ▼Graft 23 4833 0.48 0.88 ▼ 16 4833 0.33 0.51 ▼
Tunneled Central Line 87 6081 1.43 3.24 ▼ 80 6081 1.32 2.55 ▼Nontunneled Central Line 1 60 1.67 2.78 ▼ 1 60 1.67 2.18 ▼
Bloodstream infections Access-related bloodstream infections

64
Table 22. Facility bloodstream infections associated with fistulas for Oregon dialysis facilities.
Facility
Bloodstream infection
Patient Months
Pooled Mean
NHSN bloodstream
infection pooled mean
Above ▲ or
Below ▼
Blue Mountain Kidney Center 1 163 0.61 0.48 ▲Coos Bay 2 676 0.30 0.48 ▼Eugene Dialysis Service 5 901 0.55 0.48 ▲FMC Maywood Dialysis 1 130 0.77 0.48 ▲FMC Milton Freewater 0 102 0.00 0.48 ▼Four Rivers Dialysis 2 406 0.49 0.48 ▲Fresenius Medical Care Dialysis Services - Oregon, LLC - Corvallis 0 0 -- 0.48 ▼Fresenius Medical Care Dialysis Services - Oregon, LLC - Mt. Hood 3 754 0.40 0.48 ▼Fresenius Medical Care Florence Dialysis 0 72 0.00 0.48 ▼Grants Pass II 0 24 0.00 0.48 ▼Gresham Dialysis Center 1 614 0.16 0.48 ▼Hermiston Dialysis Center 0 266 0.00 0.48 ▼Hillsboro Dialysis Center 0 84 0.00 0.48 ▼Klamath Falls Dialysis 1 411 0.24 0.48 ▼Lake Road Dialysis 0 838 0.00 0.48 ▼Lebanon Dialysis 1 451 0.22 0.48 ▼McMinnville Dialysis 0 262 0.00 0.48 ▼Meridian Park Dialysis 0 419 0.00 0.48 ▼Newport Oregon 0 373 0.00 0.48 ▼Northeast Portland Renal Center 3 726 0.41 0.48 ▼Oregon Kidney Center 0 773 0.00 0.48 ▼Pacific Northwest Dialysis Services, L.L.C. - Beaverton 0 981 0.00 0.48 ▼Pacific Northwest Renal Services, L.L.C. - Astoria 2 308 0.65 0.48 ▲Pacific Northwest Renal Services, L.L.C. - Clackamas 4 623 0.64 0.48 ▲Pacific Northwest Renal Services, L.L.C. - Hollywood 4 901 0.44 0.48 ▼Pacific Northwest Renal Services, L.L.C. - Newberg 1 166 0.60 0.48 ▲Pacific Northwest Renal Services, L.L.C. - St. Helens 0 212 0.00 0.48 ▼Pacific Northwest Renal Services, L.L.C. - Tualatin 1 622 0.16 0.48 ▼Pacific Northwest Renal Services, L.L.C. - Twin Oaks 2 607 0.33 0.48 ▼PNRS Columbia River The Dalles 0 66 0.00 0.48 ▼QCI Bend 5 587 0.85 0.48 ▲Qualicenters Salem, LLC 2 1031 0.19 0.48 ▼Qualicenters-Albany 1 495 0.20 0.48 ▼Ray Yasui Dialysis Center 0 335 0.00 0.48 ▼Redmond Dialysis 2 661 0.30 0.48 ▼Redwood Dialysis 1 626 0.16 0.48 ▼Rogue Valley Dialysis 4 1429 0.28 0.48 ▼Rose Quarter Dialysis 0 875 0.00 0.48 ▼Roseburg-Mercy 1 626 0.16 0.48 ▼Salem Dialysis 2 625 0.32 0.48 ▼Salem North Dialysis 3 392 0.77 0.48 ▲Sherwood Dialysis Center 0 160 0.00 0.48 ▼Springfield Oregon Dialysis 1 855 0.12 0.48 ▼THC/PNRS LLC - Raines 2 384 0.52 0.48 ▲Tillamook Dialysis Center 0 102 0.00 0.48 ▼Walker Road Dialysis 0 333 0.00 0.48 ▼West Linn Dialysis Center 1 142 0.70 0.48 ▲West Salem 0 214 0.00 0.48 ▼Willamette Valley Renal Center 0 308 0.00 0.48 ▼Woodburn 1 579 0.17 0.48 ▼
Fistula

65
Table 23. Facility bloodstream infections associated with grafts for Oregon dialysis facilities.
Facility
Bloodstream infection
Patient Months
Pooled Mean
NHSN bloodstream
infection pooled mean
Above ▲ or
Below ▼
Blue Mountain Kidney Center 0 27 0.00 0.88 ▼Coos Bay 1 60 1.67 0.88 ▲Eugene Dialysis Service 1 175 0.57 0.88 ▼FMC Maywood Dialysis 0 34 0.00 0.88 ▼FMC Milton Freewater 0 0 -- 0.88 ▼Four Rivers Dialysis 0 88 0.00 0.88 ▼Fresenius Medical Care Dialysis Services - Oregon, LLC - Corvallis 0 0 -- 0.88 ▼Fresenius Medical Care Dialysis Services - Oregon, LLC - Mt. Hood 0 136 0.00 0.88 ▼Fresenius Medical Care Florence Dialysis 0 0 -- 0.88 ▼Grants Pass II 0 0 -- 0.88 ▼Gresham Dialysis Center 1 58 1.72 0.88 ▲Hermiston Dialysis Center 0 32 0.00 0.88 ▼Hillsboro Dialysis Center 0 31 0.00 0.88 ▼Klamath Falls Dialysis 0 87 0.00 0.88 ▼Lake Road Dialysis 1 264 0.38 0.88 ▼Lebanon Dialysis 0 36 0.00 0.88 ▼McMinnville Dialysis 1 17 5.88 0.88 ▲Meridian Park Dialysis 0 117 0.00 0.88 ▼Newport Oregon 0 18 0.00 0.88 ▼Northeast Portland Renal Center 1 266 0.38 0.88 ▼Oregon Kidney Center 1 201 0.50 0.88 ▼Pacific Northwest Dialysis Services, L.L.C. - Beaverton 1 249 0.40 0.88 ▼Pacific Northwest Renal Services, L.L.C. - Astoria 1 105 0.95 0.88 ▲Pacific Northwest Renal Services, L.L.C. - Clackamas 0 130 0.00 0.88 ▼Pacific Northwest Renal Services, L.L.C. - Hollywood 0 246 0.00 0.88 ▼Pacific Northwest Renal Services, L.L.C. - Newberg 0 19 0.00 0.88 ▼Pacific Northwest Renal Services, L.L.C. - St. Helens 0 56 0.00 0.88 ▼Pacific Northwest Renal Services, L.L.C. - Tualatin 1 282 0.35 0.88 ▼Pacific Northwest Renal Services, L.L.C. - Twin Oaks 2 140 1.43 0.88 ▲PNRS Columbia River The Dalles 0 16 0.00 0.88 ▼QCI Bend 0 114 0.00 0.88 ▼Qualicenters Salem, LLC 1 113 0.88 0.88 ▲Qualicenters-Albany 1 56 1.79 0.88 ▲Ray Yasui Dialysis Center 0 85 0.00 0.88 ▼Redmond Dialysis 1 139 0.72 0.88 ▼Redwood Dialysis 0 84 0.00 0.88 ▼Rogue Valley Dialysis 0 243 0.00 0.88 ▼Rose Quarter Dialysis 2 279 0.72 0.88 ▼Roseburg-Mercy 0 61 0.00 0.88 ▼Salem Dialysis 1 78 1.28 0.88 ▲Salem North Dialysis 1 93 1.08 0.88 ▲Sherwood Dialysis Center 0 41 0.00 0.88 ▼Springfield Oregon Dialysis 1 134 0.75 0.88 ▼THC/PNRS LLC - Raines 0 78 0.00 0.88 ▼Tillamook Dialysis Center 0 57 0.00 0.88 ▼Walker Road Dialysis 1 80 1.25 0.88 ▲West Linn Dialysis Center 1 46 2.17 0.88 ▲West Salem 0 11 0.00 0.88 ▼Willamette Valley Renal Center 1 93 1.08 0.88 ▲Woodburn 0 58 0.00 0.88 ▼
Graft

66
Table 24. Facility bloodstream infections associated with tunneled central lines for Oregon dialysis facilities.
Facility
Bloodstream infection
Patient Months
Pooled Mean
NHSN bloodstream
infection pooled mean
Above ▲ or
Below ▼
Blue Mountain Kidney Center 0 22 0.00 3.24 ▼Coos Bay 4 257 1.56 3.24 ▼Eugene Dialysis Service 3 341 0.88 3.24 ▼FMC Maywood Dialysis 0 76 0.00 3.24 ▼FMC Milton Freewater 0 36 0.00 3.24 ▼Four Rivers Dialysis 2 66 3.03 3.24 ▼Fresenius Medical Care Dialysis Services - Oregon, LLC - Corvallis 0 0 -- 3.24 ▼Fresenius Medical Care Dialysis Services - Oregon, LLC - Mt. Hood 3 104 2.88 3.24 ▼Fresenius Medical Care Florence Dialysis 0 18 0.00 3.24 ▼Grants Pass II 0 7 0.00 3.24 ▼Gresham Dialysis Center 7 188 3.72 3.24 ▲Hermiston Dialysis Center 0 50 0.00 3.24 ▼Hillsboro Dialysis Center 1 44 2.27 3.24 ▼Klamath Falls Dialysis 0 87 0.00 3.24 ▼Lake Road Dialysis 0 104 0.00 3.24 ▼Lebanon Dialysis 0 72 0.00 3.24 ▼McMinnville Dialysis 0 90 0.00 3.24 ▼Meridian Park Dialysis 0 80 0.00 3.24 ▼Newport Oregon 0 37 0.00 3.24 ▼Northeast Portland Renal Center 2 100 2.00 3.24 ▼Oregon Kidney Center 1 169 0.59 3.24 ▼Pacific Northwest Dialysis Services, L.L.C. - Beaverton 0 250 0.00 3.24 ▼Pacific Northwest Renal Services, L.L.C. - Astoria 2 49 4.08 3.24 ▲Pacific Northwest Renal Services, L.L.C. - Clackamas 6 184 3.26 3.24 ▲Pacific Northwest Renal Services, L.L.C. - Hollywood 7 214 3.27 3.24 ▲Pacific Northwest Renal Services, L.L.C. - Newberg 2 54 3.70 3.24 ▲Pacific Northwest Renal Services, L.L.C. - St. Helens 1 55 1.82 3.24 ▼Pacific Northwest Renal Services, L.L.C. - Tualatin 5 145 3.45 3.24 ▲Pacific Northwest Renal Services, L.L.C. - Twin Oaks 4 133 3.01 3.24 ▼PNRS Columbia River The Dalles 0 10 0.00 3.24 ▼QCI Bend 1 113 0.88 3.24 ▼Qualicenters Salem, LLC 7 323 2.17 3.24 ▼Qualicenters-Albany 0 85 0.00 3.24 ▼Ray Yasui Dialysis Center 0 61 0.00 3.24 ▼Redmond Dialysis 1 68 1.47 3.24 ▼Redwood Dialysis 0 136 0.00 3.24 ▼Rogue Valley Dialysis 1 382 0.26 3.24 ▼Rose Quarter Dialysis 5 232 2.16 3.24 ▼Roseburg-Mercy 1 247 0.40 3.24 ▼Salem Dialysis 2 196 1.02 3.24 ▼Salem North Dialysis 0 147 0.00 3.24 ▼Sherwood Dialysis Center 1 45 2.22 3.24 ▼Springfield Oregon Dialysis 7 405 1.73 3.24 ▼THC/PNRS LLC - Raines 5 205 2.44 3.24 ▼Tillamook Dialysis Center 0 26 0.00 3.24 ▼Walker Road Dialysis 0 54 0.00 3.24 ▼West Linn Dialysis Center 1 53 1.89 3.24 ▼West Salem 2 124 1.61 3.24 ▼Willamette Valley Renal Center 3 34 8.82 3.24 ▲Woodburn 0 103 0.00 3.24 ▼
Tunneled Central Line

67
Table 25. Facility bloodstream infections associated with non-tunneled central lines for Oregon dialysis facilities.
Facility
Bloodstream infection
Patient Months
Pooled Mean
NHSN bloodstream
infection pooled mean
Above ▲ or
Below ▼
Blue Mountain Kidney Center 0 1 0.00 2.78 ▼Coos Bay 0 0 -- 2.78 ▼Eugene Dialysis Service 0 0 -- 2.78 ▼FMC Maywood Dialysis 0 0 -- 2.78 ▼FMC Milton Freewater 0 0 -- 2.78 ▼Four Rivers Dialysis 0 0 -- 2.78 ▼Fresenius Medical Care Dialysis Services - Oregon, LLC - Corvallis 0 0 -- 2.78 ▼Fresenius Medical Care Dialysis Services - Oregon, LLC - Mt. Hood 0 14 0.00 2.78 ▼Fresenius Medical Care Florence Dialysis 0 0 -- 2.78 ▼Grants Pass II 0 0 -- 2.78 ▼Gresham Dialysis Center 0 0 -- 2.78 ▼Hermiston Dialysis Center 0 0 -- 2.78 ▼Hillsboro Dialysis Center 0 0 -- 2.78 ▼Klamath Falls Dialysis 0 0 -- 2.78 ▼Lake Road Dialysis 0 0 -- 2.78 ▼Lebanon Dialysis 0 0 -- 2.78 ▼McMinnville Dialysis 0 0 -- 2.78 ▼Meridian Park Dialysis 0 0 -- 2.78 ▼Newport Oregon 0 0 -- 2.78 ▼Northeast Portland Renal Center 0 1 0.00 2.78 ▼Oregon Kidney Center 0 0 -- 2.78 ▼Pacific Northwest Dialysis Services, L.L.C. - Beaverton 0 3 0.00 2.78 ▼Pacific Northwest Renal Services, L.L.C. - Astoria 0 0 -- 2.78 ▼Pacific Northwest Renal Services, L.L.C. - Clackamas 0 0 -- 2.78 ▼Pacific Northwest Renal Services, L.L.C. - Hollywood 0 0 -- 2.78 ▼Pacific Northwest Renal Services, L.L.C. - Newberg 0 0 -- 2.78 ▼Pacific Northwest Renal Services, L.L.C. - St. Helens 0 0 -- 2.78 ▼Pacific Northwest Renal Services, L.L.C. - Tualatin 1 0 -- 2.78 ▼Pacific Northwest Renal Services, L.L.C. - Twin Oaks 0 0 -- 2.78 ▼PNRS Columbia River The Dalles 0 0 -- 2.78 ▼QCI Bend 0 0 -- 2.78 ▼Qualicenters Salem, LLC 0 0 -- 2.78 ▼Qualicenters-Albany 0 20 0.00 2.78 ▼Ray Yasui Dialysis Center 0 0 -- 2.78 ▼Redmond Dialysis 0 9 0.00 2.78 ▼Redwood Dialysis 0 0 -- 2.78 ▼Rogue Valley Dialysis 0 0 -- 2.78 ▼Rose Quarter Dialysis 0 0 -- 2.78 ▼Roseburg-Mercy 0 0 -- 2.78 ▼Salem Dialysis 0 0 -- 2.78 ▼Salem North Dialysis 0 0 -- 2.78 ▼Sherwood Dialysis Center 0 0 -- 2.78 ▼Springfield Oregon Dialysis 0 0 -- 2.78 ▼THC/PNRS LLC - Raines 0 7 0.00 2.78 ▼Tillamook Dialysis Center 0 0 -- 2.78 ▼Walker Road Dialysis 0 0 -- 2.78 ▼West Linn Dialysis Center 0 0 -- 2.78 ▼West Salem 0 0 -- 2.78 ▼Willamette Valley Renal Center 0 4 0.00 2.78 ▼Woodburn 0 1 0.00 2.78 ▼
Nontunneled Central Line

68
Table 26. Facility access-related bloodstream infections associated with fistulas for Oregon dialysis facilities.
Facility
Bloodstream infection
Patient Months
Pooled Mean
NHSN bloodstream
infection pooled mean
Above ▲ or
Below ▼
Blue Mountain Kidney Center 1 163 0.61 0.23 ▲Coos Bay 1 676 0.15 0.23 ▼Eugene Dialysis Service 1 901 0.11 0.23 ▼FMC Maywood Dialysis 1 130 0.77 0.23 ▲FMC Milton Freewater 0 102 0.00 0.23 ▼Four Rivers Dialysis 2 406 0.49 0.23 ▲Fresenius Medical Care Dialysis Services - Oregon, LLC - Corvallis 0 0 -- 0.23 ▼Fresenius Medical Care Dialysis Services - Oregon, LLC - Mt. Hood 1 754 0.13 0.23 ▼Fresenius Medical Care Florence Dialysis 0 72 0.00 0.23 ▼Grants Pass II 0 24 0.00 0.23 ▼Gresham Dialysis Center 1 614 0.16 0.23 ▼Hermiston Dialysis Center 0 266 0.00 0.23 ▼Hillsboro Dialysis Center 0 84 0.00 0.23 ▼Klamath Falls Dialysis 1 411 0.24 0.23 ▲Lake Road Dialysis 0 838 0.00 0.23 ▼Lebanon Dialysis 0 451 0.00 0.23 ▼McMinnville Dialysis 0 262 0.00 0.23 ▼Meridian Park Dialysis 0 419 0.00 0.23 ▼Newport Oregon 0 373 0.00 0.23 ▼Northeast Portland Renal Center 3 726 0.41 0.23 ▲Oregon Kidney Center 0 773 0.00 0.23 ▼Pacific Northwest Dialysis Services, L.L.C. - Beaverton 0 981 0.00 0.23 ▼Pacific Northwest Renal Services, L.L.C. - Astoria 1 308 0.32 0.23 ▲Pacific Northwest Renal Services, L.L.C. - Clackamas 2 623 0.32 0.23 ▲Pacific Northwest Renal Services, L.L.C. - Hollywood 3 901 0.33 0.23 ▲Pacific Northwest Renal Services, L.L.C. - Newberg 0 166 0.00 0.23 ▼Pacific Northwest Renal Services, L.L.C. - St. Helens 0 212 0.00 0.23 ▼Pacific Northwest Renal Services, L.L.C. - Tualatin 0 622 0.00 0.23 ▼Pacific Northwest Renal Services, L.L.C. - Twin Oaks 0 607 0.00 0.23 ▼PNRS Columbia River The Dalles 0 66 0.00 0.23 ▼QCI Bend 4 587 0.68 0.23 ▲Qualicenters Salem, LLC 1 1031 0.10 0.23 ▼Qualicenters-Albany 0 495 0.00 0.23 ▼Ray Yasui Dialysis Center 0 335 0.00 0.23 ▼Redmond Dialysis 1 661 0.15 0.23 ▼Redwood Dialysis 1 626 0.16 0.23 ▼Rogue Valley Dialysis 2 1429 0.14 0.23 ▼Rose Quarter Dialysis 0 875 0.00 0.23 ▼Roseburg-Mercy 0 626 0.00 0.23 ▼Salem Dialysis 2 625 0.32 0.23 ▲Salem North Dialysis 3 392 0.77 0.23 ▲Sherwood Dialysis Center 0 160 0.00 0.23 ▼Springfield Oregon Dialysis 0 855 0.00 0.23 ▼THC/PNRS LLC - Raines 1 384 0.26 0.23 ▲Tillamook Dialysis Center 0 102 0.00 0.23 ▼Walker Road Dialysis 0 333 0.00 0.23 ▼West Linn Dialysis Center 0 142 0.00 0.23 ▼West Salem 0 214 0.00 0.23 ▼Willamette Valley Renal Center 0 308 0.00 0.23 ▼Woodburn 0 579 0.00 0.23 ▼
Fistula

69
Table 27. Facility access-related bloodstream infections associated with grafts for Oregon dialysis facilities.
Facility
Bloodstream infection
Patient Months
Pooled Mean
NHSN bloodstream
infection pooled mean
Above ▲ or
Below ▼
Blue Mountain Kidney Center 0 27 0.88 0.51 ▲Coos Bay 0 60 0.00 0.51 ▼Eugene Dialysis Service 1 175 0.57 0.51 ▲FMC Maywood Dialysis 0 34 0.00 0.51 ▼FMC Milton Freewater 0 0 -- 0.51 ▼Four Rivers Dialysis 0 88 0.00 0.51 ▼Fresenius Medical Care Dialysis Services - Oregon, LLC - Corvallis 0 0 -- 0.51 ▼Fresenius Medical Care Dialysis Services - Oregon, LLC - Mt. Hood 0 136 0.00 0.51 ▼Fresenius Medical Care Florence Dialysis 0 0 -- 0.51 ▼Grants Pass II 0 0 -- 0.51 ▼Gresham Dialysis Center 1 58 1.72 0.51 ▲Hermiston Dialysis Center 0 32 0.00 0.51 ▼Hillsboro Dialysis Center 0 31 0.00 0.51 ▼Klamath Falls Dialysis 0 87 0.00 0.51 ▼Lake Road Dialysis 1 264 0.38 0.51 ▼Lebanon Dialysis 0 36 0.00 0.51 ▼McMinnville Dialysis 1 17 5.88 0.51 ▲Meridian Park Dialysis 0 117 0.00 0.51 ▼Newport Oregon 0 18 0.00 0.51 ▼Northeast Portland Renal Center 1 266 0.38 0.51 ▼Oregon Kidney Center 1 201 0.50 0.51 ▼Pacific Northwest Dialysis Services, L.L.C. - Beaverton 1 249 0.40 0.51 ▼Pacific Northwest Renal Services, L.L.C. - Astoria 0 105 0.00 0.51 ▼Pacific Northwest Renal Services, L.L.C. - Clackamas 0 130 0.00 0.51 ▼Pacific Northwest Renal Services, L.L.C. - Hollywood 0 246 0.00 0.51 ▼Pacific Northwest Renal Services, L.L.C. - Newberg 0 19 0.00 0.51 ▼Pacific Northwest Renal Services, L.L.C. - St. Helens 0 56 0.00 0.51 ▼Pacific Northwest Renal Services, L.L.C. - Tualatin 0 282 0.00 0.51 ▼Pacific Northwest Renal Services, L.L.C. - Twin Oaks 1 140 0.71 0.51 ▲PNRS Columbia River The Dalles 0 16 0.00 0.51 ▼QCI Bend 0 114 0.00 0.51 ▼Qualicenters Salem, LLC 0 113 0.00 0.51 ▼Qualicenters-Albany 0 56 0.00 0.51 ▼Ray Yasui Dialysis Center 0 85 0.00 0.51 ▼Redmond Dialysis 0 139 0.00 0.51 ▼Redwood Dialysis 0 84 0.00 0.51 ▼Rogue Valley Dialysis 0 243 0.00 0.51 ▼Rose Quarter Dialysis 2 279 0.72 0.51 ▲Roseburg-Mercy 0 61 0.00 0.51 ▼Salem Dialysis 1 78 1.28 0.51 ▲Salem North Dialysis 1 93 1.08 0.51 ▲Sherwood Dialysis Center 0 41 0.00 0.51 ▼Springfield Oregon Dialysis 1 134 0.75 0.51 ▲THC/PNRS LLC - Raines 0 78 0.00 0.51 ▼Tillamook Dialysis Center 0 57 0.00 0.51 ▼Walker Road Dialysis 1 80 1.25 0.51 ▲West Linn Dialysis Center 1 46 2.17 0.51 ▲West Salem 0 11 0.00 0.51 ▼Willamette Valley Renal Center 1 93 1.08 0.51 ▲Woodburn 0 58 0.00 0.51 ▼
Graft
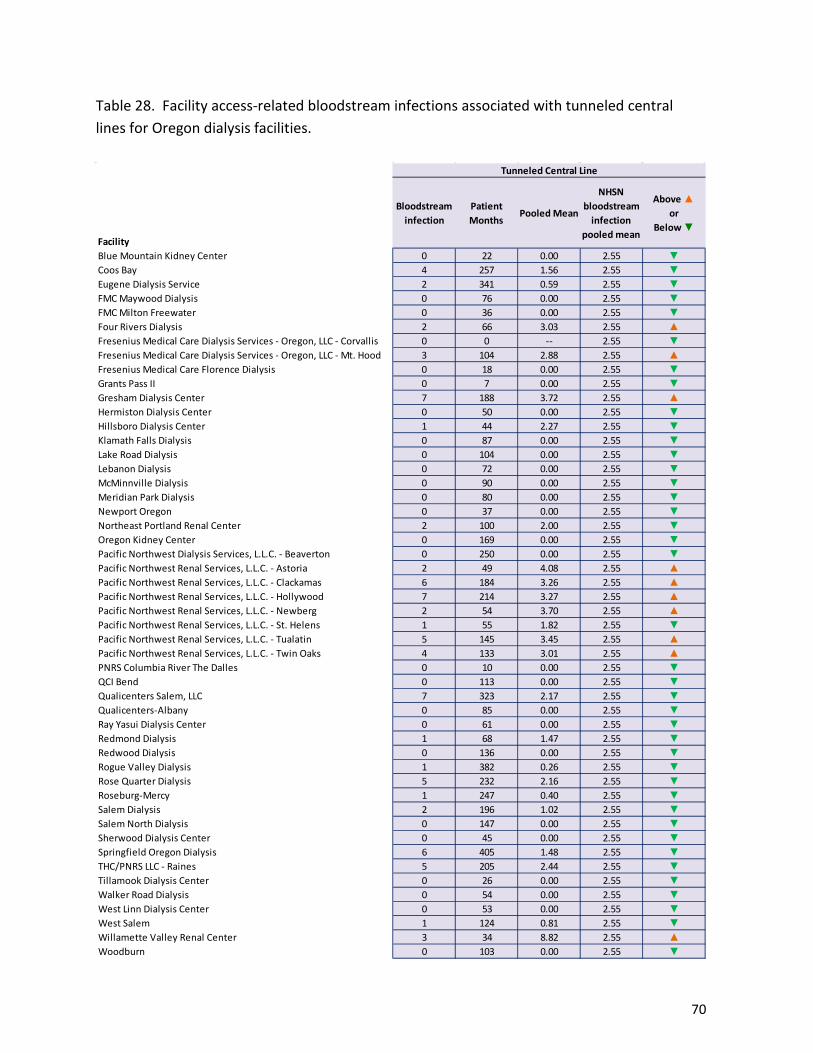
70
Table 28. Facility access-related bloodstream infections associated with tunneled central lines for Oregon dialysis facilities.
Facility
Bloodstream infection
Patient Months
Pooled Mean
NHSN bloodstream
infection pooled mean
Above ▲ or
Below ▼
Blue Mountain Kidney Center 0 22 0.00 2.55 ▼Coos Bay 4 257 1.56 2.55 ▼Eugene Dialysis Service 2 341 0.59 2.55 ▼FMC Maywood Dialysis 0 76 0.00 2.55 ▼FMC Milton Freewater 0 36 0.00 2.55 ▼Four Rivers Dialysis 2 66 3.03 2.55 ▲Fresenius Medical Care Dialysis Services - Oregon, LLC - Corvallis 0 0 -- 2.55 ▼Fresenius Medical Care Dialysis Services - Oregon, LLC - Mt. Hood 3 104 2.88 2.55 ▲Fresenius Medical Care Florence Dialysis 0 18 0.00 2.55 ▼Grants Pass II 0 7 0.00 2.55 ▼Gresham Dialysis Center 7 188 3.72 2.55 ▲Hermiston Dialysis Center 0 50 0.00 2.55 ▼Hillsboro Dialysis Center 1 44 2.27 2.55 ▼Klamath Falls Dialysis 0 87 0.00 2.55 ▼Lake Road Dialysis 0 104 0.00 2.55 ▼Lebanon Dialysis 0 72 0.00 2.55 ▼McMinnville Dialysis 0 90 0.00 2.55 ▼Meridian Park Dialysis 0 80 0.00 2.55 ▼Newport Oregon 0 37 0.00 2.55 ▼Northeast Portland Renal Center 2 100 2.00 2.55 ▼Oregon Kidney Center 0 169 0.00 2.55 ▼Pacific Northwest Dialysis Services, L.L.C. - Beaverton 0 250 0.00 2.55 ▼Pacific Northwest Renal Services, L.L.C. - Astoria 2 49 4.08 2.55 ▲Pacific Northwest Renal Services, L.L.C. - Clackamas 6 184 3.26 2.55 ▲Pacific Northwest Renal Services, L.L.C. - Hollywood 7 214 3.27 2.55 ▲Pacific Northwest Renal Services, L.L.C. - Newberg 2 54 3.70 2.55 ▲Pacific Northwest Renal Services, L.L.C. - St. Helens 1 55 1.82 2.55 ▼Pacific Northwest Renal Services, L.L.C. - Tualatin 5 145 3.45 2.55 ▲Pacific Northwest Renal Services, L.L.C. - Twin Oaks 4 133 3.01 2.55 ▲PNRS Columbia River The Dalles 0 10 0.00 2.55 ▼QCI Bend 0 113 0.00 2.55 ▼Qualicenters Salem, LLC 7 323 2.17 2.55 ▼Qualicenters-Albany 0 85 0.00 2.55 ▼Ray Yasui Dialysis Center 0 61 0.00 2.55 ▼Redmond Dialysis 1 68 1.47 2.55 ▼Redwood Dialysis 0 136 0.00 2.55 ▼Rogue Valley Dialysis 1 382 0.26 2.55 ▼Rose Quarter Dialysis 5 232 2.16 2.55 ▼Roseburg-Mercy 1 247 0.40 2.55 ▼Salem Dialysis 2 196 1.02 2.55 ▼Salem North Dialysis 0 147 0.00 2.55 ▼Sherwood Dialysis Center 0 45 0.00 2.55 ▼Springfield Oregon Dialysis 6 405 1.48 2.55 ▼THC/PNRS LLC - Raines 5 205 2.44 2.55 ▼Tillamook Dialysis Center 0 26 0.00 2.55 ▼Walker Road Dialysis 0 54 0.00 2.55 ▼West Linn Dialysis Center 0 53 0.00 2.55 ▼West Salem 1 124 0.81 2.55 ▼Willamette Valley Renal Center 3 34 8.82 2.55 ▲Woodburn 0 103 0.00 2.55 ▼
Tunneled Central Line
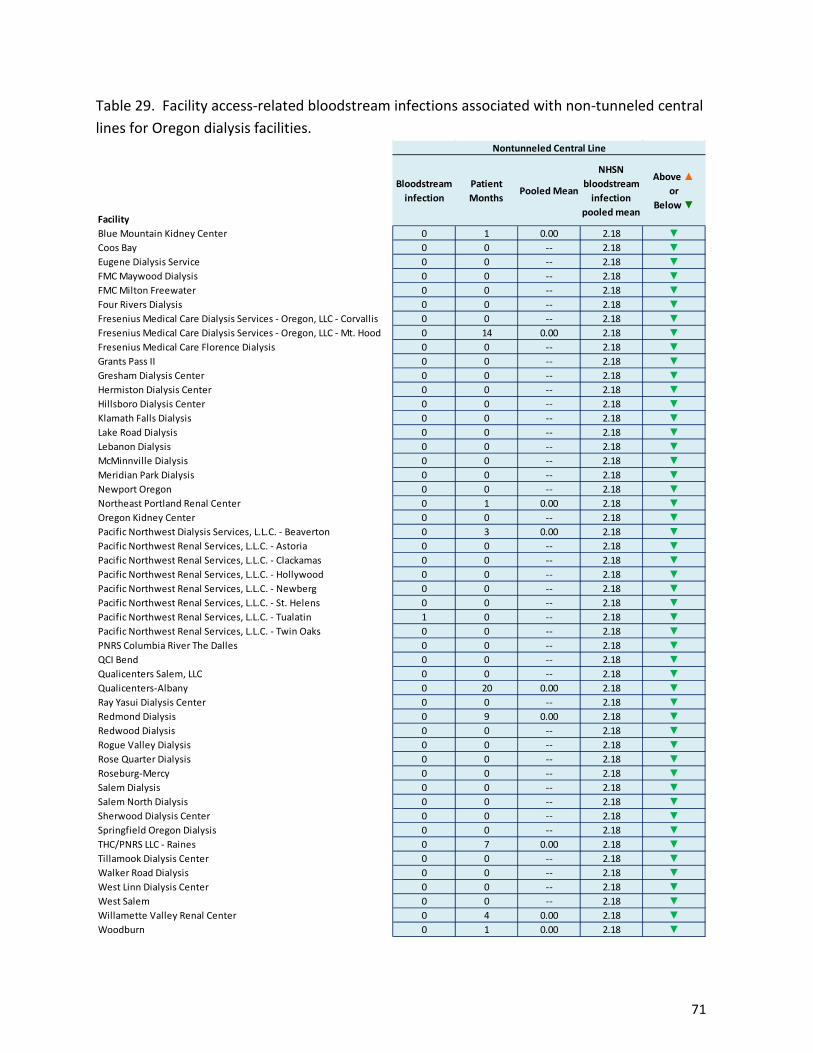
71
Table 29. Facility access-related bloodstream infections associated with non-tunneled central lines for Oregon dialysis facilities.
Facility
Bloodstream infection
Patient Months
Pooled Mean
NHSN bloodstream
infection pooled mean
Above ▲ or
Below ▼
Blue Mountain Kidney Center 0 1 0.00 2.18 ▼Coos Bay 0 0 -- 2.18 ▼Eugene Dialysis Service 0 0 -- 2.18 ▼FMC Maywood Dialysis 0 0 -- 2.18 ▼FMC Milton Freewater 0 0 -- 2.18 ▼Four Rivers Dialysis 0 0 -- 2.18 ▼Fresenius Medical Care Dialysis Services - Oregon, LLC - Corvallis 0 0 -- 2.18 ▼Fresenius Medical Care Dialysis Services - Oregon, LLC - Mt. Hood 0 14 0.00 2.18 ▼Fresenius Medical Care Florence Dialysis 0 0 -- 2.18 ▼Grants Pass II 0 0 -- 2.18 ▼Gresham Dialysis Center 0 0 -- 2.18 ▼Hermiston Dialysis Center 0 0 -- 2.18 ▼Hillsboro Dialysis Center 0 0 -- 2.18 ▼Klamath Falls Dialysis 0 0 -- 2.18 ▼Lake Road Dialysis 0 0 -- 2.18 ▼Lebanon Dialysis 0 0 -- 2.18 ▼McMinnville Dialysis 0 0 -- 2.18 ▼Meridian Park Dialysis 0 0 -- 2.18 ▼Newport Oregon 0 0 -- 2.18 ▼Northeast Portland Renal Center 0 1 0.00 2.18 ▼Oregon Kidney Center 0 0 -- 2.18 ▼Pacific Northwest Dialysis Services, L.L.C. - Beaverton 0 3 0.00 2.18 ▼Pacific Northwest Renal Services, L.L.C. - Astoria 0 0 -- 2.18 ▼Pacific Northwest Renal Services, L.L.C. - Clackamas 0 0 -- 2.18 ▼Pacific Northwest Renal Services, L.L.C. - Hollywood 0 0 -- 2.18 ▼Pacific Northwest Renal Services, L.L.C. - Newberg 0 0 -- 2.18 ▼Pacific Northwest Renal Services, L.L.C. - St. Helens 0 0 -- 2.18 ▼Pacific Northwest Renal Services, L.L.C. - Tualatin 1 0 -- 2.18 ▼Pacific Northwest Renal Services, L.L.C. - Twin Oaks 0 0 -- 2.18 ▼PNRS Columbia River The Dalles 0 0 -- 2.18 ▼QCI Bend 0 0 -- 2.18 ▼Qualicenters Salem, LLC 0 0 -- 2.18 ▼Qualicenters-Albany 0 20 0.00 2.18 ▼Ray Yasui Dialysis Center 0 0 -- 2.18 ▼Redmond Dialysis 0 9 0.00 2.18 ▼Redwood Dialysis 0 0 -- 2.18 ▼Rogue Valley Dialysis 0 0 -- 2.18 ▼Rose Quarter Dialysis 0 0 -- 2.18 ▼Roseburg-Mercy 0 0 -- 2.18 ▼Salem Dialysis 0 0 -- 2.18 ▼Salem North Dialysis 0 0 -- 2.18 ▼Sherwood Dialysis Center 0 0 -- 2.18 ▼Springfield Oregon Dialysis 0 0 -- 2.18 ▼THC/PNRS LLC - Raines 0 7 0.00 2.18 ▼Tillamook Dialysis Center 0 0 -- 2.18 ▼Walker Road Dialysis 0 0 -- 2.18 ▼West Linn Dialysis Center 0 0 -- 2.18 ▼West Salem 0 0 -- 2.18 ▼Willamette Valley Renal Center 0 4 0.00 2.18 ▼Woodburn 0 1 0.00 2.18 ▼
Nontunneled Central Line

72
Health care worker influenza vaccination
The number of health care workers receiving an influenza vaccine is recorded in each health care facility. This information is important because influenza vaccinations are highly effective in preventing influenza-related respiratory illnesses such as pneumonia. Patients aged 50 years or more are particularly vulnerable to severe disease. Vaccination during the influenza season protects them from severe and sometimes deadly lung disease. Knowing vaccination counts and rates helps health care facilities to determine strategies and set goals to improve influenza vaccination. Higher numbers and rates are better when looking at vaccination. Sixty hospitals, 139 long-term care facilities and 84 ambulatory surgical centers reported vaccination rates in 2013. Vaccination rates in hospitals ranged from 40–94% and <5%–100% in LTCFs and ASCs. Vaccination rates increased in all three types of health care facilities from the 2010–2011 to the 2012–2013 Influenza season.
Figure 20. Percentage of health care workers that received the influenza vaccine between the 2010–2011 and 2012–2013 influenza season.
The Healthy People initiative of the U.S. Department of Health and Human Services (HHS) has set a national objective for health care worker Influenza vaccination at 90% by the year 2020. For the 2012–2013 influenza season, 3 hospitals have already met this goal.

73
Figure 21: Hospital overall influenza vaccination percentages, 2012–2013 season.
■ Facility with percent of healthcare workers vaccinated above 90%■ Facility with percent of healthcare workers vaccinated above 75%■ Facility with percent of healthcare workers vaccinated above 50%■ Facility with percent of healthcare workers vaccinated below 50%
Fifty-two percent (31/60) of hospitals met the 75% overall vaccination goal for Healthy People 2015 (Figure 21). In addition, 5% (3/60) of hospitals met the 90% overall vaccination goal for 2020.
Healthy People 2020 Goal (90%
)
Healthy People 2015 Goal (75%
)
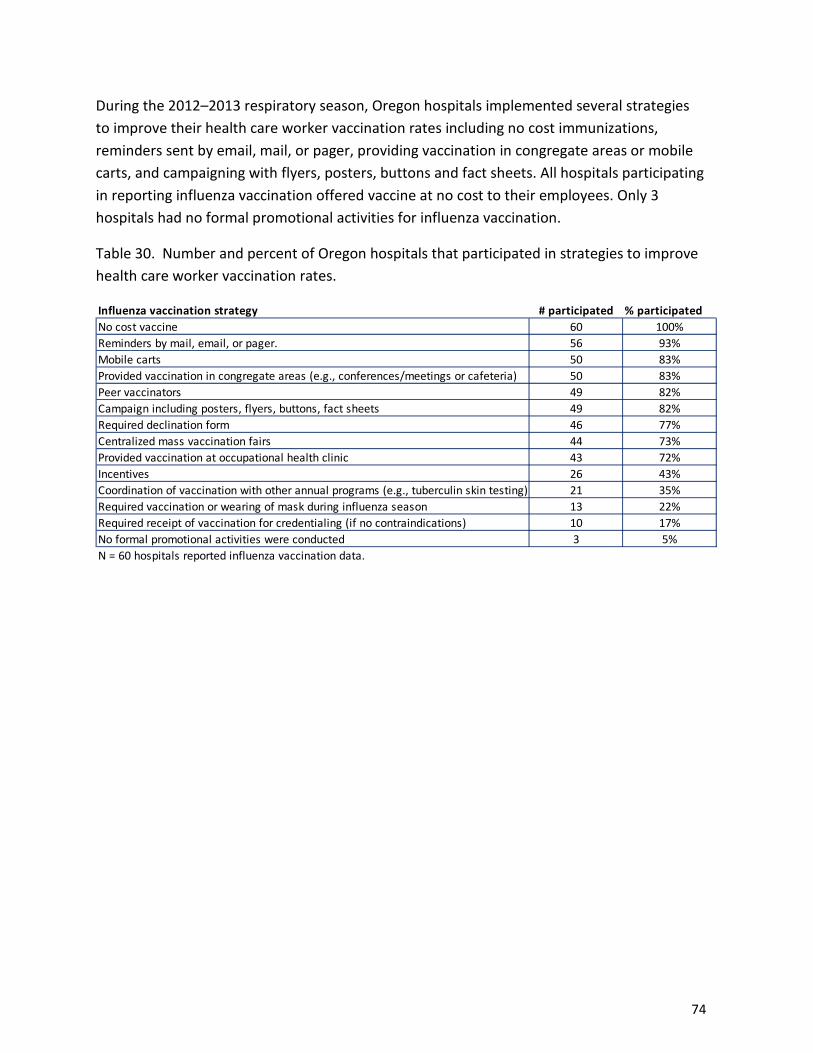
74
During the 2012–2013 respiratory season, Oregon hospitals implemented several strategies to improve their health care worker vaccination rates including no cost immunizations, reminders sent by email, mail, or pager, providing vaccination in congregate areas or mobile carts, and campaigning with flyers, posters, buttons and fact sheets. All hospitals participating in reporting influenza vaccination offered vaccine at no cost to their employees. Only 3 hospitals had no formal promotional activities for influenza vaccination.
Table 30. Number and percent of Oregon hospitals that participated in strategies to improve health care worker vaccination rates.
Influenza vaccination strategy # participated % participatedNo cost vaccine 60 100%Reminders by mail, email, or pager. 56 93%Mobile carts 50 83%Provided vaccination in congregate areas (e.g., conferences/meetings or cafeteria) 50 83%Peer vaccinators 49 82%Campaign including posters, flyers, buttons, fact sheets 49 82%Required declination form 46 77%Centralized mass vaccination fairs 44 73%Provided vaccination at occupational health clinic 43 72%Incentives 26 43%Coordination of vaccination with other annual programs (e.g., tuberculin skin testing) 21 35%Required vaccination or wearing of mask during influenza season 13 22%Required receipt of vaccination for credentialing (if no contraindications) 10 17%No formal promotional activities were conducted 3 5%N = 60 hospitals reported influenza vaccination data.
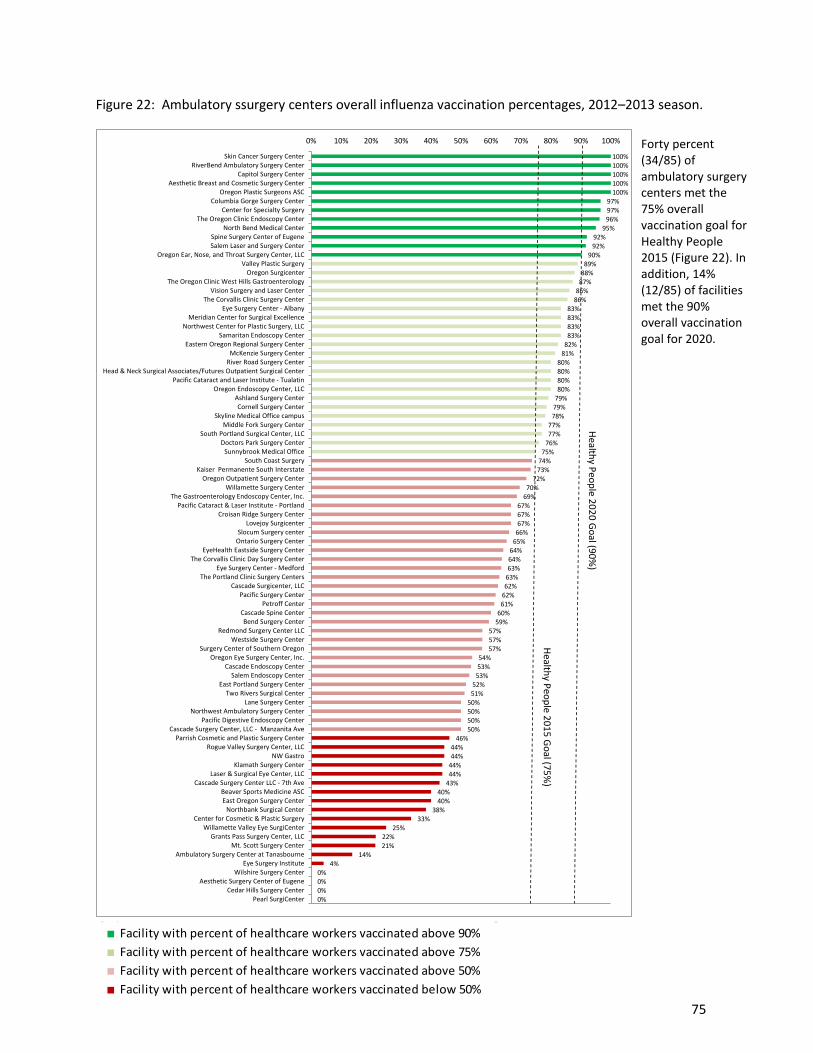
75
Figure 22: Ambulatory ssurgery centers overall influenza vaccination percentages, 2012–2013 season.
0%0%0%0%
4%14%
21%22%
25%33%
38%40%40%
43%44%44%44%44%
46%50%50%50%50%
51%52%
53%53%54%
57%57%57%
59%60%
61%62%62%63%63%64%64%
65%66%67%67%67%
69%70%
72%73%74%75%
76%77%77%
78%79%79%80%80%80%80%
81%82%83%83%83%83%
86%86%87%88%89%
90%92%92%
95%96%97%97%
100%100%100%100%100%
0% 10% 20% 30% 40% 50% 60% 70% 80% 90% 100%
Pearl SurgiCenterCedar Hills Surgery Center
Aesthetic Surgery Center of EugeneWilshire Surgery Center
Eye Surgery InstituteAmbulatory Surgery Center at Tanasbourne
Mt. Scott Surgery CenterGrants Pass Surgery Center, LLC
Willamette Valley Eye SurgiCenterCenter for Cosmetic & Plastic Surgery
Northbank Surgical CenterEast Oregon Surgery CenterBeaver Sports Medicine ASC
Cascade Surgery Center LLC - 7th AveLaser & Surgical Eye Center, LLC
Klamath Surgery CenterNW Gastro
Rogue Valley Surgery Center, LLCParrish Cosmetic and Plastic Surgery Center
Cascade Surgery Center, LLC - Manzanita AvePacific Digestive Endoscopy Center
Northwest Ambulatory Surgery CenterLane Surgery Center
Two Rivers Surgical CenterEast Portland Surgery Center
Salem Endoscopy CenterCascade Endoscopy Center
Oregon Eye Surgery Center, Inc.Surgery Center of Southern Oregon
Westside Surgery CenterRedmond Surgery Center LLC
Bend Surgery CenterCascade Spine Center
Petroff CenterPacific Surgery Center
Cascade Surgicenter, LLCThe Portland Clinic Surgery Centers
Eye Surgery Center - MedfordThe Corvallis Clinic Day Surgery Center
EyeHealth Eastside Surgery CenterOntario Surgery CenterSlocum Surgery center
Lovejoy SurgicenterCroisan Ridge Surgery Center
Pacific Cataract & Laser Institute - PortlandThe Gastroenterology Endoscopy Center, Inc.
Willamette Surgery CenterOregon Outpatient Surgery Center
Kaiser Permanente South InterstateSouth Coast Surgery
Sunnybrook Medical OfficeDoctors Park Surgery Center
South Portland Surgical Center, LLCMiddle Fork Surgery Center
Skyline Medical Office campusCornell Surgery Center
Ashland Surgery CenterOregon Endoscopy Center, LLC
Pacific Cataract and Laser Institute - TualatinHead & Neck Surgical Associates/Futures Outpatient Surgical Center
River Road Surgery CenterMcKenzie Surgery Center
Eastern Oregon Regional Surgery CenterSamaritan Endoscopy Center
Northwest Center for Plastic Surgery, LLCMeridian Center for Surgical Excellence
Eye Surgery Center - AlbanyThe Corvallis Clinic Surgery Center
Vision Surgery and Laser CenterThe Oregon Clinic West Hills Gastroenterology
Oregon SurgicenterValley Plastic Surgery
Oregon Ear, Nose, and Throat Surgery Center, LLCSalem Laser and Surgery CenterSpine Surgery Center of Eugene
North Bend Medical CenterThe Oregon Clinic Endoscopy Center
Center for Specialty SurgeryColumbia Gorge Surgery Center
Oregon Plastic Surgeons ASCAesthetic Breast and Cosmetic Surgery Center
Capitol Surgery CenterRiverBend Ambulatory Surgery Center
Skin Cancer Surgery CenterForty percent (34/85) of ambulatory surgery centers met the 75% overall vaccination goal for Healthy People 2015 (Figure 22). In addition, 14% (12/85) of facilities met the 90% overall vaccination goal for 2020.
Healthy People 2020 Goal (90%)
Healthy People 2015 Goal (75%)
■ Facility with percent of healthcare workers vaccinated above 90%■ Facility with percent of healthcare workers vaccinated above 75%■ Facility with percent of healthcare workers vaccinated above 50%■ Facility with percent of healthcare workers vaccinated below 50%

76
During the 2012–2013 respiratory season, Oregon ambulatory surgery centers implemented several strategies to improve their health care worker vaccination rates, including required declination forms, reminders sent by email, mail or pager, peer vaccinators, campaigning with flyers, buttons and fact sheets, and provided vaccination in congregate areas. Seventy-three percent of ambulatory surgery centers participating in reporting influenza vaccination offered vaccine at no cost to their employees. Only 4 ambulatory surgery centers offered any type of incentive.
Table 31. Number and percent of Oregon ambulatory surgery centers that participated in strategies to improve health care worker vaccination rates.
Influenza vaccination strategy # participated % participatedNo cost vaccine 62 73%Required declination form 49 58%Reminders by mail, email, or pager. 40 47%Peer vaccinators 36 42%Campaign including posters, flyers, buttons, fact sheets 31 36%Provided vaccination in congregate areas (e.g., conferences/meetings or cafeteria) 23 27%No formal promotional activities were conducted 18 21%Mobile carts 14 16%Provided vaccination at occupational health clinic 11 13%Centralized mass vaccination fairs 10 12%Coordination of vaccination with other annual programs (e.g., tuberculin skin testing) 9 11%Required vaccination or wearing of mask during influenza season 5 6%Required receipt of vaccination for credentialing (if no contraindications) 5 6%Incentives 4 5%N = 85 ambulatory surgical centers reported influenza vaccination data.

77
Figure 23: Long-term care facility overall influenza vaccination percentages, 2012–2013 season.
61%61%61%62%62%63%63%63%64%64%64%64%64%65%
67%67%68%68%
70%71%71%71%72%72%72%72%72%73%73%73%74%74%74%75%75%76%76%76%76%
78%79%79%80%80%81%81%81%82%82%82%82%83%83%83%
85%87%87%88%88%89%89%
90%91%91%92%93%
96%96%
99%100%
0% 10% 20% 30% 40% 50% 60% 70% 80% 90% 100%
Umpqua Valley Nursing and Rehabilitation CenterThe Dalles Health and Rehabilitation
Gracelen TerraceTown Center Village Rehab
Sherwood Park Nursing & Rehab CenterMarquis Wilsonville
Columbia Care CenterRegency Hermiston
Lifecare Center McMinnvilleOregon City Health Care Center
Mennonite VillageAvamere Rehabilitation of Oregon City
Corvallis Manor Nursing and Rehabilitation CenterMarquis Care at Hope Village
Coast Fork Nursing CenterCascade Terrace
Tierra Rose Care CenterMolalla Manor Care Center
Green Valley nursing and rehabilitation CenterLinda Vista Nursing & Rehabilitation
Portland Health and RehabWillowbrook Terrace
Rose Villa Senior LivingGSS Fairlawn Village
Hearthstone Nursing & Rehabilitation CenterPilot Butte RehabCare Center East
Marquis Vermont HillsRegency Albany
Prestige Care & Rehab - Menlo ParkLaurel Hill Nursing and Rehab Center
Good Samaritan Society Eugene VillageGlisan Care Center
Independence Health and RehabPrestige Care and Rehab of Reedwood
Fernhill EstatesFrench Prairie Nursing and Rehab Center
Kindred Sunnyside Care CenterGateway Care & Retirement
Providence Child CenterAvamere Medford at Three Fountains
Avamere Twin Oaks of Sweet HomeCascade View Nursing and Alzheimer's
Cornerstone Care OptionFriendsview Manor
South Hills Rehabilitation CenterMarquis Silver Gardens
Pacific Health & RehabilitationColumbia Basin Care Facility
Regency FlorenceMilton Freewater Health and Rehabilitation Center
Marquis CentennialForest Grove Rehabilitation and Care Center
Wallowa Valley Care Center (Wallowa Co. Healthcare District)Providence Seaside- Long term care unit
Avamere Riverpark Of EugeneOchoco Care Center
Marquis NewbergLa Grande Post Acute RehabSaint Alphonsus Care Center
Blue Mountain Nursing HomeAvamere Health Services of Rogue Valley
Marquis Powellhurst Post Acute RehabMarquis Forest Grove
Village Health CareChehalem Health and Rehabilitation
Creswell Health and Rehabilitation CenterWindsor Health and Rehabilitation
Timberview Care CenterAvamere of Junction City
Healthy People 2015 Goal (75%)
Healthy People 2020 Goal (90%)
■ Facility with percent of healthcare workers vaccinated above 90%■ Facility with percent of healthcare workers vaccinated above 75%■ Facility with percent of healthcare workers vaccinated above 50%■ Facility with percent of healthcare workers vaccinated below 50%
Twenty-seven percent (37/139) of long-term care facilities met the 75% overall vaccination goal for Healthy People 2015 (Figure 23). In addition, 6.5% (9/139) of facilities met the 90% overall vaccination goal for 2020.

78
Figure 23 cont.: Long-term care facility overall influenza vaccination percentages, 2012–2013 season.
0%3%
5%9%
14%14%
18%20%
21%22%
24%25%25%25%25%
27%29%29%29%
32%33%33%34%34%34%
35%37%37%37%38%38%38%38%
40%41%41%
43%43%43%
44%45%45%45%45%46%
48%48%48%
52%52%
49%50%
54%55%
56%54%
57%57%57%58%58%58%59%
62%60%60%60%61%61%
0% 10% 20% 30% 40% 50% 60% 70% 80% 90% 100%
Village ManorCrestview of PortlandAvamere South Salem
Marquis Oregon City Poste Acute RehabHealthcare at Foster Creek
Empres HillsboroOakwood Country Place
The Village at HillsideGresham Rehab & Specialty Care
Marquis Mt TaborWest Hills Health and Rehab
Meadow ParkMarquis Autumn Hills
Dallas Retirement VillageTrinity Mission Health & Rehab of Portland, LLC
Avamere Rehabilitation of King CityHolgate Community
Laurelhurst VillageHolladay Park Plaza
Park Forest Care CenterAvamere Rehabilitation of Lebanon
Avamere Rehabilitation of BeavertonGood Samaritan Curry Village
Rose Linn Care CenterRegency Gresham Nursing and Rehabilitation Center
The PearlValley West Health Care Center
Cascade ManorLawrence Convalescent Center
Pioneer Nursing HomeRedmond Health Care CenterMarian Estates Reece Center
Robison Jewish Health CenterMarquis Companies Springfield
Fair View Transitional Health CenterMarquis Plum Ridge
Willamette View Health CenterHood River Care Center
Sheridan Care CenterAvamere Rehabilitation of ClackamasEast Cascade Retirement Community
Mirabella PortlandBaycrest Village
Mary's Woods at MarylhurstAvamere Rehabilitation of Eugene
Presbyterian Community Care CenterAvamere Rehabilitation of Coos Bay
Rose City Nursing HomeRogue Valley ManorVista Specialty Care
Lifecare Center of Coos BayClatsop Care Center
Lake District Long Term CareRoyale Gardens Health and Rehabilitation Center
Harmony HouseProvidence Benedictine
Avamere Court at KeizerMyrtle Point Care Center
Avamere rehabilitation of HillsboroAidan Senior Living at Reedsport
Hillside HeightsMilwaukie Convalescent Center
Highland House Nursing and Rehabilitation CenterMarquis Companies at Piedmont
Porthaven Care CenterRoseHaven Nursing Center
Maryville Nursing HomeNehalem Valley Care Center
Avamere of Newport Rehabilitation and Specialty Care
Healthy People 2020 Goal (90%)
Healthy People 2015 Goal (75%)
■ Facility with percent of healthcare workers vaccinated above 90%■ Facility with percent of healthcare workers vaccinated above 75%■ Facility with percent of healthcare workers vaccinated above 50%■ Facility with percent of healthcare workers vaccinated below 50%
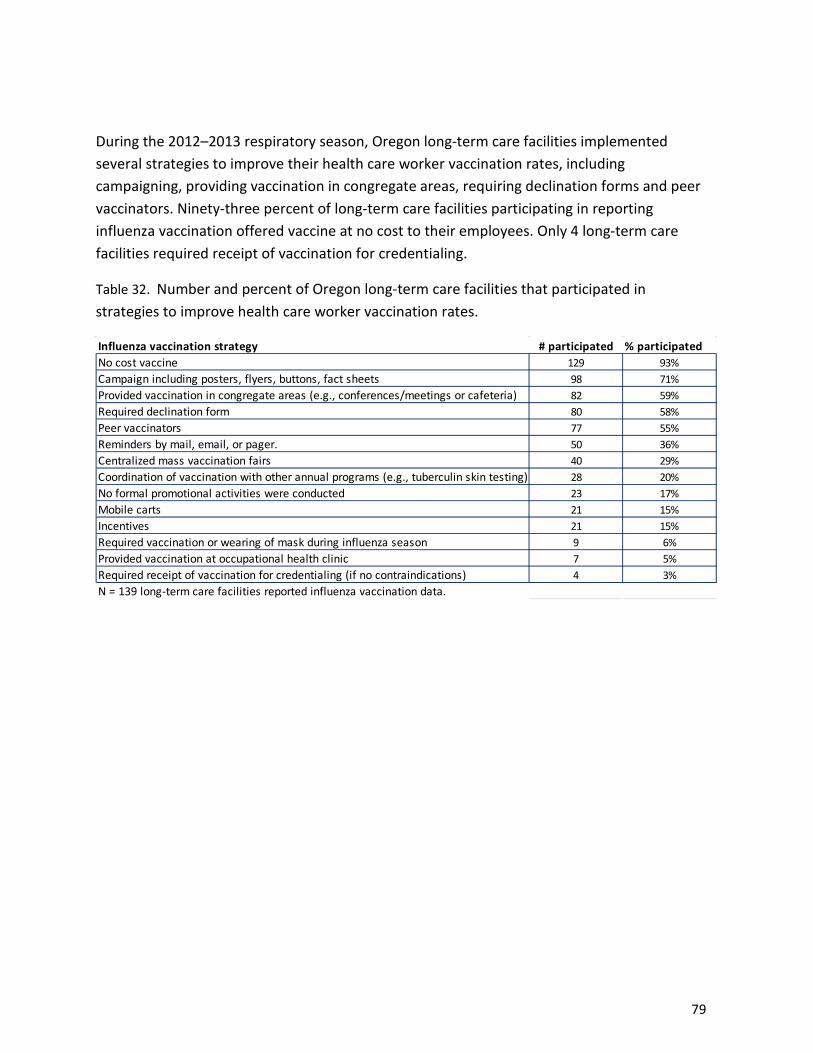
79
During the 2012–2013 respiratory season, Oregon long-term care facilities implemented several strategies to improve their health care worker vaccination rates, including campaigning, providing vaccination in congregate areas, requiring declination forms and peer vaccinators. Ninety-three percent of long-term care facilities participating in reporting influenza vaccination offered vaccine at no cost to their employees. Only 4 long-term care facilities required receipt of vaccination for credentialing.
Table 32. Number and percent of Oregon long-term care facilities that participated in strategies to improve health care worker vaccination rates.
Influenza vaccination strategy # participated % participatedNo cost vaccine 129 93%Campaign including posters, flyers, buttons, fact sheets 98 71%Provided vaccination in congregate areas (e.g., conferences/meetings or cafeteria) 82 59%Required declination form 80 58%Peer vaccinators 77 55%Reminders by mail, email, or pager. 50 36%Centralized mass vaccination fairs 40 29%Coordination of vaccination with other annual programs (e.g., tuberculin skin testing) 28 20%No formal promotional activities were conducted 23 17%Mobile carts 21 15%Incentives 21 15%Required vaccination or wearing of mask during influenza season 9 6%Provided vaccination at occupational health clinic 7 5%Required receipt of vaccination for credentialing (if no contraindications) 4 3%N = 139 long-term care facilities reported influenza vaccination data.

80
Surgical Care Improvement Project (SCIP)
Hospitals that perform surgical procedures identified by CMS for mandatory reporting must submit data for Recommended Care Measures. These measures examine the number of times a patient receives appropriate care before, during and after a surgical procedure. Information is collected from patient medical records and is reviewed by CMS for consistency. The percentage of eligible patients receiving recommended treatment is reported in this document. Higher percentages are better. Figure 24. Surgical Care Improvement Project (SCIP) Process of Care Measures 2009–2013
SCIP 1 (Prophylactic antibiotic received within one hour prior to surgical incision)
This measures the percent of eligible surgical patients who receive prophylactic antibiotics within one hour prior to surgical incision. Patients who receive antibiotics at the appropriate time prior to surgery are less likely to get wound infections. In 2013, 97.5% of eligible surgical patients received antibiotics within one hour prior to surgical incision. This is 7% higher than in 2009.
0
0.2
0.4
0.6
0.8
1
SCIP 1 SCIP 2 SCIP 3 SCIP 4 SCIP 9 SCIP 10
Procedures Meeting Stan
dard (%)
2009 2010 2011 2012 2013

81
SCIP 2 (Prophylactic antibiotic selection for surgical patients) • This measures the percent of eligible surgical patients who receive appropriate
antibiotics specific to each type of surgical procedure. Patients who receive surgery specific preventative antibiotics reduce their risk of infection. In 2013, 98.7% of eligible surgical patients received appropriate antibiotics specific to their type of surgical procedure. This is 4% higher than in 2009.
SCIP 3 (Prophylactic antibiotic discontinued within 24 hours after surgery end time)
• This measures the percent of eligible surgical patients whose antibiotics were discontinued within 24 hours after a surgical procedure. Patients whose antibiotics are discontinued within 24 hours reduce their risk of side effects including stomach aches and serious diarrhea. Also, continual use of unnecessary antibiotics can lead to bacterial resistance and antibiotics not working as well. In 2013, 97.4% of eligible surgical patients had their antibiotics discontinued within 24 hours after surgery end time. This is 7% higher than in 2009.
SCIP 4 (Cardiac surgery patients with controlled 6 a.m. postoperative blood glucose)
• This measures the percent of eligible surgical patients whose blood sugar is kept within normal range in the days following a surgery. Patients who have uncontrolled blood glucose levels have a higher risk of infection. In 2013, 97.1% of eligible surgical patients had blood sugar levels within a normal range in the days following surgery. Reporting for this measure began in 2012 and has increased 2% since then.
SCIP 9 (Urinary catheter removed on postoperative day 1 or postoperative day 2 with the day of surgery being day zero)
• This measures the percent of eligible surgical patients who had a urinary catheter removed on the first or second day after surgery. The risk for a urinary tract infection increases with longer durations of indwelling urinary catheters. In 2013, 96.1% of eligible surgical patients had their urinary catheter removed on postoperative day 1 or 2. Reporting for this measure began in 2012 and has increased by 2% since then.
SCIP 10 (Surgery patients with perioperative temperature management)
• This measures the percent of eligible surgical patients who required active warming in the operating room or those whose body temperature was normal within 30 minutes immediately before and 15 minutes immediately after anesthesia end time. Patients that have normal body temperatures before, during and after an operation have a decreased risk of infection and decreased

82
risk of delayed wound closures. In 2013, 99.8% of eligible surgical patients had normal temperatures before and after their surgical procedure. Reporting for this measure began in 2012 and has increased 0.2% since then.
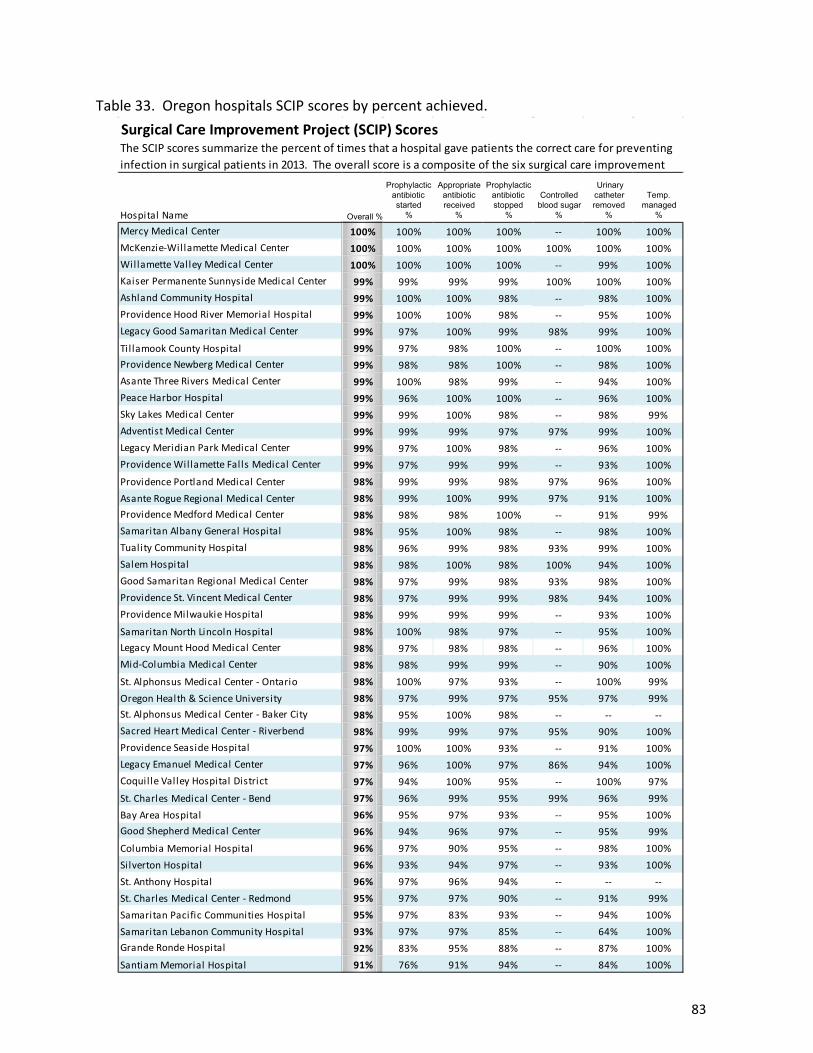
83
Table 33. Oregon hospitals SCIP scores by percent achieved.
Hospital Name Overall %
Prophylactic antibiotic started
%
Appropriate antibiotic received
%
Prophylactic antibiotic stopped
%
Controlled blood sugar
%
Urinary catheter removed
%
Temp. managed
%
Mercy Medical Center 100% 100% 100% 100% -- 100% 100%McKenzie-Willamette Medical Center 100% 100% 100% 100% 100% 100% 100%Willamette Valley Medical Center 100% 100% 100% 100% -- 99% 100%Kaiser Permanente Sunnyside Medical Center 99% 99% 99% 99% 100% 100% 100%Ashland Community Hospital 99% 100% 100% 98% -- 98% 100%Providence Hood River Memorial Hospital 99% 100% 100% 98% -- 95% 100%Legacy Good Samaritan Medical Center 99% 97% 100% 99% 98% 99% 100%Tillamook County Hospital 99% 97% 98% 100% -- 100% 100%Providence Newberg Medical Center 99% 98% 98% 100% -- 98% 100%Asante Three Rivers Medical Center 99% 100% 98% 99% -- 94% 100%Peace Harbor Hospital 99% 96% 100% 100% -- 96% 100%Sky Lakes Medical Center 99% 99% 100% 98% -- 98% 99%Adventist Medical Center 99% 99% 99% 97% 97% 99% 100%Legacy Meridian Park Medical Center 99% 97% 100% 98% -- 96% 100%Providence Willamette Falls Medical Center 99% 97% 99% 99% -- 93% 100%Providence Portland Medical Center 98% 99% 99% 98% 97% 96% 100%Asante Rogue Regional Medical Center 98% 99% 100% 99% 97% 91% 100%Providence Medford Medical Center 98% 98% 98% 100% -- 91% 99%Samaritan Albany General Hospital 98% 95% 100% 98% -- 98% 100%Tuality Community Hospital 98% 96% 99% 98% 93% 99% 100%Salem Hospital 98% 98% 100% 98% 100% 94% 100%Good Samaritan Regional Medical Center 98% 97% 99% 98% 93% 98% 100%Providence St. Vincent Medical Center 98% 97% 99% 99% 98% 94% 100%Providence Milwaukie Hospital 98% 99% 99% 99% -- 93% 100%Samaritan North Lincoln Hospital 98% 100% 98% 97% -- 95% 100%Legacy Mount Hood Medical Center 98% 97% 98% 98% -- 96% 100%Mid-Columbia Medical Center 98% 98% 99% 99% -- 90% 100%St. Alphonsus Medical Center - Ontario 98% 100% 97% 93% -- 100% 99%Oregon Health & Science University 98% 97% 99% 97% 95% 97% 99%St. Alphonsus Medical Center - Baker City 98% 95% 100% 98% -- -- --Sacred Heart Medical Center - Riverbend 98% 99% 99% 97% 95% 90% 100%Providence Seaside Hospital 97% 100% 100% 93% -- 91% 100%Legacy Emanuel Medical Center 97% 96% 100% 97% 86% 94% 100%Coquille Valley Hospital District 97% 94% 100% 95% -- 100% 97%St. Charles Medical Center - Bend 97% 96% 99% 95% 99% 96% 99%Bay Area Hospital 96% 95% 97% 93% -- 95% 100%Good Shepherd Medical Center 96% 94% 96% 97% -- 95% 99%Columbia Memorial Hospital 96% 97% 90% 95% -- 98% 100%Silverton Hospital 96% 93% 94% 97% -- 93% 100%St. Anthony Hospital 96% 97% 96% 94% -- -- --St. Charles Medical Center - Redmond 95% 97% 97% 90% -- 91% 99%Samaritan Pacific Communities Hospital 95% 97% 83% 93% -- 94% 100%Samaritan Lebanon Community Hospital 93% 97% 97% 85% -- 64% 100%Grande Ronde Hospital 92% 83% 95% 88% -- 87% 100%Santiam Memorial Hospital 91% 76% 91% 94% -- 84% 100%
Surgical Care Improvement Project (SCIP) ScoresThe SCIP scores summarize the percent of times that a hospital gave patients the correct care for preventing infection in surgical patients in 2013. The overall score is a composite of the six surgical care improvement

84
Appendices: HAI forest plots and hospital responses.
HAI forest plots The HAI forest plot is a graphical display that shows the SIR value of each hospital with corresponding confidence intervals. The example below shows how to interpret information in the HAI forest plots.
SIR = 1.51 Confidence interval = 1.29–1.76 The SIR estimate for this hospital is 1.51. This means this hospital has 51% more HAIs than the national baseline. The confidence interval is statistically significant which means the SIR estimate is different than the national baseline.
SIR = 1.41 Confidence interval = 0.2–1.4 The SIR estimate for this hospital is 1.41. This means this hospital had 41% more HAIs than the national baseline. However, the confidence interval is not statistically significant which means the SIR estimate should be interpreted as no different than the national baseline.

85
Figure 25. Oregon hospital’s SIR with confidence intervals for adult ICU CLABSIs in 2013.
• Hospital SIR │─│ Confidence interval - Hospitals with an expected number of infection <1, with at least one CLABSI in 2013
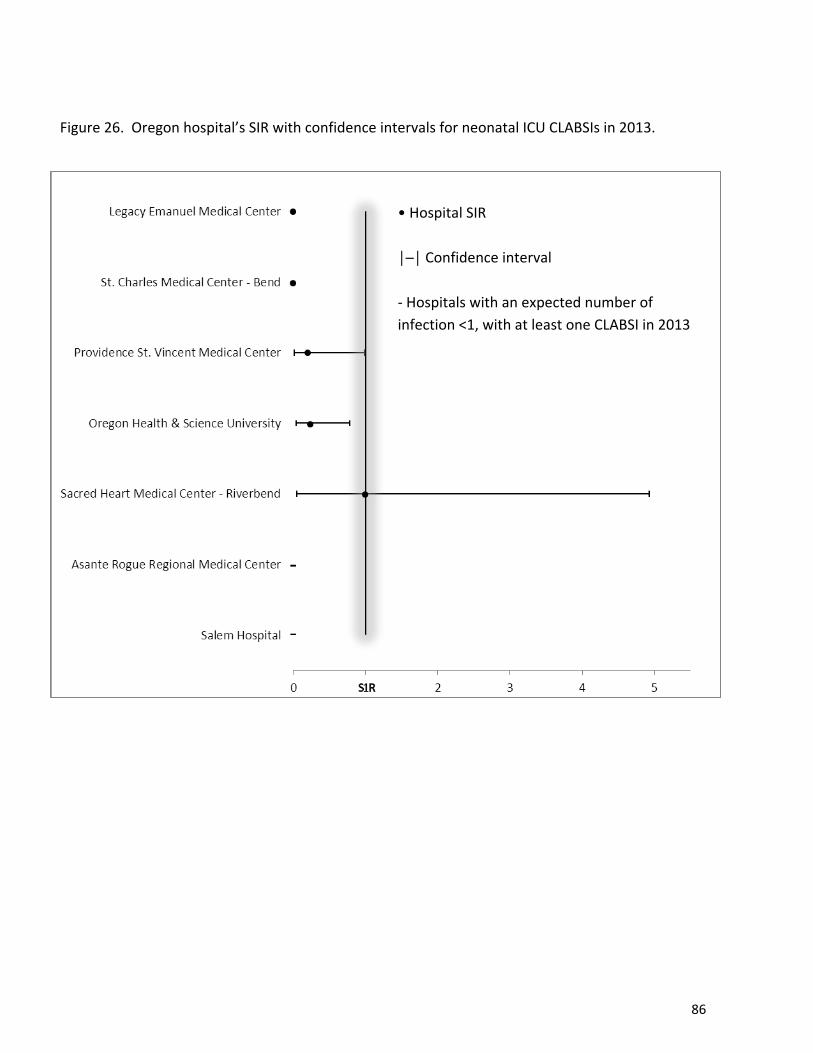
86
Figure 26. Oregon hospital’s SIR with confidence intervals for neonatal ICU CLABSIs in 2013.
• Hospital SIR │─│ Confidence interval - Hospitals with an expected number of infection <1, with at least one CLABSI in 2013

87
Figure 27. Oregon hospital’s SIR with confidence intervals for CBGB SSIs in 2013.
• Hospital SIR │─│ Confidence interval - Hospitals with an expected number of infection <1, with at least one CLABSI in 2013

88
Figure 28. Oregon hospital’s SIR with confidence intervals for COLO SSIs in 2013.
• Hospital SIR │─│ Confidence interval - Hospitals with an expected number of infection <1, with at least one CLABSI in 2013
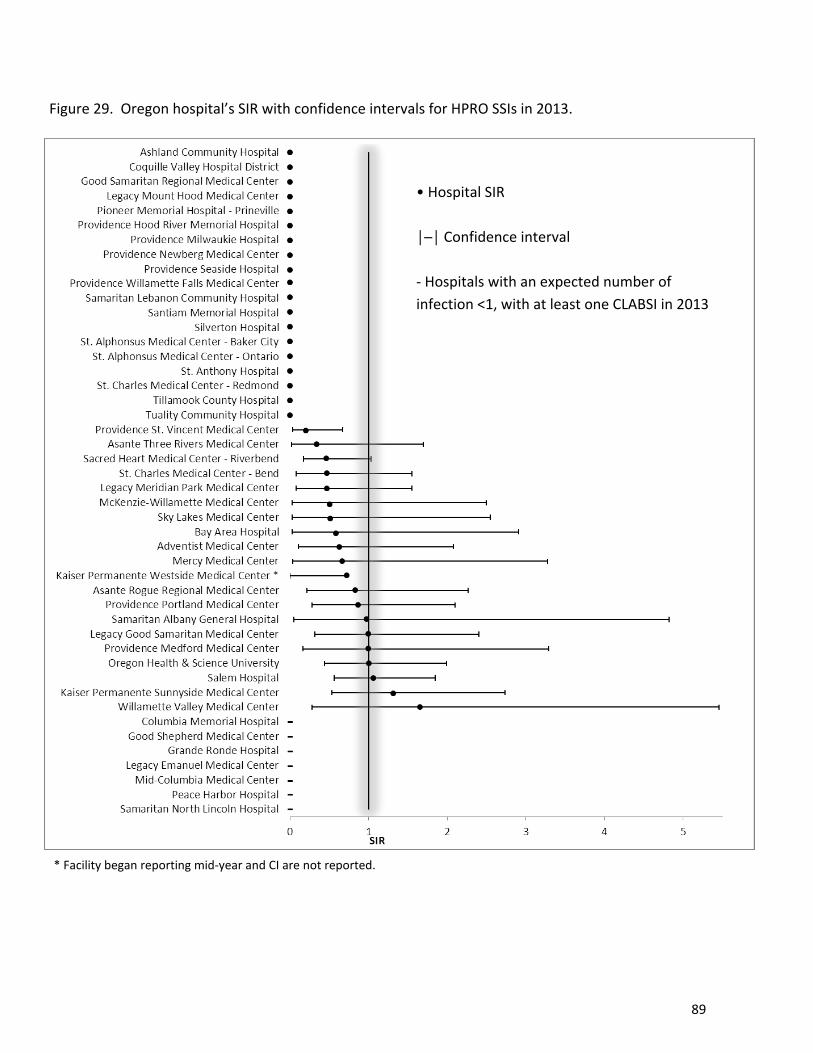
89
Figure 29. Oregon hospital’s SIR with confidence intervals for HPRO SSIs in 2013.
• Hospital SIR │─│ Confidence interval - Hospitals with an expected number of infection <1, with at least one CLABSI in 2013
* Facility began reporting mid-year and CI are not reported.

90
Figure 30. Oregon hospital’s SIR with confidence intervals for HYST SSIs in 2013.
• Hospital SIR │─│ Confidence interval - Hospitals with an expected number of infection <1, with at least one CLABSI in 2013
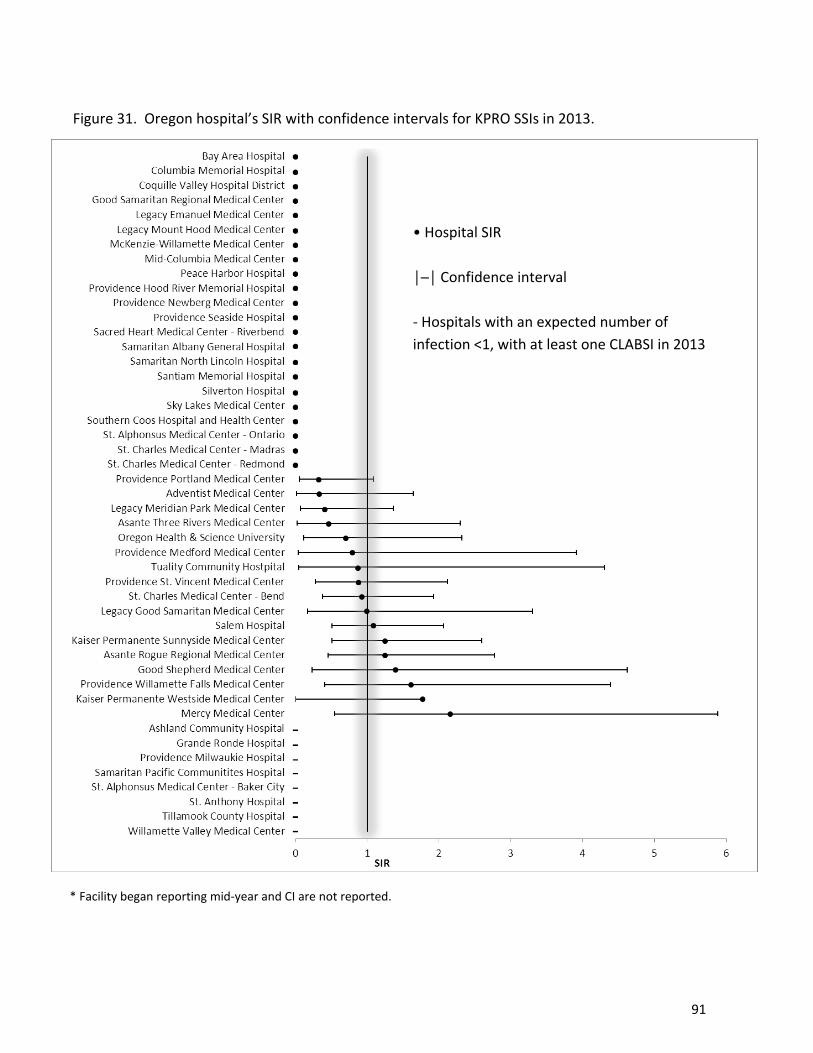
91
Figure 31. Oregon hospital’s SIR with confidence intervals for KPRO SSIs in 2013.
• Hospital SIR │─│ Confidence interval - Hospitals with an expected number of infection <1, with at least one CLABSI in 2013
* Facility began reporting mid-year and CI are not reported.
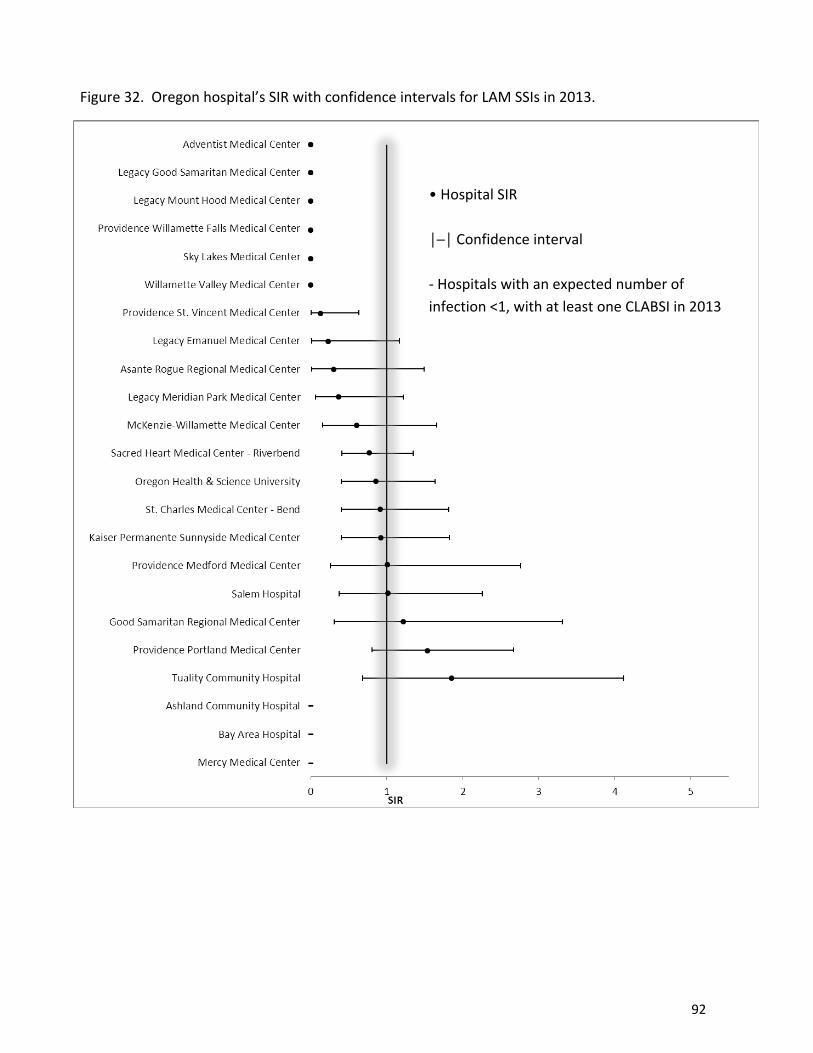
92
Figure 32. Oregon hospital’s SIR with confidence intervals for LAM SSIs in 2013.
• Hospital SIR │─│ Confidence interval - Hospitals with an expected number of infection <1, with at least one CLABSI in 2013
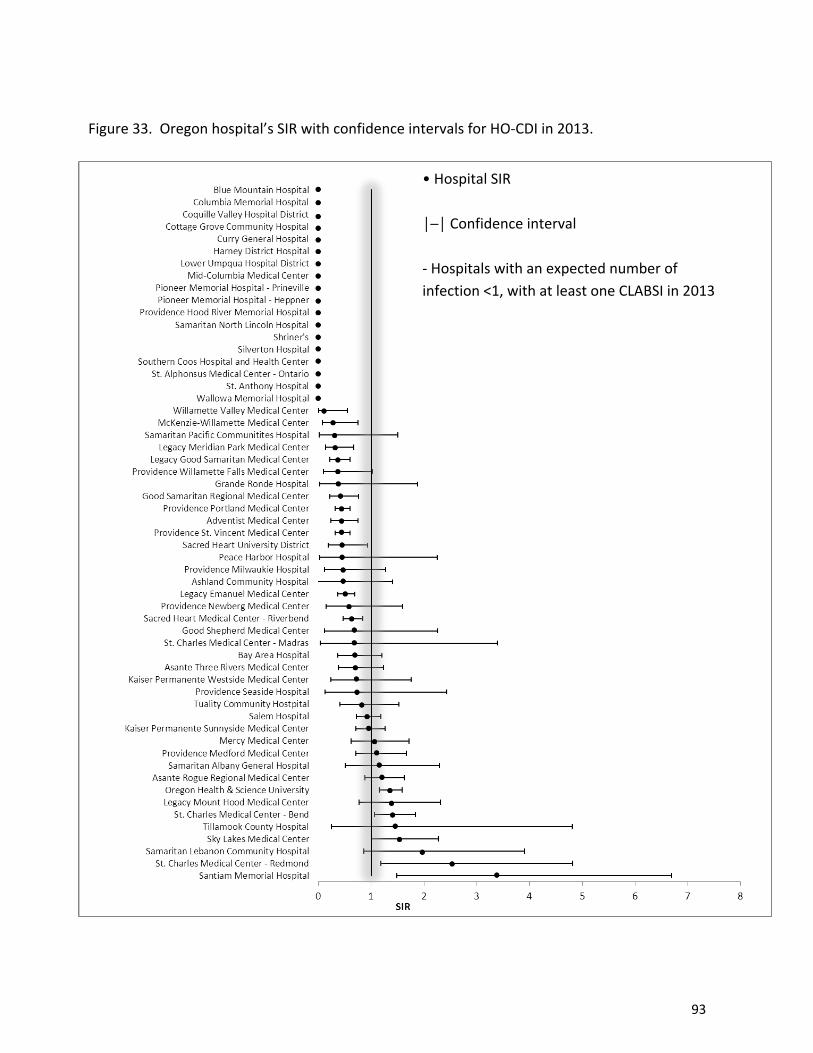
93
Figure 33. Oregon hospital’s SIR with confidence intervals for HO-CDI in 2013.
• Hospital SIR │─│ Confidence interval - Hospitals with an expected number of infection <1, with at least one CLABSI in 2013
94
Hospital comments Good Samaritan Regional Medical Center Good Samaritan Regional Medical Center performs many laminectomies as outpatients. The numbers reported to OHA only include inpatient surgeries and their outcomes. The overall case count for laminectomies, including both inpatient and outpatient procedures, was 440 with a SSI number of 4. This number of infections was lower than what was expected by the CDC. Legacy Good Samaritan Medical Center
Legacy Good Samaritan Medical Center surgeons frequently perform necessary revisions to hip prosthesis implants that have been recalled due to adverse local tissue reactions. These procedures pose a higher risk of infection than primary hip replacement procedures.
Salem Health
Salem Health uses lean methodology to continuously improve processes in order to improve the care provided to patients. This work includes preventing infections.
In 2013 there was a significant reduction in surgical site infections for patients undergoing laminectomy and colon surgery. This was a result of strategies implemented collaboratively with the medical staff and hospital teams.
In Q 1 2014 there has been a 54% reduction in hospital onset C. difficile infections compared to Q 1 2013. This is a result of the organization’s focus on reducing patient harms through the prevention of hospital acquired infections.
Asante Rogue Regional Medical Center
Asante Rogue Regional Medical Center (ARRMC) is dedicated to providing outstanding customer service and medical excellence by reducing the risk of HAIs at our facility. By following evidence-based recommendations, we have made significant gains at reducing HAI rates in our surgical populations as well as in patients with central venous catheters and multi-drug resistant organisms (MDROs) in our in-patient population.
ARRMC’s Infection Prevention & Control Program is staffed by 6 specially trained infection control professionals, 2 of these are board certified infection preventionists (CIC). Program oversight is provided by the medical director with nearly 30 years of experience in infection control. The medical director is board certified in internal medicine, infectious disease and trained in health care epidemiology through CDC/SHEA.

95
Antibiotics are the most powerful tool in combating life-threatening bacterial diseases yet their effectiveness is compromised when they are used inappropriately. Our robust Antibiotic Stewardship Program, led by the medical director of infection control, has been working with the CDC/IHI Pilot Program for Antibiotic Stewardship on a national level.

This document can be provided upon request in an alternate format for individuals with disabilities or in a language other than English for people with limited English skills. To request this publication in another format or language, contact the Publications and Design Section at 503-378-3486, 711 for TTY, or email [email protected].
OHA8581 REV. (06.14)
PUBLIC HEALTH DIVISION971-673-1111 (phone)971-673-1100 (fax)
http://public.health.oregon.gov/DiseasesConditions/CommunicableDisease/HAI/Pages/index.aspx


