67
i
| Date post: | 09-Apr-2018 |
| Category: |
Documents |
| Upload: | gianni-elia |
| View: | 221 times |
| Download: | 0 times |

8/8/2019 Health Consumer powerhouse Report EHCI 2009 091001 final with cover
http://slidepdf.com/reader/full/health-consumer-powerhouse-report-ehci-2009-091001-final-with-cover 1/67
i
8/8/2019 Health Consumer powerhouse Report EHCI 2009 091001 final with cover
http://slidepdf.com/reader/full/health-consumer-powerhouse-report-ehci-2009-091001-final-with-cover 2/67
ii
Arne Björnberg, Ph.D., Beatriz Cebolla Garrofé, Ph.D. and
Sonja Lindblad
Health Consumer Powerhouse
2009-10-01
Number of pages: 66
This report may be freely quoted, referring to the source.
© Health Consumer Powerhouse AB, 2009.
ISBN 978-91-977879-1-8
Health Consumer Powerhouse
Euro Health Consumer Index
2009
Report

8/8/2019 Health Consumer powerhouse Report EHCI 2009 091001 final with cover
http://slidepdf.com/reader/full/health-consumer-powerhouse-report-ehci-2009-091001-final-with-cover 3/67
iii
Contents
1. SUMMARY ............................................................................................................................................................ 5
1.1 SOME INTERESTING COUNTRIES ........................................................................................................................................ 5 1.2 BBB; BISMARCK BEATS BEVERIDGE – YET AGAIN! ................................................................................................................ 9
2. INTRODUCTION ............................... ............................... ............................... ................................. ...................... 10
2.1 BACKGROUND............................................................................................................................................................ 10 2.2 INDEX SCOPE ............................................................................................................................................................. 11 2.3 ABOUT THE AUTHORS .................................................................................................................................................. 11
3. COUNTRIES INVOLVED ......................................................................................................................................... 12
4. RESULTS OF THE EURO HEALTH CONSUMER INDEX 2009 ............................... ................................. ...................... 13
4.1 RESULTS SUMMARY .................................................................................................................................................... 15
5. BANG-FOR-THE-BUCK ADJUSTED SCORES ............................................................................................................. 19
5.1 BFB ADJUSTMENT METHODOLOGY.................................................................................................................................. 19 5.2 RESULTS IN THE BFB SCORE SHEET.................................................................................................................................. 20 5.3 INFORMAL PAYMENTS TO DOCTORS ................................................................................................................................. 21
6. TRENDS OVER THE FIVE YEARS ...................................................... ................................. ............................... ....... 21
6.1 SCORE CHANGES 2006 - 2009...................................................................................................................................... 21 6.2 CLOSING THE GAP BETWEEN THE PATIENT AND PROFESSIONALS .............................................................................................. 23 6.3 CLOSING THE GAP BETWEEN EAST AND WEST .................................................................................................................... 24 6.4 TRANSPARENT MONITORING OF HEALTHCARE QUALITY ......................................................................................................... 24 6.5 LAYMAN-ADAPTED COMPREHENSIVE INFORMATION ABOUT PHARMACEUTICALS ......................................................................... 25 6.6 WAITING LISTS: WHO CARES (FOR THE PATIENT)? .............................................................................................................. 25 6.7 CHANGE UNDER PRESSURE ............................................................................................................................................ 26 6.8 WHY DO PATIENTS NOT KNOW? ..................................................................................................................................... 26 6.9 MRSA SPREAD .......................................................................................................................................................... 26
7. HOW TO INTERPRET THE INDEX RESULTS? .......................................... ............................... ................................ .. 27
8. EUROPEAN DATA SHORTAGE .............................. ................................ ................................ ............................... .. 27
8.1 MEDICAL OUTCOMES INDICATORS INCLUDED IN THE EHCI .................................................................................................... 27
9. EVOLVEMENT OF THE EURO HEALTH CONSUMER INDEX ............................... ................................. ...................... 29
9.1 SCOPE AND CONTENT OF EHCI 2005 .............................................................................................................................. 29 9.2 SCOPE AND CONTENT OF EHCI 2006 – 2009 .................................................................................................................. 30 9.3 EHCI 2009 .............................................................................................................................................................. 31 9.4 NO INDICATORS TAKEN OUT FROM THE EHCI 2008 SET....................................................................................................... 31 9.5 NEW INDICATORS INTRODUCED FOR EHCI 2009 ............................................................................................................... 31 9.6 INDICATOR AREAS (SUB-DISCIPLINES) ............................................................................................................................... 32 9.7 SCORING IN THE EHCI 2009......................................................................................................................................... 33 9.8 WEIGHT COEFFICIENTS ................................................................................................................................................. 33 9.9 INDICATOR DEFINITIONS AND DATA SOURCES FOR THE EHCI 2008 ......................................................................................... 36 9.10 THRESHOLD VALUE SETTINGS ....................................................................................................................................... 43 9.11 “CUTS” DATA SOURCES............................................................................................................................................. 44 9.12 CONTENT OF INDICATORS IN THE EHCI 2009 .................................................................................................................. 45 9.13 HOW THE EURO HEALTH CONSUMER INDEX 2009 WAS BUILT ............................................................................................ 56 9.14 PRODUCTION PHASES ................................................................................................................................................ 56 9.15 EXTERNAL EXPERT REFERENCE PANEL ............................................................................................................................. 58
10. REFERENCES ....................................................................................................................................................... 58
10.1 MAIN SOURCES ........................................................................................................................................................ 58 10.2 USEFUL LINKS .......................................................................................................................................................... 59 ANNEX 1: SOURCE DOCUMENT FOR THE PATIENTS’ RIGHTS INDICATOR (IN ADDITION TO FEEDBACK FROM NATIONAL AUTHORITIES). ............ 61
APPENDIX 1. QUESTIONNAIRE USED IN THE SURVEY COMMISSIONED FROM PATIENT VIEW FOR THE EURO HEALTH
CONSUMER INDEX 2008. .......................................................................................................................................... 64
8/8/2019 Health Consumer powerhouse Report EHCI 2009 091001 final with cover
http://slidepdf.com/reader/full/health-consumer-powerhouse-report-ehci-2009-091001-final-with-cover 4/67
The flying Dutchman reigns European healthcare as the inequity
gap grows
This 5th annual edition of the Euro Health Consumer Index, is offering a user-focused,
performance-related comparison of 33 national healthcare systems.
The most remarkable outcome is no doubt the outstanding position of the Dutch healthcare,
indicating that the ongoing healthcare reform now pays off. Can we imagine a new “model”
gaining a lead, similar to the impact from the British NHS in the 1950’s and 60’s?
The Dutch progress is essential from another point of view: the strategic role of the health
consumer created by the reform. It combines competition for funding and provision within a
regulated framework. There are information tools to support active choice among consumers.
The Netherlands started to work on patient empowerment early, which now clearly pays off in
many areas.
The Dutch are not alone in the systematic efforts to engage patients and consumers using
choice and information. The most prominent European healthcare systems all move in thisdirection, which contributes to the growing healthcare divide indicated by this year’s Index.
Most Central and Eastern European healthcare systems lose rank , although they almost all
score more points in the Index every year. And this might be a very real manifestation of the
financial crisis and the competition among healthcare approaches: some healthcare systems
move ahead, driven by not only economic wealth but good policy as well, while others move
slower, thus failing to meet the growing needs and expectations of the citizens.
The signals of expanding inequalities in healthcare following on the financial crisis challenge
EU principles of solidarity and equity. It is not only a matter of money but attitude. With
patient mobility growing around Europe, there is a strong need for transparency exposing the
pros and cons of the national healthcare systems. The EU intends to introduce a cross-border care scheme which requires significantly better information to patients. Qualities such as
access to your medical record, second opinion and information about results produced by care
providers have been slowly spreading. The trend of user empowerment makes provider
catalogues and layman pharmacopoeias take off. Sensible policy integrates e-Health in this
change, providing a spearhead to radically reduce costs, opening for rapid treatment access
and patient safety advancement.
We thank the ministries and agencies in the Index countries for a creative dialogue and
provision of data. We want as well to thank the European Commission DG Information
Society and Media for the support of this year’s Index, presented under the auspices of the
Swedish EU Presidency.
Brussels, September 23, 2009
Johan Hjertqvist
President
Health Consumer Powerhouse
8/8/2019 Health Consumer powerhouse Report EHCI 2009 091001 final with cover
http://slidepdf.com/reader/full/health-consumer-powerhouse-report-ehci-2009-091001-final-with-cover 5/67
Health Consumer Powerhouse
Euro Health Consumer Index 2009 report
5
1. Summary
The 2009 Euro Health Consumer Index has a completely novel ranking situation. In previous
EHCI editions, as well as in the Euro Consumer Heart Index 2008 and the Euro Consumer
Diabetes Index 2008 (all available at www.healthpowerhouse.com), 3 – 5 top countries are
separated by only a few points on the 1000-point scale. The EHCI 2009 total ranking of
healthcare systems shows an unprecedented landslide victory for The Netherlands, scoring
863 points out of 1000, 44 points ahead of runners-up Denmark at 819 points, followed by
newcomers in the EHCI, Iceland, at 811 and Austria at 795.
The ranking was noticeably influenced by the 2008 introduction of an additional sixth sub-
discipline, “e-Health” (for more information on e-Health sub-discipline see section e-Health),
measuring essentially the penetration of electronic medical records and the use of e-solutions
solutions for the transfer of medical information between professionals, and from
professionals to patients. The e-solutions for communication to patients indicators are new for
2009, and very much show that essentially all of European healthcare still has a long way to
go in the implementation of IT solutions in healthcare. No country scores all Green on the six
e-Health indicators (see Section 9.7 for explanation on scoring colours).
1.1 Some interesting countries
(not necessarily in Index score order).
1.1.1 The Netherlands!!!
The Netherlands is the only country which has consistently been among the top three in the
total ranking of any European Index the Health Consumer Powerhouse has published since2005. The 2009 NL score of 863 points is by far the highest ever seen in a HCP Index. The
NL shares the sub-discipline victory with Denmark only on e-Health and Pharmaceuticals, and
the large victory margin seems essentially due to that the Dutch healthcare system does not
seem to have any really weak spots, except possibly some scope for improvement regarding
the waiting times situation, where some central European countries excel.
Normally, the HCP takes care to state that the EHCI is limited to measuring the “consumer
friendliness” of healthcare systems, i.e. does not claim to measure which European state has
the best healthcare system across the board.
However, the fact that is seems very difficult to build an Index of the HCP type without
ending up with The Netherlands on the medallists’ podium, creates a strong temptation toactually claim that the landslide winner of the EHCI 2008 could indeed be said to have “the
best healthcare system in Europe”.
1.1.1.1 So what are the Dutch doing right?
It has to be emphasized that the following discussion does contain a substantial amount of
speculation outside of what can actually be derived from the EHCI scores:
The NL is characterized by a multitude of health insurance providers acting in competition,
and being separate from caregivers/hospitals. Also, the NL probably has the best and most
structured arrangement for patient organisation participation in healthcare decision and policymaking in Europe.
8/8/2019 Health Consumer powerhouse Report EHCI 2009 091001 final with cover
http://slidepdf.com/reader/full/health-consumer-powerhouse-report-ehci-2009-091001-final-with-cover 6/67
Health Consumer Powerhouse
Euro Health Consumer Index 2009 report
6
Here comes the speculation: one important net effect of the NL healthcare system structure
would be that healthcare operative decisions are taken, to an unusually high degree, by
medical professionals with patient co-participation. Financing agencies and healthcare
amateurs such as politicians and bureaucrats seem farther removed from operative healthcare
decisions in the NL than in almost any other European country. This could in itself be a major reason behind the NL landslide victory in the EHCI 2009.
1.1.1.2 So what, if anything, are the Dutch doing wrong?
The NL scores very well in all sub-disciplines, except Waiting times/Access, where the score
is more mediocre. As was observed by Siciliani & Hurst of the OECD in 2003/2004, and in
the EHCI 2005 – 2009, waiting lists for specialist treatment, paradoxically, exist mainly in
countries having “GP gatekeeping” (the requirement of a referral from a primary care doctor
to see a specialist).
GP gatekeeping, a “cornerstone of the Dutch healthcare system” (said to the HCP by a former
Dutch Minister of Health) is widely believed to save costs, as well as providing a continuum
of care, which is certainly beneficial to the patient. As can be seen from the references given
in Section 9.12.3 on indicator 3.2, there is no evidence to support the cost-reducing
hypothesis. Also, as can be seen in Section 5.1, the NL has risen in healthcare spend to
actually having the highest per capita spend in Europe (outside of what the HCP internally
calls “the three rich bastards”; Norway, Switzerland and Luxembourg, who have a GDP per
capita in a class of their own).
It could well be that the Netherlands would break the 900 points barrier by relaxing the GP
gatekeeping rules!
1.1.2 Denmark
Denmark did gain a lot from the introduction of the e-Health sub-discipline. Denmark has
been on a continuous rise since it was first included in the EHCI 2006. Denmark is doing
particularly well on Patient Rights and Information, being one of only three countries (not the
same three) scoring Green both on Free choice of caregiver in the EU and on having a hospital
registry on the Internet showing which hospitals have the best medical results. Mainly for this
reason, Denmark is outdistancing its Nordic neighbours in the EHCI, is spite of having a
slightly lower score on Outcomes than these.
1.1.3 Iceland
Due to its location in the North Atlantic, Iceland has been forced to build a system of
healthcare services, which has the capability (not dimensions!) of a system serving a couple of
million people, which is serving only 300 000 Icelanders. The Icelandic bronze medal did not
come as a surprise to the HCP research team.
Lacking its own specialist qualification training for doctors, Iceland does probably benefit
from a system, which resembles the medieval rules for carpenters and masons: for a number
of years after qualification, these craftsmen were forbidden to settle down, and forced to spend
a number of years wandering around working for different builders. Naturally, they did learn a
lot of different skills along the way. Young Icelandic doctors generally spend 8 – 10 years
after graduation working in another country, and then frequently come back (and they do not

8/8/2019 Health Consumer powerhouse Report EHCI 2009 091001 final with cover
http://slidepdf.com/reader/full/health-consumer-powerhouse-report-ehci-2009-091001-final-with-cover 7/67
Health Consumer Powerhouse
Euro Health Consumer Index 2009 report
7
need to marry a master builder’s widow to set up shop!). Not only do they learn a lot – they
also get good contacts useful for complicated cases: the Icelandic doctor faced with a case not
possible to handle in Iceland, typically picks up the phone and calls his/her ex-boss, or a
skilled colleague, at a well-respected hospital and asks: Could you take this patient?, and
frequently gets the reply: “Put him on a plane!
1.1.4 Germany – the “Mystery Country”
In 6th place with 787 points, Germany probably has the most restriction-free and consumer-
oriented healthcare system in Europe, with patients allowed to seek almost any type of care
they wish whenever they want it. The main reason Germany is not engaged in the fight for
medals is the mediocrity of Outcomes (and “Germany” and “mediocre quality” are rarely
heard in the same sentence!). This is probably due to a characteristic of the German healthcare
system: a large number of rather small general hospitals, not specializing.
The “mystery” is: how is it possible to operate a restriction-free system, and not have
healthcare costs run wild? As can be seen from the cost graph in Section 5.1, German
healthcare costs are in the middle of the Western European countries.
Another speculative explanation: There are studies, that show that German doctors work
harder; long hours and many appointments/operations per doctor per year. It is well known
that hindering a German from working is difficult. Could the relatively good cost containment
in German healthcare be explained simply be “German work ethic”? Unfortunately, the EHCI
does not provide the answer.
1.1.5 Ireland, Spain and Greece
In 13th, 22nd and 24th place respectively.
For the EHCI 2009, the HCP has had much better contact with national healthcare bodies than
in previous years. For that reason, the Patient View survey to patient organizations, which
provides part of the data for the EHCI, has essentially not been used as a single CUTS (see
section 9.11) data source, but mainly as a “reality check”.
These three countries seem to have a domestic “marketing problem” for their healthcare
services. This is particularly striking for Ireland, which after is HSE reform has been steadily
climbing in the EHCI, but where the responses from patient organizations on issues such as
waiting times are very negative still in 2009.
Greece leads Europe by a wide margin in the number of doctors per capita (below). Still the picture of Greek healthcare, painted by the patient organization responses, does not at all
indicate any sort of healthy competition to provide superior healthcare services.

8/8/2019 Health Consumer powerhouse Report EHCI 2009 091001 final with cover
http://slidepdf.com/reader/full/health-consumer-powerhouse-report-ehci-2009-091001-final-with-cover 8/67
Health Consumer Powerhouse
Euro Health Consumer Index 2009 report
8
1.1.6 Albania
30th
place, 562 points. Albania is included in the EHCI at the request of the Albanian Ministryof Health, who in a very nice e-mail wrote that “we might well finish last, but we want to be
in there anyway”. Albania, as can be seen above and in Section 5.1, does have very limited
healthcare resources. The country avoids ending up last chiefly due to a very strong
performance on Access, where patient organizations confirmed the official ministry version
that waiting times essentially do not exist. In fact, Albania tops the Waiting Times sub-
discipline together with Belgium, Germany and Switzerland!
The ministry explanation for this was that “Albanians are a hardy lot, who only go to the
doctor when carried there”, i.e. underutilization of the healthcare system. This is an
oversimplification; Albanians visit their primary care doctor more than twice as often as
Swedes (3.9 visits per year vs. 1.6)!
1.1.7 Sweden
9th place, 762 points. Still, the European champion on medical outcomes. For five years, it has
not seemed to matter which indicators are tried on Outcomes (at least for rather serious
conditions); Sweden keeps being the only country to score All Green.
At the same time, the notoriously poor accessibility situation seems very difficult to rectify, in
spite of state government efforts to stimulate the decentralized county-operated healthcare
system to shorten waiting lists. The HCP survey to patient organizations confirms the picture
obtained from www.vantetider.se, that the targets for maximum waiting times, which on a
European scale are very modest, are not really met. The target for maximum wait to see your

8/8/2019 Health Consumer powerhouse Report EHCI 2009 091001 final with cover
http://slidepdf.com/reader/full/health-consumer-powerhouse-report-ehci-2009-091001-final-with-cover 9/67
Health Consumer Powerhouse
Euro Health Consumer Index 2009 report
9
primary care doctor (no more than 7 days) is underachieved only by Portugal, where the
corresponding figure is < 15 days.
Another way of expressing the vital question: Why can Albania operate its healthcare services
with practically zero waiting times, and Sweden cannot?
1.1.8 Estonia
1½ million population Estonia has dropped rather dramatically; from an impressive 11th place
overall in the 2008 Index (score 669) to 18th in 2009, with 638 points. What this might show
is one of the few visible examples of the financial crisis hitting a healthcare system.
1.1.9 Croatia
23rd place, 627 points. As was assumed in the EHCI 2008 report, Croatia was then
handicapped by numerous “not available” in the score matrix. What the HCP finds
particularly encouraging is that data, which in 2008 was confined to the Croatian MoH, hassince been released into the public domain, to the benefit of citizens and the EHCI score.
1.1.10 Portugal
21st place, 632 points. Rather surprisingly also to the sponsor of the e-Health indicators, the
European Commission, Portugal emerges as the European champion on e-Health deployment,
with widespread use of Electronic Patient Records, electronic prescriptions and on-line
booking of doctor appointments (at least for the 4 million inhabitants of the Lisbon area).
1.2 BBB; Bismarck Beats Beveridge – yet again!
All public healthcare systems share one problem: Which technical solution should be used to
funnel typically 7 – 10 % of national income into healthcare services?
Bismarck healthcare systems: Systems based on social insurance, where there is a multitude
of insurance organisations, Krankenkassen etc, who are organisationally independent of
healthcare providers.
Beveridge systems: Systems where financing and provision are handled within one
organisational system, i.e. financing bodies and providers are wholly or partially within one
organisation, such as the NHS of the UK, counties of Nordic states etc.
For more than half a century, particularly since the formation of the British NHS, the largest
Beveridge-type system in Europe, there has been intense debating over the relative merits of
the two types of system.
Already in the EHCI 2005, the first 12-state pilot attempt, it was observed that “In general,
countries which have a long tradition of plurality in healthcare financing and provision, i.e.
with a consumer choice between different insurance providers, who in turn do not
discriminate between providers who are private for-profit, non-profit or public, show common
features not only in the waiting list situation …”
Looking at the results of the EHCI 2006 – 2009, it is very hard to avoid noticing that the top
consists of dedicated Bismarck countries, with the small-population and therefore more easilymanaged Beveridge systems of the Nordic countries squeezing in. Large Beveridge systems
8/8/2019 Health Consumer powerhouse Report EHCI 2009 091001 final with cover
http://slidepdf.com/reader/full/health-consumer-powerhouse-report-ehci-2009-091001-final-with-cover 10/67
Health Consumer Powerhouse
Euro Health Consumer Index 2009 report
10
seem to have difficulties at attaining really excellent levels of customer value. The largest
Beveridge countries, the U.K. and Italy, keep clinging together in the middle of the Index.
There could be (at least) two different explanations for this:
1. Managing a corporation or organisation with 100 000+ employees calls for
considerable management skills, which are usually very handsomely rewarded.Managing an organisation such as the English NHS, with close to 1½ million staff,
who also make management life difficult by having a professional agenda, which does
not necessarily coincide with that of management/administration, would require
absolutely world class management. It is doubtful whether public organisations offer
the compensation and other incentives required to recruit those managers.
2. In Beveridge organisations, responsible both for financing and provision of healthcare,
there would seem to be a risk that the loyalty of politicians and other top decision
makers could shift from being primarily to the customer/patient. Primary loyalty
could become shifted to the organisation these decision makers, with justifiable pride,
have been building over decades (or possibly to aspects such as the job-creation potential of such organisations in politicians’ home towns).
2. Introduction
The Health Consumer Powerhouse (HCP) has become a centre for visions and action
promoting consumer-related healthcare in Europe. “Tomorrow’s health consumer will not
accept any traditional borders”, we declared in last year’s report, but it seems that this
statement is already becoming true in 2008; the “Commission proposal for a Directive for
patients rights at Cross border care” is in this way being an excellent example of this trend. In
order to become a powerful actor, building the necessary reform pressure from below, theconsumer needs access to knowledge to compare health policies, consumer services and
quality outcomes. The Euro Health Consumer Indexes are efforts to provide healthcare
consumers with such tools.
2.1 Background
Since 2004 the HCP has been publishing a wide range of comparative publications on
healthcare in various countries. First, the Swedish Health Consumer Index in 2004
(www.vardkonsumentindex.se, also in an English translation). By ranking the 21 county
councils by 12 basic indicators concerning the design of ”systems policy”, consumer choice,service level and access to information we introduced benchmarking as an element in
consumer empowerment. In two years time this initiative had inspired – or provoked – the
Swedish Association of Local Authorities and Regions together with the National Board of
Health and Welfare to start a similar ranking, making public comparisons an essential
Swedish instrument for change.
For the pan-European indexes in 2005 – 2008, HCP aimed to basically follow the same
approach, i.e. selecting a number of indicators describing to what extent the national
healthcare systems are “user -friendly”, thus providing a basis for comparing different national
systems.
Furthermore, since 2008 the HCP has enlarged the existing benchmarking programconsiderably:

8/8/2019 Health Consumer powerhouse Report EHCI 2009 091001 final with cover
http://slidepdf.com/reader/full/health-consumer-powerhouse-report-ehci-2009-091001-final-with-cover 11/67
Health Consumer Powerhouse
Euro Health Consumer Index 2009 report
11
In January 2008, the Frontier Centre and HCP released the first Euro-Canada Health
Consumer Index, which compared the health care systems in Canada and 29 European
countries. The 2009 edition was released in May, 2009.
The Euro Consumer Heart Index, launched in July 2008, compares 29 European
cardiovascular healthcare systems in five categories, covering 28 performanceindicators.
The first edition of Canada Health Consumer Index was released in September 2008 in
co-operation with Frontier Centre for Public Policy, examining healthcare from the
perspective of the consumer at the provincial level.
The first Euro Consumer Diabetes Index, launched in September 2008, provides the
first ranking of European diabetes healthcare services across five key areas:
Information, Consumer Rights and Choice; Generosity, Prevention; Access to
Procedures and Outcomes.
This year's edition of Euro Health Consumer Index covers 38 healthcare performanceindicators for 33 countries.
Though still a somewhat controversial standpoint, HCP advocates that quality comparisons
within the field of healthcare is a true win-win situation. To the consumer, who will have a
better platform for informed choice and action. To governments, authorities and providers, the
sharpened focus on consumer satisfaction and quality outcomes will support change. To
media, the ranking offers clear-cut facts for consumer journalism with some drama into it.
This goes not only for evidence of shortcomings and method flaws but also illustrates the
potential for improvement. With such a view the EHCI is designed to become an important
benchmark system supporting interactive assessment and improvement.
As we heard one of the Ministers of health saying when seeing his country’s preliminaryresults: “It´s good to have someone still telling you: you could do better.”
2.2 Index scope
The aim has been to select a limited number of indicators, within a definite number of
evaluation areas, which in combination can present a telling tale of how the healthcare
consumer is being served by the respective systems.
2.3 About the authors
Project Management for the EHCI 2008 has been executed by Arne Björnberg, Ph.D.
Dr. Björnberg has previous experience from Research Director positions in Swedish industry.
His experience includes having served as CEO of the Swedish National Pharmacy
Corporation (”Apoteket AB”), Director of Healthcare & Network Solutions for IBM Europe
Middle East & Africa, and CEO of the University Hospital of Northern Sweden (“Norrlands
Universitetssjukhus”, Umeå).
Dr. Björnberg was also the project manager for the EHCI 2005 – 2008 projects, the Euro
Consumer Heart Index 2008 and numerous other Index projects.
Beatriz Cebolla, Ph.D.
8/8/2019 Health Consumer powerhouse Report EHCI 2009 091001 final with cover
http://slidepdf.com/reader/full/health-consumer-powerhouse-report-ehci-2009-091001-final-with-cover 12/67
Health Consumer Powerhouse
Euro Health Consumer Index 2009 report
12
After graduating in biochemistry, Dr. Cebolla has worked as a researcher for the last ten years
and has been attached to various institutions relevant to the healthcare field. She completed
her Ph.D. at the Biomedical Research Institute (IIB/CSIC) in Madrid and continued with a
postdoctoral fellowship at the Institute for Molecular Pathology (IMP) in Vienna in Dr.
Meinrad Busslinger’s laboratory. She has carried out several collaborations with other scientist groups working on cancer and
diabetes and is currently studying a Master in International Public Health, and was also the
Project Manager for the 2008 Euro Consumer Diabetes Index.
Sonja Lindblad, DIHR
Sonja Lindblad has been employed in various health care companies. She holds a teacher´s
degree and is presently working on her master degree in public health at the University of
Stockholm. She has been engaged as researcher/project manager in several Swedish
healthcare index projects.
3. Countries involved
In 2005, the EHCI started with a dozen countries and 20 indicators; this year’s index already
includes all 27 European Union member states, plus Norway and Switzerland, the candidate
countries of Croatia and FYR Macedonia, and for the first time also Albania and Iceland.

8/8/2019 Health Consumer powerhouse Report EHCI 2009 091001 final with cover
http://slidepdf.com/reader/full/health-consumer-powerhouse-report-ehci-2009-091001-final-with-cover 13/67
Health Consumer Powerhouse
Euro Health Consumer Index 2009 report
13
4. Results of the Euro Health Consumer Index 2009
8/8/2019 Health Consumer powerhouse Report EHCI 2009 091001 final with cover
http://slidepdf.com/reader/full/health-consumer-powerhouse-report-ehci-2009-091001-final-with-cover 14/67
Health Consumer Powerhouse
Euro Health Consumer Index 2009 report
14
8/8/2019 Health Consumer powerhouse Report EHCI 2009 091001 final with cover
http://slidepdf.com/reader/full/health-consumer-powerhouse-report-ehci-2009-091001-final-with-cover 15/67
Health Consumer Powerhouse
Euro Health Consumer Index 2009 report
15
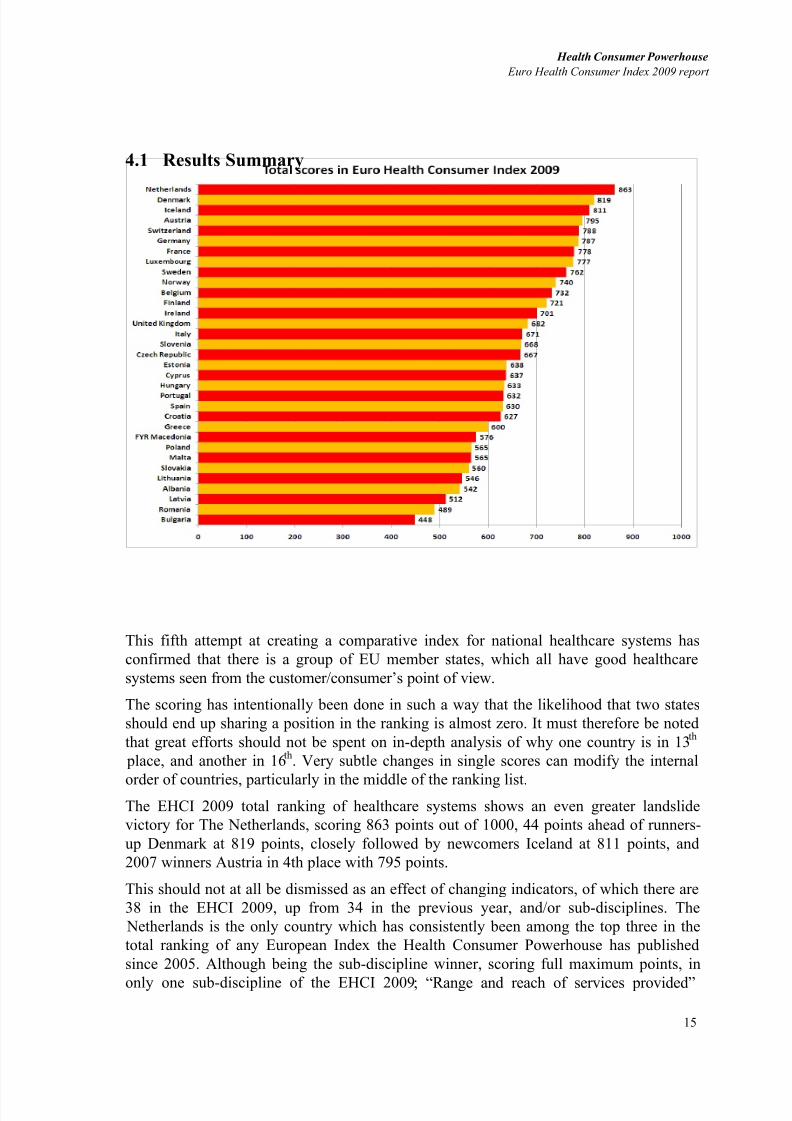
4.1 Results Summary
This fifth attempt at creating a comparative index for national healthcare systems has
confirmed that there is a group of EU member states, which all have good healthcare
systems seen from the customer/consumer’s point of view.
The scoring has intentionally been done in such a way that the likelihood that two states
should end up sharing a position in the ranking is almost zero. It must therefore be noted
that great efforts should not be spent on in-depth analysis of why one country is in 13 th
place, and another in 16th. Very subtle changes in single scores can modify the internal
order of countries, particularly in the middle of the ranking list.The EHCI 2009 total ranking of healthcare systems shows an even greater landslide
victory for The Netherlands, scoring 863 points out of 1000, 44 points ahead of runners-
up Denmark at 819 points, closely followed by newcomers Iceland at 811 points, and
2007 winners Austria in 4th place with 795 points.
This should not at all be dismissed as an effect of changing indicators, of which there are
38 in the EHCI 2009, up from 34 in the previous year, and/or sub-disciplines. The
Netherlands is the only country which has consistently been among the top three in the
total ranking of any European Index the Health Consumer Powerhouse has published
since 2005. Although being the sub-discipline winner, scoring full maximum points, in
only one sub-discipline of the EHCI 2009; “Range and reach of services provided”
8/8/2019 Health Consumer powerhouse Report EHCI 2009 091001 final with cover
http://slidepdf.com/reader/full/health-consumer-powerhouse-report-ehci-2009-091001-final-with-cover 16/67
Health Consumer Powerhouse
Euro Health Consumer Index 2009 report
16
(formerly called “Generosity” in previous EHCI editions), the Dutch healthcare system
does not seem to have any really weak spots in the other sub-disciplines, except possibly
some scope for improvement regarding the waiting times situation, where some other
central European states excel. Normally, the HCP takes care to state that the EHCI islimited to measuring the “consumer friendliness” of healthcare systems, i.e. does claim to
measure which European state has the best healthcare system across the board.
However, the fact that is seems very difficult to build an Index of the HCP type without
ending up with The Netherlands on the medallists’ podium, creates a strong temptation to
actually claim that the landslide winner of the EHCI 2009 could indeed be said to have
“the best healthcare system in Europe”.
Denmark did gain a lot from the introduction of the e-Health sub-discipline. Non the less,
as can been seen from the longitudinal analysis in Chapter 7, where the EHCI 2009 has
been modelled back on the EHCI 2007 (with only five sub-disciplines), Denmark has
been on a continuous rise since it was first included in the EHCI 2006. It would seem that
the dedicated efforts made by Danish politicians and public agencies, to achieve a real
upgrade of the healthcare system in Denmark, are paying off. This is corroborated by the
fact than Denmark emerged as the total winner of the Euro Consumer Diabetes Index
2008.
Bronze medallists are newcomers Iceland at 811 points.
In 4th place resides the 2007 winner Austria at 795 points; not doing as well on e-Health
services but scoring the first ever full score in the pharmaceuticals sub-discipline.
Switzerland comes in 5th at 788 points and Germany 6th at 787. These three countries
offer truly excellent accessibility to healthcare services, but as they do not reach the samescore levels on the heavily weighted (“the proof of the pudding is in the eating”)
Outcomes sub-discipline as do Sweden and the Netherlands, they do not quite reach the
top.
One country showing a significant downward slide in the EHCI is the 2006 overall
winner France, ending up in 10th place in 2008. This is partially due to weakness in the
implementation of e-Health solutions. As the HCP research team was informed at a visit
to the French ministry of health already in 2006, France was starting to make access to
healthcare specialist services less liberal. This seems to be reflected in the French 2008
scores on Waiting Times, where the survey commissioned to patient organisations
seemed to confirm that access is now noticeably more restricted. The accessibilitysituation seems to have improved again, with France in 7 th place at 778 points.
The Swedish score for technically excellent healthcare services is, as ever, dragged down
by the seemingly never-ending story of access/waiting time problems, in spite of national
efforts such as Vårdgaranti (National Guaranteed Access to Healthcare); Sweden still
makes a good 9th place with 762 points.
For the second time, the EU candidate states of Croatia and FYR Macedonia have been
included in the EHCI. In 2008, the scores of these countries were underestimated due to
less participation in EU-instigated data collection activities.
In southern Europe, Spain and Italy provide healthcare services where medical excellence
can be found in many places. Real excellence in southern European healthcare seems to

8/8/2019 Health Consumer powerhouse Report EHCI 2009 091001 final with cover
http://slidepdf.com/reader/full/health-consumer-powerhouse-report-ehci-2009-091001-final-with-cover 17/67
Health Consumer Powerhouse
Euro Health Consumer Index 2009 report
17
be a bit too much dependent on the consumers' ability to afford private healthcare as a
supplement to public healthcare. A mixed performance in shown by the U.K; the overall
U.K. score is dragged down by waiting lists and uneven quality performance.
Some eastern European EU member systems are doing surprisingly well, considering
their much smaller healthcare spend in Purchasing Power adjusted dollars per capita.
However, readjusting from politically planned to consumer-driven economies does take
time.
Consumer and patient rights are improving. In a growing number of European countries
there is healthcare legislation explicitly based on patient rights and a functional access to
your own medical record is becoming standard. Still very few countries have
hospital/clinic catalogues with quality ranking.
Generally European healthcare continues to improve but medical outcomes statistics is
still appallingly poor in many countries. This is not least the case regarding the number one killer condition: cardiovascular diseases, where data for one very vital parameter; 30-
day case fatality for hospitalized heart infarct patients had to be compiled from several
disparate sources.
If healthcare officials and politicians took to looking across borders, and to "stealing"
improvement ideas from their EU colleagues, there would be a good chance for a national
system to come much closer to the theoretical top score of 1000. As a prominent
example; if Sweden could just achieve a German waiting list situation, that alone would
suffice to lift Sweden to the Silver medal with ~850 points.
A further discussion on results of states and the changes observed over time can be found
in Chapter 6: Important trends over the four years.
4.1.1 Country scores
There are no countries, which excel across the entire range of indicators. The national
scores seem to reflect more of “national and organisational cultures and attitudes”, rather
than mirroring how large resources a country is spending on healthcare. The cultural
streaks have in all likelihood deep historical roots. Turning a large corporation around
takes a couple of years – turning a country around can take decades!
8/8/2019 Health Consumer powerhouse Report EHCI 2009 091001 final with cover
http://slidepdf.com/reader/full/health-consumer-powerhouse-report-ehci-2009-091001-final-with-cover 18/67
18
Health Consumer Powerhouse
Euro Health Consumer Index 2009 report
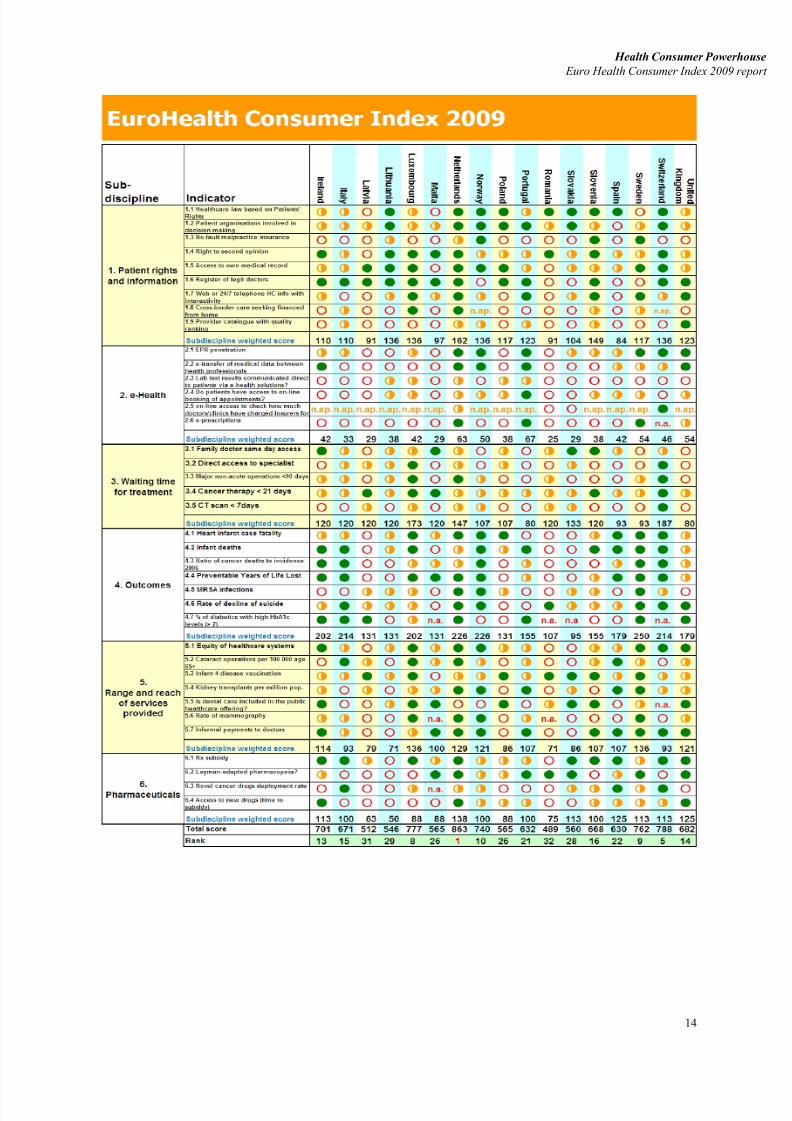
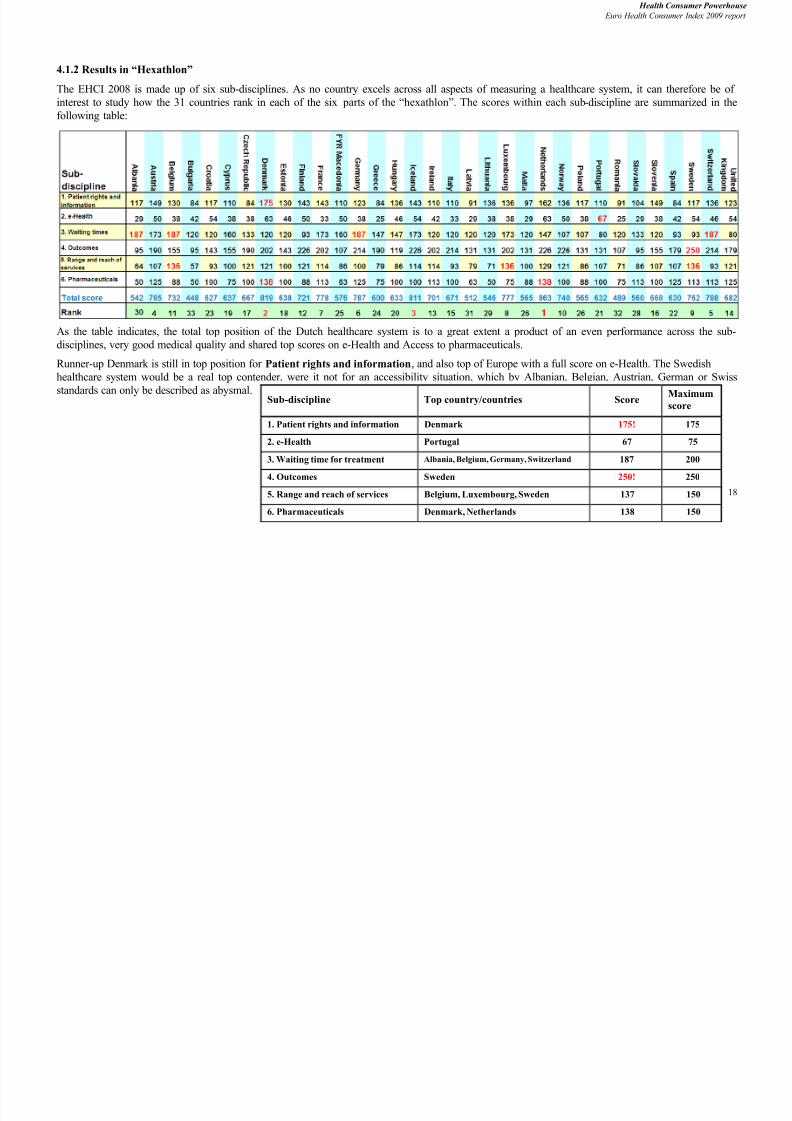
4.1.2 Results in “Hexathlon”
The EHCI 2008 is made up of six sub-disciplines. As no country excels across all aspects of measuring a healthcare system, it can therefore be of interest to study how the 31 countries rank in each of the six parts of the “hexathlon”. The scores within each sub-discipline are summarized in thefollowing table:
As the table indicates, the total top position of the Dutch healthcare system is to a great extent a product of an even performance across the sub-disciplines, very good medical quality and shared top scores on e-Health and Access to pharmaceuticals.
Runner-up Denmark is still in top position for Patient rights and information, and also top of Europe with a full score on e-Health. The Swedishhealthcare system would be a real top contender, were it not for an accessibility situation, which by Albanian, Belgian, Austrian, German or Swiss
standards can only be described as abysmal. Sub-discipline Top country/countries Score Maximumscore
1. Patient rights and information Denmark 175! 175
2. e-Health Portugal 67 75
3. Waiting time for treatment Albania, Belgium, Germany, Switzerland 187 200
4. Outcomes Sweden 250! 250
5. Range and reach of services Belgium, Luxembourg, Sweden 137 150
6. Pharmaceuticals Denmark, Netherlands 138 150
8/8/2019 Health Consumer powerhouse Report EHCI 2009 091001 final with cover
http://slidepdf.com/reader/full/health-consumer-powerhouse-report-ehci-2009-091001-final-with-cover 19/67
Health Consumer Powerhouse
Euro Health Consumer Index 2009 report
19
5. Bang-For-the-Buck adjusted scores
With all 27 EU member states and six other European countries included in the EHCI
project, it becomes apparent that the Index tries to compare states with very differentfinancial resources. The annual healthcare spending, in PPP-adjusted (Purchasing Power
Parity) US dollars, varies from less than $400 in Albania more than $4000 in Norway,
Switzerland, and Luxembourg. Continental Western Europe and Nordic countries
generally fall between $2700 and $3700. As a separate exercise, the EHCI 2009 has
added a value for money-adjusted score: the Bang-For-the-Buck adjusted score, or “BFB
Score”.
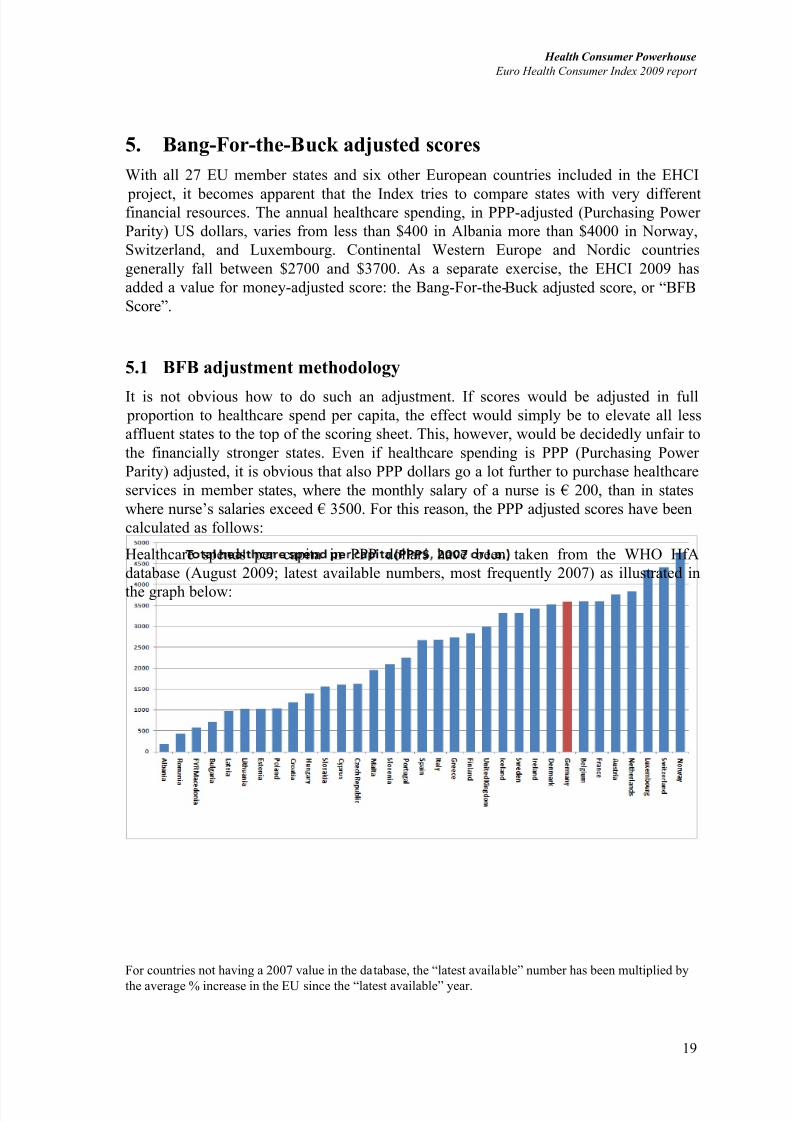
5.1 BFB adjustment methodology
It is not obvious how to do such an adjustment. If scores would be adjusted in full proportion to healthcare spend per capita, the effect would simply be to elevate all less
affluent states to the top of the scoring sheet. This, however, would be decidedly unfair to
the financially stronger states. Even if healthcare spending is PPP (Purchasing Power
Parity) adjusted, it is obvious that also PPP dollars go a lot further to purchase healthcare
services in member states, where the monthly salary of a nurse is € 200, than in states
where nurse’s salaries exceed € 3500. For this reason, the PPP adjusted scores have been
calculated as follows:
Healthcare spends per capita in PPP dollars have been taken from the WHO HfA
database (August 2009; latest available numbers, most frequently 2007) as illustrated in
the graph below:
For countries not having a 2007 value in the database, the “latest available” number has been multiplied by
the average % increase in the EU since the “latest available” year.
8/8/2019 Health Consumer powerhouse Report EHCI 2009 091001 final with cover
http://slidepdf.com/reader/full/health-consumer-powerhouse-report-ehci-2009-091001-final-with-cover 20/67
Health Consumer Powerhouse
Euro Health Consumer Index 2009 report
20
For each country has been calculated the square root of this number. The reason for this
is that domestically produced healthcare services are cheaper roughly in proportion to the
healthcare spend. The basic EHCI scores have been divided by this square root. For this
exercise, the basic scoring points of 3, 2 and 1 have been replaced by 2, 1 and 0. In the basic EHCI, the minimum score is 333 and the maximum 1000. With 2, 1 and 0, this does
not (or only very marginally) change the relative positions of the 33 countries, but is
necessary for a value-for-money adjustment – otherwise, the 333 “free” bottom points
have the effect of just catapulting the less affluent countries to the top of the list.
The score thus obtained has been multiplied by the arithmetic means of all 33 square
roots (creating the effect that scores are normalized back to the same numerical value
range as the original scores).
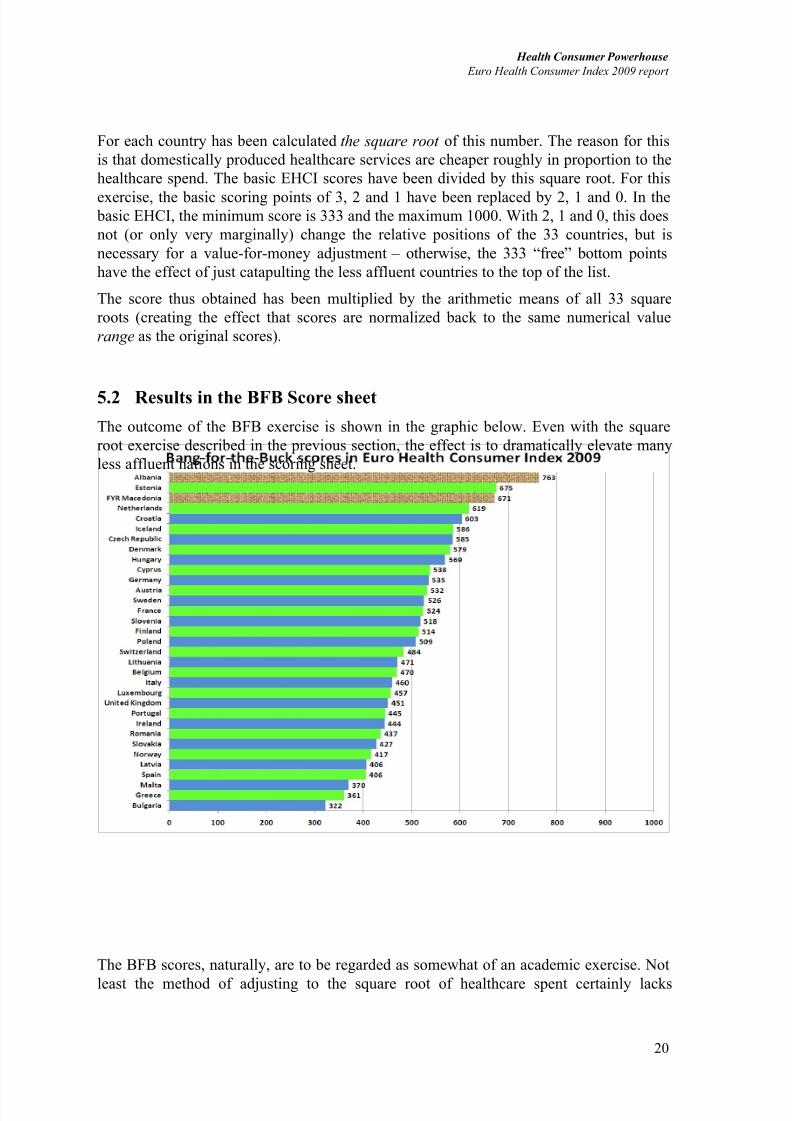
5.2 Results in the BFB Score sheet
The outcome of the BFB exercise is shown in the graphic below. Even with the square
root exercise described in the previous section, the effect is to dramatically elevate many
less affluent nations in the scoring sheet.
The BFB scores, naturally, are to be regarded as somewhat of an academic exercise. Not
least the method of adjusting to the square root of healthcare spent certainly lacks

8/8/2019 Health Consumer powerhouse Report EHCI 2009 091001 final with cover
http://slidepdf.com/reader/full/health-consumer-powerhouse-report-ehci-2009-091001-final-with-cover 21/67
Health Consumer Powerhouse
Euro Health Consumer Index 2009 report
21
scientific support. The BFB method is also a shade too blunt to accommodate countries,
who have a very low healthcare spend, such as Albania and FYR Macedonia; particularly
Albania’s official healthcare spend is very modest. After the research work, however, it
does seem that certainly the supreme winner in the 2007 and 2008 BFB scores, Estonia,keeps doing very well within its financial capacity. To some extent, the same could be
said about Hungary and the Czech Republic.
It is good to remember that Croatia (and FYR Macedonia) were handicapped by many
“n.a.:s” in the 2008 score sheet. The good position of Croatia in the B -F-B sheet is
probably not just an artifact; Croatia does have “islands of excellence” in its healthcare
system, and might well become a popular country for “health tourism”; there are few
other places where a state-of-the-art hip joint operation can be had for €3000.
One thing the authors find interesting is to see which countries top the list in the BFB
Scores, and which countries do reasonably well in the original scores. Examples of such
countries are primarily the Netherlands, Iceland and Denmark. The U.K. has a less
prominent position in the BFB exercise than in previous years – it would seem that the
increased healthcare spend in the U.K. has not yet materialized fully in improved
healthcare services.
In public sector services (and also in private enterprise; cf. IBM in 1990!), the availability
of a lot of money frequently results in decreasing cost effectiveness. This is probably
illustrated by the modest positions of Ireland and Norway in the BFB scores.
5.3 Informal payments to doctors
The cross-European survey on informal payments is, in spite of its obvious imperfections,the first one in history, which also illustrates the low level of attention paid by nations and
European institutions to the problem of parallel economy in healthcare.
This observation gives reason for two questions:
1. Unlike other professionals, such as airline pilots, lawyers, systems engineers etc,
working for large organisations, doctors are unique in being allowed to run side
jobs without the explicit permission of the main employer. What is the reason(s)
for keeping that?
2. What could be done to give doctors “normal” professional employment
conditions, i.e. a decent salary and any extra energy spent on working harder (Yes,and making more money) for the main employer?
6. Trends over the five years
EHCI 2005 was a pilot attempt with only 12 countries and 20 indicators, and is hence not
included in the longitudinal analysis.
6.1 Score changes 2006 - 2009
From the point of view of a healthcare consumer, the overall situation is improving:
8/8/2019 Health Consumer powerhouse Report EHCI 2009 091001 final with cover
http://slidepdf.com/reader/full/health-consumer-powerhouse-report-ehci-2009-091001-final-with-cover 22/67
Health Consumer Powerhouse
Euro Health Consumer Index 2009 report
22
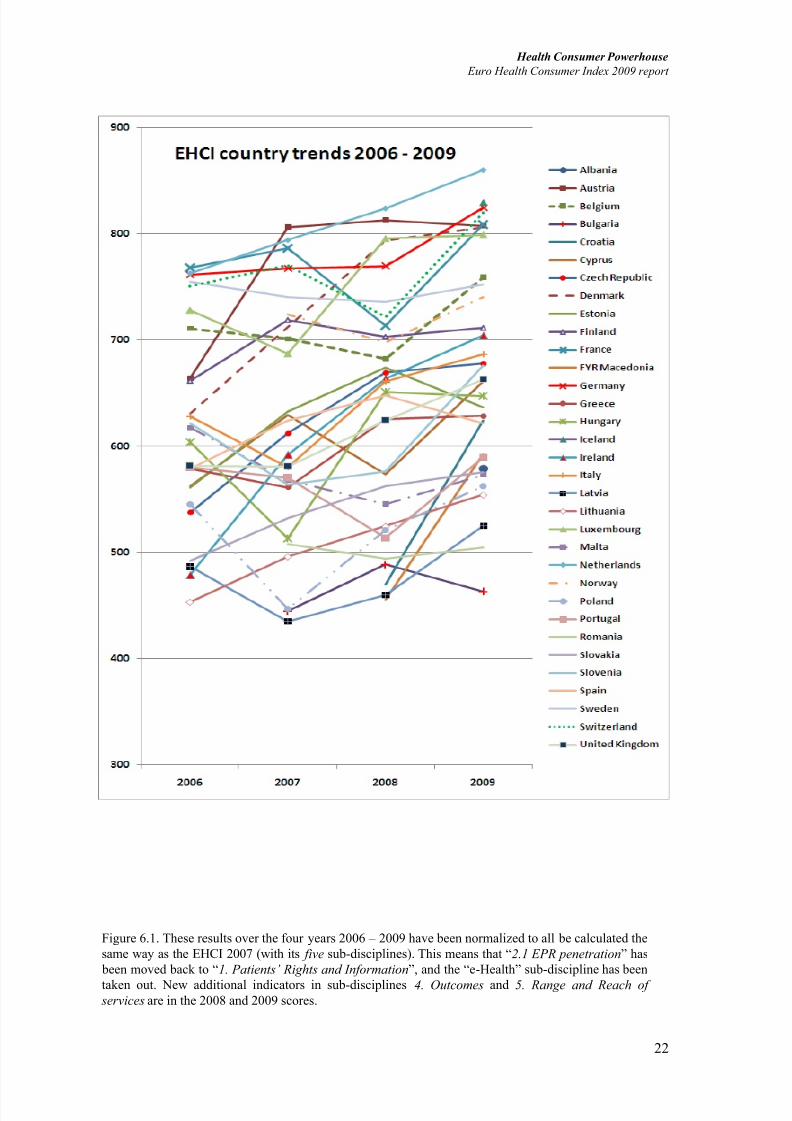
Figure 6.1. These results over the four years 2006 – 2009 have been normalized to all be calculated the
same way as the EHCI 2007 (with its five sub-disciplines). This means that “2.1 EPR penetration” has
been moved back to “1. Patients’ Rights and Information”, and the “e-Health” sub-discipline has been
taken out. New additional indicators in sub-disciplines 4. Outcomes and 5. Range and Reach of services are in the 2008 and 2009 scores.
8/8/2019 Health Consumer powerhouse Report EHCI 2009 091001 final with cover
http://slidepdf.com/reader/full/health-consumer-powerhouse-report-ehci-2009-091001-final-with-cover 23/67
Health Consumer Powerhouse
Euro Health Consumer Index 2009 report
23
The fact that most countries show an upward trend in this normalized calculation can be
taken as an indication that European healthcare is indeed improving over time. That some
countries such as Malta and Sweden have a downward trend cannot be interpreted in the
way that their healthcare systems have become worse over the time studied – only thatthey have developed less positively than the EU average!
Countries, where healthcare seems to develop faster than average in a direction of
improved consumer friendliness are:
The Netherlands: Found the keys to a truly consumer-friendly healthcare system?
Denmark: A determined political effort to improve delivery and transparency of
healthcare, which seems to be paying off.
Germany: Outcomes scores are creeping up from the “all Yellow” a couple of years ago.
Will be a real top contender, if this trend continues.
Ireland: The creation of the Health Service Executive was obviously a much-needed
reform. Steady upward trend.
Hungary, the Czech Republic and Lithuania: reforms in the area of Patient Rights and
Information seem to be taking hold.
6.2 Closing the gap between the patient and professionals
When the indicator on the role of patients’ organisations was introduced in 2006, no
country got a Green score. This year, a high level of non-governmental patient’s
organisations involvement can be seen in Belgium, Croatia, Denmark, Estonia, France,
Germany, Hungary, Lithuania, Netherlands, Norway, Poland, Slovakia and Switzerland,
which is a remarkable improvement.
More and more states are changing the basic starting point for healthcare legislation, and
there is a distinct trend towards expressing laws on healthcare in terms of rights of
citizens/patients instead of in terms of (e.g.) obligations of providers (see section
describing the indicator Healthcare law based on Patients' Rights).
Still, there is a lot to improve: if the patient has to fill in a two-page form and pay EUR 15
to get access to her own medical record, it sounds more like a bad joke than a 21
st
centuryapproach to patients’ rights (this is an actual example).
Furthermore, only a handful of EU countries have integrated in their national legislation
the Convention on Human Rights and Biomedicine1 principles, being the first legally
binding international instrument in the field of bioethics, awarding the patient with a
systematic framework of direct and readily applicable rights.
1
Convention for the Protection of Human Rights and Dignity of the Human Being with regard to the Application of Biology and Medicine: Convention on Human Rights and Biomedicine. Council of Europe, Oviedo 1997

8/8/2019 Health Consumer powerhouse Report EHCI 2009 091001 final with cover
http://slidepdf.com/reader/full/health-consumer-powerhouse-report-ehci-2009-091001-final-with-cover 24/67
Health Consumer Powerhouse
Euro Health Consumer Index 2009 report
24
6.3 Closing the gap between East and West
There seems to be a visible wave of legislation changes across the CEE, which results in
patients’ empowerment. For example, in the past years Slovenia introduced changes in the domain of access to
specialists, no-fault malpractice insurance, and the right to second opinion, together with
considerable improvement in the area of access to information (register of legit doctors,
pharmacopoeia, and even a nice attempt to construct a true providers’ catalogue with
quality ranking); some of these changes being attributable to the introduction of an Act
On Patients’ Rights of 2008. In the Czech Republic, a systematic reform of healthcare
legislation had impact on drug deployment speed; in Lithuania, the level of involvement
of patient organisations increased in past years to a level higher than the majority of the
wealthiest countries in the West.
Hungary improved a lot in the field of patient information by introducing the Doctor Infoservice with register of doctors. Access to how much caregivers have charged for a
person’s care has been introduced – this is the only example of a country with a
“monolithic” financing system having done this, and also nice attempts on provider
catalogue, pharmacopoeia and other healthcare information.
The example of Hungary is a good indication that an important improvement in EHCI
scoring can be done in one or two years, without the need to increase healthcare spending
in a dramatic way. Usually it costs very little to incorporate the patients ’ rights in the
national legislation or to make publicly available information already stored somewhere,
such as a registry of doctors or information on pharmaceuticals.
Also the newly included Candidate countries have adapted patients’ rights in their
legislation.
In e-Health, some CEE countries have introduced applications, which are still rare in
Western Europe. This is probably similar to the rapid uptake of mobile telephones in
India – sometimes, it can be an advantage not to have had an ancient technology
established.
6.4 Transparent monitoring of healthcare quality
In 2005, Dr. Foster of the UK was the single shining star on the firmament of provider
(hospital) listing, where patients could actually see which hospitals had good results in
term of actual success rates or survival percentages.
In 2007, there were already a few more examples, where the Health Consumer
Powerhouse believes that the most notable is the Danish www.sundhedskvalitet.dk ,
where hospitals are graded from to as if they were hotels, with service level
indicators as well as actual results, including case fatality rates on certain diagnoses.
Perhaps the most impressive part of this system is that it allows members of the public to
click down to a link giving the direct-dial telephone number of clinic managers.
Germany has joined the limited ranks of countries (now 3!) scoring Green by the power
of state company Bundesgeschäftsstelle Qualitätssicherung GGmbH, www.bqs-online.de, which also provides results quality information on a great number of German hospitals.
8/8/2019 Health Consumer powerhouse Report EHCI 2009 091001 final with cover
http://slidepdf.com/reader/full/health-consumer-powerhouse-report-ehci-2009-091001-final-with-cover 25/67
Health Consumer Powerhouse
Euro Health Consumer Index 2009 report
25
This year, we can find not-so-perfect, but already existing catalogues with quality ranking
in Cyprus, France, Hungary, FYR Macedonia, Italy (regional; Tuscany et al .),
Netherlands, Norway, Portugal and Slovenia!
6.5 Layman-adapted comprehensive information about
pharmaceuticals
In a discussion as late as January 2007, a representative of the Swedish Association of
Pharmaceutical Industry (LIF), who were certainly pioneers with their well-established
pharmacopoeia “Patient-FASS” (www.fass.se), was arguing that this and its Danish
equivalent were the only examples in Europe. Today, easy-to-use web-based instruments
to find information on pharmaceuticals can be found in 13 countries, also in CEE
countries, e.g . Czech Republic, Estonia, Hungary, Romania, and Slovakia.
6.6 Waiting lists: Who cares (for the patient)?
Not all the trends show an improvement. Over the years, one fact becomes clear:
gatekeeping means waiting. Contrary to popular belief, direct access to specialist care
does not generate access problems to specialists by the increased demand; repeatedly,
waiting times for specialist care are found predominately in restrictive systems, which
seem to be rather an absurd observation.
One of the most characteristic systems of this kind, the NHS in the UK, recently spent
millions pounds on reducing waiting and introduced a maximum of 18 weeks to
definitive treatment after diagnosis. The patient survey commissioned by the HCP for thisyear's Index does not show any kind of improvement. On the contrary, UK patient
organizations in 2009 have been surprisingly negative in their responses to the Waiting
times questions!
Furthermore, even the strong winners of past years’ rankings are turning to restrictive
measures: France, for example, was restraining access in 2007, which resulted in waiting
times, and therefore worse score (together with not really brilliant results in the e-Health
sub-discipline). In 2009, French patients (and doctors?) seem to have learned to work the
new regulations, as the French survey responses on this sub-discipline were very positive.
Even more notable: one of the indicators, introduced for the first time in 2008, is asking
whether patients are expected to make informal payments to the doctor in addition to anyofficial fees. Under-the-table payments serve in some (rather surprising western
European) countries as a way to gain control over the treatment: to skip the waiting list, to
access excellence in treatment, to get the use of modern methods and medicines. More on
informal payments can be found in the section Informal payments to doctors.
In this context, HCP will continue to advocate the free choice, equal and direct access and
measures intended to diminish the information handicap of the consumer as cornerstones
of 21st century modern European healthcare.
8/8/2019 Health Consumer powerhouse Report EHCI 2009 091001 final with cover
http://slidepdf.com/reader/full/health-consumer-powerhouse-report-ehci-2009-091001-final-with-cover 26/67
Health Consumer Powerhouse
Euro Health Consumer Index 2009 report
26
6.7 Change under pressure
Some general beliefs about healthcare in Europe would say that the best performers are
the relatively rich countries with a long tradition of full-coverage healthcare systems. It istherefore very difficult to score well for a non-western country. To some extent this can
be true: generally speaking, good outcomes need money and continuity. The HCP work
is, nevertheless, not concentrated on outcomes to the same extent that the common
comparative studies. GDP-correlated indicators have been avoided as best possible.
Against the beliefs presented above, it must be admitted that the way to the top of the
Euro Health Consumer Index is not too difficult; the key measures are: choice, patients’
rights, accessibility, information/transparency, quality measurement – and some of these
cost little to introduce.
The key factor seems to be the overall responsiveness of the national system, and the
capability to implement strategic changes. Under external pressure, visible in the past fewyears, individual countries take very different measures to keep healthcare sustainable,
ranging from deep systematic reforms to defensive restrictive measures on the level of
provision and access. Apparently, some national healthcare systems experience a sort of
inertia to any change. On the other hand, quick learners like Estonia or Slovakia have had
the questionable advantage of facing a crisis so threatening that it became an opportunity
to redesign the whole approach to healthcare.
6.8 Why do patients not know?
Each year, the results of the survey made in co-operation with Patient View reveal an
interesting fact: in some countries, the patients’ organisations and health campaigners(even very respectful ones) do not know about some of the services available in their
country. For example, the research team constantly finds negative answers on the
existence of doctors’ registries, pharmacopoeias, access to medical records etc. in
countries where HCP researchers can easily find this kind of information even without the
knowledge of local language. To sum up, probably the reason is that national authorities
make considerable improvements, but miss out on communicating these to the wide
public.
Three countries, where the opinions of patient organizations are deviating negatively from
official statistics, are Greece, Ireland and Spain. One example: Spanish regulations do
give patients the right to read their own patient records – nevertheless, Spanish patientorganizations returned the most pessimistic responses to this survey question of any of the
33 countries.
6.9 MRSA spread
In the EHCI 2007, considerable attention was paid to the problem of antibiotics resistance
spread: “MRSA infections in hospitals seem to spread and are now a significant health
threat in one out of two measured countries.” Unfortunately, the only countries where
significant improvement can be seen are Bulgaria, Poland and the British Isles. In
addition, both the newly included Candidates countries face the MRSA spread as well.
8/8/2019 Health Consumer powerhouse Report EHCI 2009 091001 final with cover
http://slidepdf.com/reader/full/health-consumer-powerhouse-report-ehci-2009-091001-final-with-cover 27/67
Health Consumer Powerhouse
Euro Health Consumer Index 2009 report
27
Only 7 countries out of 33 can say that MRSA is not a major problem, thus scoring
Green.
6.9.1 Ban sales of antibiotics without prescription!
There is one measure, which could be very effective against the spread of microbial
resistance; the banning of sales of antibiotics without a prescription. There is no country,
where this practice is commonplace, which does not have a significant resistance
problem!
7. How to interpret the Index results?
The first and most important consideration on how to treat the results is: with caution!
The Euro Health Consumer Index 2009 is an attempt at measuring and ranking the
performance of healthcare provision from a consumer viewpoint. The results definitely
contain information quality problems. There is a shortage of pan-European, uniform set
procedures for data gathering.
But again, the HCP finds it far better to present the results to the public, and to promote
constructive discussion rather than staying with the only too common opinion that as long
as healthcare information is not a hundred percent complete it should be kept in the
closet. Again, it is important to stress that the Index displays consumer information, not
medically or individually sensitive data.
While by no means claiming that the EHCI 2009 results are dissertation quality, thefindings should not be dismissed as random findings. On the contrary, previous
experience from the general Euro Health Consumer Indexes reflects that consumer
ranking by similar indicators is looked upon as an important tool to display healthcare
service quality. The HCP hopes that the EHCI 2009 results can serve as inspiration for
how and where European healthcare can be improved.
8. European data shortage
8.1 Medical outcomes indicators included in the EHCI
There is one predominant feature, which characterizes European/Canadian public
healthcare systems as opposed to their more industrialised counterparts in countries such
as the U.S.A.: there is an abundance of statistics on input of resources, but a traditional
scarcity of data on quantitative or qualitative output .
Organisations like the WHO and OECD are publishing easily accessible and frequently
updated statistics on topics like:
the number of doctors/nurses per capita
hospital beds per capita
share of patients receiving certain treatments

8/8/2019 Health Consumer powerhouse Report EHCI 2009 091001 final with cover
http://slidepdf.com/reader/full/health-consumer-powerhouse-report-ehci-2009-091001-final-with-cover 28/67
Health Consumer Powerhouse
Euro Health Consumer Index 2009 report
28
number of consultations per capita
number of MR units per million of population
health expenditure by sources of fundsdrug sales in doses and monetary value (endless tables)
Systems with a history of funding structures based on grant schemes and global budgeting
often exhibit a management culture, where monitoring and follow-up is more or less
entirely focused on input factors. Such factors can be staff numbers, costs of all kinds
(though not usually put in relation to output factors) and other factors of the nature
illustrated by the above bullet list.
Healthcare systems operating more on an industrial basis have a natural inclination to
focus monitoring on output , and also much more naturally relate measurements of costs
to output factors in order to measure productivity, cost-effectiveness and quality.
The EHCI project has endeavoured to obtain data on the quality of actual healthcare
provided. Doing this, the ambition has been to concentrate on indicators, where the
contribution of actual healthcare provision is the main factor, and external factors such as
lifestyle, food, alcohol or smoking are not heavily interfering. Thus, the EHCI has also
avoided including public health parameters, which often tend to be less influenced by
healthcare performance than by external factors.
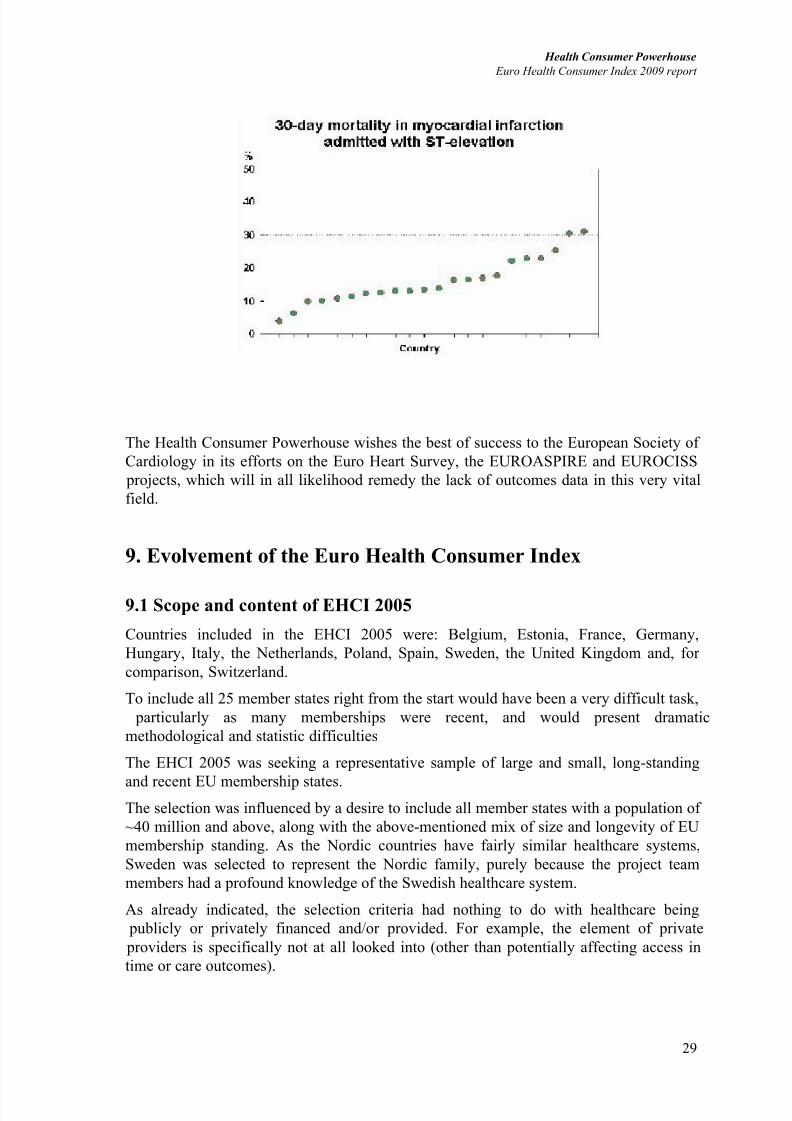
One chosen quality indicator has been: Heart infarct case fatality < 28 days after
hospitalisation (de-selecting such parameters as total heart disease mortality, where the
Mediterranean states have an inherent, presumably life-style dependent, leading position).
The data originally used were those from the so-called MONICA study, completed withdata obtained directly from healthcare authorities of countries not part of MONICA. For
Sweden, Finland, Denmark and Austria and a few more countries much more recent data
from national sources have been used, but with the cut-off to get a Green score set at 8%
case fatality rather than 18%. In the early 1990’s, 18% was state-of-the-art – 15 years
later, that has improved considerably.
There is a surprising lack of more recent data on this the #1 killer disease in modern-day
Europe. The graph shown below is in its original form from material published by the
European Society of Cardiology, (with the identities of countries not given) based on
what is by now very ancient MONICA data.
8/8/2019 Health Consumer powerhouse Report EHCI 2009 091001 final with cover
http://slidepdf.com/reader/full/health-consumer-powerhouse-report-ehci-2009-091001-final-with-cover 29/67
Health Consumer Powerhouse
Euro Health Consumer Index 2009 report
29
The Health Consumer Powerhouse wishes the best of success to the European Society of
Cardiology in its efforts on the Euro Heart Survey, the EUROASPIRE and EUROCISS
projects, which will in all likelihood remedy the lack of outcomes data in this very vital
field.
9. Evolvement of the Euro Health Consumer Index
9.1 Scope and content of EHCI 2005
Countries included in the EHCI 2005 were: Belgium, Estonia, France, Germany,
Hungary, Italy, the Netherlands, Poland, Spain, Sweden, the United Kingdom and, for
comparison, Switzerland.
To include all 25 member states right from the start would have been a very difficult task,
particularly as many memberships were recent, and would present dramatic
methodological and statistic difficulties
The EHCI 2005 was seeking a representative sample of large and small, long-standing
and recent EU membership states.The selection was influenced by a desire to include all member states with a population of
~40 million and above, along with the above-mentioned mix of size and longevity of EU
membership standing. As the Nordic countries have fairly similar healthcare systems,
Sweden was selected to represent the Nordic family, purely because the project team
members had a profound knowledge of the Swedish healthcare system.
As already indicated, the selection criteria had nothing to do with healthcare being
publicly or privately financed and/or provided. For example, the element of private
providers is specifically not at all looked into (other than potentially affecting access in
time or care outcomes).
8/8/2019 Health Consumer powerhouse Report EHCI 2009 091001 final with cover
http://slidepdf.com/reader/full/health-consumer-powerhouse-report-ehci-2009-091001-final-with-cover 30/67
Health Consumer Powerhouse
Euro Health Consumer Index 2009 report
30
One important conclusion from the work on EHCI 2005 was that it is indeed possible to
construct and obtain data for an index comparing and ranking national healthcare systems
seen from the consumer/patient’s viewpoint.
9.2 Scope and content of EHCI 2006 – 2009
The EHCI 2006 included all the 25 EU member states of that time, plus Switzerland
using essentially the same methodology as in 2005.
The number of indicators was also increased, from 20 in the EHCI 2005 to 28 in the 2006
issue. The number of sub-disciplines was kept at five; with the change that the “Customer
Friendliness” sub-discipline was merged into “Patient Rights and Information”. The new
sub-discipline “Generosity” (What is included in the public healthcare offering?) was
introduced, as it was commented from a number of observers, not least healthcare
politicians in countries having pronounced waiting time problems, that absence of waitingtimes could be a result of “meanness” – national healthcare systems being restrictive on
who gets certain operations could naturally be expected to have less waiting list problems.
In order to test this, the new sub discipline “Generosity” of public healthcare systems, in
2009 calles “Range and reach of services”. A problem with this sub discipline is that it is
only too easy to land in a situation, where an indicator becomes just another way of
measuring national wealth (GDP/capita). The indicator “Number of hip joint
replacements per 100 000 inhabitants” is one prominent example of this. The cost per
operation of a hip joint is in the neighbourhood of € 7000 (can be slightly more in
Western Europe – less in states with low salaries for healthcare staff). That cost, for a
condition that might be crippling but not life-threatening, results in Provision levels beingvery closely correlated to GDP/capita.
Cataract operations seem a better and less GDP-correlated indicator on the Generosity of
public healthcare systems. The cost per operation is only one tenth of that for a hip joint
and thus much more affordable in less affluent countries. Interestingly, Belgium – a
country with minimal waiting list problems, and which was most often to us accused of
achieving this through restrictiveness, by far has (along with Canada) the highest
provision levels for cataract operations in the OECD.
To achieve a higher level of reliability of information, one essential work ingredient has
been to establish a net of contacts directly with national healthcare authorities in a more
systematic way than was the case for previous EHCI editions. The weaknesses inEuropean healthcare statistics described in previous EHCI reports can only be offset by
in-depth discussions with key personnel at a national healthcare authority level.
In general, the responsiveness from Health Ministries, or their state agencies in charge of
supervision and/or Quality Assurance of healthcare services, was good in 2006 – 2008.
Written responses were received from 19 EU member states. This situation greatly
improved in 2009 (see section 9.9.2).
8/8/2019 Health Consumer powerhouse Report EHCI 2009 091001 final with cover
http://slidepdf.com/reader/full/health-consumer-powerhouse-report-ehci-2009-091001-final-with-cover 31/67
Health Consumer Powerhouse
Euro Health Consumer Index 2009 report
31
9.3 EHCI 2009
The project work on the Index is a compromise between which indicators were judged to
be most significant for providing information about the different national healthcaresystems from a user/consumer’s viewpoint, and the availability of data for these
indicators. This is a version of the classical problem “Should we be looking for the 100-
dollar bill in the dark alley, or for the dime under the lamppost?”
It has been deemed important to have a mix of indicators in different fields; areas of
service attitude and customer orientation as well as indicators of a “hard facts” nature
showing healthcare quality in outcome terms. It was also decided to search for indicators
on actual results in the form of outcomes rather than indicators depicting procedures, such
as “needle time” (time between patient arrival to an A&E department and trombolytic
injection), percentage of heart patients trombolysed or stented, etcetera.
Intentionally de-selected were indicators measuring public health status, such as lifeexpectancy, lung cancer mortality, total heart disease mortality, diabetes incidence, etc.
Such indicators tend to be primarily dependent on lifestyle or environmental factors rather
than healthcare system performance. They generally offer very little information to the
consumer wanting to choose among therapies or care providers, waiting in line for
planned surgery, or worrying about the risk of having a post-treatment complication or the
consumer who is dissatisfied with the restricted information.
9.4 No indicators taken out from the EHCI 2008 set
Of the totally 34 indicators used for the EHCI 2008, none has been discontinued in the2009 Index.
Despite a frenetic disagreement from some countries, HCP proudly keeps the indicator
“Direct access to specialists” in the EHCI, as there is absolutely no evidence that the GP
gatekeeping role has an impact on expenses side of healthcare. Studies such as that made
by Kroneman et al.2 provide more respectful reasoning in this regard than statements like
“The gatekeeping is a matter of policy and we insist that this indicator is removed from
the index.”
9.5 New indicators introduced for EHCI 2009
In the design and selection of indicators, the EHCI has been working on the following
three criteria since 2005:
1. Relevance
2. Scientific soundness
3. Feasibility (i.e. can data be obtained)
The HCP team was happy to learn that those same three principles are also governing the
new German quality indicators project, www.bqs-online.de.
2
Kroneman et al: Direct access in primary care and patient satisfaction: A European study. Health Policy 76 (2006)72 – 79

8/8/2019 Health Consumer powerhouse Report EHCI 2009 091001 final with cover
http://slidepdf.com/reader/full/health-consumer-powerhouse-report-ehci-2009-091001-final-with-cover 32/67
Health Consumer Powerhouse
Euro Health Consumer Index 2009 report
32
As every year the international expert panel has fed in a long list of new indicators to be
included in this year’s Index (find more on expert panel composition), there was a true
brainstorm of new bright ideas to be included in this year’s Index. Unfortunately, the
research team was unable to turn all of them into a green-yellow-red score in the matrix;for example, the indicator “Hospital admissions for asthma” (a high number giving a Red
score) had to be discarded due to the chaos of diagnosis differentiation between asthma,
COPD, bronchitis and possibly other ailments.
Nevertheless, the research team was able to present data for six new/modified indicators.
For description and more details on the indicators, see section “Content of indicators in
the EHCI 2009”.
Sub-discipline 1 (Patient rights and information)
1.8. Cross border care seeking1.9 Provider catalogue with quality ranking; this was moved back from the e-Health sub-
discipline into sub-discipline 1 (where it used to reside 2005 – 2007).
Sub-discipline 2 (e-Health)
This sub-discipline was introduced to highlight the fact that the largest, most information-
intensive industry in society (= healthcare) is incredibly under-developed in the field of
computer use. A nurse handles probably one hundred times more information on an 8-
hour shift than a nightwatchman does. Nevertheless, nightwatchmen in many countries
are sporting handheld computers, and nurses are not. The potential for improvements in
outcomes, patient safety, flow rationalization and other areas of healthcare throughincreased intelligent use of computers is enormous.
The sub-discipline contains three novel indicators:
2.3 Lab test results communicated direct to patients via e-health solutions?
2.4 Do patients have access to on-line booking of appointments?
2.5 on-line access to check how much doctors/clinics have charged insurers for your care?
Sub-discipline 4 (Outcomes)
4.3 ”Ratio of cancer deaths to incidence 2006” replaced the previous Cancer 5-year
survival indicator, as no fresh data cound be found – the most recent are still the
EUROCARE data on patients diagnosed 1995 – 1999.
Sub-discipline 5 (Range and Reach of services provided)
5.1 Equity of healthcare systems
9.6 Indicator areas (sub-disciplines)
The 2009 Index is, just like in 2008, built up with indicators grouped in six sub-
disciplines. After having had to surrender to the “lack of statistics syndrome”, and after
scrutiny by the expert panel, 38 indicators survived into the EHCI 2009.
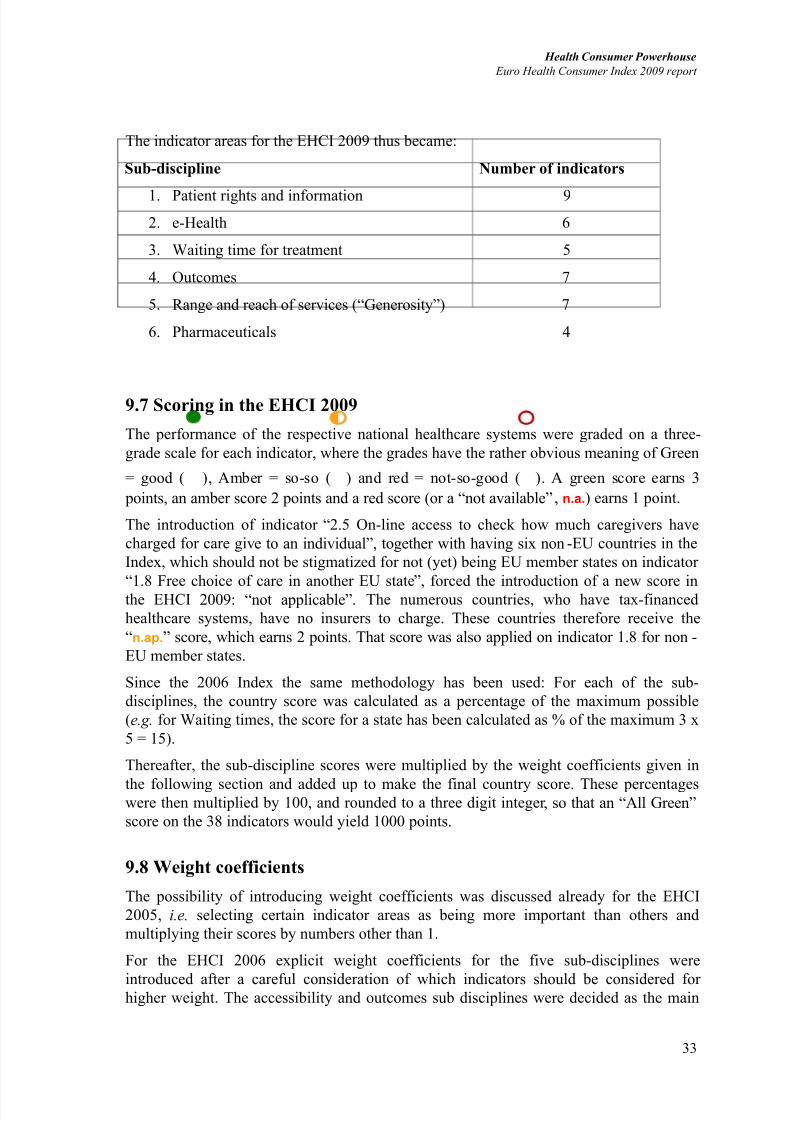
8/8/2019 Health Consumer powerhouse Report EHCI 2009 091001 final with cover
http://slidepdf.com/reader/full/health-consumer-powerhouse-report-ehci-2009-091001-final-with-cover 33/67
Health Consumer Powerhouse
Euro Health Consumer Index 2009 report
33
The indicator areas for the EHCI 2009 thus became:
Sub-discipline Number of indicators
1. Patient rights and information 9
2. e-Health 6
3. Waiting time for treatment 5
4. Outcomes 7
5. Range and reach of services (“Generosity”) 7
6. Pharmaceuticals 4
9.7 Scoring in the EHCI 2009
The performance of the respective national healthcare systems were graded on a three-
grade scale for each indicator, where the grades have the rather obvious meaning of Green
= good (), Amber = so-so ( ) and red = not-so-good ( ). A green score earns 3
points, an amber score 2 points and a red score (or a “not available”, n.a.) earns 1 point.
The introduction of indicator “2.5 On-line access to check how much caregivers have
charged for care give to an individual”, together with having six non-EU countries in the
Index, which should not be stigmatized for not (yet) being EU member states on indicator
“1.8 Free choice of care in another EU state”, forced the introduction of a new score in
the EHCI 2009: “not applicable”. The numerous countries, who have tax-financed
healthcare systems, have no insurers to charge. These countries therefore receive the
“n.ap.” score, which earns 2 points. That score was also applied on indicator 1.8 for non-
EU member states.
Since the 2006 Index the same methodology has been used: For each of the sub-
disciplines, the country score was calculated as a percentage of the maximum possible
(e.g. for Waiting times, the score for a state has been calculated as % of the maximum 3 x
5 = 15).
Thereafter, the sub-discipline scores were multiplied by the weight coefficients given in
the following section and added up to make the final country score. These percentageswere then multiplied by 100, and rounded to a three digit integer , so that an “All Green”
score on the 38 indicators would yield 1000 points.
9.8 Weight coefficients
The possibility of introducing weight coefficients was discussed already for the EHCI
2005, i.e. selecting certain indicator areas as being more important than others and
multiplying their scores by numbers other than 1.
For the EHCI 2006 explicit weight coefficients for the five sub-disciplines were
introduced after a careful consideration of which indicators should be considered for higher weight. The accessibility and outcomes sub disciplines were decided as the main
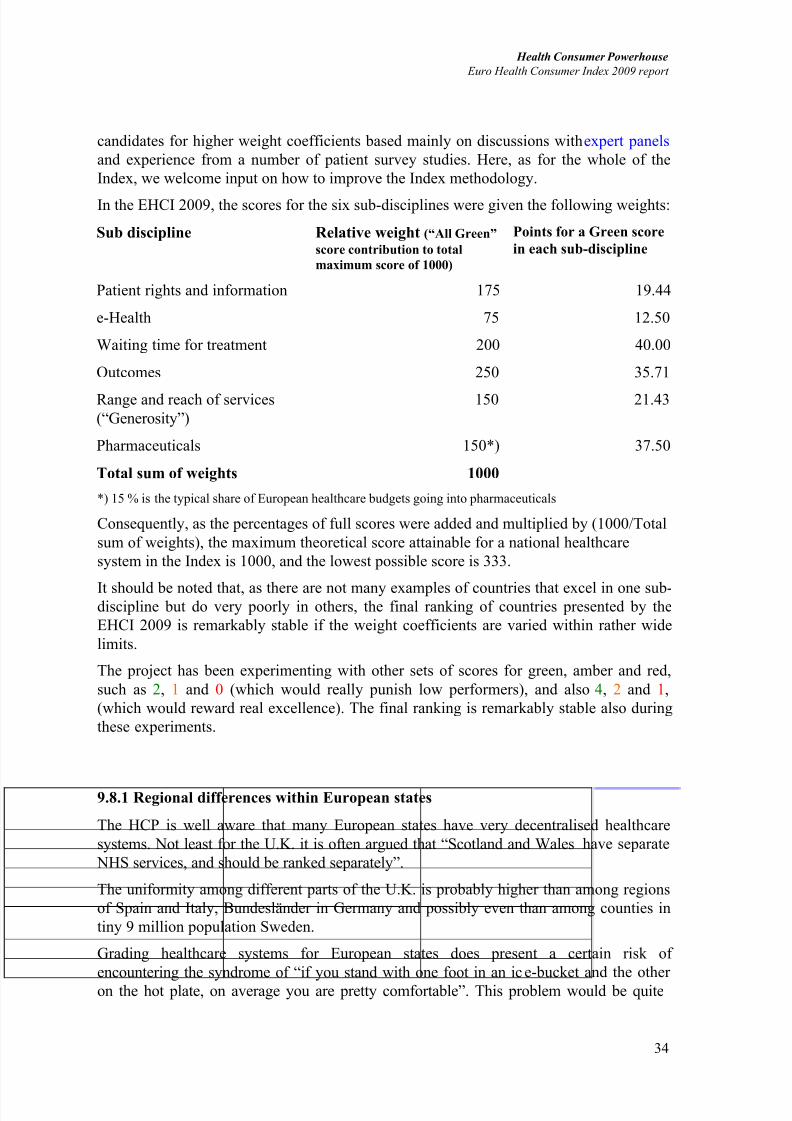
8/8/2019 Health Consumer powerhouse Report EHCI 2009 091001 final with cover
http://slidepdf.com/reader/full/health-consumer-powerhouse-report-ehci-2009-091001-final-with-cover 34/67
Health Consumer Powerhouse
Euro Health Consumer Index 2009 report
34
candidates for higher weight coefficients based mainly on discussions with expert panels
and experience from a number of patient survey studies. Here, as for the whole of the
Index, we welcome input on how to improve the Index methodology.
In the EHCI 2009, the scores for the six sub-disciplines were given the following weights:
Sub discipline Relative weight (“All Green”score contribution to total
maximum score of 1000)
Points for a Green score
in each sub-discipline
Patient rights and information 175 19.44
e-Health 75 12.50
Waiting time for treatment 200 40.00
Outcomes 250 35.71
Range and reach of services
(“Generosity”)
150 21.43
Pharmaceuticals 150*) 37.50
Total sum of weights 1000
*) 15 % is the typical share of European healthcare budgets going into pharmaceuticals
Consequently, as the percentages of full scores were added and multiplied by (1000/Total
sum of weights), the maximum theoretical score attainable for a national healthcare
system in the Index is 1000, and the lowest possible score is 333.
It should be noted that, as there are not many examples of countries that excel in one sub-discipline but do very poorly in others, the final ranking of countries presented by the
EHCI 2009 is remarkably stable if the weight coefficients are varied within rather wide
limits.
The project has been experimenting with other sets of scores for green, amber and red,
such as 2, 1 and 0 (which would really punish low performers), and also 4, 2 and 1,
(which would reward real excellence). The final ranking is remarkably stable also during
these experiments.
9.8.1 Regional differences within European states
The HCP is well aware that many European states have very decentralised healthcare
systems. Not least for the U.K. it is often argued that “Scotland and Wales have separate
NHS services, and should be ranked separately”.
The uniformity among different parts of the U.K. is probably higher than among regions
of Spain and Italy, Bundesländer in Germany and possibly even than among counties in
tiny 9 million population Sweden.
Grading healthcare systems for European states does present a certain risk of
encountering the syndrome of “if you stand with one foot in an ice-bucket and the other
on the hot plate, on average you are pretty comfortable”. This problem would be quite

8/8/2019 Health Consumer powerhouse Report EHCI 2009 091001 final with cover
http://slidepdf.com/reader/full/health-consumer-powerhouse-report-ehci-2009-091001-final-with-cover 35/67
Health Consumer Powerhouse
Euro Health Consumer Index 2009 report
35
pronounced if there were an ambition to include the U.S.A. as one country in a Health
Consumer Index.
As equity in healthcare has traditionally been high on the agenda in European states, it
has been judged that regional differences are small enough to make statements about the
national levels of healthcare services relevant and meaningful.
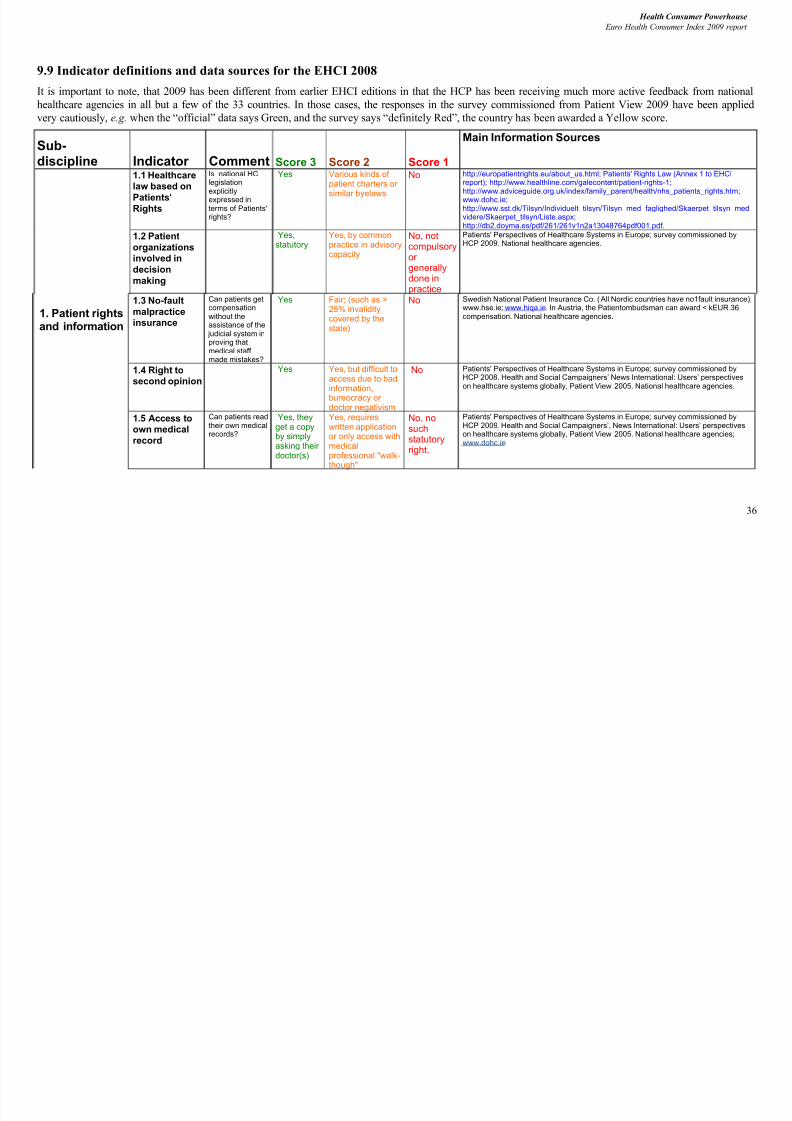
8/8/2019 Health Consumer powerhouse Report EHCI 2009 091001 final with cover
http://slidepdf.com/reader/full/health-consumer-powerhouse-report-ehci-2009-091001-final-with-cover 36/67
36
Health Consumer Powerhouse
Euro Health Consumer Index 2009 report
9.9 Indicator definitions and data sources for the EHCI 2008
It is important to note, that 2009 has been different from earlier EHCI editions in that the HCP has been receiving much more active feedback from nationalhealthcare agencies in all but a few of the 33 countries. In those cases, the responses in the survey commissioned from Patient View 2009 have been appliedvery cautiously, e.g. when the “official” data says Green, and the survey says “definitely Red”, the country has been awarded a Yellow score.
Sub-
discipline Indicator Comment Score 3 Score 2 Score 1
Main Information Sources
1. Patient rightsand information
1.1 Healthcarelaw based on
Patients'Rights
Is national HClegislationexplicitlyexpressed interms of Patients'rights?
Yes Various kinds of patient charters or
similar byelaws
No http://europatientrights.eu/about_us.html; Patients' Rights Law (Annex 1 to EHCIreport); http://www.healthline.com/galecontent/patient-rights-1;http://www.adviceguide.org.uk/index/family_parent/health/nhs_patients_rights.htm;www.dohc.ie;http://www.sst.dk/Tilsyn/Individuelt_tilsyn/Tilsyn_med_faglighed/Skaerpet_tilsyn_med_ videre/Skaerpet_tilsyn/Liste.aspx;http://db2.doyma.es/pdf/261/261v1n2a13048764pdf001.pdf.
1.2 Patient
organizationsinvolved in
decision
making
Yes,statutory
Yes, by commonpractice in advisorycapacity
No, notcompulsoryor generallydone inpractice
Patients' Perspectives of Healthcare Systems in Europe; survey commissioned byHCP 2009. National healthcare agencies.
1.3 No-fault
malpracticeinsurance
Can patients getcompensationwithout theassistance of the judicial system inproving thatmedical staff made mistakes?
Yes Fair; (such as >25% invaliditycovered by thestate)
No Swedish National Patient Insurance Co. ( All Nordic countries have no1fault insurance);www.hse.ie; www.hiqa.ie. In Austria, the Patientombudsman can award < kEUR 36compensation. National healthcare agencies.
1.4 Right tosecond opinion
Yes Yes, but difficult toaccess due to bad
information,bureocracy or doctor negativism
No Patients' Perspectives of Healthcare Systems in Europe; survey commissioned byHCP 2008. Health and Social Campaigners’ News International: Users’ perspectiveson healthcare systems globally, Patient View 2005. National healthcare agencies.
1.5 Access toown medical
record
Can patients readtheir own medicalrecords?
Yes, theyget a copyby simplyasking their doctor(s)
Yes, requireswritten applicationor only access withmedicalprofessional "walk-though"
No, nosuchstatutoryright.
Patients' Perspectives of Healthcare Systems in Europe; survey commissioned byHCP 2009. Health and Social Campaigners’, News International: Users’ perspectiveson healthcare systems globally, Patient View 2005. National healthcare agencies;www.dohc.ie
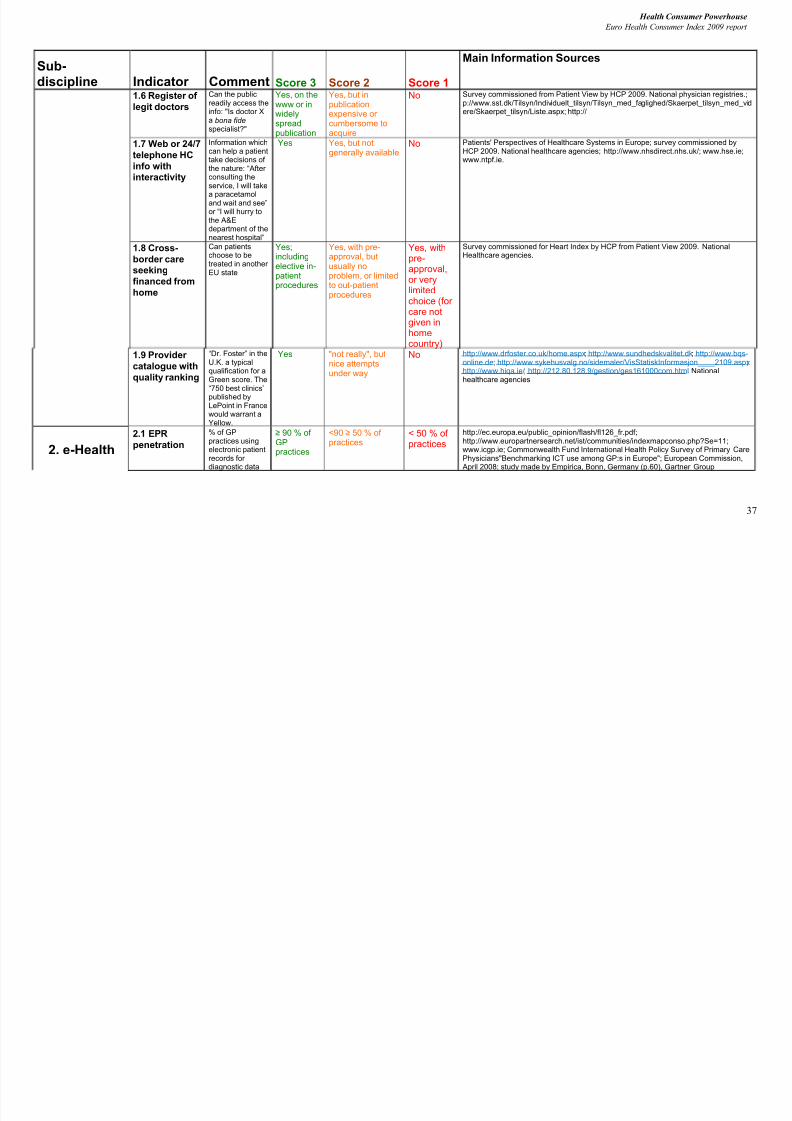
8/8/2019 Health Consumer powerhouse Report EHCI 2009 091001 final with cover
http://slidepdf.com/reader/full/health-consumer-powerhouse-report-ehci-2009-091001-final-with-cover 37/67
37
Health Consumer Powerhouse
Euro Health Consumer Index 2009 report
Sub-
discipline Indicator Comment Score 3 Score 2 Score 1
Main Information Sources
1.6 Register of
legit doctors
Can the publicreadily access theinfo: "Is doctor Xa bona fide specialist?"
Yes, on thewww or inwidelyspreadpublication
Yes, but inpublicationexpensive or cumbersome toacquire
No Survey commissioned from Patient View by HCP 2009. National physician registries.;p://www.sst.dk/Tilsyn/Individuelt_tilsyn/Tilsyn_med_faglighed/Skaerpet_tilsyn_med_videre/Skaerpet_tilsyn/Liste.aspx; http://
1.7 Web or 24/7
telephone HC
info withinteractivity
Information whichcan help a patienttake decisions of the nature: “After consulting theservice, I will take
a paracetamoland wait and see”or “I will hurry tothe A&Edepartment of thenearest hospital”
Yes Yes, but notgenerally available
No Patients' Perspectives of Healthcare Systems in Europe; survey commissioned byHCP 2009. National healthcare agencies; http://www.nhsdirect.nhs.uk/; www.hse.ie;www.ntpf.ie.
1.8 Cross-
border careseeking
financed from
home
Can patientschoose to betreated in another EU state
Yes;includingelective in-patientprocedures
Yes, with pre-approval, butusually noproblem, or limitedto out-patientprocedures
Yes, withpre-approval,or verylimitedchoice (for care notgiven inhomecountry)
Survey commissioned for Heart Index by HCP from Patient View 2009. NationalHealthcare agencies.
1.9 Provider
catalogue with
quality ranking
“Dr. Foster” in theU.K. a typicalqualification for aGreen score. The
“750 best clinics”published byLePoint in Francewould warrant aYellow.
Yes "not really", butnice attemptsunder way
No http://www.drfoster.co.uk/home.aspx; http://www.sundhedskvalitet.dk; http://www.bqs-online.de; http://www.sykehusvalg.no/sidemaler/VisStatiskInformasjon____2109.aspx;http://www.hiqa.ie/; http://212.80.128.9/gestion/ges161000com.html. Nationalhealthcare agencies
2. e-Health
2.1 EPR
penetration
% of GPpractices usingelectronic patientrecords for diagnostic data
≥ 90 % of GPpractices
<90 ≥ 50 % of practices
< 50 % of practices
http://ec.europa.eu/public_opinion/flash/fl126_fr.pdf;http://www.europartnersearch.net/ist/communities/indexmapconso.php?Se=11;www.icgp.ie; Commonwealth Fund International Health Policy Survey of Primary CarePhysicians"Benchmarking ICT use among GP:s in Europe"; European Commission,April 2008; study made by Empirica, Bonn, Germany (p.60), Gartner Group

8/8/2019 Health Consumer powerhouse Report EHCI 2009 091001 final with cover
http://slidepdf.com/reader/full/health-consumer-powerhouse-report-ehci-2009-091001-final-with-cover 38/67
38
Health Consumer Powerhouse
Euro Health Consumer Index 2009 report
Sub-
discipline Indicator Comment Score 3 Score 2 Score 1
Main Information Sources
2.2 e-transfer
of medical data
between healthprofessionals
% of GPpractices using e-networks for transfer of medical data tocare providers /professionals
≥ 25 % of GPpractices
<25 ≥10 % of practices
< 10 % of practices
"Benchmarking ICT use among GP:s in Europe"; European Commission, April 2008;study made by Empirica, Bonn, Germany (p.45), Gartner Group, Cambio Sweden
2.3 Lab test
results
communicateddirect to patients via e-health
solutions?
Can patientsreceive testresults either bye-mail or bylogging on topersonal webpage?
Yes, widelyavailable
Only from somepioneer hospitals/laboratories
No, or veryrare
Survey commissioned by HCP from Patient View 2009. National healthcare agencies.
2.4 Do patients
have access toon-line
booking of
appointments?
Can patientsbook doctor appointments on-line?
Yes, widelyavailable
Only from somepioneer hospitals/laboratories
No, or veryrare
Survey commissioned by HCP from Patient View 2009. National healthcare agencies.
2.5 on-line
access to
check howmuch
doctors/clinics
have chargedinsurers for
your care?
Can patientscheck on-line howmuch garegivershave clamed fromtheir healthinsurance?
Yes For somecaregivers, fromsome insuranceproviders, or "Notapplicable" (e.g. intax-financedsystems)
No Survey commissioned by HCP from Patient View 2009. National healthcare agencies.
2.6 e-
prescriptions
% of GP
practices usingelectronicnetworks for prescriptions topharmacies
≥ 50 % of
GPpractices
<50 ≥ 5 % of
practices
< 5 % of
practices
"Benchmarking ICT use among GP:s in Europe"; European Commission, April 2008;
study made by Empirica, Bonn, Germany. (p.45), Gartner Group, Cambio
3. Waiting timefor treatment
3.1 Family
doctor sameday access
Can I count onseeing myprimary caredoctor today?
Yes Yes, but not quitefulfilled
No Survey commissioned from Patient View by HCP 2009. National healthcare agencies.
3.2 Direct
access to
specialist
Without referralfrom family doctor (GP)
Yes Quite often inreality, or for limited number of specialities
No Survey commissioned by HCP from Patient View 2009. National healthcare agencies,
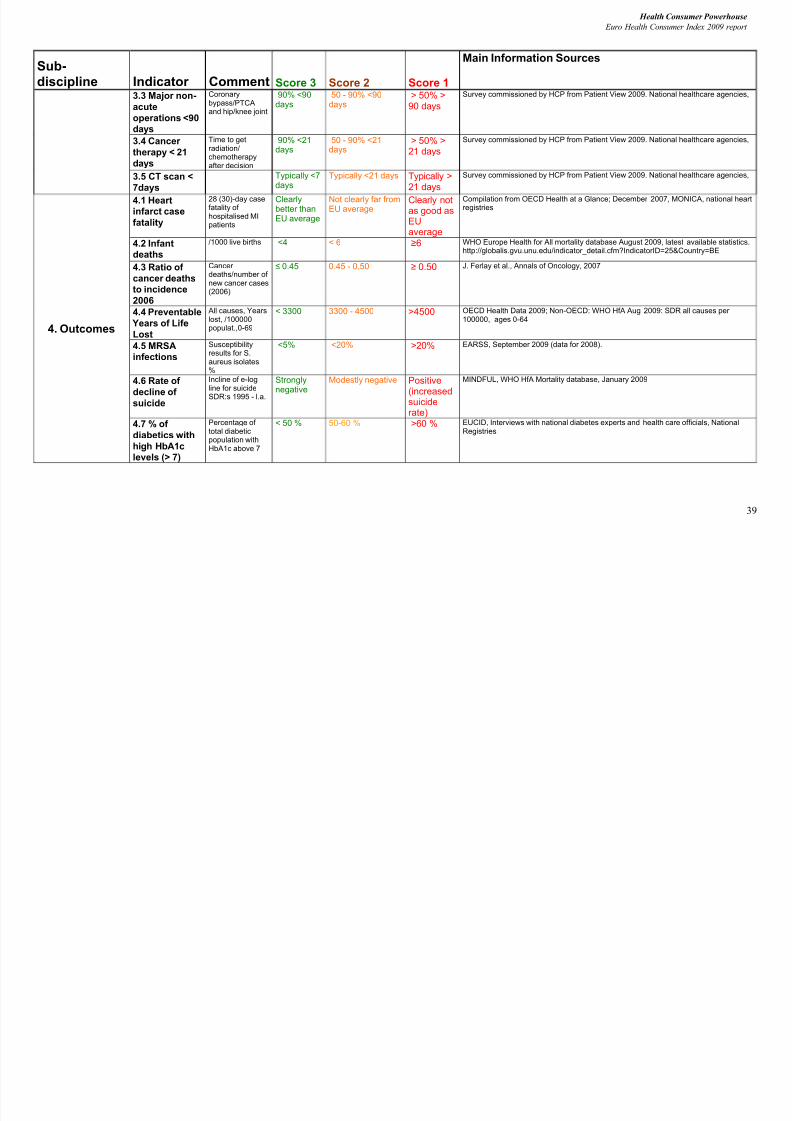
8/8/2019 Health Consumer powerhouse Report EHCI 2009 091001 final with cover
http://slidepdf.com/reader/full/health-consumer-powerhouse-report-ehci-2009-091001-final-with-cover 39/67
39
Health Consumer Powerhouse
Euro Health Consumer Index 2009 report
Sub-
discipline Indicator Comment Score 3 Score 2 Score 1
Main Information Sources
3.3 Major non-
acute
operations <90days
Coronarybypass/PTCAand hip/knee joint
90% <90days
50 - 90% <90days
> 50% >90 days
Survey commissioned by HCP from Patient View 2009. National healthcare agencies,
3.4 Cancer
therapy < 21
days
Time to getradiation/chemotherapyafter decision
90% <21days
50 - 90% <21days
> 50% >21 days
Survey commissioned by HCP from Patient View 2009. National healthcare agencies,
3.5 CT scan <
7days
Typically <7days
Typically <21 days Typically >21 days
Survey commissioned by HCP from Patient View 2009. National healthcare agencies,
4. Outcomes
4.1 Heartinfarct case
fatality
28 (30)-day casefatality of hospitalised MIpatients
Clearlybetter thanEU average
Not clearly far fromEU average
Clearly notas good asEUaverage
Compilation from OECD Health at a Glance; December 2007, MONICA, national heartregistries
4.2 Infantdeaths
/1000 live births <4 < 6 ≥6 WHO Europe Health for All mortality database August 2009, latest available statistics.http://globalis.gvu.unu.edu/indicator_detail.cfm?IndicatorID=25&Country=BE
4.3 Ratio of
cancer deathsto incidence
2006
Cancer deaths/number of new cancer cases(2006)
≤ 0.45 0.45 - 0.50 ≥ 0.50 J. Ferlay et al., Annals of Oncology, 2007
4.4 Preventable
Years of Life
Lost
All causes, Yearslost, /100000populat.,0-69
< 3300 3300 - 4500 >4500 OECD Health Data 2009; Non-OECD: WHO HfA Aug 2009: SDR all causes per 100000, ages 0-64
4.5 MRSAinfections
Susceptibilityresults for S.aureus isolates,%
<5% <20% >20% EARSS, September 2009 (data for 2008).
4.6 Rate of
decline of suicide
Incline of e-log
line for suicideSDR:s 1995 - l.a.
Strongly
negative
Modestly negative Positive
(increasedsuiciderate)
MINDFUL, WHO HfA Mortality database, January 2009
4.7 % of
diabetics with
high HbA1clevels (> 7)
Percentage of total diabeticpopulation withHbA1c above 7
< 50 % 50-60 % >60 % EUCID, Interviews with national diabetes experts and health care officials, NationalRegistries
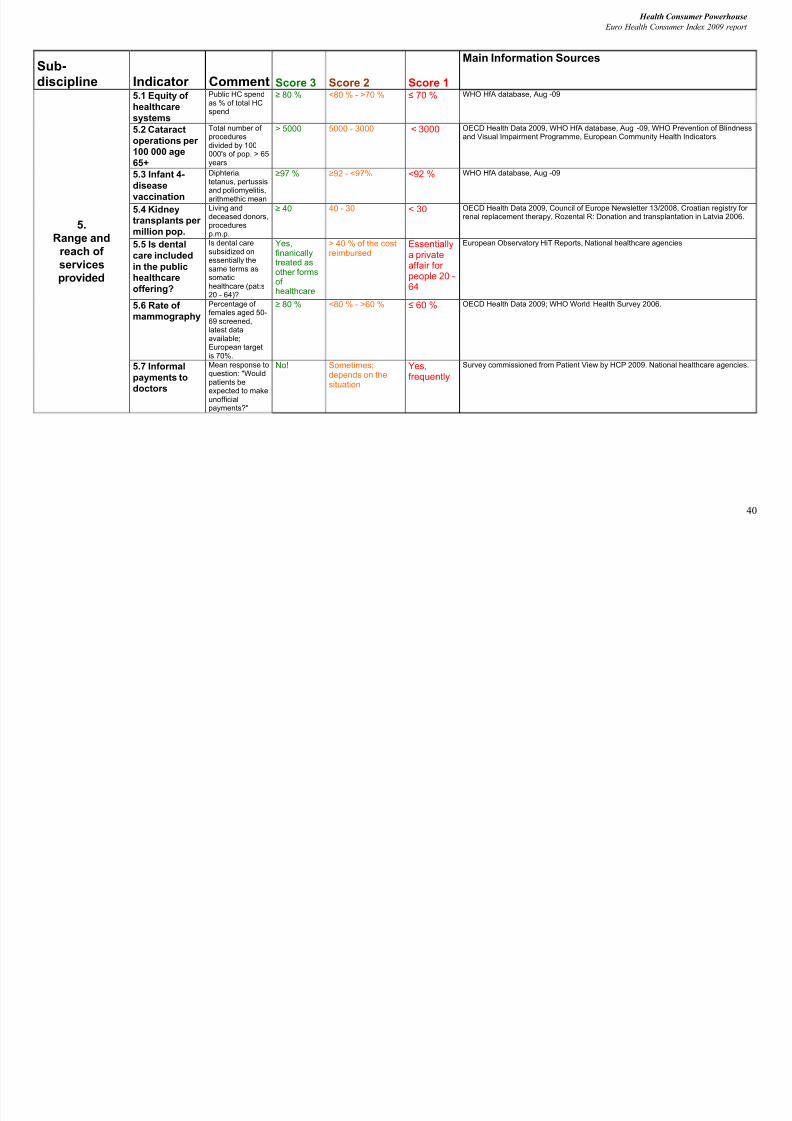
8/8/2019 Health Consumer powerhouse Report EHCI 2009 091001 final with cover
http://slidepdf.com/reader/full/health-consumer-powerhouse-report-ehci-2009-091001-final-with-cover 40/67
40
Health Consumer Powerhouse
Euro Health Consumer Index 2009 report
Sub-
discipline Indicator Comment Score 3 Score 2 Score 1
Main Information Sources
5.Range and
reach of servicesprovided
5.1 Equity of
healthcare
systems
Public HC spendas % of total HCspend
≥ 80 % <80 % - >70 % ≤ 70 % WHO HfA database, Aug -09
5.2 Cataract
operations per 100 000 age
65+
Total number of proceduresdivided by 100000's of pop. > 65years
> 5000 5000 - 3000 < 3000 OECD Health Data 2009, WHO HfA database, Aug -09, WHO Prevention of Blindnessand Visual Impairment Programme, European Community Health Indicators
5.3 Infant 4-
disease
vaccination
Diphteria,tetanus, pertussisand poliomyelitis,arithmethic mean
≥97 % ≥92 - <97% <92 % WHO HfA database, Aug -09
5.4 Kidneytransplants per
million pop.
Living anddeceased donors,proceduresp.m.p.
≥ 40 40 - 30 < 30 OECD Health Data 2009, Council of Europe Newsletter 13/2008, Croatian registry for renal replacement therapy, Rozental R: Donation and transplantation in Latvia 2006.
5.5 Is dental
care included
in the publichealthcare
offering?
Is dental caresubsidized onessentially thesame terms assomatichealthcare (pat:s20 - 64)?
Yes,finanicallytreated asother formsof healthcare
> 40 % of the costreimbursed
Essentiallya privateaffair for people 20 -64
European Observatory HiT Reports, National healthcare agencies
5.6 Rate of mammography
Percentage of females aged 50-69 screened,latest dataavailable;European targetis 70%.
≥ 80 % <80 % - >60 % ≤ 60 % OECD Health Data 2009; WHO World Health Survey 2006.
5.7 Informal
payments to
doctors
Mean response toquestion: "Wouldpatients be
expected to makeunofficialpayments?"
No! Sometimes;depends on thesituation
Yes,frequently
Survey commissioned from Patient View by HCP 2009. National healthcare agencies.

8/8/2019 Health Consumer powerhouse Report EHCI 2009 091001 final with cover
http://slidepdf.com/reader/full/health-consumer-powerhouse-report-ehci-2009-091001-final-with-cover 41/67
41
Health Consumer Powerhouse
Euro Health Consumer Index 2009 report
Sub-
discipline Indicator Comment Score 3 Score 2 Score 1
Main Information Sources
6. Pharma-
ceuticals
6.1 Rx subsidy Proportion of totalsales of Rx drugspaid for by publicsubsidy
>90% 60 - 90% <60% http://www.efpia.org/6_publ/infigure2004h.pdf 2005 update? WHO Health for Alldatabase 2005;http://www.laegemiddelstyrelsen.dk/statistik/overvaagning/udgifter/2007-1/2007-1.asp.;National healthcare agencies
6.2 Layman-adapted
pharmacopeia?
Is there a layman-adaptedpharmacopeiareadily accessibleby the public(www or widelyavaliable)?
Yes Yes, but not reallyeasily accessibleor frequentlyconsulted
No www.fass.se and other similar websites from other countries. National healthcareagencies.
6.3 Novelcancer drugs
deploymentrate
Moreintense thanEU average
Close to EUaverage Lessintensethan EUaverage
"A pan-European comparison regarding patient access to cancer drugs", February2009, Nils Wilking & Bengt Jönsson, Karolinska Institute, Stockholm.
6.4 Access to
new drugs(time to
subsidy)
Betweenregistration andinclusion insubsidy system
<150 days <300 days >300 days Phase 6 Report Feb 2007. PATIENTS W.A.I.T. Indicator Commissioned by EFPIA.IMS Global Consulting. "A pan-European comparison regarding patient access tocancer drugs", Nils Wilking & Bengt Jönsson, Karolinska Institute, Stockholm. Nationalhealthcare agencies
Table 9.8: Indicator definitions and data sources for the EHCI 2008
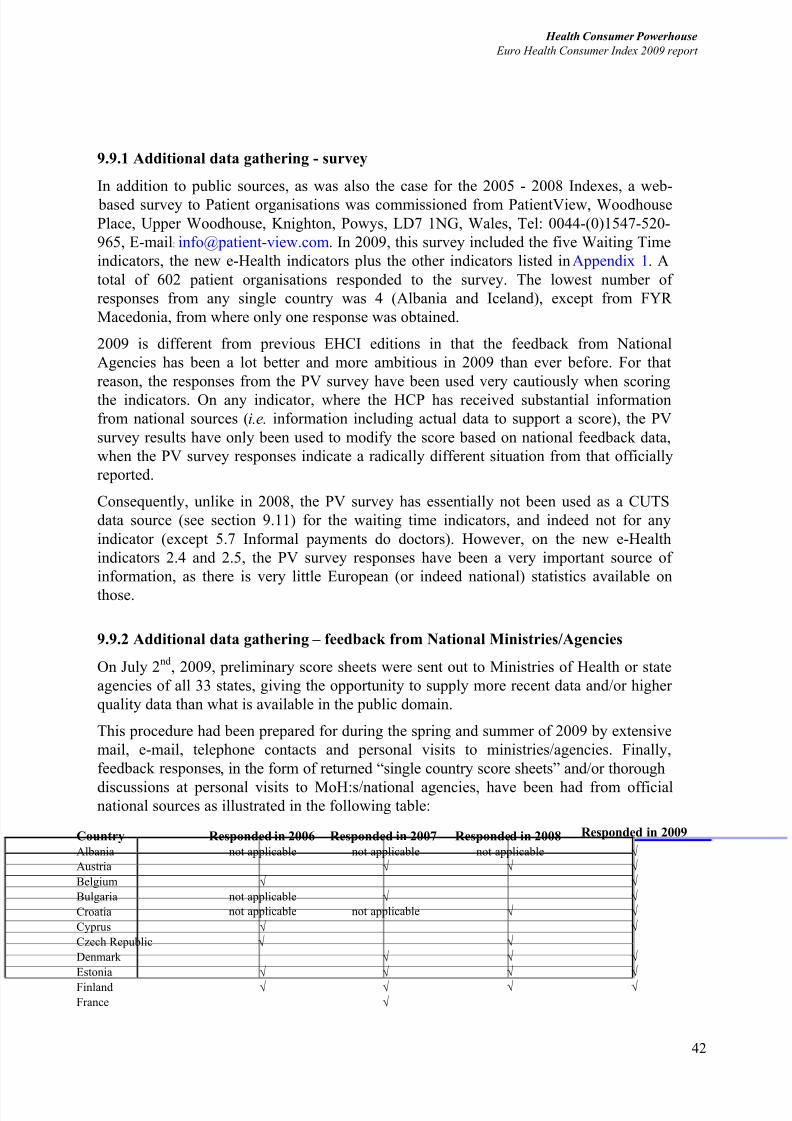
8/8/2019 Health Consumer powerhouse Report EHCI 2009 091001 final with cover
http://slidepdf.com/reader/full/health-consumer-powerhouse-report-ehci-2009-091001-final-with-cover 42/67
42
Health Consumer Powerhouse
Euro Health Consumer Index 2009 report
9.9.1 Additional data gathering - survey
In addition to public sources, as was also the case for the 2005 - 2008 Indexes, a web-
based survey to Patient organisations was commissioned from PatientView, Woodhouse
Place, Upper Woodhouse, Knighton, Powys, LD7 1NG, Wales, Tel: 0044-(0)1547-520-
965, E-mail: [email protected]. In 2009, this survey included the five Waiting Time
indicators, the new e-Health indicators plus the other indicators listed in Appendix 1. A
total of 602 patient organisations responded to the survey. The lowest number of
responses from any single country was 4 (Albania and Iceland), except from FYR
Macedonia, from where only one response was obtained.
2009 is different from previous EHCI editions in that the feedback from National
Agencies has been a lot better and more ambitious in 2009 than ever before. For that
reason, the responses from the PV survey have been used very cautiously when scoring
the indicators. On any indicator, where the HCP has received substantial information
from national sources (i.e. information including actual data to support a score), the PV
survey results have only been used to modify the score based on national feedback data,
when the PV survey responses indicate a radically different situation from that officially
reported.
Consequently, unlike in 2008, the PV survey has essentially not been used as a CUTS
data source (see section 9.11) for the waiting time indicators, and indeed not for any
indicator (except 5.7 Informal payments do doctors). However, on the new e-Health
indicators 2.4 and 2.5, the PV survey responses have been a very important source of
information, as there is very little European (or indeed national) statistics available on
those.
9.9.2 Additional data gathering – feedback from National Ministries/Agencies
On July 2nd, 2009, preliminary score sheets were sent out to Ministries of Health or state
agencies of all 33 states, giving the opportunity to supply more recent data and/or higher
quality data than what is available in the public domain.
This procedure had been prepared for during the spring and summer of 2009 by extensive
mail, e-mail, telephone contacts and personal visits to ministries/agencies. Finally,
feedback responses, in the form of returned “single country score sheets” and/or thorough
discussions at personal visits to MoH:s/national agencies, have been had from officialnational sources as illustrated in the following table:
Country Responded in 2006 Responded in 2007 Responded in 2008 Responded in 2009
Albania not applicable not applicable not applicable √ Austria √ √ √ Belgium √ √
Bulgaria not applicable √ √
Croatia not applicable not applicable √ √
Cyprus √ √
Czech Republic √ √
Denmark √ √ √ Estonia √ √ √ √ Finland √ √ √ √ France √
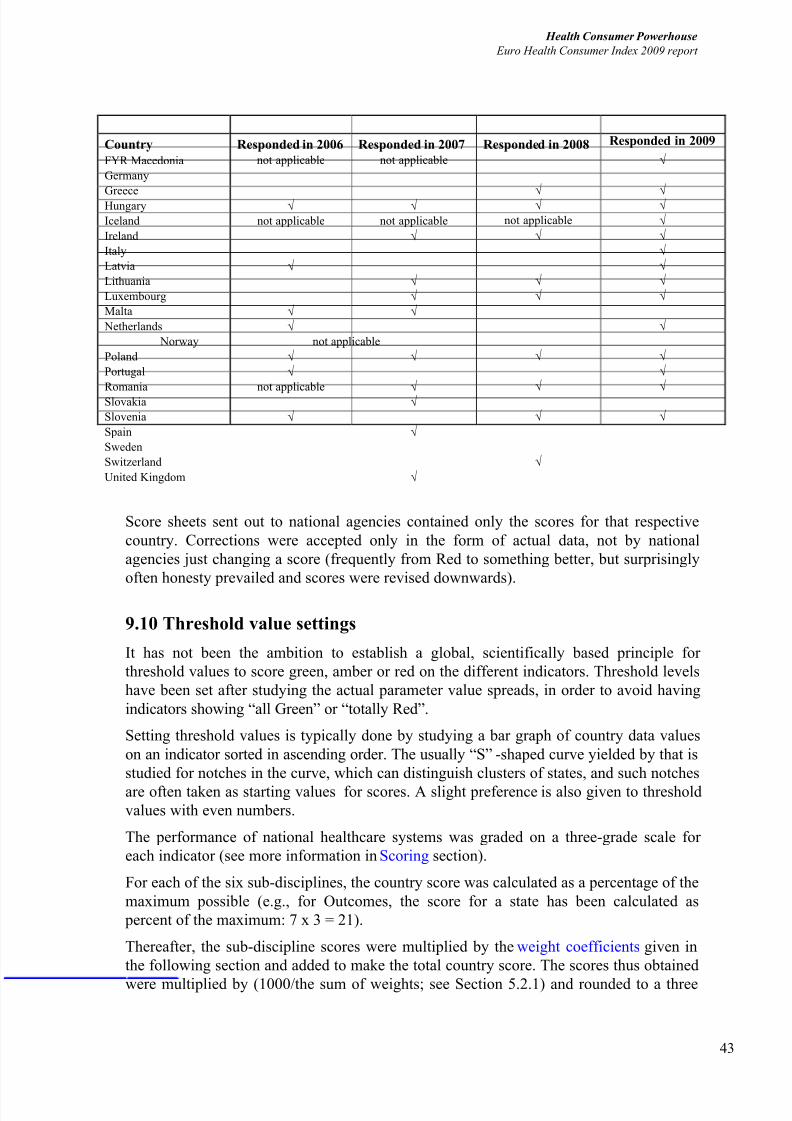
8/8/2019 Health Consumer powerhouse Report EHCI 2009 091001 final with cover
http://slidepdf.com/reader/full/health-consumer-powerhouse-report-ehci-2009-091001-final-with-cover 43/67
43
Health Consumer Powerhouse
Euro Health Consumer Index 2009 report
Country Responded in 2006 Responded in 2007 Responded in 2008 Responded in 2009
FYR Macedonia not applicable not applicable √
Germany
Greece √ √ Hungary √ √ √ √ Iceland not applicable not applicable not applicable √ Ireland √ √ √ Italy √ Latvia √ √ Lithuania √ √ √
Luxembourg √ √ √
Malta √ √
Netherlands √ √
Norway not applicable
Poland √ √ √ √ Portugal √ √
Romania not applicable √ √ √ Slovakia √
Slovenia √ √ √
Spain √
Sweden
Switzerland √
United Kingdom √
Score sheets sent out to national agencies contained only the scores for that respective
country. Corrections were accepted only in the form of actual data, not by national
agencies just changing a score (frequently from Red to something better, but surprisingly
often honesty prevailed and scores were revised downwards).
9.10 Threshold value settings
It has not been the ambition to establish a global, scientifically based principle for
threshold values to score green, amber or red on the different indicators. Threshold levels
have been set after studying the actual parameter value spreads, in order to avoid having
indicators showing “all Green” or “totally Red”.
Setting threshold values is typically done by studying a bar graph of country data values
on an indicator sorted in ascending order. The usually “S”-shaped curve yielded by that is
studied for notches in the curve, which can distinguish clusters of states, and such notches
are often taken as starting values for scores. A slight preference is also given to thresholdvalues with even numbers.
The performance of national healthcare systems was graded on a three-grade scale for
each indicator (see more information in Scoring section).
For each of the six sub-disciplines, the country score was calculated as a percentage of the
maximum possible (e.g., for Outcomes, the score for a state has been calculated as
percent of the maximum: 7 x 3 = 21).
Thereafter, the sub-discipline scores were multiplied by the weight coefficients given in
the following section and added to make the total country score. The scores thus obtained
were multiplied by (1000/the sum of weights; see Section 5.2.1) and rounded to a three
8/8/2019 Health Consumer powerhouse Report EHCI 2009 091001 final with cover
http://slidepdf.com/reader/full/health-consumer-powerhouse-report-ehci-2009-091001-final-with-cover 44/67
44
Health Consumer Powerhouse
Euro Health Consumer Index 2009 report
digit integer, giving a score system where a state with “all Green” would receive 1000
points (and “all Red” 333 points).
One (minor) reason for this somewhat complex scoring methodology has been driven by
the “competition” element of the Heart Index, reducing the likelihood of two or more
states ending up in a tied position. The Eurovision Song Contest, for example, changed
the score in the same direction after four countries tied for first place in 1969.
Finally, the HCP is a value-driven organisation. We believe in Patient/Consumer
Empowerment, an approach that places highest importance on quantitative and qualitative
healthcare services. As is illustrated by the “Quality information about care providers”
indicator, this sometimes leads to the inclusion of indicators where only few countries,
theoretically none, score Green (in this case, only Denmark, Germany and the
Netherlands do).
9.11 “CUTS” data sources
Whenever possible, research on data for individual indicators has endeavoured to find a
“CUTS” (Comprehensive Uniform Trustworthy Source). If data on the underlying
parameter behind an indicator is available for all or most of the 29 states from one single
and reasonably reliable source, then there has been a definitive preference to base the
scores on the CUTS. As CUTS would be considered EUCID data, WHO databases,
OECD Health data, Special Eurobarometers, and scientific papers using well-defined and
established methodology.
Apart from the sheer effectiveness of the approach, the basic reason for the concentration
on CUTS, when available, is that data collection primarily based on information obtainedfrom 33 national sources, even if those sources are official Ministry of Health or National
Health/Statistics agencies, generally yields a high noise level. It is notoriously difficult to
obtain precise answers from many sources even when these sources are all answering the
same question. For example, in the Euro Consumer Diabetes Index 2008, it was difficult
to find answers to indicators like “Do you have nurse practitioners in your country?” or
“Is diabetes foot (podiatrist) a recognized sub-speciality in your country?”. The reason is
very simple: the definition of what is a diabetes nurse or a diabetes podiatrist and the
amount of education and training required to qualify are different in every country. It has
to be emphasized that also when a CUTS for an indicator has been identified, the data are
still reviewed through cross-check procedures, as there have frequently been occasionswhere national sources or scientific papers have been able to supply more recent and/or
higher precision data.
9.11.1 The “Rolls-Royce gearbox” factor
Another reason for preferably using CUTS whenever possible is the same reason why
Rolls-Royce (in their pre-BMW days) did not build their own gearboxes. The reason was
stated as “We simply cannot build a better gearbox than those we can get from outside
suppliers, and therefore we do not make them ourselves”. For the small size organisation
HCP, this same circumstance would be true for an indicator where a Eurobarometer
question, the WHO HfA database, or another CUTS happens to cover an indicator.

8/8/2019 Health Consumer powerhouse Report EHCI 2009 091001 final with cover
http://slidepdf.com/reader/full/health-consumer-powerhouse-report-ehci-2009-091001-final-with-cover 45/67
45
Health Consumer Powerhouse
Euro Health Consumer Index 2009 report
9.12 Content of indicators in the EHCI 2009
The research team of the Euro Health Consumer Index 2009 has been collecting data on
38 healthcare performance indicators, structured to a framework of six sub-disciplines.Each of these sub-disciplines reflects a certain logical entity, e.g. Medical outcomes or e-
Health implementation.
The indicators come numbered in the report, to provide more reader friendliness and
clarity.
Where possible, CUTS - Comprehensive Uniform Trustworthy Sources - were used; see
section “CUTS Data Sources” for more information on this approach, typical for HCP
research work.
9.12.1 Patients' Rights and Information
This sub-discipline is testing the ability of a healthcare system to provide the patient with
a status strong enough to diminish the information skew walling the professional and
patient.
Why does HCP love this sub-discipline? Because it is a GDP non-dependent indicator
family. Even the poorest countries can allow themselves to grant the patient with a firm
position within the healthcare system; and this year's Euro Health Consumer Index is
proving this observation again.
There are nine indicators in this sub-discipline:
1.1 Patients' Rights based healthcare law
Is national healthcare legislation explicitly expressed in terms of patients' rights? By law
or other legislative act? Are there professional ethical codes, patients' charters, etc.?
Sources of data: http://europatientrights.eu/about_us.html ; Patients' Rights Law (Annex 1
to EHCI report); National healthcare agencies, web-based research, journals search. Non-
CUTS data.
1.2 Patients' Organisations involved in decision making
Do patient organisations have right to participate in healthcare decision making?
Sometimes we find that patient's organisations are welcomed to get involved, sometimesthey do it by law, sometimes they do it only informally, but usually, sometimes only
formally without a real participation, sometimes not at all.
Sources of data: Patients' Perspectives of Healthcare Systems in Europe; survey
commissioned by HCP 2009. National healthcare agencies. Non-CUTS data.
1.3 No-fault malpractice insurance
Can patients get compensation without the assistance of the judicial system? Does the
compensation prerequisite proving who among the medical staff made a mistake? Each
year, the HCP research staff is meeting high healthcare officials who have never heard of
no-fault malpractice system, such as that put in place essentially in the Nordic countries.
8/8/2019 Health Consumer powerhouse Report EHCI 2009 091001 final with cover
http://slidepdf.com/reader/full/health-consumer-powerhouse-report-ehci-2009-091001-final-with-cover 46/67
46
Health Consumer Powerhouse
Euro Health Consumer Index 2009 report
Source of data: Swedish National Patient Insurance Co. (All Nordic countries have
no1fault insurance); www.hse.ie; www.hiqa.ie. National healthcare agencies, web-based
research, journals search. Non-CUTS data.
1.4 Right to second opinion
As in other areas of human life, there are not many questions and conditions with only
one right answer, in medicine also. Therefore, do the patients have the right to get the
second opinion, without having to pay extra? Is it a formal right, but unusual practice, or
well-established institute?
Sources of data: Patients' Perspectives of Healthcare Systems in Europe; survey
commissioned by HCP 2009. Health and Social Campaigners’ News International: Users’
perspectives on healthcare systems globally, Patient View 2005. National healthcare
agencies. Non-CUTS data.
1.5 Access to own medical record
Can patients readily get access to, and read, their own medical records? Hard to believe,
at some places in Europe, the patient's personal data and integrity is so protected, that he
cannot access his own medical record. This is remarkable, as the Data protection directive
is very clear on the fact that the patient should have this right by law. Elsewhere, he
cannot access it neither, but at least he is not being told it is for his own good.
Sources of data: Patients' Perspectives of Healthcare Systems in Europe; survey
commissioned by HCP 2009. Health and Social Campaigners’ News International: Users’
perspectives on healthcare systems globally, Patient View 2005. National healthcare
agencies; web and journal research. Non-CUTS data.
1.6 Register of legit doctors
Can the public readily access the information: "Is doctor X a bona fide specialist?" Has to
be a web/telephone based service and Yellow pages do not score Green – with an
exception for Luxembourg, where the chapter on physicians is yearly reviewed and
approved by the Ministry of health. Very easy and cheap to implement, but still very
difficult to find sources of information.
Sources of data: Patients' Perspectives of Healthcare Waiting times in Europe; survey
commissioned by HCP 2009. National physician registries. National healthcare agencies;web and journal research. Non-CUTS data.
1.7 Web or 24-7 telephone healthcare info with interactivity
Simple description of this indicator used in previous years' editions remains the same in
2008: Information which can help a patient take decisions of the nature: “After consulting
the service, I will take a paracetamol and wait and see” or “I will hurry to the A&E
department of the nearest hospital” The most comprehensive service of this kind is the
British NHS Direct.
Sources of data: Patients' Perspectives of Healthcare Systems in Europe; survey
commissioned by HCP 2009. National healthcare agencies, web search. Non-CUTS data.
8/8/2019 Health Consumer powerhouse Report EHCI 2009 091001 final with cover
http://slidepdf.com/reader/full/health-consumer-powerhouse-report-ehci-2009-091001-final-with-cover 47/67
47
Health Consumer Powerhouse
Euro Health Consumer Index 2009 report
1.8 Crossborder care seeking financed from home
After the spring 2009 EU directive on cross-border care, the indicator on cross-border
mobility was reintroduced in the form it had in 2007. The only three countries scoring
Green are Denmark, Luxembourg and the Netherlands. Denmark had its 2007 law on free
mobility in the EU temporarily suspended between November 2008 and June 30, 2009,
but that has now come back into effect. The Luxembourg Green might strike as
“cheating”, but in the insourcing-prone public sectors, the LUX good common sense to
refrain from building their own comprehensive healthcare services (which LUX certainly
could have afforded), and let its citizens seek care in neighbouring countries, does
deserve recognition.
Sources of data: Survey commissioned for Heart Index by HCP from Patient View 2009.
National healthcare agencies.
1.9 Provider catalogue with quality ranking
In 2005, Dr. Foster of the UK was the single shining star on the firmament of provider
(hospital) listing, where patients could actually see which hospitals had good results in
term of actual success rates or survival percentages.
In 2009, there are already a few more examples, where the Health Consumer Powerhouse
believes that the most notable is the Danish www.sundhedskvalitet.dk , where hospitals
are graded from to as if they were hotels, with service level indicators as
well as actual results, including case fatality rates on certain diagnoses. Perhaps the most
impressive part of this system is that it allows members of the public to click down to a
link giving the direct-dial telephone number of clinic managers.
In 2009 the Danish www.sundhedskvalitet.dk r emains the standard European qualification
for a green score, the “750 best clinics” published by LaPointe in France would warrant a
yellow, as a nice attempt, as in eight other countries. The rest of the countries are
desperately red.
Sources of data: http://www.drfoster.co.uk/home.aspx ; http://www.sundhedskvalitet.dk/ ;
http://www.sykehusvalg.no/sidemaler/VisStatiskInformasjon____2109.aspx ;
http://www.hiqa.ie/ ; http://212.80.128.9/gestion/ges161000com.html , www.bqs-
online.de . Non-CUTS data.
9.12.2 E-health
This is a new sub-discipline introduced to EHCI 2008. Healthcare which is supported by
electronic processes and communication is healthcare aiming to provide evidence based
and safe practice. Surprisingly, contrary to general beliefs, e-health implementation is not
truly a question of national wealth, which is seen in these sub-discipline results. E-health
reflects the new face of healthcare, with a high degree of information processing to ensure
access, speed and safety.
8/8/2019 Health Consumer powerhouse Report EHCI 2009 091001 final with cover
http://slidepdf.com/reader/full/health-consumer-powerhouse-report-ehci-2009-091001-final-with-cover 48/67
48
Health Consumer Powerhouse
Euro Health Consumer Index 2009 report
2.1 EPR penetration
Percentage of GP practices using computer for storage of individual patient diagnosis
data.
Sources of data:
http://ec.europa.eu/public_opinion/flash/fl126_fr.pdf ;
http://www.europartnersearch.net/ist/communities/indexmapconso.php?Se=11 ;
www.icgp.ie ; Commonwealth Fund International Health Policy Survey of Primary Care
Physicians"Benchmarking ICT use among GP:s in Europe"; European Commission, April
2008; study made by Empirica, Bonn, Germany (p.60), Gartner Group. CUTS data.
2.2 e-transfer of medical data between health professionals
Indicator similar to the previous one: percentage of GP practices using electronic
networks for transfer of medical data betweencare providers /professionals.Sources of data: “Benchmarking ICT use among GP:s in Europe"; European
Commission, April 2008; study made by Empirica, Bonn, Germany (p.45). CUTS data.
2.3 Lab test results communicated direct to patients via e-health solutions?
What percentage of GP practices is using electronic networks for transferring medical
data such as lab test results directly to patients? Could be e-mail, or a personal webpage
which the patient could log on to. As seen in the EHCI, these solutions have been
implemented very sparingly across Europe. In waiting list-free countries, there is
frequently the argument that electronic communication between doctor and patient is
“awful information quality”, which is probably a major reason why Germany scores low
on some e-Health Indicators.
Sources of data: Survey commissioned by HCP from Patient View 2009. National
healthcare agencies.
2.4 Do patients have access to on-line booking of appointments?
The supply/demand ratio for specialist appointments or major surgery is very similar to
that of hotel rooms or package holidays. There is no real reason why patients should not
be able to book available “slots” at their convenience. This exists very sparingly in
Europe; one of theonly two Green scores goes to Portugal, where “4 million people in theLisbon region” have access to this service. The other Green is Croatia – note the “Indian
mobile telephone penetration” referred to above!
Sources of data: Survey commissioned by HCP from Patient View 2009. National
healthcare agencies.
2.5 On-line access to check how much doctors/clinics have charged insurers for your
care?
This service was introduced in the Czech Republic in 2007, and has had a few followers
by 2009. In Austria and a couple of other countries, patient get this information on a
paper “bill” when discharged from hospital; however, this does not count towards a

8/8/2019 Health Consumer powerhouse Report EHCI 2009 091001 final with cover
http://slidepdf.com/reader/full/health-consumer-powerhouse-report-ehci-2009-091001-final-with-cover 49/67
49
Health Consumer Powerhouse
Euro Health Consumer Index 2009 report
Green score on this e-Health indicator. Many tax-financed systems do not have any
insurers being charged – the cowardly way out of this dilemma has been the introduction
of the “n.ap.” score (“not applicable” = Yellow) not to unfairly stigmatize these countries.
Hungary is an interesting country scoring Green while having a “monolithic” financingsystem: the reason is that the Hungarian government has wanted to enlist 10 million
Hungarians as “auditors”, to help the government check up on hospital fraud!
Sources of data: Survey commissioned by HCP from Patient View 2009. National
healthcare agencies.
2.6 e-prescriptions
What percentage of GP practices can send prescriptions electronically to pharmacies?
Sweden, with its centralized pharmacy system, is a role model: more than 70% of all prescriptions are sent to a central e-mailbox, and the patient can then walk into any
pharmacy in the country, where they simply pull down the prescription from the mailbox.
Sources of data: "Benchmarking ICT use among GP:s in Europe"; European Commission,
April 2008; study made by Empirica, Bonn, Germany. (p.45), Gartner Group, Cambio,
National healthcare agencies.
9.12.3 Waiting time for treatment
3.1 Family doctor same day accessTesting a very reasonable demand: Can patients count on seeing a primary care doctor
today, simply because the patient believes he/she needs to? This indicator basically shows
that there is no explication for waiting times in primary care; the findings seem to be
randomly placed in the matrix and there is no correlation with GDP nor the range of
services provided, nor the density of primary care network. In some rather unexpected
countries, the GP has even the obligation to answer the phone to every patient registered
in his practice 24 hours per day, 7. days a week.
Sources of data: Patients' Perspectives of Healthcare: Waiting times in Europe; survey
commissioned by HCP 2009. Health and Social Campaigners’ News International: Users’
perspectives on healthcare systems globally, Patient View 2005. National healthcareagencies; journal search. Non-CUTS data.
3.2 Direct access to specialist
Can patients see a specialist without first having to gain a referral from a primary-care
doctor?
This indicator happens to be the most disputed of all in the history of HCP indexes.
Although, or maybe consequently, it has been kept since 2005, and seems to confirm the

8/8/2019 Health Consumer powerhouse Report EHCI 2009 091001 final with cover
http://slidepdf.com/reader/full/health-consumer-powerhouse-report-ehci-2009-091001-final-with-cover 50/67
50
Health Consumer Powerhouse
Euro Health Consumer Index 2009 report
notion that “no significant effects of gatekeeping were found on the level of ambulatory
care costs, or on the level or growth of total health care expenditure" 3
Sources of data: Patients' Perspectives of Healthcare: Waiting times in Europe; survey
commissioned by HCP 2009. National healthcare agencies with healthcare officials;
http://www.im.dk/publikationer/healthcare_in_dk/healthcare.pdf ; http://www.ic.nhs.uk/ ;
http://www.oecd.org, www.vantetider.se, . Non-CUTS data.
3.3 Major non-acute operations<90 days
What is the interval between diagnosis and treatment for a basket of coronary
bypass/PTCA and hip/knee joint? It is difficult to avoid the observation that for countries,
which do have official waiting time statistics (Ireland, Sweden, UK etc), this is in itself a
not very flattering circumstance. Countries such as Germany, where waiting times tend to
vary in the 2 – 3 weeks range, have never felt the urge to produce waiting time data, for
principally the same type of reason that Madrid has less snow-ploughs than Helsinki.
Sources of data: Patients' Perspectives of Healthcare Waiting times in Europe; survey
commissioned by HCP 2009. National healthcare agencies.
Non-CUTS data.
3.4 Cancer therapies < 21 days
Time to get radiation/chemotherapy after decision.
Sources of data: Patients' Perspectives of Healthcare Waiting times in Europe; survey
commissioned by HCP 2009. National healthcare agencies. Non-CUTS data.
3.5 CT scan < 7days
As a representative for waiting times for advanced diagnostics was chosen Time to get a
CT scan after decision. There proved to be some difficulty making respondents (in
national healthcare agencies) not answer in terms of “acute” or “non-acute” examinations.
Again, is has to de emphasized that waiting times for a CT scan is both poor service
quality and also increases costs, not saving money, as teh procedure of keeping track of
patients for weeks/months is by no means costless, and the examination itself is if
anything cheaper if the patient (and the care provider) has the underlying cause fresh in
their minds.
Sources of data: Patients' Perspectives of Healthcare Waiting times in Europe; survey
commissioned by HCP 2009. National healthcare agencies. Non-CUTS data.
3G Van Merode, A Paulus, P Groenewegen: Does general practitioner gatekeeping curb health care
expenditure? J Health Serv Res Policy. 2000 Jan ;5 (1):22-6
See also Kroneman et al: Direct access in primary care and patient satisfaction: A European study. HealthPolicy 76 (2006) 72 – 79

8/8/2019 Health Consumer powerhouse Report EHCI 2009 091001 final with cover
http://slidepdf.com/reader/full/health-consumer-powerhouse-report-ehci-2009-091001-final-with-cover 51/67
51
Health Consumer Powerhouse
Euro Health Consumer Index 2009 report
9.12.4 Outcomes
The Outcomes sub-discipline assesses the performance of different national healthcare
systems when it comes to results of treatment. The healthcare professionals sometimes
tend to think about the healthcare systems predominantly in the terms of outcomes –
saying that what really counts, is the result. We do agree to some extent, and this is
reflected in the weight attributed to the outcomes sub-discipline indicators.
4.1 Heart infarct case fatality4
Data availability on this vital indicator is shockingly fragmented and incoherent over
Europe. The OECD Health at a Glance Report (December 2007) lists this parameter. To
illustrate the problem, the best number in Europe, 6.4% for Denmark, should be
compared with official communication from the Danish Sundhedsstyret that the Danish
number (Hjaerteregistret, 2004) is 15.5%. One explanation could be that the OECD asked
for the “in-hospital 30-day case fatality”, which is a different (and lower) number. Thescores on this indicator are therefore based on a compilation of data from various sources
and points in time (back to MONICA data), national registries and finally checked against
the SDR:s for ischaemic heart disease – in this checkup, scores have been given a
negative bias for states with high SDR:s (Standardized Death Rates), and vice versa. The
logic behind that would be that if a country claims excellent case fatality rates, and still
has high SDR:s it could be feared that this excellent care is not accessible to everybody.
Definitively non-CUTS data.
Sources of data: Compilation from OECD Health at a Glance; December 2007,
MONICA, national heart registries. Non-CUTS data.
4.2 Infant deaths
Infant mortality rate is the number of infants dying before reaching one year of age, per
1,000 live births in a given year. In the well developed countries the increased infant
mortality occurs primarily among very low birth weight infants, many of whom are born
prematurely; in Europe, very low birth weight infants probably account for more than half
of all infant deaths. In Europe, with infant deaths normally counting below 6/1000, good
check-ups during pregnancy and access to state-of-the-art delirvery care are probably the
key factors behind attaining really low numbers. Iceland has the lowest infant death rate
on Earth, less than 2/1000.
Sources of data: WHO Europe Health for All mortality database August 2009, latest
available statistics. CUTS data.
4.3. Ratio of cancer deaths to incidence 2006
The EHCI 2008 indicator on cancer outcomes was the more conventional 5-year survival
rates of cancer (all types except skin). As no more recent (EUROCARE-4, patients
diagnosed 1995 – 1999) data was available in 2009, the very comprehensive paper by J.
Ferlay et al , listing cancer incidences and cancer deaths in 2006 for all 33 countries was
4
This indicator and other cardiac care indicators are explained in detail in the Euro Consumer Heart Index2008, Health Consumer Powerhouse AB, Brussels 2008, www.healthpowerhouse.com .

8/8/2019 Health Consumer powerhouse Report EHCI 2009 091001 final with cover
http://slidepdf.com/reader/full/health-consumer-powerhouse-report-ehci-2009-091001-final-with-cover 52/67
52
Health Consumer Powerhouse
Euro Health Consumer Index 2009 report
chosen as 2009 indicator data. In this indicator, a ratio of less than 0.4 for
Deaths/Incidence, would in principle be equal to a survival rate > 60%. Not surprisingly,
there are more Green scores (11 vs. 4) based on the 2006 data than on the 5-year data on
patients diagnosed in the 2nd half of the 1990’s.
Sources of data: J. Ferlay et al., Annals of Oncology, 2007.
4.4 Preventable Years of Life Lost
All causes, Years lost per 100.000 population 0-69. Potential Years of Life Lost (PYLL),
used by the OECD, take into account the age at which deaths occurs by giving greater
weight to deaths at younger age and lower weight to deaths at older age.
Potential Years of Life Lost are calculated from the number of deaths multiplied by a
standard life expectancy at the age at which death occurs. PYLL is preferred as an
indicator over and above the popular “Healthcare Amenable Deaths”, as that indicator automatically gives low values to states with a low CVD death rate, such as the
Mediterranean states.
The PYLL (Potential Years of Life Lost) is produced by the OECD, and consequently
does not cover all the 33 countries in the EHCI. However, it was found that there is a
strong correlation between PYLL and SDR (all causes), ages 0 – 64, which can be
obtained for all countries from the WHO: a linear regression calculation did confirm that
the correlation (R-value) between the two was 97 %. Therefore, for non-OECD countries,
the PYLL values are calculated as the function PYLL = K*SDR + M.
Sources of data: OECD Health Data 2009; Non-OECD: WHO HfA, August 2009, SDR
all causes per 100000, ages 0-64. CUTS data.
4.5 MRSA infections
Percentage of hospital-acquired strains being resistant. The aim of this indicator is to
assess the prevalence and spread of major invasive bacteria with clinically and
epidemiologically relevant antimicrobial resistance. As in the previous year's indexes,
The European Antimicrobial Resistance Surveillance System (EARSS) data is used. The
data is collected by 800 public-health laboratories serving over 1300 hospitals in 31
European countries.
Sources of data: EARSS, August 2009.CUTS data.
4.6 Relative decline of suicide rate
Incline of e-log line for suicide SDR:s 1995 - latest available.
Since 2005, HCP has wanted to introduce an indicator on quality of psychiatric care. Due
to substantial methodological and definitions problems, we rejected the usual indicators
as psychiatric beds per population, mental disorders hospitalisation, drug sales and many
others. The decline of suicide in a ten year period, e.g. since 1995, somehow returned,
every year, to the expert panel's working sessions. But, adding to uncertain data
reliability, there was a practical problem to solve: taking into account the very significant
peak of suicide in Eastern European countries in 1991-1995, how to make the indicator
fair for all the European region? In 2008, following long and vivid discussions, the
8/8/2019 Health Consumer powerhouse Report EHCI 2009 091001 final with cover
http://slidepdf.com/reader/full/health-consumer-powerhouse-report-ehci-2009-091001-final-with-cover 53/67
53
Health Consumer Powerhouse
Euro Health Consumer Index 2009 report
indicator “inclination of e-log line for suicide SDR:s 1995 – l.a.” was introduced, being
fully aware of its interpretative limitations. The use of logarithmic values eliminates
effects from countries having very different absolute suicide rates, i.e. countries lowering
the suicide SDR from 4 to 3 get the same trend line as those lowering it from 40 to 30.
Sources of data: MINDFUL, WHO HfA Mortality database, January 2009. CUTS data.
4.7 % of diabetes patients with high HbA1c levels
Percentage of total diabetic population with HbA1c level above 7.
This indicator has been adapted from the Euro Consumer Diabetes Index5. It is an
important assessment tool of how well diabetes has been managed on individual patients
for the previous two or three months.
Sources of data: EUCID, Interviews with national diabetes experts and health care
officials, National Diabetes Registries. Non-CUTS data.
9.12.5 Range and reach of services provided
5.1 Equity of healthcare systems
The simple indicator “What % of total healthcare spend is public?” has been introduced
in 2009 as a measure on equity of healthcare systems. A few countries report 100% in the
WHO database. These countries all get a Red score on indicator 5.7 (below). Therefore,
the 100% did not survive the customary “ Do we believe this? test ” in the expert panel
discussions, and 100% therefore gives a Red score. Also, Switzerland was judged to be avictim of the same kind of definition problems as pre-reform (2006) Netherlands, where
on formal grounds a large part of the common health insurance was reported as private
spend, and given a Green score. Sources of data: WHO HfA database, Aug -09
5.2 Cataract operations per 100 000 age 65+
Surgical procedures by ICD-CM, Cataract surgery, Total procedures performed on
patients of all ages, but divided by 100 000’s of population over 65. Few cataracts are
performesd on patients under 65, and age-separated data is not available.
Cataract operations per 100 000 total population has been continuously used in previous
EHCI editions as a proxy of capability of the healthcare systems to provide non-lifesaving
care aimed to improve the quality of life of the patient. As of 2008, it has been age-
adjusted following a suggestion made by Irish officials (which is not surprising, as the
former construction of the indicator would have disadvantaged Europe’s youngest
populations of Macedonia, Ireland and Romania).
Sources of data: OECD Health Data 2009, WHO HfA database, Aug -09, WHO
Prevention of Blindness and Visual Impairment Programme, European Community
Health Indicators
5
For more information, see Euro Consumer Diabetes Index 2008, Health Consumer Powerhouse AB,Brussels 2008. ISBN 978-91-976874-7-8
8/8/2019 Health Consumer powerhouse Report EHCI 2009 091001 final with cover
http://slidepdf.com/reader/full/health-consumer-powerhouse-report-ehci-2009-091001-final-with-cover 54/67
54
Health Consumer Powerhouse
Euro Health Consumer Index 2009 report
5.3 Infant 4-disease vaccination
Percentage of children vaccinated (Diphteria, tetanus, pertussis and poliomyelitis,
arithmethic mean).
Sources of data: WHO HfA database, Aug -09, National vaccination registries
5.4 Kidney transplants per million population
Procedures per million population. There is a commonly encountered notion that this
number is greatly influenced by factors outside the control of healthcare systems, such as
the number of traffic victims in a country. It must be judged that the primary explanation
factors are inside healthcare, such as “the role and place of organ donation in
anaesthesiologists’ training”, “the number of Intensive Care Unit beds p.m.p.” etc.
Sources of data: OECD Health Data 2009, Council of Europe Newsletter on OrganDonation and Transplantation, Vol 13, Sept. 2008, Croatian registry for renal replacement
therapy, Rozental R: Donation and transplantation in Latvia 2006.
5.5 Is dental care included in the public healthcare offering?
In the past years, a the very simple indicator “What percentage of public healthcare spend
is made up by dental care?” was selected as a measure of affordability of dental care, on
the logic that if dental care accounts for close to 10 % of total public healthcare
expenditure, this must mean that dental care is essentially a part of a fair public healthcare
offering.
In 2008, an Eurobarometer survey was used. This indicator was redesigned as
“Percentage responding dental care to be "not at all affordable/not very affordable".
In 2009, the data on this indicator is chiefly based on information from National
healthcare agencies, with the actual question: “Is dental care subsidized on the same terms
as somatic care, for patients aged 20 – 64?”
Sources of data: European Observatory HiT Reports, National healthcare agencies. Non-
CUTS data.
5.6 Rate of mammography
Percentage of females aged 50-69 screened, latest data available. This indicator was
introduced as a proxy of practical ability to organize and follow a simple screening on
well-defined and easily reachable target population. Results are desperately variable
across Europe: the target is set to 70 % (the HCP logic would say: why not 100 %?) and
the actual values range from 10 % to 98 %.
Sources of data: OECD Health Data 2009; WHO World Health Survey 2006, WHO
World Health Statistics 2009.

8/8/2019 Health Consumer powerhouse Report EHCI 2009 091001 final with cover
http://slidepdf.com/reader/full/health-consumer-powerhouse-report-ehci-2009-091001-final-with-cover 55/67
55
Health Consumer Powerhouse
Euro Health Consumer Index 2009 report
5.7 Informal payments to doctors
Mean response to question: "Would patients be expected to make unofficial payments?"
with r ange of answers: plain “No!”, “Sometimes, depends on situation” and “Yes,
frequently”. The indicator was first introduced in 2008. As an informal payment was
considered any payment made by the patient in addition to official co-payment. That
survey on informal payments was the first cross-European survey done ever on this
problem, and was repeated in 2009, with highly compatible results compared with 2008.
Sources of data: Survey commissioned from Patient View by HCP 2009. National
healthcare agencies. Non-CUTS data.
9.12.6 Pharmaceuticals
6.1 Rx subsidy %What percentage of total prescription drug sales is paid by subsidy?
Sources of data: http://www.efpia.org/6_publ/infigure2004h.pdf 2005 update? WHO
Health for All database 2005;
http://www.laegemiddelstyrelsen.dk/statistik/overvaagning/udgifter/2007-1/2007-1.asp. .,
National healthcare agencies.
Non-CUTS data.
6.2 Layman-adapted pharmacopoeia
Is there a layman-adapted pharmacopoeia readily accessible by the public (www or widely avaliable)? The existence of these (a comprehensive data collection on all drugs
registered and offered for sale in a country, searchable both on chemical substance and
brand name, and containing at least the same information as do the packing leaflets,
written in a was to be understandable by non-porefessionals) has grown considerably
from 2005, when essentially only Denmark and Sweden had them.
Sources of data: Survey commissioned from Patient View by HCP 2009. National
healthcare agencies.
Non-CUTS data.
6.3 Novel cancer drugs deployment rate
This indicator measures the use, in DDD/100 000 inhabitants, of a basket of 21 latest-
generation cancer drugs. The use of each drug has been indexed, and the indicator data is
the average of those 21 indexes.
Sources of data: "A pan-European comparison regarding patient access to cancer drugs",
February 2009, Nils Wilking & Bengt Jönsson, Karolinska Institute, Stockholm. CUTS
data.
6.4. Access to new drugs (time to subsidy)
Time lag between registration of a drug, and the drug being included in the national
subsidy system.

8/8/2019 Health Consumer powerhouse Report EHCI 2009 091001 final with cover
http://slidepdf.com/reader/full/health-consumer-powerhouse-report-ehci-2009-091001-final-with-cover 56/67
56
Health Consumer Powerhouse
Euro Health Consumer Index 2009 report
Sources of data: Phase 6 Report Feb 2007. PATIENTS W.A.I.T. Indicator Commissioned
by EFPIA. IMS Global Consulting. "A pan-European comparison regarding patient access
to cancer drugs", Nils Wilking & Bengt Jönsson, Karolinska Institute, Stockholm.
9.13 How the Euro Health Consumer Index 2009 was built
The Index does not take into account whether a national healthcare system is publicly or
privately funded and/or operated. The purpose is health consumer empowerment, not the
promotion of political ideology. Aiming for dialogue and co-operation, the ambition of
HCP is to be looked upon as a partner in developing healthcare around Europe.
9.14 Production phases
The EHCI 2008 was constructed under the following project plan.
9.14.1 Phase 1
Start-up meeting with the Expert Reference Panel - Mapping of existing data
The composition of the Expert panel can be found in the section 9.15. The major area of activity
was to evaluate to what extent relevant information is available and accessible for the selectedcountries. The basic methods were:
Web search, journal search
Telephone and e-mail interviews with key individuals, and
Personal visits when required.
Web search:a) Relevant byelaws and policy documents b) Actual outcome data in relation to policies
Information providers:
a) National and regional Health Authorities
b) Institutions (EHMA,, Picker Institute, Legal-ethical papers of Catholic University in Leuwen,others)
c) Private enterprise (IMS Health, pharmaceutical industry, others)
Interviews (to evaluate findings from earlier sources, particularly to verify the real outcomes of
policy decisions):a) Phone and e-mail b) Personal visits to key information providers

8/8/2019 Health Consumer powerhouse Report EHCI 2009 091001 final with cover
http://slidepdf.com/reader/full/health-consumer-powerhouse-report-ehci-2009-091001-final-with-cover 57/67
57
Health Consumer Powerhouse
Euro Health Consumer Index 2009 report
9.14.2 Phase 2
Data collection to assemble presently available information to be included in the
EHCI 2009.Identification of vital areas where additional information needed to be assembled
was performed.
Collection of raw data for these areas
A round of personal visits by the researchers to Health Ministries and/or State
Agencies for supervision and/or Quality Assurance of Healthcare Services.
Regular contact with the Expert Reference Panel mainly to discuss the indicators,
the criteria to define them, and the data acquisition problems. Finally, we had a
second meeting on September 10th, 2009, at which was discussed in detail each of
the indicators, including those that could not be included in the Index due to lack of data. Also, the discrepancies between data from different sources were
analyzed. Sub-discipline relative weights were discussed and set.
9.14.3 Phase 3
9.14.3.1 Consulting European patient advocates and citizens through HCP survey
performed by external research facility (Patient View, U.K.).
The EHCI survey contained of the questions found in Appendix 1 of this report and was
committed in partnership with The Patient View (see also section Additional datagathering - survey for more information). The survey was available on the Internet from
June 7th in English, German, Spanish and Scandinavian (Swedish). The closing date was
September 1st, 2009; 602 responses were submitted.
9.14.3.2 “Score update sheet” send -out.
On July 2, 2009, all 33 states received their respective preliminary score sheets (with no
reference to other states’ scores) as an e-mail send-out asking for updates/corrections by
August 25. The send-out was made to contacts at ministries/state agencies as advised by
states during the contact efforts prior to July 2009. One reminder was also sent out.
Corrective feedback from states was accepted up until September 17, by which timereplies had been received from countries denoted in section Additional data gathering –
feedback from National Ministries/Agencies for more information on national feedback.
9.14.4 Phase 4
Project presentation and reports
A report describing the principles of how the EHCI 2008 was constructed.
Presentation of EHCI 2008 at a press conference and seminar in Brussels.
On-line launch on www.healthpowerhouse.com .
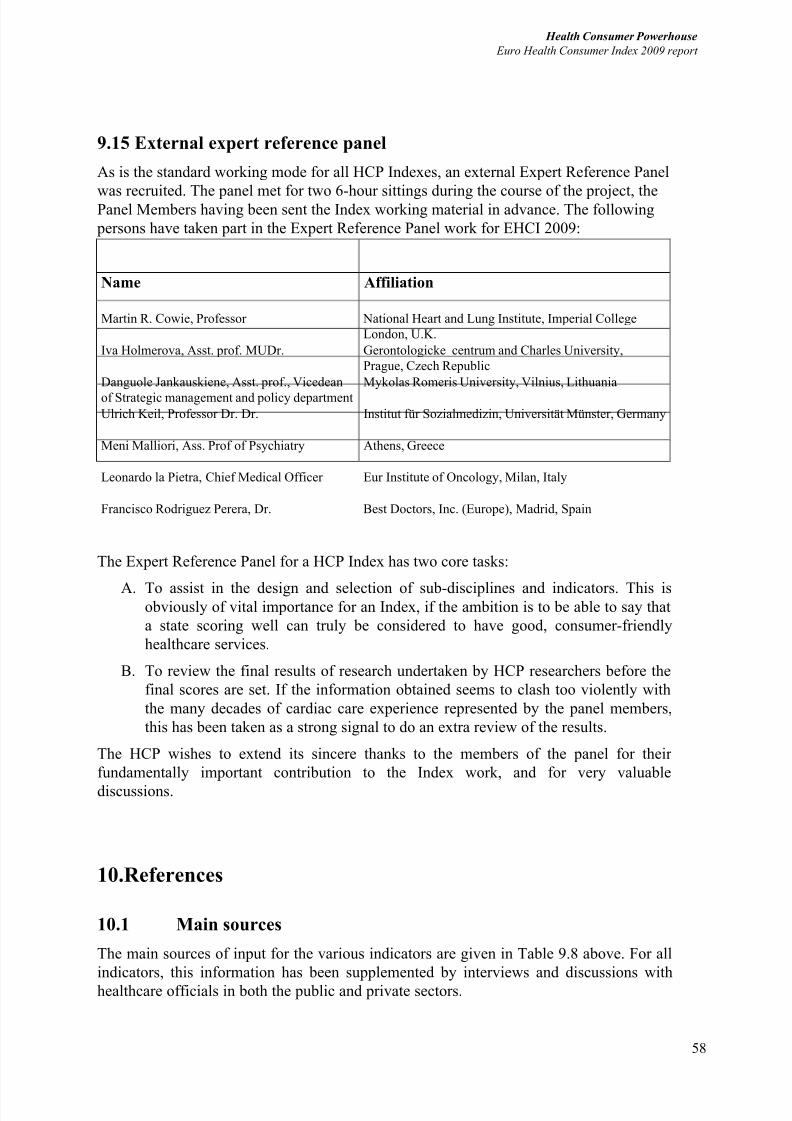
8/8/2019 Health Consumer powerhouse Report EHCI 2009 091001 final with cover
http://slidepdf.com/reader/full/health-consumer-powerhouse-report-ehci-2009-091001-final-with-cover 58/67
58
Health Consumer Powerhouse
Euro Health Consumer Index 2009 report
9.15 External expert reference panel
As is the standard working mode for all HCP Indexes, an external Expert Reference Panel
was recruited. The panel met for two 6-hour sittings during the course of the project, thePanel Members having been sent the Index working material in advance. The following
persons have taken part in the Expert Reference Panel work for EHCI 2009:
Name Affiliation
Martin R. Cowie, Professor National Heart and Lung Institute, Imperial College
London, U.K.
Iva Holmerova, Asst. prof. MUDr. Gerontologicke centrum and Charles University,
Prague, Czech Republic
Danguole Jankauskiene, Asst. prof., Vicedean
of Strategic management and policy department
Mykolas Romeris University, Vilnius, Lithuania
Ulrich Keil, Professor Dr. Dr. Institut für Sozialmedizin, Universität Münster, Germany
Meni Malliori, Ass. Prof of Psychiatry Athens, Greece
Leonardo la Pietra, Chief Medical Officer Eur Institute of Oncology, Milan, Italy
Francisco Rodriguez Perera, Dr. Best Doctors, Inc. (Europe), Madrid, Spain
The Expert Reference Panel for a HCP Index has two core tasks:
A. To assist in the design and selection of sub-disciplines and indicators. This isobviously of vital importance for an Index, if the ambition is to be able to say that
a state scoring well can truly be considered to have good, consumer-friendly
healthcare services.
B. To review the final results of research undertaken by HCP researchers before the
final scores are set. If the information obtained seems to clash too violently with
the many decades of cardiac care experience represented by the panel members,
this has been taken as a strong signal to do an extra review of the results.
The HCP wishes to extend its sincere thanks to the members of the panel for their
fundamentally important contribution to the Index work, and for very valuable
discussions.
10.References
10.1 Main sources
The main sources of input for the various indicators are given in Table 9.8 above. For all
indicators, this information has been supplemented by interviews and discussions with
healthcare officials in both the public and private sectors.

8/8/2019 Health Consumer powerhouse Report EHCI 2009 091001 final with cover
http://slidepdf.com/reader/full/health-consumer-powerhouse-report-ehci-2009-091001-final-with-cover 59/67

8/8/2019 Health Consumer powerhouse Report EHCI 2009 091001 final with cover
http://slidepdf.com/reader/full/health-consumer-powerhouse-report-ehci-2009-091001-final-with-cover 60/67
60
Health Consumer Powerhouse
Euro Health Consumer Index 2009 report
http://www.medscape.com/businessmedicine
http://www.oecdbookshop.org/oecd/display.asp?TAG=XK4VX8XX598X398888IX8V&
CID=&LANG=EN&SF1=DI&ST1=5LH0L0PQZ5WK#OtherLanguages (OECD Health
Data 2005)
http://www.oecd.org/department/0,2688,en_2649_33929_1_1_1_1_1,00.html (OECD
Health Policy & Data Department)
http://www.medscape.com/medline/abstract/15176130 (Patient Ombudsmen in Europe)
http://aitel.hist.no/~walterk/wkeim/patients.htm (Patients’ Rights Laws in Europe)
http://www.patient-view.com/hscnetwork.htm
http://www.pickereurope.org/
http://www.vlada.si/index.php?gr1=min&gr2=minMzd&gr3=&gr4=&id=&lng=eng
(Slovenia Health Ministry)
http://www.sundhedskvalitet.dk
http://www.100tophospitals.com/
http://www.worldcongress.com/presentations/?confCOde=NW615
http://www.who.int/healthinfo/statistics/mortestimatesofdeathbycause/en/index.html
http://www.who.int/topics/en/
http://www.who.int/healthinfo/statistics/mortdata/en/
http://www.euro.who.int/hfadb (WHO “Health for All” database)
http://www.who.dk/healthinfo/FocalPoints (addresses to Health Statistics contacts in
Europe)
http://www.who.int/genomics/public/patientrights/en/
http://www.waml.ws/home.asp (World Association of Medical Law)
http://www.wrongdiagnosis.com/risk/geography.htm
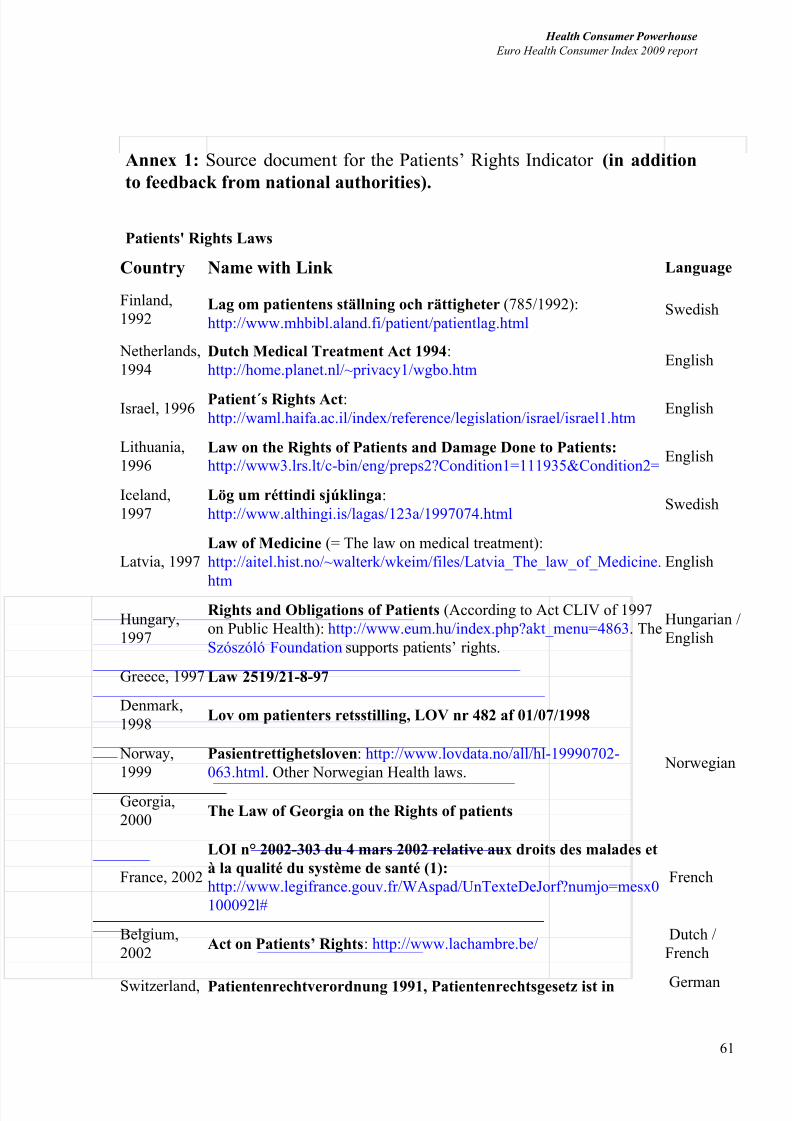
8/8/2019 Health Consumer powerhouse Report EHCI 2009 091001 final with cover
http://slidepdf.com/reader/full/health-consumer-powerhouse-report-ehci-2009-091001-final-with-cover 61/67
61
Health Consumer Powerhouse
Euro Health Consumer Index 2009 report
Annex 1: Source document for the Patients’ Rights Indicator (in addition
to feedback from national authorities).
Patients' Rights Laws
Country Name with Link Language
Finland,
1992Lag om patientens ställning och rättigheter (785/1992):
http://www.mhbibl.aland.fi/patient/patientlag.html Swedish
Netherlands,
1994Dutch Medical Treatment Act 1994:
http://home.planet.nl/~privacy1/wgbo.htm English
Israel, 1996Patient´s Rights Act:
http://waml.haifa.ac.il/index/reference/legislation/israel/israel1.htm English
Lithuania,
1996Law on the Rights of Patients and Damage Done to Patients: http://www3.lrs.lt/c-bin/eng/preps2?Condition1=111935&Condition2=
English
Iceland,
1997
Lög um réttindi sjúklinga:
http://www.althingi.is/lagas/123a/1997074.html Swedish
Latvia, 1997Law of Medicine (= The law on medical treatment):
http://aitel.hist.no/~walterk/wkeim/files/Latvia_The_law_of_Medicine.
htm
English
Hungary,
1997
Rights and Obligations of Patients (According to Act CLIV of 1997
on Public Health): http://www.eum.hu/index.php?akt_menu=4863 . The
Szószóló Foundation supports patients’ rights.
Hungarian /
English
Greece, 1997 Law 2519/21-8-97
Denmark,
1998Lov om patienters retsstilling, LOV nr 482 af 01/07/1998
Norway,
1999Pasientrettighetsloven: http://www.lovdata.no/all/hl-19990702-
063.html. Other Norwegian Health laws. Norwegian
Georgia,
2000The Law of Georgia on the Rights of patients
France, 2002
LOI n° 2002-303 du 4 mars 2002 relative aux droits des malades et
à la qualité du système de santé (1): http://www.legifrance.gouv.fr/WAspad/UnTexteDeJorf?numjo=mesx0
100092l#
French
Belgium,
2002Act on Patients’ Rights: http://www.lachambre.be/
Dutch /
French
Switzerland, Patientenrechtverordnung 1991, Patientenrechtsgesetz ist in German
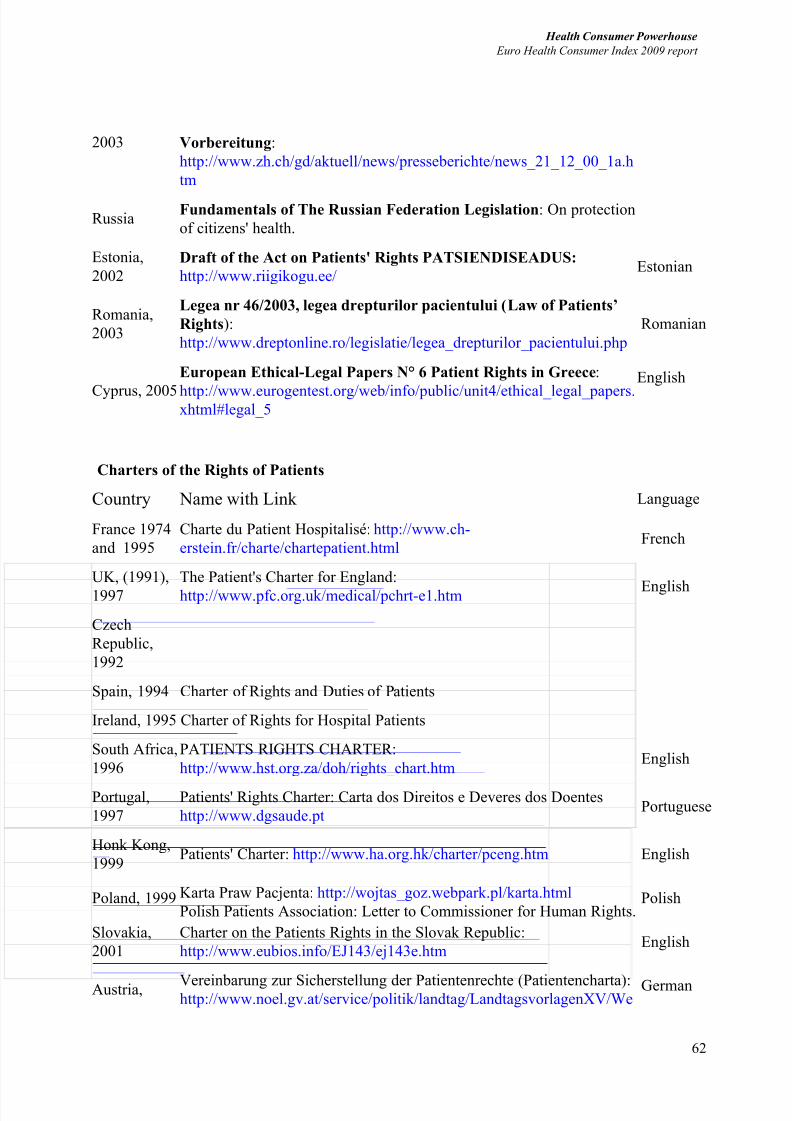
8/8/2019 Health Consumer powerhouse Report EHCI 2009 091001 final with cover
http://slidepdf.com/reader/full/health-consumer-powerhouse-report-ehci-2009-091001-final-with-cover 62/67
62
Health Consumer Powerhouse
Euro Health Consumer Index 2009 report
2003 Vorbereitung:
http://www.zh.ch/gd/aktuell/news/presseberichte/news_21_12_00_1a.h
tm
RussiaFundamentals of The Russian Federation Legislation: On protection
of citizens' health.
Estonia,
2002Draft of the Act on Patients' Rights PATSIENDISEADUS: http://www.riigikogu.ee/
Estonian
Romania,
2003
Legea nr 46/2003, legea drepturilor pacientului (Law of Patients’Rights):
http://www.dreptonline.ro/legislatie/legea_drepturilor_pacientului.php
Romanian
Cyprus, 2005
European Ethical-Legal Papers N° 6 Patient Rights in Greece:
http://www.eurogentest.org/web/info/public/unit4/ethical_legal_papers.xhtml#legal_5
English
Charters of the Rights of Patients
Country Name with Link Language
France 1974
and 1995
Charte du Patient Hospitalisé: http://www.ch-
erstein.fr/charte/chartepatient.html French
UK, (1991),
1997
The Patient's Charter for England:
http://www.pfc.org.uk/medical/pchrt-e1.htm English
Czech
Republic,
1992
Spain, 1994 Charter of Rights and Duties of Patients
Ireland, 1995 Charter of Rights for Hospital Patients
South Africa,
1996
PATIENTS RIGHTS CHARTER:
http://www.hst.org.za/doh/rights_chart.htm English
Portugal,
1997
Patients' Rights Charter: Carta dos Direitos e Deveres dos Doentes
http://www.dgsaude.pt Portuguese
Honk Kong,
1999Patients' Charter: http://www.ha.org.hk/charter/pceng.htm English
Poland, 1999 Karta Praw Pacjenta: http://wojtas_goz.webpark.pl/karta.html
Polish Patients Association: Letter to Commissioner for Human Rights.Polish
Slovakia,
2001
Charter on the Patients Rights in the Slovak Republic:
http://www.eubios.info/EJ143/ej143e.htm English
Austria, Vereinbarung zur Sicherstellung der Patientenrechte (Patientencharta):http://www.noel.gv.at/service/politik/landtag/LandtagsvorlagenXV/We
German
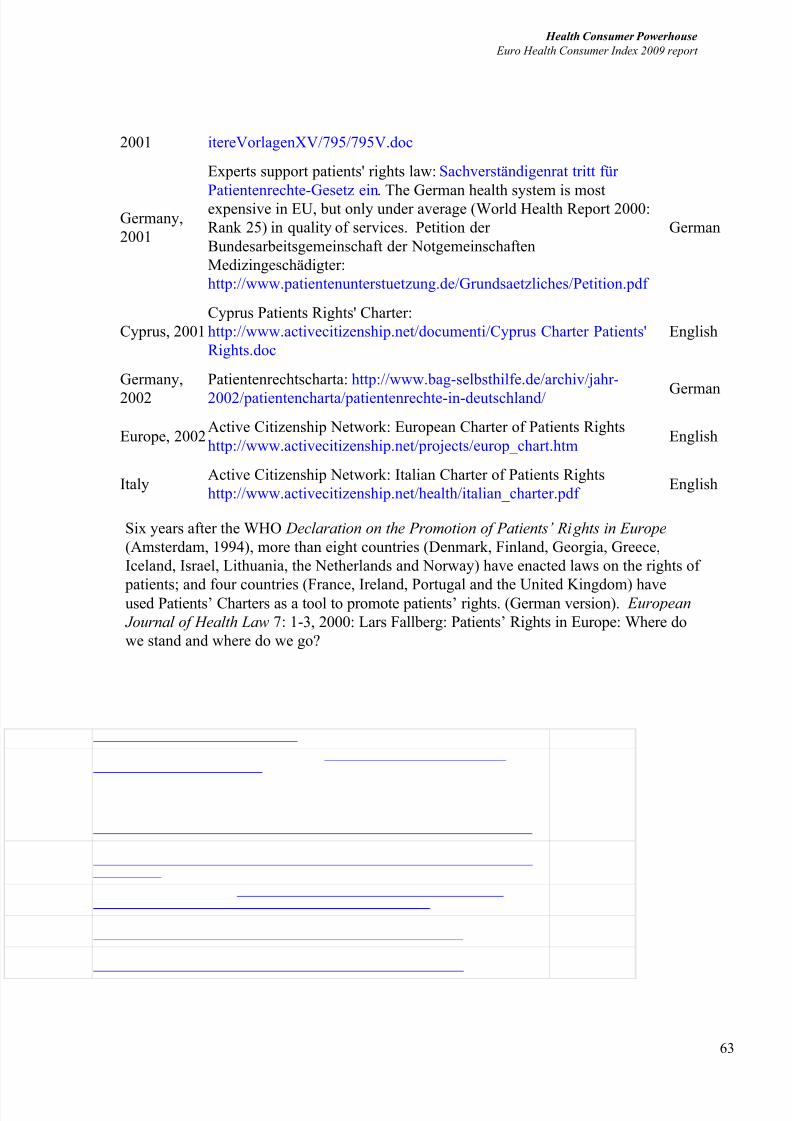
8/8/2019 Health Consumer powerhouse Report EHCI 2009 091001 final with cover
http://slidepdf.com/reader/full/health-consumer-powerhouse-report-ehci-2009-091001-final-with-cover 63/67
63
Health Consumer Powerhouse
Euro Health Consumer Index 2009 report
2001 itereVorlagenXV/795/795V.doc
Germany,
2001
Experts support patients' rights law: Sachverständigenrat tritt für
Patientenrechte-Gesetz ein. The German health system is mostexpensive in EU, but only under average (World Health Report 2000:
Rank 25) in quality of services. Petition der
Bundesarbeitsgemeinschaft der Notgemeinschaften
Medizingeschädigter:
http://www.patientenunterstuetzung.de/Grundsaetzliches/Petition.pdf
German
Cyprus, 2001
Cyprus Patients Rights' Charter:
http://www.activecitizenship.net/documenti/Cyprus Charter Patients'
Rights.doc
English
Germany,
2002
Patientenrechtscharta: http://www.bag-selbsthilfe.de/archiv/jahr-
2002/patientencharta/patientenrechte-in-deutschland/ German
Europe, 2002 Active Citizenship Network: European Charter of Patients Rights
http://www.activecitizenship.net/projects/europ_chart.htm English
ItalyActive Citizenship Network: Italian Charter of Patients Rights
http://www.activecitizenship.net/health/italian_charter.pdf English
Six years after the WHO Declaration on the Promotion of Patients’ Ri ghts in Europe
(Amsterdam, 1994), more than eight countries (Denmark, Finland, Georgia, Greece,
Iceland, Israel, Lithuania, the Netherlands and Norway) have enacted laws on the rights of
patients; and four countries (France, Ireland, Portugal and the United Kingdom) haveused Patients’ Charters as a tool to promote patients’ rights. (German version). European
Journal of Health Law 7: 1-3, 2000: Lars Fallberg: Patients’ Rights in Europe: Where do
we stand and where do we go?

8/8/2019 Health Consumer powerhouse Report EHCI 2009 091001 final with cover
http://slidepdf.com/reader/full/health-consumer-powerhouse-report-ehci-2009-091001-final-with-cover 64/67
64
Health Consumer Powerhouse
Euro Health Consumer Index 2009 Report
Appendix 1
Appendix 1. Questionnaire used in the survey commissioned
from Patient View for the Euro Health Consumer Index 2008.
How user friendly is your country's healthcare system in 2009?
About this survey
SURVEY OBJECTIVE:“To compare the extent to which the national healthcare systems of Europe take the patient andthe consumer into consideration in 2009”.
Dear health campaigner,
For the fifth year running, Health Consumer Powerhouse (HCP) is asking health campaignersacross Europe to help it compile the annual EURO HEALTH CONSUMER INDEX. The Index is
designed to measure the user-friendliness of national healthcare systems across Europe.
If you would like to contribute your views on the condition of your country’s healthcare system in2009, this year’s questionnaire for the Index is short — only 15 questions — and should take nomore than about 10 minutes of your time to complete. All responses will be anonymous. You willfind the questions on the next 4 pages.
The survey’s closing date is Tuesday August 25th 2009 (but HCP would welcome your opinionsbefore then, in order to draw up some initial trends).
To thank you for contributing your opinions to the study, and to allow you to read the results,PatientView, the survey manager, will send you (if you wish) the weblink to the Euro HealthConsumer Index upon publication on September 28th 2009.
Yours faithfully,Dr Arne Björnberg and Dr Beatriz CebollaHealth Consumer PowerhouseBrussels, Stockholm, and Winnipeg.
If you have any questions about this survey, please contact:Louise Oatham,PatientView,Woodhouse Place, Upper Woodhouse, Knighton, Powys, LD7 1NG, UK.Tel: 0044-(0)1547-520-965e-mail: [email protected]
Questions 1 to 6: on patients rights’ and information
1/15:
Are patient organisations in your country involved in healthcare decision-making?
(Such involvement might be at Ministry of Health level, or it might be at local government level.)
Yes, patient groups in my country have a legal right/obligation to become involved. There is no legal right to become involved, but patient groups OFTEN DO (by common
practice). There is no legal right to become involved, but patient groups OCCASIONALLY do, or
RARELY do. Patient groups in my country DO NOT USUALLY become involved.

8/8/2019 Health Consumer powerhouse Report EHCI 2009 091001 final with cover
http://slidepdf.com/reader/full/health-consumer-powerhouse-report-ehci-2009-091001-final-with-cover 65/67
65
Health Consumer Powerhouse
Euro Health Consumer Index 2009 Report
Appendix 1
2/15:
Do patients in your country have the statutory right to request a second opinion on an importantmedical problem, without having to pay extra (except, perhaps, for any regular co-payment fee for
an appointment)? Yes. Patients do have such a right, but it is difficult to access (perhaps due to a public lack of
information about the right, or due to bureaucracy within the healthcare system, or because the healthcare system discourages patients from using such a right).
No.
3/15:Can patients in your country readily get access to, and read, their own medical records?
Yes, simply by asking their doctor. The information is available, but the patient has to make a written application for it, or is
only permitted to read it with an 'intermediary', such as a medical professional, present to
explain it. No, patients in my country do not have access to such information.
4/15:
Can patients in your country readily get access to information about whether their doctor (or anyother doctor in their country) is a legitimate, bona fide, qualified healthcare professional?
Yes, the information is readily available on the Internet or in a well-known free publication. The information is available, but the patient has to pay for it (or the information is, in some
other way, difficult to access). No, patients in my country do not have access to such information.
5/15:
Does your country have a web-based or a telephone healthcare information service that is publiclyavailable in all parts of the country, runs 24 hours a day/7 days a week, and is interactive? [Thesort of information that the service provides could typically be: “Take an aspirin, and wait to see if you get better”, or “You must hurry to the A&E department of the nearest hospital”.]
Yes. Such a service exists, but few members of the public know about it, or it is hard to access. No.
6/15:
Can patients in your country choose to be treated in another EU state of their choice on thesame economic terms as for treatment at home? [This facility is known as 'cross-border care'.]
Yes, even if they would only have to wait a modest amount of time (perhaps one month)for treatment in their home country.
Yes—they have to have pre-approval, but that is usually given with no problem, or havehad to wait for a long time (> 3 months) for treatment.
No—or the pre-approval is usually only granted for very rare, special treatments.
Questions 7 to 9: on E-health
7/15:
Can your country's patients receive their test results by email (or by logging onto a personal web
page)?

8/8/2019 Health Consumer powerhouse Report EHCI 2009 091001 final with cover
http://slidepdf.com/reader/full/health-consumer-powerhouse-report-ehci-2009-091001-final-with-cover 66/67
66
Health Consumer Powerhouse
Euro Health Consumer Index 2009 Report
Appendix 1
Yes, this facility is widely available. It does exist, but is only offered by a few pioneering hospitals, laboratories, health
authorities, etc. No (or it is very rare).
8/15:
Can your country's patients book appointments with their doctor online?
Yes, this facility is widely available. It does exist, but is only offered by a few pioneering health authorities, hospitals, etc. No (or it is very rare).
o Primary-care doctors (GPs).o Hospital specialists.
9/15:Can your country's patients check ONLINE how much their healthcare providers (doctors/clinics)have been charging their insurers for supplying them with treatment/care?
Yes. This information is not available online, but can be obtained annually in print format. No (or not applicable, or not an insurance-based system).
Questions 10 to 14: on waiting times
10/15:
Can your country's patients see their primary-care doctor that same day (with or without anappointment)?
Yes. Sometimes, but not always. Normally not on the same day.
11/15:
Can your country's patients see a specialist (for a non-acute condition) without first having to get areferral from a primary-care doctor?
Yes. Yes, but only for a few specialties (such as gynaecology or paediatrics). Yes, but only if the patient is able to 'beat the system' and avoid going through the
primary-care doctor. No.
12/15:
Which of the following would be the more typical waiting time in your country for an operation for aNON-LIFE-THREATENING CONDITION (such as for a hip-joint replacement, or a non-acuteheart bypass)? [Please regard “waiting time” as the period between when a doctor/specialistdecides that the operation is needed, and when the patient actually receives the operation — without the patient having to go privately.]
The vast majority of patients (over 90%) would get the operation WITHIN three months. Most patients (over 50%) would get the operation WITHIN three months. Most patients (over 50%) would typically WAIT MORE THAN three months.

8/8/2019 Health Consumer powerhouse Report EHCI 2009 091001 final with cover
http://slidepdf.com/reader/full/health-consumer-powerhouse-report-ehci-2009-091001-final-with-cover 67/67
Health Consumer Powerhouse
Euro Health Consumer Index 2009 Report
Appendix 1
13/15:
Which of the following would be the more TYPICAL waiting time in your country for chemotherapyor radiotherapy for cancer patients? [Please regard “waiting time” as the period between when a
doctor decides that treatment is needed, and when the patient actually receives it — without thepatient having to go privately.]
The vast majority of patients (over 90%) would get the treatment WITHIN three weeks. Most patients (over 50%) would get the treatment WITHIN three weeks. Most patients (over 50%) would typically WAIT MORE THAN three weeks.
14/15:
Which of the following would be the more TYPICAL waiting time in your country for a CT scan(computed tomography X-ray scan)? [Please regard “waiting time” as the period between when adoctor decides that a CT scan is needed, and when the patient actually receives it — without thepatient having to go privately.]
Typically LESS THAN 7 days. Typically MORE THAN 7 days, but LESS THAN 21 days. Typically MORE THAN 21 days.
Finally, question 15: on 'informal' payments to doctors
The survey's final question looks at one aspect of the financial probity of medical professionals.
15/15:
Would your country's patients be expected to make unofficial payments [sometimes described as'under-the table' payments] to doctors for their services (in addition to any official co-payment of appointment fees)?
Yes, frequently. Sometimes/it depends on the the services provided, or on the doctor. No.


