September 2013 www.healthcostinstitute.org Copyright 2013 Health Care Cost Institute Inc. Unless explicitly noted, the content of this report is licensed under a Creative Commons Attribution Non-Commercial No Derivatives 3.0 License
Transcript
September 2013
www.healthcostinstitute.org
Copyright 2013 Health Care Cost Institute Inc. Unless explicitly noted, the content of this report is licensed
under a Creative Commons Attribution Non-Commercial No Derivatives 3.0 License
HCCI found that per capita ex-penditures for people age 64 or younger with ESI were $4,701 in 2012 (Table 1). Per capita expend-itures grew by 4.0 percent, nearly the same rate as 2011. For all of the subpopulations examined – region of the country, age group, and gender – health expenditures increased in 2012. However, ex-penditure growth slowed in the Midwest, the West, children, young adults, pre-Medicare adults, and for men.
HCCI also sought to understand which health care services helped keep expenditure growth low. In 2012, rising expenditures for out-patient services and prescription drugs offset slower expenditure growth for inpatient and profes-sional procedures. Outpatient fa-cility claims accounted for over 45
percent of the increase in overall expenditures.
Expenditures per capita
increased by $181
Between 2011 and 2012, per capi-ta expenditures rose by $181 from $4,520 to $4,701. The 4.0 percent increase in per capita expendi-tures during this period is 0.1 per-centage points lower than the growth rate observed for the pre-vious period (Figure 1).
Highest per capita expenditures
and fastest expenditures growth
were in the Northeast
As seen in Table 1 and Figure 2, the Northeast had the highest ex-penditures per capita ($4,868) and the fastest rate of regional
Annual Health Care Expenditures
Per Capita HEALTH CARE COST
GROWTH REMAINED
HISTORICALLY LOW
Expenditures grew slower in 2012 (4.0%) than in 2011 (4.1%). Rising outpatient and prescription ex-penditures offset slower expendi-ture growth for inpatient and pro-fessional procedures.
$4,701
Health care expenditures per in-sured younger than 65 and cov-ered by ESI in 2012.
$181
Difference in health care expendi-tures between 2011 and 2012.
45%
About $82 of the $181 increase in per capita spending came from rising outpatient facility expendi-tures.
$1,315 AND 6.5% The expenditures per insured (2012) and the growth of those expenditures (2011-2012) on out-patient facility claims.
3.8% The one-year change in prescrip-tion expenditure growth in 2012, reversing the slower growth seen in 2010 and 2011.
expenditures growth (4.9%). The West continued to have the lowest expenditures per capita ($4,382) and the slowest regional expendi-tures growth (1.9%), nearly 2 per-centage points slower than the growth rate between 2010 and 2011 (3.8%). Expenditures in the South increased by $213 between 2011 and 2012 to $4,790 (4.7%), whereas expenditures in the Mid-west increased by $186 to $4,735 (4.1%). The expenditures gap be-tween the Northeast and the West continued to widen, from $339 in 2011 to $486 to 2012.
Young adults experienced fastest
expenditures growth in 2011 and
2012
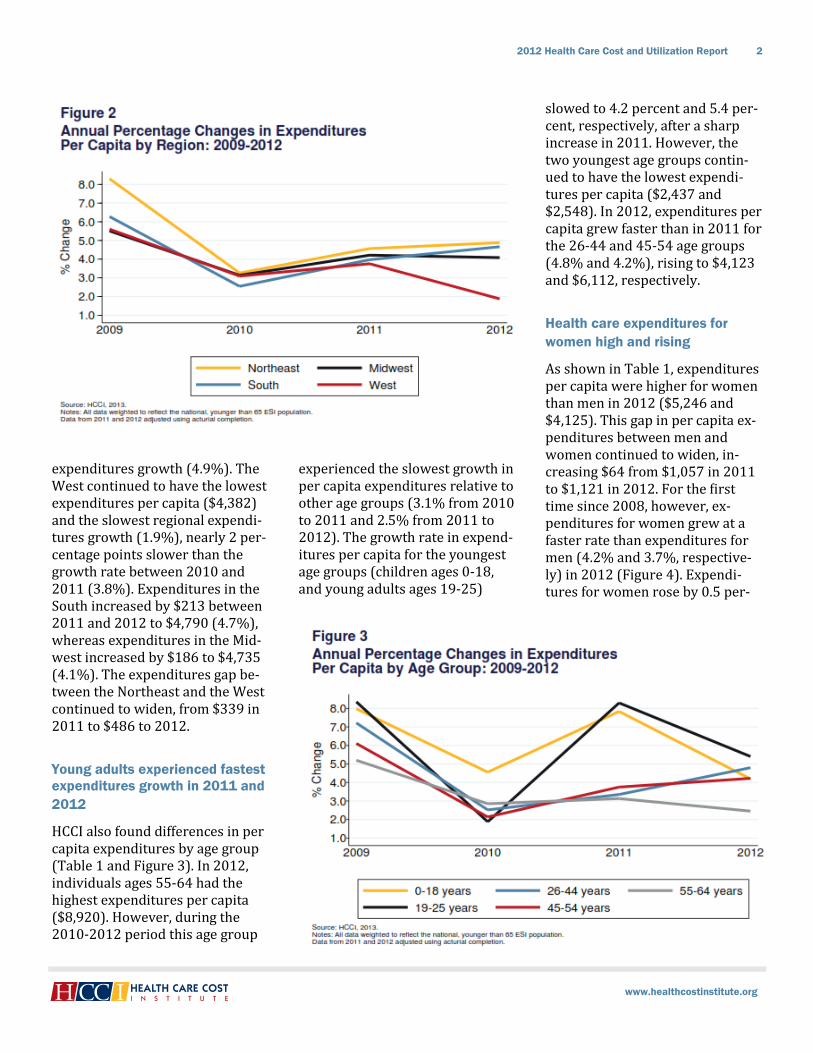
HCCI also found differences in per capita expenditures by age group (Table 1 and Figure 3). In 2012, individuals ages 55-64 had the highest expenditures per capita ($8,920). However, during the 2010-2012 period this age group
experienced the slowest growth in per capita expenditures relative to other age groups (3.1% from 2010 to 2011 and 2.5% from 2011 to 2012). The growth rate in expend-itures per capita for the youngest age groups (children ages 0-18, and young adults ages 19-25)
slowed to 4.2 percent and 5.4 per-cent, respectively, after a sharp increase in 2011. However, the two youngest age groups contin-ued to have the lowest expendi-tures per capita ($2,437 and $2,548). In 2012, expenditures per capita grew faster than in 2011 for the 26-44 and 45-54 age groups (4.8% and 4.2%), rising to $4,123 and $6,112, respectively.
Health care expenditures for
women high and rising
As shown in Table 1, expenditures per capita were higher for women than men in 2012 ($5,246 and $4,125). This gap in per capita ex-penditures between men and women continued to widen, in-creasing $64 from $1,057 in 2011 to $1,121 in 2012. For the first time since 2008, however, ex-penditures for women grew at a faster rate than expenditures for men (4.2% and 3.7%, respective-ly) in 2012 (Figure 4). Expendi-tures for women rose by 0.5 per-
centage points from 2011 to 2012, an increase of $212. For men, growth in expenditures declined by 0.9 percentage points, resulting in a $148 increase in expenditures between the two years.
Expenditures rose for all service
categories; outpatient expendi-
tures grew 6.5 percent
For all four service categories (inpatient, outpatient, profession-al procedures, and prescriptions), expenditures increased in 2012 (Table 1). However, for the brand-ed prescriptions subservice cate-gory, expenditures fell 0.6 percent.
Inpatient admissions remained about 20.7 percent of the total ex-penditures (Table 1 and Figure 5). Growth in inpatient expenditures slowed between 2011 and 2012 from 4.0 percent to 2.4 percent. For the inpatient subset sub-service category growth slowed from 4.6 percent in 2011 to 2.4 percent in 2012.3 Between 2009
and 2012, expenditures for the inpatient subset grew at an aver-age annual rate of 3.1 percent.
Outpatient services growth rates remained below 2009 levels, but have been accelerating. As a re-sult, outpatient expenditures ac-counted for 28 percent of health
care dollars spent per capita (Figure 5). For both outpatient subservice categories (outpatient other and outpatient visits), ex-penditures continued to grow fast-er than in prior years, resulting in an overall outpatient average an-nual growth rate of 5.9 percent (2010-2012), which was the high-est growth rate of any service cat-egory (Table 1). Growth rates for outpatient visits increased by 0.7 percentage points to 7.4 percent. Growth rates for outpatient other facility claims remained steady at 5.1 percent.
Expenditures growth for profes-sional procedures also remained below 2009 rates for 2010-2012 (Table 1), although 34 percent of per capita health care dollars ($1,596) were spent on profes-sional procedures (Figure 5). Growth in expenditures for pro-fessional procedures slowed by 0.7 percentage points between 2011 and 2012, from 3.8 percent to 3.1 percent.
Prescription expenditures growth slowed between 2009 and 2011; however, in 2012, growth re-bounded and expenditures in-creased by 3.8 percent (Table 1). In both 2011 and 2012, about 17.4 percent of health care dollars per capita were spent on prescriptions (Figure 5). Expenditures on brand prescriptions had been growing at 7.3 percent (2010) and 4.0 per-cent (2011) in the prior two years; in 2012, growth declined by 0.6 percent. Expenditures on generic prescriptions declined in 2010 (-5.7%) and 2011 (-3.2%), but grew by 13.5 percent in 2012. The dol-lars spent per capita on generics remained about half of those spent on brand prescriptions ($277 and $540 respectively).
Summary
ESI cost growth remained low for the third year in a row, rising only 4.0 percent. Overall, per capita health care expenditures contin-ued to rise in 2012, across all re-gions, age groups, and genders. The Northeast continued to have the highest expenditures per capi-ta and the fastest expenditures growth. The West continued to have the lowest expenditures and the slowest growth rate compared to 2011. Continuing a trend from 2011, young adults experienced the highest expenditures growth of any age group. Unlike in 2010 and 2011, expenditures on chil-dren in 2012 did not grow faster than those for adults ages 26-54. Women had higher and faster growing per capita expenditures than did men.
HCCI found changes in trends by service category for 2012 not seen in 2010 or 2011. As expected, pro-fessional procedures had the high-est dollar per capita expenditures but the second lowest rate of ex-penditures growth. Outpatient services experienced the fastest growth in per capita expenditures for both outpatient visits and out-patient other. However, the inpa-tient expenditures growth rate abruptly slowed, and prescription expenditures accelerated to 3.8 percent. As a result, lower inpa-tient and professional procedure expenditures growth helped slow overall expenditures growth, but relatively fast prescription growth and the third year of steadily ris-ing outpatient expenditures meant that 2012 expenditures rates kept pace with 2011 rates.
WHAT ARE EXPENDITURES PER CAPITA?
Per capita health expenditures in this report are the estimate of to-tal expenditures paid divided by the insured population.
WHAT ARE INPATIENT FACILITY CLAIMS?
An inpatient facility is a medical setting, such as hospitals, hospic-es, and skilled nursing facilities, where patients are kept overnight for treatment. An inpatient facility claims is the facility fee associated with an admission.
HCCI developed an inpatient sub-service category. This inpatient
subset excluded skilled nursing facility (SNF), hospice, and un-groupable claims due to the lack of information about the intensity and unit prices of those services at the time of analysis.
WHAT ARE OUTPATIENT VISITS AND OUTPATIENT OTHER SERVICES?
HCCI categorized outpatient facili-ty claims from emergency rooms, ambulatory surgery centers, and observation as outpatient visits. Imaging, radiology, and ancillary claims pertaining to services per-formed at an outpatient facility were categorized as outpatient other.4
WHAT ARE PROFESSIONAL PROCESDURES?
A claim filed by a health care pro-fessional for medical services ren-dered. It includes claims for pro-fessional procedures as opposed to facility claims, including office visits, lab tests, and immuniza-tions.
WHAT ARE PRESCRIPTIONS?
An order from a health care pro-fessional and given to a patient to obtain drugs or medical devices that cannot be purchased over the counter.
Table 1: Annual Expenditures Per Capita (2010—2012)
2010 2011 2012
Percent Change
2009 / 2010
Percent Change
2010 / 2011
Percent Change
2011 / 2012
Per Capita $4,343 $4,520 $4,701 2.9% 4.1% 4.0%
Per Capita by Region
Northeast $4,438 $4,641 $4,868 3.3% 4.6% 4.9%
Midwest $4,365 $4,549 $4,735 3.1% 4.2% 4.1%
South $4,402 $4,577 $4,790 2.5% 4.0% 4.7%
West $4,146 $4,302 $4,382 3.1% 3.8% 1.9%
Per Capita by Age
18 and Younger $2,169 $2,339 $2,437 4.6% 7.8% 4.2%
19-25 $2,232 $2,418 $2,548 1.9% 8.3% 5.4%
26-44 $3,807 $3,934 $4,123 2.5% 3.3% 4.8%
45-54 $5,653 $5,865 $6,112 2.1% 3.8% 4.2%
55-64 $8,442 $8,707 $8,920 2.9% 3.1% 2.5%
Per Capita by Gender
Men $3,801 $3,977 $4,125 3.3% 4.6% 3.7%
Women $4,855 $5,034 $5,246 2.7% 3.7% 4.2%
Per Capita by Service Category
Inpatient $913 $950 $972 2.7% 4.0% 2.4%
Inpatient Subset1 $897 $938 $961 2.3% 4.6% 2.4%
Outpatient $1,163 $1,234 $1,315 5.1% 6.1% 6.5%
Visits $705 $753 $809 6.7% 6.7% 7.4%
Other $458 $482 $506 2.8% 5.1% 5.1%
Professional Procedures $1,492 $1,549 $1,596 1.6% 3.8% 3.1%
Prescriptions2 $774 $787 $817 2.6% 1.7% 3.8%
Brand $522 $543 $540 7.3% 4.0% -0.6%
Generics $252 $244 $277 -5.7% -3.2% 13.5%
Source: HCCI, 2013.
Notes: All data to represent the total population of insureds younger than 65 and covered by ESI. Actuarial completion was performed on data from 2011 and 2012. All per capita dollars calculated from allowed costs. All figures rounded.
1. Skilled nursing facility (SNF), hospice, and ungroupable claims were excluded from analysis of inpatient expenditure trends due to the lack of information about the intensity and unit prices of those services at the time of analysis.
2. Prescriptions uncategorizable as brand or generic were also analyzed, but they are not included in the tables due to very low dollar amounts.
Health care cost growth is the re-sult of changes in the number of services provided (“utilization”) and the actual prices paid for those services (“allowed costs”). Because changes in prices or utili-zation might reflect changes in how care is delivered, HCCI con-sidered a third factor – changes in the resources used to provide care (“intensity”). Resource intensity can be used to adjust utilization metrics (see page 12), or to adjust prices paid into a base price that all patients would pay for a given service (“intensity-adjusted price”).7 HCCI used intensity-adjusted prices to determine whether prices changed due to changes in the resources used to treat patients or changes in factors other than service intensity. HCCI reported utilization and prices
paid as the two main components of expenditures, and intensity and intensity-adjusted prices as com-ponents of the prices paid.
In this section of the report, HCCI analyzed how the different com-ponents of spending affected per capita expenditures for each of the service categories and subservice categories.8 For 2012, HCCI found that growth of prices paid out-paced growth in utilization for most services. However, shifts in utilization reveal that while the expenditures growth rate in 2012 was very similar to that in 2011, the 2012 trends varied from those observed in 2010 and 2011.
Components of Spending
PRICES DRIVE MOST,
BUT NOT ALL,
SPENDING GROWTH
For most service categories, prices rose faster than utilization. For generic prescriptions, utilization grew faster than prices in 2012.
8.9% AND 1.4%
Change in average intensity-adjusted prices and utilization for outpatient visits (2011-2012).
3.3% AND 0.8%
Change in average intensity-adjusted prices and utilization for outpatient other facility claims (2011-2012).
2.1% AND 1.9%
Change in average intensity-adjusted prices and utilization for professional procedures (2011-2012).
25.4% AND -20.7%
Change in average prices and utili-zation for brand prescriptions (2011-2012).
5.3% AND 7.7%
Change in average prices and utili-zation for generic prescriptions (2011-2012).
Since 2009, the growth rate of ex-penditures on outpatient services had outpaced all other service cat-egories, and 2012 was no excep-tion (Figure 6, Table 1, and Table 3). Expenditures grew fastest for outpatient visits and outpatient other facility claims (7.4% and 5.1%, respectively). Prescription expenditures rose by 3.8 percent, about 2.1 percentage points high-er than in 2011. This was due largely to rising generic expendi-tures (13.5% growth), and despite declining brand expenditures (-0.6%). Between 2011 and 2012, growth slowed for professional procedures and inpatient facility claims (3.1% and 2.4%, respec-tively).
Inpatient admissions continued
to decline
As has occurred for the last four years, inpatient utilization de-clined in 2012, falling by 2.9 per-cent (Table 2 and Figure 7). For the inpatient subset, for which uti-lization metrics were unavailable, utilization levels fell by 3.1 per-centage points, resulting in an av-erage of 2 fewer inpatient admis-sions per 1,000 insureds in 2012 than in 2011.
Outpatient facility use increased,
but more slowly than in 2011
Outpatient visits rose by 4 visits per 1,000 insureds between 2011 and 2012 (1.4%), increasing to 329 visits per 1,000 insureds (Table 2 and Figure 7). Outpatient other facility uses grew to 2,631 outpatient facility claims in 2012,
a 0.8 percent increase in utiliza-tion. The rate of increase for visits and other facility uses was some-what lower than in 2011.
Professional procedures out-
paced facility utilization
In 2012, professional procedure
utilization increased by 1.9 per-cent, nearly a percentage point higher than 2011, and 3.3 percent-age points higher than 2010 (Table 2 and Figure 8). The num-ber of procedures per 1,000 in-sureds rose by 310 resulting in 16,390 procedures per 1,000 in-sureds, or 16.4 procedures per
capita for 2012. Utilization rose the fastest for pathology and lab procedures (up 4.5%, or 201 pro-cedures per 1,000 insured) and preventive visits to primary care providers (up 3.6%, or 12 preven-tive visits per 1,000 insureds).
Generic prescription filled days
rose as brand utilization fell by
over 20 percent
Prescriptions can be counted by the number of scripts filled or by the number of days filled. Since scripts may be for different lengths of time, capturing scripts might obscure changes in pre-scription utilization. Therefore, HCCI analyzed prescriptions by filled days. As was the trend in 2010 and 2011, the number of ge-neric filled days was higher than the number of brand filled days (Table 2 and Figure 8). Between 2011 and 2012, the gap in days between brand and generic use widened due to a 20.7 decrease in brand prescription use and a 7.7 percent increase in generic pre-scription use. Generic days filled rose to 226,362 days per 1,000 insureds (about 226 days per capi-ta), while brand prescription days fell to 55,470 filled days per 1,000 insureds (about 55 days per capi-ta) in 2012.
Price growth slowed for inpatient
admissions and professional
procedures
Price growth for inpatient admis-sions slowed by 0.2 percentage points from 5.6 percent in 2011 to 5.4 percent in 2012 (Table 2 and Figure 7). Average price growth for inpatient subset claims fell 0.5 percentage points to 5.7 percent
in 2012. The average admission price was $16,421 in 2012; the average admissions price for the inpatient subset was higher at $17,044.
Professional procedure price growth had slowed by 0.1 percent-age points between 2010 and 2011, but in 2012 dropped 1.8
percentage points to a 1.1 percent growth rate (Table 2 and Figure 8). The average professional pro-cedure price rose from $96 in 2011 to $97 in 2012.
Price increases accelerated for outpatient facility claims and pre-scriptions per filled day in 2012 (Table 2 and Figure 7). Price growth for an average outpatient visit rose from $2,319 in 2011 to $2,457 in 2012, an increase of 6.0 percent. The average price for out-patient other services rose from $185 in 2011 to $192 in 2012, an increase of 4.2 percent. The price for a filled day grew by 3.2 percent between 2011 and 2012 (Table 2 and Figure 8). Prices for generics per filled day had declined in 2010 and 2011, but rose by 5.3 percent in 2012, however the cost of a ge-neric filled day remained about $1 (2010-2012). Prices for brand per filled day rose 10.3 percent in be-tween 2009 and 2010, another 18.2 percent between 2010 and 2011, and by 25.4 percent more in 2012. As a result, the average cost of brand prescriptions grew by $3 per day between 2010 and 2012, to an average price per day of $10 in 2012 (Table 2).
Service intensity trend generally
flat for all service categories in
2012
Using intensity weights designed by CMS and adjusted for commer-cial claims, HCCI calculated aver-age service intensity for the inpa-tient subset, outpatient visits, out-patient other, and professional procedures (Table 2 and Figure 9). Intensity weights were not calcu-lated for prescriptions.
Intensity for outpatient other ser-vices and inpatient facility ser-vices increased slightly for the sec-ond year in a row, rising by 0.8
percent and 0.4 percent, respec-tively. Outpatient visit intensity declined 2.7 percent between 2011 and 2012. Professional pro-cedure intensity fell by 1.0 per-cent, yet the growth rate for aver-age service intensity levels for professional procedures remained higher in 2012 than in 2010.
Growth of intensity-adjusted prices continued to accelerate for
outpatient services and professional procedures, slowed
for inpatient admissions,
outpatient other
Prices paid for services can change if the resources used to care for patients change (Table 2 and Fig-ure 10). Therefore, HCCI calculat-ed an average intensity-adjusted price, or “base price”, which would reflect changes in prices due to factors other than resource inten-sity. Intensity-adjusted prices for outpatient visits rose from $137 in 2010 to $161 dollars in 2012, an average annual increase of 8.1 percent. Professional procedure intensity-adjusted prices grew by $2 in the three-year period, in-creasing $1 in 2012. These adjust-ed prices grew at 2.1 percent in 2012, which was 0.3 percentage points higher than growth in 2011 (1.8%) and 1.6 percentage points lower than growth in 2010 (3.7%).
Rising intensity for inpatient ad-missions and outpatient other fa-cility claims resulted in growth rates for intensity-adjusted prices that were lower than the growth rates for prices paid. The average intensity-adjusted prices for inpa-tient admissions subset grew 5.3 percent in 2012, 0.6 percentage points lower than in 2011. Intensi-
ty-adjusted prices for outpatient other facility claims rose from $143 in 2011 to $148 in 2012, re-flecting adjusted price growth of 3.3 percent in 2012, 0.1 percent-age points lower than in 2011.
Price growth remained the primary driver of expenditures
growth
The relatively slow growth of utili-zation compared to intensity-adjusted prices for inpatient, out-patient, and professional proce-dure services, reflects the ongoing trend in price growth outpacing service use. In 2012, as in the last three years, growth of intensity-adjusted prices paid outpaced growth in utilization (Table 3). Declines in the growth rate of uti-lization combined with increases in intensity-adjusted prices in 2012 led to a similar growth rate in expenditures for 2011 and 2012.
However, unlike 2011, rising pro-fessional procedures utilization outpaced price growth for that service category. Professional pro-cedure prices, on average, grew by 1.1 percent, whereas utilization grew by 1.9 percent. After intensi-ty-adjustments, professional pro-cedure prices grew by 2.1 percent.
Summary
Expenditures growth for inpatient and outpatient facility claims, as well as prescriptions, reflected increases in the prices paid for those services. Inpatient prices, both the prices paid and the inten-sity-adjusted prices grew faster than utilization or service intensi-ty. Outpatient prices (paid and
intensity-adjusted) for both visits and other facility claims grew fast-er than utilization or intensity. Brand prescription prices grew while brand prescription utiliza-tion declined, helping drive up prescription price growth overall. In contrast, generic prescriptions had faster utilization growth than price growth.
In 2012, professional procedure utilization grew by 1.9 percent, faster than the prior three years. This growth was faster than the rate of change for average prices paid, which suggests that profes-sional procedure prices paid on behalf of the insureds, for the first
time, were not the major driver of professional procedure cost growth. Nevertheless, after adjust-ing for declining intensity in 2012, intensity-adjusted professional procedure prices outpaced utiliza-tion.
For 2012, these changes in trends led to declining growth for brand prescriptions, slower growth for inpatient and professional proce-dure expenditures, steady growth for outpatient other facility claims, and faster expenditure growth for outpatient visits and generic pre-scriptions. The direction of overall expenditures and the increasing role of utilization growth suggest
that care in 2012 moved away from more intense and expensive services. HCCI will be reporting more in the future on these care shifts.
HOW DID HCCI CALCULATE UTILI-ZATION AND WHAT IS AVERAGE PRICE?
Utilization was the average num-ber of uses for a service per 1,000 insureds. For every service use, there was an associated dollar amount paid to providers by both insurers and the insured. Average price was calculated by dividing all the dollars spent on a service cate-gory, subservice category, or de-tailed service category by the asso-ciated number of service uses.4
WHAT IS INTENSITY?
Intensity refers to the resources used for each medical service. For example, one patient has a simple 15-minute appointment with a physician, while another patient
has a 30-minute visit with the same physician. Intensity of ser-vices is greater for the second pa-tient, even though each was count-ed as a single office visit. HCCI measures intensity by assigning a weight designed by Centers for Medicare & Medicaid Services (CMS) and commercially adjusted to each medical service, when pos-sible. HCCI did not calculate inten-sity of prescriptions, as the dosage levels and days are fully captured by the price.
WHAT IS AN INTENSITY-ADJUSTED PRICE?
HCCI examined the relative effect of intensity growth on price growth. Isolating the effect of in-tensity on the price paid per ser-vice allows for the calculation of an
intensity-adjusted price. The con-sumer never sees this price direct-ly. The intensity-adjusted price, or unit price, was calculated by divid-ing the price paid for the service by the intensity of the service. For example, intensity equal to one would lead to no difference be-tween prices paid and intensity-adjusted prices. Intensity greater than one would lead to intensity-adjusted prices being higher than prices paid; an intensity level less than one would mean that intensi-ty-adjusted prices were less than the prices paid. Using this metric, HCCI is able to determine how much of the change in price growth came from changes in re-source use (intensity growth) and how much came from changes in other factors influencing prices (intensity-adjusted price growth).
Professional Procedures $55 $56 $57 3.7% 1.8% 2.1%
Source: HCCI, 2013.
Notes: All data to represent the total population of insureds younger than 65 and covered by ESI. Actuarial completion was performed on data from 2011 and 2012. All per capita dollars calculated from allowed costs. All figures rounded.
1. Skilled nursing facility (SNF), hospice, and ungroupable claims were excluded from analysis of inpatient expenditure trends due to the lack of information about the intensity and unit prices of those services at the time of analysis.
2. Prescriptions uncategorizable as brand or generic were also analyzed, but they are not included in the tables due to very low dollar amounts and low utilization.
HCCI assigned each inpatient facili-ty claim a major diagnostic catego-ry (MDCs).
As seen in Appendix Table A9, the five MDCs with the highest ex-penditures per capita in 2012 were musculoskeletal ($160), circulatory ($126), pregnancy and childbirth ($94), digestive ($93), and nervous system ($63). Except for diagnoses associated with the circulatory sys-tem (which declined by 0.9% be-tween 2011 and 2012), expendi-
tures per capita rose for the other four MDCs.
Between 2011 and 2012, expendi-tures on these services rose 4.6 percent for the musculoskeletal system, 5.5 percent for pregnancy and childbirth, 4.4 percent for the digestive system, and 4.6 percent for the nervous system. Rising ex-penditures for these services were driven by intensity-adjusted price increases rather than utilization. The decline in circulatory system MDCs, however, was primarily due to a 7.0 percent decline in utiliza-
tion that was offset by increases in intensity (2.3%) and intensity-adjusted prices (4.1%).
As well, HCCI is watching one MDC that showed high expenditure growth and increasing admissions in 2012. The dollars spent on infec-tious and parasitic disease ($33) rose by 8.0 percent in 2012. For infectious disease admissions, in-creased expenditures were due to increased utilization (2.7%), inten-sity (1.8%), and intensity-adjusted price (3.3%).
2012
Expenditures
Components of 2012
Expenditures Trend
Components of 2012 Price
Trend Per Capita Utilization Prices Paid Intensity Unit Price Inpatient 2.4% -2.9% 5.4% N/A N/A
Notes: All data to represent the total population of insureds younger than 65 and covered by ESI. Actuarial completion was performed on data from 2011 and 2012. All per capita dollars calculated from allowed costs. All figures rounded.
1. Skilled nursing facility (SNF), hospice, and ungroupable claims were excluded from analysis of inpatient expenditure trends due to the lack of information about the intensity and unit prices of those services at the time of analysis.
2. Prescriptions uncategorizable as brand or generic were also analyzed, but they are not included in the tables due to very low dollar amounts and low utilization.
3. Generic prices per day were less than $1.50 in 2011 and 2012.
In this section, HCCI examined trends in out-of-pocket and payer expenditures per capita. Payer expenditures reflect the actual amounts paid by insurers (employers or health plans) to providers for health care services. Out-of-pocket expenditures are actual payments made by insureds directly to medical professionals, facilities, and pharmacies, and are the most visible health care costs to consumers.
HCCI found that out-of-pocket ex-penditures were about 16.3 per-cent of total per capita expendi-tures and about 4.8 percent higher in 2012 than in 2011 (Table 4). Payer expenditures, which re-mained the bulk of expenditures per capita (83.7%), increased by 3.8 percent (Table 5). For both payers and consumers, profes-
sional procedures accounted for the most of their expenditures, while outpatient services was the second largest service category of expenditures (Figure 12 and Fig-ure 14). Out-of-pocket expendi-tures on prescriptions fell while payer expenditures on prescrip-tions grew faster in 2012 than in 2011.
Out-of-pocket expenditures per
capita increased by $35
In 2012, out-of-pocket expendi-tures per capita rose from $733 in 2011 to $768 in 2012 (Table 4 and Figure 11). This 4.8 percent in-crease was higher than the rate of out-of-pocket expenditures growth in 2011, but lower than the 6.9 percent increase observed for 2010. Between 2010 and 2012,
Out-of-Pocket and Payer
Expenditures OUTPATIENT CARE
WAS 25.9% OF OUT-
OF-POCKET
EXPENDITURES
In 2012, consumers paid about 16.3% of the medical services (inpatient, outpatient, and profes-sional procedures) payments through out-of-pocket expendi-tures. Of the $768 per capita dol-lars spent out-of-pocket, $199 was spent on outpatient services.
4.8% AND $768
Growth (2011-2012) and per capi-ta dollar amount of out-of-pocket expenditures (2012).
3.8% AND $3,932
Growth (2011-2012) and per capi-ta dollar amount of expenditures by payers (2012).
16.3%
Share of total per capita expendi-tures that came from insureds’ co-pays, deductibles, and co-insurance (2012).
9.8% AND $118
Out-of-pocket growth (2011-2012) and per capita dollar amount of expenditures for outpatient visits (2011-2012).
out-of-pocket expenditures, while lower than payer expenditures, experienced faster growth.
The growth rate for out-of-pocket expenditures was highest in the Midwest and South, which were also the regions with the highest out-of-pocket per capita expendi-tures (Table 4). In the South, out-of-pocket per capita expenditures increased by $44, a 5.5 percent increase over 2011; since 2009, out-of-pocket expenditures grew by an annual average of 5.8 per-cent in this region. In the Midwest, out-of-pocket expenditures also grew by 5.5 percent per capita, an increase of $41. For the Northeast, the out-of-pocket expenditures rose 5.2 percentage points ($35). The West had the lowest growth rate in out-of-pocket expendi-tures, rising 2.2 percent ($15) be-tween 2011 and 2012.
Out-of-pocket expenditures rose 6.5 percent for adults ages 26-44, from $707 in 2011 to $753 in
2012 (Table 4). The highest ex-penditures were for the oldest adults (ages 55-64), who spent $1,265 per capita out-of-pocket in 2012, a 2.3 percent increase from 2011. The lowest out-of-pocket expenditures were for children (ages 0-18) at $427 in 2012 – a 5.9
percent increase over 2011.
Out-of-pocket expenditures grew faster for women (5.0%) than for men (4.4%; Table 4). Women’s out-of-pocket per capita expenditures reached $883 in 2012 – about $236 more than expenditures by men. Men’s out-of-pocket expendi-tures rose by $27 per capita be-tween 2011 and 2012, compared with a $42 rise for women.
Unlike in prior years, out-of-pocket expenditures per capita on outpatient services were higher than expenditures on prescrip-tions (Figure 12). Insureds paid $190 per capita out-of-pocket for prescriptions and $182 for outpa-tient services in 2011, while in 2012 these averages were $189 and $199, respectively.
For the third year in a row, growth in out-of-pocket inpatient expend-itures per capita slowed (Table 4 and Figure 13). Out-of-pocket brand prescription expenditures per capita declined, falling 12 per-
cent in 2012 to $85. The category with the highest 2012 per capita expenditure growth was generic prescriptions (10.9% to $103), followed by outpatient visits (9.8% to $118).
Growth rate for payer expendi-
tures slowed to 3.8%
Payer expenditures rose 3.8 per-cent, a $145 increase from $3,787 in 2011 to $3,932 in 2012 (Table 5 and Figure 11). As in prior years, payer expenditures made up more than 83 percent of per capita ex-penditures in 2012. On average, payer expenditures per capita grew at rates slower than overall per capita expenditures for the previous three years.
Payer expenditures grew fastest in the Northeast and the South, which were also the regions with the highest per capita expendi-tures (Table 5). In the Northeast, payer expenditures were $4,157 per capita in 2012, a $191 or 4.8
percent increase from 2011. In the South, payer expenditures per capita increased $170 to $3,956 (4.5% growth). Payer expenditure growth slowed in the Midwest (3.8%) and the West (1.8%).
In 2012, payers saw expenditures per capita for young adults (ages
19-25) rise 5.2 percent (Table 5). Overall, payers paid more for old-er adults than for younger adults, with expenditures for the oldest adults (ages 55-64) reaching $7,656 per capita in 2012. This was $2,508 more than the expend-itures per capita on the next oldest group (ages 45-54) and more than twice the amount spent on 26 to 44 year olds.
As seen in Table 5 and Figure 14, payers spent the most per capita dollars on professional proce-dures ($1,263), followed by outpa-tient services ($1,116). Between 2011 and 2012, payer expendi-tures on outpatient visits rose by 7.0 percent to $691, and expendi-tures on outpatient other claims rose 4.4 percent to $425. Payers saw prescription expenditures rise 5.3 percent to $629, due to a 1.9 percent increase in brand ex-penditures ($455) and a 15.1 per-cent increase in expenditures on generics ($174).
In 2012, per capita out-of-pocket expenditures increased $35 and continued to grow faster than pay-er expenditures. Payer expendi-tures accounted for the vast ma-jority of per capita expenditures, but for the third year in a row, the share of the insureds’ out-of-pocket expenditures increased. Payer expenditures were highest in the Northeast, whereas out-of-pocket expenditures were highest in the South. Out-of-pocket ex-penditure growth rates remained higher than payer growth rates for the three youngest age groups (ages 0-44). Out-of-pocket ex-penditures also grew faster than payer expenditures for both men and women.
Out-of-pocket and payer expendi-tures for outpatient services con-tinued to rise more rapidly than expenditures on other services. Out-of-pocket expenditures on outpatient care experienced more than 9 percent growth for the fourth consecutive year. As well, in 2012, out-of-pocket and payer expenditures for generic prescrip-tions grew faster than for other services.
WHAT ARE OUT-OF-POCKET EXPENDITURES PER CAPITA?
Out-of-pocket payments are made directly to a health care provider by the insured, including any copay-ments, coinsurance payments, and deductible payments. Any health care payments made out-of-pocket for which a claim was not filed (such as over-the-counter medi-cines), are not included in this met-ric. Out-of-pocket expenditures per capita are calculated by dividing total out-of-pocket expenditures by the insured population.
WHAT ARE COINSURANCE PAYMENTS?
Coinsurance is the portion of cov-ered health care costs borne by an insured. After the insured meets a
deductible requirement, insurers often apply coinsurance according to a fixed percentage of the prices paid.
WHAT ARE COPAYS?
Copays are a cost-sharing arrange-ment in which the insured pays a specified charge for a specified ser-vice. Typical co-payments are fixed flat amounts for physician office visits, prescriptions, or hospital ser-vices.
WHAT ARE DEDUCTIBLES?
Deductibles are the amount that the insured must pay out of pocket to providers before the health plan pays any reimbursement to the insured. For example, an insured
with a $1,000 deductible would pay the first $1,000 of service costs in the given year. After the deductible is satisfied, the insureds and the health plan jointly pay further ex-penses according to the insurance contract.
WHAT ARE PAYER EXPENDITURES PER CAPITA?
Payer expenditures are dollars paid by the insurer directly to a health care provider on behalf of the in-sured. This excludes any rebates, discounts, incentive payments, or administrative costs that are not captured by the claims system. Payer expenditures per capita are calculated by dividing total payer expenditures by the insured popu-lation.
Table 4: Out-of-Pocket Expenditures Per Capita (2010—2012)
2010 2011 2012
Percent
Change
2009 / 2010
Percent
Change
2010 / 2011
Percent
Change
2011 / 2012
Out-of-Pocket Per Capita
National $701 $733 $768 6.9% 4.6% 4.8%
Share of Expenditures 16.1% 16.2% 16.3% N/A N/A N/A
Out-of-Pocket Per Capita by Geographic Region
Northeast $654 $675 $710 8.8% 3.3% 5.2%
Midwest $724 $760 $801 6.0% 4.9% 5.5%
South $750 $790 $834 6.4% 5.4% 5.5%
West $644 $668 $683 7.0% 3.8% 2.2%
Out-of-Pocket Per Capita by Age
18 and Younger $378 $403 $427 7.3% 6.7% 5.9%
19-25 $447 $473 $502 6.0% 5.9% 6.1%
26-44 $671 $707 $753 7.6% 5.4% 6.5%
45-54 $888 $925 $964 6.3% 4.2% 4.2%
55-64 $1,201 $1,236 $1,265 6.0% 3.0% 2.3%
Out-of-Pocket Per Capita by Gender
Men $592 $620 $647 7.1% 4.7% 4.4%
Women $804 $841 $883 6.8% 4.5% 5.0%
Out-of-Pocket Per Capita by Service Category
Inpatient $43 $46 $47 8.7% 5.2% 3.7%
Inpatient Subset1 $43 $45 $47 8.7% 5.5% 3.8%
Outpatient $166 $182 $199 11.2% 9.4% 9.3%
Visits $98 $107 $118 12.0% 9.4% 9.8%
Other $68 $74 $81 10.0% 9.5% 8.5%
Professional Procedures $298 $316 $334 7.9% 6.1% 5.6%
Prescriptions2 $194 $190 $189 1.6% -2.1% -0.7%
Brand $102 $97 $85 4.9% -5.2% -12.0%
Generics $92 $93 $103 -1.6% 1.3% 10.9%
Source: HCCI, 2013.
Notes: All data to represent the total population of insureds younger than 65 and covered by ESI. Actuarial completion was performed on data from 2011 and 2012. All per capita dollars calculated from allowed costs. All figures rounded.
1. Skilled nursing facility (SNF), hospice, and ungroupable claims were excluded from analysis of inpatient expenditure trends due to the lack of information about the intensity and unit prices of those services at the time of analysis.
2. Prescriptions uncategorizable as brand or generic were also analyzed, but they are not included in the tables due to very low dollar amounts.
Table 5: Payer Expenditures Per Capita (2010—2012)
2010 2011 2012
Percent
Change
2009 / 2010
Percent
Change
2010 / 2011
Percent
Change
2011 / 2012
Payer Per Capita
National $3,641 $3,787 $3,932 2.2% 4.0% 3.8%
Share of Expenditures 83.9% 83.8% 83.7% N/A N/A N/A
Payer Per Capita by Geographic Region
Northeast $3,784 $3,966 $4,157 2.4% 4.8% 4.8%
Midwest $3,641 $3,790 $3,934 2.6% 4.1% 3.8%
South $3,652 $3,786 $3,956 1.8% 3.7% 4.5%
West $3,502 $3,634 $3,699 2.4% 3.7% 1.8%
Payer Per Capita by Age
18 and Younger $1,791 $1,936 $2,010 4.0% 8.1% 3.8%
19-25 $1,786 $1,945 $2,046 0.9% 8.9% 5.2%
26-44 $3,136 $3,227 $3,370 1.5% 2.9% 4.4%
45-54 $4,765 $4,940 $5,148 1.4% 3.7% 4.2%
55-64 $7,242 $7,471 $7,656 2.3% 3.2% 2.5%
Payer Per Capita by Gender
Men $3,209 $3,357 $3,478 2.6% 4.6% 3.6%
Women $4,051 $4,194 $4,363 1.9% 3.5% 4.0%
Payer Per Capita by Service Category
Inpatient $869 $904 $925 2.4% 4.0% 2.3%
Inpatient Subset1 $855 $893 $914 2.0% 4.5% 2.3%
Outpatient $997 $1,053 $1,116 4.2% 5.6% 6.0%
Visits $607 $645 $691 5.9% 6.3% 7.0%
Other $390 $407 $425 1.6% 4.4% 4.4%
Professional Procedures $1,195 $1,233 $1,263 0.1% 3.2% 2.4%
Prescriptions2 $580 $597 $629 2.9% 2.9% 5.3%
Brand $420 $446 $455 7.9% 6.2% 1.9%
Generics $160 $151 $174 -7.9% -5.8% 15.1%
Source: HCCI, 2013.
Notes: All data to represent the total population of insureds younger than 65 and covered by ESI. Actuarial completion was performed on data from 2011 and 2012. All per capita dollars calculated from allowed costs. All figures rounded.
1. Skilled nursing facility (SNF), hospice, and ungroupable claims were excluded from analysis of inpatient expenditure trends due to the lack of information about the intensity and unit prices of those services at the time of analysis.
2. Prescriptions uncategorizable as brand or generic were also analyzed, but they are not included in the tables due to very low dollar amounts.
HCCI has access to several billion de-identified commercial health insurance claims for the years 2007 through 2012. HCCI’s claims data is compliant with the Health Insurance Portability and Ac-countability Act (HIPAA) and in-cludes the prices paid to provid-ers. HCCI data includes claims for the people with group insurance (fully insured and administrative services only), individual insur-ance, and Medicare Advantage. Three major health insurers con-tributed the data to HCCI for the purposes of producing this nation-al, multi-payer, commercial health care claims database.
For the 2012 Health Care Cost and Utilization Report, HCCI performed research on over 5.4 billion claim lines (2007-2012) for about 40 million insureds per year. This analytic subset of the data consist-ed of all non-Medicare claims on behalf of insureds younger than age 65 with ESI. The claims used in this report represent about 25.6 percent of the national ESI popula-tion, making this one of the largest collections of data on the privately insured ever assembled.
Methods
The analytic subset was weighted using U.S. Census Bureau data to make the estimates representative of the national ESI population across demographic and geo-graphic characteristics.4 Claims for
2011 and 2012 were adjusted us-ing actuarial completion to ac-count for claims incurred but not adjudicated.
HCCI used these weighted and ad-justed claims to estimate per capi-ta health expenditures, prices, uti-lization, unit prices, and service intensity for 2007 through 2012. HCCI did not correct dollars for inflation; thus, all reported ex-penditures and prices were nomi-nal.
HCCI analyzed four major catego-ries of services, several subservice categories, and detailed service categories.3 Inpatient facility claims were from hospitals, skilled nursing facilities (SNFs), and hos-pices where there was evidence that the insured stayed overnight. Outpatient facility claims were claims that did not have an over-night stay, but include observation and emergency room claims. Both outpatient and inpatient claims consisted of only the facility charges associated with such claims. Professional procedures were from claims billed by physi-cians and nonphysicians according to procedure codes commonly used in the industry. Prescription data came from retail and mail order pharmacies.
A Note on Premiums
HCCI does not report on premi-ums or their determinants. For more information on health insur-ance premiums and the multiple
factors that affect them (including health care expenditure; benefi-ciary, group, and market charac-teristics; benefit design; and the regulatory environment) see Con-gressional Research Service, Pri-vate Health Insurance Premiums and Rate Reviews, 2011; American Academy of Actuaries, Critical Is-sues in Health Reform: Premium Setting in the Individual Market, 2010; and Congressional Budget Office, Key Issues in Analyzing Ma-jor Health Insurance Proposals, Chapter 3, Factors Affecting Insur-ance Premiums, 2008.8-10
Changes in 2012
HCCI’s analytic methodology un-derwent a number of changes to enhance reporting for the 2012 Health Care Cost and Utilization Report.
Data changes. In the 2012 report, new data were provided for 2007-2012 from the data contributors, resulting in changes in the mem-bership, expenditures, utilization, and prices in all years. This is an unavoidable consequence of up-dating and refining the dataset over time. As a result, the trends reported in the 2012 report are somewhat different from those in the 2011 report.
The data were adjusted to account for new and revised data for 2012. For the 2012 analytic dataset, 2010 data was considered com-plete and no actuarial adjustment was performed. The 2011 and 2012 claims were completed using the new data. The average intensi-ty weights were changed for some of the outpatient and professional procedure subservice categories due to improved imputation for
missing weights and to the intro-duction of some new weights in 2012.
Analysis changes. For the 2012 re-port, HCCI changed the analytical age groupings to correspond to Affordable Care Act provision ena-bling children through age 25 to be covered on their parents’ insur-ance for qualifying plans. HCCI excluded data from Puerto Rico along with other U.S. territories, thus limiting reporting to spend-ing for individuals residing in the 50 U.S. states and the District of Columbia. In response to public inquires about the data, HCCI en-hanced the reporting on prescrip-tions, and for the first time report-ed on trends by gender.
Citation for 2012 report
Please use the following when cit-ing the 2012 Health Care Cost and Utilization Report. Citation style is MLA.
“2012 Health care cost and utiliza-tion report.” Health Care Cost In-stitute, Inc (2013):1-25. [Internet]. Washington (DC): HCCI; 2013 Sep. Available from: http://www.healthcostinstitute.org/files/HCCI_HCCUR2012.pdf
Endnotes
1. Yamamoto, Dale H. "Health Care Costs - From Birth to Death." Health Care Cost Institute (2013): 1-39. So-ciety of Actuaries. Web. 26, Aug. 2013.
2. Health Care Cost Institute. Health care cost and utili-zation report: 2010[Internet]. Washington
(DC): HCCI; 2013 Sep. Available from: http://www.healthcostinstitute.org/files/HCCI_HCCUR2010.pdf
3. Health Care Cost Institute. Health care cost and utili-zation report: 2011[Internet]. Washington (DC): HCCI; 2013 Sep. Available from: http://www.healthcostinstitute.org/files/HCCI_HCCUR2011.pdf
4. Health Care Cost Institute. 2012 Health care cost and utilization report analytic methodology [Internet]. Washington (DC): HCCI; 2013 Sep. Available from: http://www.healthcostinstitute.org/files/HCCI_HCCUR2011.pdf
5. Health Care Cost Institute, Inc. Aggregated ESI cost and utilization dataset (2007-2012). Washington (DC): Health Care Cost In-stitute 2013.
6. Some prescription claims could not be categorized as brand or generic. HCCI included them in overall prescription metrics, but did not include them in the subservice analyses.
7. Dunn, Abe, Eli Liebman, and Adam Hale Shapiro. Forthcoming 2014. "Developing a Framework for Decomposing Medical-Care Expenditure Growth: Exploring Issues of Repre-sentativeness." In Measur-ing Economic Sustainabil-
ity and Progress, Confer-ence on Research in In-come and Wealth, edited by Dale W. Jorgenson, J. Steven Landefeld, and Paul Schreyer. Chicago: Univer-sity of Chicago Press.
8. Congressional Research Service. Private Health Insurance Premiums and Rate Reviews [Internet]. Washington (DC): CRS; 2011 Jan [cited 2012 May 11]. Available from: http://assets.opencrs.com/rpts/R41588_20110111. pdf.
9. American Academy of Ac-tuaries. Critical Issues in Health Reform: Premium Setting in the Individual Market [Internet]. Wash-ington (DC): AAA; 2010 March [cited 2012 May 11]. Available from: http://www.actuary.org/pdf/health/premiums_mar10.pdf
10. Congressional Budget Of-fice. Key Issues in Analyz-ing Major Health Insurance Proposals, Chapter 3, Fac-tors Affecting Insurance Premiums [Internet]. Washington (DC): CBO; 2008 December [cited 2012 May 11]. Available from: http://www.cbo.gov/sites/default/files/cbofiles/ftpdocs/99xx/doc9924/ 12-18-keyissues.pdf.
Most of the dollars spent on health care have historically been spent on professional procedures and inpatient care. That trend appears to be changing as more dollars are spent on outpatient care.
Between 2010 and 2012, expenditures per capita for insureds younger than age 65 and covered by employer-sponsored health insurance have risen by $358. About 42 percent ($152) of these additional dollars came from outpatient facility claims.
Outpatient care is also one of the most rapidly growing sources of health care expenditures for the privately insured. HCCI found that between 2010 and 2012, outpatient visit expenditures rose 14.8 percent. During the three year period, expenditures on outpatient other claims, including facility claims for imaging and radiology, increased by 10.5 percent.
The outpatient care trends observed in this report may be indicative of changes in where the insured seek care, as well as in who bears the cost of care. In future reports, the Health Care Cost Institute will examine how rising outpatient expenditures reflect changes in the health care system.
To learn more, visit
www.healthcostinstitute.org
Copyright 2012 Health Care Cost Institute Inc. Unless explicitly noted, the content of this report is licensed under a
Creative Commons Attribution Non-Commercial No Derivatives 3.0 License