Health differences in Kainuu and other Europe -from global to local- 26.03.22 DART inequalities 2012 / Kaikkonen 1 ”Medicine is a social science, and politics is nothing but medicine at a larger scale” -Rudolf Virchow, 1848
Transcript
Health differences in Kainuu and other Europe
-from global to local-
18.04.23 DART inequalities 2012 / Kaikkonen 1
”Medicine is a social science, and politics is nothing but medicine at a larger scale”-Rudolf Virchow, 1848
Description of Public Health
• ”Medicine is a social science, and politics is nothing but medicine at a larger scale”– Rudolf Virchow, 1848
• Society´s obligation to assure the conditions for people´s health– Gostin 2001
• ”… yhteiskunnallisen edistyksen luonnollinen taipumus on saattaa henkisen ja ruumiillisen työn harjoittajat parempaan tasa-arvoon keskenänsä.” Societies develoment´s natural tendency is to bring the mental and physical work of practitioners to greater equality among each other
– Yrjö-Sakari Yrjö-Koskinen 1874
18.04.23 DART inequalities 2012 / Kaikkonen 2
Life Expectancy: differences world-wide
18.04.23 DART inequalities 2012 / Kaikkonen 3
WHO 2008
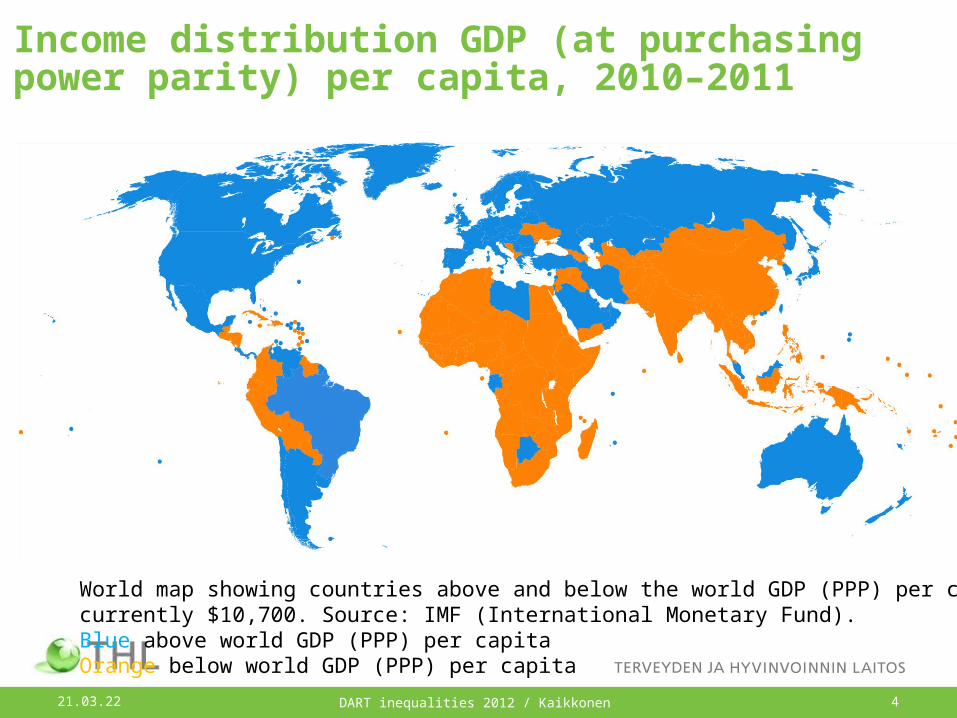
Income distribution GDP (at purchasing power parity) per capita, 2010–2011
18.04.23 DART inequalities 2012 / Kaikkonen 4
World map showing countries above and below the world GDP (PPP) per capita, currently $10,700. Source: IMF (International Monetary Fund).Blue above world GDP (PPP) per capitaOrange below world GDP (PPP) per capita
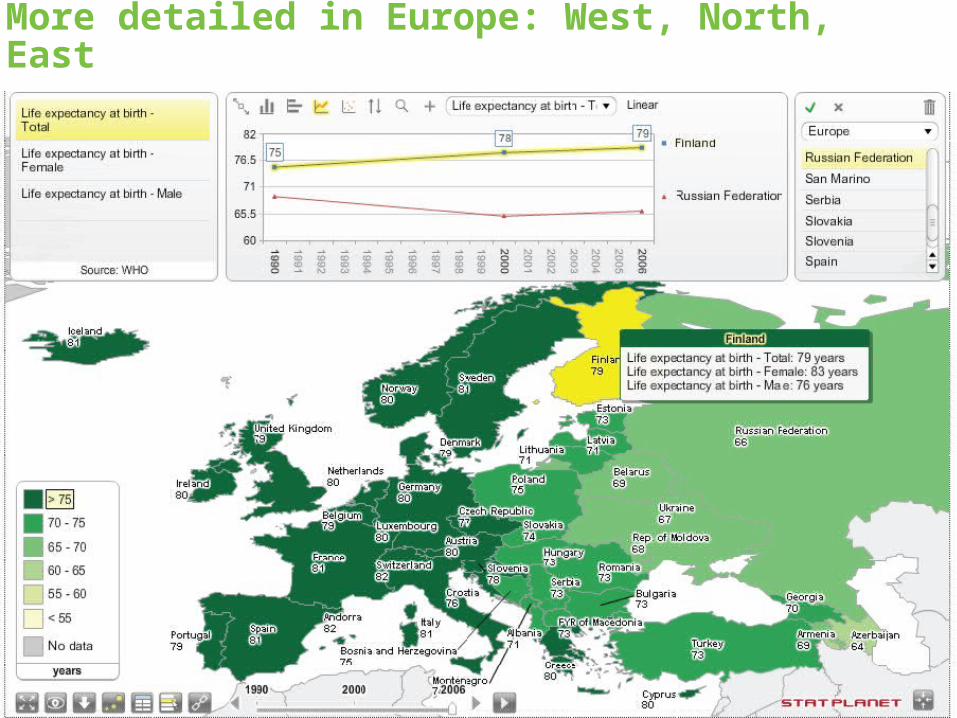
More detailed in Europe: West, North, East
18.04.23 DART inequalities 2012 / Kaikkonen 5
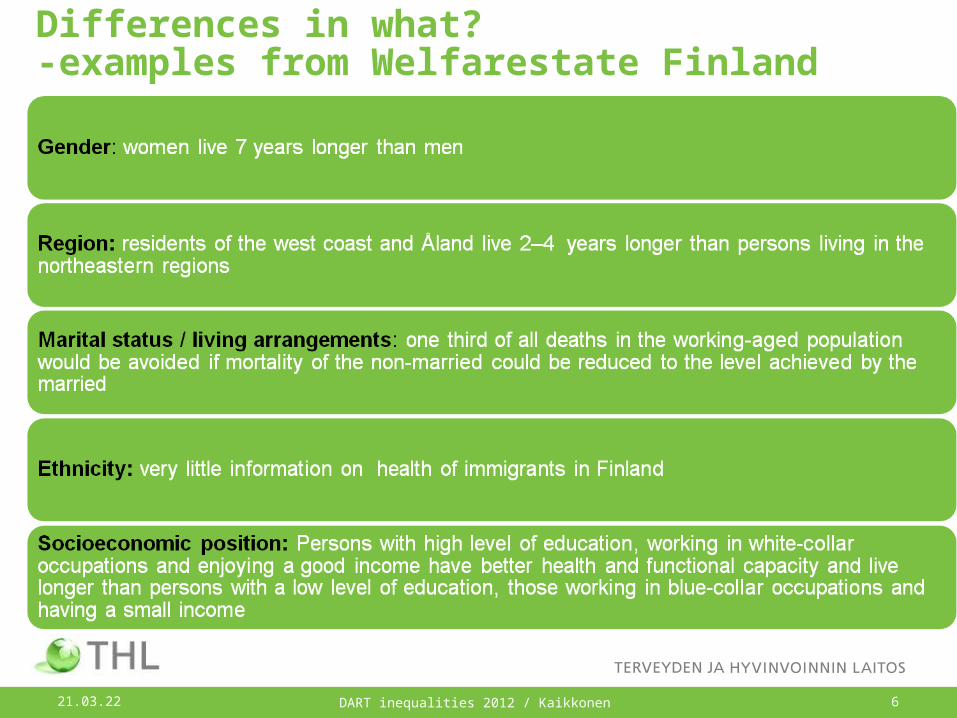
Differences in what? -examples from Welfarestate Finland
18.04.23 6DART inequalities 2012 / Kaikkonen
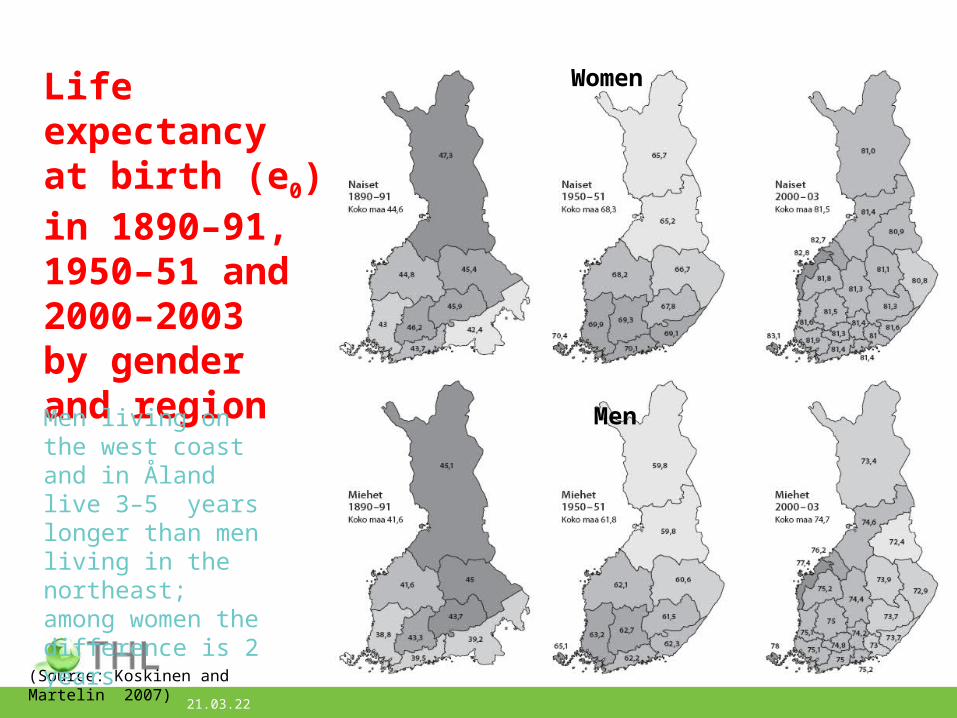
Life expectancy at birth (e0) in 1890–91, 1950–51 and 2000–2003 by gender and region
(Source: Koskinen and Martelin 2007)
Women
MenMen living on the west coast and in Åland live 3–5 years longer than men living in the northeast;among women the difference is 2 years
18.04.23
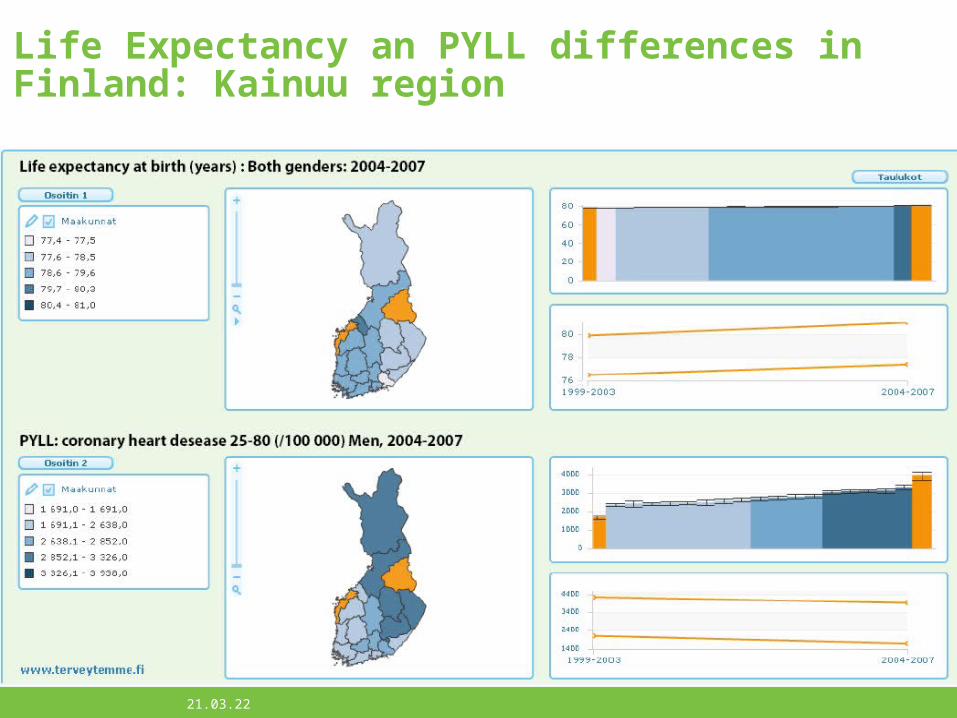
Life Expectancy an PYLL differences in Finland: Kainuu region
18.04.23
Relative mortality by living arrangements and number of children aged 17 or less, persons aged 30–64 (standardized for age and socio-economic characteristics)
(Source: Koskinen et al. 2007)
Living with a spouse (in marriage) and having children is associated with low mortality
18.04.23
18.04.23 DART inequalities 2012 / Kaikkonen 10
10
Life-expectancy trend among men and women at the age 35 during period 1988-2007 according to income fifths
Tarkiainen et al. 2011
18.04.23 DART inequalities 2012 / Kaikkonen 11
POTENTIAL: Proportion (%) of selected public health problems that would be avoided in Finland if the prevalence of the problem in the rest of the population would be as low as among those with tertiary level of education
Health problem Proportion (%) of cases avoided
Respiratory deaths 50–75Alcohol deaths 50–60Need for daily help due to restrictions in functional capacity 50Coronary heart disease deaths 30–50Accidental/violent deaths 20–45Diabetes 30Back disorders 30Osteoarthritis of knee/hip 30Stroke deaths 20–40Cancer deaths 20–30Impaired vision/hearing 20Disturbing allergy 10
Koskinen & Martelin 2007
Riddle me this and riddle me that –but who is getting and what?
One of the great riddles of public health:
– despite prosperity, more equal income distribution, welfare state, equal access to health care, …
• persisting, even widening health inequalities between socioeconomic groups
(Mackenbach 2010, presentation in Helsinki)
18.04.23 DART inequalities 2012 / Kaikkonen 12
13
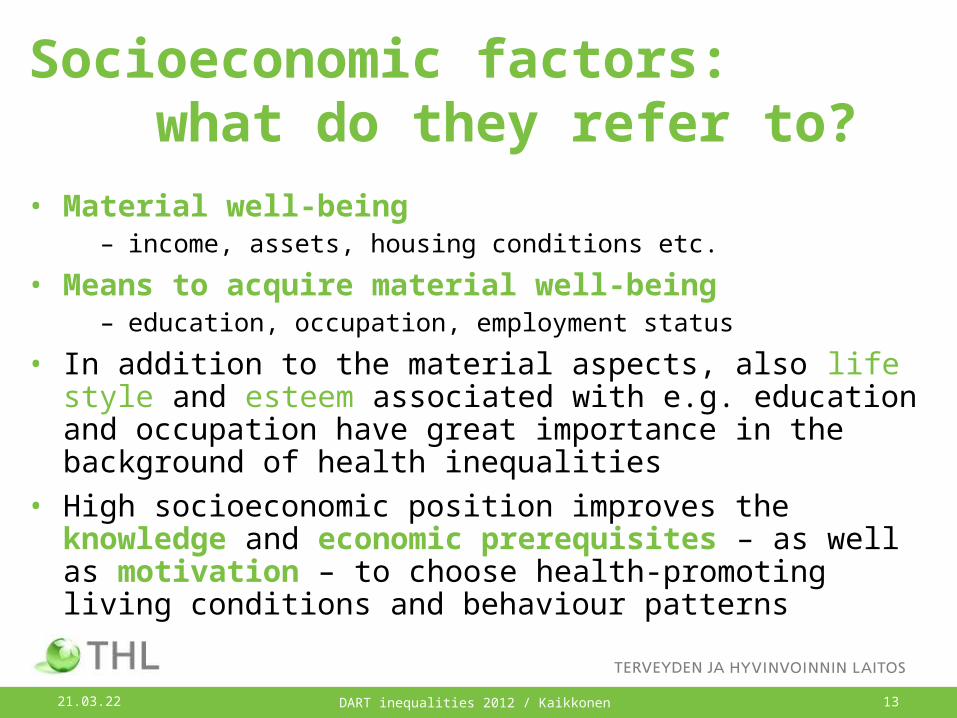
• Material well-being– income, assets, housing conditions etc.
• Means to acquire material well-being– education, occupation, employment status
• In addition to the material aspects, also life style and esteem associated with e.g. education and occupation have great importance in the background of health inequalities
• High socioeconomic position improves the knowledge and economic prerequisites – as well as motivation – to choose health-promoting living conditions and behaviour patterns
Socioeconomic factors: what do they refer to?
18.04.23 DART inequalities 2012 / Kaikkonen
We should influnce these in global and in local decision making
18.04.23 DART inequalities 2012 / Kaikkonen 14
Need for global andlocal information is obvious
Health inequalities in Europe
18.04.23 DART inequalities 2012 / Kaikkonen 15
Several action plans to reduce inequalities in health –but more needed
18.04.23 DART inequalities 2012 / Kaikkonen 16
• Britain: Independent Inquiry (1998) etc.
• Netherlands: Albeda committee (2001)
• Sweden: Public Health Commission (2002)
• Norway: National Strategy (2006)
• Finland: National Action Plan (2008)
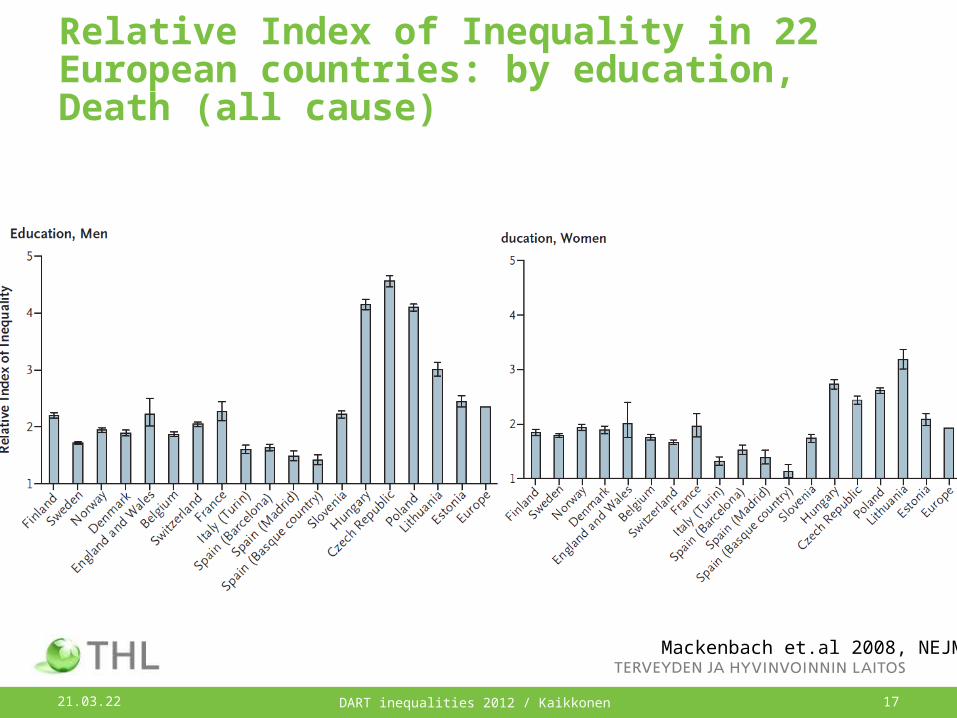
Relative Index of Inequality in 22 European countries: by education, Death (all cause)
18.04.23 DART inequalities 2012 / Kaikkonen 17
Mackenbach et.al 2008, NEJM
18.04.23 DART inequalities 2012 / Kaikkonen 18
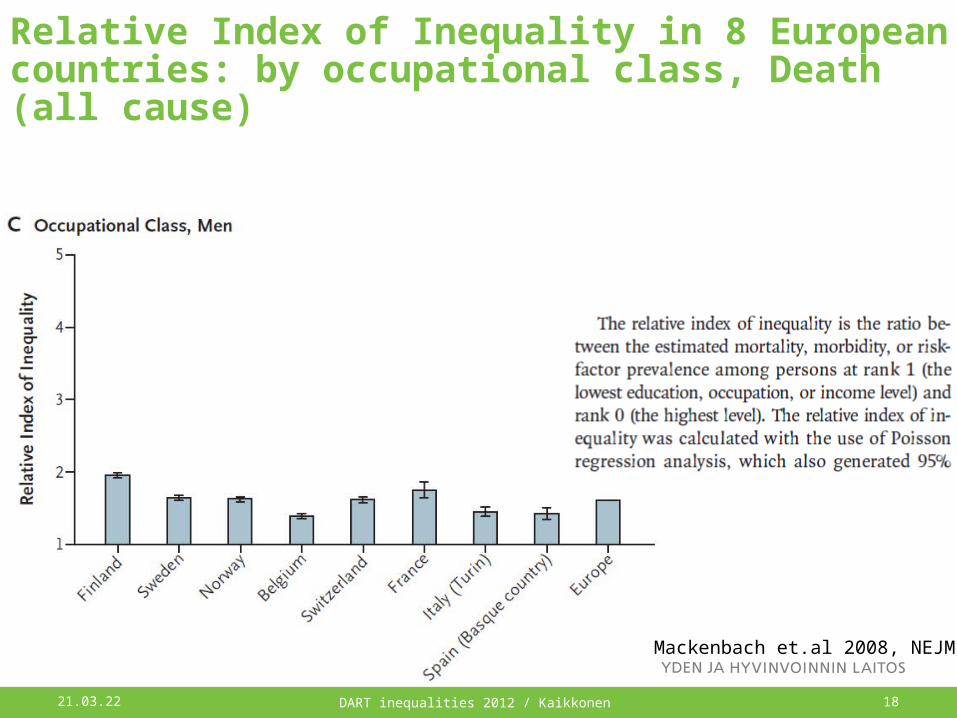
Relative Index of Inequality in 8 European countries: by occupational class, Death (all cause)
Mackenbach et.al 2008, NEJM
18.04.23 DART inequalities 2012 / Kaikkonen 19
Relative Index of Inequality in 22 European countries: by education, Self-rated health
Mackenbach et.al 2008, NEJM
Health inequalities in Kainuu
18.04.23 DART inequalities 2012 / Kaikkonen 20
18.04.23 DART inequalities 2012 / Kaikkonen 21
Background: health inequalities
• The overall status of health in Finland has improved significantly over the past decades.– However health inequalities have increased– Big differences in mortality between socioeconomic groups in
Finland compared to many European countries
• Government Resolution on the national 'Health 2015 public health programme' (2001)– One key target to reduce inequalities in mortality by a fifth by the
year 2015
• The Ministry of Social Affairs and Health has published (2008) the National Action Plan to Reduce Health Inequalities 2008-2011
• Identification for relevance of area level information for decision makers and palnners (Kaikkonen et.al2008; Murto et.al2009)– Eye opening
Context: Finnish welfare state and responsibilities for THL and municipalities
• Finland is a modern Nordic welfare that was build up to provide social security for the whole population, a safety network– However Finnish welfare state has not accomplished to reduce inequalities in health and welfare
(Palosuo et. al 2009)
– Moreover area level differences in health and welfare in Finland are still visible
• National institute for health and welfare has obligatory resposibility to analyze and monitor the welfare of the population and health, the factors affecting them and their problems, prevalence of the problems and prevention opportunities, and develop and promote measures to promote health and well-being and reduce the problems. (Act of National institute for health and welfare § 2).
• “Finnish municipalities and cities have broad responsibilities in providing their citizens with social and health care services, education and cultural services, in supervising activities affecting the environment, in promoting employment and commerce, and in arranging preventive work. Moreover, the 2006 revised Primary Health Care Act obligates municipalities to follow the health of their population and its subgroups.” (Kaikkonen et al. 2008)
– Obligation revisited in Healthcare act 2010 (§12)
18.04.23 DART inequalities 2012 / Kaikkonen 22
Socioeconomic inequalities in KAINUU: from gradle to grave
18.04.23 DART inequalities 2012 / Kaikkonen 23
Kainuu has been a national pilot for local level information: available information
• Various existing national register and survey data have been used in the report. Information on the working-aged population in Kainuu is most extensive but also children, adolescents and the elderly have been covered when possible. Actors in Kainuu have been interviewed to supplement the results. – The report also includes strategic guidelines to reduce
socioeconomic health inequalities defined by the health and social sector of the Joint authority of Kainuu region.
• The health of the Kainuu population has improved over the past decades but socioeconomic health inequalities are generally wider than in Finland on average. – Poor health and risky health behaviour are more common and
mortality is higher among the lower educational groups.
18.04.23 DART inequalities 2012 / Kaikkonen 24
Kaikkonen et. al 2008
• During years 2007–2008, was carried out by Institute for Health and Welfare (THL) Child Health Monitoring Development project (LATE) data collection of 10 child healthcare units and school health services in normal children health monitoring. – In addition, during the years 2007–2009 were collected also
substudies in the City of Turku and the region of Kainuu as part of joint project of THL’s and
– In the data collection the target age-groups were half-, one-, three-, and fi ve years of age, and from the school healthcare services of the first, fifth and eighth (or 9) grade students. In this report we use these data-sets to
• To examine health and welfare inequalities among children and their families.
18.04.23 DART inequalities 2012 / Kaikkonen 25
Kainuu has been a national pilot for local level information: sewing gaps
Kaikkonen et. al 2012
Flying finns… experiences from municipalitiesEvidence based policy
TEROKA, INDI, ATH, LATE etc. We know from arealevel co-operation:
• Area-level information (data) speaks to decision makers
• Waking up with local info really works!
• Easy reachable and understandable results are worthy
• Co-operation and networks are possible over the normal structure using information , not only feelings
• Goals go through to strategies
• Commitment is possible
18.04.23 26DART inequalities 2012 / Kaikkonen
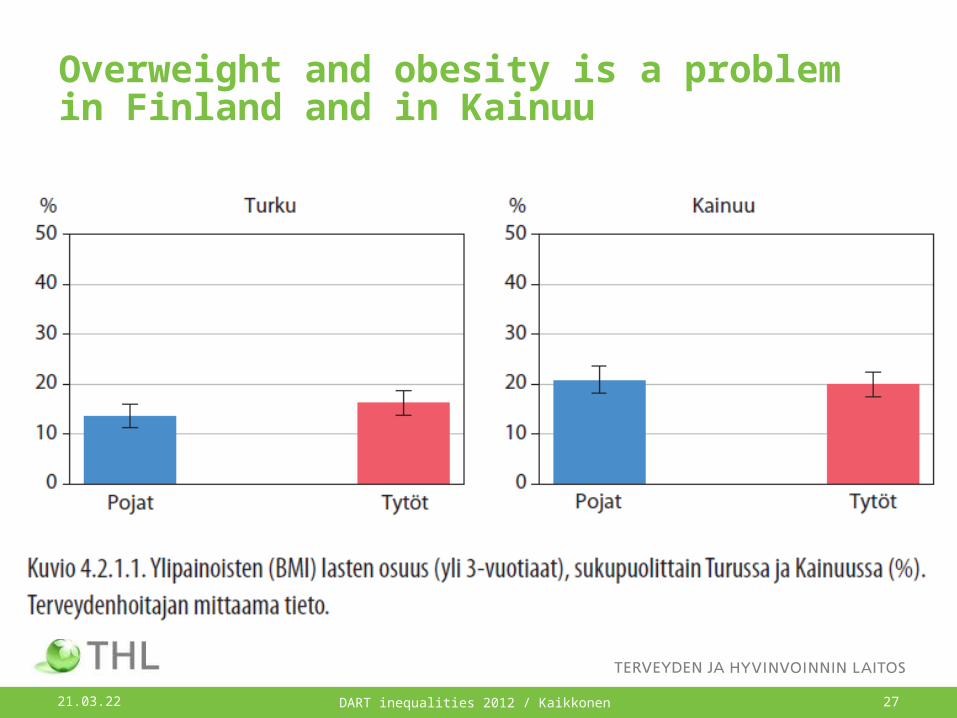
Overweight and obesity is a problem in Finland and in Kainuu
18.04.23 DART inequalities 2012 / Kaikkonen 27
Mothers education is associated with it
18.04.23 DART inequalities 2012 / Kaikkonen 28
Smoking: high schoolers and vocational education in Kainuu
18.04.23 DART inequalities 2012 / Kaikkonen 29
Kaikkonen et. al. 2008
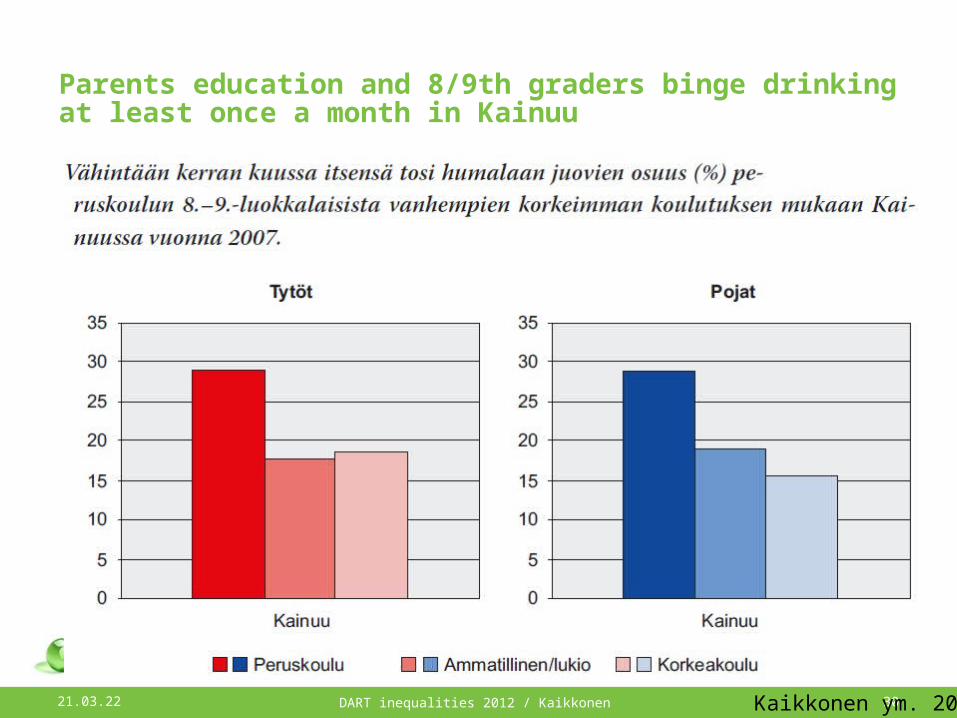
Parents education and 8/9th graders binge drinking at least once a month in Kainuu
18.04.23 DART inequalities 2012 / Kaikkonen 30Kaikkonen ym. 2008
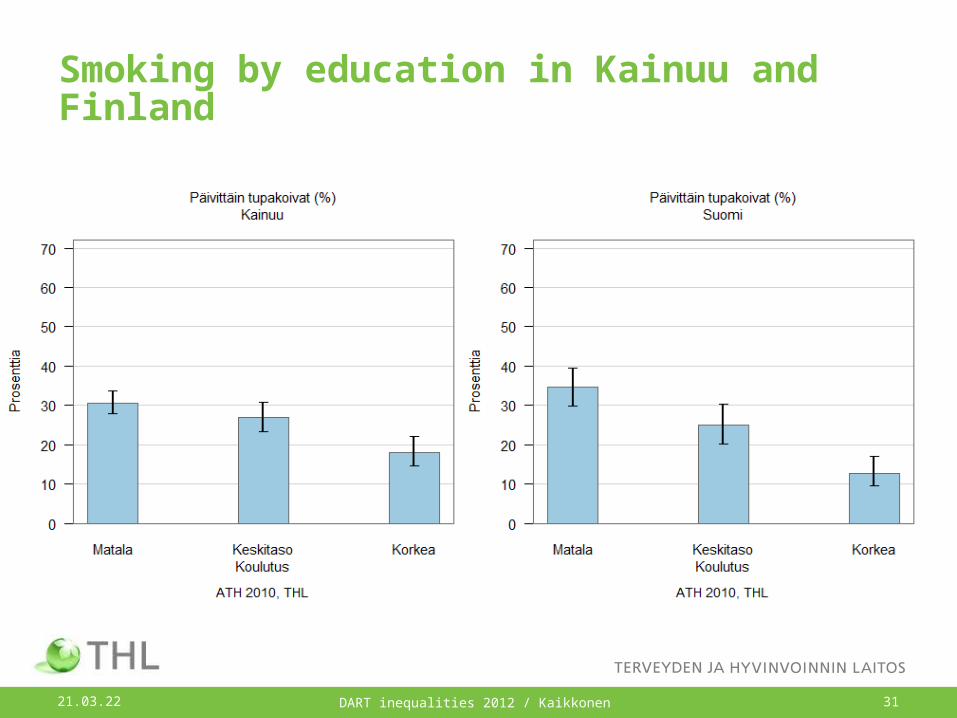
Smoking by education in Kainuu and Finland
18.04.23 DART inequalities 2012 / Kaikkonen 31
Quality of life (WHO-QOL-bref) by education in Kainuu and Finland
18.04.23 DART inequalities 2012 / Kaikkonen 32
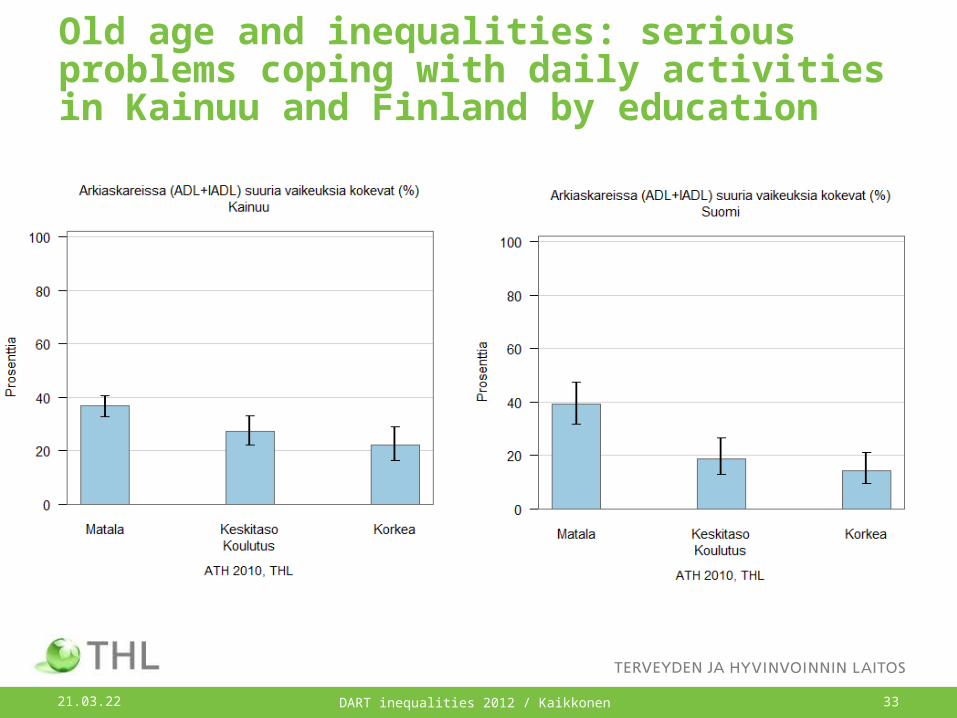
Old age and inequalities: serious problems coping with daily activities in Kainuu and Finland by education
18.04.23 DART inequalities 2012 / Kaikkonen 33
Motivation
• Local authorities need information by population group in order to be able to evaluate service needs, orient actions, allocate resources and monitor the attainment of goals.
18.04.23 DART inequalities 2012 / Kaikkonen 34
18.04.23 DART inequalities 2012 / Kaikkonen 35
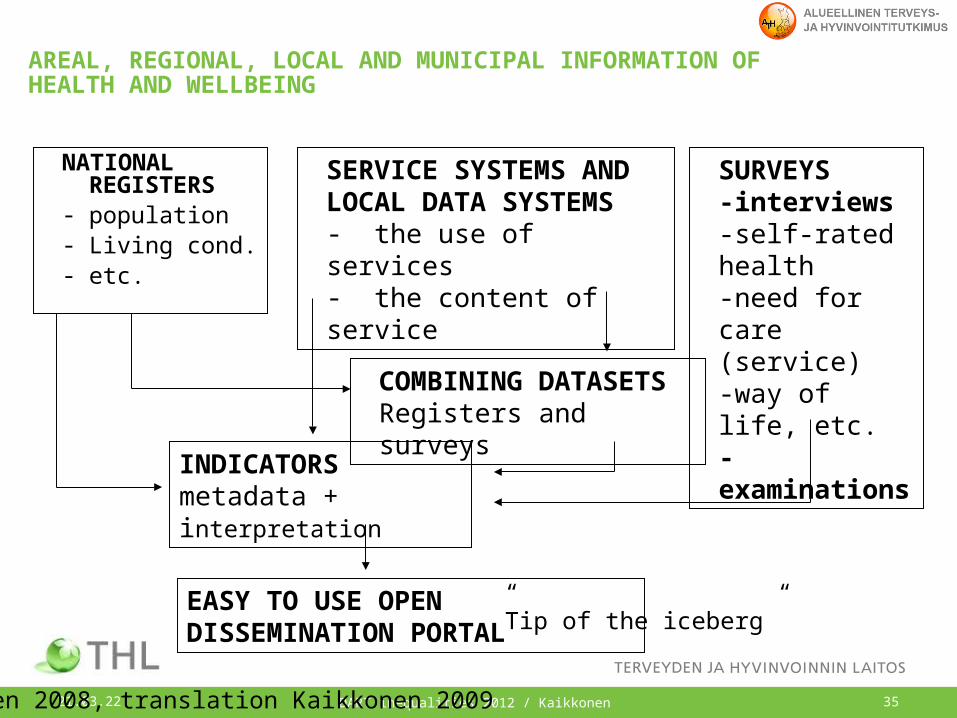
AREAL, REGIONAL, LOCAL AND MUNICIPAL INFORMATION OF HEALTH AND WELLBEING
NATIONAL REGISTERS
- population- Living cond.- etc.
SURVEYS-interviews-self-rated health-need for care (service)-way of life, etc. -examinations
SERVICE SYSTEMS AND LOCAL DATA SYSTEMS- the use of services - the content of service
COMBINING DATASETS Registers and surveys
INDICATORS metadata + interpretation
EASY TO USE OPEN DISSEMINATION PORTAL
Koskinen 2008, translation Kaikkonen 2009
”Tip of the iceberg”
The current situation
• National level monitoring with socioeconomic status is internationally comparable– Children’s (aged 0-13) health monitoring is lacking
• Questionnaire-based data on lifestyles and citizens’ personal experiences are often not available at the local level or even at the regional level.
• Monitoring data available, mainly derived from various data files and usually are not analysed by population group in the area level.
18.04.23 DART inequalities 2012 / Kaikkonen 36
18.04.23 DART inequalities 2012 / Kaikkonen 37
ATH:n motto:
Regional Health and Well-being study ATH
18.04.23 DART inequalities 2012 / Kaikkonen 38
National area level adult Health and Well-being survey, ATH• Area level monitoring is needed for effective national level policy
making
• Monitoring factors affecting the health and well-being in area level and local populations and their sub-groups, – Compare data with those of other regions or of the country as a whole,
or against the goals set.
• ATH will further collect monitoring information which is significant for the orienting of health promotion measures and the evaluation of their effectiveness
• ATH will also improve the technical implementation of the stages of the questionnaire study, aiming at a process – minimising the requirement for manual labour and enabling rapid
reporting.
Regional Health and Well-being study ATH
• Pilot 34 000 Finnish age 20+ in Kainuu (9000), Turku (9000), Southern Ostrobotnia (8000), Keski-Satakunta (3000) and representative sample of Finland (5000)
• THL will nationalize the ATH-study, years 2012–2014– 150 000+ finns
– Covering also ethnic groups 2014 (based on the maamu-study)
– Areas can also add their samples to fill the needs
18.04.23 DART inequalities 2012 / Kaikkonen 39
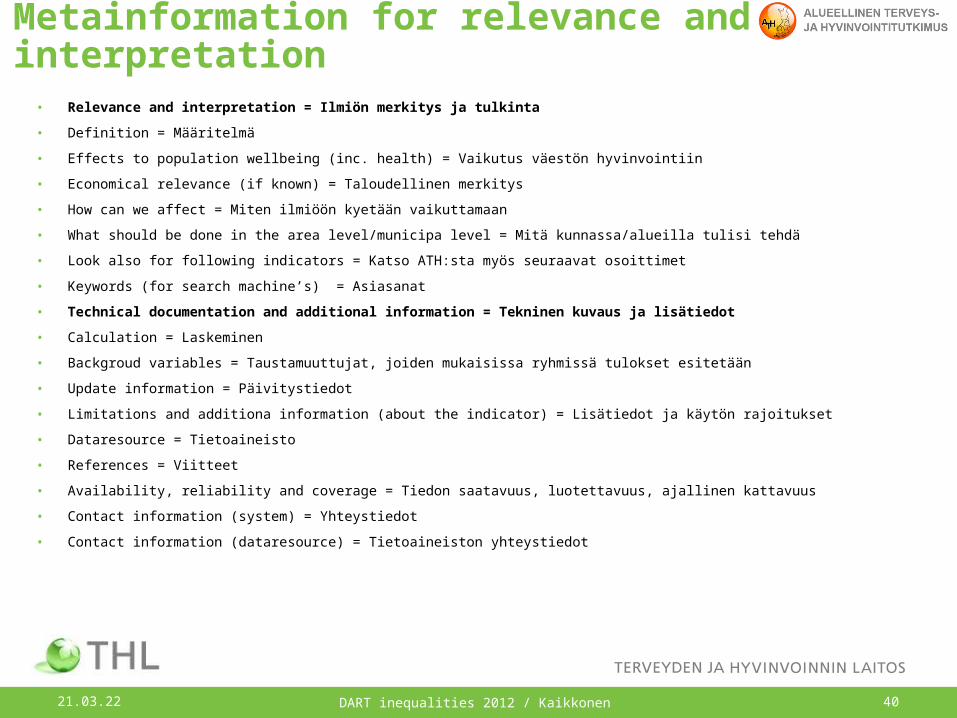
Metainformation for relevance and interpretation• Relevance and interpretation = Ilmiön merkitys ja tulkinta
• Definition = Määritelmä
• Effects to population wellbeing (inc. health) = Vaikutus väestön hyvinvointiin
• Economical relevance (if known) = Taloudellinen merkitys
• How can we affect = Miten ilmiöön kyetään vaikuttamaan
• What should be done in the area level/municipa level = Mitä kunnassa/alueilla tulisi tehdä
• Look also for following indicators = Katso ATH:sta myös seuraavat osoittimet
• Keywords (for search machine’s) = Asiasanat
• Technical documentation and additional information = Tekninen kuvaus ja lisätiedot
• Calculation = Laskeminen
• Backgroud variables = Taustamuuttujat, joiden mukaisissa ryhmissä tulokset esitetään
• Update information = Päivitystiedot
• Limitations and additiona information (about the indicator) = Lisätiedot ja käytön rajoitukset
• Dataresource = Tietoaineisto
• References = Viitteet
• Availability, reliability and coverage = Tiedon saatavuus, luotettavuus, ajallinen kattavuus
• Contact information (system) = Yhteystiedot
• Contact information (dataresource) = Tietoaineiston yhteystiedot
18.04.23 DART inequalities 2012 / Kaikkonen 40
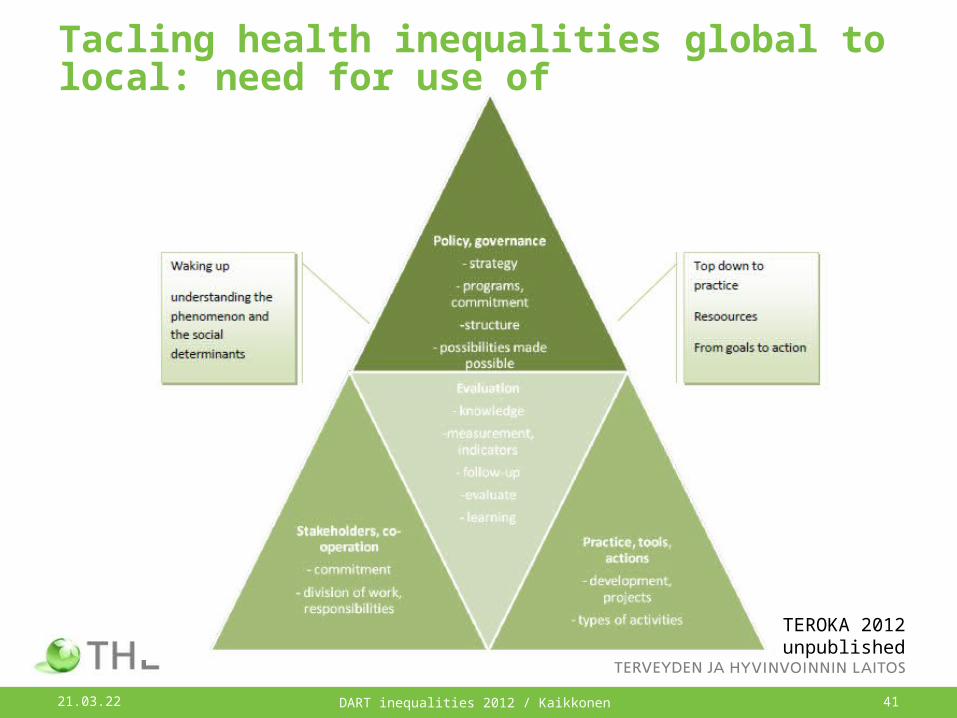
Tacling health inequalities global to local: need for use of
18.04.23 DART inequalities 2012 / Kaikkonen 41
TEROKA 2012unpublished
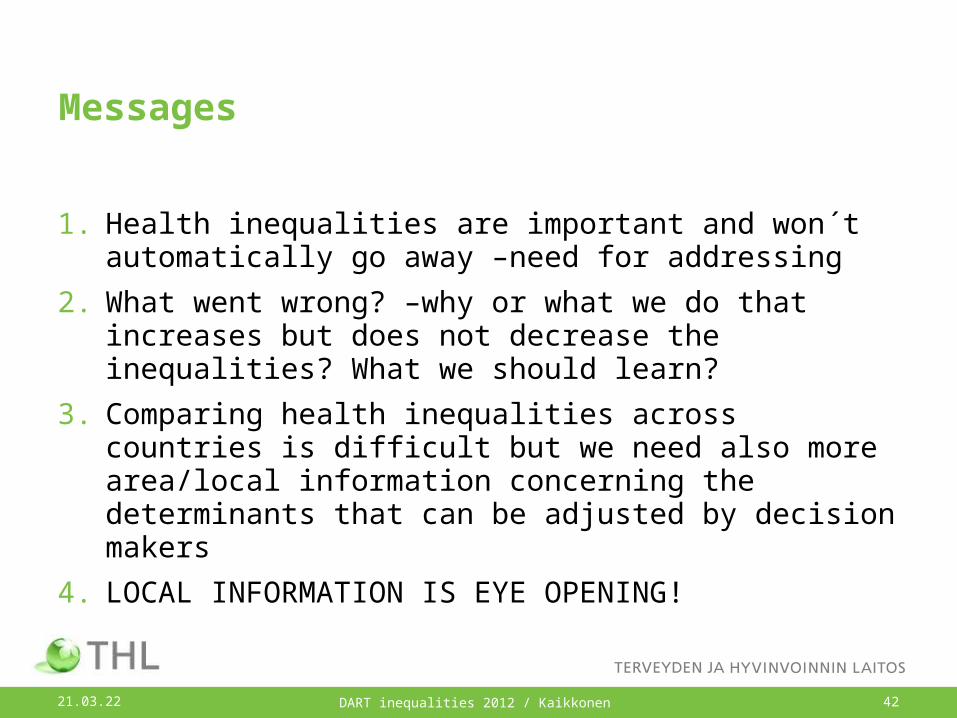
Messages
1. Health inequalities are important and won´t automatically go away –need for addressing
2. What went wrong? –why or what we do that increases but does not decrease the inequalities? What we should learn?
3. Comparing health inequalities across countries is difficult but we need also more area/local information concerning the determinants that can be adjusted by decision makers
4. LOCAL INFORMATION IS EYE OPENING!
18.04.23 DART inequalities 2012 / Kaikkonen 42
18.04.23 DART inequalities 2012 / Kaikkonen 43
Kiitos mielenkiinnostanne!Thank you for your attention!
Risto KaikkonenDevelopment managerTHL/ATHp. 029 524 [email protected]