40
A Report from the Office of the Chief Medical Officer of Health Department of Health February 2016 Health Inequities in New Brunswick OPTIMAL HEALTH
A Report from the Office of the Chief Medical Officer of HealthDepartment of HealthFebruary 2016
Health Inequities in New Brunswick
OPTIMAL HEALTH

Office of the Chief Medical Officer of Health New Brunswick Department of Health P.O. Box 5100 Fredericton, New Brunswick E3B 5G8 Canada
Prepared by: Hao Wang, Teri Emrich and Maurice Collette. With contributions from: Mary-Clare White, Executive Council Office, and Kim Blinco and Karen White-Masry, Office of the Chief Medical Officer of Health.
Guidance and feedback from Dr. Cristin Muecke, Medical Officer of Health - Provincial Programs, are gratefully acknowledged.
February 2016 ISBN 978-1-4605-0981-4 (Bilingual print edition) ISBN 978-1-4605-0982-1 (PDF: English edition) Printed in New Brunswick.
This report is available online: www.gnb.ca/publichealth
About the cover: The illustration on the front cover depicts two individuals with differing opportunities for health. The person on the stairs with a briefcase signifies a healthier person with good resources (education, adequate income, etc) who has easy access to ways of achieving optimal health, whereas the person facing the wall experiences poorer health, in part because of limited access to any ways of achieving optimal health.
Ce document est aussi disponible en français sur le site Web du Bureau du médecin-hygiéniste en chef du Nouveau-Brunswick (www.gnb.ca/santepublique) sous le titre « Les iniquités en matière de santé au Nouveau-Brunswick ».

Table of Contents
Summary....................................................................................................................................................................................... 1
Introduction................................................................................................................................................................................. 3
Methods......................................................................................................................................................................................... 6
Health inequities in New Brunswick.................................................................................................................................... 7
Inequities in access to resources and opportunities for health......................................................................... 7
Food security................................................................................................................................................................ 7
Health behaviours...................................................................................................................................................... 8
Access to health care.............................................................................................................................................. 12
Inequities in the distribution of selected chronic diseases and risk factors............................................... 14
Inequities in self-perceived health and mental health....................................................................................... 20
Inequities in health and health determinants among health regions.......................................................... 23
Discussion................................................................................................................................................................................... 25
Policy considerations...................................................................................................................................................... 26
What Public Health can do to address health inequities........................................................................... 29
What health-care providers can do in a clinical setting to address health inequities.................... 29
What non-health sectors can do to address health inequities................................................................ 30
Conclusion.................................................................................................................................................................................. 31
References.................................................................................................................................................................................. 32


Health Inequities in New Brunswick
1
Summary
What do we know about health inequity• Health inequities are systematic and unfair differences in health status between groups that
occupy different positions on the social hierarchy, where the more socially disadvantaged groups experience poorer health.
• Health inequities affect people at every level of the social strata.
• Due to their roots in economic and social structures, the task of addressing health inequities requires full participation of public health and the health-care systems, as well as non-health sectors of government, the private and non-profit sectors and citizen stakeholders.
What are the key findings of this report• Results suggest a trend toward a decrease in food insecurity with every increase in the income
hierarchy.
• Inequities in smoking, healthy eating and active living exist between low- and high-income households, low-income households being more likely to report daily smoking and less likely to report healthy eating or being physically active. Inequities in healthy eating also exist between individuals with different levels of educational attainment, the least educated being less likely to report healthy eating.
• Government-funded home-care services offered in New Brunswick are accessed primarily by low-income families. However, data from the Canadian Community Health Survey show that low-income Canadians are more likely to report they felt they did not receive health care needed in the past year.
• New Brunswick’s lowest income households are more likely to report being afflicted with cancer, heart disease, chronic obstructive lung disease or diabetes, and having high blood pressure or classified being obese. Self-reported cancer and diabetes also differ by level of education. Those without a high school diploma experience higher rates of cancer and diabetes than those with post-secondary graduation.
• New Brunswickers with low-income and education levels perceive their overall health and mental health as poorer compared to the most affluent households and the more educated.
• Inequities in access to the social determinants of health appear between the northern and the southern parts of the province, residents in the north having more limited access than those living in the south.

Health Inequities in New Brunswick
2
What can be done to reduce health inequities in New Brunswick• The public health system can direct its efforts upstream to address the fundamental social and
economic structures that cause health inequities. Public Health can promote health equity by:
» assessing and reporting on the existence (and impact) of health inequities and on effective strategies to reduce these inequities;
» modifying and orienting interventions and services to reduce inequities;
» leading, supporting and participating with other organizations in policy analysis and development, and in advocacy for improved health determinants and reduced health inequities;
» partnering with other government and community organizations to improve health outcomes for populations that experience marginalization; and
» applying an equity lens to the development of healthy public policies and to health impact assessments.
• Health-care providers can promote health equity by screening patients for poverty and by helping to improve their patients’ access to health and social services.
• Stakeholders outside of health-care, be they in other government departments, the private or voluntary sectors, can collaborate with the health sector to create the conditions for reducing health inequities through policy, programs as well as information and resource sharing.

Health Inequities in New Brunswick
3
Introduction
Canada is often viewed as having one of the best universal health care systems in the world [1] and being a world leader in population health. [2] So why is it that the health of many Canadians continues to be far from ideal?
Each year, an estimated 20 per cent of the $200 billion Canada spends on health care can be attributed to socio-economic disparities. [3] It is normal to observe inequalities or disparities in health across the nation due to naturally occurring variation in genetics and constitution between individuals. However, not all health inequalities arise from these variations. Some are due to differences in access to resources and opportunities for health between social groups. [4] These systematic and unfair differences in health status between groups that occupy different positions on the social hierarchy, where the more socially disadvantaged group experiences poorer health, are known as health inequities. Disadvantaged groups and communities may be distinguished by their race/ethnicity, skin colour, religion, language or nationality; their income, education or occupation (i.e., socio-economic status); their gender, sexual orientation or gender identity; their age, geography, disability status, mental health, illness, political or other affiliation; or other characteristic associated with discrimination, marginalization or exclusion from economic and social opportunities. [5-11] The strongest predictors of health inequities in Canada are socio-economic status, gender, Aboriginal status and geographic location. [12] Reducing health inequities in this province would help New Brunswickers attain their full health potential regardless of social positions or other socially determined circumstances.
Health inequities and the social determinants of healthMany of the important forces that contribute to these inequities extend far beyond our health-care system. Socially disadvantaged groups bear the burden of health inequities because of the unfair distribution of the social determinants of health. [15] These determinants of health are the social conditions in which people are born, grow up, live, learn, work, play and age, and the systems put in place to deal with illness, shaped by political, social and economic forces. [14,16] The consequences of an unfair distribution of the social determinants of health are avoidable death, disease, disability, distress and discomfort. [12] Social determinants of health include income and social status; employment and working conditions; education and literacy; social and physical environments; culture, ethnicity and values; social support and connectedness; gender; personal health practices and coping skills; risk behaviours; early childhood development; and access to health care. [17,18]
Health inequity: Systematic and unfair differences in health status between groups that occupy different positions on the social hierarchy, where the more socially disadvantaged groups experience poorer health. [13]
Health inequality: Measureable differences in health between individuals, groups or communities. It is sometimes used interchangeably with the term “health disparities”. [14]
Social determinants of health: The interrelated social, political and economic factors that create the conditions in which people live, learn, work and play. [14]

Health Inequities in New Brunswick
4
Health inequities affect everyoneHealth inequities are important cost drivers of our health-care system and a barrier to full participation in the economy. [12] Today, the highest attainable standard of health is considered to be that enjoyed by the most socially advantaged groups. [6] There is also a social gradient where a linear decrease in health can be seen with decreasing social position. [4,12] As a province, we need to strive to achieve the highest possible standard of health for all by reducing, with the goal of eliminating, differences in health between groups with different underlying levels of social advantage.
Many health-care providers in Canada see patients every day with illnesses and injuries that could have been prevented. The result is avoidable health care and social costs, human suffering and lost productivity. Addressing the social determinants of health could reduce these unwarranted demands on our health-care, social and economic systems; pave the way to shorter waitlists for medical and surgical care, increased productivity, community involvement and economic growth; and improve health and wellness for all as more people flourish and reach their potential. Better yet, the population overall would be in better health, and the gap between the experiences of those with the best and poorest health would be smaller.
In the end, everyone – not just the more socially disadvantaged groups – benefits from reduced health inequities. This is because health inequity affects the cost and availability of health care for everyone; it affects crime and everyone’s sense of community safety; it affects whether communities thrive socially and economically; it affects tourism and our ability to attract economic investments; and it leaves less money available for new social programs and services, other social development initiatives and public priorities. [19] Basically, our individual and collective health and well-being are on the line.
Joseph had a good job in the construction business since leaving school part way through Grade 12. Although he lived alone, he liked his job and was proud of his accomplishments, including owning a truck and his own house. One day at work, a steel beam fell and landed on his leg, fracturing it badly. The company kept him on, but Joseph was no longer enjoying his job because of his impairments and chronic pain. When the company went out of business one year later, he lost his job and could not find work because of his age, disability and lack of training. Almost 42 years old, he started taking more and more pain killers and was drinking on most days as he felt lonely and depressed. Soon the bills piled up and he had to sell his truck. Eventually the bank took over his house. Joseph did not want to see his family or friends until he was back on his feet. Life on the street was hard on him, and the pain got worse. He had smoked most of his life and now had to steal or beg for cigarettes. Many times he looked for discarded butts to satisfy his cravings. His health declined due to his poor housing situation, poor nutrition and chronic smoking. Eventually, chronic smoking led him to be hospitalized with pneumonia. Lying in a hospital bed, he wondered how he had ended up where he was and where he would go when discharged from the hospital.
But it did not have to be this way. What if conditions and supports had been different at many points along the way? What if Joseph had finished school and then went on to college to get better training in a trade? Perhaps better understanding of and compliance with workplace safety practices could have prevented his injury. After his injury, what if he would have had access to retraining and entered another line of work? What if there had been supports so he could have kept his house and truck until he found a way to straighten his finances? What if he had never smoked?
Health Inequities in New Brunswick
5
Purpose of this reportTraditional health indicators measure health determinants or health status in the population, such as housing status, employment levels or diabetes prevalence. However, improvements in health determinants or health status at the population level may mask widening inequities if, for example, the indicator average is improving only through changes to wealthier members of society. Indicators of health inequity, on the other hand, are used to show the unequal distribution of a health determinant or health status in the population. Purposeful reporting of indicators of health inequity has been identified as a promising practice to reduce social inequities in health. Intentional and public presentation of evidence of health inequities can be a starting point for addressing health inequities by bringing the topic to the forefront. [20,21] This report is meant to stimulate individual and collective interest and facilitate conversations to address this important issue which affects all New Brunswickers one way or another.
The report illustrates some of the differences in health experiences of New Brunswickers based on household income quintile, showing a clear link between wealth and health; based on where people live, knowing that different parts of the province have different levels of social advantage; based on education, knowing that opportunities for health increases with education; and based on sex, knowing that women and men have different patterns of illness, risk factors, risk behaviours and health experiences.
Health Inequities in New Brunswick
6
Methods
The 2011-2012 Canadian Community Health Survey (CCHS) was chosen as the main data source as it collected a variety of information related to health outcomes, risk factors and social determinants of health for the New Brunswick population. The survey was conducted by Statistics Canada through a well-designed and controlled survey process. [22] It included a large sample of New Brunswickers and was designed to provide reliable estimates at the health region level. For administrative purposes, the province is divided geographically into seven health regions (see Figure 23, p. 24).
Across Canada, CCHS data are collected from individuals aged 12 years and older living in the 10 provinces and three territories, excluding those living on a military base, reserves and other Aboriginal settlements in the provinces, persons living in the Quebec health regions of Région du Nunavik and Région des Terres-Cries-de-la-Baie-James, the institutionalized population and full-time members of the Canadian Armed Forces. Altogether, these exclusions represent less than three per cent of the target population. [22] In the 2011-2012 CCHS, the New Brunswick sample size was 4,631, representative of its population of 643,802 aged 12 and over at the time of the survey.
The CCHS data share limitations with similar self-reported surveys. For example, respondents may have answered questions inaccurately or chose to respond in a socially acceptable way. Statistics Canada has been doing data validation on the CCHS by comparing the data with other external data sources. [23]
Data from the 2011-2012 CCHS were used to calculate prevalence rates of self-reported health, mental health, selected chronic diseases and social determinants of health based on household income quintile, education, sex or health region. Household income was a self-reported measure, and household income quintiles were established based on adjusted household income ratios to the low-income cut-off corresponding to the number of persons in the household and the size of the community, obtained by dividing the original ratios by the highest ratio for all survey respondents. The low-income cut-off was defined as the threshold at which a family would typically spend a larger portion of its income than the average family on the necessities of food, shelter and clothing. The population was divided into five income groups (or income quintiles), with about 20 per cent of the population in each group. In ascending order, quintile 1 (Q1) represents the least affluent households and quintile 5 (Q5) the most affluent.
Health Inequities in New Brunswick
7
Health inequities in New Brunswick
Inequities in access to resources and opportunities for healthAs previously noted, a complex set of factors and conditions, collectively known as the determinants of health, determine an individual’s level of health. [17] Within the province, it is clear that the determinants of health are not evenly distributed in the population. Based on the 2006 census, 13.8 per cent of New Brunswickers, including 16.4 per cent of children (<18 years old), were living in poverty that year. [24] That rate climbed to 45.4 per cent among single mothers. As of May 2015, 9.6 per cent of the labour force aged 15 and older were unemployed. [25] Only 50 per cent of New Brunswickers aged 16 and older have the literacy skills necessary to function in society. [26] Meanwhile, 29 per cent of New Brunswickers have a weak or very weak sense of belonging to their community, and 12 per cent feel very unsafe in their community. [26] New Brunswickers also experience inequities in access to resources and opportunities for health, such as food security, health behaviours and health care, based on where they live, their income and education attainment.
Food security
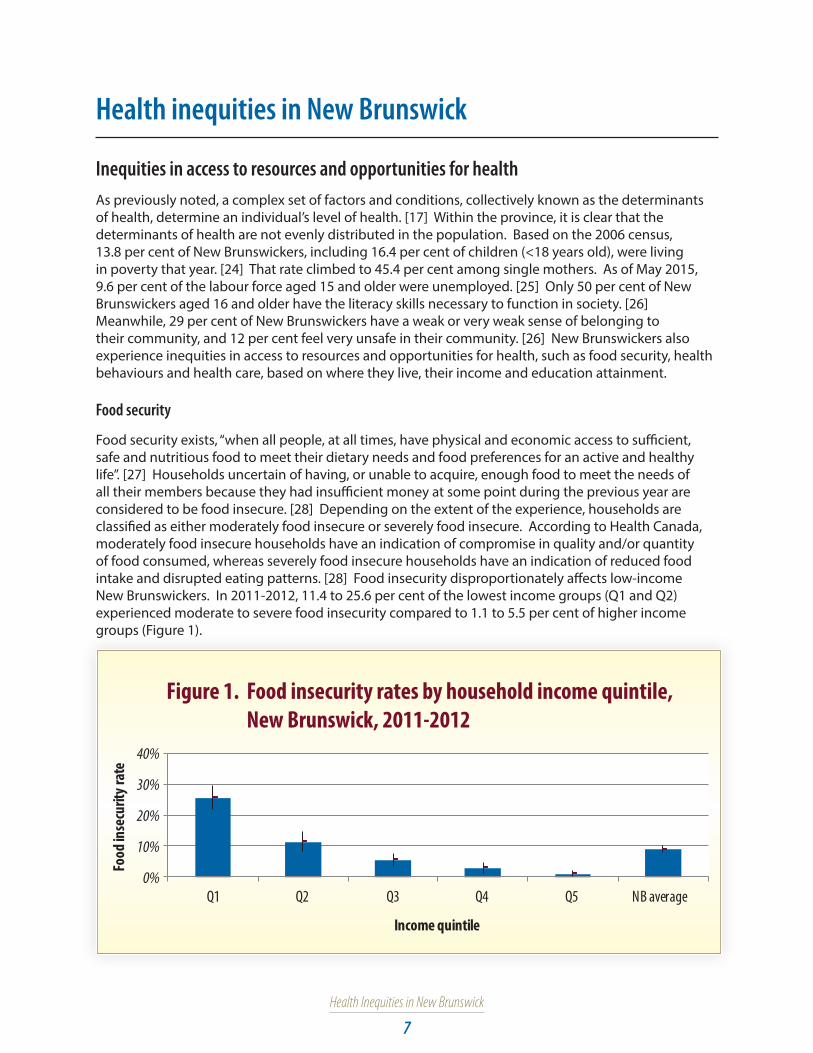
Food security exists, “when all people, at all times, have physical and economic access to sufficient, safe and nutritious food to meet their dietary needs and food preferences for an active and healthy life”. [27] Households uncertain of having, or unable to acquire, enough food to meet the needs of all their members because they had insufficient money at some point during the previous year are considered to be food insecure. [28] Depending on the extent of the experience, households are classified as either moderately food insecure or severely food insecure. According to Health Canada, moderately food insecure households have an indication of compromise in quality and/or quantity of food consumed, whereas severely food insecure households have an indication of reduced food intake and disrupted eating patterns. [28] Food insecurity disproportionately affects low-income New Brunswickers. In 2011-2012, 11.4 to 25.6 per cent of the lowest income groups (Q1 and Q2) experienced moderate to severe food insecurity compared to 1.1 to 5.5 per cent of higher income groups (Figure 1).
0%
10%
20%
30%
40%
Q1 Q2 Q3 Q4 Q5 NB average
Income quintile
Food
inse
curit
y rat
e
Figure 1. Food insecurity rates by household income quintile, New Brunswick, 2011-2012

Health Inequities in New Brunswick
8
Also, 11.6 per cent of households with children in the lowest income quintile experienced moderate to severe food insecurity compared to 0.0 per cent in the highest income quintile (Figure 2).
0%
5%
10%
15%
20%
Q1 Q2 Q3 Q4 Q5 NB average
Income quintile
Food
inse
curit
y rat
e
Figure 2. Food insecurity rates among households with children, by household income quintile, 2011-2012
Some New Brunswickers are forced to meet their basic food needs by accessing emergency food programs such as food banks, community kitchens and school breakfast programs. [29] Nearly 20,000 New Brunswickers use food banks each year, with food bank use reported being on the rise in recent years. [30] However, emergency food programs are downstream approaches to addressing food insecurity; research shows that the assistance they provide is insufficient to change a household’s food insecurity status. [31] It is clear that, to eliminate food insecurity, we need to move upstream and eliminate poverty. [29]
Health behaviours
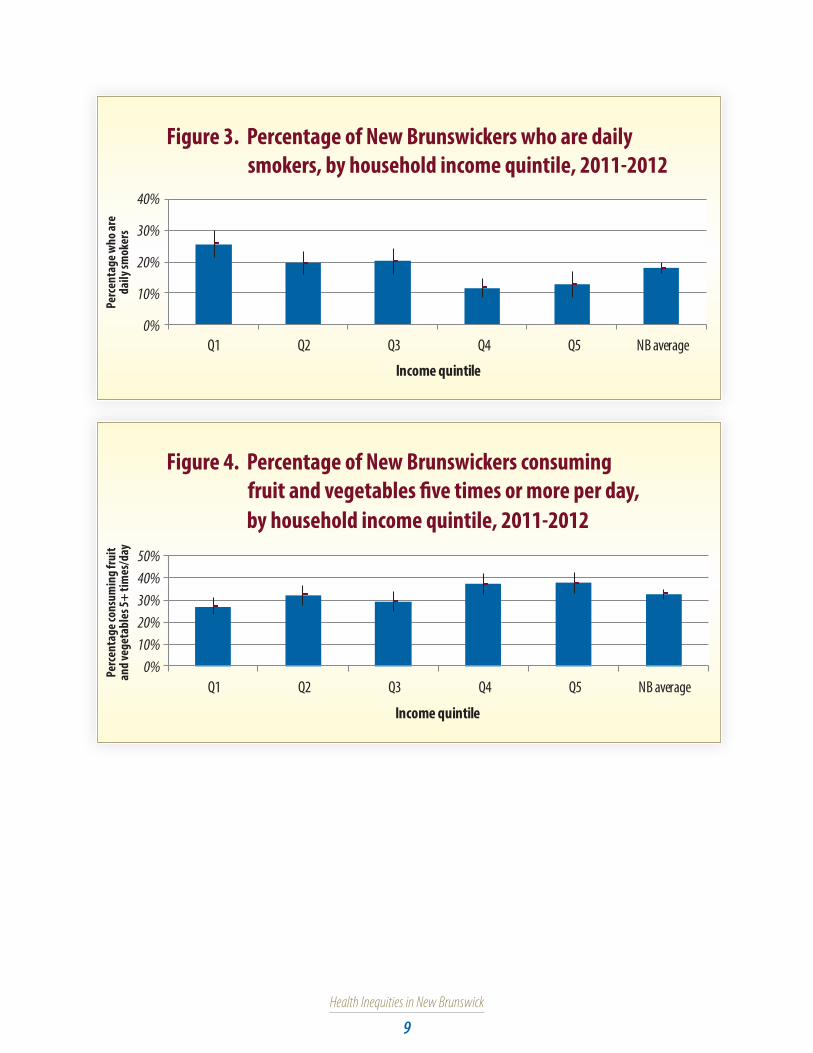
Evidence shows inequities in health behaviours between low- and high-income households. For example, New Brunswickers living in lower income households were statistically more likely to report being daily smokers, and statistically less likely to report consuming fruit and vegetables five or more times a day, or being moderately active or active than those living in higher income households (Figures 3-5).
Upstream interventions and strategies focus on improving fundamental social and economic structures in order to decrease barriers and improve supports that allow people to achieve their full health potential. [14]
Downstream interventions and strategies focus on providing equitable access to care and services to mitigate the negative impacts of disadvantage on health. [14]
Downstream interventions and strategies address the immediate health needs of marginalized populations, whereas upstream interventions address the causes and the causes-of-the-causes of poor health in an effort to promote health and prevent disease. [32]
Health Inequities in New Brunswick
9
Figure 3. Percentage of New Brunswickers who are daily smokers, by household income quintile, 2011-2012
0%
10%
20%
30%
40%
Q1 Q2 Q3 Q4 Q5 NB average
Income quintile
Perc
enta
ge w
ho ar
e da
ily sm
oker
s
Figure 4. Percentage of New Brunswickers consumingfruit and vegetables �ve times or more per day,
by household income quintile, 2011-2012
0%10%20%30%40%50%
Q1 Q2 Q3 Q4 Q5 NB average
Income quintile
Perc
enta
ge co
nsum
ing f
ruit
and v
eget
able
s 5+
times
/day
Health Inequities in New Brunswick
10
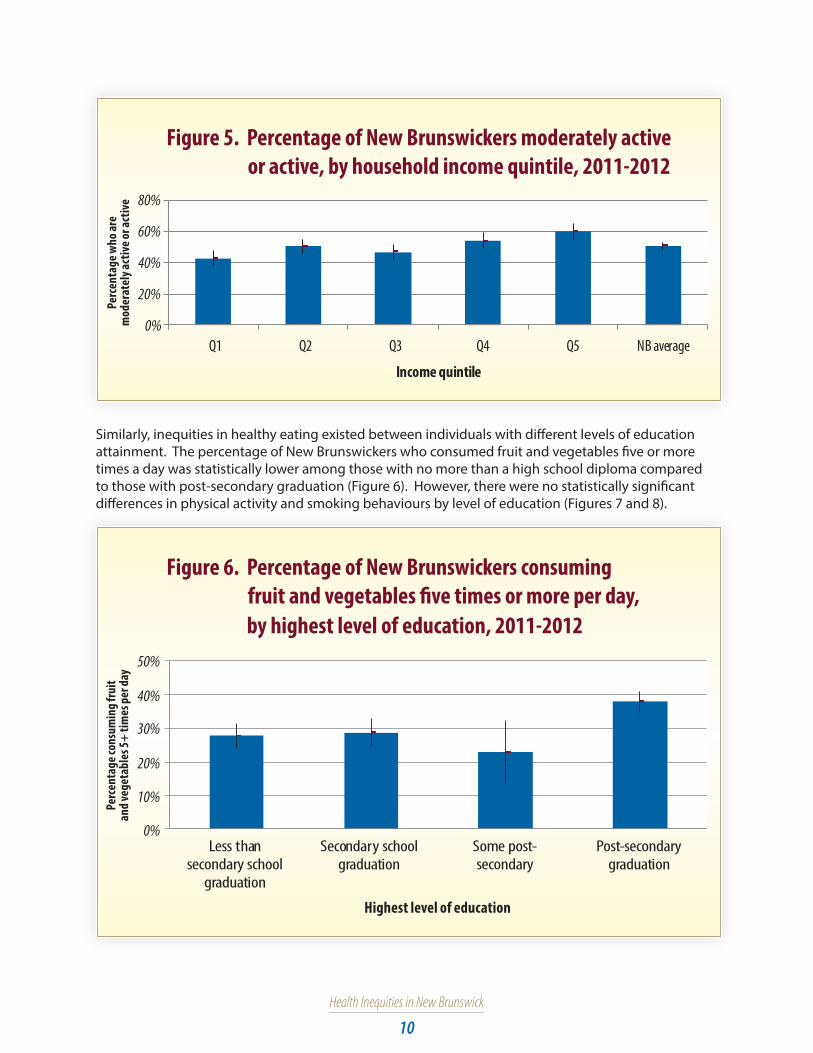
Figure 5. Percentage of New Brunswickers moderately active or active, by household income quintile, 2011-2012
0%
20%
40%
60%
80%
Q1 Q2 Q3 Q4 Q5 NB average
Income quintile
Perc
enta
ge w
ho ar
e m
oder
atel
y act
ive o
r act
ive
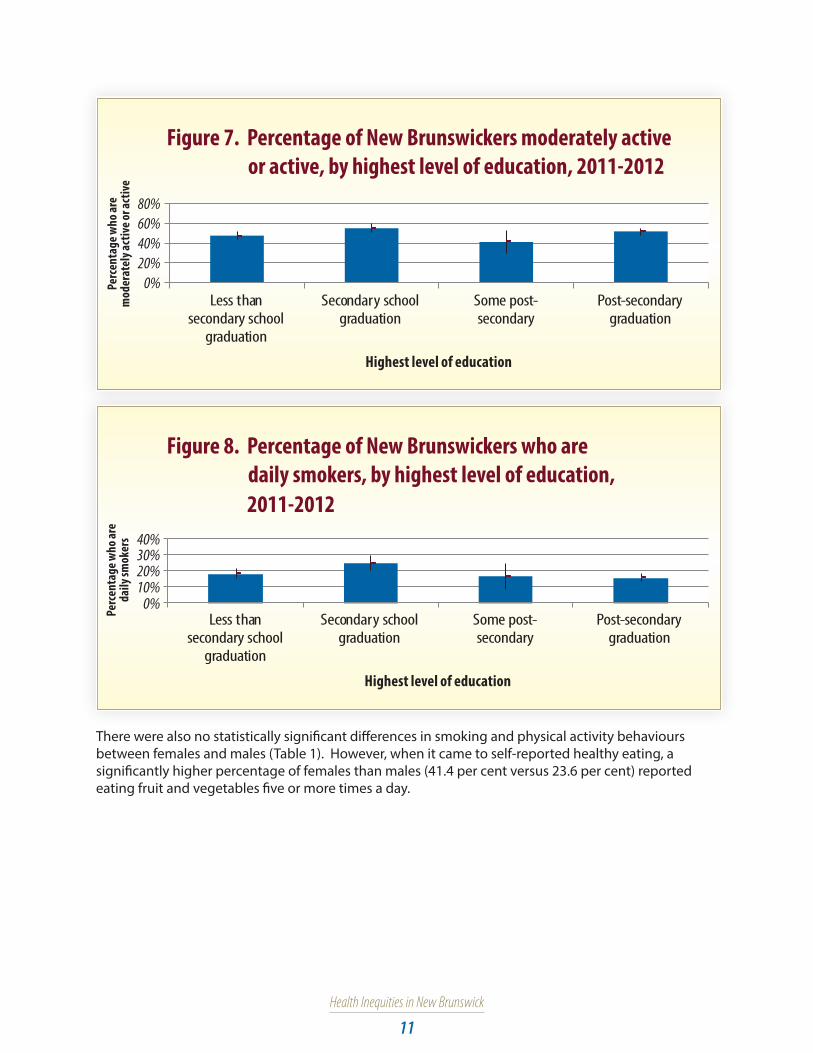
Similarly, inequities in healthy eating existed between individuals with different levels of education attainment. The percentage of New Brunswickers who consumed fruit and vegetables five or more times a day was statistically lower among those with no more than a high school diploma compared to those with post-secondary graduation (Figure 6). However, there were no statistically significant differences in physical activity and smoking behaviours by level of education (Figures 7 and 8).
Figure 6. Percentage of New Brunswickers consuming
fruit and vegetables �ve times or more per day,
by highest level of education, 2011-2012
Perc
enta
ge co
nsum
ing f
ruit
and v
eget
able
s 5+
times
per d
ay
Less thansecondary school
graduation
Secondary schoolgraduation
Some post-secondary
Post-secondarygraduation
Highest level of education
0%
10%
20%
30%
40%
50%
Health Inequities in New Brunswick
11
Figure 7. Percentage of New Brunswickers moderately active or active, by highest level of education, 2011-2012
0%20%40%60%80%
Perc
enta
ge w
ho ar
e m
oder
atel
y act
ive o
r act
ive
Less thansecondary school
graduation
Secondary schoolgraduation
Some post-secondary
Post-secondarygraduation
Highest level of education
Figure 8. Percentage of New Brunswickers who are
daily smokers, by highest level of education,
2011-2012
Perc
enta
ge w
ho ar
e da
ily sm
oker
s
Less thansecondary school
graduation
Secondary schoolgraduation
Some post-secondary
Post-secondarygraduation
Highest level of education
30%20%10%0%
40%
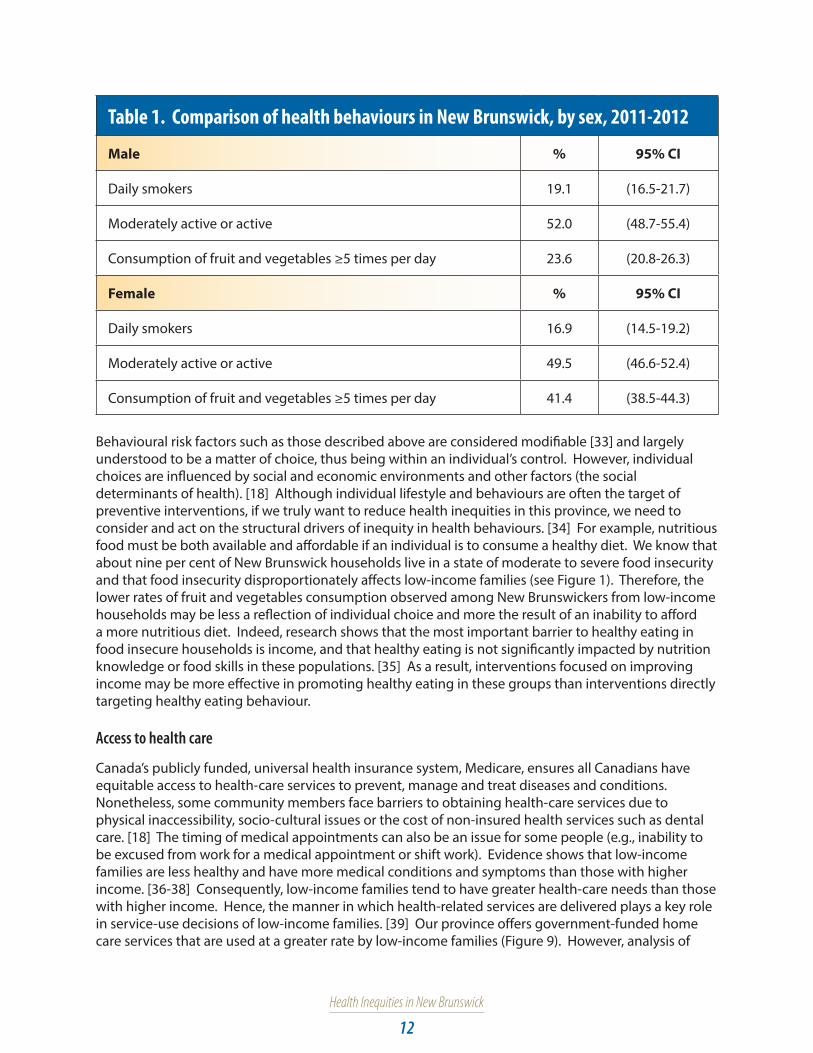
There were also no statistically significant differences in smoking and physical activity behaviours between females and males (Table 1). However, when it came to self-reported healthy eating, a significantly higher percentage of females than males (41.4 per cent versus 23.6 per cent) reported eating fruit and vegetables five or more times a day.
Health Inequities in New Brunswick
12
Table 1. Comparison of health behaviours in New Brunswick, by sex, 2011-2012
Male % 95% CI
Daily smokers 19.1 (16.5-21.7)
Moderately active or active 52.0 (48.7-55.4)
Consumption of fruit and vegetables ≥5 times per day 23.6 (20.8-26.3)
Female % 95% CI
Daily smokers 16.9 (14.5-19.2)
Moderately active or active 49.5 (46.6-52.4)
Consumption of fruit and vegetables ≥5 times per day 41.4 (38.5-44.3)
Behavioural risk factors such as those described above are considered modifiable [33] and largely understood to be a matter of choice, thus being within an individual’s control. However, individual choices are influenced by social and economic environments and other factors (the social determinants of health). [18] Although individual lifestyle and behaviours are often the target of preventive interventions, if we truly want to reduce health inequities in this province, we need to consider and act on the structural drivers of inequity in health behaviours. [34] For example, nutritious food must be both available and affordable if an individual is to consume a healthy diet. We know that about nine per cent of New Brunswick households live in a state of moderate to severe food insecurity and that food insecurity disproportionately affects low-income families (see Figure 1). Therefore, the lower rates of fruit and vegetables consumption observed among New Brunswickers from low-income households may be less a reflection of individual choice and more the result of an inability to afford a more nutritious diet. Indeed, research shows that the most important barrier to healthy eating in food insecure households is income, and that healthy eating is not significantly impacted by nutrition knowledge or food skills in these populations. [35] As a result, interventions focused on improving income may be more effective in promoting healthy eating in these groups than interventions directly targeting healthy eating behaviour.
Access to health care
Canada’s publicly funded, universal health insurance system, Medicare, ensures all Canadians have equitable access to health-care services to prevent, manage and treat diseases and conditions. Nonetheless, some community members face barriers to obtaining health-care services due to physical inaccessibility, socio-cultural issues or the cost of non-insured health services such as dental care. [18] The timing of medical appointments can also be an issue for some people (e.g., inability to be excused from work for a medical appointment or shift work). Evidence shows that low-income families are less healthy and have more medical conditions and symptoms than those with higher income. [36-38] Consequently, low-income families tend to have greater health-care needs than those with higher income. Hence, the manner in which health-related services are delivered plays a key role in service-use decisions of low-income families. [39] Our province offers government-funded home care services that are used at a greater rate by low-income families (Figure 9). However, analysis of

Health Inequities in New Brunswick
13
the 2000-2001 CCHS data shows that low-income Canadians are more likely than other Canadians to report they felt they did not receive health care needed in the past year. [40,41] Nonetheless, this finding may not be related to accessibility but rather to a perceived failure of the system to meet their individual needs. If this is the case for New Brunswick, how health-related services are delivered to low-income families needs to change and be better tailored to their needs so they receive adequate and timely health care.
Figure 9. Percentage of households that received home care
services funded by government, by household income
quintile, 2011-2012
Perc
enta
ge of
hou
seho
lds t
hat
rece
ived
hom
e car
e ser
vice
s
0%2%4%6%8%10%
Q1 Q2 Q3 Q4 Q5 NB average
Income quintile
Other data show New Brunswickers are getting flu shots at an equal rate, regardless of income (Figure 10). However, the percentage of females who get the flu shot (66.3 per cent; 95% CI: 63.5-69.1) is statistically higher than males (59.2 per cent; 95% CI: 55.8-62.5).
Figure 10. Percentage of New Brunswickers who (ever) had a �u shot, by household income quintile, 2011-2012
Q1 Q2 Q3 Q4 Q5 NB average0%
20%
40%
60%
80%
Perc
enta
ge w
ho (e
ver)
had
a �u
shot
Income quintile

Health Inequities in New Brunswick
14
Medicare services address the population’s immediate health-care needs and, as such, are often described as downstream interventions. [42] Evidence is increasingly pointing to the need to move upstream and address the social determinants of health if progress is to be made in reducing inequities in health, such as the unequal burden of chronic diseases and risk factors described in the next section. Moving upstream includes midstream interventions that attempt to improve living circumstances (e.g., housing conditions, employment and food security) or to reduce risk by promoting healthy behaviours, as well as truly upstream interventions that attempt to change social and economic structures that distribute wealth, power, opportunities and decision-making. There is also an economic incentive for more upstream interventions. For example, relatively modest increases in income have been found to lessen food insecurity among low-income families [32,43,44], and the lower rate of food insecurity among Canadian seniors has been attributed to the guaranteed annual incomes provided to them. [45,46] There is also evidence of a graded relation between severity of food insecurity and health status of adults. [39,47,48] Extreme levels of material deprivation associated with household food insecurity have been associated with extensive dietary compromise [49-51], higher levels of stress [39,52] and deprivation across a broad spectrum of basic needs [52-54], all of which diminish an individual’s ability to manage health problems, thereby potentially increasing the need for health care. [55] Therefore, policy interventions aimed at reducing poverty or the prevalence and severity of food insecurity would have a direct impact on the health and well-being of these individuals and also reduce the burden on our health-care system from reduced health care use and costs.
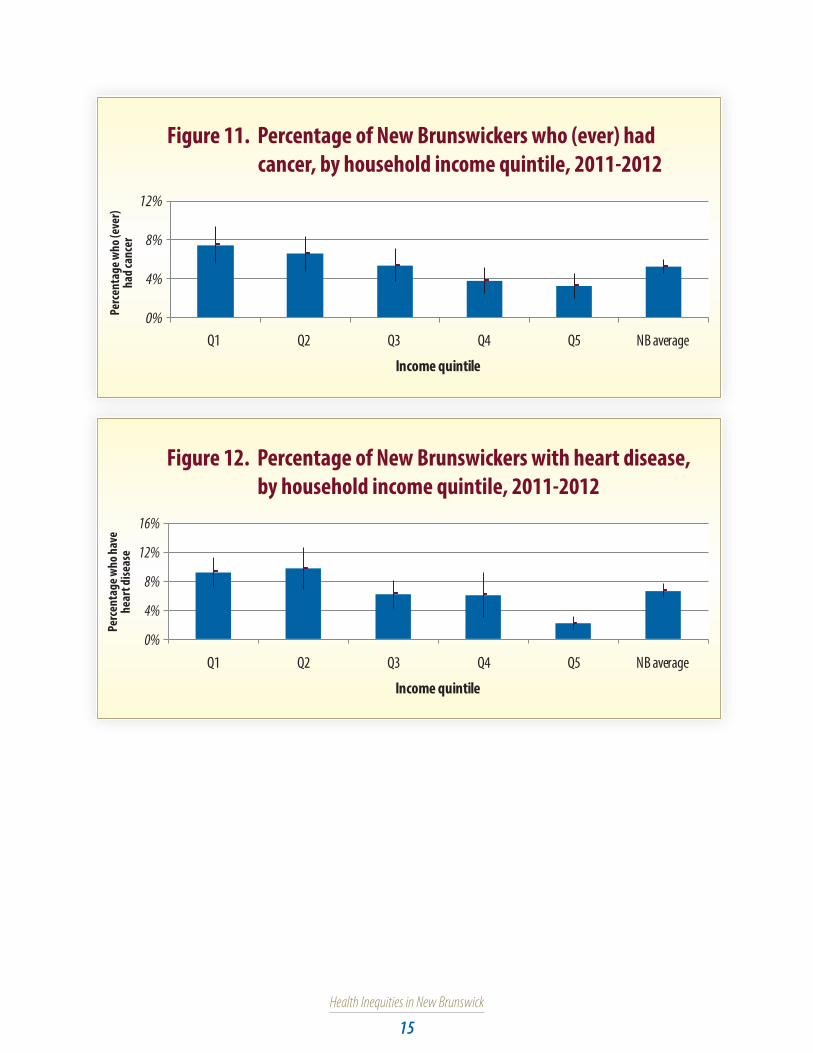
Inequities in the distribution of selected chronic diseases and risk factorsChronic diseases are typically characterized by pre-existing risk factors, vague beginnings, long latency and prolonged affliction. [56] As a group, chronic diseases are the most significant cost driver in the province’s health-care system, and their prevention represents a significant challenge. Cancer and heart disease are the leading causes of death and premature death in New Brunswick. [57] Diabetes, chronic obstructive pulmonary disease (COPD), heart disease and cancer were selected for this report because of their high prevalence and that they share many lifestyle risk factors.
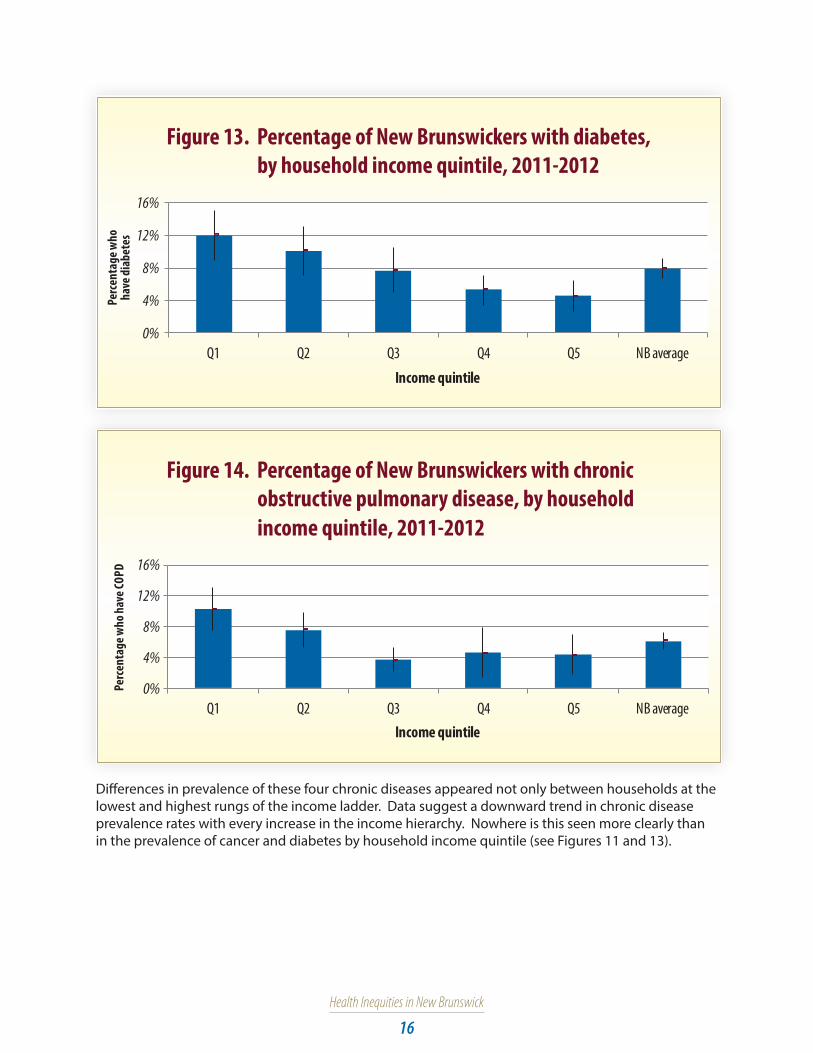
Although chronic diseases are prevalent throughout the province, it is clear that certain population segments are disproportionately affected. Income is arguably the most significant social determinant of health, and evidence indicates New Brunswick’s lowest income households are those most afflicted with chronic diseases and conditions. In 2011-2012, prevalence rates of self-reported cancer, heart disease, and diabetes were statistically higher among households in the two lowest income quintiles (Q1 and Q2) compared to those in the highest income quintile (Q5) (Figures 11-13). The prevalence of COPD was also statistically higher in Q1 compared to Q5 (Figure 14).
Health Inequities in New Brunswick
15
Figure 11. Percentage of New Brunswickers who (ever) had cancer, by household income quintile, 2011-2012
Perc
enta
ge w
ho (e
ver)
had c
ance
r
Q1 Q2 Q3 Q4 Q5 NB average
Income quintile
0%
4%
8%
12%
Figure 12. Percentage of New Brunswickers with heart disease,by household income quintile, 2011-2012
Perc
enta
ge w
ho h
ave
hear
t dise
ase
Q1 Q2 Q3 Q4 Q5 NB average
Income quintile
0%
4%
8%
12%
16%
Health Inequities in New Brunswick
16
Figure 13. Percentage of New Brunswickers with diabetes,by household income quintile, 2011-2012
Perc
enta
ge w
ho
have
diab
etes
Q1 Q2 Q3 Q4 Q5 NB average
Income quintile
0%
4%
8%
12%
16%
Figure 14. Percentage of New Brunswickers with chronic obstructive pulmonary disease, by household
Perc
enta
ge w
ho h
ave C
OPD
Q1 Q2 Q3 Q4 Q5 NB averageIncome quintile
0%
4%
8%
12%
16%
income quintile, 2011-2012
Differences in prevalence of these four chronic diseases appeared not only between households at the lowest and highest rungs of the income ladder. Data suggest a downward trend in chronic disease prevalence rates with every increase in the income hierarchy. Nowhere is this seen more clearly than in the prevalence of cancer and diabetes by household income quintile (see Figures 11 and 13).

Health Inequities in New Brunswick
17
Prevalence rates of self-reported cancer and diabetes also differed by level of education. Respondents without a high school diploma had statistically higher rates of cancer and diabetes than those with secondary school graduation or some post-secondary education (Figures 15 and 16).
Figure 15. Percentage of New Brunswickers who (ever) had cancer, by highest level of education, 2011-2012
Perc
enta
ge w
ho
(eve
r) ha
d can
cer
Less thansecondary school
graduation
Secondary schoolgraduation
Some post-secondary
Post-secondarygraduation
Highest level of education
0%2%4%6%8%10%12%
Figure 16. Percentage of New Brunswickers with diabetes,by highest level of education, 2011-2012
Perc
enta
ge w
ho h
ave d
iabe
tes
Less thansecondary school
graduation
Secondary schoolgraduation
Some post-secondary
Post-secondarygraduation
Highest level of education
0%5%10%15%20%
In addition to experiencing a greater chronic disease load, lower-income households experienced more chronic disease risk factors than higher-income households. For instance, the percentage of self-reported hypertension was statistically higher in the two lowest household income quintiles compared to the two highest (Figure 17). There were also differences in the percentage of New Brunswickers classified as overweight or obese between the different income quintiles. While the percentage of individuals classified as being overweight was statistically lower in low-income households compared to high-income households, a statistically higher percentage from low-income households were classified as being obese, putting them at greater risk of adverse health outcomes (Figure 18).

Health Inequities in New Brunswick
18
Figure 17. Percentage of New Brunswickers with hypertension,by household income quintile, 2011-2012
Perc
enta
ge w
ho
have
hype
rten
sion
Q1 Q2 Q3 Q4 Q5 NB average
Income quintile
0%5%10%15%20%25%30%35%
Figure 18. Percentage of New Brunswickers overweight orobese, by household income quintile, 2011-2012
Perc
enta
ge w
ho ar
e ove
rwei
ght o
r obe
se
Q1 Q2 Q3 Q4 Q5 NB average
Income quintile
0%
5%
10%
15%
20%
25%
30%
35%
40%
45%OverweightObese
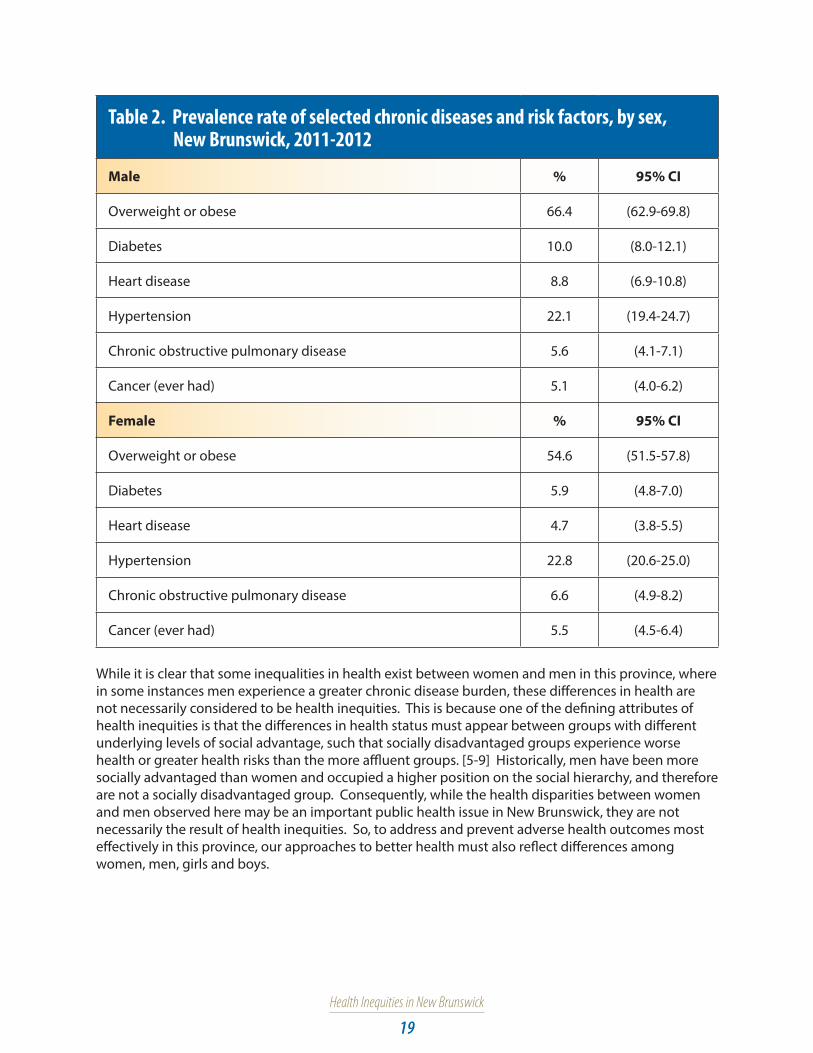
There are also differences in the prevalence of chronic diseases and risk factors by sex in this province. Data analyses revealed statistically higher rates of overweight or obese, diabetes and heart disease among males compared to females. Meanwhile, hypertension, COPD and cancer prevalence rates were similar between sexes (Table 2).
Health Inequities in New Brunswick
19
Table 2. Prevalence rate of selected chronic diseases and risk factors, by sex, New Brunswick, 2011-2012
Male % 95% CI
Overweight or obese 66.4 (62.9-69.8)
Diabetes 10.0 (8.0-12.1)
Heart disease 8.8 (6.9-10.8)
Hypertension 22.1 (19.4-24.7)
Chronic obstructive pulmonary disease 5.6 (4.1-7.1)
Cancer (ever had) 5.1 (4.0-6.2)
Female % 95% CI
Overweight or obese 54.6 (51.5-57.8)
Diabetes 5.9 (4.8-7.0)
Heart disease 4.7 (3.8-5.5)
Hypertension 22.8 (20.6-25.0)
Chronic obstructive pulmonary disease 6.6 (4.9-8.2)
Cancer (ever had) 5.5 (4.5-6.4)
While it is clear that some inequalities in health exist between women and men in this province, where in some instances men experience a greater chronic disease burden, these differences in health are not necessarily considered to be health inequities. This is because one of the defining attributes of health inequities is that the differences in health status must appear between groups with different underlying levels of social advantage, such that socially disadvantaged groups experience worse health or greater health risks than the more affluent groups. [5-9] Historically, men have been more socially advantaged than women and occupied a higher position on the social hierarchy, and therefore are not a socially disadvantaged group. Consequently, while the health disparities between women and men observed here may be an important public health issue in New Brunswick, they are not necessarily the result of health inequities. So, to address and prevent adverse health outcomes most effectively in this province, our approaches to better health must also reflect differences among women, men, girls and boys.

Health Inequities in New Brunswick
20
Women and men are affected by different health issues and often have differing health-care needs. For example, they have different morbidity and mortality patterns as well as differing experiences with health care. However, differential health outcomes are not only linked to biology (sex), but to overall life circumstances and experiences of women and men based on gender, among other diversity factors. For health issues common to women and men, equity does not necessarily mean the provision of the same treatment, but rather the provision of treatment that is fair and which will result in equality of outcomes. This means gender implications of health, in all their manifestations, need to be incorporated into the provision of health care.
Inequities in self-perceived health and mental health In addition to having less access to the social determinants of health and experiencing a greater burden of chronic diseases and chronic disease risk factors, New Brunswickers with lower income and education levels also perceive their overall health and mental health as poorer than those with higher incomes. In fact, there is a clear gradient in self-perceived health whereby the proportion of the population reporting their health to be very good or excellent increased with increasing household income quintile (Figure 19). A statistically lower percentage of New Brunswickers in Q1 reported very good or excellent health compared to the other income groups, while a statistically lower percentage of New Brunswickers in Q2 and Q3 reported very good or excellent health compared to Q4 and Q5. Similarly, the percentage of individuals who reported their mental health as very good or excellent increased with household income (Figure 20). A statistically lower percentage of individuals in Q1 reported their mental health as very good or excellent compared to those in Q3, Q4 and Q5.
Sex versus Gender“Sex” and “Gender” are not interchangeable terms. Sex refers to the biological and physiological characteristics that distinguish women and men (i.e., anatomy, hormones and genes). Although this term is often considered a binary (woman/man or female/male), it is recognized that this representation is limited and not reflective of the complex biological reality of the whole population. Gender, on the other hand, refers to the different social and cultural roles, attitudes, behaviours, expectations, constraints, relative power and influence that society ascribes to women and men by virtue of their biological sex. It is expressed as a continuum (i.e., degree of femininity/masculinity) based on societal constructs. Considering sex and gender differences is an integral step to ensuring equitable health outcomes. [58]
While there is a clear distinction between sex and gender, the two are interrelated, making their effects on health outcomes nearly impossible to disentangle. For example, while sex influences who will get lung cancer and who will survive it, social factors influence who smokes and therefore at greater risk. Gender and diversity factors can also influence exposure to risk factors and engagement in health behaviours, and may also affect care received (e.g., access to resources and services; prevention and control; experience of illness and its social significance; attitudes toward maintaining one’s health and that of family members; patterns of service use; perceptions of quality of care). [59] It is important to note that gender attitudes and beliefs are often embedded in laws, practices and social institutions. They permeate organizational structures including health care, reinforcing patterns of gender discrimination, limiting opportunities available to women and men. [60]

Health Inequities in New Brunswick
21
Figure 19. Percentage of New Brunswickers who perceive their
health as very good or excellent, by household income quintile, 2011-2012
Perc
enta
ge w
ho p
erce
ive th
eir
heal
th as
very
goo
d or
exce
llent
Q1 Q2 Q3 Q4 Q5 NB average
Income quintile
0%20%40%60%80%
Inequities in self-perceived health and mental health also exist based on educational attainment. The percentage of New Brunswickers without a high school diploma who reported their health as very good or excellent was statistically lower compared to those who graduated from high school or with post-secondary education (Figure 21). Similarly, the percentage reporting their mental health as very good or excellent was statistically lower in individuals without a high school diploma compared to those with a high school diploma or post-secondary graduation (Figure 22).
Figure 20. Percentage of New Brunswickers who perceive their
mental health as very good or excellent, by household
income quintile, 2011-2012
Perc
enta
ge w
ho p
erce
ive th
eir m
enta
l he
alth
as ve
ry g
ood
or ex
celle
nt
Q1 Q2 Q3 Q4 Q5 NB average
Income quintile
0%
20%
40%
60%
80%
100%

Health Inequities in New Brunswick
22
Figure 21. Percentage of New Brunswickers who perceive their
health as very good or excellent, by highest level of
education, 2011-2012
Perc
enta
ge w
ho p
erce
ive th
eir
heal
th as
very
goo
d or
exce
llent
Less thansecondary school
graduation
Secondary schoolgraduation
Some post-secondary
Post-secondarygraduation
Highest level of education
0%
20%
40%
60%
80%
Figure 22. Percentage of New Brunswickers who perceive their
mental health as very good or excellent, by highest
level of education, 2011-2012
Perc
enta
ge w
ho p
erce
ive th
eir m
enta
l he
alth
as ve
ry g
ood
or ex
celle
nt
Less thansecondary school
graduation
Secondary schoolgraduation
Some post-secondary
Post-secondarygraduation
Highest level of education
0%20%40%60%80%100%

Health Inequities in New Brunswick
23
There were no statistically significant differences in self-perceived health and mental health between males and females (Table 3).
Table 3. Percentage of New Brunswickers rating their health and mental health as very good or excellent, by sex, 2011-2012
Male % 95% CI
Health rated as very good or excellent 42.8 (39.5-46.1)
Mental health rated as very good or excellent 68.6 (65.3-71.9)
Female % 95% CI
Health rated as very good or excellent 41.0 (38.2-43.8)
Mental health rated as very good or excellent 68.3 (65.6-71.1)
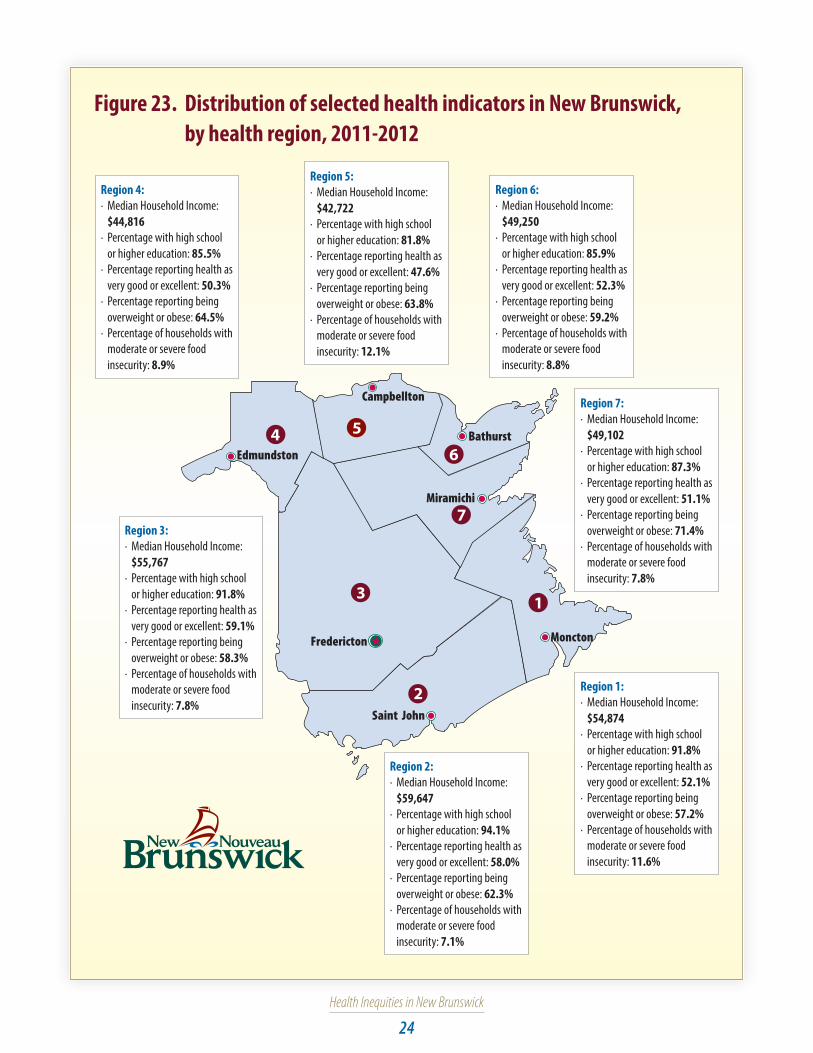
Inequities in health and health determinants among health regionsIn New Brunswick, inequities in access to the social determinants of health appear between the northern and the southern health regions, residents in the north having more limited access than those living in the south (Figure 23).
In 2011-2012, median household incomes in the south (regions 1, 2 and 3) were $54,874 or higher, while median household incomes in the north (regions 4, 5, 6 and 7) were $49,250 or lower. Median household income differed by more than $17,000 between the lowest and highest income regions (regions 5 and 2, respectively).
Similarly, the percentage of New Brunswickers who graduated from secondary school or with higher education differed between the north and the south, with slightly higher rates found in the southern health regions. Again, the largest difference observed was between Region 5 and Region 2 (12 per cent). Lower educational attainment means a higher chance of unemployment or low-paying jobs, which continue the cycle of poverty and health inequity.
The three health regions with the lowest median household income (regions 4, 5 and 7) reported the highest levels of overweight and obesity. The highest rate of food insecurity was also found in the province’s lowest income region (Region 5).
The percentage of individuals reporting their health as being very good or excellent was highest in the two health regions with the highest median household income (regions 2 and 3) and lowest in the three health regions with the lowest median household income (regions 5, 4 and 7, respectively).
Even if one assumes a lower cost of living in northern New Brunswick, people who live there experience poorer wages, more food insecurity and less self-reported health. As a result, it would not appear a lower cost of living is protecting them from health inequities.
Health Inequities in New Brunswick
24
Figure 23. Distribution of selected health indicators in New Brunswick, by health region, 2011-2012
Edmundston
Campbellton
Bathurst
Miramichi
Fredericton
Saint John
Moncton
46
2
7
3 1
5
Region 4:· Median Household Income:
$44,816· Percentage with high school
or higher education: 85.5%· Percentage reporting health as
very good or excellent: 50.3%· Percentage reporting being
overweight or obese: 64.5%· Percentage of households with
moderate or severe food insecurity: 8.9%
Region 5:· Median Household Income:
$42,722· Percentage with high school
or higher education: 81.8%· Percentage reporting health as
very good or excellent: 47.6%· Percentage reporting being
overweight or obese: 63.8%· Percentage of households with
moderate or severe food insecurity: 12.1%
Region 6:· Median Household Income:
$49,250· Percentage with high school
or higher education: 85.9%· Percentage reporting health as
very good or excellent: 52.3%· Percentage reporting being
overweight or obese: 59.2%· Percentage of households with
moderate or severe food insecurity: 8.8%
Region 7:· Median Household Income:
$49,102· Percentage with high school
or higher education: 87.3%· Percentage reporting health as
very good or excellent: 51.1%· Percentage reporting being
overweight or obese: 71.4%· Percentage of households with
moderate or severe food insecurity: 7.8%
Region 1:· Median Household Income:
$54,874· Percentage with high school
or higher education: 91.8%· Percentage reporting health as
very good or excellent: 52.1%· Percentage reporting being
overweight or obese: 57.2%· Percentage of households with
moderate or severe food insecurity: 11.6%
Region 2:· Median Household Income:
$59,647· Percentage with high school
or higher education: 94.1%· Percentage reporting health as
very good or excellent: 58.0%· Percentage reporting being
overweight or obese: 62.3%· Percentage of households with
moderate or severe food insecurity: 7.1%
Region 3:· Median Household Income:
$55,767· Percentage with high school
or higher education: 91.8%· Percentage reporting health as
very good or excellent: 59.1%· Percentage reporting being
overweight or obese: 58.3%· Percentage of households with
moderate or severe food insecurity: 7.8%

Health Inequities in New Brunswick
25
Discussion
Health equity has become a topic of dialogue across the world. It is now widely recognized that improved health cannot be achieved through more health care or economic growth alone, and that wide gaps in social circumstances result in wide health gaps between the most and the least advantaged groups.
The distribution of health and the resources and opportunities for health followed the expected pattern within the province, whereby our more socially disadvantaged residents experienced the poorest health. New Brunswickers with the lowest income and education levels experienced greater food insecurity and practised poorer health behaviours than those with higher income and education levels. Moreover, these vulnerable groups experienced more chronic diseases and chronic disease risk factors than their more advantaged counterparts. It is of no surprise these vulnerable groups also perceived their overall health and mental health as poorer. Such differences are unfair and unjust, and action is needed to reduce these health disparities if health equity is to be achieved within the province.
Related to the concept of health inequity is health literacy, which is also associated with key social determinants of health and health outcomes. [61] Health literacy is essential to New Brunswickers’ capacity to manage their health properly. It refers to people’s abilities, as well as the health-related systems and providers of information within those systems. [62] Individuals who are health literate can obtain and understand the information required to manage their health on a day-to-day basis. In Canada, an estimated 55 per cent of working-age adults and 88 per cent of those aged 65 and older are unable to make appropriate health decisions on their own and do not have the skills required to obtain, understand and act on health information and services. [63] Those who struggle the most with low health literacy skills often are older adults, people with low levels of education or with low English or French proficiency, recent immigrants, members of the Aboriginal population and those dependent on social assistance. [62] Besides having a negative impact on health and quality of life, low health literacy in Canada also has a significant impact on our health-care costs. Researchers estimate that three to five per cent of total health-care costs are due to limited health literacy [64], representing at least $6.5 billion of the total health-care budget each year in Canada. Since only about one in eight Canadians older than 65 is considered to be health literate and the population is rapidly aging, this fact becomes increasingly important as seniors suffer from more chronic diseases and take more medications than any other age group. [65] According to a recent National Academy of Medicine discussion paper, health literacy is intrinsically linked to an individual’s and a community’s socio-economic context, and it is a powerful mediator of the social determinants of health. [61] The authors propose health literacy interventions as a viable option to address social adversity and environmental health determinants to reduce health disparities, thereby fostering health equity and social justice.
Action is therefore urgently needed in New Brunswick and Canada as a whole to better understand and address the connections between the social, physical and economic environments and health behaviours, prioritizing upstream interventions.
Health Inequities in New Brunswick
26
Policy considerationsDownstream, midstream, and upstream interventions to address health inequities encompass a range of possible activities, and Public Health can work across the spectrum to increase health equity in this province. The National Collaborating Centre for Determinants of Health offers examples of interventions to address income-based health inequities at various levels of action. [42] Ensuring chronic disease prevention programs are available and accessible to low-income families is an example of downstream action. Linking clients with welfare, social assistance or back-to-work programs are examples of midstream action. Advocating for living wage policies, wage capping or progressive taxation are examples of upstream action.
The following are examples of downstream, midstream and upstream actions on health equity from the Office of the Chief Medical Officer of Health (OCMOH):
Downstream: sexual health clinics and healthy toddler assessment;
Midstream: immunization, health education, Healthy Learners in School Program, public health inspections and healthy public policies such as the ban on smoking and vaping in many outdoor places; and,
Upstream: health impact assessments with a health equity lens (e.g., social and community impacts of shale gas development in New Brunswick).
According to the National Collaborating Centre for Healthy Public Policy, two broad approaches to action on health inequities have proven most effective:
• Establishing revenue support programs; and
• Reducing exposure to health-damaging conditions and behaviours. [66]
Examples of revenue support programs include allowances, income support programs and raising educational levels with the goal of reducing poverty through raising educational attainment, reducing unemployment, and raising income of those at the lowest levels of the social hierarchy. The second approach focuses on addressing the determinants of health to reduce inequalities such as physical and social environments, food security and early childhood development, and health behaviours such as tobacco use, physical inactivity and poor diet. Focusing on upstream interventions to address these would greatly increase our chance to reduce health inequities within the province.
The role of Public Health in reducing health inequities
The National Collaborating Centre for Social Determinants of Health identified the following four roles Public Health can play to promote health equity:
• assessing and reporting on the existence (and impact) of health inequities – as we have done in this report – and also on effective strategies to reduce these inequities;
• modifying and orienting interventions and services to reduce inequities, with an understanding of the unique needs of populations that experience marginalization;
• leading, supporting and participating with other organizations in policy analysis and development, and in advocacy for improvement in health determinants and inequities; and
• partnering with other government and community organizations to identify ways to improve health outcomes for populations that experience marginalization. [67]
Health Inequities in New Brunswick
27
The Sudbury and District Health Unit in Ontario identified the following10 promising practices to reduce social inequities in health [21]:
• Targeting with Universalism
• Purposeful Reporting
• Social Marketing
• Health Equity Target Setting
• Equity-Focused Health Impact Assessment
• Competencies/Organizational Standards
• Contributing to the Evidence Base
• Early Childhood Development
• Community Engagement
• Intersectoral Action
The OCMOH in New Brunswick is already engaging in a number of these promising practices as it works to achieve its mission to protect, promote and improve the health of the people of New Brunswick in collaboration with the two regional health authorities (RHAs). Some examples are illustrated in Table 4.
Health Inequities in New Brunswick
28
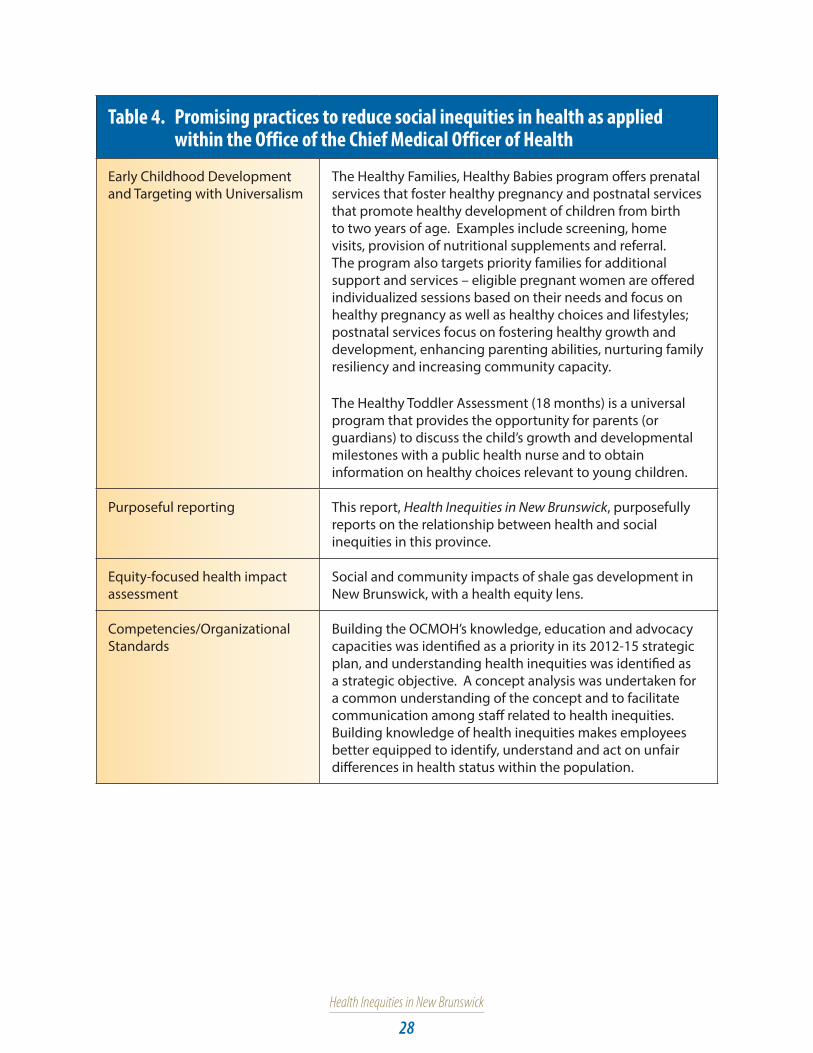
Table 4. Promising practices to reduce social inequities in health as applied within the Office of the Chief Medical Officer of Health
Early Childhood Development and Targeting with Universalism
The Healthy Families, Healthy Babies program offers prenatal services that foster healthy pregnancy and postnatal services that promote healthy development of children from birth to two years of age. Examples include screening, home visits, provision of nutritional supplements and referral. The program also targets priority families for additional support and services – eligible pregnant women are offered individualized sessions based on their needs and focus on healthy pregnancy as well as healthy choices and lifestyles; postnatal services focus on fostering healthy growth and development, enhancing parenting abilities, nurturing family resiliency and increasing community capacity.
The Healthy Toddler Assessment (18 months) is a universal program that provides the opportunity for parents (or guardians) to discuss the child’s growth and developmental milestones with a public health nurse and to obtain information on healthy choices relevant to young children.
Purposeful reporting This report, Health Inequities in New Brunswick, purposefully reports on the relationship between health and social inequities in this province.
Equity-focused health impact assessment
Social and community impacts of shale gas development in New Brunswick, with a health equity lens.
Competencies/Organizational Standards
Building the OCMOH’s knowledge, education and advocacy capacities was identified as a priority in its 2012-15 strategic plan, and understanding health inequities was identified as a strategic objective. A concept analysis was undertaken for a common understanding of the concept and to facilitate communication among staff related to health inequities. Building knowledge of health inequities makes employees better equipped to identify, understand and act on unfair differences in health status within the population.

Health Inequities in New Brunswick
29
The OCMOH and its Public Health partners from the RHAs need to continue to integrate more of these promising practices into their work as we strive to reduce health inequities in this province.
What Public Health can do to address health inequities
• Identify workable strategies to reduce health inequities.
• Advocate for and facilitate an intersectoral approach to address health inequity.
• Partner strategically with other government and community organizations to identify ways to improve health outcomes for populations that experience marginalization. This includes identifying the unique needs of marginalized populations and modifying interventions and services accordingly to reduce inequities.
• Apply an equity lens to the development of healthy public policies and to health impact assessments.
• Participate with other government departments and organizations to review and develop new policies, and to advocate for improvements in the determinants of health and the reduction of health inequities.
The role of health-care providers in reducing health inequities
Health-care providers can also work to reduce social inequities in health through their own practice by acting on the social determinants of health. In March 2015, the president of the Canadian Medical Association (CMA), Dr. Chris Simpson, blogged on the importance of physicians getting involved in the social determinants of health of their patients and reviewed CMA progress on this issue. [68] Similarly, the Canadian Nurses Association provides online resources and articulates the responsibility of nurses to promote health equity through action on the social determinants of health. [69] Research suggests that 50 per cent of population health is determined by our social and economic environment, compared to only 25 per cent being determined by the health-care system. [70]
The Ontario College of Family Physicians’ Poverty Committee has developed a Poverty Intervention Tool (http://ocfp.on.ca/cpd/povertytool) that uses a simple verified question for detecting those living below the poverty line: “Do you ever have difficulty making ends meet at the end of the month?”. The authors point out that poverty has been shown to be a risk to health equivalent to hypertension, high cholesterol and smoking. Work is underway to adapt this tool to New Brunswick. [71]
The College of Family Physicians of Canada recently released a guide on the social determinants of health that provides concrete steps on how to consider and improve patients’ social determinants of health, including suggested clinical, community and population-level interventions. [72]
What health-care providers can do in a clinical setting to address health inequities
• Regularly screen patients for poverty and intervene where necessary.
• Ensure their practice is accessible to all patients, especially marginalized populations.
• Offer advanced access and same-day scheduling.
• Build an anti-poverty team shaped around the needs of their community.
• Understand and provide forms for provincial/territorial social assistance programs. [72]
• Provide better support to people with lower levels of literacy and health literacy through such means as clear communications, building relationships of trust and increased awareness of community resources.
Health Inequities in New Brunswick
30
The role of non-health sectors in reducing health inequities
Cross-sectoral planning and partnerships with non-health-care sectors have been found to be an effective way to address the determinants of health in Canada’s RHAs. [73] Government at all levels (municipal, provincial and federal) and the private and voluntary sectors whose work aligns with the social determinants of health (e.g., planning and urban development, housing, income, transportation, food insecurity) all have contributions to make. [12,74-77] New Brunswick has already demonstrated its capacity for intersectoral action on important social issues. The Economic and Social Inclusion Corporation’s poverty reduction plan, Overcoming Poverty Together, was developed, and is being overseen, coordinated and implemented by a board of directors that includes members of government, business, community non-profit organizations and a person who has experienced poverty. The development process engaged more than 750 members of the public and 50 community organizations. The plan identifies what can be done collectively to reduce poverty in New Brunswick. [29] We need to continue to build on the success of initiatives such as Overcoming Poverty Together, to bring together government, the private and non-profit sectors and individual New Brunswickers to take collective action on reducing health inequities in the province.
What non-health sectors can do to address health inequities [12]
• Collaborate with the health sector to develop structures and mechanisms that are most likely to create the conditions for reducing health inequities in the areas of setting policy; developing, implementing and assessing programs; and sharing information and resources.
• Develop the necessary leadership and intersectoral mechanisms needed to enhance capacity to address health inequities at the provincial, regional and community levels.
• Support investments in key initiatives that align with priority disadvantaged groups and determinants of health, and where there is evidence of effectiveness in reducing health inequities.

Health Inequities in New Brunswick
31
Conclusion
Health inequities exist within New Brunswick and are affecting people at every level of the social strata, not just the most vulnerable. As a province, we cannot allow these to go unchecked, not only due to their burden on our health-care system, but also because of the threat they pose to our social and economic prosperity. Due to the roots of health inequities in economic and social structures, addressing them cannot fall solely on public health and the health-care system. Rather, addressing these inequities will also require participation of non-health sectors of government, the private and non-profit sectors as well as stakeholders from the public.

Health Inequities in New Brunswick
32
References:
1. The Conference Board of Canada, “Why does Canada get a “B” when its health care system is one of the best in the world?”, The Conference Board of Canada website, 2015, available at http://www.conferenceboard.ca/hcp/details/health.aspx
2. Vancouver Coastal Health, “Towards a Population Health Promotion Approach: A Framework and Recommendations for Action”, Vancouver, BC, 2006, available at https://www.vch.ca/media/Toward_A_Population_Health_Approach.pdf.
3. Canadian Medical Association, Being poorer, dying faster: it’s time to end Canada’s “national disgrace”, CMA website, February 5, 2013, available at https://www.cma.ca/En/Pages/Being-poorer-dying-faster-time-to-end-Canada-national-disgrace-CMA-says.aspx.
4. M Whitehead and G Dalhlgren, “Concepts and principles for tackling social inequities in health: levelling up part 1”, World Health Organization Regional Office for Europe, Copenhagen, 2006.
5. PA Braveman and S Gruskin, “Defining Equity in Health”, J Epidemiol Community Health, vol. 57, pp. 254-258, 2003.
6. PA Braveman, “Health Disparities and Health Equity: Concepts and Measurement”, Annu. Rev. Public Health, vol. 27, pp. 167-194, 2006.
7. PA Braveman, S Kumanyika, J Fielding, T Laveist, LN Borrell, R Manderscheid and A Troutman, “Health Disparities and Health Equity: The Issues is Justice”, American Journal of Public Health, vol. 101, no. S1, pp. S149-S155, 2011.
8. PA Braveman, “What is Health Equity: And How Does a Life-Course Approach Take Us Further Toward It?”, Matern Child Health J, vol. 18, pp. 366-372, 2014.
9. PA Braveman, “What Are Health Disparities and Health Equity? We Need to Be Clear”, Public Health Reports, vol. 129, no. Supplement 2, pp. 5-8, 2014.
10. CP Jones, “Systems of Power, Axes of Inequity: Parallels, Intersections, Braiding the Strands”, Medical Care, vol. 52, no. 10 Supplement 3, pp. S71-S75, 2014.
11. PA Braveman, “Equity in health and health care: A WHO/SIDA Initiative”, World Health Orgnization (ARA/96.1), Geneva, 1996.
12. Health Disparities Task Group of the Federal/Provincial/Territorial Advisory Committee on Population Health and Health Security, “Reducing Health Disparities- Roles of the Health Sector: Discussion Paper”, Public Health Agency of Canada, 2004.
13. Office of the Chief Medical Officer of Health, “Health Inequity: A Concept Analysis”, Fredericton, NB, 2015.
14. National Collaborating Centre for Determinants of Health, “English Glossary of Essential Health Equity Terms”, St. Francis Xavier University, Antigonish, NS, 2015.
15. I Kawachi, S Subramanian and N Almeida-Filho, “A glossary for health inequalities”, J Epidemiol Community Health, vol. 56, pp. 647-652, 2002.
16. C. o. S. D. o. Health, “Closing the Gap in a Generation: Health Equity Through Action on the Social Determinants of Health”, World Health Organization, Geneva, 2008.
17. Public Heath Agency of Canada, “What determines health”, 21 October 2011. [Online]. Available at http://www.phac-aspc.gc.ca/ph-sp/determinants/index-eng.php#determinants. [Accessed 11 June 2015].
Health Inequities in New Brunswick
33
18. Public Health Agency of Canada, “The Chief Public Health Officer’s Report on the State of Public Health in Canada”, Ottawa, 2008.
19. Winnipeg Regional Health Authority, 2013, “Health for All- Building Winnipeg’s Health Equity Action Plan”, available at http://www.wrha.mb.ca/about/healthequity/HealthEquityActionPlan.php
20. National Collaborating Centre for Determinants of Health, “Public Health speaks: Purposeful reporting for health equity [video]”, St. Francis Xavier University, Antigonish, NS, 2013.
21. Sudbury and District Health Unit, “10 promising practices to guide local public health practice to reduce social inequities in health: Technical briefing”, Sudbury, ON, 2011.
22. Canadian Community Health Survey Annual Component User Guide 2012 and 2011-2012 Microdata Files, Statistics Canada, June 2013.
23. ST Vincent Dale, “Validation in Statistics Canada Health Surveys”, June 2007.
24. Economic and Social Inclusion Corporation, “Fact Check - Poverty in New Brunswick”, [Online]. Available at http://www2.gnb.ca/content/gnb/en/departments/esic/overview/content/fact_check_povertyinnewbrunswick.html.
25. Statistics Canada, “Labour force characteristics, seasonally adjusted, by province (monthly)”, 5 June 2015. [Online]. Available at http://www.statcan.gc.ca/tables-tableaux/sum-som/l01/cst01/lfss01a-eng.htm. [Accessed 11 June 2015].
26. Economic and Social Inclusion Corportation, “A snapshot of New Brunswick”, [Online]. Available at http://www2.gnb.ca/content/gnb/en/departments/esic/overview/content/a_snapshot_of_newbrunswick.html. [Accessed 11 June 2015].
27. Food and Agriculture Organization, “Rome Declaration on World Food Security and World Food Summit Plan of Action”, Rome, Italy, 1996.
28. Health Canada, “Determining Food Security Status”, 25 July 2012. [Online]. Available at http://www.hc-sc.gc.ca/fn-an/surveill/nutrition/commun/insecurit/status-situation-eng.php. [Accessed 2 June 2015].
29. Economic and Social Inclusion Corporation, “Overcoming Poverty Together: The New Brunswick Economic and Social Inclusion Plan 2014-2019”, Province of New Brunswick, Fredericton, 2014, available at http://www2.gnb.ca/content/dam/gnb/Departments/esic/pdf/NBEconomicSocialInclusionPlan2014-2019.pdf.
30. Food Banks Canada (2013), “HungerCount 2013”, Toronto: Food Banks Canada, available at http://www.foodbankscanada.ca/FoodBanks/MediaLibrary/HungerCount/HungerCount2013.pdf.
31. V Tarasuk, N Dachner and R Loopstra, “Food banks, welfare, and food insecurity in Canada”, British Food Journal, vol. 116, no. 9, pp. 1405-1417, 2014.
32. R Loopstra and V Tarasuk, “Severity of household food insecurity is sensitive to change in household income and employment status among low-income families”, J Nutr, vol 143, pp. 1316-1323, 2013.
33. Public Health Agency of Canada, “Chronic Disease Risk Factors”, 9 April 2015. [Online]. Available at http://www.phac-aspc.gc.ca/cd-mc/risk_factors-facteurs_risque-eng.php. [Accessed 1 June 2015].
34. Commission on Social Determinants of Health, “Achieving health equity: from root causes to fair outcomes. Interim Statement”, World Health Organization, Geneva, 2007.
35. E Power, “Determinants of Healthy Eating Among Low-income Canadians”, Canadian Journal of Public Health, vol. 96, no. Supplement 3, pp. S37-S42, 2005.
Health Inequities in New Brunswick
34
36. JS Feinstein, “The relationship between socio-economic status and health: a review of the literature”, Milbank Quarterly, vol. 71, pp. 279–322, 1993.
37. C Mustard, S Derkson, J-M Berthelot, M Wolfson, LL Roos, KC Carriere and A Zierler, “Socioeconomic gradients in mortality and the use of health care services at different stages in the life course”, Winnipeg, Manitoba Centre for Health Policy, 1995.
38. L Reutter, “Socioeconomic determinants of health” In: M.J. Stewart, editor, Community nursing: promoting Canadians’ health, 2nd ed., Toronto: W.B. Saunders, 2000.
39. DL Williamson, MJ Stewart, K Hayward, N Letourneau, E Makwarimba, J Masudab, K Raine, L Reutter, I Rootman and D Wilson, “Low-income Canadians’ experiences with health-related services: Implications for health care reform”, Health Policy, vol. 76, pp. 106–121, 2006.
40. NM Kasman and EJ Badley, “Beyond access: who reports that health care is not being received when needed in a publicly funded health care system?“, Canadian Journal of Public Health, vol. 95, pp. 304–308, 2004.
41. K Wilson and MW Rosenberg, “Accessibility and the Canadian health care system: squaring perceptions and realities”, Health Policy, vol. 67, pp. 137–148, 2004.
42. National Collaborating Centre for Determinants of Health, “Let’s Talk Moving Upstream”, St. Francis Xavier University, Antigonish, NS, 2014.
43. L McIntyre, “Food security: more than a determinant of health”, Policy Options, vol. 24, pp. 46-51, 2003.
44. R Ionescu-Ittu, M Glymour and J Kaufman, “A difference-in-differences approach to estimate the effect of income-supplementation on food insecurity”, Prev Med, vol. 70, pp. 108-116, 2015.
45. JC Herbert Emery, VC Fleisch and L McIntyre, “How a guaranteed annual income could put food banks out of business”, University of Calgary’s School of Public Policy, SPP Research Papers, vol. 6, pp. 1-20, December 2013.
46. JC Herbert Emery, VC Fleisch and L McIntyre, “Legislated changes to federal pension income in Canada will adversely affect low-income seniors’ health”, Prev Med, vol. 57, pp. 963-966, 2013.
47. V Tarasuk, A Mitchell, L McLaren and L McIntyre, “Chronic physical and mental health conditions among adults may increase vulnerability to household food insecurity”, J Nutr, vol. 143, pp. 1785-1793, 2013.
48. RC Whitaker, SM Phillips and SM Orzol, “Food insecurity and the risks of depression and anxiety in mothers and behavior problems in their preschool-aged children”, Pediatrics, vol. 118, pp. 859-868, 2006.
49. V Tarasuk, L McIntyre and J Li, “Low-income women’s dietary intakes are sensitive to the depletion of household resources in one month”, J Nutr, vol. 137, pp. 1980-1987, 2007.
50. SI Kirkpatrick and V Tarasuk, “Food insecurity is associated with nutrient inadequacies among Canadian adults and adolescents”, J Nutr, vol. 138, pp. 604-612, 2008.
51. LB Dixon, MA Winkleby and KL Radimer, “Dietary intakes and serum nutrients differ between adults from food-insufficient and food-sufficient families: Third National Health and Nutrition Examination Survey, 1988–1994”, J Nutr, vol. 131, pp. 1232-1246, 2001.
52. AM Hamelin, M Beaudry and JP Habicht, “Characterization of household food insecurity in Quebec: food and feelings”, Soc Sci Med, vol. 54, pp. 119-132, 2002.
53. R Loopstra and V Tarasuk, “What does increasing severity of food insecurity indicate for food insecure families? Relationship between severity of food insecurity and indicators of matrial hardship and constrained food purchasing”, J Hunger Environ Nutr, vol. 8, pp. 337-349, 2013.

Health Inequities in New Brunswick
35
54. MB Kushel, R Gupta, L Gee and JS Haas, “Housing instability and food insecurity as barriers to health care among low-income Americans”, J Gen Intern Med, vol. 21, pp. 71-77, 2006.
55. V Tarasuk, J Cheng, C de Oliveira, N Dachner, C Gundersen and P Kurdyak, “Association between household food insecurity and annual health care costs”, CMAJ August 10, 2015. [Online]. Available at http://www.cmaj.ca/content/early/2015/08/10/cmaj.150234. [Accessed 12 August 2015].
56. Primary Health Care Branch, New Brunswick Department of Health, “A Chronic Disease Prevention and Management Framework for New Brunswick”, Fredericton, 2010, available at http://www.gnb.ca/0051/pub/pdf/2010/6960e-final.pdf.
57. Service New Brunswick, “2013 Annual Report - Vital Statistics”, Fredericton, NB, 2015, available at http://www.snb.ca/e/1000/1000-01/e/annual-e.asp
58. B Clow, A Pederson, M Haworth-Brockman and J Bernier, “Rising to the challenge: Sex- and gender-based analysis for health planning, policy and research in Canada”, Atlantic Centre of Excellence for Women’s Health, Halifax, NS, 2009.
59. St. Michael’s Hospital, University of Toronto, 2007, “Measuring Health Inequalities Among Canadian Women: Developing a Basket of Indicators”, available at http://hc-sc.gc.ca/sr-sr/pubs/hpr-rpms/2007-bierman-eng.php
60. P Östlin, “Transforming Health Systems and Services for women and girls”, Karolinska Institutet, Sweden, 2009, available at http://www.un.org/womenwatch/daw/egm/impact_bdpfa/EP5%20-%20Ostlin_final.pdf.
61. RA Logan, WF Wong, M Villaire, G Daus, TA Parnell, E Willis and MK Paasche-Orlow, “Health Literacy: A Necessary Element for Achieving Health Equity”, National Academy of Medicine, 2015, available at http://nam.edu/wp-content/uploads/2015/07/NecessaryElement.pdf.
62. Public Health Association of BC, “An Inter-sectoral Approach for Improving Health Literacy for Canadians- A Discussion Paper”, Victoria, BC, 2012.
63. Canadian Literacy and Learning Network, “Literacy Statistics”, 2015, available at http://www.literacy.ca/literacy/literacy-sub/.
64. K Eichler, S Wieser and U Bruegger, “The costs of limited health literacy: a systematic review”, Int J Public Health, vol. 54, no. 5, pp. 313-324, 2009, available at http://www.ncbi.nlm.nih.gov/pmc/articles/PMC3785182/pdf/38_2009_Article_58.pdf.
65. I Rootman and D Gordon-El-Bihbety, “A Vision for a Health Literate Canada: Report of the Expert Panel on Health Literacy”, Canadian Public Health Association, 2008, available at http://www.cpha.ca/uploads/portals/h-l/report_e.pdf.
66. National Collaborating Centre for Healthy Public Policy, “Thirteen Public Interventions in Canada that have Contributed to a Reduction in Health Inequalities”, Quebec, 2010.
67. National Collaborating Centre for Determinants of Health, “Let’s talk: Public Health Roles for Improving Health Equity”, St. Francis Xavier University, Antigonish, NS, 2013, available at http://nccdh.ca/images/uploads/PHR_EN_Final.pdf.
68. C Simpson, “Physician Leadership in the “Social Determinants of Health” Sphere - Upstream Thinking”, 27 March 2015, available at https://www.cma.ca/En/Pages/president-blog.aspx.
69. Canadian Nurses Association, “Position Statement: Social Determinants of Health”, November 2013, available at http://cna-aiic.ca/~/media/cna/files/en/ps124_social_determinants_of_health_e.%20pdf?la=en.

Health Inequities in New Brunswick
36
70. Canadian Medical Association, “Health Equity and the Social Determinants of Health: A Role for the Medical Profession”, 2013, available at https://www.cma.ca/Assets/assets-library/document/en/advocacy/PD13-03-e.pdf.
71. R Boyle, Chronic Disease Prevention and Management, New Brunswick Department of Health, personal communication, August 2015.
72. The College of Family Physicians of Canada, “Best Advice Guide: Social Determinants of Health”, March 2015, available at http://www.nbcfp.ca/2015/03/best-advice-guide-on-social-determinants-of-health/.
73. B Gardner, Health Equity Discussion Paper, Toronto: Toronto Central LHIN, 2008.
74. Health Officers Council of BC, “Health Inequities in British Columbia: Discussion Paper”, Public Health Association of BC, 2008, available at http://www.phabc.org/files/HOC_Inequities_Report.pdf
75. C Muntaner, E Ng and H Chung, “Better Health: An analysis of public policy and programming focusing on the determinants of health and health outcomes that are effective in achieving the healthiest populations”, Ottawa: Canadian Health Services Research Foundation, 2012, available at http://www.chnc.ca/documents/BetterHealth.pdf
76. Sudbury and District Health Unit, “10 Promising Practices to reduce social inequities in health: What does the evidence tell us?”, Sudbury, ON, 2012, available at http://www.sdhu.com/content/healthy_living/doc.asp?folder=22203&parent=3225&doc=13088&lang=0
77. National Collaborating Centre for Determinants of Health, “Boosting Momentum: Applying Knowledge to Advance Health Equity”, St. Francis Xavier University, Antigonish, NS, 2014, available at http://nccdh.ca/images/uploads/Summary_2014_Environmental_scan.pdf


