1 DEPARTMENT OF HEALTH & HUMAN SERVICES Centers for Medicare & Medicaid Services Room 352-G 200 Independence Avenue, SW Washington, DC 20201 HEALTH INSURANCE MARKETPLACES 2017 OPEN ENROLLMENT PERIOD: JANUARY ENROLLMENT REPORT For the period: November 1 – December 24, 2016 January 10, 2017 During the fourth open enrollment period, the individual market Health Insurance Marketplaces (“the Marketplaces”) continue to play an important role in fulfilling one of the Affordable Care Act’s core goals: reducing the number of uninsured Americans by providing access to quality, affordable health insurance. This report provides interim data on enrollment-related activity in the Marketplaces during the first part of the 2017 Open Enrollment Period (OEP) for all 50 states and the District of Columbia (covering the period from November 1, 2016 through December 24, 2016). The report indicates that, as of December 24, 2016, more than 11.5 million individuals are signed up for 2017 coverage through the Marketplaces, an increase of 286,000 people compared to the comparable period last year. 1 The report includes detailed state-level data on the characteristics of these individuals. The report includes data on the overall distribution of plan selections through the Marketplaces by gender, metal level, age, and financial assistance status (i.e., whether the consumer will receive advance premium tax credits and/or cost-sharing reductions). Additionally, it includes separate breakouts on new consumers and those who are reenrolling in coverage, and data related to completed applications, eligibility determinations, website visitors, and call center activity. Some or all of these data are available for states using the HealthCare.gov platform and the 12 State-Based Marketplaces (SBMs) that are using their own Marketplace enrollment platforms for the 2017 coverage year. 2 1 Throughout this report, references to “the comparable period last year” refer to the period covered by last year’s January Mid-Open Enrollment report: November 1, 2015 through December 26, 2015 https://aspe.hhs.gov/health-insurance- marketplaces-2016-open-enrollment-period-january-enrollment-report. For more information about data on plan selections through the Marketplaces for the 2016 coverage year, please see the Health Insurance Marketplaces 2016 Open Enrollment Period March Enrollment Report, which is available at https://aspe.hhs.gov/health-insurance-marketplaces-2016-open- enrollment-period-final-enrollment-report 2 The 39 states using the HealthCare.gov platform are Alabama, Alaska, Arizona, Arkansas, Delaware, Florida, Georgia, Hawaii, Illinois, Indiana, Iowa, Kansas, Kentucky, Louisiana, Maine, Michigan, Mississippi, Missouri, Montana, Nebraska, New Hampshire, Nevada, New Jersey, New Mexico, North Carolina, North Dakota, Ohio, Oklahoma, Oregon, Pennsylvania, South Carolina, South Dakota, Tennessee, Texas, Utah, Virginia, West Virginia, Wisconsin, and Wyoming. The 12 states using their own enrollment platforms are California, Colorado, Connecticut, District of Columbia, Idaho, Maryland, Massachusetts, Minnesota, New York, Rhode Island, Vermont, and Washington. Kentucky used its own enrollment platform in previous years, but transitioned to HealthCare.gov for the 2017 plan year. For the SBMs that are using their own Marketplace platforms, data availability for certain metrics varies by State. See the Addendum for a summary of the metrics that are available for each state. The Addendum of this
Transcript
1
DEPARTMENT OF HEALTH & HUMAN SERVICES Centers for Medicare & Medicaid Services Room 352-G 200 Independence Avenue, SW Washington, DC 20201
HEALTH INSURANCE MARKETPLACES 2017 OPEN ENROLLMENT PERIOD: JANUARY ENROLLMENT REPORT For the period: November 1 – December 24, 2016
January 10, 2017
During the fourth open enrollment period, the individual market Health Insurance Marketplaces (“the Marketplaces”) continue to play an important role in fulfilling one of the Affordable Care Act’s core goals: reducing the number of uninsured Americans by providing access to quality, affordable health insurance.
This report provides interim data on enrollment-related activity in the Marketplaces during the first part of the 2017 Open Enrollment Period (OEP) for all 50 states and the District of Columbia (covering the period from November 1, 2016 through December 24, 2016). The report indicates that, as of December 24, 2016, more than 11.5 million individuals are signed up for 2017 coverage through the Marketplaces, an increase of 286,000 people compared to the comparable period last year.1 The report includes detailed state-level data on the characteristics of these individuals. The report includes data on the overall distribution of plan selections through the Marketplaces by gender, metal level, age, and financial assistance status (i.e., whether the consumer will receive advance premium tax credits and/or cost-sharing reductions). Additionally, it includes separate breakouts on new consumers and those who are reenrolling in coverage, and data related to completed applications, eligibility determinations, website visitors, and call center activity. Some or all of these data are available for states using the HealthCare.gov platform and the 12 State-Based Marketplaces (SBMs) that are using their own Marketplace enrollment platforms for the 2017 coverage year.2
1 Throughout this report, references to “the comparable period last year” refer to the period covered by last year’s January Mid-Open Enrollment report: November 1, 2015 through December 26, 2015 https://aspe.hhs.gov/health-insurance-marketplaces-2016-open-enrollment-period-january-enrollment-report. For more information about data on plan selections through the Marketplaces for the 2016 coverage year, please see the Health Insurance Marketplaces 2016 Open Enrollment Period March Enrollment Report, which is available at https://aspe.hhs.gov/health-insurance-marketplaces-2016-open-enrollment-period-final-enrollment-report
2 The 39 states using the HealthCare.gov platform are Alabama, Alaska, Arizona, Arkansas, Delaware, Florida, Georgia, Hawaii, Illinois, Indiana, Iowa, Kansas, Kentucky, Louisiana, Maine, Michigan, Mississippi, Missouri, Montana, Nebraska, New Hampshire, Nevada, New Jersey, New Mexico, North Carolina, North Dakota, Ohio, Oklahoma, Oregon, Pennsylvania, South Carolina, South Dakota, Tennessee, Texas, Utah, Virginia, West Virginia, Wisconsin, and Wyoming. The 12 states using their own enrollment platforms are California, Colorado, Connecticut, District of Columbia, Idaho, Maryland, Massachusetts, Minnesota, New York, Rhode Island, Vermont, and Washington. Kentucky used its own enrollment platform in previous years, but transitioned to HealthCare.gov for the 2017 plan year. For the SBMs that are using their own Marketplace platforms, data availability for certain metrics varies by State. See the Addendum for a summary of the metrics that are available for each state. The Addendum of this
Additionally, for the HealthCare.gov states, the report includes data on the distribution of plan selections by self-reported race/ethnicity, rural status, and household income; data on the number of reenrollees who actively reenrolled and/or changed plans; and data on the average monthly advance premium tax credit.
report also includes some Basic Health Program enrollment data for New York and Minnesota. Under the Affordable Care Act, states have the option of using the Basic Health Program to provide affordable health coverage for low-income residents who would otherwise be eligible to purchase coverage through the Health Insurance Marketplace.
3
Highlights
Nationwide:
• Over 11.5 million individuals are signed up for 2017 Marketplace coverage as of December 24, 2016.3 This is an increase of 286,000 consumers relative to the comparable period last year.
• Totals include 8.9 million returning consumers and 2.6 million new consumers.
• More than 8 in 10 individuals (9.3 million or 81%) who are signed up for 2017 plans through the Marketplace will receive advance premium tax credits.
• Consumer engagement continues to increase compared to previous years, with more than half of the 8.9 million consumers who reenrolled in Marketplace coverage actively selecting a plan (5.0 million, or 56%, an increase compared to last year’s 51%).
Among states using the HealthCare.gov platform: • More than 8.7 million individuals are signed up for 2017 coverage through
HealthCare.gov. • Totals include 6.6 million returning and 2.1 million new consumers. • More than 8 in 10 individuals (7.2 million, or 82%) who are signed up for 2017 plans
through the Marketplace will receive an advance premium tax credit4 with an average value of $386 per person per month.5
• HealthCare.gov consumers continue to represent a broad cross-section of Americans. For example, 2017 HealthCare.gov Marketplace consumers include:
o 4.8 million Female and 4.0 million male consumers. o 3.9 million White, 584,000 African-American, 882,000 Latino, and 573,000
Asian consumers. o 1.6 million Rural Americans. o 836,000 children, 2.3 million adults age 18-34, 3.2 million adults age 35-54, and
2.5 million older Americans. The share of consumers age 18-34, 26%, is the same as last year at this time.
• HealthCare.gov consumers were especially likely to come back to the Marketplace to shop and save. Almost two-thirds (65%) of reenrollees actively selected a plan.
3This figure includes all individuals associated with these Marketplace plan selections, including subscribers and dependents included on the policy. 4 For purposes of this analysis, an individual qualifying for an advance premium tax credit was defined as any policy with an APTC amount >$0. 5 Averages in this brief refer to plan-selection-weighted averages across individuals with plan selections with advance premium tax credits in the 39 HealthCare.gov states.
4
Plan Selections Totals
Nationwide plan selection data show that as of December 24, 2016, over 11.5 million
Americans are signed up for 2017 coverage through the Marketplace (see Table 1). This includes:
• More than 8.7 million plan selections in the 39 HealthCare.gov states.
• More than 2.8 million plan selections in the 12 states (including DC) that are using their own Marketplace platforms in 2017.
The 11.5 million Americans signed up for 2017 coverage through the Marketplace is an increase of 286,000 plan selections relative to the comparable period last year. One important change should be noted when interpreting this year-over-year comparison. Louisiana expanded Medicaid in July 2016, with the result that most consumers with incomes between 100 and 138% of the federal poverty level (FPL) will be enrolled in Medicaid instead of Marketplace coverage for 2017. Through December of last year, about 70,000 Louisianans with incomes between 100 and 138% FPL selected Marketplace plans. This suggests that year over year growth, adjusted for Medicaid expansion, is likely well over 300,000. In addition to the totals in this report are 727,590 individuals in New York and Minnesota signed up for coverage through Basic Health Program. Under the Affordable Care Act, states have the option of using a Basic Health Program to provide affordable health coverage for low-income residents who would generally otherwise be eligible to purchase coverage through the Health Insurance Marketplace. In New York and Minnesota, many individuals with incomes below 200 percent of the FPL who in other states would be enrolled through the Marketplace are instead enrolled through the Basic Health Program. The total number of individuals signed up for 2017 coverage through either the Marketplace or a Basic Health Program is 12.2 million.
Table 1
Plan Selections
Reporting Period: 11-1-16 to 12-24-16
Number % of Total Total 2017 Plan Selections in the Marketplaces
11,544,770
100%
2017 Plan Selections in the Marketplaces in 39 States Using the HealthCare.gov Eligibility and Enrollment Platform
8,744,148
76%
2017 Plan Selections in the Marketplaces in 12 State-Based Marketplaces Using Their Own Marketplace Platforms
2,800,622
24%
Source: Centers for Medicare & Medicaid Services, as of 12-24-16
5
Figure 1
During the 2017 OEP, the number of Marketplace plan selections in the HealthCare.gov states has been higher when compared with the 2016 OEP. As the graph below shows, consumers typically enroll around deadlines, as evidenced by the increase around the December deadline in both OE3 and OE4. In OE3, enrollment once again climbed directly in advance of the January 31 deadline; a trend expected once again during this OE.
Notes: Represents the cumulative number of unique individuals who have been determined eligible to enroll in a plan through the states using the HealthCare.gov platform, and have actively selected a plan (with or without the first premium payment having been received by the issuer).Plan selections for OE3 reflect the total through the end of OE3 Open Enrollment; OE4 reflects through 12-24-16. Number of states using the HealthCare.gov platform: 38 states during the 2016 coverage year, and 39 states during the 2017 coverage year.
Source: Centers for Medicare & Medicaid Services, as of 12-24-16
0
1
2
3
4
5
6
7
8
9
10
Week1
Week2
Week3
Week4
Week5
Week6
Week7
Week8
Week9
Week10
Week11
Week12
Week13
Week14
Week15
Mill
ions
Trends in timing of HealthCare.gov Plans Selections Across OE3 and OE4
OE3 OE4
6
New and Returning Consumers Nationwide, the more than 11.5 million 2017 plan selections include 2.6 million new consumers and 8.9 million reenrollees (see Table 2). Even more than last year, Marketplace consumers showed themselves to be actively engaged with their coverage (see Table 3).
o Nationwide, 56% of returning consumers actively selected a plan, an increase from 51% in the comparable period last year.
o In states using the HealthCare.gov platform, 65% of returning consumers actively selected a plan, an increase from 60% in the comparable period last year.
Totals for HealthCare.gov re-enrollees who did not actively renew their coverage include consumers who were automatically reenrolled with their 2016 insurer and consumers who were signed up for January 1 coverage through a suggested alternate plan.
Table 2
Plan Selections By Enrollment Type (Reporting Period:
11-1-16 to 12-24-16 (1))
Marketplace Total 39 States Using the
HealthCare.gov Eligibility and Enrollment Platform
12 State-Based Marketplaces Using
Their Own Marketplace Platforms (1)
Number % of Total Number % of Total Number % of Total
Total Plan Selections 11,544,770 100% 8,744,148 100% 2,800,622 100%
Number With Known Data on Enrollment Type 11,544,770 100% 8,744,148 100% 2,800,622 100%
New Consumers 2,663,993 23% 2,122,939 24% 541,054 19%
Active Reenrollees 5,015,186 43% 4,327,129 49% 688,057 25%
Other Reenrollees 3,630,712 31% 2,294,080 26% 1,336,632 48%
Reenrolled but Specific Type Unknown 234,879 2% 0 0% 234,879 8%
Notes: (1) For SBMs using their own Marketplace platforms, the number of active reenrollees and automatic reenrollees does not add up directly to the total number of reenrollees due to some SBM plan selections with missing data and others with minor anomalies. (2) Further information on consumers within “Other Enrollees” is available in the Methodology section on page 11. Source: Centers for Medicare & Medicaid Services, as of 12-24-16
7
Table 3
2017 Reenrollee Plan Selections Through the Marketplaces By Switching Status
Cumulative (Reporting Period: 11-1-16 to 12-24-16)
Number
Plan Selection Data by Enrollment Type as a % of:
All Consumers Reenrolling in
Coverage
Active Reenrollees
Marketplace Total
Total Consumers Reenrolling in 2017 Coverage through the Marketplaces (1) (2)
8,880,777 100% N/A
Active Reenrollees 5,015,186 56% 100% Other Reenrollees 3,630,712 41% N/A Unknown Reenrollment Type 234,879 3% N/A
HealthCare.Gov States
Total Consumers Reenrolling in 2017 Coverage through the Marketplaces
6,621,209 100% N/A
Active Reenrollees 4,327,129 65% 100% Active Reenrollees Who Remained in the Same Marketplace
Plan (3) 2,032,936 31% 47%
Active Reenrollees Who Switched Marketplace Plans (3) 2,294,193 35% 53% Other Reenrollees 2,294,080 35% N/A Unknown Reenrollment Type 0 0% N/A
SBMs Using Their Own Marketplace Platforms
Total Consumers Reenrolling in 2017 Coverage through the Marketplaces (1)
2,259,568 100% N/A
Active Reenrollees 688,057 30% 100% Other Reenrollees 1,336,632 59% N/A Unknown Reenrollment Type 234,849 10% N/A
Notes:
(1) For SBMs using their own Marketplace platforms, the number of active reenrollees and automatic reenrollees does not add up directly to the total number of reenrollees due to some SBM plan selections with missing data and others with minor anomalies.
(2) Kentucky shifted from using its own enrollment platform for 2016 to using the HealthCare.gov platform for 2017, so breakdowns in enrollment type (i.e., New vs Reenrolling) are not available for Kentucky and enrollees for the 2017 plan year are reported as New.
(3) “Active Who Remained in the Same Marketplace Plan” are active reenrollees who have selected their “crosswalked” plan for 2017, while “Active Reenrollees Who Switched Marketplace Plans” are those that have not selected their crosswalked plan. When individuals have 2017 Marketplace plans available to them from their 2016 issuer, the crosswalked plan will either be the same plan as 2016 or a different plan from the same issuer. Otherwise, the crosswalked plan will be a suggested alternate plan from a different issuer.
Source: Centers for Medicare & Medicaid Services, as of 12-24-16
8
Demographic Characteristics of HealthCare.gov State Consumers Table 4 summarizes the demographic characteristics of consumers selecting plans through the Marketplaces in the HealthCare.gov states during the first part of the 2017 OEP. Data on race and ethnicity should be interpreted with great caution since nearly one-third of enrollees do not provide these data.
Table 4
Selected Characteristics of Plan Selections through the
Marketplaces in States Using the HealthCare.gov Eligibility and
Enrollment Platform (1)
2017 Open Enrollment
Period 11-1-16 to 12-24-16
Total Plan
Selections
By Reenrollment Status
New Consumers
(%)
Active Reenrollees
(%)
Automatic Reenrollees
(%)
Total Plan Selections 8.74 Million 2.12 Million 4.33 Million 2.29 Million
Males who have selected a Marketplace plan
3.98 Million 0.99 Million 1.93 Million 1.06 Million
46% 47% 45% 46%
Females who have selected a Marketplace plan
4.76 Million 1.13 Million 2.40 Million 1.23 Million
54% 53% 55% 54%
0 to 34 year olds who have selected a Marketplace plan
3.13 Million 0.91 Million 1.3 Million 0.89 Million
36% 43% 31% 39%
18 to 34 year olds who have selected a Marketplace plan
2.29 Million 0.67 Million 0.96 Million 0.66 Million
26% 32% 22% 29%
Individuals who have selected a Silver Marketplace plan
6.45 Million 1.51 Million 3.30 Million 1.64 Million
74% 71% 76% 72%
Individuals who have selected a Marketplace plan with financial assistance
7.23 Million 1.72 Million 3.86 Million 1.64 Million
83% 81% 89% 72%
African-Americans who have selected a Marketplace plan
0.58 Million 0.19 Million 0.24 Million 0.15 Million
7% 9% 6% 6%
Latinos who have selected a Marketplace plan (2)
0.88 Million 0.20 Million 0.46 Million 0.22 Million
10% 9% 11% 10%
Whites who have selected a Marketplace plan
3.89 Million 0.83 Million 2.14 Million 0.92 Million
45% 39% 49% 40%
Individuals in ZIP Codes designated as rural who have selected a Marketplace plan
1.57 Million 0.35 Million 0.43 Million 0.79 Million
18% 17% 10% 34%
Notes:
9
(1) For the 2017 reporting year, CMS is reporting percents that include all consumers; in previous years, ASPE reported percentages that represented the percent of plan selections with known data for that category. As a result, please note that data on race/ethnicity is not directly comparable to last year.
(2) Kentucky shifted from using its own enrollment platform for 2016 to using the HealthCare.gov platform for 2017, so breakdowns in enrollment type (i.e., New vs Reenrolling) are not available for Kentucky and enrollees for the 2017 plan year are reported as New.
Source: Centers for Medicare & Medicaid Services, as of 12-24-16
10
Financial Assistance: Consumers Are Savings Hundreds of Dollars per Month6
Under the Affordable Care Act, advance premium tax credits are available to reduce premium costs for eligible taxpayers.
• Nationwide, 8 in 10 individuals (9.3 million, or 81% of all consumers signed up for 2017 Marketplace coverage) will receive an advance premium tax credit.
• In the 39 states using the HealthCare.gov eligibility and enrollment platform: • More than 8 in 10 individuals (7.2 million, or 82%) of HealthCare.gov state
consumers will receive an advance premium tax credit.7 • The average tax credit value is $386 per person per month, or $4,632 on an
annual basis (see Table 5).
Table 5
Advance Premium Tax Credit (APTC) Eligibility and Average Monthly APTC Amount in States Using the HealthCare.gov Eligibility and Enrollment Platform
11-1-16 to 12-24-16
Description
Total Number of Individuals
With 2017 Plan Selections
Through the Marketplaces
2017 Plan Selections with APTC
Average Monthly APTC
Number
% of Total
TOTAL – States Using the HealthCare.gov Eligibility and Enrollment Platform
8.74 Million 7.19 Million 82% $386
Source: CMS data for 39 states using the HealthCare.gov eligibility and enrollment platform as of 12-24-16. NOTE: APTC data for the 2017 plan year, through 12-24-16, by zip code can be found at: https://www.cms.gov/Research-Statistics-Data-and-Systems/Statistics-Trends-and-Reports/Marketplace-Products/Downloads/Marketplace_Plan_Selections_by_ZIP_PUF_FINAL.zip
6 For additional information about these premium-related metrics, please see “Marketplace Premiums After Shopping, Switching, and Premium Tax Credits,” ASPE Research Brief, U.S. Department of Health and Human Services, April 12, 2016 Available at: https://aspe.hhs.gov/pdf-report/marketplace-premiums-after-shopping-switching-and-premium-tax-credits-2015-2016 7 The amount of the premium tax credit is generally equal to the premium for the second lowest cost silver plan available through the Marketplace that applies to the members of a family who are enrolled in coverage through the Marketplace and not eligible for other, non-Marketplace coverage such as government coverage or affordable employer-sponsored coverage, minus a certain percentage of household income. For more information on the required contribution percentage, see https://www.irs.gov/affordable-care-act/individuals-and-families/questions-and-answers-on-the-premium-tax-credit? 7 For purposes of this analysis, an individual qualifying for an advance premium tax credit was defined as any individual associated with a policy with an APTC amount >$0.
The data reported here have been obtained from the information systems of the Centers for Medicare & Medicaid Services (CMS), based on information collected for 39 states using the HealthCare.gov eligibility and enrollment platform. We also obtained more limited data reported to CMS by the 12 states (including the District of Columbia) that are using their own Marketplace platforms.
This report includes data that are currently available on enrollment-related activity for the 2017 Open Enrollment period – which generally corresponds with data from 11-1-16 to 12-24-16 for the 39 HealthCare.gov states and for the 12 states that are using their own Marketplace platforms for the 2017 plan year. This report also includes available data on the characteristics of individuals who have selected a plan through the Marketplaces for the states that are using the HealthCare.gov eligibility and enrollment platform for 2017, and the states using their own Marketplace platforms. Data for certain metrics are not available for some or all of the states that are using their own Marketplace platforms. The data in this report reflect the total number of plan selections cumulatively from the beginning of Open Enrollment to the end of the reporting period, net of any cancellations from a consumer or cancellations from an insurer during that time. Because of automation in communication with issuers, plan selection totals reported during Open Enrollment account for issuer-initiated plan cancellations that occur before the end of Open Enrollment for reasons such as non-payment of premiums. Usually those cancellations are reflected in reported numbers towards the last few weeks of Open Enrollment.
This report does not include data on effectuated enrollment (the number of people who have paid monthly premiums to the insurer). The Centers for Medicare & Medicaid Services (CMS) will be publishing data on effectuated enrollment for the 2017 coverage year separately. HealthCare.gov totals for returning consumers include three groups: individuals who returned to the Marketplace and actively selected a plan, individuals who were automatically re-enrolled with their 2016 insurer, and a much smaller group of consumers who were signed up for January 1 coverage through a suggested alternate plan. Like all HealthCare.gov consumers, people with a suggested alternate plan will have health insurance coverage starting January 1 provided they pay their first premium. Therefore, this group is included in the plan selection totals reported here.
We believe that the information contained in this issue brief provides the most systematic summary of enrollment-related activity in the Marketplaces for the 2017 Open Enrollment period because the data for the various metrics are counted using comparable definitions for data elements across states and Marketplace types.
12
SECTION III: APPENDICES
Appendix A: Characteristics of Marketplace Plan Selections
• A1 – Marketplace Plan Selections by Gender, Age, Metal Level, and Financial Assistance Status – Total for all State Marketplaces
Page 14
• A2 - Marketplace Plan Selections by Gender, Age, Metal Level, Financial Assistance Status, Race/Ethnicity, Rural Status, and Household Income in States Using the HealthCare.gov Eligibility and Enrollment Platform
Page 17
• A3 - Marketplace Plan Selections by Gender, Age, Metal Level, and Financial Assistance Status in States Using their Own Marketplace Platform
Appendix B: State-Level Tables – HealthCare.gov States
• B1 – Marketplace Plan Selection by Enrollment Type in States Using the HealthCare.gov Eligibility and Enrollment Platform, By State
Addendum
• B2 – Plan Switching by Active Reenrollees Who Selected Plans Through the Marketplaces in States Using the HealthCare.gov Eligibility and Enrollment Platform, By State
Addendum
• B3 - Total Completed Applications and Individuals Who Completed Applications in States Using the HealthCare.gov Eligibility and Enrollment Platform, By State
Addendum
• B4 - Total Marketplace Eligibility Determinations, and Marketplace Plan Selections in States Using the HealthCare.gov Eligibility and Enrollment Platform, By State
Addendum
• B5 - Total Marketplace Plan Selections by Financial Assistance Status in States Using the HealthCare.gov Eligibility and Enrollment Platform, By State
Addendum
• B6 - Total Marketplace Plan Selections by Age in States Using the HealthCare.gov Eligibility and Enrollment Platform, By State
Addendum
• B7 - Total Marketplace Plan Selections by Gender in States Using the HealthCare.gov Eligibility and Enrollment Platform, By State
Addendum
• B8 - Total Marketplace Plan Selections by Metal Level in States Using the HealthCare.gov Eligibility and Enrollment Platform, By State
Addendum
• B9 - Total Marketplace Plan Selections by Race/Ethnicity in States Using the HealthCare.gov Eligibility and Enrollment Platform, By State
Addendum
• B10 - Total Marketplace Plan Selections by Rural Status in States Using the HealthCare.gov Eligibility and Enrollment Platform, By State
Addendum
• B11 - Total Marketplace Plan Selections by Household Income in States Using the HealthCare.gov Eligibility and Enrollment Platform, By State
Addendum
Appendix C: State-Level Tables – States Using Their Own Marketplace Platforms
• C1 – Marketplace Plan Selection by Enrollment Type in States Using Their Own Marketplace Platforms, By State, By State
Addendum
• C2 - Total Completed Applications and Individuals Who Completed Applications in States Using Their Own Marketplace Platforms, By
Addendum
13
State
• C3 - Total Marketplace Eligibility Determinations, and Marketplace Plan Selections in States Using Their Own Marketplace Platforms, By State
Addendum
• C4 - Total Marketplace Plan Selections by Financial Assistance Status in States Using Their Own Marketplace Platforms, By State
Addendum
• C5 - Total Marketplace Plan Selections by Age in States Using Their Own Marketplace Platforms, By State
Addendum
• C6 - Total Marketplace Plan Selections by Gender in States Using Their Own Marketplace Platforms, By State
Addendum
• C7 - Total Marketplace Plan Selections by Metal Level in States Using Their Own Marketplace Platforms, By State
Addendum
Appendix D: Technical Notes Addendum
14
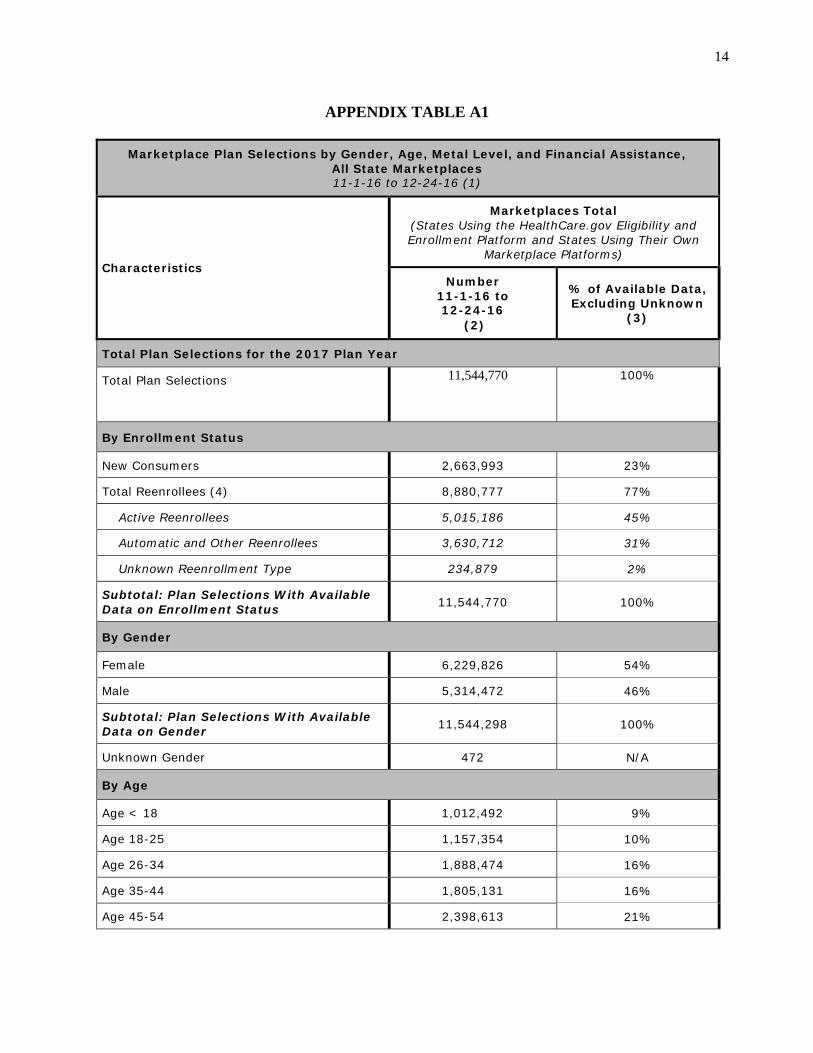
APPENDIX TABLE A1
Marketplace Plan Selections by Gender, Age, Metal Level, and Financial Assistance, All State Marketplaces 11-1-16 to 12-24-16 (1)
Characteristics
Marketplaces Total (States Using the HealthCare.gov Eligibility and Enrollment Platform and States Using Their Own
Marketplace Platforms)
Number 11-1-16 to 12-24-16
(2)
% of Available Data, Excluding Unknown
(3)
Total Plan Selections for the 2017 Plan Year
Total Plan Selections 11,544,770 100%
By Enrollment Status
New Consumers 2,663,993 23%
Total Reenrollees (4) 8,880,777 77%
Active Reenrollees 5,015,186 45%
Automatic and Other Reenrollees 3,630,712 31%
Unknown Reenrollment Type 234,879 2%
Subtotal: Plan Selections With Available Data on Enrollment Status 11,544,770 100%
By Gender
Female 6,229,826 54%
Male 5,314,472 46%
Subtotal: Plan Selections With Available Data on Gender 11,544,298 100%
Unknown Gender 472 N/A
By Age
Age < 18 1,012,492 9%
Age 18-25 1,157,354 10%
Age 26-34 1,888,474 16%
Age 35-44 1,805,131 16%
Age 45-54 2,398,613 21%
15
Marketplace Plan Selections by Gender, Age, Metal Level, and Financial Assistance, All State Marketplaces 11-1-16 to 12-24-16 (1)
Characteristics
Marketplaces Total (States Using the HealthCare.gov Eligibility and Enrollment Platform and States Using Their Own
Marketplace Platforms)
Number 11-1-16 to 12-24-16
(2)
% of Available Data, Excluding Unknown
(3)
Age 55-64 3,173,210 27%
Age ≥65 112,120 1%
Subtotal: Plan Selections With Available Data on Age (2) 11,547,394 100%
Unknown Age 376 N/A
Ages 18 to 34 3,045,828 26%
Ages 0 to 34 4,058,320 35%
By Metal Level
Bronze 2,629,449 23%
Silver 8,194,404 71%
Gold 548,341 4%
Platinum 116,963 1%
Catastrophic 95,778 1%
Subtotal: Plan Selections With Available Data on Metal Level (5) 11,584,935 100%
Unknown Metal Level 0 N/A
By Financial Assistance Status
With Financial Assistance 9,361,661 81%
Without Financial Assistance 2,183,335 19%
Subtotal: Plan Selections With Available Data on Financial Assistance (2) 11,544,996 100%
Unknown Financial Assistance Status 0 N/A
APTC (With or Without CSR) 9,328,452 81%
Notes: Percentages in this table have been rounded. Some numbers may not add to totals due to rounding.
16
(1) Unless otherwise noted, the data in this table represent cumulative data on the number of unique individuals who have been determined eligible to enroll in a Marketplace plan, and have selected, been automatically reenrolled into, or been placed into a suggested alternate Marketplace medical plan (with or without the first premium payment having been received by the issuer). Individuals who have cancelled or terminated their Marketplace plans are not included in the total number of plan selections. These data also do not include individuals who may have selected a 2016 Marketplace plan during the reporting period, as a result of having been eligible for a Special Enrollment Period (SEP). For additional technical notes, please refer to the Addendum of this report. (2) For each metric, the data represent the total number of “Individuals Applying for 2017 Coverage in Completed Applications” who have selected a 2017 medical Marketplace plan for enrollment through the Marketplace (with or without the first premium payment having been received directly by the issuer) during the reference period, excluding plan selections with unknown data for a given metric. This is also known as pre-effectuated enrollment, because enrollment is not considered effectuated until the first premium payment is made, and this figure includes plan selections for which enrollment has not yet been effectuated. (3) In some cases, the data for certain characteristics of Marketplace plan selections are not yet available. For this reason, for each metric, we have calculated the comparable percentages based on the number of plan selections with known data for that metric. (4) The number of active reenrollees and automatic reenrollees may not add to the total number of reenrollees due to some SBM plan selections with missing data or other reporting anomalies. (5) The subtotals for each metal tier type, age and financial assistance do not sum to the total number due to a small number of individuals who have multiple 2017 Marketplace plan selections in the system that will be resolved through data cleanup processes. Source: Centers for Medicare & Medicaid Services, as of 12-24-16.
17
APPENDIX TABLE A2
Marketplace Plan Selections by Gender, Age, Metal Level, Financial Assistance Status, Race/Ethnicity, Rural Status, and Household Income
in States Using the HealthCare.gov Platform (1) 11-1-16 to 12-24-16
Characteristics
Marketplaces Total States Using the HealthCare.gov Eligibility
and Enrollment Platform for the 2017 Coverage Year
(39 States)
Number 11-1-16 to 12-24-16
(2)
% of Total
(3)
Total Plan Selections for the 2017 Plan Year
Total Plan Selections 8,744,148 100%
By Enrollment Status
New Consumers 2,122,939 24%
Total Reenrollees 6,621,209 75%
Active Reenrollees 4,327,129 49%
Other Reenrollees 2,294,080 26%
Unknown Reenrollment Type 0 0%
Subtotal: Plan Selections With Available Data on Enrollment Status 8,744,148 100%
By Gender
Female 4,762,616 54%
Male 3,981,532 46%
Subtotal: Plan Selections With Available Data on Gender 8,744,148 100%
By Age
Age < 18 835,659 10%
Age 18-25 894,639 10%
Age 26-34 1,398,785 16%
Age 35-44 1,363,132 16%
18
Marketplace Plan Selections by Gender, Age, Metal Level, Financial Assistance Status, Race/Ethnicity, Rural Status, and Household Income
in States Using the HealthCare.gov Platform (1) 11-1-16 to 12-24-16
Characteristics
Marketplaces Total States Using the HealthCare.gov Eligibility
and Enrollment Platform for the 2017 Coverage Year
(39 States)
Number 11-1-16 to 12-24-16
(2)
% of Total
(3)
Age 45-54 1,791,273 20%
Age 55-64 2,378,506 27%
Age ≥65 82,154 1%
Subtotal: Plan Selections With Available Data on Age (2) 8,744,148 100%
Ages 18 to 34 2,293,424 26%
Ages 0 to 34 3,129,083 36%
By Metal Level
Bronze 1,879,824 21%
Silver 6,453,296 74%
Gold 366,113 4%
Platinum 22,066 0%
Catastrophic 62,849 1%
Subtotal: Plan Selections With Available Data on Metal Level (4) 8,744,148 100%
By Financial Assistance Status
With Financial Assistance 7,227,705 83%
Without Financial Assistance 1,516,443 17%
Subtotal: Plan Selections With Available Data on Financial Assistance (2) 8,744,148 100%
APTC (With or Without CSR) 7,194,496 82%
19
Marketplace Plan Selections by Gender, Age, Metal Level, Financial Assistance Status, Race/Ethnicity, Rural Status, and Household Income
in States Using the HealthCare.gov Platform (1) 11-1-16 to 12-24-16
Characteristics
Marketplaces Total States Using the HealthCare.gov Eligibility
and Enrollment Platform for the 2017 Coverage Year
(39 States)
Number 11-1-16 to 12-24-16
(2)
% of Total
(3)
By Self-Reported Race/Ethnicity (3)
American Indian / Alaska Native 30,606 0%
Asian 573,544 7%
Native Hawaiian / Pacific Islander 6,419 0%
African-American 583,890 7%
Latino 882,755 10%
White 3,892,453 45%
Multiracial 86,450 1%
Subtotal: Plan Selections With Available Data on Self-Reported Race/Ethnicity 6,056,117 69%
Unknown Race/Ethnicity 2,688,031 31%
By Rural Status
In ZIP Codes Designated as Rural 1,574,502 18%
In ZIP Codes Designated as Urban 7,169,646 82%
Subtotal: Plan Selections With Available Data on Rural Status 8,744,148 100%
By Household Income
≥100% - ≤150% of FPL 2,939,556 34%
>150% - ≤200% of FPL 1,929,476 22%
>200% - ≤250% of FPL 1,258,368 14%
>250% - ≤300% of FPL 737,242 8%
>300%- ≤400% of FPL 778,431 9%
20
Marketplace Plan Selections by Gender, Age, Metal Level, Financial Assistance Status, Race/Ethnicity, Rural Status, and Household Income
in States Using the HealthCare.gov Platform (1) 11-1-16 to 12-24-16
Characteristics
Marketplaces Total States Using the HealthCare.gov Eligibility
and Enrollment Platform for the 2017 Coverage Year
(39 States)
Number 11-1-16 to 12-24-16
(2)
% of Total
(3)
Subtotal: Plan Selections With Available Data on Household Income 7,643,073 87%
Other/Unknown Household Income 1,101,075 13%
Notes: Percentages in this table have been rounded. Some numbers may not add to totals due to rounding. (1) Unless otherwise noted, the data in this table represent cumulative data on the number of unique individuals who have been determined eligible to enroll in a Marketplace plan, and have selected, been automatically reenrolled into, or been placed into a suggested alternate Marketplace medical plan (with or without the first premium payment having been received by the issuer). Individuals who have cancelled or terminated their Marketplace plans are not included in the total number of plan selections. These data also do not include: standalone dental plan selections; or individuals who may have selected a 2016 Marketplace plan during the reporting period, as a result of having been eligible for a Special Enrollment Period (SEP). For additional technical notes, please refer to the Addendum of this report.
(2) For each metric, the data represent the total number of “Individuals Applying for 2016 Coverage in Completed Applications” who have selected a 2017 medical Marketplace plan for enrollment through the Marketplace (with or without the first premium payment having been received directly by the issuer) during the reference period, excluding plan selections with unknown data for a given metric. This is also known as pre-effectuated enrollment, because enrollment is not considered effectuated until the first premium payment is made, and this figure includes plan selections for which enrollment has not yet been effectuated.
(3) For the 2017 reporting year, CMS is reporting percents that include all consumers; in previous years, ASPE reported percentages that represented the percent of plan selections with known data for that category. As a result, please note that data on race/ethnicity is not directly comparable to last year. Source: Centers for Medicare & Medicaid Services, as of 12-24-16.
21
APPENDIX TABLE A3
Marketplace Plan Selections by Gender, Age, Metal Level, and Financial Assistance Status in State-Based Marketplaces Using Their Own Marketplace Platforms (1)
11-1-16 to 12-24-16
Characteristics
Marketplaces Total State-Based Marketplaces Using Their
Own Marketplace Platforms for the 2017 Coverage Year
(12 States)
Number 11-1-16 to 12-24-16
(2)
% of Available Data, Excluding Unknown (3)
Total Plan Selections for the 2017 Plan Year (12 States Reporting)
Total Plan Selections 2,800,622 100%
By Enrollment Status (12 States Reporting New vs. Reenrollee; 10 States Reporting Active vs. Automatic Reenrollees)
New Consumers 541,054 19%
Total Reenrollees (4) 2,259,568 81%
Active Reenrollees 688,057 25%
Other Reenrollees 1,336,632 48%
Unknown Reenrollment Type 234,879 8%
By Gender (12 States Reporting)
Female 1,467,210 48%
Male 1,332,940 52%
Subtotal: Plan Selections With Available Data on Gender (5) 2,800,150 100%
Unknown Gender 472 N/A
By Age (12 States Reporting)
Age < 18 176,833 6%
Age 18-25 262,715 9%
Age 26-34 489,689 18%
Age 35-44 441,999 16%
22
Marketplace Plan Selections by Gender, Age, Metal Level, and Financial Assistance Status in State-Based Marketplaces Using Their Own Marketplace Platforms (1)
11-1-16 to 12-24-16
Characteristics
Marketplaces Total State-Based Marketplaces Using Their
Own Marketplace Platforms for the 2017 Coverage Year
(12 States)
Number 11-1-16 to 12-24-16
(2)
% of Available Data, Excluding Unknown (3)
Age 45-54 607,340 22%
Age 55-64 794,704 28%
Age ≥65 26,966 1%
Subtotal: Plan Selections With Available Data on Age (5) 2,800,246 100%
Unknown Age 376 N/A
Ages 18 to 34 752,404 27%
Ages 0 to 34 929,237 33%
By Metal Level (12 States Reporting) (6)
Bronze 749,625 27%
Silver 1,741,108 62%
Gold 182,228 7%
Platinum 94,897 3%
Catastrophic 32,929 1%
By Financial Assistance Status (12 States Reporting) (6)
With APTC 2,133,956 76%
Without APTC 666,892 24%
Notes: Percentages in this table have been rounded. Some numbers may not add to totals due to rounding.
(1) Unless otherwise noted, the data in this table represents cumulative data on the number of unique individuals who have been determined eligible to enroll in a Marketplace plan, and have selected or been automatically reenrolled into a Marketplace medical plan (with or without the first premium payment having been received directly by the issuer). Individuals who have cancelled or terminated their Marketplace plans are not included in the total number of plan selections except for two states (District of Columbia and Minnesota). These data also do not include: individuals who may have selected a 2016 Marketplace plan during the reporting period, as a result of having been eligible for a Special Enrollment Period (SEP). For additional technical notes, please refer to the Addendum of this report. (2) For each metric, the data represent the total number of “Individuals Applying for 2016 Coverage in Completed Applications” who have selected a 2017 medical Marketplace plan for enrollment through the Marketplace (with or without the first premium payment having been received directly by the issuer) during the reference period, excluding plan selections with unknown data for a given metric. This is also known as pre-effectuated enrollment, because enrollment is not considered effectuated until the first premium payment is made, and this figure includes plan selections for which enrollment has not yet been effectuated. The
23
sum of new enrollees and reenrollees in Vermont and Massachusetts did not match the reported total for plan selections due to slight differentials and were adjusted accordingly. (3) In some cases, the data for certain characteristics of Marketplace plan selections are not yet available. For this reason, for each metric, we have calculated the comparable percentages based on the number of plan selections with known data for that metric. (4) Minnesota and New York are unable to provide breakouts of active versus automatic reenrollees due to reporting system limitations, and as such, total reenrollees for these states are represented as unknown reenrollment type. In addition, due to reporting anomalies, the reported subtotals for active and automatic reenrollees for Colorado and Vermont sum to a total greater than the total number of reenrollees. These reporting discrepancies are adjusted in the unknown reenrollment type metric. The calculated percentages for active reenrollees, automatic reenrollees, and unknown reenrollment type are based on the sum of those reported metrics. (5) The reported subtotals for plan selections by gender and age do not sum to the total number of plan selections, and as such, plan selections without available data are reported in the unknown metric. (6) The reported subtotals for plan selections by metal level and financial assistance status sum to a total greater than the total number of plan selections due to some SBM reporting anomalies. (7) SBMs are unable to report data on cost sharing reductions only (i.e., separate from advance payments of the premium tax credit).
24
APPENDIX TABLE A4
Selected Enrollment-Related Information
11-1-16 to 12-24-16 (1)
Description
Marketplace Total,
All States
States Using the HealthCare.gov Eligibility and
Enrollment Platform
(39 States)
State-Based Marketplaces
Using Their Own Marketplace
Platforms (12 States)
Visitors to the Marketplace Websites (1) 26,952,462 19,407,351 7,545,111
Calls to the Marketplace Call Center 13,517,314
8,503,762 5,013,552
Number of Completed Applications 13,345,104 7,870,013 5,475,091
Number of Individuals Included in Completed Applications 18,092,827 10,874,870 7,217,957
Number of Individuals Determined Eligible to Enroll in a 2017 Plan Through the Marketplaces
13,432,885 9,910,054 3,522,831
Total Plan Selections 11,544,397 8,744,148 2,800,622
Notes:
(1) This includes visitors to both English and Spanish websites, so in some cases consumers who visited both may be double-counted.
###
Get CMS news at cms.gov/newsroom, sign up for CMS news via email and follow CMS on Twitter @CMSgovPress