49 1 Department of Geography, Visva-Bharati University, Santiniketan-731235, West Bengal, India. e-mail: [email protected]Földrajzi Értesítõ 2003. LII. évf. 1–2. füzet, pp. 49–61. Health pattern of the rural people in Lower Ganga Plain B.R.K. SINHA 1 Introduction Health is one of the basic themes of present day study. It contributes directly to welfare by reducing sickness, child mortality, as well as by increasing life expectancy and improving labour’s pro- ductivity. Health is considered as a pivotal for achieving over all development of a region. In other words, health is regarded as an indispensable human capital which plays a key role in improving the quality of life. The World Bank’s Sector Strategy (1997) rightly pointed out that good health contributes to the overall quality of life as well as to productivity. Health in this sense is not only an output of society and worthwhile in its own terms, it is also an asset for a community, a resource in the form of energy, abili- ty, talents and other mental and physical capabilities of normal functioning in a given environment. Health is however not a static phenomenon because it varies in space and time, across age, gender, class, education, occupation and income. Such variation is the cumulative effects of unequal distribution and development of social, economic, cultural, political and physical resources of chang- ing nature. African Development Report on Human Capital Development (1998), SING, A. K. (1983) and Human Development Report (1998) have also laid emphasis on several socio-economic aspects of population particularly on improved food and nutrition, education in improving health of the people as these elements interact positively in many ways in making out a good life at all spatial levels. Objectives In view of the above importance and problems, the present paper focuses on the variation in the pattern of health of the rural people across age groups and sex, social groups vis-a-vis educational and occupational categories. Finally, suggestion are made for improving the health status of the rural people for better life. Methodology Data base To accomplish the above work a rural Community Development Block i. e. Mangolkote of Burdwan District has been selected as a representative of the Lower
Transcript
49
1 Department of Geography, Visva-Bharati University, Santiniketan-731235, West Bengal, India.e-mail: [email protected]
Földrajzi Értesítõ 2003. LII. évf. 1–2. füzet, pp. 49–61.
Health pattern of the rural people in Lower Ganga Plain
B.R.K. SINHA1
Introduction
Health is one of the basic themes of present day study. It contributes directly to welfare byreducing sickness, child mortality, as well as by increasing life expectancy and improving labour’s pro-ductivity. Health is considered as a pivotal for achieving over all development of a region. In other words,health is regarded as an indispensable human capital which plays a key role in improving the quality oflife. The World Bank’s Sector Strategy (1997) rightly pointed out that good health contributes to theoverall quality of life as well as to productivity. Health in this sense is not only an output of society andworthwhile in its own terms, it is also an asset for a community, a resource in the form of energy, abili-ty, talents and other mental and physical capabilities of normal functioning in a given environment.
Health is however not a static phenomenon because it varies in space and time, across age,gender, class, education, occupation and income. Such variation is the cumulative effects of unequaldistribution and development of social, economic, cultural, political and physical resources of chang-ing nature. African Development Report on Human Capital Development (1998), SING, A. K. (1983)and Human Development Report (1998) have also laid emphasis on several socio-economic aspectsof population particularly on improved food and nutrition, education in improving health of the peopleas these elements interact positively in many ways in making out a good life at all spatial levels.
Objectives
In view of the above importance and problems, the present paper focuses onthe variation in the pattern of health of the rural people across age groups and sex,social groups vis-a-vis educational and occupational categories. Finally, suggestionare made for improving the health status of the rural people for better life.
Methodology
Data base
To accomplish the above work a rural Community Development Block i. e.Mangolkote of Burdwan District has been selected as a representative of the Lower
50
Ganga Plain from Eastern India. It is so because the nature and characteristics of thisBlock are similar to that of other parts of the Lower Ganga Plain. This Block com-prises 128 inhabited villages in which the share of Cultivators dominated and Agri-cultural Labourers dominated villages remains almost equal. Out of the total villages7 Cultivators dominated and another 7 Agricultural Labourers dominated villages al-together amounting to around 11% were separately selected for household survey fol-lowing the simple random sampling without replacement technique.
Similarly, 30 households from each village were selected following the sametechnique. Thus, the total number of villages and households became 14 and 420 re-spectively to serve as the ultimate sample units of study. Finally, the primary data re-lating to various qualitative and quantitative health indicators were collected from 420households comprising of 210 from Cultivators dominated and another 210 from Ag-ricultural Labourers dominated villages for synthesis and analysis of the data.
Concept of measuring health
Different scholars such as RAZA, M. (1990), TREWARTHA, G. T. (1967), SMITH,D. M. (1997), BASU, S. (1992), PACIONE, M. (1988), MADAN, G. R. (1983) andMUKHERJEE, B. M. (1986) and others have used different quantitative and qualitativeindicators such as height and weight of the body, body temperature, blood pressure,counts of red blood and white blood corpuscle, infant mortality rate, general mortali-ty, problems of hair, eyes, lips, gums, teeth, skin, gland, life expectancy, number ofdoctors, hospital and beds per unit population, safe water supply, literacy, education,per capita income, expenditure on health, disease of various types, food and nutrition,calorie intake, capacity to do manual work for standard working hours, clear eye sightand memory condition etc. in measuring health of the people but their quantitativeand qualitative indicators are applicable to the common people at regional, state andnational levels only. Investigators have considered only those quantitative and quali-tative parameters that are directly or indirectly related to mental and physical capaci-ties of individuals.
These are the number and types of diseases, condition of appetite, digestiveproblem, memory capacity, mental tension, blood pressure, eye problem, E.N.T. prob-lems, dizziness, physical and mental problem while working continuously for 6–8hours standard working period, problems arise during working period in sun, rain andcold, problems in carrying normal head load, state of sleeping, feeling of weaknessand tiredness, feeling of laziness, whether enthusiastic to work, whether two timesmeal and breakfast are taken in time, number of visit to government and private hos-pitals or clinics, per head total medical cost in the last one year, types of drinking water,number of days of pulse, green and other vegetables taken by the individuals in a week,how many days in a week an individual takes ghee/butter, milk, eggs, meat, fish etc.,frequency of taking smoking, tobacco, alcoholic materials, whether the food is ade-
51
quately available or not at household level, whether the house is ventilated orunventilated, whether breath is sweet or not, educational achievements including train-ing and skills and income levels etc.
Thus, while preparing master data sheets each variable was given certain pos-itive or negative weightage depending upon its positive or negative conditions of in-dividual. Thereafter, the total composite scores of all variables and also the total pos-itive or negative scores of each individual were separately worked out and serially list-ed from 1 to 1705.
Finally, for each person the percentage of positive composite score to totalcomposite score (i.e. positive composite score + negative composite score = 100 percent) was calculated. On the basis of variation in the percentages of positive compositescores of individuals five levels of health have been made. These are:
1. Very good (80 per cent and above positive composite score);2. Good (60–80 per cent positive composite score);3. Average (40–60 per cent positive composite score);4. Poor (20–40 per cent positive composite score);5. Very poor (less than 20 per cent positive composite score).
Analysis
Health pattern by age group and sex
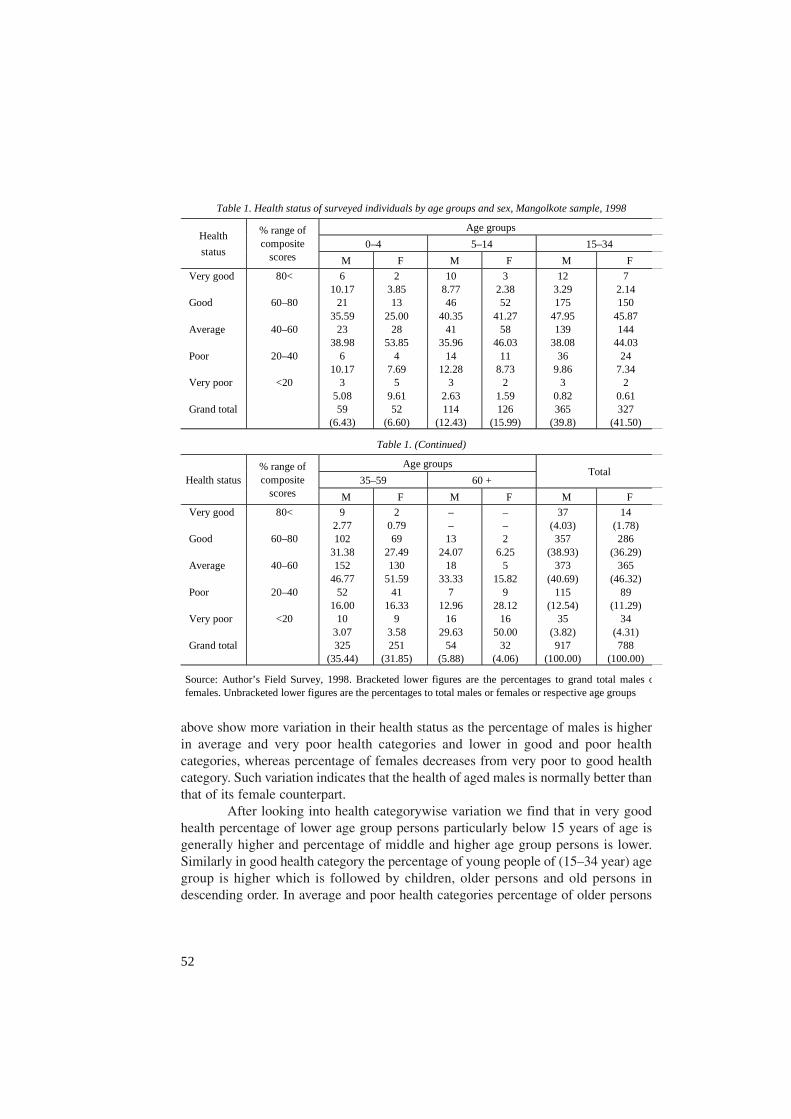
Table. 1 and Fig. 1 explain the variation in health pattern of the rural peopleat age and sex level. Variation in health of the infants shows that the percentage ofboth male and female children is highest in average health category that is followedby good, very good, poor and very poor in descending order in male category and bygood, very poor, poor and very good in female category. Variation in health of theschool going age group children shows that percentage of male children is highest ingood health category, whereas the percentage of female children is highest in aver-age health category. Next highest percentage of male children is in average health fol-lowed by poor, very good and very poor in descending order whereas in female cate-gory the next higher percentage is in good health followed by health levels similar tomale children.
When we look into the health quality of infants and school going age groupchildren we find that the health of the latter group is relatively better indicated by high-er percentage in good health. Variation in health among the younger working age group(15–34 year) persons shows that the percentage to total male or female population ofthis age group is highest in good health that is followed by the percentage of aver-age, poor, very good and very poor health. Older working age group (35–59 year)persons show their highest percentage in average health, higher in good, high in poor,low in very poor and very low in very good health. Similarly, aged persons of 60 and
52
above show more variation in their health status as the percentage of males is higherin average and very poor health categories and lower in good and poor healthcategories, whereas percentage of females decreases from very poor to good healthcategory. Such variation indicates that the health of aged males is normally better thanthat of its female counterpart.
After looking into health categorywise variation we find that in very goodhealth percentage of lower age group persons particularly below 15 years of age isgenerally higher and percentage of middle and higher age group persons is lower.Similarly in good health category the percentage of young people of (15–34 year) agegroup is higher which is followed by children, older persons and old persons indescending order. In average and poor health categories percentage of older persons
Table 1. Health status of surveyed individuals by age groups and sex, Mangolkote sample, 1998
Age groups
0–4 5–14 15–34 Health
status
% range of composite
scores M F M F M F
Very good Good Average Poor Very poor Grand total
80<
60–80
40–60
20–40
<20
6 10.17
21 35.59
23 38.98
6 10.17
3 5.08 59
(6.43)
2 3.85 13
25.00 28
53.85 4
7.69 5
9.61 52
(6.60)
10 8.77 46
40.35 41
35.96 14
12.28 3
2.63 114
(12.43)
3 2.38 52
41.27 58
46.03 11
8.73 2
1.59 126
(15.99)
12 3.29 175
47.95 139
38.08 36
9.86 3
0.82 365
(39.8)
7 2.14 150
45.87 144
44.03 24
7.34 2
0.61 327
(41.50)
Table 1. (Continued)
Age groups
35–59 60 + Total
Health status % range of composite
scores M F M F M F
Very good Good Average Poor Very poor Grand total
80<
60–80
40–60
20–40
<20
9 2.77 102
31.38 152
46.77 52
16.00 10
3.07 325
(35.44)
2 0.79 69
27.49 130
51.59 41
16.33 9
3.58 251
(31.85)
– –
13 24.07
18 33.33
7 12.96
16 29.63
54 (5.88)
– – 2
6.25 5
15.82 9
28.12 16
50.00 32
(4.06)
37 (4.03) 357
(38.93) 373
(40.69) 115
(12.54) 35
(3.82) 917
(100.00)
14 (1.78) 286
(36.29) 365
(46.32) 89
(11.29) 34
(4.31) 788
(100.00)
Source: Author’s Field Survey, 1998. Bracketed lower figures are the percentages to grand total males ofemales. Unbracketed lower figures are the percentages to total males or females or respective age groups
53
is generally highest and in very poor and poor categories the percentage of old person ishigher. As a whole it can be said that generally health of the children and young personsis better than that of older and old persons. Finally, we find that the majority or rural peoplepossess average health followed by good, poor, very poor and very good.
Health pattern by social groups
Social groups and health are the two important aspects of population. Socialgroup (the results of socio-economic conditions) is considered as a social force in
Fig. 1. Health status of surveyed individuals by age groups (AG, in years) and sex, 1998 (MangolkoteBlock). – Levels of health in percent: a = very good; b = good; c = average; d = poor; e = very poor; GT = grand total; M = male; F = female
54
health because each social group has different social pathology in affecting health ofits people.
Table 2 and Fig. 2 deal with the variation in health pattern of the rural peo-ple across different social groups. From the table and figure we find that the percent-age of persons having very good health decreases from Muslim to O.B.C., higher casteand finally to scheduled caste categories. Percentage of persons having good healthalso shows a decreasing trend from Muslim category to higher caste, O.B.C., sched-uled caste and scheduled tribe. Variation in average health of the rural people is remark-able as the percentage of persons having average health is highest in scheduled caste thatis followed by the percentage of scheduled tribe, scheduled caste and O.B.C. (in descend-ing order) and lower among the persons of Muslim and higher caste categories.
Table 2. Health status of the surveyed individuals by social groups, Mangolkote sample, 1998.
Social groups
H.C. Muslim O.B.C. Health status % range of composite
scores M F M F M F
Very good Good Average Poor Very poor Grand total
80<
60–80
40–60
20–40
<20
15 4.95 168
55.45 103
33.99 15
4.95 2
0.66 303
(33.04)
3 1.13 135
50.75 120
45.11 7
2.63 1
0.37 266
(33.76)
12 11.00
64 58.71
25 22.93
7 6.42
1 0.91 109
(11.89)
4 4.20 60
64.51 22
23.65 6
6.45 1
1.07 93
(11.80)
10 6.02 57
34.34 72
43.37 24
14.46 3
1.80 166
(18.10)
6 4.80 48
38.40 54
43.20 12
9.60 5
4.00 125
(15.86)
Table 2. (Continued)
Social groups
S.C. S.T. Total
Health status % range of composite
scores M F M F M F
Very good Good Average Poor Very poor Grand total
80<
60–80
40–60
20–40
<20
– –
37 19.68 104
55.32 35
18.62 12
6.38 188
(20.50)
1 0.59 25
14.88 101
60.12 37
22.02 4
2.38 168
(21.32)
– –
31 20.53
69 45.69
34 22.52
17 11.25 151
(16.47)
– –
18 13.23
68 50.00
27 19.85
23 16.91 136
(17.25)
37 (4.03) 357
(38.93) 373
(40.68) 115
(12.54) 35
(3.81) 917
(100.00)
14 (1.77) 286
(36.29) 365
(46.32) 89
(11.29) 34
(4.31) 788
(100.00)
Source: See Table 1.
55
In fine, we can say that health of the Muslims, higher caste and O.B.C. is compara-tively better than that of the scheduled caste and scheduled tribe persons. Such variation in healthstatus may be because of better food and nutrition, education, health awareness and better lifestyle of higher caste, O.B.C. and Muslims and lack of proper food and nutrition’s, education,health awareness as well as poor life style, food and drink habits etc. Finally grand total varia-tions in health status is the same as in the case of age and sex groups.
Health pattern by educational achievements
Education and health are very important characteristic features of population.Here, education acts as an important factor in determining health level. Education plays
Fig. 2. Health status of surveyed individuals by social groups (SG), 1998 (Mangolkote Block).– I = schedule tribe; II = schedule caste; III = other backward classes; IV = muslims; V = higher caste; a–e, M, F and GT = for explanation see Fig. 1
56
a very crucial role in health. According to African Development Report (1998) edu-cation is considered as an important factor which effects the health and life expect-ancy of individuals because it equips them with the knowledge and the means topresvent, control and detect diseases. Table 3 and Fig. 3 analyse the variation in healthpattern across different educational categories. It is clear from the table and figure thatthe percentage of illiterate, primary, and junior secondary females and under gradu-ate males is higher in average health whereas the percentage of good health is higheramong junior secondary males, secondary and higher secondary males and femalesand among post graduate males. Secondly, percentage of those having professional/technical education and post graduate females is highest in very good health. In poorhealth category the percentage of under graduate females is highest which may bebecause of certain reasons relating to disease.
Table 3. Health status of surveyed individuals by educational achievement, Mangolkote sample, 1998.
Levels of education
Illiterate Primary Jr. Sec. Sec + H.S. Health status % range of composite
scores M F M F M F M F
Very good Good Average Poor Very poor Grand total
80<
60–80
40–60
20–40
<20
1 0.60 38
22.62 68
40.47 42
25.00 19
11.31 168
(18.32)
1 0.48 42
20.19 105
50.48 37
17.79 23
11.06 208
(26.40)
1 0.67 46
30.67 67
44.67 28
18.66 8
5.33 150
(16.36)
1 0.46 87
39.91 108
49.54 16
7.34 6
2.75 218
(27.66)
2 1.01 102
51.52 73
36.87 16
8.02 5
2.52 198
(21.59)
3 1.92 67
42.95 71
45.51 11
7.05 4
2.57 156
(19.80)
5 2.53 95
47.98 81
40.91 15
7.57 2
1.01 198
(21.59)
2 1.23 78
47.85 72
44.17 10
6.14 1
0.61 163
(20.69)
Table 3. (Continued)
Levels of education
U.G P.G Prof./Tech. Total
Health status % range of composite
scores M F M F M F M F
Very good Good Average Poor Very poor Grand total
80<
60–80
40–60
20–40
<20
15 9.49 57
36.08 75
47.47 10
6.33 1
0.63 158
(17.23)
3 10.34
8 27.59
5 17.24
13 44.83
– 29
(3.68) –
9 24.32
16 43.24
8 21.62
4 10.82
– 37
(4.03) –
3 27.27
3 27.27
3 27.27
2 18.18
– 11
(1.40) –
4 50.00
3 37.50
1 12.50
– – 8
(0.88) – –
1 33.33
1 33.33
1 33.33
– – 3
(0.38) – –
37 (4.03) 357
(38.93) 373
(40.68) 115
(12.54) 35
(3.82) 917
(100.00)
14 (1.78) 286
(36.30) 365
(46.32) 89
(11.29) 34
(4.31) 788
(100.00) Source: See Table 1.
57
After looking into the over all picture we find that the percentage of personshaving very good health sharply decreases from higher educational levels to lowereducational levels. Similarly, the percentage of persons possessing poor and very poorhealth health generally decreases from lower educational level to higher educationallevels leaving aside some exceptional cases in under graduate and post graduate edu-
Fig. 3. Health status of surveyed individuals by sex and level of education (LE) categories, 1998(Mangolkote Block). – I = prof/tech; II = postgraduate; III = undergraduate; IV = sec-8 and h-sec;V = junior-secondary; VI = primary; VII = illiterate; a–e, M, F and GT = for explanation see Fig. 1
58
cational categories. Percentage of good health is generally found higher among thepersons of medium educational levels. Whereas the percentage of average health isgenerally found higher towards lower educational levels as well as towards mediumlevels of education. The above variation thus may be taken into consideration as theresult of variation in educational achievements.
Health pattern by different occupations
Health and occupation are the two important qualitative characteristics ofpopulation. Different occupations are found influencing health differently. Different
Table 4. Health status of surveyed individuals engaged in different occupations, Mangolkote sample, 1998.
Economic functions
Primary Secondary
Cultivator Agril. Labour L.S. Farming Mining quarry
Industiral activities
Health status and % range of
composite scores
M F M F M F M F F M
Very good 80<
Good 60–80
Average 40–60
Poor 20–40
Very poor <20
Grand total
4 2.21 54
29.03 68
37.57 48
26.52 7
3.88 181
(32.61)
1 13.51
25 33.78
33 44.59
12 16.22
3 2.70 74
(30.45)
2 1.23 43
26.54 95
58.64 11
6.79 11
6.79 162
(2919)
1 0.77 42
32.31 53
40.77 18
13.85 16
12.31 130
(53.49)
– – 8
25.81 16
51.61 6
19.35 1
3.22 31
(5.58)
– – 4
50.00 3
37.50 1
12.50 – – 8
(3.29)
1 10.00
5 50.00
4 40.00
– – – –
10 (1.80)
– – – – – – – – – – – –
2 16.67
7 58.33
3 25.00
– – – – 12
(2.16)
– – – – – – – – – – – –
Table 4. (Continued)
Economic functions
Secondary Tertiary
Const. work Trans. Comm.
Comm. Activities
Others
Total Health status
and % range of composite
scores M F M F M F M F M F
Very good 80<
Good 60–80
Average 40–60
Poor 20–40
Very poor <20
Grand total
1 12.50
3 37.50
4 50.00
– – – – 8
(1.44)
– – – – 3
100.00 – – – – 3
(1.23)
– – 9
50.00 2
11.11 5
27.78 2
11.11 18
(11.61)
– – – – – – – – – – – –
7 10.00
36 51.43
25 35.71
1 1.43
1 1.43 70
(21.61)
– – – – 2
40.00 – 3
60.00 – 5
(2.05)
6 9.52 34
53.97 15
23.81 5
7.94 3
4.76 63
(11.35)
2 8.69 10
43.48 7
30.43 2
8.69 2
8.69 23
(9.46)
23 (4.14) 199
(35.85) 232
(41.80) 76
(13.69) 25
(4.50) 555
(100.00)
4 (1.65)
83 (34.16)
99 (40.74)
36 (14.81)
21 (8.64) 243
(100.00) Source: See Table 1.
59
occupation has different problems which in turn affects adversely the health of workingpersons. MEHTA, R. (1998) has intensively worked on occupational health in whichhe has emphasised on environmental conditions such as work environment, socialenvironment, physical environment, undue physical and mental stress at work placein influencing health of the workers. BETTOLO, M. and BATTISTA, G. (1996) alsodiscussed about occupational health of workers and pointed out that different typesof occupational diseases adversely effect the health of working persons.
Table 4 and Fig. 4 clearly exhibit the variation in health of the rural peopleacross different economic functions. When we look into the variation of health pat-
Fig. 4. Health status of surveyed individual working persons (WP) engaged in different occupations,1998 (Mangolkote Block). – I = services; II = commercial; III = transport and communication;IV = construction; V = industries; VI = mining and quarrying; VII = livestock farmers; VIII = agrarians; IX = cultivators; a–e, M, F and GT = for explanation see Fig. 1
60
tern, we find that in very good health the percentage of females engaged in cultiva-tion as cultivators, males engaged in industrial and construction works is relativelyhigher. In good health category the percentage of persons engaged in commercial andother activities relatively higher and those belonging to this health category and areengaged particularly in primary economic functions show relatively lower percent-age.
Similarly, in average health category the percentage is found comparativelyhigher among the persons of primary economic functions. In poor and very poor healthcategories the percentage is fairly higher among the persons found engaged as culti-vators, agricultural labourers and livestock farmers.
As a whole we can say that in general health of the persons engaged in sec-ondary and tertiary economic functions is generally better and the health of those en-gaged in primary activities is relatively poor as indicated by higher percentages inaverage, poor and in very poor categories.
Such variation may be due to better socio-economic conditions of secondaryand territory workers than that of primary workers. This may also be because of com-paratively better education and better health accessibility for those found engaged inthe activities other than agricultural.
Findings and suggestions
Findings of the study show that health varies among the persons of differentage groups. Children and young persons show comparatively better health than thatof older and aged persons.
Social groupwise variation shows that health of higher caste persons andMuslims are relatively better than that of other backward class, scheduled caste andscheduled tribe persons. It has also been found that better educated persons possessgenerally better health.
Occupationwise variation also shows that health of the secondary and tertia-ry workers is generally better than that of primary workers.
Thus, it is suggested that essential medical and health facilities of differenttypes at different levels in combination with essential educational facilities, food andnutrition, etc. must be made available in all the villages of the Block and while dis-tributing or allocating such infrastructure special emphasis should be given on femalesof different age groups, on older and old people, S.C., S.T. and other backward castesin the Block.
The children below 15 years should be taken special care of their physicaland mental health with the provision of compulsory education and health. Once theabove measures are adopted and properly utilised, then the male–female, agegroupwise, social groupwise and villagewise gaps in health will considerably be re-duced. These efforts will enable the rural people to live a life of peace and comfort.
61
REFERENCES
African Development Report on Human Capital Development. – African Development Bank, Ox-ford University Press, New York 1998.
BASU, S. 1992. Nutritional status, Physical growth, Trends and Health problems among the tribalpopulation of Bastar district, M. P. – In: TEWARI, P.D. and TRIPATHI, R.S.: Dimensions ofScheduled Tribes Development in India, Uppal Publishing House, New Delhi.
Human Development Report published for the United Nations Development Programme (UNDP). –Oxford University Press, Delhi. 1998.
MADAN, G. R. 1983. India’s Social Problems. – Social Disorganisation and Reconstruction, Vol. I,Allied Publishers Pvt. New Delhi.
BETTOLO, M. and BETISTA, G. 1996. Introduction in B. COLOMBO, P. DEMÉNY and M. F. PERUTJ: Re-sources and Population. Natural, Institutional and Demographic Dimensions of Develop-ment, Clarandon Press, Oxford.
MEHTA, R. 1998. Occupational Health: Am Overview. – In: BAJPAI, P. K.: Social Work Perspective onHealth, Rawat Publications, Jaipur.
MUKHERJEE, B. M. 1986. Ageing Members and their Health in Changing Techno-Economic Condi-tion. – In: CHAUDHURY, B.: Tribal Health, Socio-Cultural Dimensions, Inter-India Publica-tion, New Delhi.
PACIONE, M. 1988. The Geography of the Third World. – Progress and Prospects, Routledge, LondonRAZA, M. 1990. Education, Development and Society. – Vikas Publishing House Pvt. Ltd., New
Delhi.SMITH, D. M. 1977. Human Geography: A Welfare Approach. – Edward Arnold Ltd., LondonSINGH, A. K. 1983. Health Modernity Education in India. – Social Change, Vol. 13. No. 2. Journal of
the Council for Social Development, 53 Lodi Estate, New Delhi.The World Banks’s Sector Strategy. 1997. Health, Nutrition & Population, The Human Develop-
ment Network. – The World Bank’s Group, Washington D. C., U.S.A.TREWARTHA, G. T., ROBINSON, A. H. and HAMMAND, E. H. 1967. Elements of Geography. – Physical
and Cultural, McGraw Hills Book Company, New York.