Trends in Psychology / Temas em Psicologia DOI: 10.9788/TP2018.4-17En ISSN 2358-1883 (online edition) Article Trends Psychol., Ribeirão Preto, vol. 26, nº 4, p. 2185--2201 - December/2018 ––––––––––––––––––––––––––––––––––––––––––– * Mailing address: Universidade Lusófona do Porto, Faculdade de Psicologia, Educação e Desporto, R. de Augusto Rosa, 24, 4000-098 Porto, Portugal. E-mail: [email protected], [email protected], angelamtleite@gmail. com, [email protected] and [email protected]Health Perception: Validation of a Scale for the Portuguese Population Teresa Soares Souto *, 1 Orcid.org/0000-0001-7268-1747 Ana Ramires 2 Orcid.org/0000-0002-3028-0563 Ângela Leite 2 Orcid.org/0000-0003-0560-1756 Vanessa Santos 1 Orcid.org/0000-0003-2197-3971 Raquel Espírito Santo 1 Orcid.org/0000-0003-0632-6338 –––––––––––––––––––––––––––––––––––––––– 1 Universidade Lusófona do Porto, Porto, Portugal 2 Universidade Europeia, Lisboa, Portugal Abstract The validity of health perception construct has increased over time; people assess better their health status due to an increased level of education. Different instruments have been developed to assess this dimension of health. This study aims to validate for the Portuguese adult population of the Health Perception Questionnaire due to the inexistence in the Portuguese context of a validated instrument that assess health perception. It is a self -report instrument that evaluates health perception in three moments - past, present and future, resistance and attitudes towards the disease.1,139 subjects from the general population, aged between 18 and 79 years and mostly women, participated. Exploratory and confirmatory factorial analyzes were carried out. A second order model was found, where health perception is defined around two factors - current health (seven items) and previous health (two items). The experience of serious or significant illness, as well as well-being and health, are assumed as key elements in the individual construction of the previous and current health perception respectively. Keywords: Psychology, health, behavioural medicine, validation studies, psychometrics. Percepção da Saúde: Validação de uma Escala para a População Portuguesa Resumo A validade do construto perceção da saúde tem aumentado ao longo do tempo; as pessoas avaliam melhor a sua saúde devido a um acréscimo da escolaridade. Diferentes instrumentos têm sido
Transcript
Trends in Psychology / Temas em Psicologia DOI: 10.9788/TP2018.4-17EnISSN 2358-1883 (online edition)
Article
Trends Psychol., Ribeirão Preto, vol. 26, nº 4, p. 2185--2201 - December/2018
–––––––––––––––––––––––––––––––––––––––––––* Mailing address: Universidade Lusófona do Porto, Faculdade de Psicologia, Educação e Desporto, R. de Augusto
1Universidade Lusófona do Porto, Porto, Portugal2Universidade Europeia, Lisboa, Portugal
Abstract
The validity of health perception construct has increased over time; people assess better their health status due to an increased level of education. Different instruments have been developed to assess this dimension of health. This study aims to validate for the Portuguese adult population of the Health Perception Questionnaire due to the inexistence in the Portuguese context of a validated instrument that assess health perception. It is a self -report instrument that evaluates health perception in three moments - past, present and future, resistance and attitudes towards the disease.1,139 subjects from the general population, aged between 18 and 79 years and mostly women, participated. Exploratory and confi rmatory factorial analyzes were carried out. A second order model was found, where health perception is defi ned around two factors - current health (seven items) and previous health (two items). The experience of serious or signifi cant illness, as well as well-being and health, are assumed as key elements in the individual construction of the previous and current health perception respectively.
Percepção da Saúde: Validação de uma Escala para a População Portuguesa
ResumoA validade do construto perceção da saúde tem aumentado ao longo do tempo; as pessoas avaliam melhor a sua saúde devido a um acréscimo da escolaridade. Diferentes instrumentos têm sido
Souto, T. S., Ramires, A., Leite, A., Santos,V., Santo, R. E.2186
Trends Psychol., Ribeirão Preto, vol. 26, nº 4, p. 2185--2201 - December/2018
desenvolvidos para avaliar esta dimensão da saúde. Este estudo tem como objetivo a validação para a população adulta portuguesa do Health Perception Questionnaire, dada a inexistência no contexto português de instrumento validado que avalie a perceção da saúde. É um instrumento de autoresposta que avalia a perceção da saúde em três momentos - passado, presente e futuro, a resistência e atitudes em relação à doença. Participaram 1,139 sujeitos da população geral, com idades entre os 18 e os 79 anos e maioritariamente mulheres. Foram realizadas análises fatoriais exploratória e confi rmatória, tendo sido encontrado um modelo de 2.ª ordem, onde a perceção da saúde se defi ne em torno de dois fatores – saúde atual (sete itens) e saúde anterior (dois itens). A vivência de doença grave ou signifi cativa, assim como o bem-estar e a saúde, assumem-se como elementos chave na construção individual da perceção de saúde anterior e atual respectivamente.
Palavras-chave: Psicologia, saúde, medicina do comportamento, estudos de validação, psicometria.
Percepción de la Salud: Validación de una Escala para la Población Portuguesa
ResumenLa validez del constructo percepción de la salud ha aumentado a lo largo del tiempo; las personas evalúan mejor su salud debido al aumento en el nivel de escolaridad. Diferentes instrumentos se han desarrollado para evaluar esta dimensión de la salud. Este estudio tiene como objetivo la validación para la población adulta portuguesa del Health Perception Questionnaire, en ausencia de instrumento validado para evaluar la percepción de la salud en el contexto portuguése Es un instrumento de autorespuesta que evalúa la percepción de la salud en tres momentos - pasado, presente y futuro, la resistencia y actitudes en relación a la enfermedad. Participaron1,139 sujetos de la población general, con edades entre los 18 y los 79 años y mayoritariamente mujeres. Se realizaron análisis factoriales exploratorios y confi rmatorios, habiendo sido encontrado un modelo de 2ª planta, donde la percepción de la salud se defi ne en torno a dos factores - salud actual (siete ítems) y salud anterior (dos ítems). La vivencia de enfermedad grave o signifi cativa, así como el bienestar y la salud, se asumen como elementos clave en la construcción individual de la percepción de salud anterior y actual respectivamente.
Palabras clave: Psicologia, salud, medicina de la conducta, estudios de validación, psicometría.
Theoretical Framework
Health Perception Construct Perception is a process in which the
individual organises the sensory stimuli into meaningful information (Hamlyn, 2017; Ross, 2010). Although many authors have tried to defi ne the concept of health, each person has an individual perspective of health and illness (Azêdo, 2010; Saleh et al., 2017; Santos, Barbosa, Faro, & Alves, 2005) and, therefore, of her/his own health. From a patient’s point of view, health refers to the ability to live expressed in a state of health (Krabbe, 2016), referring to the way the subject perceives it considering the stimuli received, not focusing only on the
objective medical indications but on assessing her/his health (physically and mentally; McPherson, Melvin, Belew, & McGraw, 2016; Vintém, 2008). “Health perception encompasses both physical and mental well-being and, for some, even spiritual attainment” (Crown, 2012, p. 791). These are personal beliefs and assessments of the general state of health that show how people consider themselves to be well or not. It is a subjective concept, and an individual’s perceptions can refl ect feelings and beliefs more than their current physical state (Ware, Johnston, Davies-Avery, & Brook, 1979; Ware & Karmos, 1976). General perceptions of health represent an integration of various health concepts such as mental health (Post, 2014).
Health Perception: Validation of a Scale for the Portuguese Population. 2187
Trends Psychol., Ribeirão Preto, vol. 26, nº 4, p. 2185--2201 - December/2018
During the last few years, researchers have found that individual perceptions affect healthy behaviours (e.g. Coleman, Hicks-Coolick, & Brown, 2015; Rubin et al., 2016). According to a Directorate-General of the European Commis-sion (Eurostat) study (2015) on the perception of health of the European Union population, two main indicators stand out: health perception, as a global indicator for health in general, and chron-ic morbidity as an evaluation of the presence of long-term diseases or health problems. Two in three Europeans over 16 years old perceive their health as very good or good. Particularly in Por-tugal, about 46% of the population report this same perception, but with a very marked gender discrepancy, with men tending to evaluate their health more favourably than women (Eurostat, 2015). Health perception varies from country to country (Assari, 2014; Assari & Lankarani, 2015).
Studies in the general population indicate that health perception is an important predic-tor of health outcomes (Goodwin & Engstrom, 2002; Zahrt & Crum, 2017). This predictive value can be explained by the role played by the characteristics of the personality in the way it is individually perceived as to the existence or not of medical problems. This health perception is decisive in decision-making in the context of health interventions, because it predicts the use of appropriate care (Cloninger & Zohar, 2011). Health perception has been studied related to: the perception of illness (e.g. Meuleman, Chil-cot, Dekker, Halbesma, & van Dijk, 2017), qual-ity of life (e.g. Shetty, Wertheim, & Butt, 2017), health outcomes (e.g. Conner & Norman, 2017), general well-being (e.g. Salloum, Cloninger, Salvador-Carulla, & Otero, 2016), psychologi-cal well-being (e.g. Fastame, Hitchcott, & Pen-na, 2017), happiness (e.g. Ngnoumen & Langer, 2016), depression (e.g. Oliveira et al., 2016) and anxiety (e.g. Lee & Sung, 2017), among others. The validity of the construct of health percep-tion has increased over time; people are better equipped to assess their health because of their increased level of education and cognitive skills, as well as increased exposure to health informa-
tion, and the source of this information is very relevant (Schnittker & Bacak, 2014).
Instruments that Evaluate the Health and Illness Perception
According to the literature, there are more instruments available that evaluate illness per-ception rather than that of health. Among those that evaluate illness perception, the following stand out:
The Brief Illness Perception Questionnaire (Brief IPQ) by Ng (2012) whose dimensions are: identity of illness, cause of illness, time of illness, consequences of illness and control of illness.
The Revised Illness Perception Question-naire (IPQ-R) by Moss-Morris and colleagues (2002), whose dimensions are: illness identity, illness time (acute/chronic), illness time (cyclic), illness consequences, personal control over ill-ness, control of illness, treatment of the illness, emotional representations about the illness, ill-ness coherence, psychological attributions of the illness, attributions of risk factors of the illness, attributions of illness immunity and attributions of opportunity towards the illness.
Among those that evaluate the perception of health, the following stand out: Perception of Health Scale by Diamond, Becker, Arenson, Chambers, and Rosenthal (2007), whose dimen-sions are: self-control, self-awareness, certainty and importance of health.
36-Item Short Form Survey (SF-36) by Ware and Sherbourne (1992), whose dimen-sions are: limitations in physical activities due to health problems, limitations in social activities due to physical or emotional problems, limita-tions in usual functional activities due to physi-cal health problems, body pain, general mental health – psychological distress and well-being, limitations in activities of habitual functions due to emotional problems, vitality – energy and fa-tigue and general perceptions of health.
General Health Questionnaire by Goldberg and Hillier (1979) whose dimensions are: so-matic symptoms, anxiety and insomnia, social dysfunction and severe depression.
Souto, T. S., Ramires, A., Leite, A., Santos,V., Santo, R. E.2188
Trends Psychol., Ribeirão Preto, vol. 26, nº 4, p. 2185--2201 - December/2018
Health Perception Questionnaire (HPQ) by Ware (1976) whose dimensions are: current health, prior health, health outlook, disease re-sistance, health concerns and illness orientation. The dimensions of current health, prior health and health outlook allow us to know the per-ception of health over time, respectively, prior, present and future. The dimension of resistance to disease assesses the individual’s vulnerabil-ity to illness. The health concern dimension ex-presses the importance attributed to health in their lives and, fi nally, the orientation of the ill-ness is related to the behaviours adopted towards the illness. This latter dimension differs greatly from the previous three, insofar as it relates to health behaviours that result from a combina-tion of knowledge, practices and attitudes that contribute to motivating actions taken in relation to health; health behaviours are also related to health outcomes (Conner & Norman, 2017).
In the Portuguese context, there is no vali-dated instrument that evaluates health percep-tion, so the present study intends to fi ll this gap, aiming to validate the HPQ for the Portuguese population. This choice stems from the fact that this instrument evaluates health perception over time (prior, present and future perspectives), al-lowing a temporal analysis of the construct; in addition, it appreciates above all the construct of health perception, being one of the most com-monly used aspects in research (e.g. Anthony & Barry, 2009; Lee & Oh, 2013; Michaelson, Pickett, Vandemeer, Taylor, & Davison, 2016; Tourani et al., 2018). Specifi cally, Anthony and Barry (2009) pointed out that the scores ob-tained on the previous health and disease resis-tance subscales differed signifi cantly regarding the gender variable, with men reporting higher mean scores than women. In addition, the results of the health concern subscale differed among the homeless participants.
In the context of health perception, Michael-son and collaborators (2016) emphasise that the perception of good health is associated with the fact that health perception is personalised and subjective. On the other hand, Tourani and col-leagues (2018) point out that both health evalu-ation and the evaluation of health outcomes al-
lows for assessment of the performance of health plans and their impact, constituting a source of information for decision-makers in the realm of effective decision-making based on scientifi c ev-idence. Finally, Lee and Oh (2013) pointed out that health concerns and anxiety (sub-variables of health perception) affected the perceived ben-efi t as well as the perceived barriers (sub-vari-ables of belief about health) and that the con-cerns and health anxiety signifi cantly affected exercise- and welfare-oriented activities and the pursuit of hobbies (sub-variables associated with life satisfaction).
The most important advantages of the HPQ are the fact that it was one of the instruments that was used to develop the SF-36, a 36-item tool (Ware & Sherbourne, 1992) used to assess health status in the Medical Outcomes Study (MOS) and used in the Rand Health Insurance Experiment as a predictor of the use of mental health care (Ware et al., 1979).
Methods
SampleThe sample is composed of 1,139 partici-
pants from the general Portuguese adult popula-tion: the majority (69%) are female; their ages range from 17 to 79 years with a mean age of 31 years (SD 13.45), and half of the respondents are under 25 years of age; about half of the partici-pants in the study (47%) have a higher academic degree and, in approximately equal parts (20% each), a lower than secondary education and a complete secondary education (Table 1).
InstrumentThe HPQ (Ware, 1976) is a self-response
tool that evaluates health perception at three moments - prior, present and future - and resistance to and attitudes towards illness (Ware, Manning, Duan, Wells, & Newhouse, 1984). The HPQ was constructed for the US population in general by Ware et al. (1979) and validated for the Mexican population by Beaman, Reyes-Frausto, and Garcia-Pena (2003), which is the only available translation. The HPQ consists of 33 items in the form of a statement that are
Health Perception: Validation of a Scale for the Portuguese Population. 2189
Trends Psychol., Ribeirão Preto, vol. 26, nº 4, p. 2185--2201 - December/2018
evaluated on a 5-point Likert scale (from 1 - completely false statement to 5 - completely true statement). In this set of 33 items, 27 form six subscales: current health (nine items - 1, 4, 9, 12, 17, 22, 26, 30, 32), prior health (three items - 11, 19, 28), health outlook (four items - 5, 10, 18, 23), resistance to illness (four items - 3, 7, 15, 29), health concern (fi ve items - 6, 13, 20, 24, 33) and sickness orientation (two items - 16, 25). Scores are calculated for each of the six subscales. Among these 27 items are the 22 items that give rise to the General Health Rating Index of Ware and colleagues (1984) and that evaluates general health. The score of two of the subscales - health concerns and sickness orientation - were reversed given that they were negative regarding the subject. Thus, a high score on the total HPQ and its subscales represents a better
Table 1Frequencies Distribution (%) of Sociodemographic Variables
Sociodemographicvariables
Sample
Total Subsample 1 Subsample 2
(N = 1,139) (N = 565) (N = 574)
Sex
Male 31.08 28.88 31.79
Female 68.92 71.12 68.21
Age (years)
< 25 49.96 54.87 48.38
25–35 23.27 19.86 24.36
36–45 10.10 10.11 9.98
46–55 8.69 7.94 8.93
56–65 5.36 4.69 5.57
> 66 2.72 2.53 2.78
Academic degree
PhD 0.09 0.12
MSc 1.84 1.44 1.97
BSc 45.39 50.90 43.62
Secondary 19.84 11.19 22.62
Elementary-nine years 10.18 9.03 10.56
Elementary-six years 20.28 25.63 18.56
Elementary-four years 2.37 1.81 2.55
health perception. In the study of the validity of the psychometric characteristics of the HPQ performed by Ware and colleagues (1979), the factorial analysis procedures of the preliminary tests confi rmed the existence of the six main factors and indicated that each scale contributes with unique information relevant to health perception. The reliability values ranged from .59 (sickness orientation) to .91 (current health), being slightly lower in the groups characterised by lower socioeconomic status, lower schooling and older age (Ware et al., 1979). The test reliability of the HPQ at one, two and three year intervals was .66, .59 and .56, respectively (Ware et al., 1984). Regarding the validity, the factorial analysis procedures of the preliminary tests confi rmed the existence of six main factors (Ware & Gandek, 1998). However, there are six
Souto, T. S., Ramires, A., Leite, A., Santos,V., Santo, R. E.2190
Trends Psychol., Ribeirão Preto, vol. 26, nº 4, p. 2185--2201 - December/2018
items in the questionnaire that do not integrate these dimensions and are related to rejection of a sick role and attitudes towards going to the doctor (Davies, Sherbourne, Peterson, & Ware, 1988). Connelly, Philbrick, Smith, Kaiser, and Wymer controlled differences related to physical health and found signifi cant associations among the perceptions about health and anxiety, depression, worry and behavioural use, such as the number of visits and phone calls to physicians (1989). The HPQ correlated .46 with the Quality of Well Being Scale and .52 with the Sickness Impact Profi le (Read, Quinn, & Hoefer, 1987).
Table 2 shows the descriptive analysis for the total sample of HPQ responses, corresponding to the numbering of the items to that of the original instrument. The 27 items did not present signifi cant deviations from normality (| sk | <3 and | ku | <10; Kline, 2015).
ProceduresThe HPQ was translated and back-trans-
lated by three researchers (two Portuguese and one English). The conceptual and semantic equivalence of the items was analysed, the operational equivalence was evaluated, and the authors decided to maintain the form of application of the questionnaire, as well as its instructions.
The HPQ has been administered to indivi-duals in the general adult population, in various contexts such as academic, professional and rec-reational. Participants in the study were informed of its purpose, of the voluntary nature of partici-pation and had the assurance of confi dentiality and anonymity of the information collected. A pilot study was conducted in advance to ensure effective understanding of the formulation of the different items that make up the scale. In gen-eral, the participants understood the items well and had no diffi culty answering the questions.
Results
To fulfi l the objective of the study, the vali-dation of HPQ for the Portuguese population, a sample of 1,139 individuals was used. The HPQ factorial structure was evaluated by randomly
splitting the sample into two subsamples: the exploratory factorial analysis (EFA) was per-formed in a subsample with 565 participants and the confi rmatory factorial analysis (CFA) in the other subsample with 574 participants (Fabrigar, Wegener, MacCallum, & Strahan, 1999). Con-sequently, HPQ validation, which involved the development and specifi cation of the measure-ment model, was performed in two steps. Statis-tical analysis was performed using SPSS 22 and Amos 22 software.
EFAThe subsample used in the fi rst stage of the
study is characterised by the majority being fe-male (71%) and less than 25 years old (55%). About half of these participants had a bachelor’s degree (51%) and about a fourth, a lower sec-ondary education (26%; Table 1).
In this exploratory step, to validate the structure of the 27 items of the six constructs of the HPQ, the EFA technique was used (with main component analysis, varimax orthogonal rotation and factor extraction according to the Kaiser rule). The adequacy of the sample was analysed according to the Kaiser-Meyer-Olkin statistic (.70 to .80 being acceptable and > .80 being excellent) and the Bartlett sphericity test (p < .05); the factorial and discriminant validity of the items was verifi ed by the factorial weights (high in a single factor and greater than .50) and the level of internal consistency of each factor by the Cronbach’s alpha index (between .60 and .70, acceptable and above .70, recommended; Hair, Black, Babin, & Anderson, 2014).
The subsample presented adequacy for the EFA procedure, KMO = .82; χ2 (351) = 4084.58, p < .001. In the structure of the initial solution, composed of seven factors, items with reduced commonalities (< .35) and the absence of fac-torial and discriminant validity were identifi ed. After successive elimination of each of these items, the procedure was repeated, and the re-sults again indicated suitability of the sample for the analysis, KMO = .83; χ2 (91) = 241451, p < .001. The resulting factor structure (Table 3) was well defi ned and presented factorial (λ’s > .58) and discriminant validity, being composed of 14
Health Perception: Validation of a Scale for the Portuguese Population. 2191
Trends Psychol., Ribeirão Preto, vol. 26, nº 4, p. 2185--2201 - December/2018
Table 2Descriptive Statistics of the Responses to the Perception Health Questionnaire (N = 1,139)
Item Mean Standard deviation Asymmetry Kurtosis
1 According to the doctors I have seen, my health is now excellent. 3.63 0.89 −0.48 −0.16
3 I seem to get sick a little easier than other people. (Inverted) 3.83 0.97 −0.89 0.39
4 I feel better now than I ever have before. 2.91 0.98 0.18 −1.16
5 I will probably be sick a lot in the future. (Inverted) 3.21 0.74 0.46 1.06
6 I never worry about my health. (Inverted) 3.95 0.90 −1.15 1.07
7 Most people get sick a little easier than I do. 2.89 0.81 −0.09 0.14
9 I am somewhat ill. (Inverted) 3.62 1.01 −0.58 −0.68
10 In the future, I expect to have better health than other people I know. 3.44 1.03 −0.58 −0.32
11 I was so sick once I thought I might die. (Inverted) 3.86 1.08 −1.01 0.17
12 I am not as healthy now as I used to be. (Inverted) 3.27 1.10 −0.21 −1.14
13 I worry about my health more than other people worry about their health. 2.80 0.88 0.14 −0.38
15 My body seems to resist illness very well. 3.49 0.81 −0.67 −0.28
16 Getting sick once in a while is a part of my life. 3.12 1.10 −0.26 −1.26
17 I am as healthy as anybody I know 2.64 0.84 0.18 −0.20
18 I think my health will be worse in the future than it is now. (Inverted) 3.13 0.75 −0.02 0.48
19 I have never had an illness that lasted a long period of time. 3.67 1.06 −0.76 −0.47
20 Others seem more concerned about their health than I am about mine. (Inverted) 3.25 0.84 0.02 −0.43
22 My health is excellent. 3.19 0.95 −0.22 −0.65
23 I expect to have a very healthy life. 4.38 0.67 −0.99 1.50
24 My health is a concern to my life. 3.75 0.93 −0.99 0.32
25 I accept that sometimes I am just going to be sick. 3.16 1.03 −0.35 −1.29
26 I have been feeling bad lately. (Inverted) 3.69 0.98 −0.93 0.05
28 I have never been seriously ill. 3.55 1.14 −0.61 −0.80
29 When there is something going around, I usually catch it. (Inverted) 2.72 0.96 0.37 −1.01
30 Doctors say that I am now in poor health. (Inverted) 4.01 0.75 −0.76 1.11
32 I feel about as good now as ever have. 3.36 1.05 −0.30 −1.11
33 During the past 3 months, how much has your health worried or concerned you? 3.11 1.01 −0.59 −1.08
Note. Items classifi ed in a fi ve-point Likert scale from: 1, completely false statement to 5, completely true statement.
Souto, T. S., Ramires, A., Leite, A., Santos,V., Santo, R. E.2192
Trends Psychol., Ribeirão Preto, vol. 26, nº 4, p. 2185--2201 - December/2018
items in three factors that explained 56% of the total variance and the internal consistency lev-els for the factors were between acceptable and good: current health (items 1, 4, 9, 12, 22, 26, 30 and 32; a = .85), prior health (items 11, 19 and 28; a = .71) and health concern (items 6, 24 and
33; a = .65). The correlation between the prior health and the current health was average (Co-hen, 1988), positive and signifi cant (r = .38; p < .001). The health concern does not signifi cantly correlate with prior health (r = .04; p = .412) or with current health (r = .01; p = .860).
Table 3EFA Results: Structure of the Factors Current Health (F1), Previous Health (F2) and Health Concerns (F3) (N = 565)
Item CommunalitiesF1
Factor loading
F2 F3
22 My health is excellent. .61 .77
9 I am somewhat ill. .59 .73
1 According to the doctors I have seen, my health is now ex-cellent. .56 .73
32 I feel about as good now as ever have. .58 .72
26 I have been feeling bad lately. .47 .66
12 I am not as healthy now as I used to be. .47 .65
4 I feel better now than I ever have before. .42 .64
30 Doctors say that I am now in poor health. .44 .58
28 I have never been seriously ill. .69 .80
11 I was so sick once I thought I might die. .59 .76
19 I have never had an illness that lasted a long period of time. .57 .73
24 My health is a concern to my life. .74 .86
33 During the past 3 months, how much has your health worried or concerned you? .62 .78
6 I never worry about my health. .41 .64
Eigenvalue 4.42 1.86 1.49
Explained variance (%) 55.54 31.60 13.29 10.65
Cronbach’s Alpha .85 .71 .65
CFAThe subsample used in this stage of the
study was defi ned by 574 participants: the ma-jority were female (68%) and the most represen-tative age group was between 17 and 24 years old (48%). A high percentage (44%) had a bach-elor’s degree followed by a complete secondary education (23%; Table 1).
In the second stage of the study, the CFA procedure, using the maximum likelihood meth-
od, was applied to the data of the second sub-sample to confi rm the factorial structure and to evaluate the quality of the adjustment of the model specifi ed by the EFA. The univariate and multivariate normality assumptions of the items were evaluated according to the asymmetry (sk) and kurtosis (ku) coeffi cients. The quality of the adjustment of the model was measured by the reference values, indicators of good quality, of the following indices: normed Chi-square (χ2/df
Health Perception: Validation of a Scale for the Portuguese Population. 2193
Trends Psychol., Ribeirão Preto, vol. 26, nº 4, p. 2185--2201 - December/2018
< 3, acceptable; Kline, 2015), standardised root mean residual (SRMR < .08, acceptable; Hu & Bentler, 1999), root mean square error of ap-proximation (RMSEA < .07, acceptable and < .03, excellent; Steiger, 2007) and comparative fi t index (CFI > .95, good; Hu & Bentler, 1999). Along the RMSEA, the 90% confi dence interval was also considered, which, in a well-adjusted model, should present a lower limit close to zero and an upper limit below .08 (Steiger, 2007). For the respecifi cation of the model, it was analysed by the Mahalanobis d-squared distances (MD, p1 and p2 < .001 identify multivariate outliers) and the modifi cation indexes (MI > 11 show signifi cant improvements if changes are theo-retically justifi able; Hair et al., 2014). As it was not possible to submit the modifi ed model to external validation with an independent sample, the parsimony of the models was evaluated by the modifi ed expected cross-validation index
(MECVI), which refl ects the theoretical adjust-ment of the model in other similar samples, and by the chi-square difference test (Maroco, 2010).
Figure 1 presents the results of the CFA ap-plication to the trifactorial model with 14 items (Model 1) obtained by EFA. The 14 items did not present severe violations of univariate nor-mality (|sk |< 1.29 and |ku| < 1.48) but presented multivariate normality (ku = 25.42, p < .001). The quality of the model fi t was acceptable, but modest, χ2 (74) = 389.85, p < .001; χ2/df = 5.27; RMSEA = .09 and IC90% = [.08, .10]; SRMR = .07; CFI = .88; MECVI = .79, so it was respeci-fi ed. In the modifi cation of Model 1, it was con-sidered that the correlational structure among the factors suggested: the existence of a second or-der hierarchical structure; the exclusion of items that had relatively weak factor weights (<.60) and IM indicators of saturation of items by more than one factor.
Figure 1. Model 1: CFA (standardised solution).
Souto, T. S., Ramires, A., Leite, A., Santos,V., Santo, R. E.2194
Trends Psychol., Ribeirão Preto, vol. 26, nº 4, p. 2185--2201 - December/2018
Model 2 (Figure 2) results from the elimina-tion of items 6, 11, 24, 30 and 33 (consequently, the elimination of the health concern factor) and the inclusion of a second order factor named health perception. The nine items of the result-ing model did not present severe violations of multivariate normality (ku = 10.57, p < .001). The values of the adjustment quality indices ob-served slight improvements, χ2 (26) = 137.80, p < .001; χ2/df = 5.30; RMSEA = .09 and IC90% = [.07, .10]; SRMR = .04; CFI = .94; MECVI =
.31. The MD analysis identifi ed four multivari-ate outliers and the MI suggested the presence of covariance between the measurement errors of items 9 and 26, 4 and 28 and 6 and 32. From a theoretical point of view, the establishment of covariance between items of the same construct is justifi ed by the similarity of the content of the items, and between the measurement errors of items 4 (I feel better now than I ever have be-fore) and 28 (I have never been seriously ill), by the complementarity of content.
Figure 2. Model 2: CFA (standardised solution).
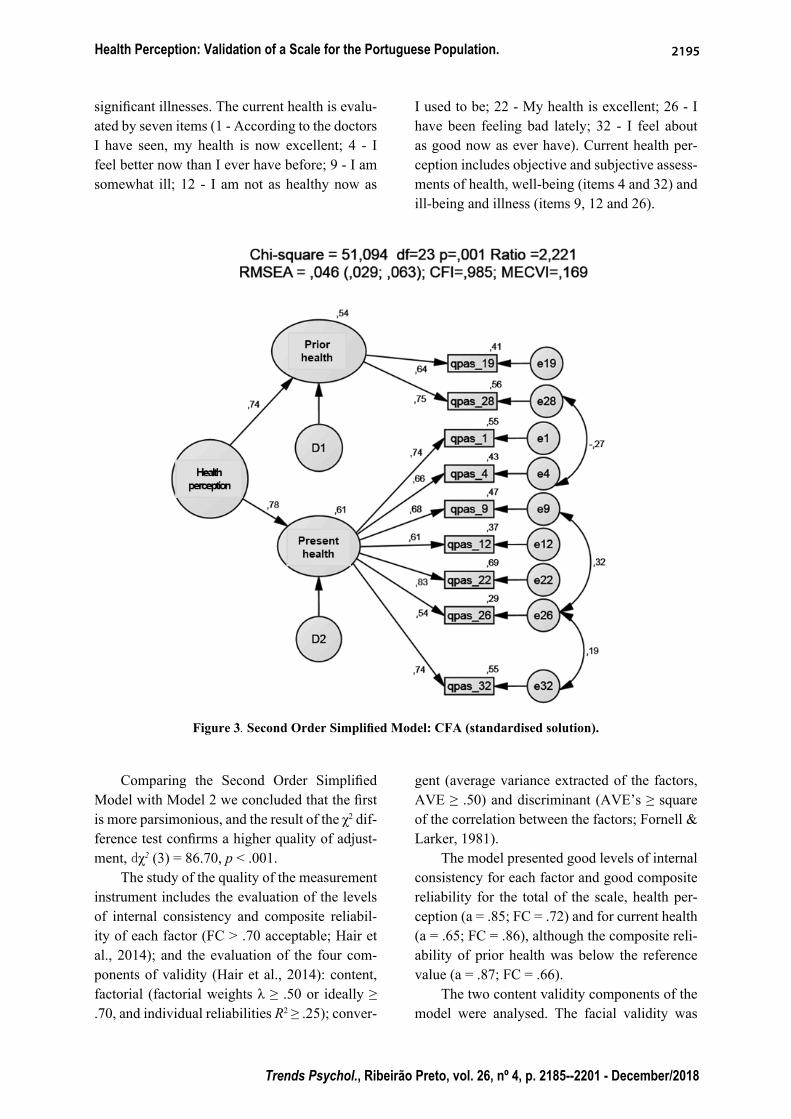
The simplifi ed second-order model (Figure 3), whose exogenous construct is health per-ception, was thus defi ned by nine items in two factors, current health (seven items) and prior health (two items), 570 observations and three covariances between residuals. The items did not present severe violations of multivariate nor-mality (ku = 10.01, p < .001) and all indexes un-
der evaluation supported the existence of a good overall fi t of the model, χ2 (23) = 51.10, p < .001; χ2/df = 2.22; RMSEA = .05 and IC90% = [.03, .06]; SRMR = .03; CFI = .99; MECVI = .17.
Prior health is assessed by two items (19 - I have never had an illness that lasted a long pe-riod of time; 28 - I have never been seriously ill) that focus on the prior history of serious or
Health Perception: Validation of a Scale for the Portuguese Population. 2195
Trends Psychol., Ribeirão Preto, vol. 26, nº 4, p. 2185--2201 - December/2018
signifi cant illnesses. The current health is evalu-ated by seven items (1 - According to the doctors I have seen, my health is now excellent; 4 - I feel better now than I ever have before; 9 - I am somewhat ill; 12 - I am not as healthy now as
I used to be; 22 - My health is excellent; 26 - I have been feeling bad lately; 32 - I feel about as good now as ever have). Current health per-ception includes objective and subjective assess-ments of health, well-being (items 4 and 32) and ill-being and illness (items 9, 12 and 26).
Figure 3. Second Order Simplifi ed Model: CFA (standardised solution).
Comparing the Second Order Simplifi ed Model with Model 2 we concluded that the fi rst is more parsimonious, and the result of the χ2 dif-ference test confi rms a higher quality of adjust-ment, dχ2 (3) = 86.70, p < .001.
The study of the quality of the measurement instrument includes the evaluation of the levels of internal consistency and composite reliabil-ity of each factor (FC > .70 acceptable; Hair et al., 2014); and the evaluation of the four com-ponents of validity (Hair et al., 2014): content, factorial (factorial weights λ ≥ .50 or ideally ≥ .70, and individual reliabilities R2 ≥ .25); conver-
gent (average variance extracted of the factors, AVE ≥ .50) and discriminant (AVE’s ≥ square of the correlation between the factors; Fornell & Larker, 1981).
The model presented good levels of internal consistency for each factor and good composite reliability for the total of the scale, health per-ception (a = .85; FC = .72) and for current health (a = .65; FC = .86), although the composite reli-ability of prior health was below the reference value (a = .87; FC = .66).
The two content validity components of the model were analysed. The facial validity was
Souto, T. S., Ramires, A., Leite, A., Santos,V., Santo, R. E.2196
Trends Psychol., Ribeirão Preto, vol. 26, nº 4, p. 2185--2201 - December/2018
assured by the procedures described and by the pilot study; the correlation between prior health and current health constructs is moderate, posi-tive and signifi cant (r = .42; p < .001); between health perception and prior health it is high (r = .65; p < .001), and it is also high between health perception and current health (r = .96; p < .001), providing evidence of nomological validity (Co-hen, 1988).
All items presented high factorial weights (l’s are .54 and .75) and adequate individual reliability (R2 between .29 and .69), establishing the factorial validity (Figure 3). The values of the extracted mean variance presented appropriate levels (current health -.48, prior health -.49 and health perception -.56), indicating good convergent validity of the factors and the total of the scale. The results demonstrated the existence of discriminant validity between the two factors current health and prior health (AVE’s > .33).
Discussion
The validation of HPQ for the Portuguese population aimed to be an effective response to the scarcity of instruments that allow researchers and clinicians to obtain an adequate perception of individual health. Thus, the main objective of this research was to adapt this instrument to the Portuguese population, analysing its psychomet-ric characteristics and identifying and confi rm-ing its factorial structure.
The author’s model (Ware, 1976) was not confi rmed, since 27 items were proposed, distributed into six subscales. This model was not confi rmed either in AFE (which suggested the existence of three factors) or in the AFC (which suggested the existence of two factors). The fi nal model, adapted to the Portuguese population, is defi ned by nine items included in two factors (prior health – two items; current health – seven items), which makes it impossible to compare internal consistency values between the original model and the model used in this study. However, the retained items in the fi nal model remained in the factors (both in the original model and in the fi nal model). Therefore, in the studied population, what allows us to evaluate the perception of
health is the previous history and the current health situation and not health perspectives, health concerns, resistance to illness, or sickness orientation. In fact, studies with populations of subjects with genetic mutations that cause fatal diseases present a better health perception than subjects of the general population before they become symptomatic (Leite, Paúl, & Sequeiros, 2002), and thus it seems that subjects perceive their health negatively only in the presence of symptomatology or during the explicit manifestation of an illness.
These results are supported by the existence of signifi cant correlations between the three fi nal dimensions of the second order model (prior health, current health and health perception) and also by the observed absence of signifi cant correlations between current and prior health and health concerns in the three-factor model. Thus, the perception about prior health is the result of an evaluation made on the existence or not of serious or signifi cant illness; current health refers mainly to the perception of the current health that is expressed both in objective and subjective concepts, in well-being, general malaise and illness.
This result is consistent with Simon (1990) when he states that the current health subscale is strongly associated with variables related to physical health. There seems to be a dichotomy between what determines the prior health perception of illness and what determines the current health perception of health. Although this perception of health includes references to illness, it is mainly items related to well-being and health that contribute to the perception of current health. Bernstein and colleagues (2016) had already discovered that worse perceptions of health were associated with a worse sickness orientation.
The HPQ was not previously validated for other populations because it soon gave rise to Ware’s and Sherbourne’s (1992) 36-Item Short Form Survey (SF-36) that was translated and validated for different populations. For this rea-son, emerges a diffi culty in comparing previous validation frameworks with the same instru-ment. However, several authors have used the
Health Perception: Validation of a Scale for the Portuguese Population. 2197
Trends Psychol., Ribeirão Preto, vol. 26, nº 4, p. 2185--2201 - December/2018
HPQ or have used revised forms of the HPQ in different population types. Most of the authors who used the HPQ did not question its facto-rial structure (e.g. Bernhard & Sheppard, 1993; Coehlo, Hooker, & Bowman, 2007; Duffy & MacDonald, 1990; Gennaro, Brooten, Roncoli, & Kumar, 1993; Kim, Kim, & Sok, 2008; Lee, 1991; Oelofsen & Richardson, 2006). Other au-thors only used one of the subscales of HPQ, namely the current health perception (e.g. El-liott & Marmarosh, 1994; Frazier & Waid, 1999; Hooker, Monahan, Bowman, Frazier, & Shifren, 1998; Jones, Jaceldo, Lee, Zhang, & Meleis, 2001; Simon, 1990; Thomas, 1989; Thomas & Atakan, 1993); only Duffy (1997) used all three subscales of the HPQ: prior, present and future health perception. The results found by these au-thors do not always overlap with ours. Contrary to our study, Anthony and Barry (2009) found that scores on the prior health subscale differed signifi cantly by gender, with men presenting higher mean values than women. Other authors studied the same concepts through the same in-struments but in relation to variables not stud-ied by us, such as, for example, Klm and Jung (2015), who found that health-promoting behav-iour has a strong and positive correlation with health perception, health awareness and subjec-tive health status; and Brewer, Robinson, Sumra, Tatsi, and Gire (2015) who reported that religion and social support have a positive impact on cur-rent health perceptions, depression and future health perspectives.
The dimension of the fi nal model (nine items), compared to the proposed model (33 items), is an advantage when considering the application of the instrument in a health context. On the other hand, it rivals the measures of a single item, whose reliability is very debatable (Fuchs & Diamantopoulos, 2009; Ware, 1976).
The study presents some limitations, namely the fact that the sample used is not representative of the Portuguese population. However, none of the studies mentioned previously used representative samples of the populations studied, although some populations were quite specifi c. (e.g. Conner & Norman, 2017; Fastame
et al., 2017; Lee & Sung, 2017; Meuleman et al., 2017; Ngnoumen & Langer, 2016; Oliveira et al., 2016; Salloum et al., 2016; Shetty et al., 2017).
Moreover, since the sample was evaluated in a single moment, it lacks temporal stability validation. In the future, it would be important to compare the results obtained with other results from the application of different instruments previously validated for the Portuguese popula-tion that measured the same construct.
Authors’ ContributionsSubstantial contribution in the concept and
design of the study: Teresa Soares Souto; Ângela Leite.
Contribution to data collection: Vanessa Santos; Raquel Espírito Santo.
Contribution to data analysis and inter-pretation: Ana Ramires; Ângela Leite; Teresa Soares Souto.
Contribution to manuscript preparation: Teresa Soares Souto; Ângela Leite; Ana Ramires.
Contribution to critical revision, adding intelectual content: Teresa Soares Souto; Ângela Leite; Ana Ramires; Vanessa Santos; Raquel Espírito Santo.
Confl icts of interestThe authors declare that they have no
confl ict of interest related to the publication of this manuscript.
References
Anthony, J. S., & Barry, D. G. (2009). Perceptions of health status among women and men in an urban homeless population. Journal of National Black Nurses’ Association, 20(1), 36-41.
Assari, S. (2014). Cross-country variation in additive effects of socio-economics, health behaviors, and comorbidities on subjective health of pa-tients with diabetes. Journal of Diabetes & Met-abolic Disorders, 13(1), 36. doi: 10.1186/2251-6581-13-36
Assari, S., & Lankarani, M. M. (2015). Does multi-morbidity mediate the effect of socioeconomics on self-rated health? Cross-country differences.
Souto, T. S., Ramires, A., Leite, A., Santos,V., Santo, R. E.2198
Trends Psychol., Ribeirão Preto, vol. 26, nº 4, p. 2185--2201 - December/2018
International Journal of Preventive Medicine, 6, 85. doi: 10.4103/2008-7802.164413
Azêdo, D. B. M. (2010). O suporte social e a perceção do estado de saúde na maternidade na adolescência (Dissertação de mestrado em Psicologia da Saúde Comunitária). Universidade Fernando Pessoa, Faculdade de Ciências Humanas e Sociais, Porto, Portugal.
Beaman, P. E., Reyes-Frausto, E., & Garcia-Pena, C. (2003). Validation of the Health Perceptions Questionnaire for an older Mexican population. Psychological Reports, 92, 723-734.
Bernhard, L. A., & Sheppard, L. (1993). Health, symptoms, self-care, and dyadic adjustment in menopausal women. Journal of Obstetric, Gy-necologic, & Neonatal Nursing, 22(5), 456-461.
Bernstein, E. E., Rabideau, D. J., Gigler, M. E., Nierenberg, A. A., Deckersbach, T., & Sylvia, L. G. (2016). Patient perceptions of physical health and bipolar symptoms: The intersection of mental and physical health. Journal of Affec-tive Disorders, 189, 203-206. doi: 10.1016/j.jad.2015.09.052
Brewer, G., Robinson, S., Sumra, A., Tatsi, E., & Gire, N. (2015). The infl uence of religious coping and religious social support on health behaviour, health status and health attitudes in a British Christian sample. Journal of Religion and Health, 54(6), 2225-2234. doi: 10.1007/s10943-014-9966-4
Cloninger, C. R., & Zohar, A. H. (2011). Personal-ity and the perception of health and happiness. Journal of Affective Disorders, 128 (1), 24-32. doi: 10.1016/j.jad.2010.06.012
Coehlo, D. P., Hooker, K., & Bowman, S. (2007). Institutional placement of persons with dementia: What predicts occurrence and timing?. Journal of Family Nursing, 13(2), 253-277. doi: https://doi.org/10.1177/1074840707300947
Cohen, J. (1988). Statistical power analysisfor the behavioral sciences (2nd Ed.). Hillsdale, NJ: Erlbaum.
Coleman, A. M., Hicks-Coolick, A., & Brown, A. F. (2015). The role of perception in developing healthy lifestyles and community engagement. Journal of the Georgia Public Health Associa-tion, 5(1), 45-50.
Connelly, J. E., Philbrick, J. T., Smith, G. R., Kaiser, D. L., & Wymer, A. (1989). Health perceptions of primary care patients and the infl uence on
health care utilization. Medical Care, 27(Suppl. 3), 99-109.
Conner, M., & Norman, P. (2017). Health behaviour: Current issues and challenges. Psychology & Health, 32(8), 895-906. doi: https://doi.org/10.1080/08870446.2017.1336240
Crown, K. (2012). Health Perception. In S. Loue & M. Sajatovic (Eds.), Encyclopedia of Immigrant Health (pp. 791-791). New York: Springer.
Davies, A. R., Sherbourne, C. D., Peterson, J. R., & Ware, J. E. (1988). Scoring manual: Adult health status and pacient satisfaction measures used in Rand’s Health Insurance Experiment. Santa Mónica, CA: Rand Corporation.
Diamond, J. J., Becker, J. A., Arenson, C. A., Cham-bers, C. V., & Rosenthal M. P. (2007). Develop-ment of a Scale to Measure Adults’ Perceptions of Health. Journal of Community Psychology, 35(5), 557-561. doi: https://doi.org/10.1002/jcop.20164
Directorate-General of the European Commission. (2015). Self-perceived health statistics. Lux-embourg: Publications Offi ce of the European Union. Retrieved from http://ec.europa.eu/eu-rostat/statistics-explained/index.php/Self-per-ceived_health_statistics
Duffy, M. E. (1997). Determinants of reported health promotion behaviors in employed Mexican American women. Health Care for Women In-ternational, 18(2), 149-163.
Duffy, M. E., & MacDonald, E. (1990). Determinants of functional health of older persons. The Ger-ontologist, 30(4), 503-509.
Elliott, T. R., & Marmarosh, C. L. (1994). Problem-solving appraisal, health complaints, and health-related expectancies. Journal of Counseling & Development, 72(5), 531-537.
Fabrigar, L. R., Wegener, D. T., MacCallum, R. C., & Strahan, E. J. (1999). Evaluating the use of exploratory factor analysis in psychological research. Psychological Methods, 4(3), 272-299.
Fastame, M. C., Hitchcott, P. K., & Penna, M. P. (2017). Does social desirability infl uence psy-chological well-being: Perceived physical health and religiosity of Italian elders? A developmen-tal approach. Aging & Mental Health, 21(4), 348-353. doi: 10.1080/13607863.2015.1074162
Frazier, L. D., & Waid, L. D. (1999). Infl uences on anxiety in later life: The role of health status,
Health Perception: Validation of a Scale for the Portuguese Population. 2199
Trends Psychol., Ribeirão Preto, vol. 26, nº 4, p. 2185--2201 - December/2018
health perceptions, and health locus of control. Aging & Mental Health, 3(3), 213-220.
Fornell, C., & Larcker, D. F. (1981). Evaluating structural equation models with unobservable variables and measurement error. Journal of Marketing Research, 18(1), 39-50.
Fuchs, C., & Diamantopoulos, A. (2009). Using sin-gle-item measures for construct measurement in management research. Die Betriebswirtschaft, 69(2), 195-210.
Gennaro, S., Brooten, D., Roncoli, M., & Kumar, S. P. (1993). Stress and health outcomes among mothers of low-birth-weight infants. Western Journal of Nursing Research, 15(1), 97-113.
Goldberg, D. P., & Hillier, V. F. (1979). A scaled ver-sion of the General Health Questionnaire. Psy-chological Medicine, 9(1), 139-45.
Goodwin, R., & Engstrom, G. (2002). Personality and the perception of health in the general population. Psychological Medicine, 32(2), 325-332. doi: https://doi.org/10.1017/S0033291701005104
Hair, J. F., Black, W. C., Babin, B. J., & Anderson, R. E. (2014). Multivariate data analysis (7th ed.). Harlow, UK: Pearson Educational Limited.
Hamlyn, D. W. (2017). The psychology of perception: A philosophical examination of Gestalt theory and derivative theories of perception (Vol. 13). New York: Routledge.
Hooker, K., Monahan, D. J., Bowman, S. R., Frazier, L. D., & Shifren, K. (1998). Personality counts for a lot: Predictors of mental and physical health of spouse caregivers in two disease groups. The Journals of Gerontology Series B: Psychological Sciences and Social Sciences, 53(2), 73-85.
Hu, L.-t., & Bentler, P. M. (1999). Cutoff criteria for fi t indexes in covariance structure analysis: Conventional criteria versus new alternatives. Structural Equation Modeling, 6(1), 1-55. doi: https://doi.org/10.1080/10705519909540118
Jones, P. S., Jaceldo, K. B., Lee, J. R., Zhang, X. E., & Meleis, A. I. (2001). Role integration and perceived health in Asian American women caregivers. Research in Nursing & Health, 24(2), 133-144. doi: https://doi.org/10.1002/nur.1016
Kim, K. B., Kim, H. A., & Sok, S. H. R. (2008). A study on health perception, health knowledge, and health promoting behavior in the elderly.
Journal of East-West Nursing Research, 14(1), 56-67.
Kline, R. B. (2015). Principles and practice of struc-tural equation modeling. London: Guilford.
Klm, S., & Jung, E. (2015). A relevance on health perception, health knowledge and health promo-tion behavior of the university students. Journal of the Korea Academia-Industrial coopera-tion Society, 16(8), 5394-5403. doi: 10.5762/KAIS.2015.16.8.5394
Krabbe, P. (2016). The measurement of health and health status: Concepts, methods and applica-tions from a multidisciplinary perspective. San Diego, CA: Elsevier Academic Press.
Lee, B. A., & Oh, D. J. (2013). The effects of health perception on living health belief, living satisfaction and wellbeing-oriented activities according to swimming participation with middle-aged women. Journal of Exercise Rehabilitation, 9(3), 381. doi: 10.12965/jer.130047
Lee, E. J., & Sung, M. H. (2017). Impacts of health perception, aging anxiety and perception of suc-cessful aging on health promotion behavior of Late Middle-aged women. Korean Journal of Women Health Nursing, 23(3), 181-190. doi: 10.4069/kjwhn.2017.23.3.181
Lee, H. J. (1991). Relationship of hardiness and cur-rent life events to perceived health in rural adults. Research in Nursing & Health, 14(5), 351-359
Leite, Â., Paúl, C., & Sequeiros, J. (2002). O bem-estar psicológico em indivíduos de risco para doenças neurológicas hereditárias de apareci-mento tardio e controlos. Psicologia, Saúde & Doenças, 3(2), 113-118.
Maroco, J. (2010). Análise de equações estruturais: Fundamentos teóricos, software & aplicações. Pêro Pinheiro, Portugal: ReportNumber.
McPherson, F., Melvin, K. C., Belew, D. L., & Mc-Graw, L. K. (2016). Health Perception and Wellness Behavior Survey among Military Benefi ciaries. Annals of Psychiatry and Mental Health, 4(2), 1060.
Meuleman, Y., Chilcot, J., Dekker, F. W., Halbesma, N., & van Dijk, S. (2017). Health-related quality of life trajectories during predialysis care and associated illness perceptions. Health Psychology, 36(11), 1083-1091. doi: 10.1037/hea0000504
Souto, T. S., Ramires, A., Leite, A., Santos,V., Santo, R. E.2200
Trends Psychol., Ribeirão Preto, vol. 26, nº 4, p. 2185--2201 - December/2018
Michaelson, V., Pickett, W., Vandemeer, E., Taylor, B., & Davison, C. (2016). A mixed methods study of Canadian adolescents’ perceptions of health. International Journal of Qualitative Studies on Health and Well-Being, 11(1), 32891. doi: 10.3402/qhw.v11.32891
Moss-Morris, R., Weinmanb, J., Petriea, K., Hornec, R., Camerona, L., & Buickc, D. (2002). The Revised Illness Perception Questionnaire (IPQ-R). Psychology and Health, 17(1), 1-16.
Ng, T. (2012). The Brief Illness Perception Question-naire (Brief IPQ). Journal of Physiotherapy, 58(3), 202. doi: https://doi.org/10.1016/S1836-9553(12)70116-9
Ngnoumen, C. T., & Langer, E. J. (2016). Mindful-ness: The essence of well-being and happiness. In I. Ivtzan & T. Lomas (Eds), Mindfulness in Positive Psychology: The Science of Meditation and Wellbeing (pp. 97-107). London: Routledge.
Oelofsen, N., & Richardson, P. (2006). Sense of coherence and parenting stress in mothers and fathers of preschool children with developmental disability. Journal of Intellectual and Developmental Disability, 31(1), 1-12. doi: https://doi.org/10.1080/13668250500349367
Oliveira, C., Sole, A., Girón, R. M., Quintana-Gal-lego, E., Mondejar, P., Baranda, F., ...Quittner, A. (2016). Depression and anxiety symptoms in Spanish adult patients with cystic fi brosis: Associations with health-related quality of life. General Hospital Psychiatry, 40, 39-46. doi: 10.1016/j.genhosppsych.2016.02.002
Post, M. (2014). Defi nitions of quality of life: What has happened and how to move on. Topics in Spinal Cord Injury Rehabilitation, 20(3), 167-180. doi: 10.1310/sci2003-167
Read, J. L., Quinn, R. J., & Hoefer, M. A. (1987). Measuring overall health: An evaluation of three important approaches. Journal of Chronic Dis-eases, 40(Suppl. 1), 7-21.
Ross, K. (2010). Assessing diferences in percep-tions and actual health status: A national cross-sectional analysis (Dissertação de mestrado em Filosofi a). Kansas State University, Manhattan, KS.
Rubin, J., Taylor, J., Krapels, J., Sutherland, A., Felician, M., Liu, J., ...Rohr, C. (2016). Are better health outcomes related to social expenditure? A cross-national empirical analysis of social expenditure and population
health measures. Santa Monica, CA: RAND Corporation. Retrieved from https://www.rand.org/pubs/research_reports/RR1252.html
Saleh, Z. T., Connell, A., Lennie, T. A., Bailey, A. L., Elshatarat, R. A., Yousef, K., & Moser, D. K. (2017). Cardiovascular disease risk predicts health perception in prison inmates. Clinical Nursing Research. Retrieved from http://journals.sagepub.com/doi/pdf/10.1177/ 1054773817740534
Salloum, I. M., Cloninger, C. R., Salvador-Carulla, L., & Otero, A. A. (2016). Health status: From illness to wellbeing. In J. E. Mezzich, M. Botbol, G. Christodoulou, C. R. Cloninger, & I. Salloum (Eds), Person centered psychiatry (pp 157-164). New York: Springer
Santos, A. F., Barbosa, R. B., Faro, S. R. S., & Alves, A., Jr. (2005). Representações sociais no proces-so saúde-doença entre nefrologistas e pacientes renais crónicos. Psicologia, Saúde e Doença, 6(1), 57-67.
Schnittker, J., & Bacak, V. (2014). The increasing predictive validity of self-rated health. PLOS One, 22. Retrieved from http://journals.plos.org/plosone/article?id=10.1371/journal.pone.0084933
Shetty, A. A., Wertheim, J. A., & Butt, Z. (2017). Health-related quality of life outcomes after Kidney Transplantation. In G. Orlando, G. Remuzzi, & D. F. Williams (Eds.), Kidney Transplantation, Bioengineering and Regeneration (pp. 699-708). San Diego, CA: Elsevier Academic Press.
Simon, J. M. (1990). Humor and its relation-ship to perceived health, life satisfaction, and moral in older adults. Issues in Mental Health Nursing, 11(1), 17-31. doi: https://doi.org/10.3109/01612849009014542
Steiger, J. H. (2007). Understanding the limitations of global fi t assessment in structural equation modeling. Personality and Individual Diffe-rences, 42(5), 893-898. doi: https://doi.org/10.1016/j.paid.2006.09.017
Thomas, S. P. (1989). Gender differences in anger expression: Health implications. Research in Nursing & Health, 12(6), 389-398. doi: 10.1002/nur.4770120609
Thomas, S. P., & Atakan, S. (1993). Trait anger, an-ger expression, stress, and health status of Amer-ican and Turkish midlife women. Health Care
Health Perception: Validation of a Scale for the Portuguese Population. 2201
Trends Psychol., Ribeirão Preto, vol. 26, nº 4, p. 2185--2201 - December/2018
for Women International, 14(2), 129-143. doi: https://doi.org/10.1080/07399339309516035
Tourani, S., Behzadifar, M., Martini, M., Aryankhe-sal, A., Mirghaed, M. T., Salemi, M., ...Braga-zzi, N. L. (2018). Health-related quality of life among healthy elderly Iranians: A systematic re-view and meta-analysis of the literature. Health and Quality of Life Outcomes, 16(1), 18. doi: 10.1186/s12955-018-0845-7
Vintém, J. M. (2008). Inquéritos Nacionais de Saúde: Auto-perceção do estado de saúde: Uma análise em torno da questão de género e da escolaridade. Revista Portuguesa de Saúde Pública, 26(2), 5-16.
Ware, J. E., Jr. (1976). Scales for measuring health perceptions. Health Services Research, 11(4), 396-415.
Ware, J. E., Jr., & Gandek, B. (1998). Overview of the SF-36 Health Survey and the International Quality of Life Assessment (IQOLA) Project. Journal of Clinical Epidemiology, 51(11), 903-12.
Ware, J. E., Jr., Johnston, S. A., Davies-Avery, A., & Brook, R. H. (1979). Conceptualization and measurement of health for adults in the Health Insurance Study: Vol. III. Mental Health. Santa Monica, CA: Rand Corporation.
Ware, J. E., Jr., & Karmos, A. H. (1976). Develop-ment and validation of scales to measures (Vol. 2) of a Final Report, NTIS publication. Perceived Health and Patient Role Propensity. Springfi eld, VA: National Technical Information Service.
Ware, J. E., Jr., Manning, W. G, Duan, N., Wells, K. B., & Newhouse, J. P. (1984). Health Status and the use of Outpatient Mental Health Ser-vices. American Psychologist, 39(10), 1090-1100. doi: http://dx.doi.org/10.1037/0003-066X.39.10.1090
Ware, J. E., Jr., & Sherbourne, C. D. (1992). The MOS 36 Item Short-Form Health Survey (Sf-35). I. Conceptual framework and item selec-tion. Medical Care, 30(6), 473-483.
Zahrt, O. H., & Crum, A. J. (2017). Perceived physi-cal activity and mortality: Evidence from three nationally representative US samples. Health Psychology, 36(11), 1017-1025. doi: 10.1037/hea0000531