Page 1
J Adv Environ Health Res (2020) 8: 79-94 DOI: 10.22102/jaehr.2020.212994.1153
ORIGINAL PAPER
MUK-JAEHR
Health risk assessment of heavy metals, BTEX and polycyclic
aromatic hydrocarbons (PAHs) in the workplace in a secondary oil
re-refining factory
Iman Molaei1, Sayed Mostafa Khezri1,, Mohammad Sadegh Sekhavatjou1, 3, Abdolreza Karbassi1, 4, Azamalsadat Hosseini Alhashemi1, 5 ,6
1. Department of Environmental Engineering, Tehran West Branch, Islamic Azad University, Tehran, Iran
2. Environment and Energy Department, Science and Research Branch, Islamic Azad University, Tehran, Iran
3. Department of Environmental Engineering, Science and Research Campus, Islamic Azad University,
Ahvaz, Iran
4. School of Environment, College of Engineering, University of Tehran, Tehran, Iran
5. Department of Earth and Environmental Science, Irving K. Barber School of Arts and Sciences, University
of British Columbia, Okanagan Campus, 1177 Research Road, Kelowna, BC, VIV 1V7, Canada
6. Department of Environmental Pollution, Ahvaz Branch, Islamic Azad University, Ahvaz, Iran
Date of submission: 23 Dec 2019, Date of acceptance: 27 Jan 2020
ABSTRACT
The present study aimed to evaluate the health risk of heavy metals (iron, zinc, cadmium, arsenic,
nickel, lead, and mercury), benzene, toluene, ethylbenzene and xylene (BTEX), and polycyclic
aromatic hydrocarbons (PAHs) in the workplace in a secondary oil re-refining factory. In this
descriptive, cross-sectional study, samples were collected and analyzed using the NIOSH 1501
method at eight sampling points with determined concentrations of BTEX, 16Ʃ PAHs, and heavy
metals. The concentration of each pollutant was evaluated based on the type of workers
(packaging/filtration). The risk assessment of the contaminants was carried out using the RAIS
software, and the risk of non-carcinogenic compounds was estimated based on the reference
respiratory concentration (mg/m3). The results showed that the lifetime cancer risk index (LCR)
cumulative risk of the heavy metals was within the definitive risk range at all the sampling points.
The highest carcinogenic risk of LCR belonged to arsenic at sampling point H (filtration chamber),
and the highest cumulative carcinogenic risk of the total contaminants in the environmental sampling
points belonged to sampling point H. At all the sampling points, the LCR carcinogenic risk
accumulation for the hydrocarbon compounds was within the definitive range. The maximum
cumulative lifetime cancer risk for the hydrocarbon compounds was evaluated in filtration (point B),
and the most hazardous carcinogens were arsenic, benzo(a)pyrene, and naphthalene. The proposed
risk assessment method was observed to be comprehensive, and its results could be used for corrective
and controlling measures and the prioritization of risk reduction resources.
Keywords: Risk assessment, Heavy metals, BTEX, Polycyclic aromatic hydrocarbons, Volatile
organic compounds
Introduction
Sayed Mostafa Khezri [email protected]
Citation: Molaei I, Khezri S M, Sekhavatjou M S, Karbassi
A, Hosseini Alhashemi A. Health risk assessment of heavy
metals, BTEX and polycyclic aromatic hydrocarbons (PAHs)
in the workplace in a secondary oil re-refining factory. J Adv
Environ Health Res 2020; 8(2): 79-94
Working with materials in various
industries is an important stage of the chemical
life cycle, which poses irreversible risks to the
employees. Today, the health and safety of
humans in the workplace have become a
greater concern due to the presence of various
hazardous chemicals.1, 2 Workplace chemical
Page 2
Molaei et al. 80
MUK-JAEHR
pollutants include gases, vapors, and
particulates, each of which is associated with
specific hazards, and their adverse effects
depend on the type of chemical, entry route,
duration of contact, and their concentration.
Excessive exposure to these pollutants in
workplaces and industries leads to severe
diseases. In recent years, significant changes
have occurred in chemicals, processes, and
types of activities in industries, thereby
increasing the number of high-risk workers for
chemical contamination.3, 4
Organic pollutants, especially volatile
organic compounds (VOCs), are important
pollutants, some of which have carcinogenic
effects. VOCs have various generation
resources and could easily be released into the
environment and work environments.5 The
main pathways for exposure to these
compounds are inhalation, swallowing, contact
with the eyes, and absorption by the skin.6
Aromatic compounds such as benzene,
toluene, ethylbenzene, and xylene (BTEX)
have been identified as the most frequent and
important volatile organic compounds in
ambient and industrial environments, which
may remarkably affect human health and air
quality.7, 8 Based on the classification of the
United States Environmental Protection
Agency (USEPA), these compounds are
known as priority pollutants.9 Polycyclic
aromatic hydrocarbons (PAHs) are a group of
hydrocarbon compounds, which have
observed an increasing trend in the air around
industrial areas, such as petrochemicals,
refineries, and oil industries. PAHs could
disperse in all sectors of the environment
through natural and anthropogenic resources,4
intensely threatening human health10 due to
properties such as toxicity, high stability,
aggregation, biotransformation,
carcinogenesis, and mutagenesis.11 Since these
compounds are of a lipophilic nature, they
have a high tendency to accumulating in living
organisms, which in turn leads to toxicity.12
Some human carcinogens among PAHs
include benz(a)anthracene, benzo(a)pyrene,
benzo(b)fluoranthene, benzo(k)fluoranthene,
chrysene, dibenz(a,h) anthracene, and
indeno(1,2,3-cd)pyrene.13
In addition to BTEX and PAHs, heavy
metals are another group of pollutants, the
annual contamination rate of which has been
reported to be on the rise mainly due to
industrialization at higher concentrations than
their natural or background levels. Among
various heavy metals, lead (Pb), chromium
(Cr), cadmium (Cd), copper (Cu), and cobalt
(Co) are considered particularly harmful.
These elements have a long half-life and the
ability to accumulate in the human body.
Numerous health problems are associated with
heavy metal contamination, and scientists have
observed acute toxic effects on various organs
of laboratory animals, such as the kidneys,
liver, pancreas, and lungs (through
respiration).14
To achieve the health goals regarding the
protection of the workforce, it is essential to
examine their exposure to chemicals and risks
associated with harmful substances, such as
heavy metals.15 In order to decide on the
control measures to protect employees against
the adverse effects of chemicals, it is critical to
assess the health risks of exposure to chemicals
in particular. The risk assessment process is
considered to be the key solution to the
evaluation of the risks associated with
occupational and environmental exposure to
chemicals.16, 17 In assessing the health risk of
exposure to chemicals and toxicants, the level
of risk to the users is specified, and measures
are taken to protect personnel against
hazardous chemicals. According to the current
national rules and regulations, industrial
workers and personals must only be exposed to
safe chemicals.18
The assessment of exposure to chemical
compounds implies the identification and
quantification of their sources, as well as the
pathways for their entry to the human body and
their adverse effects on human health.19 Such
health risks are particularly high in the workers
involved in secondary oil re-refining factories
due to the emissions of harmful pollutants,
such as heavy metals, BTEX, and PAHs in the
Page 3
J Adv Environ Health Res (2020) 8: 79-94 81
MUK-JAEHR
workplace. Therefore, secondary oil re-
refining factories regarded as important
anthropogenic chemical compound emission
sources.18
Regarding the estimation of lung cancer
risk associated with PAH exposure through
inhalation, the World Health Organization
(WHO) has suggested the unit risk of 8.7×10⁻²
(µg/m3( for lifelong PAH exposure (70 years),
assuming one is exposed to benzo[a]pyrene
equivalent concentration of 1 µg/m3.20 It is
notable that the mentioned unit risk has been
proposed for lifetime exposure and adopted for
assessing the exposure of adults to ambient
atmospheric PAHs.21
Today, many international organizations,
including the WHO, USEPA, and United
States Food and Drug Administration
(USFDA) consider the application of
quantitative risk assessment to be the basis for
legislation on chemicals. The lifetime cancer
risk index (LCR) is commonly used to estimate
the risk of carcinogenic pollutants, which has
been introduced as an indicator of the
increased risk of cancer due to specific
exposures. In addition, the hazard quotient
(HQ) is employed to estimate the risk of
exposure to non-carcinogenic pollutants, and
the HQ equation represents the ratio of
exposure to certain levels of a substance that
do not have adverse effects.22 In the present
study, LCR was calculated for the compounds
with approved inhalation unit risk factor (IUR)
values based on the USEPA risk assessment
method, and the HQ was estimated for the
compounds with approved RfC values.
Workers at secondary oil re-refining
factories are constantly exposed to various
materials, such as heavy metals, BTEX, and
PAHs. However, no studies have been focused
on the health risk assessment of these materials
to date. Therefore, their examination through a
risk assessment process to identify and
calculate the risk of each chemical produced in
these plants (BTEX and PAHs) is considered
essential to prioritizing the implementation of
control measures.
The present study aimed to evaluate the
health risk of heavy metals, BTEX, and PAHs
in a secondary oil re-refining factory.
Materials and Methods
Study area
This cross-sectional study was conducted
in Garmsar Industrial Town, Iran. Garmsar is
located in the west of Semnan province
(coordinates: 34°28'30"N and 51°52' to
52°55'E), covering an area of 10,686 km2. Fajr
Industrial Estate is located within 10 km from
Garmsar-Tehran road in the western part of
Garmsar city (coordinates: 35°14'56"N
52°14'2"E), covering an area of approximately
300 hectares per km (Fig. 1). The area of Fajr
Industrial Estate is 210 hectares, which
consists of 293 deployed units and 60 active
units.
Fig. 1. Map of Garmsar city and location of secondary oil refineries factories
Page 4
Molaei et al. 82
MUK-JAEHR
Air sampling and analytical procedures
Air samples were collected to estimate the
concentrations of BTXS, PAHs, and heavy
metals in the selected sites using the
methodology 1501, proposed by the US
National Occupational Health and Safety
Research Center (NIOSH 1501).23
Considering the similarity of the methods and
materials employed in these factories to re-
refine the used oils, eight sampling points were
selected, including points A (staff management
and administrative building), B (packing,
labeling salons, and cans, barrels, and oil
storerooms), C (used [burned] oil inlet units),
D (first distillation and acidification units
[heat: 300-400 °C]), E (second distillation unit
[heat: 200 °C]), F (filtration and collection
units of refined oils), G (open-area units for
painting the barrels and metal cans of oil), and
H (entrance of Tizro Grease Factory). The
samples were collected at each sampling point
(used oil re-refining plant) from ambient air
during spring-winter 2018. Sampling was
performed at 8:00 AM-2 PM at 6 h intervals
(maximum factory production) using
SKC Universal Pumps and SKC constant
flow personal sampling pumps (models:
PCXR4, PCXR8, and 44XR).
Sample collection was carried out at the
height of 1.6 meters above the ground (human
breathing height) using SKC personal
sampling pumps (SKC, model: 224-44 MTX,
USA) at the flow rate of 0.2 l/min. The
sampling lasted 2-3 h, and the air was passed
through a sorbent tube containing coconut
shell charcoal (SKC; 226-01). At all the
sampling sites, the field blanks were obtained
as well. The tubes were preserved at the
temperature of -18 °C for 48 h before the
analysis. The absorbent in the two sectors of
the tube (front and back) was poured into two
separate vials, and one milliliter of solvent
(CS2) was added to each vial. Following that,
the vials were let stand for 30 min with
occasional shaking. Afterwards, 2 µL of the
extracted solution was injected into a gas
chromatography device equipped with a flame
ionization detector (GC/FID; Agilent GC,
7890 A, USA). The running time of GC for the
analysis of BTEX and PAHs was 4.66 min.
The injector and detector temperatures were
set at 160 and 300 °C, respectively. The
temperature of the oven was initially
maintained at 40 °C for 1 min, reaching 15 °C
per minute and remaining constant at 80 °C for
1 min.
Active sampling methods were employed
to estimate the concentration of heavy metals
at the secondary oil re-refining plant. To this
end, SKC pumps were used with low flow
rates by employing a 37 mL fiberglass
membrane filter; the filter had been previously
weighed. After transferring the collected filters
to the laboratory in special holders, the
concentrations of the heavy metals (iron, zinc,
cadmium, arsenic, nickel, lead, and mercury)
were separately estimated using the acid
digestion method and inductively coupled
plasma spectroscopy (model: PQ9000, Elite,
Germany).
Health risk assessment
In order to investigate the effects of the
heavy metals on human health, the risk
assessment methods developed by health and
environmental authorities (EPA, Agency for
Toxic Substances and Disease Registry
(ASTDR) and Risk Assessment Information
System (RAIS)) were used. After determining
the concentration of each pollutant and heavy
metal in the air of the study area, the guidelines
of the USEPA, which were published during
the integrated risk information system (IRIS)
in 2005, were used to determine the exposure
concentration of each individual in the study
area with these substances through various
ways (USEPA 2005). The amount of exposure
through inhalation was calculated based on 8 h
of working per day for the factory workers and
24 h per day for the residents.
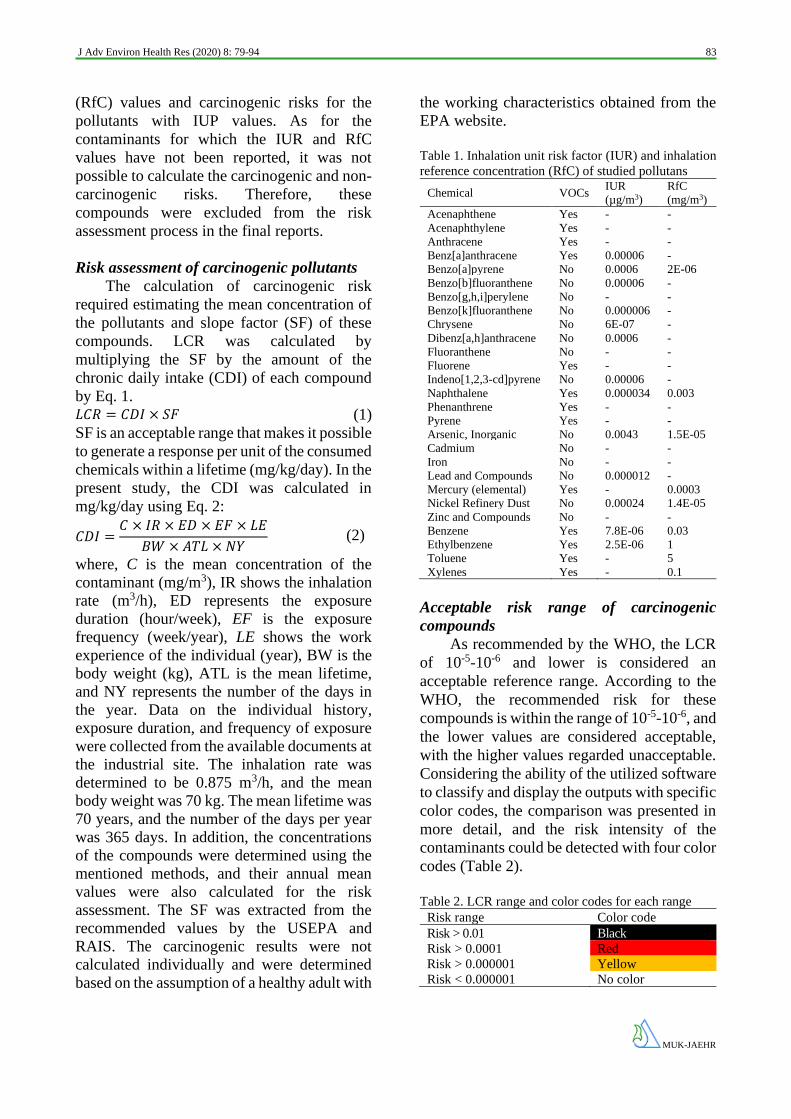
To calculate the risk of the studied
contaminants, the contaminants with the
reported values of carcinogenic and non-
carcinogenic risks reported by the EPA were
initially determined. According to the
information in Table 1, the EPA has approved
the non-carcinogenic risk of the contaminants
with reported reference respiratory concentration
Page 5
J Adv Environ Health Res (2020) 8: 79-94 83
MUK-JAEHR
(RfC) values and carcinogenic risks for the
pollutants with IUP values. As for the
contaminants for which the IUR and RfC
values have not been reported, it was not
possible to calculate the carcinogenic and non-
carcinogenic risks. Therefore, these
compounds were excluded from the risk
assessment process in the final reports.
Risk assessment of carcinogenic pollutants
The calculation of carcinogenic risk
required estimating the mean concentration of
the pollutants and slope factor (SF) of these
compounds. LCR was calculated by
multiplying the SF by the amount of the
chronic daily intake (CDI) of each compound
by Eq. 1. 𝐿𝐶𝑅 = 𝐶𝐷𝐼 × 𝑆𝐹 (1)
SF is an acceptable range that makes it possible
to generate a response per unit of the consumed
chemicals within a lifetime (mg/kg/day). In the
present study, the CDI was calculated in
mg/kg/day using Eq. 2:
𝐶𝐷𝐼 =𝐶 × 𝐼𝑅 × 𝐸𝐷 × 𝐸𝐹 × 𝐿𝐸
𝐵𝑊 × 𝐴𝑇𝐿 × 𝑁𝑌 (2)
where, C is the mean concentration of the
contaminant (mg/m3), IR shows the inhalation
rate (m3/h), ED represents the exposure
duration (hour/week), EF is the exposure
frequency (week/year), LE shows the work
experience of the individual (year), BW is the
body weight (kg), ATL is the mean lifetime,
and NY represents the number of the days in
the year. Data on the individual history,
exposure duration, and frequency of exposure
were collected from the available documents at
the industrial site. The inhalation rate was
determined to be 0.875 m3/h, and the mean
body weight was 70 kg. The mean lifetime was
70 years, and the number of the days per year
was 365 days. In addition, the concentrations
of the compounds were determined using the
mentioned methods, and their annual mean
values were also calculated for the risk
assessment. The SF was extracted from the
recommended values by the USEPA and
RAIS. The carcinogenic results were not
calculated individually and were determined
based on the assumption of a healthy adult with
the working characteristics obtained from the
EPA website.
Table 1. Inhalation unit risk factor (IUR) and inhalation
reference concentration (RfC) of studied pollutans
Chemical VOCs IUR
)3(µg/m
RfC
)3(mg/m
Acenaphthene Yes - -
Acenaphthylene Yes - -
Anthracene Yes - -
Benz[a]anthracene Yes 0.00006 -
Benzo[a]pyrene No 0.0006 2E-06
Benzo[b]fluoranthene No 0.00006 -
Benzo[g,h,i]perylene No - -
Benzo[k]fluoranthene No 0.000006 -
Chrysene No 6E-07 -
Dibenz[a,h]anthracene No 0.0006 -
Fluoranthene No - -
Fluorene Yes - -
Indeno[1,2,3-cd]pyrene No 0.00006 -
Naphthalene Yes 0.000034 0.003
Phenanthrene Yes - -
Pyrene Yes - -
Arsenic, Inorganic No 0.0043 1.5E-05
Cadmium No - -
Iron No - -
Lead and Compounds No 0.000012 -
Mercury (elemental) Yes - 0.0003
Nickel Refinery Dust No 0.00024 1.4E-05
Zinc and Compounds No - -
Benzene Yes 7.8E-06 0.03
Ethylbenzene Yes 2.5E-06 1
Toluene Yes - 5
Xylenes Yes - 0.1
Acceptable risk range of carcinogenic
compounds
As recommended by the WHO, the LCR
of 10-5-10-6 and lower is considered an
acceptable reference range. According to the
WHO, the recommended risk for these
compounds is within the range of 10-5-10-6, and
the lower values are considered acceptable,
with the higher values regarded unacceptable.
Considering the ability of the utilized software
to classify and display the outputs with specific
color codes, the comparison was presented in
more detail, and the risk intensity of the
contaminants could be detected with four color
codes (Table 2).
Table 2. LCR range and color codes for each range
Risk range Color code
Risk > 0.01 Black
Risk > 0.0001 Red
Risk > 0.000001 Yellow
Risk < 0.000001 No color
Page 6
Molaei et al. 84
MUK-JAEHR
Risk assessment of the non-carcinogenic
compounds
In the present study, the risk of the non-
carcinogenic compounds was estimated based on
the RfC and expressed in mg/m3. Moreover, the
HQ was calculated by dividing the concentration
of the contaminant by the RfC of the same
contaminant using Eq. 3:
HQ=CC/RfC (3)
where, HQ shows the hazard quotient (health
risk or non-carcinogenic effects), EC or CC
represents the annual mean concentration of
the pollutant (mg/m3), and RfC is the reference
pollutant concentration (mg/m3) as the
concentration of the pollutants without non-
carcinogenic health effects during exposure. In
addition, the CC values were obtained using
Eq. 4:
𝐶𝐶 =𝐶𝐴 × 𝐸𝑇 × 𝐸𝐹 × 𝐸𝐷
𝐿𝑇 × 365(𝑑𝑎𝑦𝑠/ 𝑦𝑒𝑎𝑟) × 24(ℎ𝑜𝑢𝑟𝑠/𝑑𝑎𝑦) (4)
where, ED is the exposure per year (work
experience), EF shows the exposure frequency
per day, ET denotes the exposure duration
(hour/day), and LT is the mean life expectancy
(year). It is notable that the exposure rate was
the annual mean concentration, and the daily
intake dose for the non-carcinogenic materials
was indicated by EC or CC, while the
carcinogenic compounds were indicated by
CDI.
Acceptable risk of the non-carcinogenic
compounds
According to the literature, HQ>1
indicates that the concentration of the volatile
organic compounds VOCs is higher than the
standard concentration levels, leading to
concerns about the general health of
populations, while HQ≤1 indicates that the
VOCs concentrations are below the RfC to
exert adverse effects and expected to cause no
harm to humans. As a result, HQ≤1 has been
recommended by the WHO and considered
acceptable for non-carcinogenic pollutants.
This classification was shown as the color code
in the outputs of the software, which made it
faster and easier to identify the high-risk
pollutants (Table 3).
Table 3. RfC range and color codes for each range
Hazard Index or Quotient
Danger range Color code
HQ or HI < 0.1 Colorless
HQ or HI > 0.1 Purple
HQ or HI > 1 Blue
Cumulative risk calculation
The cumulative risk for the carcinogenic
compounds was determined by calculating the
sum of the LCR of each pollutant using Eqs. 5
and 6.
𝑅 =∑𝐿𝐶𝑅 (5)
The risk index for the non-carcinogenic
compounds, which represents the cumulative
risk, was the sum of the hazard quotient of each
non-carcinogenic pollutant, as shown in Eq. 6.
𝑅 =∑𝐻𝑄 (6)
Results and Discussion
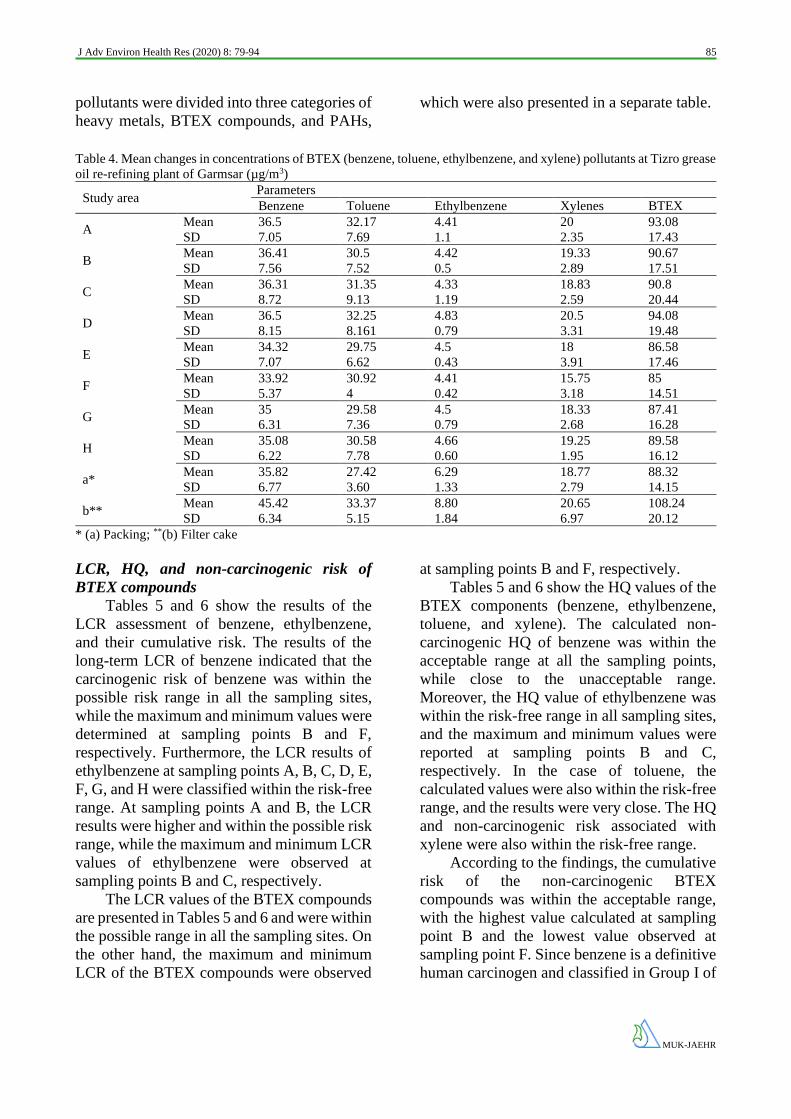
BTEX concentrations
Table 4 shows the mean values of BTEX
in all the sampling sites. As is observed, the
highest and lowest mean concentrations of
BTEX were observed at sampling points D
(94.88 µg/m3) and F (85.30 µg/m3),
respectively. Among the four BTEX
compounds (benzene, toluene, ethylbenzene,
and xylene), the highest value belonged to
benzene at sampling point D (45.33 µg/m3). In
addition, ethylbenzene had the lowest
concentration with the maximum
concentration of 5.367 µg/m3 at sampling point
D.
Table 4 shows the mean values of BTEX
based on the type of occupation (packing [a]
and filter cake [b]). Accordingly, the highest
and lowest mean BTEX concentrations were
observed in filter cake (108.24 µg/m3) and
packing (88.33 µg/m3), respectively. Between
the mentioned occupations, the highest
concentration belonged to benzene in filter
cake (50.33 µg/m3) and packing (42.0 µg/m3).
The risk assessment results regarding the
LCR and HQ based on the sampling location
and process outputs are presented in separate
tables. In order to evaluate the results of the
risk assessment, the final results based on the
Page 7
J Adv Environ Health Res (2020) 8: 79-94 85
MUK-JAEHR
pollutants were divided into three categories of
heavy metals, BTEX compounds, and PAHs,
which were also presented in a separate table.
Table 4. Mean changes in concentrations of BTEX (benzene, toluene, ethylbenzene, and xylene) pollutants at Tizro grease
oil re-refining plant of Garmsar (µg/m3)
Study area Parameters
Benzene Toluene Ethylbenzene Xylenes BTEX
A Mean 36.5 32.17 4.41 20 93.08
SD 7.05 7.69 1.1 2.35 17.43
B Mean 36.41 30.5 4.42 19.33 90.67
SD 7.56 7.52 0.5 2.89 17.51
C Mean 36.31 31.35 4.33 18.83 90.8
SD 8.72 9.13 1.19 2.59 20.44
D Mean 36.5 32.25 4.83 20.5 94.08
SD 8.15 8.161 0.79 3.31 19.48
E Mean 34.32 29.75 4.5 18 86.58
SD 7.07 6.62 0.43 3.91 17.46
F Mean 33.92 30.92 4.41 15.75 85
SD 5.37 4 0.42 3.18 14.51
G Mean 35 29.58 4.5 18.33 87.41
SD 6.31 7.36 0.79 2.68 16.28
H Mean 35.08 30.58 4.66 19.25 89.58
SD 6.22 7.78 0.60 1.95 16.12
a* Mean 35.82 27.42 6.29 18.77 88.32
SD 6.77 3.60 1.33 2.79 14.15
b** Mean 45.42 33.37 8.80 20.65 108.24
SD 6.34 5.15 1.84 6.97 20.12
* (a) Packing; **(b) Filter cake
LCR, HQ, and non-carcinogenic risk of
BTEX compounds
Tables 5 and 6 show the results of the
LCR assessment of benzene, ethylbenzene,
and their cumulative risk. The results of the
long-term LCR of benzene indicated that the
carcinogenic risk of benzene was within the
possible risk range in all the sampling sites,
while the maximum and minimum values were
determined at sampling points B and F,
respectively. Furthermore, the LCR results of
ethylbenzene at sampling points A, B, C, D, E,
F, G, and H were classified within the risk-free
range. At sampling points A and B, the LCR
results were higher and within the possible risk
range, while the maximum and minimum LCR
values of ethylbenzene were observed at
sampling points B and C, respectively.
The LCR values of the BTEX compounds
are presented in Tables 5 and 6 and were within
the possible range in all the sampling sites. On
the other hand, the maximum and minimum
LCR of the BTEX compounds were observed
at sampling points B and F, respectively.
Tables 5 and 6 show the HQ values of the
BTEX components (benzene, ethylbenzene,
toluene, and xylene). The calculated non-
carcinogenic HQ of benzene was within the
acceptable range at all the sampling points,
while close to the unacceptable range.
Moreover, the HQ value of ethylbenzene was
within the risk-free range in all sampling sites,
and the maximum and minimum values were
reported at sampling points B and C,
respectively. In the case of toluene, the
calculated values were also within the risk-free
range, and the results were very close. The HQ
and non-carcinogenic risk associated with
xylene were also within the risk-free range.
According to the findings, the cumulative
risk of the non-carcinogenic BTEX
compounds was within the acceptable range,
with the highest value calculated at sampling
point B and the lowest value observed at
sampling point F. Since benzene is a definitive
human carcinogen and classified in Group I of
Page 8
Molaei et al. 86
MUK-JAEHR
the International Agency for Research on
Cancer (IARC), it is associated with a high-
risk level, and exposure to benzene could have
irreparable effects on human health. As such,
the permissible exposure limit to this pollutant
is extremely low (0.5 ppm).24 In a study
conducted by Colman Lerner et al. in
Argentina, benzene risk in repair jobs was
reported to be definitive, while the risk of
benzene was observed to be probable in-
vitro.25 Moreover, Rahimnejad et al.
conducted a study in an oil-dependent
chemical industry, claiming that the LCR of
benzene was definitive in 13 complexes and
probable in eight complexes, and in all the
studied complexes, the risk of benzene was
higher than the recommended limits by the
WHO.22
Table 5. LCR and HQ of BTEX compounds A B C D E F G H
Chemical HQ LCR HQ LCR HQ LCR HQ LCR HQ LCR HQ LCR HQ LCR HQ LCR
Benzene 0.278 2.32E-
05 0.277
2.32E-
05 0.277
2.31E-
05 0.278
2.32E-
05 0.261
2.18E-
05 0.258
2.16E-
05 0.266
2.23E-
05 0.267
2.23E-
05
Ethylbenzene 0.0011 9.85E-
07 0.001 9E-07 0.00099
8.83E-
07 0.001 9E-07 0.001
9.17E-
07 0.001 9E-07 0.001
9.17E-
07 0.0011
9.51E-
07
Toluene 0.0015 - 0.0014 - 0.00143 - 0.0015 - 0.0014 - 0.0014 - 0.0014 - 0.0014 -
Xylenes 0.0468 - 0.0441 - 0.043 - 0.0457 - 0.0411 - 0.036 - 0.0419 - 0.0439 -
*Total
Risk/HI0.327
2.42E-
05 0.324
2.4E-
05 0.322
2.4E-
05 0.326
2.4E-
05 0.305
2.3E-
05 0.296
2.25E-
05 0.311
2.3E-
05 0.313
2.3E-
05
Table 6. LCR and HQ of BTEX compounds based on
type of occupation a * b **
Chemical HQ LCR HQ LCR
Benzene 0.273 2.28E-05 0.346 2.89E-05
Ethylbenzene 0.0014 1.28E-06 0.002 1.79E-06
Toluene 0.0013 - 0.0015 -
Xylenes 0.0406 - 0.0495 -
*Total Risk/HI 0.316 2.4E-05 0.399 3.1E-05
* (a) Packing and **(b) Filter cake
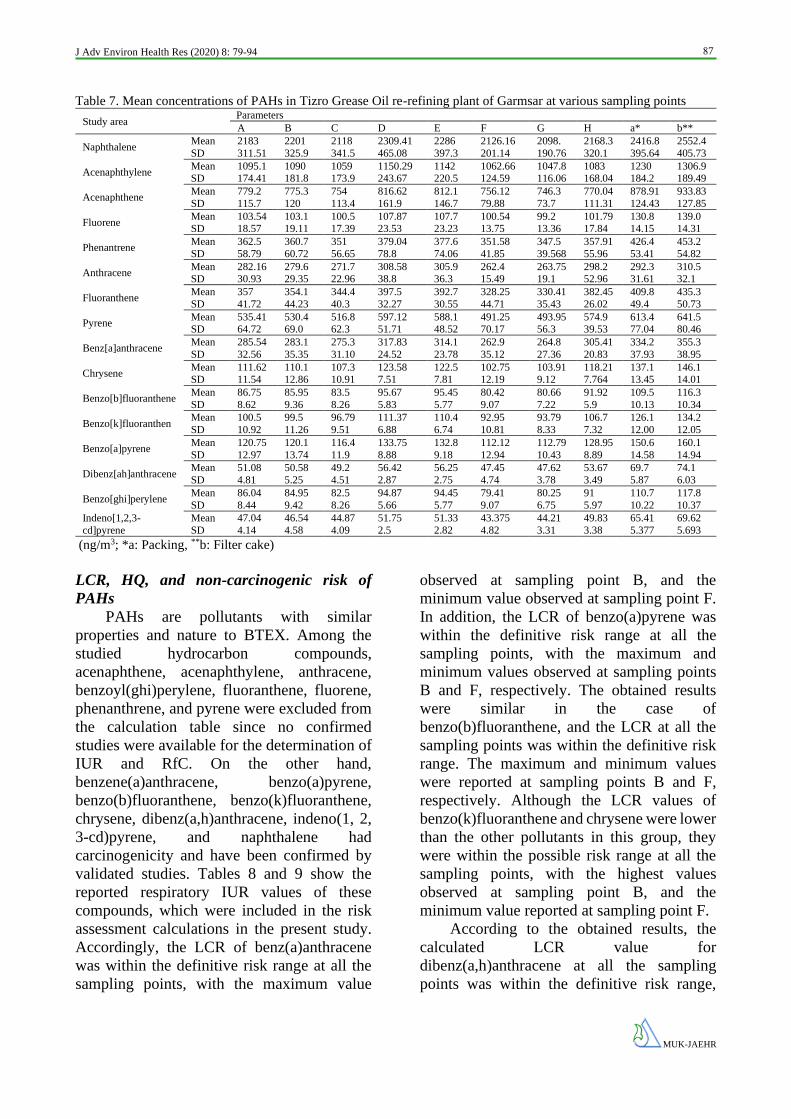
PAH concentrations The mean concentrations of 16 target
PAHs (Σ16PAHs in the atmospheric ambient
air samples obtained from the secondary oil re-
refining plant in sampling sites A-G) were as
follows: 43.5-2,586.1 ng/m3 (mean: 411.7
ng/m3), 42.5-2,630 ng/m3 (mean: 410.93
ng/m3), 40.5-2,432 ng/m3 (mean: 398.20
ng/m3), 49-2,806.6 ng/m3 (mean: 440.72
ng/m3), 48-2,638 ng/m3 (mean: 436.83 ng/m3),
38.5-2,298 ng/m3 (mean: 393.77 µg/m3), 40.5-
2,262 µg/m3 (mean: 390.93 µg/m3), and 45-
2,593.3 µg/m3 (mean: 417.65 ng/m3) (Table 7).
According to the information in Table 7, the
highest concentration of PAHs (mean:
Σ16PAHs =440.72 ng/m3) was observed at
sampling point D. Since the oil temperature
increased to 400 °C in the first distillation
section (sampling point D), the molecular
bonds between the lighter materials in the oil
were destroyed, and all the solvents and lighter
materials were removed from the oil and
transferred to cooling tanks or distillers, where
acidification was performed. In these
conditions, the leakage and removal of the
VOCs (e.g., PAHs from the furnaces, pipes,
and oil transfer joints) may have increased.
The lowest mean concentration of Σ16PAHs
(390.93 ng/m3) was observed at sampling point
G, which is an open area for the coloring of oil
barrels and metal cans (Table 7). In the present study, it was expected that
proximity to emission sources would significantly affect the PAH levels, and lower concentrations were observed in the air samples obtained from the open area for the painting of the oil barrels and metal cans (sampling point G). Furthermore, the highest and lowest mean concentrations of PAHs belonged to naphthalene (2,186.23 µg/m3) and indeno[1,2,3-cd]pyrene (47.37 µg/m3). This finding is in line with the results reported by Salaudeen et al.26 and Liu et al.27
Table 7 shows the mean PAH values
based on the type of occupation (a: packing, b)
filter cake). Accordingly, the highest mean
concentrations of PAHs were observed in filter
cake (496.63 ng/m3), while the lowest mean
concentrations of PAHs were observed in
packing (468.58 ng/m3). Moreover,
naphthalene concentration was highest among
Σ16PAHs in both occupations, so that the
highest mean concentration in filter cake was
2,552.4 ng/m3, while it was 2,416.8 ng/m3 in
packing.
Page 9
J Adv Environ Health Res (2020) 8: 79-94 87
MUK-JAEHR
Table 7. Mean concentrations of PAHs in Tizro Grease Oil re-refining plant of Garmsar at various sampling points
Study area Parameters
A B C D E F G H a* b**
Naphthalene Mean 2183 2201 2118 2309.41 2286 2126.16 2098. 2168.3 2416.8 2552.4
SD 311.51 325.9 341.5 465.08 397.3 201.14 190.76 320.1 395.64 405.73
Acenaphthylene Mean 1095.1 1090 1059 1150.29 1142 1062.66 1047.8 1083 1230 1306.9 SD 174.41 181.8 173.9 243.67 220.5 124.59 116.06 168.04 184.2 189.49
Acenaphthene Mean 779.2 775.3 754 816.62 812.1 756.12 746.3 770.04 878.91 933.83
SD 115.7 120 113.4 161.9 146.7 79.88 73.7 111.31 124.43 127.85
Fluorene Mean 103.54 103.1 100.5 107.87 107.7 100.54 99.2 101.79 130.8 139.0 SD 18.57 19.11 17.39 23.53 23.23 13.75 13.36 17.84 14.15 14.31
Phenantrene Mean 362.5 360.7 351 379.04 377.6 351.58 347.5 357.91 426.4 453.2
SD 58.79 60.72 56.65 78.8 74.06 41.85 39.568 55.96 53.41 54.82
Anthracene Mean 282.16 279.6 271.7 308.58 305.9 262.4 263.75 298.2 292.3 310.5 SD 30.93 29.35 22.96 38.8 36.3 15.49 19.1 52.96 31.61 32.1
Fluoranthene Mean 357 354.1 344.4 397.5 392.7 328.25 330.41 382.45 409.8 435.3
SD 41.72 44.23 40.3 32.27 30.55 44.71 35.43 26.02 49.4 50.73
Pyrene Mean 535.41 530.4 516.8 597.12 588.1 491.25 493.95 574.9 613.4 641.5 SD 64.72 69.0 62.3 51.71 48.52 70.17 56.3 39.53 77.04 80.46
Benz[a]anthracene Mean 285.54 283.1 275.3 317.83 314.1 262.9 264.8 305.41 334.2 355.3
SD 32.56 35.35 31.10 24.52 23.78 35.12 27.36 20.83 37.93 38.95
Chrysene Mean 111.62 110.1 107.3 123.58 122.5 102.75 103.91 118.21 137.1 146.1 SD 11.54 12.86 10.91 7.51 7.81 12.19 9.12 7.764 13.45 14.01
Benzo[b]fluoranthene Mean 86.75 85.95 83.5 95.67 95.45 80.42 80.66 91.92 109.5 116.3
SD 8.62 9.36 8.26 5.83 5.77 9.07 7.22 5.9 10.13 10.34
Benzo[k]fluoranthen Mean 100.5 99.5 96.79 111.37 110.4 92.95 93.79 106.7 126.1 134.2
SD 10.92 11.26 9.51 6.88 6.74 10.81 8.33 7.32 12.00 12.05
Benzo[a]pyrene Mean 120.75 120.1 116.4 133.75 132.8 112.12 112.79 128.95 150.6 160.1
SD 12.97 13.74 11.9 8.88 9.18 12.94 10.43 8.89 14.58 14.94
Dibenz[ah]anthracene Mean 51.08 50.58 49.2 56.42 56.25 47.45 47.62 53.67 69.7 74.1
SD 4.81 5.25 4.51 2.87 2.75 4.74 3.78 3.49 5.87 6.03
Benzo[ghi]perylene Mean 86.04 84.95 82.5 94.87 94.45 79.41 80.25 91 110.7 117.8
SD 8.44 9.42 8.26 5.66 5.77 9.07 6.75 5.97 10.22 10.37
Indeno[1,2,3-
cd]pyrene
Mean 47.04 46.54 44.87 51.75 51.33 43.375 44.21 49.83 65.41 69.62
SD 4.14 4.58 4.09 2.5 2.82 4.82 3.31 3.38 5.377 5.693
(ng/m3; *a: Packing, **b: Filter cake)
LCR, HQ, and non-carcinogenic risk of
PAHs
PAHs are pollutants with similar
properties and nature to BTEX. Among the
studied hydrocarbon compounds,
acenaphthene, acenaphthylene, anthracene,
benzoyl(ghi)perylene, fluoranthene, fluorene,
phenanthrene, and pyrene were excluded from
the calculation table since no confirmed
studies were available for the determination of
IUR and RfC. On the other hand,
benzene(a)anthracene, benzo(a)pyrene,
benzo(b)fluoranthene, benzo(k)fluoranthene,
chrysene, dibenz(a,h)anthracene, indeno(1, 2,
3-cd)pyrene, and naphthalene had
carcinogenicity and have been confirmed by
validated studies. Tables 8 and 9 show the
reported respiratory IUR values of these
compounds, which were included in the risk
assessment calculations in the present study.
Accordingly, the LCR of benz(a)anthracene
was within the definitive risk range at all the
sampling points, with the maximum value
observed at sampling point B, and the
minimum value observed at sampling point F.
In addition, the LCR of benzo(a)pyrene was
within the definitive risk range at all the
sampling points, with the maximum and
minimum values observed at sampling points
B and F, respectively. The obtained results
were similar in the case of
benzo(b)fluoranthene, and the LCR at all the
sampling points was within the definitive risk
range. The maximum and minimum values
were reported at sampling points B and F,
respectively. Although the LCR values of
benzo(k)fluoranthene and chrysene were lower
than the other pollutants in this group, they
were within the possible risk range at all the
sampling points, with the highest values
observed at sampling point B, and the
minimum value reported at sampling point F.
According to the obtained results, the
calculated LCR value for
dibenz(a,h)anthracene at all the sampling
points was within the definitive risk range,
Page 10
Molaei et al. 88
MUK-JAEHR
with the maximum risk value observed at
sampling point B, and the minimum value
reported at sampling points F and G.
Furthermore, the LCR of indeno(1, 2, 3-
cd)pyrene at all the sampling points exceeded
the acceptable range and was within the
definitive cancer risk range. The maximum
and minimum values were observed at
sampling points B and F, respectively.
Table 8. LCR and HQ of PAHs
A B C D E F G H
Chemical HQ LCR HQ LCR HQ LCR HQ LCR HQ LCR HQ LCR HQ LCR HQ LCR
Benz[a]anthracene - 0.0014 - 0.0013
8 -
0.0013
5 -
0.0015
4 -
0.0015
5 -
0.0012
9 - 0.0013 -
0.0014
9
Benzo[a]pyrene 1380
0
0.0059
1
1370
0
0.0058
7
1330
0 0.0057
1520
0 0.0065
1530
0
0.0065
4
1280
0
0.0054
9
1290
0
0.0055
2
1470
0
0.0063
1
Benzo[b]fluoranth
ene -
0.0004
24 -
0.0004
21 -
0.0004
09 -
0.0004
67 -
0.0004
68 -
0.0003
93 -
0.0003
95 -
0.0004
5
Benzo[k]fluoranth
ene -
4.92E-
05 -
4.87E-
05 -
4.74E-
05 -
0.0000
54 -
5.45E-
05 -
4.55E-
05 -
4.59E-
05 -
5.22E-
05
Chrysene - 5.46E-
06 -
5.39E-
06 -
5.25E-
06 -
5.99E-
06 -
6.05E-
06 -
5.03E-
06 -
5.08E-
06 -
5.78E-
06
Dibenz[a,h]anthra
cene - 0.0025 -
0.0024
7 -
0.0024
1 -
0.0027
5 -
0.0027
6 -
0.0023
2 -
0.0023
3 -
0.0026
3
Indeno[1,2,3-
cd]pyrene -
0.0002
3 -
0.0002
28 -
0.0002
2 -
0.0002
51 -
0.0002
53 -
0.0002
12 -
0.0002
16 -
0.0002
44
Naphthalene 166 0.0060
5 168 0.0061 161
0.0058
7 174
0.0063
4 176 0.0064 162
0.0058
9 160
0.0058
2 165
0.0060
1
*Total Risk/HI
1400
0 0.0164
1390
0 0.0164
1350
0 0.0159
1530
0 0.0177
1540
0 0.0179
1300
0 0.0155
1300
0 0.0155
1490
0 0.017
Table 9. LCR and HQ of PAHs based on type of occupation
a* b** Chemical HQ LCR HQ LCR
Benz[a]anthracene - 0.00164 - 0.00174Benzo[a]pyrene 17200 0.00737 18300 0.00784
Benzo[b]fluoranthene - 0.000536 - 0.000569 Benzo[k]fluoranthene - 6.17E-05 - 6.57E-05
Chrysene - 6.7E-06 - 7.15E-06
Dibenz[a,h]anthracene - 0.00341 - 0.00363Indeno[1,2,3-cd]pyrene - 0.00032 - 0.000341
Naphthalene 184 0.0067 194 0.00708*Total Risk/HI 17400 0.0198 18500 0.021
* (a) Packing and **(b) Filter cake
Naphthalene was the final contaminant in
this group, and the risk assessment results
indicated that its LCR was within the definitive
risk range in all the studied sites. Unlike the
other hydrocarbons, the lowest estimated LCR
value for naphthalene was at sampling point G,
while the highest value was denoted at
sampling point B. The cumulative LCR of the
hydrocarbon compounds was represented by
the black color code, demonstrating that at all
the sampling points, the cumulative LCR of the
hydrocarbon compounds was within the
definitive range. The maximum cumulative
LCR of the hydrocarbon compounds was
evaluated at sampling point B, while the
minimum value was reported at sampling
points F and G.
Although all the studied hydrocarbon
compounds were carcinogenic compounds
with previously reported IUR values, RfC was
only available for benzo(a)pyrene and
naphthalene. Consequently, the calculations of
HQ, non-cancer risk, and cumulative risk were
carried out only for these two compounds
(Tables 8 amd 9). According to the information
in Tables 8 and 9, the color codes clearly
indicated that the HQ and non-cancer risk
associated with benzo(a)pyrene were
unacceptable in all the studied sites, with the
maximum and minimum values calculated at
sampling points B and F, respectively.
Furthermore, the HQ and non-cancer risk
associated with naphthalene were
unacceptable at all the sampling points, and the
highest HQ values were calculated at sampling
point B, while the lowest value was observed
Page 11
J Adv Environ Health Res (2020) 8: 79-94 89
MUK-JAEHR
at sampling point G. The cumulative non-
cancer risk and cumulative HQ values
resulting from the sum of the risks of the two
compounds (benzo[a]pyrene and naphthalene)
were predictable since both compounds were
within the unacceptable range. Similarly, the
cumulative non-cancer risk of the hydrocarbon
compounds in all sampling sites was within the
unacceptable range. The highest cumulative
non-cancer risk was observed at sampling
point B, and the lowest was denoted at
sampling points F and G.
Heavy metal concentrations Table 10 shows the concentration of the
heavy metals based on the sampling points and
type of occupations. Among the studied heavy
metals, iron had the highest concentration.
According to the information in Table 3, the
mean concentration of the heavy metals (iron,
zinc, lead, cadmium, arsenic, and nickel) was
as follows: sampling point F (196.29 ng/m3),
sampling point H (67.58 ng/m3), sampling
point F (17.54 ng/m3), sampling point H (15.08
ng/m3), and sampling point H (5.45 ng/m3).
Table 3 also shows that iron concentration was
higher in filter cake (253.66 ng/m3), followed
by zinc (1,717 ng/m3) and lead (60.33 ng/m3).
In addition, the lowest concentrations of the
studied heavy metals based on the type of
occupation belonged to nickel and mercury,
which is consistent with the results obtained by
Hosseini et al., which demonstrated iron to
have the highest concentration.28
Table 10. Mean changes in concentrations of heavy metals in Tizro Grease Oil re-refining plant of Garmsar (ng/m3)
Study area Parameters
Fe Zn Cd As Ni Pb
A Mean 233.62 167.29 14.95 12.87 4.33 54.4
SD 23.53 17.30 2.33 1.16 0.47 6.98
B Mean 228.91 163.79 14.72 12.02 4.33 53.16
SD 24.49 15.75 2.51 1.45 0.47 7.10
C Mean 173.45 123 11.7 9.21 3.66 40.45
SD 47.72 26.35 3.91 2.84 0.94 11.11
D
Mean 239.08 170.34 15.87 14.58 5.12 63
SD 41.61 19.36 3.71 1.34 0.49 7.33
E Mean 254.25 183.08 16.22 12.45 4.08 53.95
SD 36.19 36.41 0.629 0.93 0.16 6.36
F Mean 270.87 196.29 17.54 11.79 4.166 49.95
SD 59.25 54.76 2.35 0.91 0.33 5.77
G Mean 265.37 190.16 16.79 14.41 4.95 63.87
SD 20.9 20.02 1.95 1.34 0.34 8.23
H Mean 247.53 177.08 16.04 15.08 5.45 67.58
SD 30.98 20.19 2.62 2.45 1.1 13.23
a* Mean 218.12 155.11 14.48 11.94 5.09 52.34
SD 32.55 15.2 3.83 1.198 0.27 6.84
b** Mean 219.02 156.54 14.81 12.25 5.48 53.15
SD 32.58 15.32 3.97 1.26 0.23 6.52
* (a) Packing and **(b) Filter cake
LCR, HQ, and non-carcinogenic risk of
heavy metals
According to the information in Tables 11
and 12, the calculated LCR for arsenic was
within the definitive risk range at all the
sampling points. Moreover, the calculated
LCR for lead at all the sampling points was
within the probable risk range, and the
calculated LCR for nickel was within the
definitive risk range at sampling points D, H,
and B, while it was within the probable risk
range at the other points. Moreover, the
cumulative LCR for all the heavy metals was
within the definitive risk range at all the
sampling points. Among the studied heavy
metals, the highest LCR belonged to arsenic at
sampling point G, and the highest LCR among
the sampling points was observed in sampling
Page 12
Molaei et al. 90
MUK-JAEHR
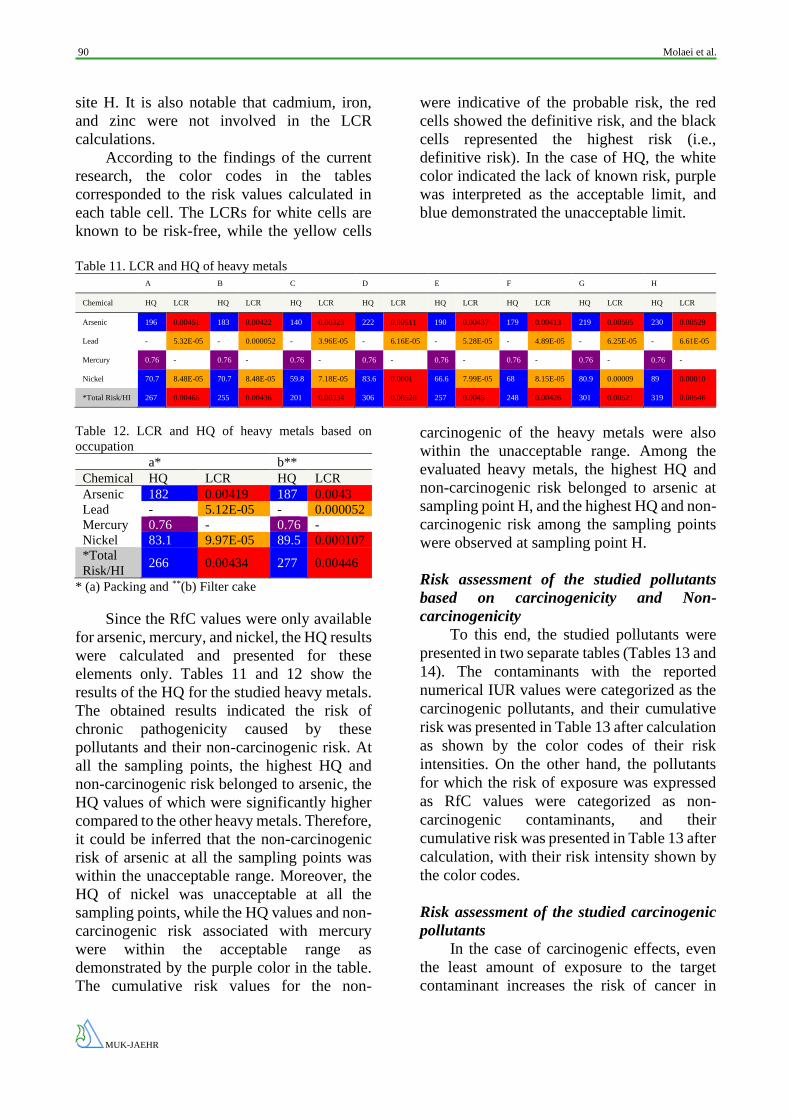
site H. It is also notable that cadmium, iron,
and zinc were not involved in the LCR
calculations.
According to the findings of the current
research, the color codes in the tables
corresponded to the risk values calculated in
each table cell. The LCRs for white cells are
known to be risk-free, while the yellow cells
were indicative of the probable risk, the red
cells showed the definitive risk, and the black
cells represented the highest risk (i.e.,
definitive risk). In the case of HQ, the white
color indicated the lack of known risk, purple
was interpreted as the acceptable limit, and
blue demonstrated the unacceptable limit.
Table 11. LCR and HQ of heavy metals
A B C D E F G H
Chemical HQ LCR HQ LCR HQ LCR HQ LCR HQ LCR HQ LCR HQ LCR HQ LCR
Arsenic 196 0.00451 183 0.00422 140 0.00323 222 0.00511 190 0.00437 179 0.00413 219 0.00505 230 0.00529
Lead - 5.32E-05 - 0.000052 - 3.96E-05 - 6.16E-05 - 5.28E-05 - 4.89E-05 - 6.25E-05 - 6.61E-05
Mercury 0.76 - 0.76 - 0.76 - 0.76 - 0.76 - 0.76 - 0.76 - 0.76 -
Nickel 70.7 8.48E-05 70.7 8.48E-05 59.8 7.18E-05 83.6 0.0001 66.6 7.99E-05 68 8.15E-05 80.9 0.00009 89 0.00010
*Total Risk/HI 267 0.00465 255 0.00436 201 0.00334 306 0.00528 257 0.0045 248 0.00426 301 0.00521 319 0.00546
Table 12. LCR and HQ of heavy metals based on
occupation a* b**
Chemical HQ LCR HQ LCR
Arsenic 182 0.00419 187 0.0043
Lead - 5.12E-05 - 0.000052
Mercury 0.76 - 0.76 -
Nickel 83.1 9.97E-05 89.5 0.000107
*Total
Risk/HI
266 0.00434 277 0.00446
* (a) Packing and **(b) Filter cake
Since the RfC values were only available
for arsenic, mercury, and nickel, the HQ results
were calculated and presented for these
elements only. Tables 11 and 12 show the
results of the HQ for the studied heavy metals.
The obtained results indicated the risk of
chronic pathogenicity caused by these
pollutants and their non-carcinogenic risk. At
all the sampling points, the highest HQ and
non-carcinogenic risk belonged to arsenic, the
HQ values of which were significantly higher
compared to the other heavy metals. Therefore,
it could be inferred that the non-carcinogenic
risk of arsenic at all the sampling points was
within the unacceptable range. Moreover, the
HQ of nickel was unacceptable at all the
sampling points, while the HQ values and non-
carcinogenic risk associated with mercury
were within the acceptable range as
demonstrated by the purple color in the table.
The cumulative risk values for the non-
carcinogenic of the heavy metals were also
within the unacceptable range. Among the
evaluated heavy metals, the highest HQ and
non-carcinogenic risk belonged to arsenic at
sampling point H, and the highest HQ and non-
carcinogenic risk among the sampling points
were observed at sampling point H.
Risk assessment of the studied pollutants
based on carcinogenicity and Non-
carcinogenicity
To this end, the studied pollutants were
presented in two separate tables (Tables 13 and
14). The contaminants with the reported
numerical IUR values were categorized as the
carcinogenic pollutants, and their cumulative
risk was presented in Table 13 after calculation
as shown by the color codes of their risk
intensities. On the other hand, the pollutants
for which the risk of exposure was expressed
as RfC values were categorized as non-
carcinogenic contaminants, and their
cumulative risk was presented in Table 13 after
calculation, with their risk intensity shown by
the color codes.
Risk assessment of the studied carcinogenic
pollutants
In the case of carcinogenic effects, even
the least amount of exposure to the target
contaminant increases the risk of cancer in
Page 13
J Adv Environ Health Res (2020) 8: 79-94 91
MUK-JAEHR
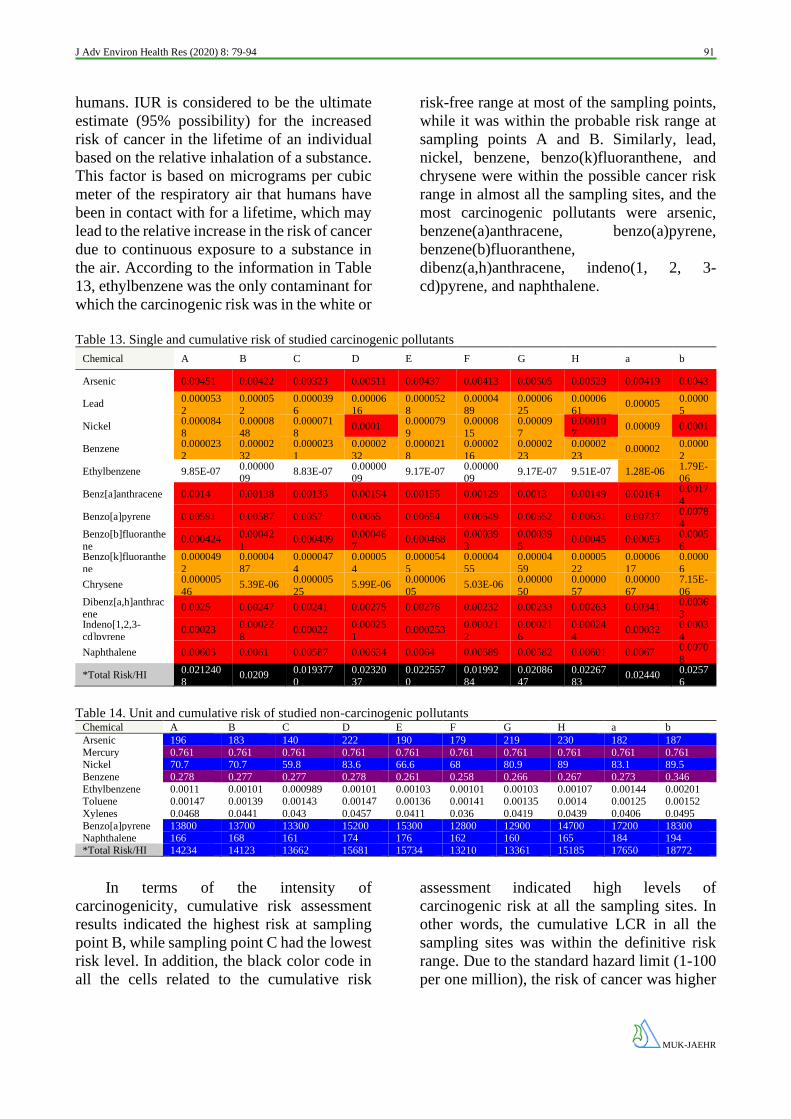
humans. IUR is considered to be the ultimate
estimate (95% possibility) for the increased
risk of cancer in the lifetime of an individual
based on the relative inhalation of a substance.
This factor is based on micrograms per cubic
meter of the respiratory air that humans have
been in contact with for a lifetime, which may
lead to the relative increase in the risk of cancer
due to continuous exposure to a substance in
the air. According to the information in Table
13, ethylbenzene was the only contaminant for
which the carcinogenic risk was in the white or
risk-free range at most of the sampling points,
while it was within the probable risk range at
sampling points A and B. Similarly, lead,
nickel, benzene, benzo(k)fluoranthene, and
chrysene were within the possible cancer risk
range in almost all the sampling sites, and the
most carcinogenic pollutants were arsenic,
benzene(a)anthracene, benzo(a)pyrene,
benzene(b)fluoranthene,
dibenz(a,h)anthracene, indeno(1, 2, 3-
cd)pyrene, and naphthalene.
Table 13. Single and cumulative risk of studied carcinogenic pollutants
Chemical A B C D E F G H a b
Arsenic 0.00451 0.00422 0.00323 0.00511 0.00437 0.00413 0.00505 0.00529 0.00419 0.0043
Lead 0.0000532
0.000052
0.0000396
0.0000616
0.0000528
0.0000489
0.0000625
0.0000661
0.00005 0.00005
Nickel 0.000084
8
0.00008
48
0.000071
8 0.0001
0.000079
9
0.00008
15
0.00009
7
0.00010
7 0.00009 0.0001
Benzene 0.000023
2
0.00002
32
0.000023
1
0.00002
32
0.000021
8
0.00002
16
0.00002
23
0.00002
23 0.00002
0.0000
2
Ethylbenzene 9.85E-07 0.0000009
8.83E-07 0.0000009
9.17E-07 0.0000009
9.17E-07 9.51E-07 1.28E-06 1.79E-06
Benz[a]anthracene 0.0014 0.00138 0.00135 0.00154 0.00155 0.00129 0.0013 0.00149 0.00164 0.0017
4
Benzo[a]pyrene 0.00591 0.00587 0.0057 0.0065 0.00654 0.00549 0.00552 0.00631 0.00737 0.0078
4 Benzo[b]fluoranthene
0.000424 0.000421
0.000409 0.000467
0.000468 0.000393
0.000395
0.00045 0.00053 0.00056
Benzo[k]fluoranthe
ne
0.000049
2
0.00004
87
0.000047
4
0.00005
4
0.000054
5
0.00004
55
0.00004
59
0.00005
22
0.00006
17
0.0000
6
Chrysene 0.000005
46 5.39E-06
0.000005
25 5.99E-06
0.000006
05 5.03E-06
0.00000
50
0.00000
57
0.00000
67
7.15E-
06 Dibenz[a,h]anthracene
0.0025 0.00247 0.00241 0.00275 0.00276 0.00232 0.00233 0.00263 0.00341 0.00363
Indeno[1,2,3-
cd]pyrene 0.00023
0.00022
8 0.00022
0.00025
1 0.000253
0.00021
2
0.00021
6
0.00024
4 0.00032
0.0003
4
Naphthalene 0.00605 0.0061 0.00587 0.00634 0.0064 0.00589 0.00582 0.00601 0.0067 0.0070
8
*Total Risk/HI
0.0212408
0.0209 0.0193770
0.0232037
0.0225570
0.0199284
0.0208647
0.0226783
0.02440 0.02576
Table 14. Unit and cumulative risk of studied non-carcinogenic pollutants Chemical A B C D E F G H a b
Arsenic 196 183 140 222 190 179 219 230 182 187
Mercury 0.761 0.761 0.761 0.761 0.761 0.761 0.761 0.761 0.761 0.761 Nickel 70.7 70.7 59.8 83.6 66.6 68 80.9 89 83.1 89.5
Benzene 0.278 0.277 0.277 0.278 0.261 0.258 0.266 0.267 0.273 0.346
Ethylbenzene 0.0011 0.00101 0.000989 0.00101 0.00103 0.00101 0.00103 0.00107 0.00144 0.00201 Toluene 0.00147 0.00139 0.00143 0.00147 0.00136 0.00141 0.00135 0.0014 0.00125 0.00152
Xylenes 0.0468 0.0441 0.043 0.0457 0.0411 0.036 0.0419 0.0439 0.0406 0.0495
Benzo[a]pyrene 13800 13700 13300 15200 15300 12800 12900 14700 17200 18300 Naphthalene 166 168 161 174 176 162 160 165 184 194
*Total Risk/HI 14234 14123 13662 15681 15734 13210 13361 15185 17650 18772
In terms of the intensity of
carcinogenicity, cumulative risk assessment
results indicated the highest risk at sampling
point B, while sampling point C had the lowest
risk level. In addition, the black color code in
all the cells related to the cumulative risk
assessment indicated high levels of
carcinogenic risk at all the sampling sites. In
other words, the cumulative LCR in all the
sampling sites was within the definitive risk
range. Due to the standard hazard limit (1-100
per one million), the risk of cancer was higher
Page 14
Molaei et al. 92
MUK-JAEHR
in the workers exposed to benzene-1,3,5 and
cadmium.
Risk assessment of the studied non-
carcinogenic pollutants
In the non-carcinogenic group, the
probability of human exposure is extremely
low until the amount of human exposure to the
contaminant reaches a certain level (i.e.,
threshold limit). In the case of air pollutants,
the inhalation reference concentration is
equivalent to the amount of the pollutants that
must be inhaled through the respiratory tract to
perceive the possible adverse effects on the
human body; this value is reported in
milligrams per cubic meter. If an individual is
exposed to contaminants at higher levels than
this threshold, the hazard index, which is
obtained by dividing the amount of the
contaminant (concentration of the inhaled air)
by the inhalation reference concentration, the
value is greater than one, which indicates that
the exposed individuals are at the risk of non-
carcinogenic health complications.
Table 14 shows the HQ values of the non-
carcinogenic pollutants at the sampling points.
Since all the studied non-carcinogenic
pollutants are presented in Table 14, the
calculated cumulative risk in the table more
broadly indicates the extent of non-
carcinogenic risks. According to the
information in Table 14, the three pollutants
(ethylbenzene, toluene, and xylene) were
within the permissible limits as shown by the
white color code at all the sampling points,
while mercury and benzene were within the
acceptable range.
According to the results of the present
study, the non-carcinogenic pollutants
associated with the highest risk included
arsenic, nickel, benzo(a)pyrene, and
naphthalene, and risk assessment results of all
these elements were within unacceptable
ranges at all the sampling points. On the other
hand, benzo(a)pyrene was the compound with
the maximum distance and acceptable levels.
The highest cumulative non-carcinogenic risk
was observed at sampling point B, and the
lowest cumulative non-carcinogenic risk was
reported at sampling point F. To determine the
level of non-carcinogenic risk due to the
presence of heavy metals in the air, the daily
exposure value was calculated (mg/m3), and
the long-term and chronic HQ for the heavy
metals was also determined to estimate the
non-carcinogenic effects.
Conclusion
According to the results, the highest
concentrations of the organic compounds
(BTEX and PAHs) were observed at sampling
point D. Between BTEX and PAHs, the
highest concentration belonged to benzene and
naphthalene in all the sampling sites,
respectively, the values of which were above
the standard. Furthermore, the highest
concentration of the pollutants (BTEX, PAHs,
and heavy metals) was observed in the filter
cake occupation. Among the studied heavy
metals, iron had the highest concentration,
followed by zinc (1,717 µg/m3) and lead
(60.33 µg/m3).
The obtained results demonstrated that the
cumulative LCR for the evaluated heavy
metals at all the sampling points was within the
definitive risk range, and the highest LCR of
carcinogenic risk belonged to arsenic at
sampling point H (filtration chamber). In
addition, the highest cumulative carcinogenic
risk among the environmental sampling sites
was reported at sampling point H. At all the
sampling points, the LCR carcinogenic risk
belonged to the hydrocarbon compounds
within the definitive risk range, and the
maximum cumulative LCR carcinogenicity
among the hydrocarbon compounds was
observed in the filtration room (sampling point
B). On the other hand, the risk assessment
results demonstrated that the most hazardous
carcinogens were arsenic, benzo(a)pyrene, and
naphthalene. Risk assessment results could be
used to prioritize resources for risk reduction,
engineering, management, and control
measures.
Acknowledgements
This article was extracted from a Ph.D.
thesis conducted by Iman Molaei and approved
Page 15
J Adv Environ Health Res (2020) 8: 79-94 93
MUK-JAEHR
by the Islamic Azad University, Research and
Sciences Branch, Iran. Hereby, we extend our
gratitude to the Islamic Azad University for the
financial and instrumental support of this
research project.
References 1. Dargahi A, Bagheri S, Poursadeghiyan M,
Hosseini Ahagh MM, Farrokhi M. Knowledge
and attitudes of students in Khalkhal medical
sciences faculty on health actions in
emergencies. Health Emergen Disaster 2017;
3(1): 51-6.
2. Eslami F, Salari M, Dehghani MH, Dargahi A,
Nazmara S, Beheshti A. Relationship of
formaldehyde concentration in ambient air
with CO, NO2, O3, temperature and humidity:
modeling by response surface model. Arch
Hyg Sci 2019; 8(1): 9-16.
3. Bahrami A, Ghorbani Shanh F, Rahimpoor R.
Comparation of health risk assessment
carcinogenic hydrocarbons in Workplace air in
an oil-dependent industry by the
Environmental Protection Agency (EPA) and
the Department of Human Resources
Malaysia. Iran Occup Health 2017; 14(5): 107-
17.
4. Ali N. Polycyclic aromatic hydrocarbons
(PAHs) in indoor air and dust samples of
different Saudi microenvironments; health and
carcinogenic risk assessment for the general
population. Sci Total Environ 2019; 696:
133995.
5. Khamutian R, Najafi F, Soltanian M,
Shokoohizadeh MJ, Poorhaghighat S, Dargahi
A, et al. The association between air pollution
and weather conditions with increase in the
number of admissions of asthmatic patients in
emergency wards: A case study in
Kermanshah. Med J Islam Repub Iran 2015;
29(1): 558-65.
6. Harb P, Locoge N, Thevenet F. Emissions and
treatment of VOCs emitted from wood-based
construction materials: Impact on indoor air
quality. Chem Eng J 2018; 354: 641-52.
7. Cerón Bretón JG, Cerón Bretón RM, Vivas
Ucan F, Baeza CB, Fuentes MDLLE, Lara ER,
et al. Characterization and sources of Aromatic
Hydrocarbons (BTEX) in the atmosphere of
two urban sites located in Yucatan Peninsula in
Mexico. Atmosphere 2017; 8(6): 107.
8. Davey NG, Bell RJ, Gill CG, Krogh ET.
Mapping the geospatial distribution of
atmospheric BTEX compounds using portable
mass spectrometry and adaptive whole air
sampling. Atmos Pollut Res 2019; 11(3): 545-
53.
9. USEPA (US). Environmental protection
Agency. Integrated risk information system
(IRIS). 2014b; Available from:
http://www.epa.gov/iris/index.html.
10. Mari M, Harrison RM, Schuhmacher M,
Domingo JL, Pongpiachan S. Inferences over
the sources and processes affecting polycyclic
aromatic hydrocarbons in the atmosphere
derived from measured data. Sci Total Environ
2010; 408(11): 2387-93.
11. Dauner ALL, Lourenço RA, Martins CC.
Effect of seasonal population fluctuation in the temporal and spatial distribution of polycyclic
aromatic hydrocarbons in a subtropical estuary. Environ Technol Innov 2016; 5: 41-
51. 12. Ebrahimi-Seirizi Z, Riyahi-Bakhtiari A,
Ghaffari S. Petroleum pollution risk assessment in sediment of Hara protected zone
with determination of polycyclic aromatic hydrocarbons. J Mazandaran Univ Med Sci
2014; 23(2): 186-94. 13. Kermani M, Asadgol Z, Arfaeinia H. A study
of polycyclic aromatic hydrocarbons (PAHs) and Trace Elements in Ambient air PM2.5 in an
urban site of Tehran, Iran. Iran J Health Safe
Environ 2018; 5(2): 947-56. 14. Almasi A, Dargahi A, Ahagh M, Janjani H,
Mohammadi M, Tabandeh L. Efficiency of a constructed wetland in controlling organic
pollutants, nitrogen, and heavy metals from sewage. J Chem Pharm Scie 2016; 9(4): 2924-
8. 15. Jahangiri M, Jalali M, Saeidi C,
Mohammadpour H, Mardi H, Mehr Alipour J. Health risk assessment of harmful chemicals in
order to provide control guidelines: Case study in a polyurethane foam industry. Occup Med Q
J 2014; 5(4): 33-41. 16. Mustafa MF, Liu Y, Duan Z, Guo H, Xu S,
Wang H, et al. Volatile compounds emission and health risk assessment during composting
of organic fraction of municipal solid waste. J
Hazard Mater 2017; 327: 35-43. 17. Dehghani MH, Baghani AN, Fazlzadeh M,
Ghaffari HR. Exposure and risk assessment of BTEX in indoor air of gyms in Tehran, Iran.
Microchem J 2019; 150: 104135.
18. Mousavian NA, Mansouri N, Nezhadkurki F.
Estimation of heavy metal exposure in
Page 16
Molaei et al. 94
MUK-JAEHR
workplace and health risk exposure assessment
in steel industries in Iran. Meas 2017; 102:
286-90.
19. Duruibe JO, Ogwuegbu M, Egwurugwu J.
Heavy metal pollution and human biotoxic
effects. Int J Phys Sci 2007; 2(5): 112-8.
20. WHO. Air quality guideline for Europe. WHO
European Series, WHO Regional Office for
Europe, Copenhagen, 1987, 105–117.
http://www.euro.who.int/air.
21. Lin Y-C, Lee W-J, Chen S-J, Chang-Chien G-
P, Tsai P-J. Characterization of PAHs exposure
in workplace atmospheres of a sinter plant and
health-risk assessment for sintering workers. J
Hazard Mater 2008; 158(2-3): 636-43.
22. Rahimnejad S, Bahrami A, Assari M,
Sultanian A, Rahimpoor R, Negahban A, et al.
Quantitative risk assessment of occupational
exposure to volatile organic compounds in the
oil-dependent chemical industry. J Sabzevar
Univ Med Sci 2014; 21(5): 829-41.
23. Hydrocarbons A. Method 1501. NIOSH
Manual of Analytical Methods (NMAM),
Foure Available from:
https://www.cdc.gov/niosh/docs/2003-
154/pdfs/1501.pdf.
24. WHO (World Health Organization). Air
quality guidelines forEurope. Regional Office
for Europe, Copenhagen, Copenhagen. 2th ed;
2111. [updated Accessed February 20, 2100];
Available from:
http://www.euro.who.int/data/assets/pdf_file/
70732/1110/E70222.pdf.
25. Colman Lerner JE, Sanchez EY, Sambeth JE,
Porta AA. Characterization and health risk
assessment of VOCs in occupational
environments in Buenos Aires, Argentina.
Atmos Environ 2012; 55: 440-7.
26. Salaudeen I, Sonibare O, Sojinu S, Ekundayo
O. Polycyclic aromatic hydrocarbons in air
from industrial areas in Lagos and Ogun states,
Nigeria. Pollut 2017; 3(4): 561-73.
27. Liu Y, Zhu L, Shen X. Polycyclic aromatic
hydrocarbons (PAHs) in indoor and outdoor air
of Hangzhou, China. Environ Sci Technol
2001; 35(5): 840-4.
28. Hosseini G, Teymouri P, Giahi O, Maleki A.
Health risk assessment of heavy metals in
atmospheric PM10 in Kurdistan University of
Medical Sciences campus. J Mazandaran Univ
Med Sci 2016; 25(132): 136-46.