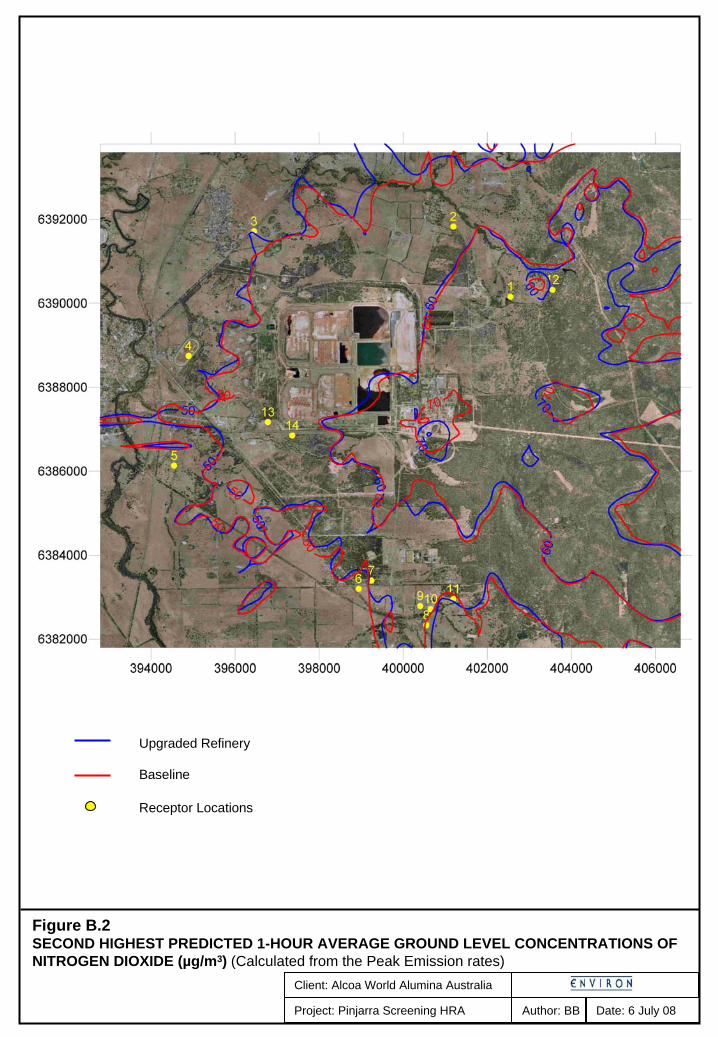
FINAL Health Risk Screening Assessment of the Upgraded Pinjarra Refinery Prepared for: Alcoa World Alumina Australia Perth, Western Australia Prepared by: ENVIRON Australia Pty Ltd Date: July 2008 Project Number: AS110256
Transcript
F I N A L
Health Risk Screening Assessment of the
Upgraded Pinjarra Refinery
Prepared for: Alcoa World Alumina Australia
Perth, Western Australia
Prepared by: ENVIRON Australia Pty Ltd
Date: July 2008
Project Number: AS110256
F I N A L
Alcoa World Alumina Australia 9 July 2008
Health Risk Screening Assessment of the Upgraded Pinjarra Refinery
Page i
F I N A L
AS110256 X:\Projects_and_Clients\Alcoa of Australia\AS110256 Alcoa HRA Pinjarra\Report\AS110256_Upgraded Pinjarra Refinery_D0.doc
This document is issued in confidence to Alcoa World Alumina Australia for the purposes of investigating the potential health risk arising from atmospheric emissions from the Upgraded Pinjarra Refinery. It should not be used for any other purpose.
The report must not be reproduced in whole or in part except with the prior consent of ENVIRON Australia Pty Ltd and subject to inclusion of an acknowledgement of the source.
Whilst reasonable attempts have been made to ensure that the contents of this report are accurate and complete at the time of writing, ENVIRON Australia Pty Ltd disclaims any responsibility for loss or damage that may be occasioned directly or indirectly through the use of, or reliance on, the contents of this report.
Health Risk Screening Assessment of the Upgraded Pinjarra Refinery
Page ii
F I N A L
AS110256 X:\Projects_and_Clients\Alcoa of Australia\AS110256 Alcoa HRA Pinjarra\Report\AS110256_Upgraded Pinjarra Refinery_D0.doc
Alcoa World Alumina Australia 9 July 2008
Health Risk Screening Assessment of the Upgraded Pinjarra Refinery
Page iii
F I N A L
AS110256 X:\Projects_and_Clients\Alcoa of Australia\AS110256 Alcoa HRA Pinjarra\Report\AS110256_Upgraded Pinjarra Refinery_D0.doc
Forward
This report was commissioned by Alcoa to meet in part its commitments under EPA Bulletin 1122 and consequent Ministerial Statement 646 (March, 2004) of the WA Minister for the Environment. Ministerial Condition 8-21 requires Alcoa as the proponent of the Pinjarra Efficiency Upgrade to:
Within six months following commissioning of the upgraded plant, the proponent shall further validate/revise the air quality predictions and the Health Risk Assessment carried out for the Environmental Protection Statement using actual emission source monitoring data for the upgraded refinery, including area source data from the Residue Disposal Area, and ambient air quality monitoring data, to the requirements of the Minister for the Environment on advice of the Environmental Protection Authority.
This report forms one in a series of three linked reports that collectively revise the air quality predictions and Health Risk Assessment conducted for the Pinjarra Efficiency Upgrade, as required under Condition 8-2; including additional source emissions monitoring data collected since commissioning of the upgrade, area source data from the Residue Disposal Area and ambient air quality monitoring data.
The three linked reports are:
1. Air Assessments Ltd, 2008: Pinjarra Refinery Efficiency Upgrade Air Quality Modelling for the 2008 HRA; consultant report to Alcoa, July 2008
2. ENVIRON Australia Pty Ltd, 2008 (a): Report on Methods Used to Calculate Atmospheric Emissions from Alcoa’s Upgraded Pinjarra Refinery; consultant report to Alcoa, June 2008
3. ENVIRON Australia Pty Ltd, 2008(b): Health Risk Screening Assessment of the Upgraded Pinjarra Refinery; consultant report to Alcoa, July 2008 (this report)
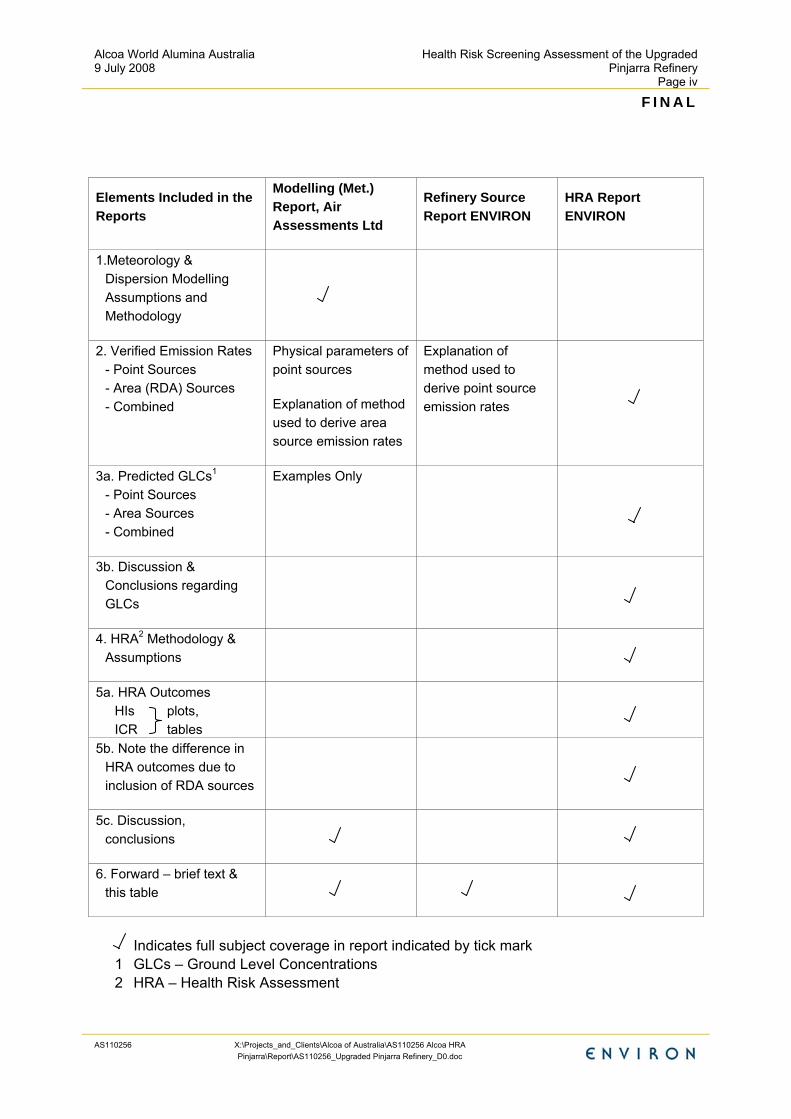
This report should be read in the knowledge that it forms an element of a sequence of reported investigations and analyses that taken together, make up the revised air quality predictions and Health Risk Assessment conducted for the upgraded refinery. The following table has been prepared to indicate the key elements and matters covered in each of the three reports. If the reader requires other information not contained in this report, reference should be made to this table so that the report relevant to the specific area of interest can be consulted.
1 The initial model validation required under Ministerial Condition 8-1 has been addressed previously. The
final model validation report was completed and lodged with the Department of Environment in March 2008.
Alcoa World Alumina Australia 9 July 2008
Health Risk Screening Assessment of the Upgraded Pinjarra Refinery
Page iv
F I N A L
AS110256 X:\Projects_and_Clients\Alcoa of Australia\AS110256 Alcoa HRA Pinjarra\Report\AS110256_Upgraded Pinjarra Refinery_D0.doc
Elements Included in the Reports
Modelling (Met.) Report, Air Assessments Ltd
Refinery Source Report ENVIRON
HRA Report ENVIRON
1.Meteorology & Dispersion Modelling Assumptions and Methodology
2. Verified Emission Rates - Point Sources - Area (RDA) Sources - Combined
Physical parameters of point sources
Explanation of method used to derive area source emission rates
Explanation of method used to derive point source emission rates
3a. Predicted GLCs1 - Point Sources - Area Sources - Combined
Examples Only
3b. Discussion & Conclusions regarding GLCs
4. HRA2 Methodology & Assumptions
5a. HRA Outcomes HIs plots, ICR tables
5b. Note the difference in HRA outcomes due to inclusion of RDA sources
5c. Discussion, conclusions
6. Forward – brief text & this table
Indicates full subject coverage in report indicated by tick mark
1 GLCs – Ground Level Concentrations 2 HRA – Health Risk Assessment
Alcoa World Alumina Australia 9 July 2008
Health Risk Screening Assessment of the Upgraded Pinjarra Refinery
Page v
F I N A L
AS110256 X:\Projects_and_Clients\Alcoa of Australia\AS110256 Alcoa HRA Pinjarra\Report\AS110256_Upgraded Pinjarra Refinery_D0.doc
Executive Summary
In early 2004, Alcoa World Alumina Australia (Alcoa) was granted Ministerial Approval to increase the alumina production capacity of its Pinjarra Refinery from 3.5 Mtpa to approximately 4.2 Mtpa through the implementation of the Pinjarra Efficiency Upgrade (PEU) project. A key focus of the PEU project was the installation and upgrade of emission control equipment at the refinery. Since the Ministerial Approval for the PEU was granted, Alcoa has undertaken a comprehensive stack emission monitoring program at the Pinjarra Refinery, and conducted a study to evaluate dust emissions from the Residue Disposal Area (RDA). The results of these programs have been used to improve the estimates of atmospheric emissions from the refinery.
A screening assessment of the potential health risk arising from atmospheric emissions from the Pinjarra Refinery has been conducted using the refined emission estimates, and including emissions from the RDA. The screening assessment considered the potential health risks associated with a Baseline and an Upgraded Refinery emissions scenarios, defined as follows:
• Baseline emissions scenario representative of emissions from the Pinjarra Refinery operating at an alumina production rate of approximately 3.5 Mtpa, prior to the commencement of the Pinjarra Efficiency Upgrade (PEU) project; and
• Upgraded Refinery emissions scenario representative of emissions from the Pinjarra Refinery operating at an alumina production rate of approximately 4.2 Mtpa, following implementation of the PEU project.
The screening health risk assessment has been confined to the inhalation pathway as this is expected to represent the most significant exposure route in relation to the Pinjarra Refinery emissions. The exposure concentrations have been calculated by ENVIRON for both the Baseline and Upgraded Refinery emission scenarios using emissions information provided by Alcoa and the results of air dispersion modelling completed by Air Assessments (2008).
The screening assessment considered the health risk associated with 21 individual compounds or groups of compounds, comprised of the particulates, products of combustion, metals, ammonia, organic compounds (including Polycyclic Aromatic Hydrocarbons [PAHs]), and dioxins and furans, across the modelling domain. More detailed analysis is presented for 14 discrete receptor locations identified by Alcoa to represent populations that could be exposed to the atmospheric emissions from the Pinjarra Refinery.
The potential health effects arising from the predicted short-term (acute) and long-term (chronic) exposure to non-carcinogenic compounds, and potential carcinogenic risks were considered in the screening assessment by comparing the predicted exposure concentrations at the receptor locations with health protective guidelines for ambient air developed by reputable authorities such as the National Environment Protection Council (NEPC), World Health Organisation (WHO) and the U.S Environmental Protection Agency (USEPA).
Alcoa World Alumina Australia 9 July 2008
Health Risk Screening Assessment of the Upgraded Pinjarra Refinery
Page vi
F I N A L
AS110256 X:\Projects_and_Clients\Alcoa of Australia\AS110256 Alcoa HRA Pinjarra\Report\AS110256_Upgraded Pinjarra Refinery_D0.doc
The Hazard Index (HI) was calculated in order to evaluate the potential for non-carcinogenic adverse health effects from simultaneous exposure to multiple compounds by summing the ratios of the predicted concentrations in air to the health protective guidelines for individual compounds. The general rule of thumb for interpreting the HI is that:
• values less than one represent no cause for concern;
• values greater than one but less than 10 generally do not represent cause for concern because of the inherent conservatism embedded in the exposure and toxicity assessments; and
• values greater than ten may present some concern with respect to possible health effects (Toxikos, 2003).
To assess the potential health effects associated with exposure to carcinogens, the incremental carcinogenic risk was calculated in order to provide an indication of the incremental probability that an individual may develop cancer over a lifetime as a direct result of exposure to potential carcinogens. The incremental carcinogenic risk that is considered acceptable varies between jurisdictions, typically ranging from one in a million (1x10⁻⁶) to one in ten thousand (1x10⁻⁴). The most stringent criterion of one in a million represents the USEPA’s de minimis, or essentially negligible incremental risk level, and has therefore been adopted for this screening assessment as a conservative (i.e. most health protective) indicator of acceptable incremental carcinogenic risk.
The results of the screening health risk assessment for atmospheric emissions from the Pinjarra Refinery indicate that:
• the inclusion of the fugitive emission sources (i.e. RDA and Bauxite stockpile area) resulted in PM10 being a more significant contributor to the Acute HIs than it was in the original PEU;
• the potential for emissions from the Upgraded Refinery to cause acute or chronic non-carcinogenic health effects is low;
• the potential for emissions from the Upgraded Refinery to contribute significantly to an increase in the incremental carcinogenic risk in the exposed population is low; and
• the Acute and Chronic HI, and incremental carcinogenic risk are predicted to be lower at all of the receptor locations for the Upgraded Refinery emissions scenario compared to the Baseline.
As with any risk evaluation, there are areas of uncertainty in this screening assessment. To ensure that potential risks are not underestimated, conservative assumptions have been used to characterise exposure and toxicity wherever possible. This results in compounding of conservatism, and so it is considered likely that the quantitative risk indicators are over-estimates of potential health risks associated with emissions from the Pinjarra Refinery.
Alcoa World Alumina Australia 9 July 2008
Health Risk Screening Assessment of the Upgraded Pinjarra Refinery
Page vii
F I N A L
AS110256 X:\Projects_and_Clients\Alcoa of Australia\AS110256 Alcoa HRA Pinjarra\Report\AS110256_Upgraded Pinjarra Refinery_D0.doc
Contents Page
1 Introduction 1
2 Overview of the Screening Assessment Approach 3
3 Exposure Assessment 4 3.1 Compounds considered 4 3.2 Potential Receptor Locations 5 3.3 Potentially Complete Exposure Pathways 6 3.4 Estimated Concentrations in Air 6 3.4.1 Averaging Period Adjustment 6 3.4.2 Chemical Transformation 7
Health Risk Screening Assessment of the Upgraded Pinjarra Refinery
Page viii
F I N A L
AS110256 X:\Projects_and_Clients\Alcoa of Australia\AS110256 Alcoa HRA Pinjarra\Report\AS110256_Upgraded Pinjarra Refinery_D0.doc
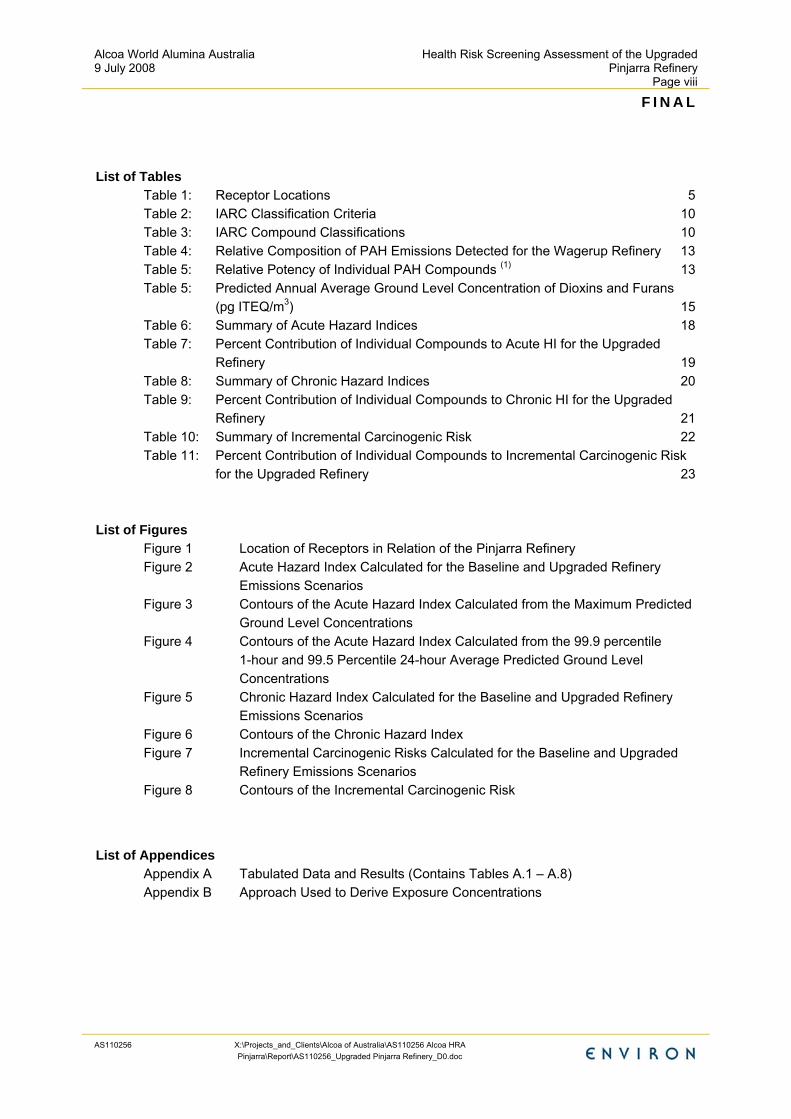
List of Tables
Table 1: Receptor Locations 5 Table 2: IARC Classification Criteria 10 Table 3: IARC Compound Classifications 10 Table 4: Relative Composition of PAH Emissions Detected for the Wagerup Refinery 13 Table 5: Relative Potency of Individual PAH Compounds (1) 13 Table 5: Predicted Annual Average Ground Level Concentration of Dioxins and Furans
(pg ITEQ/m3) 15 Table 6: Summary of Acute Hazard Indices 18 Table 7: Percent Contribution of Individual Compounds to Acute HI for the Upgraded
Refinery 19 Table 8: Summary of Chronic Hazard Indices 20 Table 9: Percent Contribution of Individual Compounds to Chronic HI for the Upgraded
Refinery 21 Table 10: Summary of Incremental Carcinogenic Risk 22 Table 11: Percent Contribution of Individual Compounds to Incremental Carcinogenic Risk
for the Upgraded Refinery 23
List of Figures
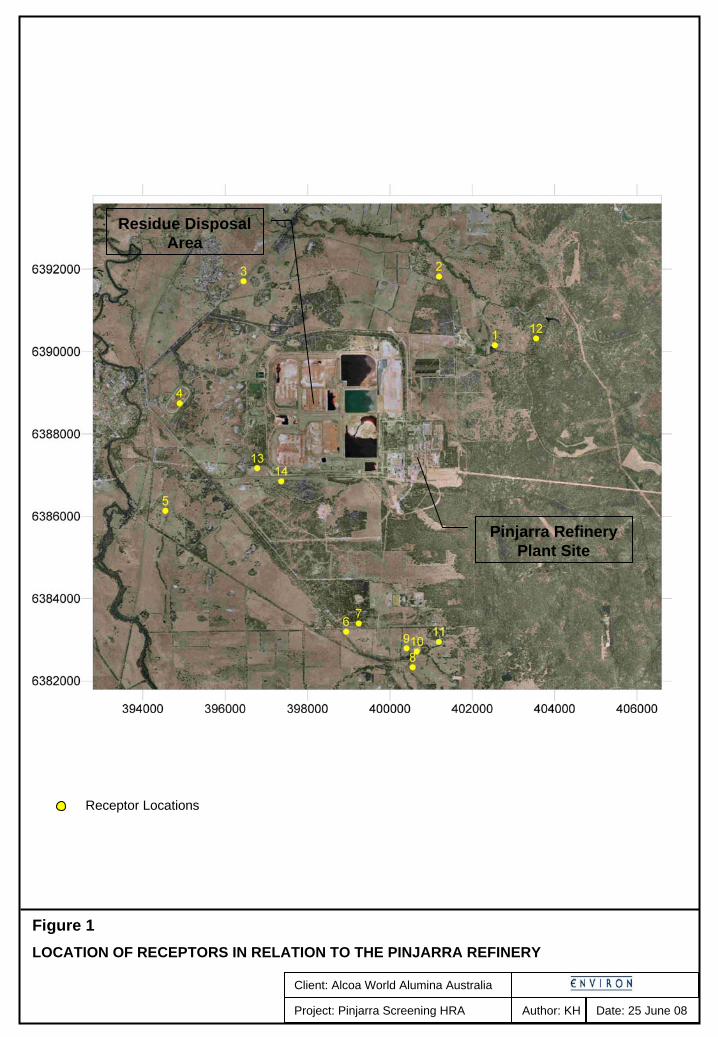
Figure 1 Location of Receptors in Relation of the Pinjarra Refinery Figure 2 Acute Hazard Index Calculated for the Baseline and Upgraded Refinery
Emissions Scenarios Figure 3 Contours of the Acute Hazard Index Calculated from the Maximum Predicted
Ground Level Concentrations Figure 4 Contours of the Acute Hazard Index Calculated from the 99.9 percentile
1-hour and 99.5 Percentile 24-hour Average Predicted Ground Level Concentrations
Figure 5 Chronic Hazard Index Calculated for the Baseline and Upgraded Refinery Emissions Scenarios
Figure 6 Contours of the Chronic Hazard Index Figure 7 Incremental Carcinogenic Risks Calculated for the Baseline and Upgraded
Refinery Emissions Scenarios Figure 8 Contours of the Incremental Carcinogenic Risk
List of Appendices Appendix A Tabulated Data and Results (Contains Tables A.1 – A.8) Appendix B Approach Used to Derive Exposure Concentrations
Alcoa World Alumina Australia 9 July 2008
Health Risk Screening Assessment of the Upgraded Pinjarra Refinery
Page 1
F I N A L
AS110256 X:\Projects_and_Clients\Alcoa of Australia\AS110256 Alcoa HRA Pinjarra\Report\AS110256_Upgraded Pinjarra Refinery_D0.doc
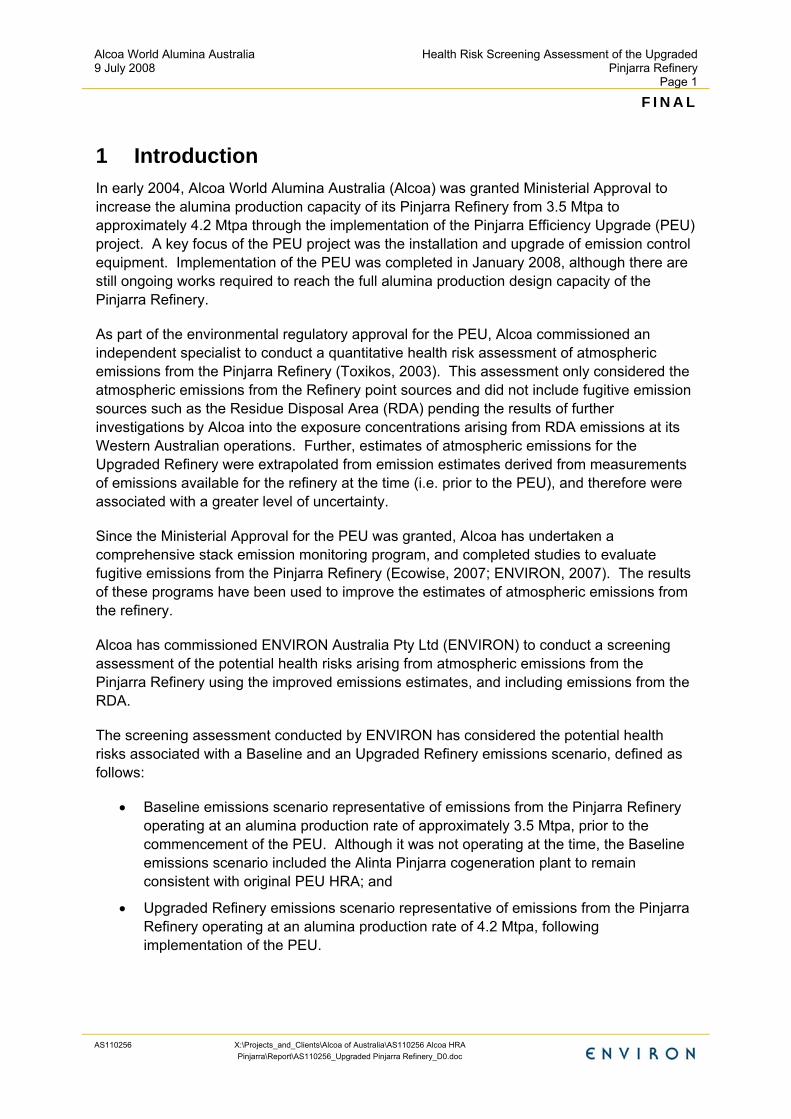
1 Introduction In early 2004, Alcoa World Alumina Australia (Alcoa) was granted Ministerial Approval to increase the alumina production capacity of its Pinjarra Refinery from 3.5 Mtpa to approximately 4.2 Mtpa through the implementation of the Pinjarra Efficiency Upgrade (PEU) project. A key focus of the PEU project was the installation and upgrade of emission control equipment. Implementation of the PEU was completed in January 2008, although there are still ongoing works required to reach the full alumina production design capacity of the Pinjarra Refinery.
As part of the environmental regulatory approval for the PEU, Alcoa commissioned an independent specialist to conduct a quantitative health risk assessment of atmospheric emissions from the Pinjarra Refinery (Toxikos, 2003). This assessment only considered the atmospheric emissions from the Refinery point sources and did not include fugitive emission sources such as the Residue Disposal Area (RDA) pending the results of further investigations by Alcoa into the exposure concentrations arising from RDA emissions at its Western Australian operations. Further, estimates of atmospheric emissions for the Upgraded Refinery were extrapolated from emission estimates derived from measurements of emissions available for the refinery at the time (i.e. prior to the PEU), and therefore were associated with a greater level of uncertainty.
Since the Ministerial Approval for the PEU was granted, Alcoa has undertaken a comprehensive stack emission monitoring program, and completed studies to evaluate fugitive emissions from the Pinjarra Refinery (Ecowise, 2007; ENVIRON, 2007). The results of these programs have been used to improve the estimates of atmospheric emissions from the refinery.
Alcoa has commissioned ENVIRON Australia Pty Ltd (ENVIRON) to conduct a screening assessment of the potential health risks arising from atmospheric emissions from the Pinjarra Refinery using the improved emissions estimates, and including emissions from the RDA.
The screening assessment conducted by ENVIRON has considered the potential health risks associated with a Baseline and an Upgraded Refinery emissions scenario, defined as follows:
• Baseline emissions scenario representative of emissions from the Pinjarra Refinery operating at an alumina production rate of approximately 3.5 Mtpa, prior to the commencement of the PEU. Although it was not operating at the time, the Baseline emissions scenario included the Alinta Pinjarra cogeneration plant to remain consistent with original PEU HRA; and
• Upgraded Refinery emissions scenario representative of emissions from the Pinjarra Refinery operating at an alumina production rate of 4.2 Mtpa, following implementation of the PEU.
Alcoa World Alumina Australia 9 July 2008
Health Risk Screening Assessment of the Upgraded Pinjarra Refinery
Page 2
F I N A L
AS110256 X:\Projects_and_Clients\Alcoa of Australia\AS110256 Alcoa HRA Pinjarra\Report\AS110256_Upgraded Pinjarra Refinery_D0.doc
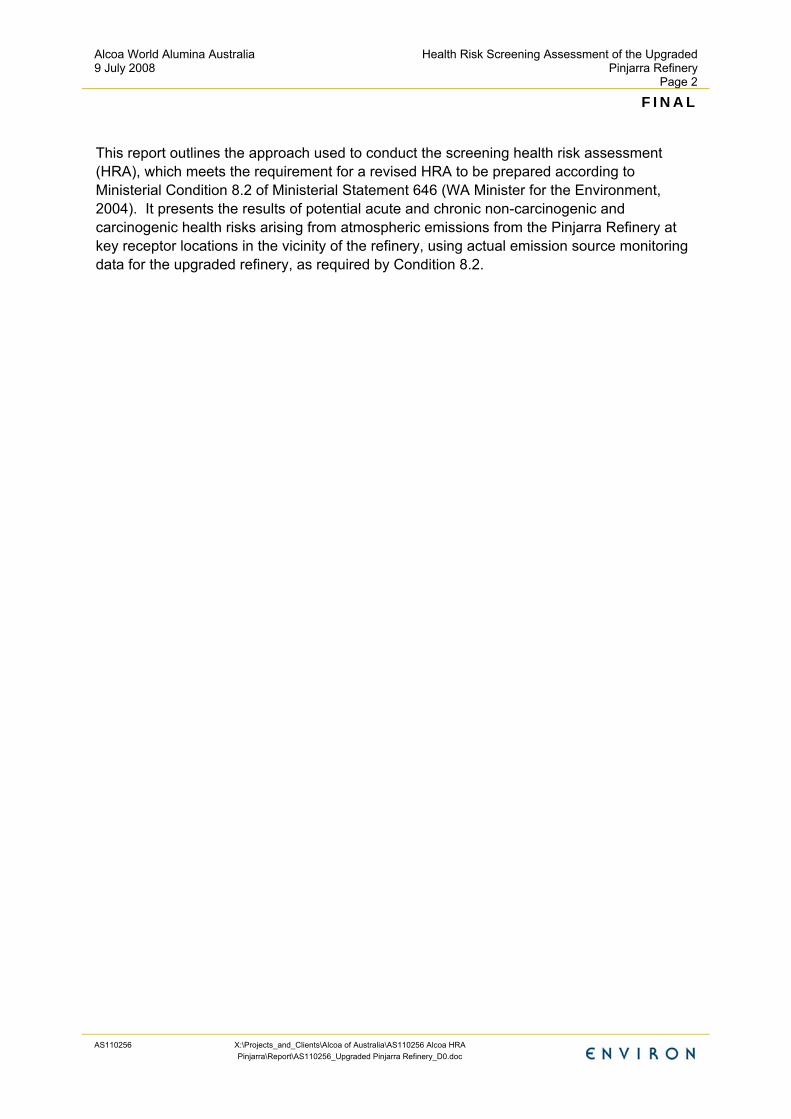
This report outlines the approach used to conduct the screening health risk assessment (HRA), which meets the requirement for a revised HRA to be prepared according to Ministerial Condition 8.2 of Ministerial Statement 646 (WA Minister for the Environment, 2004). It presents the results of potential acute and chronic non-carcinogenic and carcinogenic health risks arising from atmospheric emissions from the Pinjarra Refinery at key receptor locations in the vicinity of the refinery, using actual emission source monitoring data for the upgraded refinery, as required by Condition 8.2.
Alcoa World Alumina Australia 9 July 2008
Health Risk Screening Assessment of the Upgraded Pinjarra Refinery
Page 3
F I N A L
AS110256 X:\Projects_and_Clients\Alcoa of Australia\AS110256 Alcoa HRA Pinjarra\Report\AS110256_Upgraded Pinjarra Refinery_D0.doc
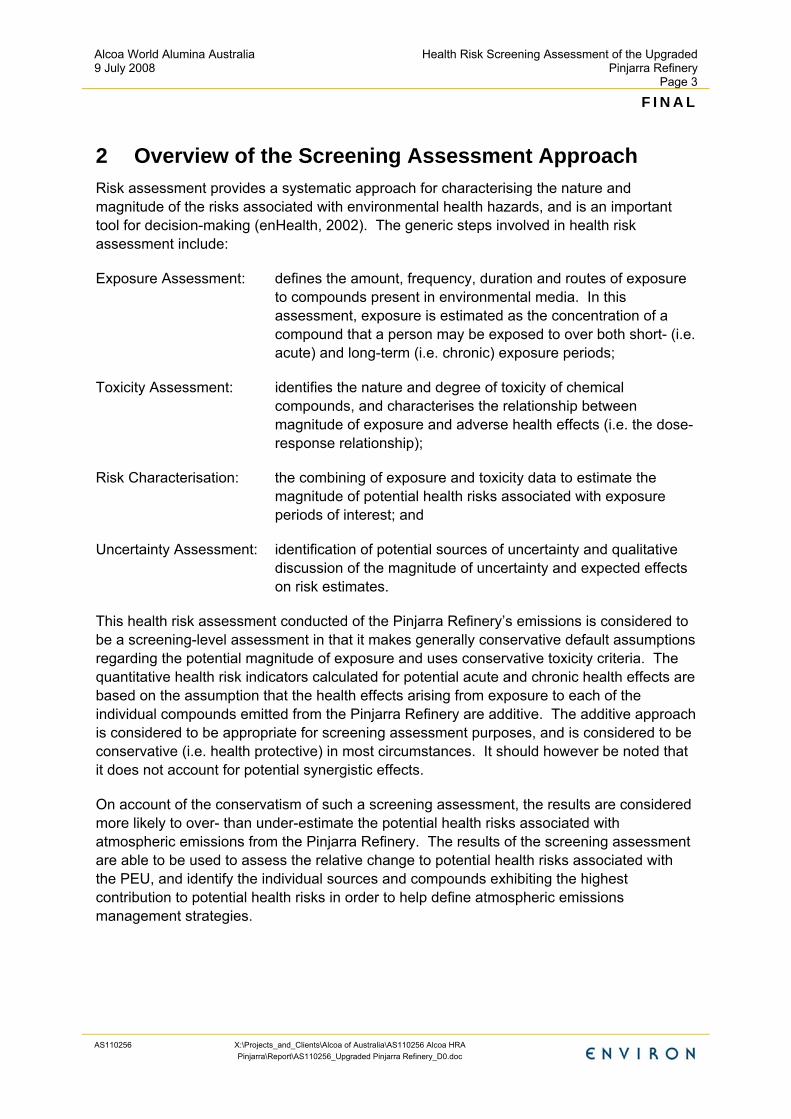
2 Overview of the Screening Assessment Approach Risk assessment provides a systematic approach for characterising the nature and magnitude of the risks associated with environmental health hazards, and is an important tool for decision-making (enHealth, 2002). The generic steps involved in health risk assessment include:
Exposure Assessment: defines the amount, frequency, duration and routes of exposure to compounds present in environmental media. In this assessment, exposure is estimated as the concentration of a compound that a person may be exposed to over both short- (i.e. acute) and long-term (i.e. chronic) exposure periods;
Toxicity Assessment: identifies the nature and degree of toxicity of chemical compounds, and characterises the relationship between magnitude of exposure and adverse health effects (i.e. the dose-response relationship);
Risk Characterisation: the combining of exposure and toxicity data to estimate the magnitude of potential health risks associated with exposure periods of interest; and
Uncertainty Assessment: identification of potential sources of uncertainty and qualitative discussion of the magnitude of uncertainty and expected effects on risk estimates.
This health risk assessment conducted of the Pinjarra Refinery’s emissions is considered to be a screening-level assessment in that it makes generally conservative default assumptions regarding the potential magnitude of exposure and uses conservative toxicity criteria. The quantitative health risk indicators calculated for potential acute and chronic health effects are based on the assumption that the health effects arising from exposure to each of the individual compounds emitted from the Pinjarra Refinery are additive. The additive approach is considered to be appropriate for screening assessment purposes, and is considered to be conservative (i.e. health protective) in most circumstances. It should however be noted that it does not account for potential synergistic effects.
On account of the conservatism of such a screening assessment, the results are considered more likely to over- than under-estimate the potential health risks associated with atmospheric emissions from the Pinjarra Refinery. The results of the screening assessment are able to be used to assess the relative change to potential health risks associated with the PEU, and identify the individual sources and compounds exhibiting the highest contribution to potential health risks in order to help define atmospheric emissions management strategies.
Alcoa World Alumina Australia 9 July 2008
Health Risk Screening Assessment of the Upgraded Pinjarra Refinery
Page 4
F I N A L
AS110256 X:\Projects_and_Clients\Alcoa of Australia\AS110256 Alcoa HRA Pinjarra\Report\AS110256_Upgraded Pinjarra Refinery_D0.doc
3 Exposure Assessment
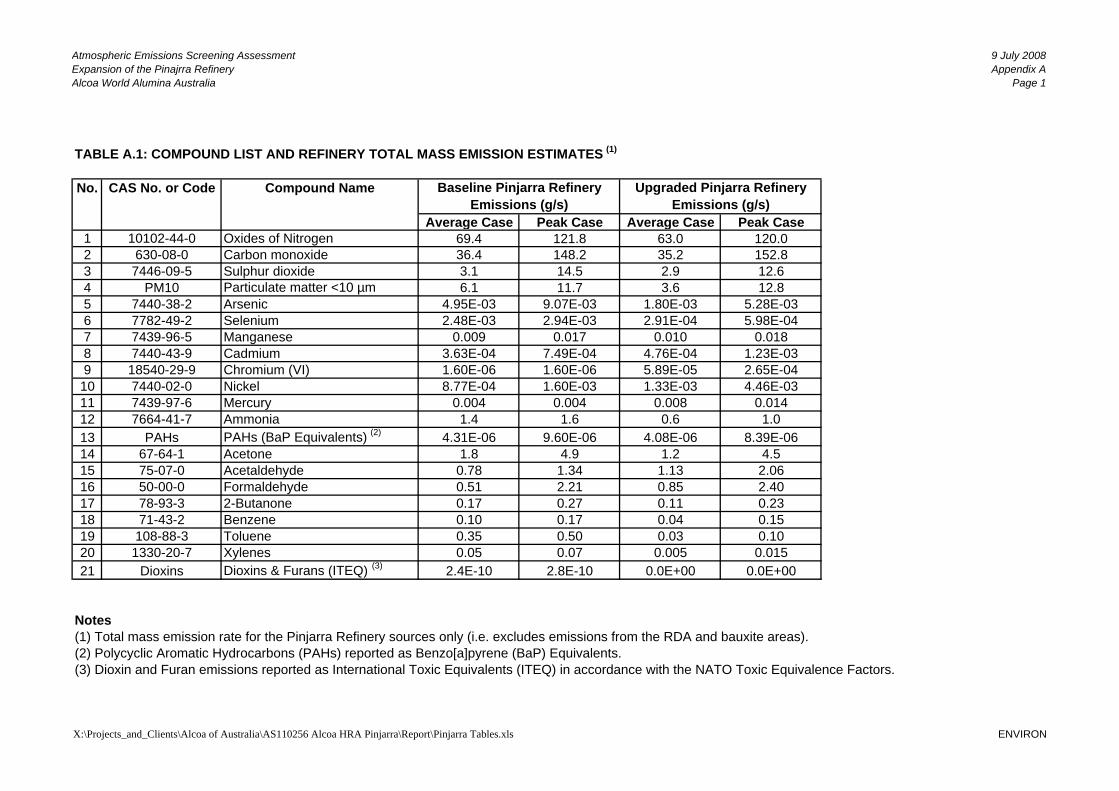
3.1 Compounds considered Alcoa has undertaken a review of emission monitoring data available for the Pinjarra Refinery to characterise atmospheric emissions representative of the Baseline and Upgraded Refinery emissions scenarios. Emissions have been quantified for 21 individual compounds or groups of compounds, which may be grouped into the following classes:
• particulates;
• products of combustion;
• metals;
• ammonia;
• organic compounds (e.g. aldehydes, ketones and aromatics [including Polycyclic Aromatic Hydrocarbons (PAHs)]); and
• dioxins and furans.
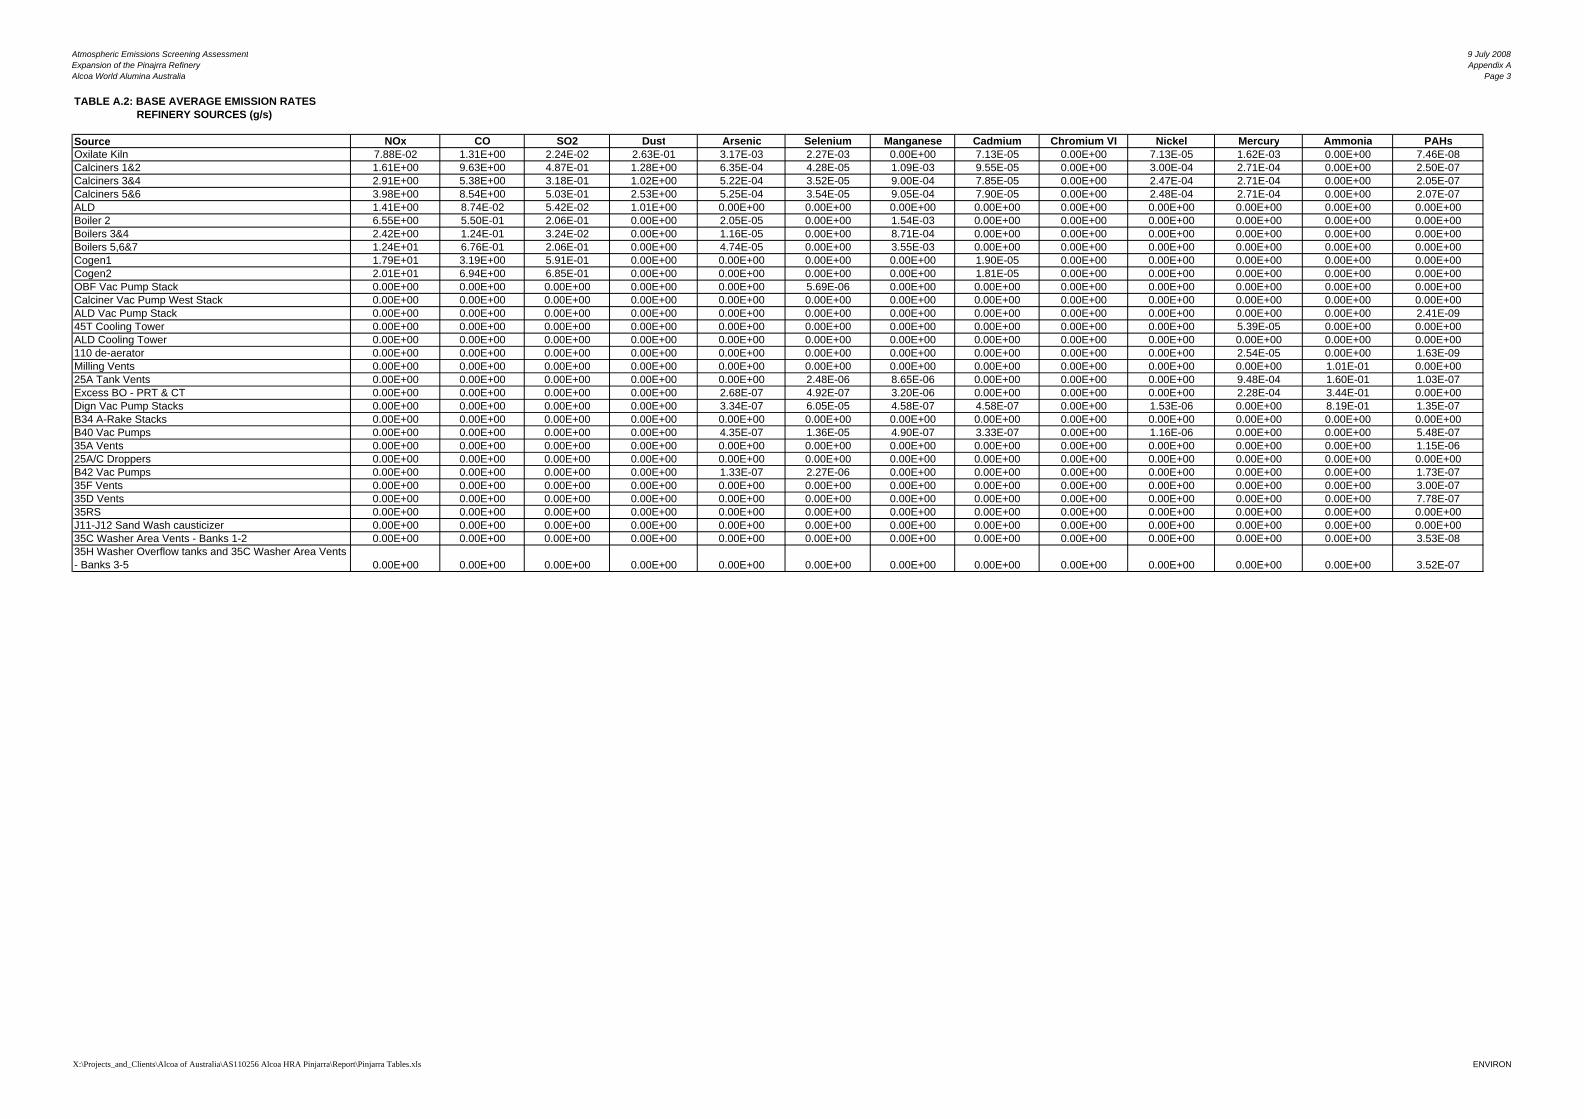
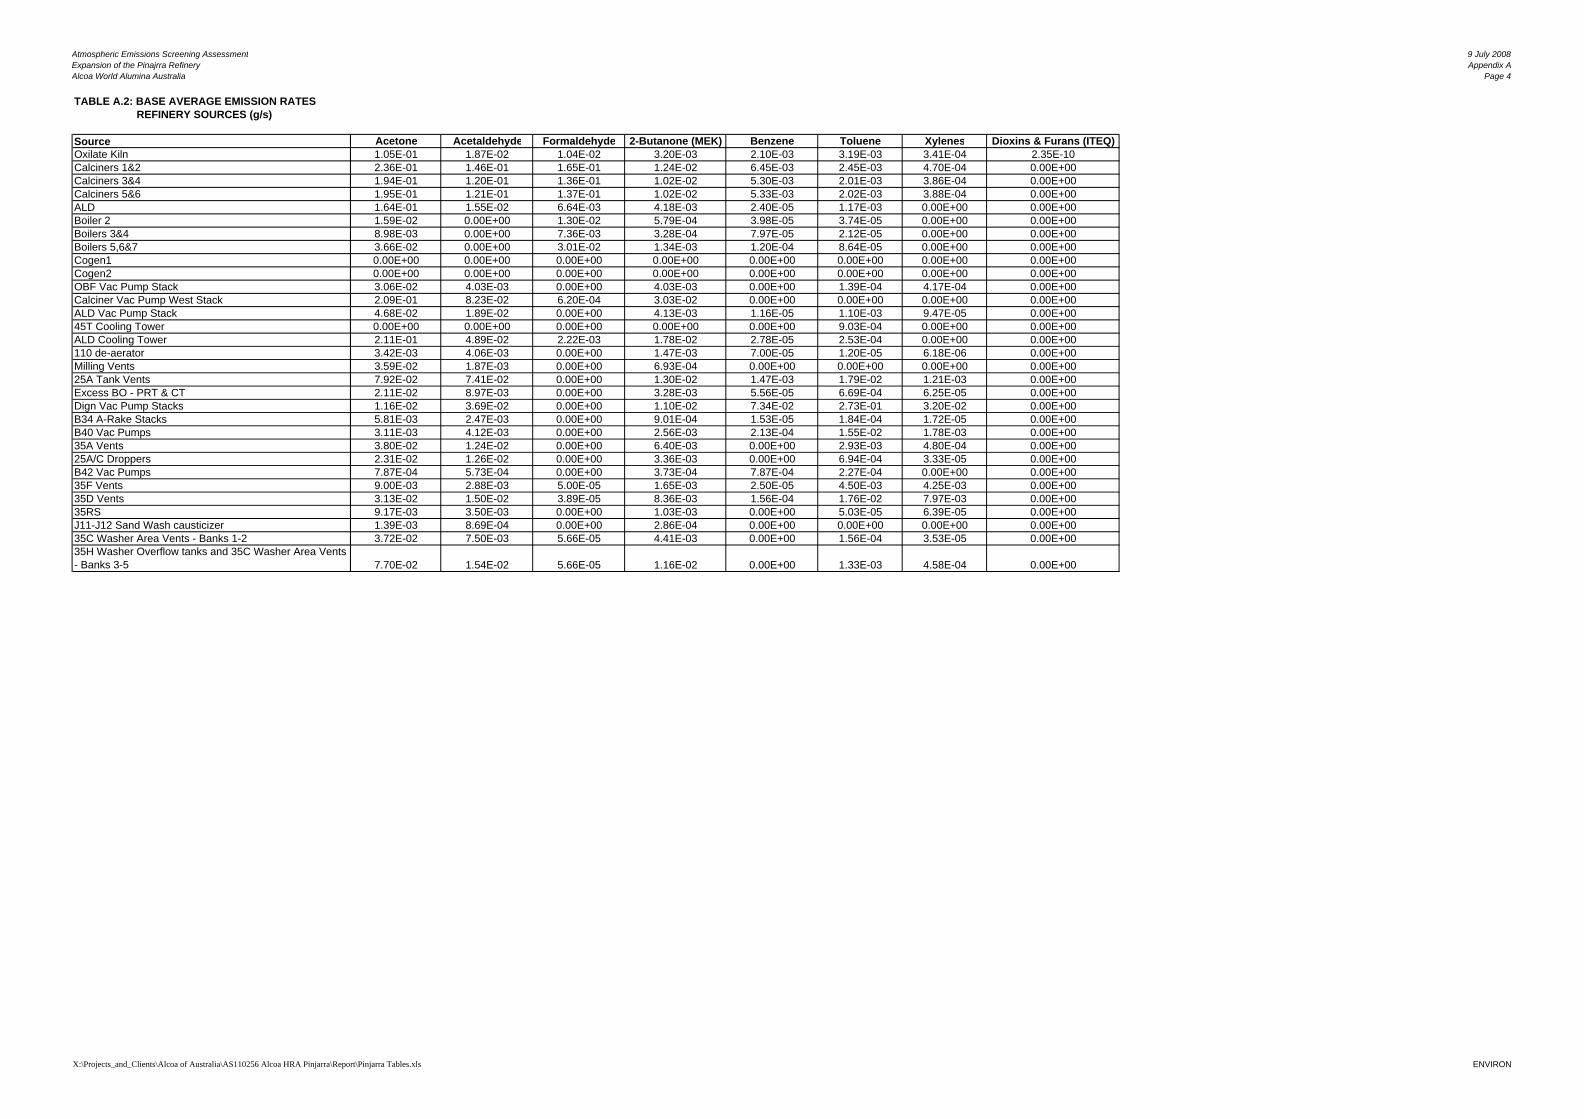
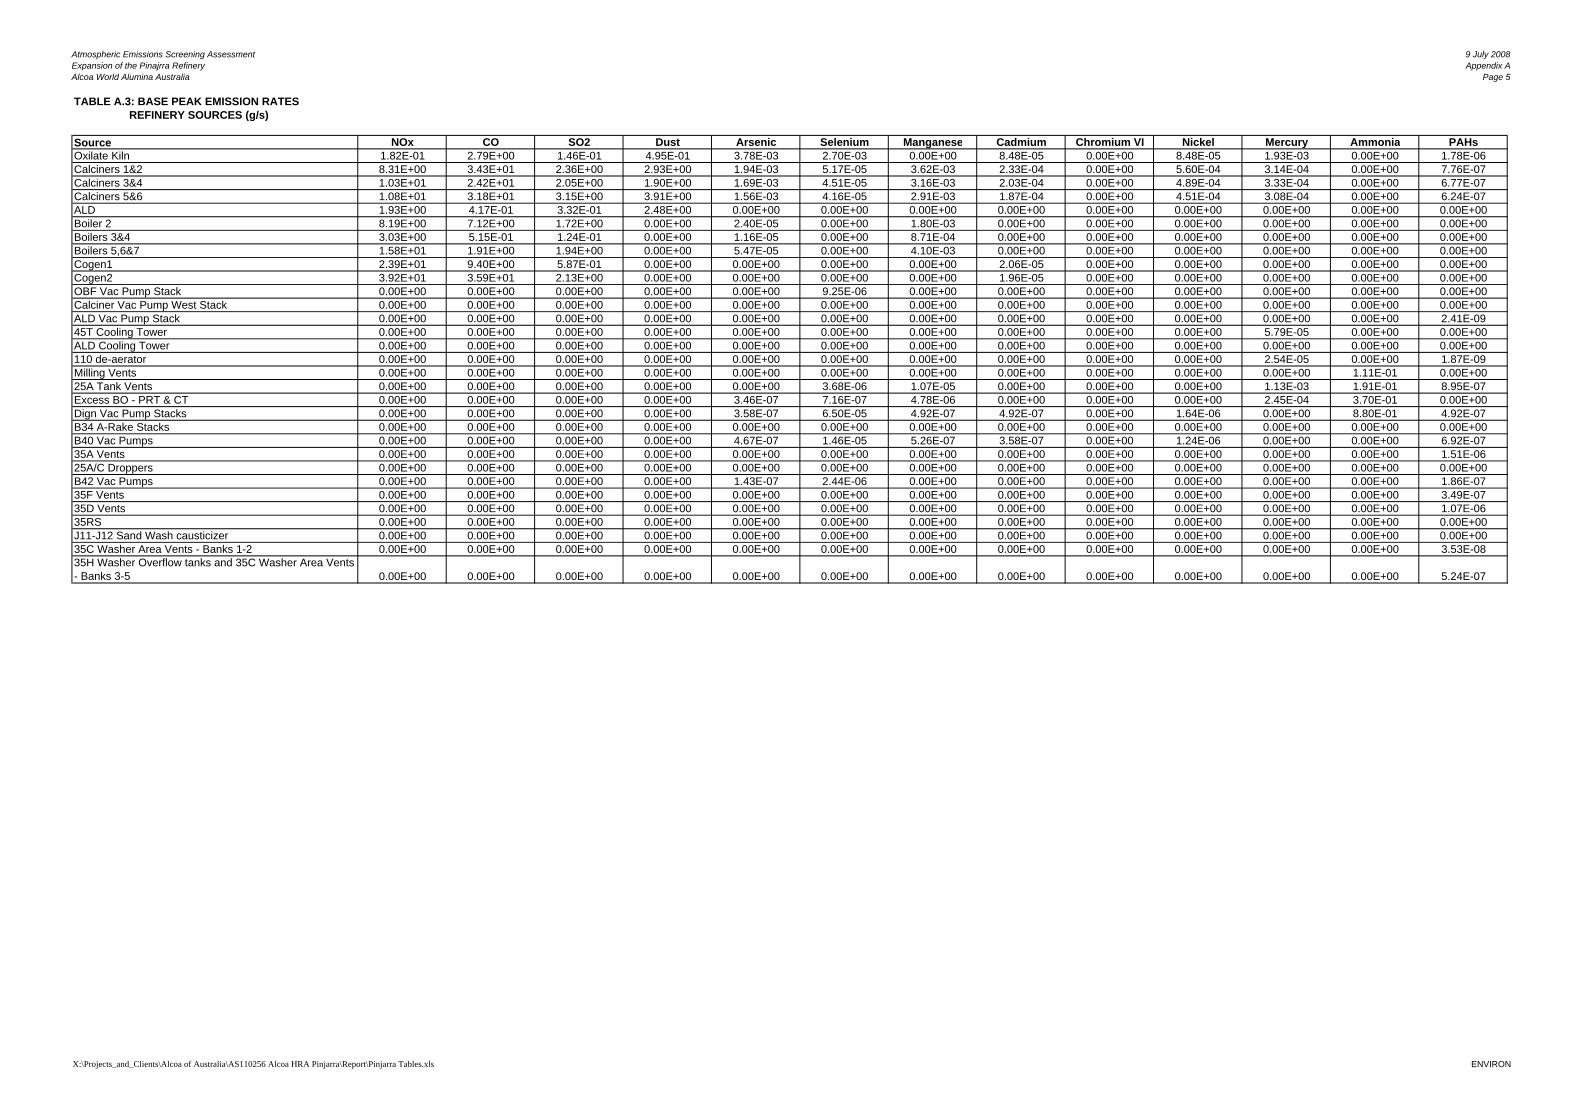
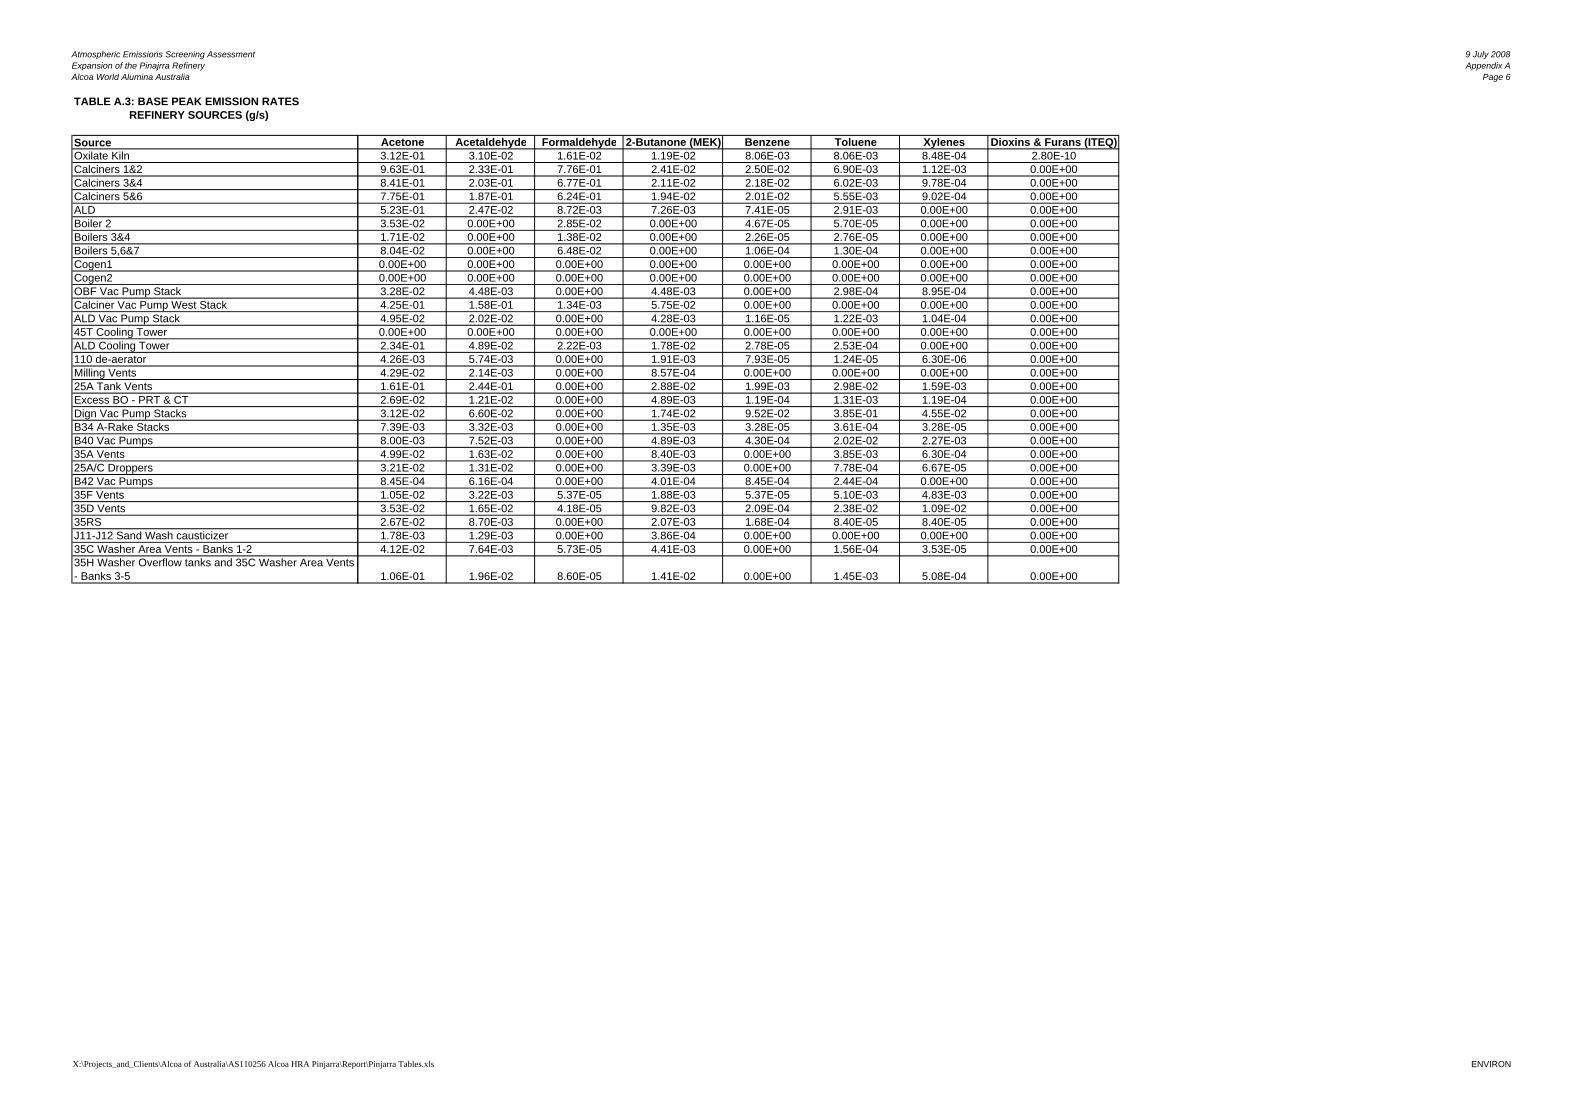
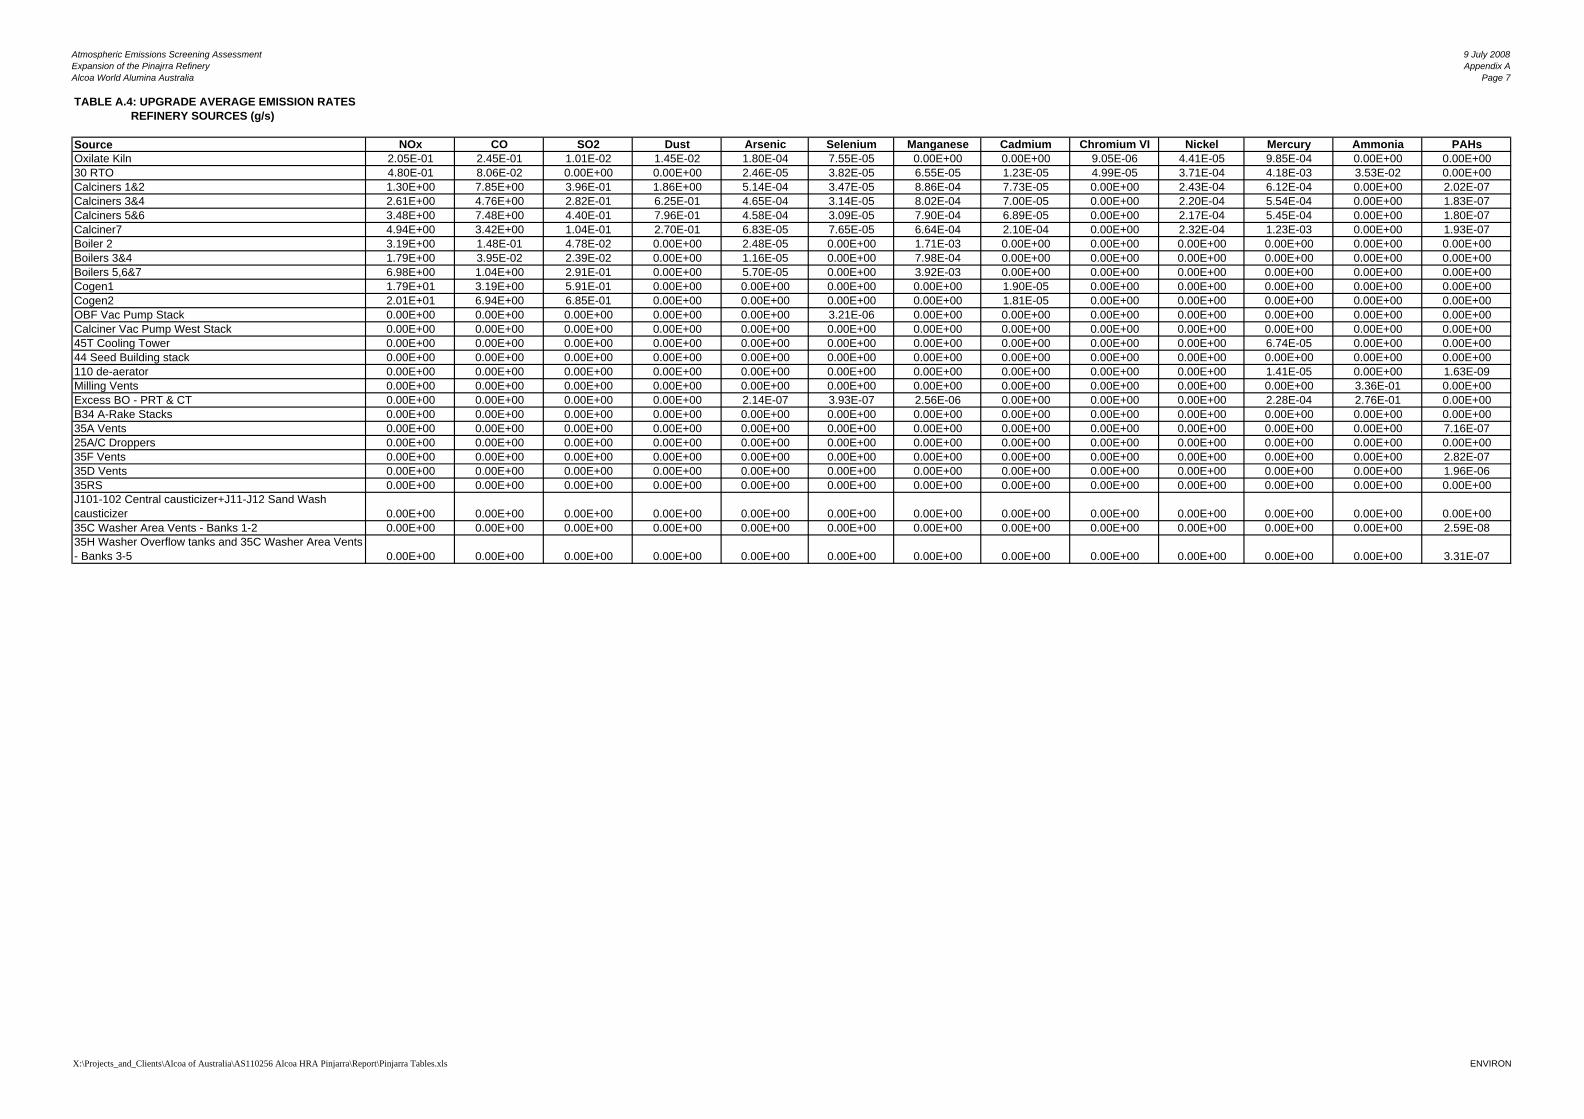
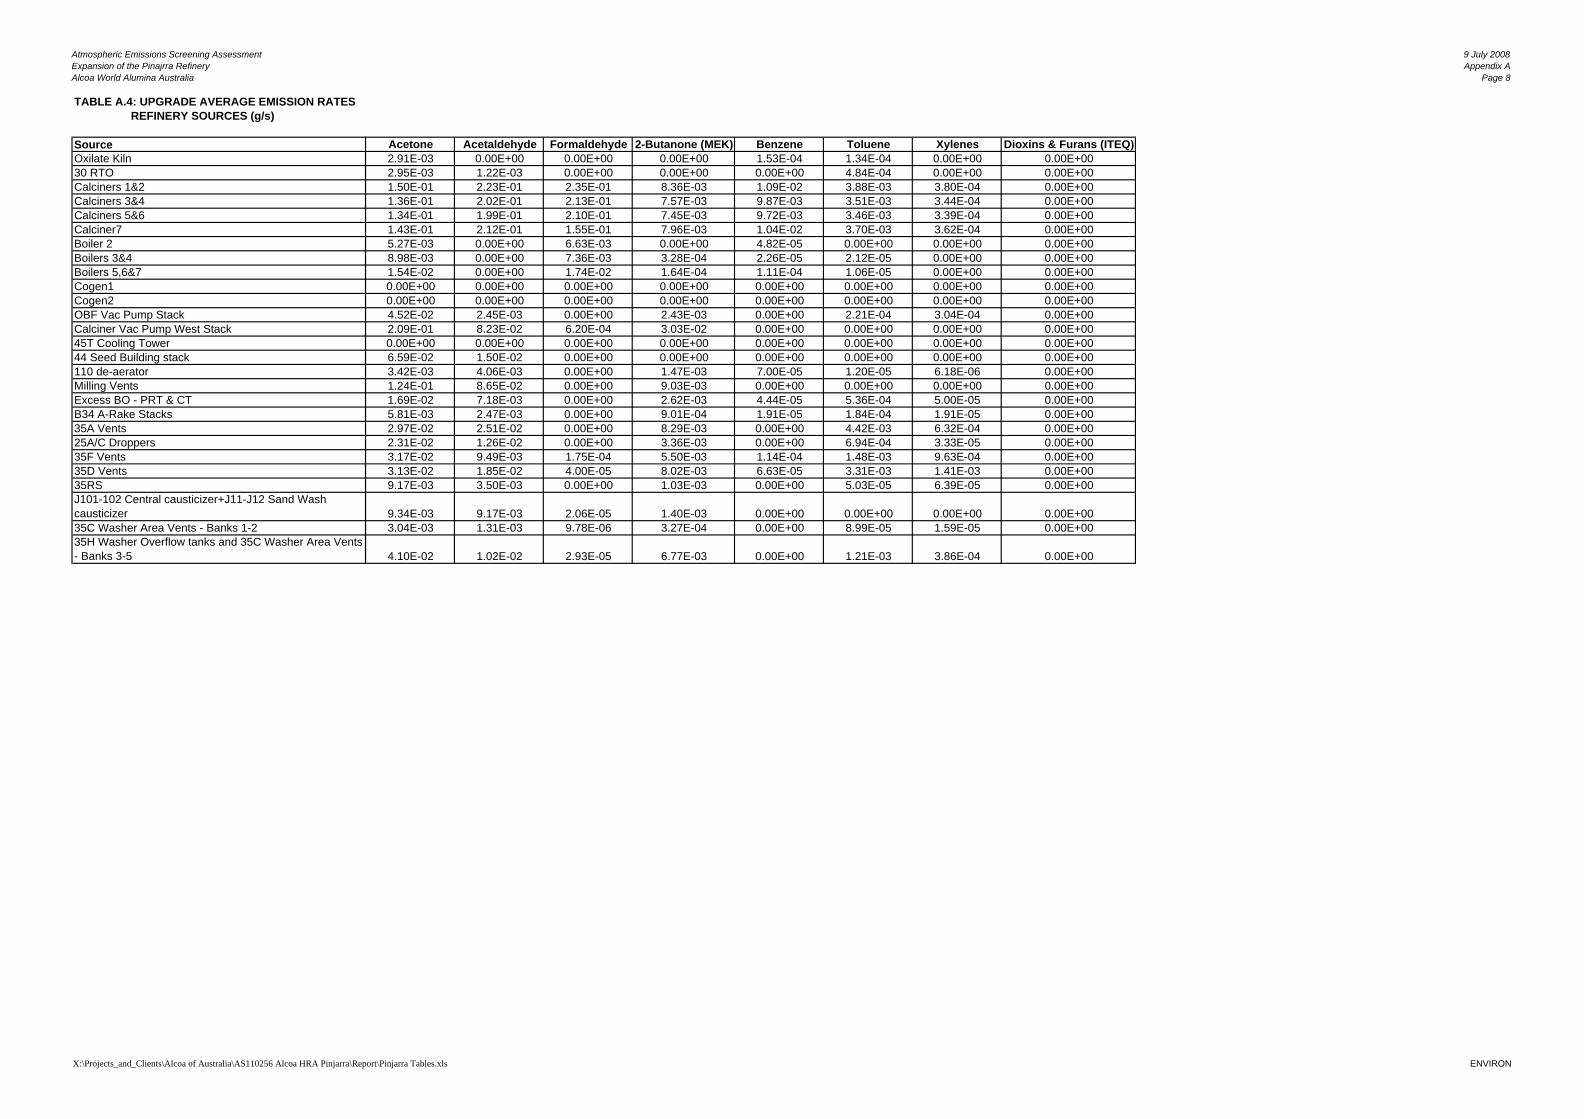
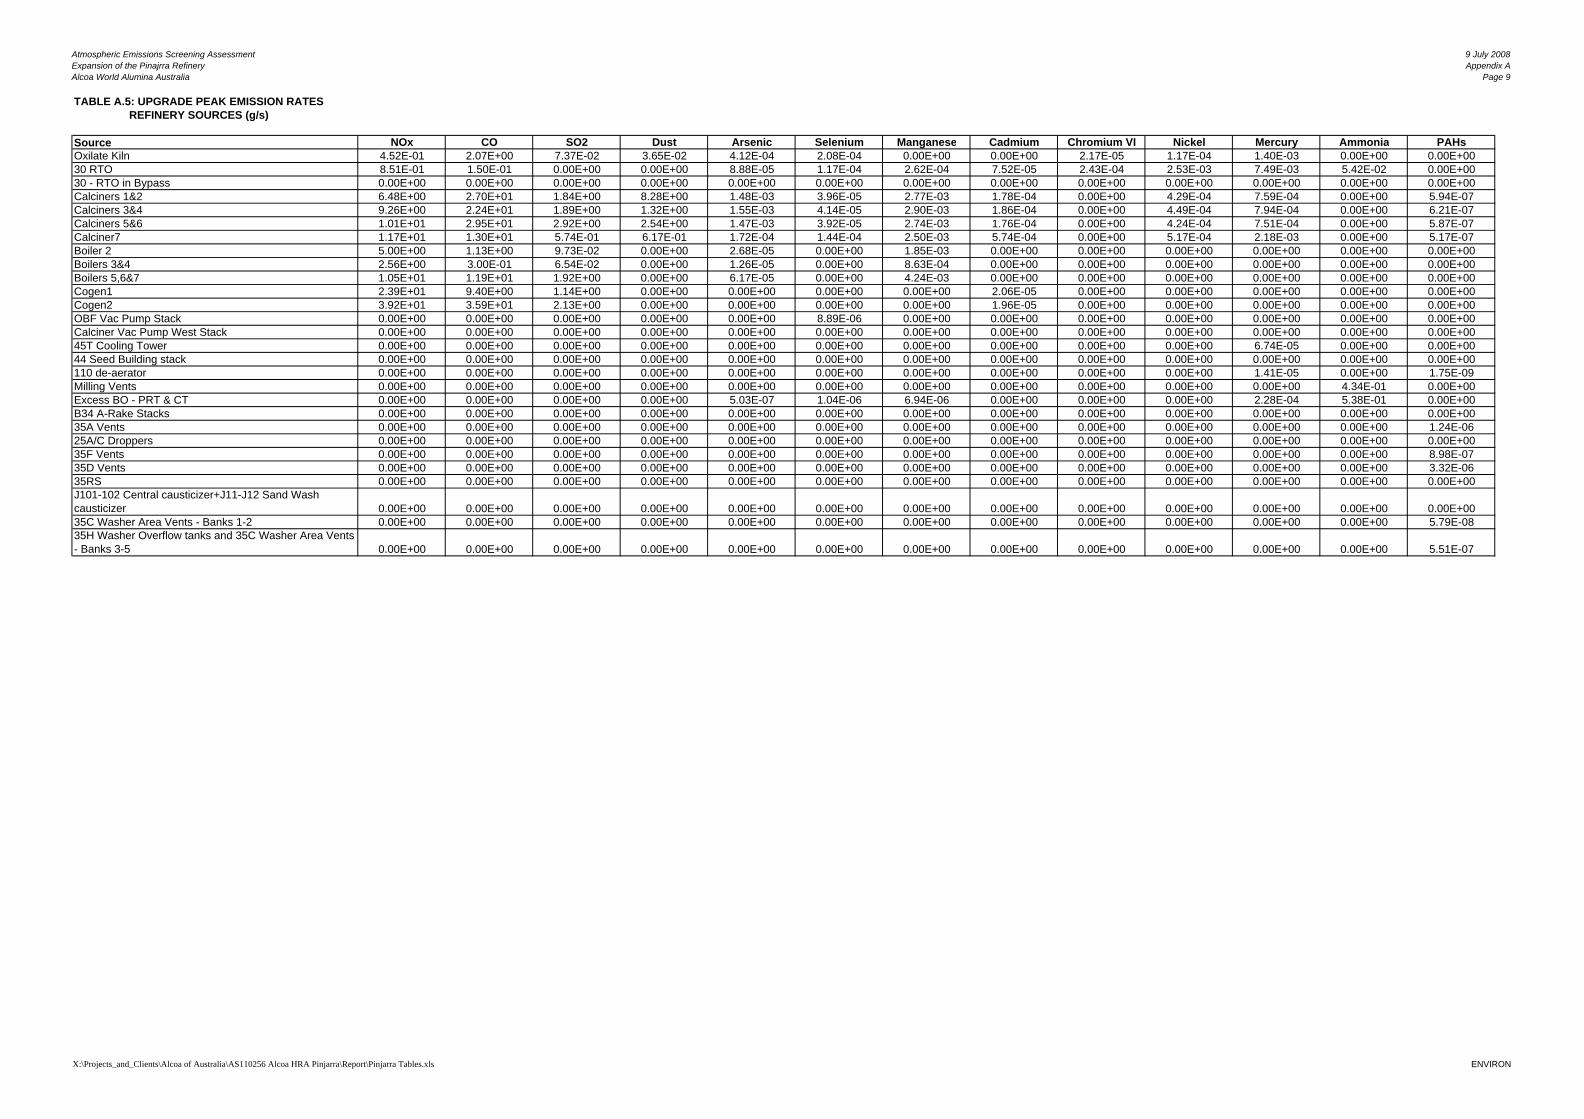
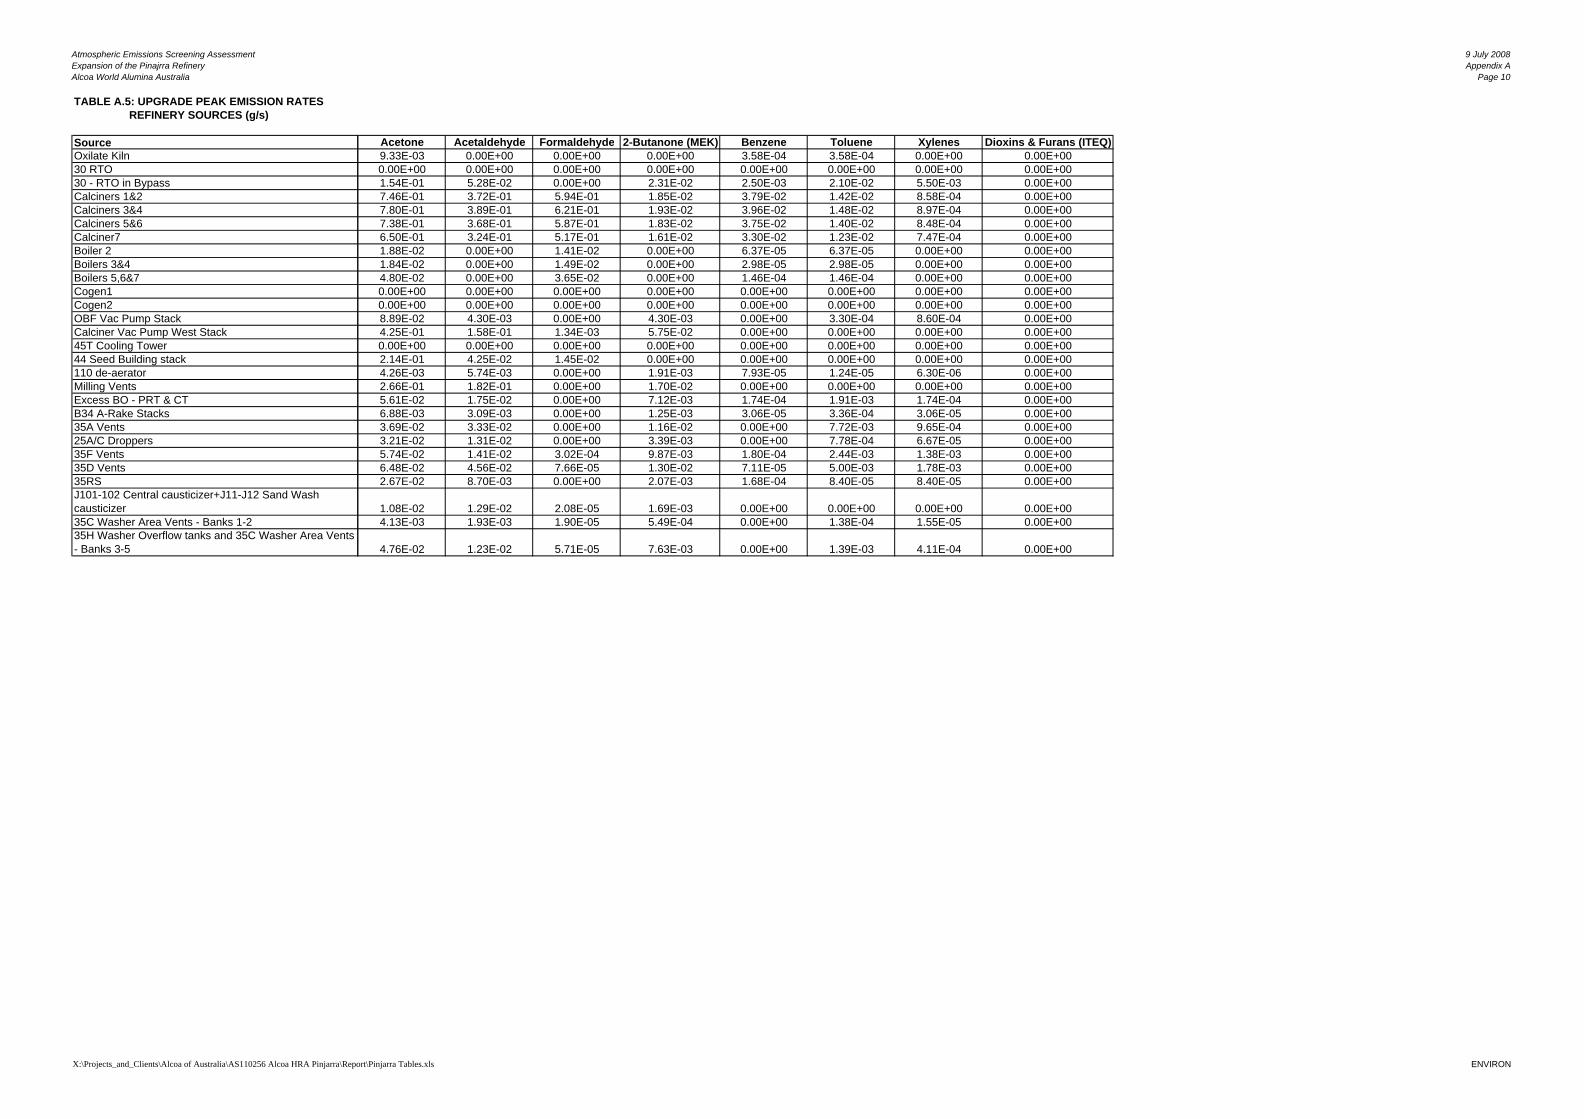
Table A.1 of Appendix A lists the individual compounds or groups of compounds for which emissions have been quantified, and the corresponding total mass emission rate for the Baseline and Upgraded Refinery emission scenarios. Tables A.2 to A.5 provide the mass emission rates of each compound from each source modelled. For the Baseline and Upgraded Refinery emission scenarios, “peak” and “average” emissions have been calculated by Alcoa and applied to the assessment of acute and chronic exposure respectively. Typically peak emissions have been defined using the maximum measured emission concentration, and the average emissions have been defined using the average of the measured emission concentrations. ENVIRON (2008) documents the methods used by Alcoa to estimate atmospheric emissions from the Pinjarra Refinery for:
• total VOCs, oxides of nitrogen, particulate matter and carbon monoxide for all refinery point sources; and
• metals from the oxalate kiln.
All of the compounds for which emissions have been quantified have been included in the screening health risk assessment. This list of compounds corresponds to that included in the air dispersion modelling component of the previous health risk assessment conducted for the Pinjarra Refinery (Toxikos, 2003) (excluding PM2.5) on the basis that the emissions of these compounds represented over 90% of the total mass of emissions previously estimated for the Pinjarra Refinery (ENVIRON, 2003).
It should be noted that the previous health risk assessment (Toxikos, 2003) also considered the health risk associated with PM2.5 and a number of additional Volatile Organic Compounds (VOCs). That assessment found that exposure to PM2.5 was a minor contributor to the overall health risk from refinery point sources. In addition, the Pinjarra RDA
Alcoa World Alumina Australia 9 July 2008
Health Risk Screening Assessment of the Upgraded Pinjarra Refinery
Page 5
F I N A L
AS110256 X:\Projects_and_Clients\Alcoa of Australia\AS110256 Alcoa HRA Pinjarra\Report\AS110256_Upgraded Pinjarra Refinery_D0.doc
particulate study (Ecowise, 2007) found that the ambient monitoring results showed that the ratio of PM2.5 to PM10 was less than 0.1. Therefore, compliance with the PM10 24-hour standard will mean that the PM2.5 guideline will be complied with. Therefore, PM2.5 has not been considered in this screening assessment.
The previous health risk assessment conducted for the Pinjarra Refinery (Toxikos, 2003), estimated the exposure concentrations for a number of additional VOC compounds2 based on the application of minimum dilution factors, providing a conservative (i.e. health protective over-estimate) of the exposure concentration for these VOC compounds. The health risk associated with the exposure to these additional VOC compounds has not been considered in this assessment as emissions data were not available and the results of the previous health risk assessment (Toxikos, 2003) found that the cumulative health risk associated with these additional VOC compounds is likely to be well below levels representing cause for concern.
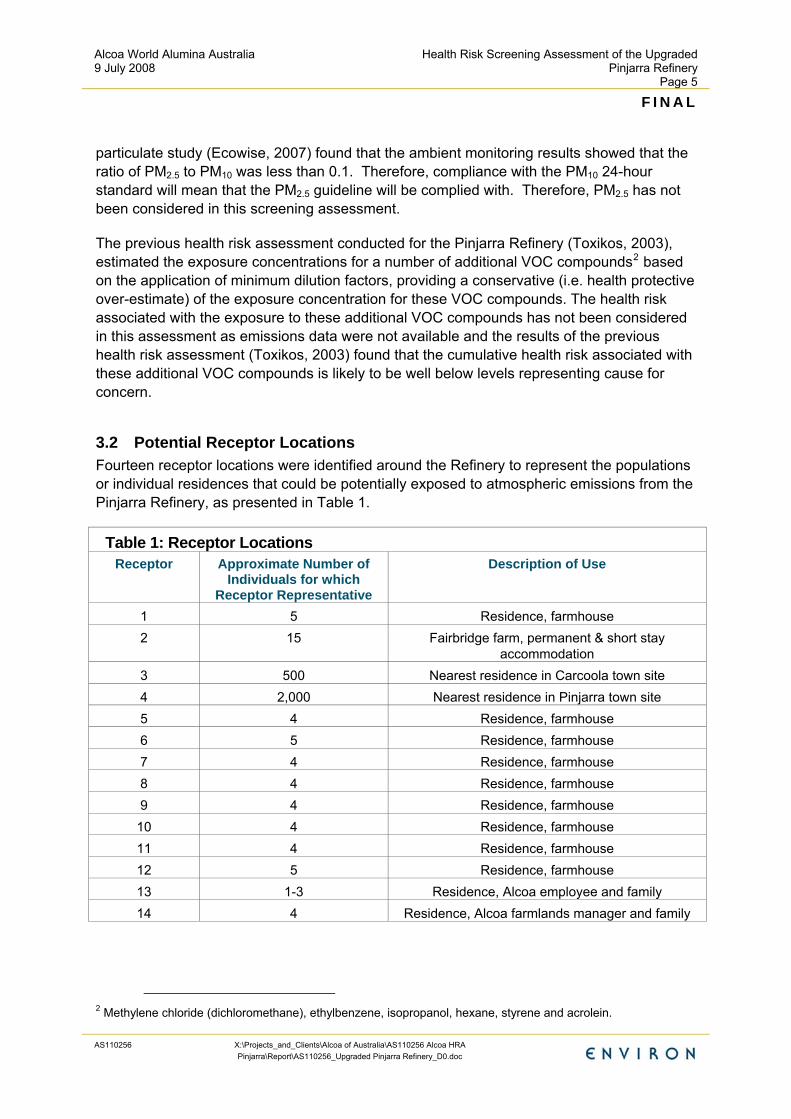
3.2 Potential Receptor Locations Fourteen receptor locations were identified around the Refinery to represent the populations or individual residences that could be potentially exposed to atmospheric emissions from the Pinjarra Refinery, as presented in Table 1.
Table 1: Receptor Locations Receptor Approximate Number of
accommodation 3 500 Nearest residence in Carcoola town site 4 2,000 Nearest residence in Pinjarra town site 5 4 Residence, farmhouse 6 5 Residence, farmhouse 7 4 Residence, farmhouse 8 4 Residence, farmhouse 9 4 Residence, farmhouse 10 4 Residence, farmhouse 11 4 Residence, farmhouse 12 5 Residence, farmhouse 13 1-3 Residence, Alcoa employee and family 14 4 Residence, Alcoa farmlands manager and family
2 Methylene chloride (dichloromethane), ethylbenzene, isopropanol, hexane, styrene and acrolein.
Alcoa World Alumina Australia 9 July 2008
Health Risk Screening Assessment of the Upgraded Pinjarra Refinery
Page 6
F I N A L
AS110256 X:\Projects_and_Clients\Alcoa of Australia\AS110256 Alcoa HRA Pinjarra\Report\AS110256_Upgraded Pinjarra Refinery_D0.doc
The locations of the receptors in relation to the Pinjarra Refinery site are presented in Figure 1, overlain on an aerial photograph of the region.
For purposes of this screening assessment, all receptors are assumed to be residents, including potentially sensitive subpopulations such as children and the elderly. This assumption is inherent in the health protective guidelines selected (refer to Section 4).
3.3 Potentially Complete Exposure Pathways Based on previous studies (ENVIRON, 2005 and 2007) inhalation is expected to represent the most significant exposure route in relation to emissions from the Pinjarra Refinery and therefore the exposure assessment has been confined to the inhalation pathway.
Further assessment of the potential exposure via alternative exposure routes has not been included in the scope of this assessment as no changes have occurred since the previous assessments that would invalidate the conclusions of the previous studies.
3.4 Estimated Concentrations in Air Concentrations in the ambient air have been estimated based on the results of air dispersion modelling conducted by Air Assessments (2008), and emission estimates for the Pinjarra Refinery provided by Alcoa. The emission estimates were based on emissions testing results obtained by independent NATA accredited sampling contractors and analytical laboratories using appropriate techniques including quality control and assurance.
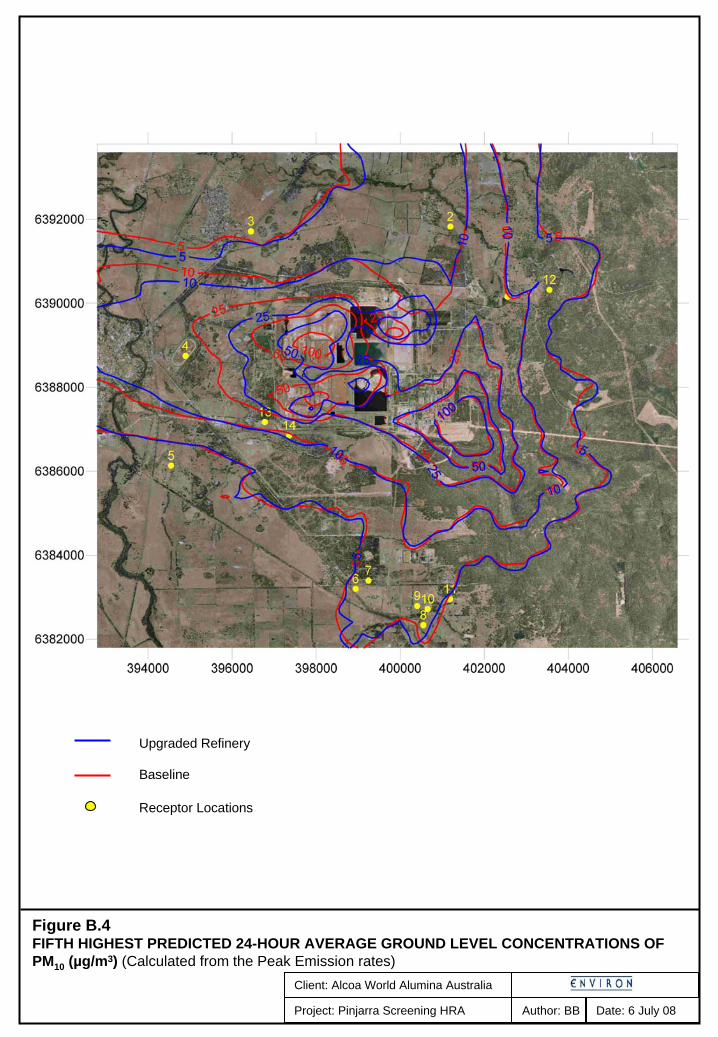
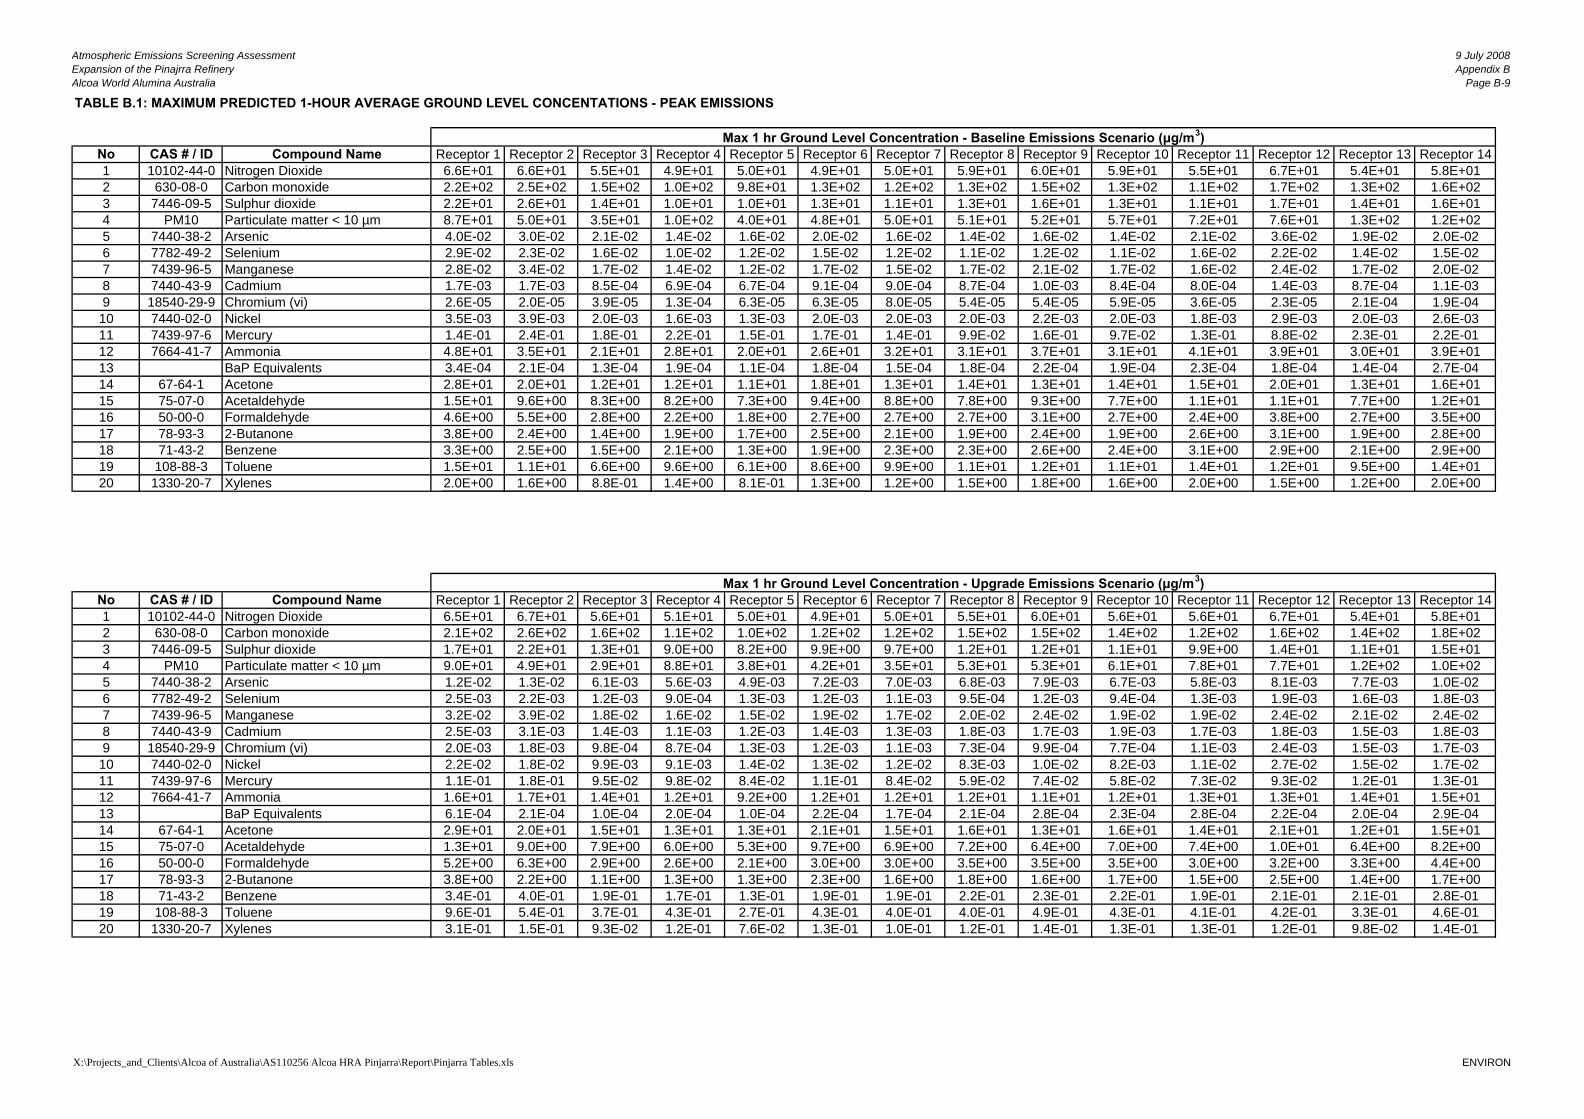
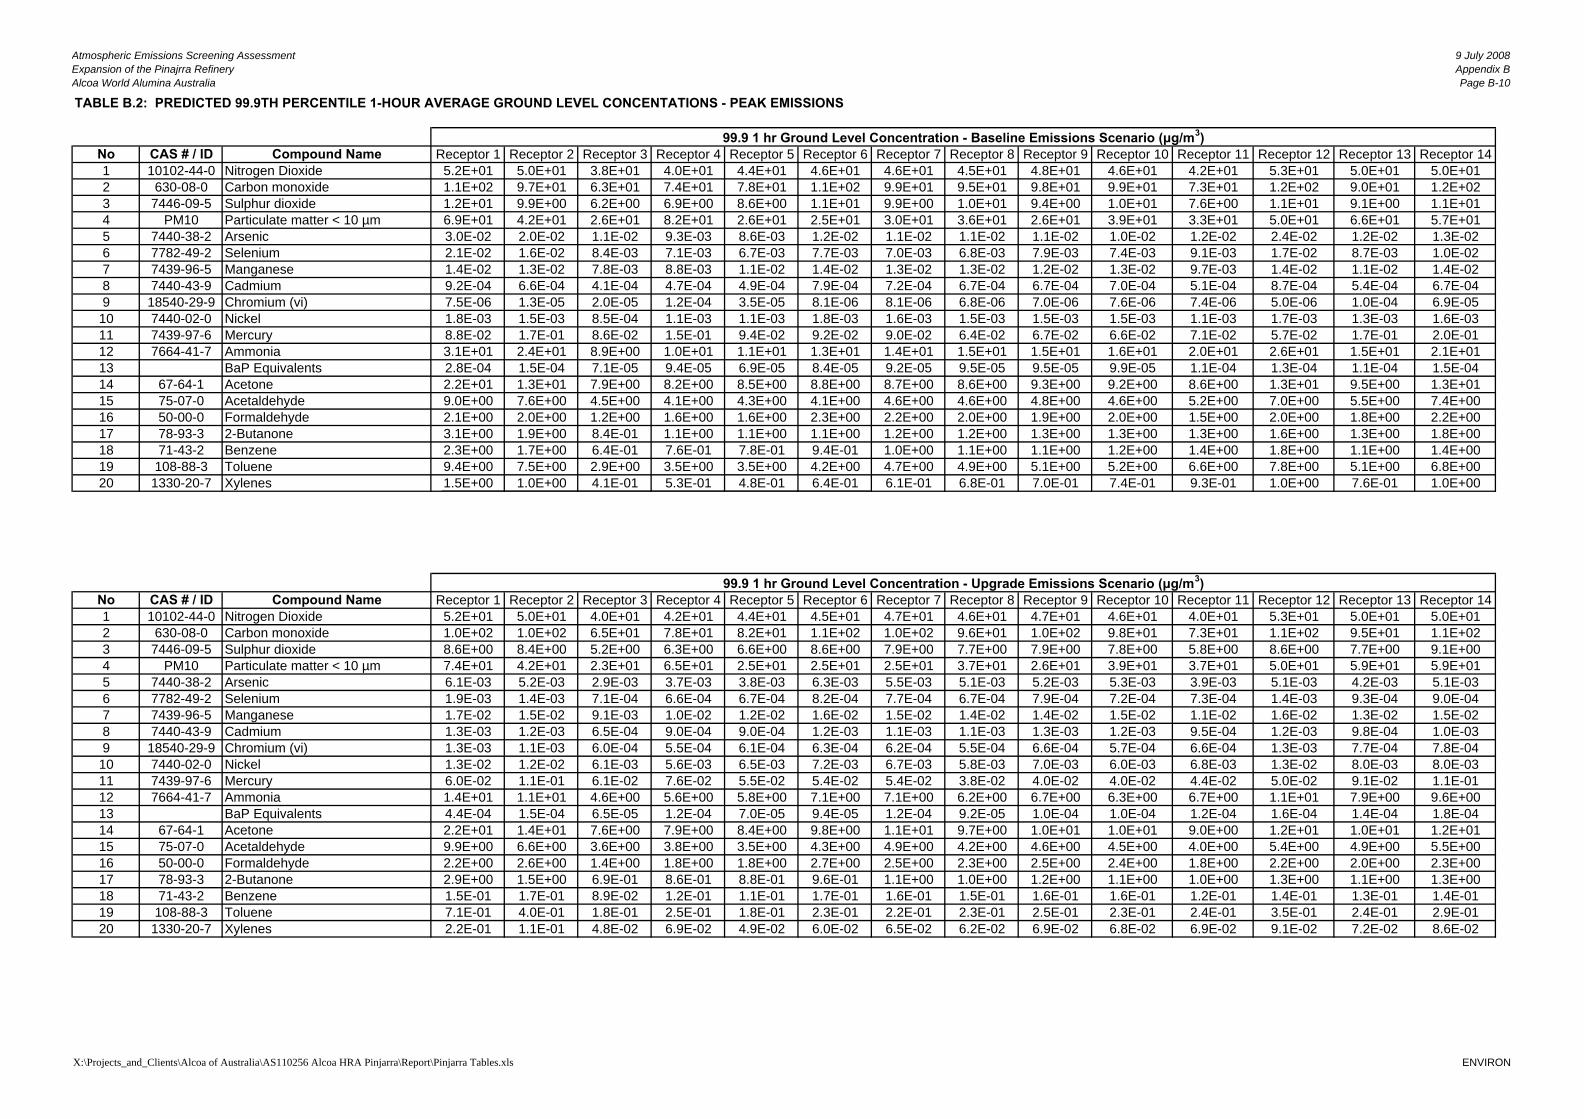
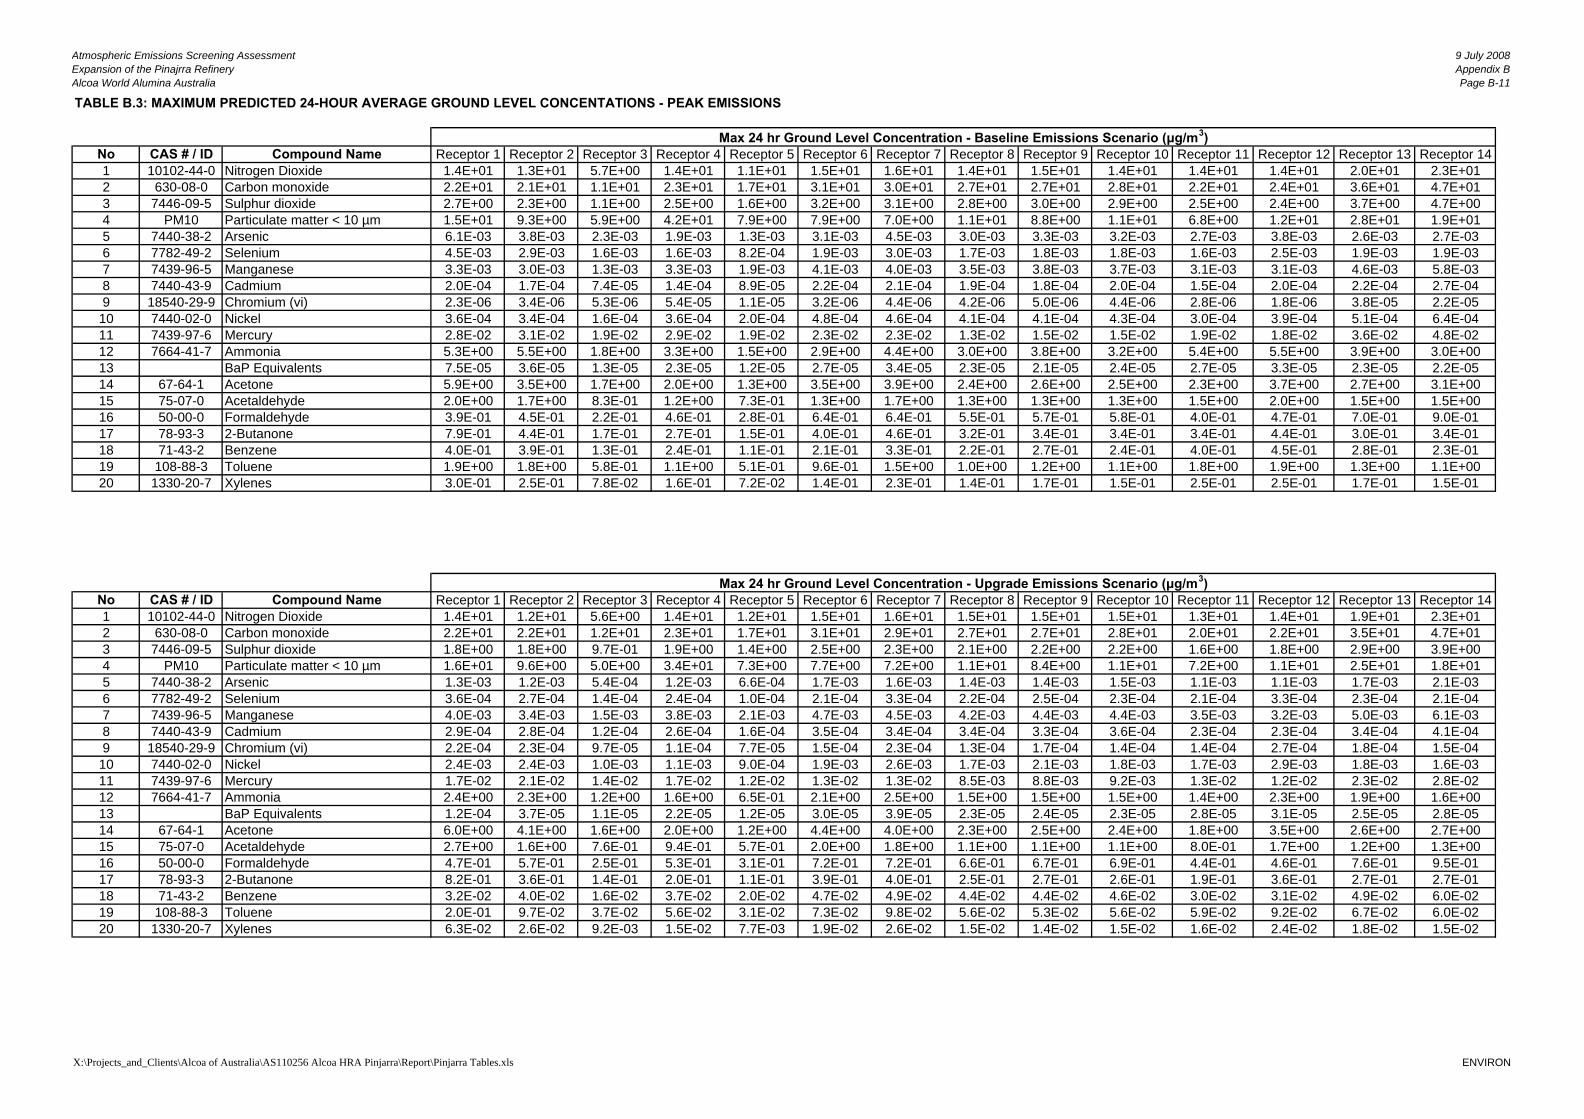
Concentrations in ambient air representative of acute exposure have been derived using the maximum 1-hour or 24-hour average ground level concentrations, and the 99.9 percentile 1-hour or 99.5 percentile 24-hour average ground level concentrations predicted by the air dispersion modelling based on the peak emission estimates for the Pinjarra Refinery. Concentrations in ambient air representative of chronic exposure have been derived using the annual average ground level concentrations predicted by the air dispersion modelling using the average emission estimates for the Pinjarra Refinery.
Appendix B presents details of the approach used to derive the concentrations in the ambient air.
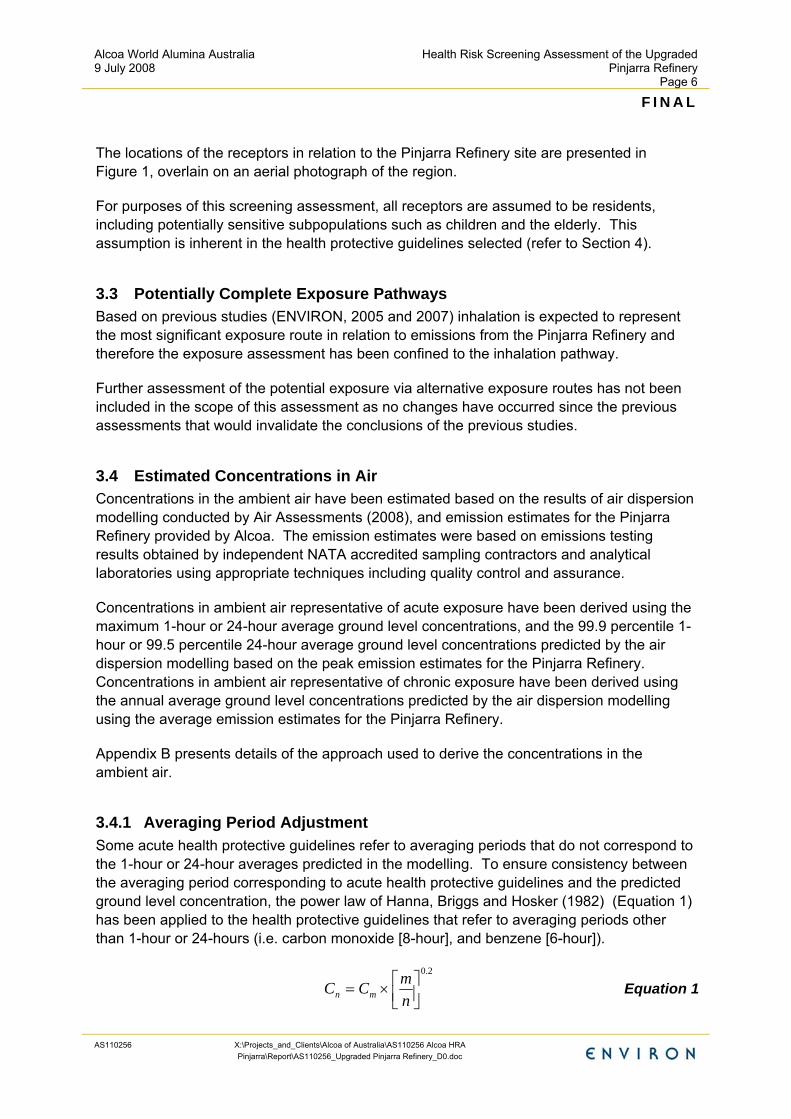
3.4.1 Averaging Period Adjustment Some acute health protective guidelines refer to averaging periods that do not correspond to the 1-hour or 24-hour averages predicted in the modelling. To ensure consistency between the averaging period corresponding to acute health protective guidelines and the predicted ground level concentration, the power law of Hanna, Briggs and Hosker (1982) (Equation 1) has been applied to the health protective guidelines that refer to averaging periods other than 1-hour or 24-hours (i.e. carbon monoxide [8-hour], and benzene [6-hour]).
2.0
⎥⎦⎤
⎢⎣⎡×=
nmCC mn Equation 1
Alcoa World Alumina Australia 9 July 2008
Health Risk Screening Assessment of the Upgraded Pinjarra Refinery
Page 7
F I N A L
AS110256 X:\Projects_and_Clients\Alcoa of Australia\AS110256 Alcoa HRA Pinjarra\Report\AS110256_Upgraded Pinjarra Refinery_D0.doc
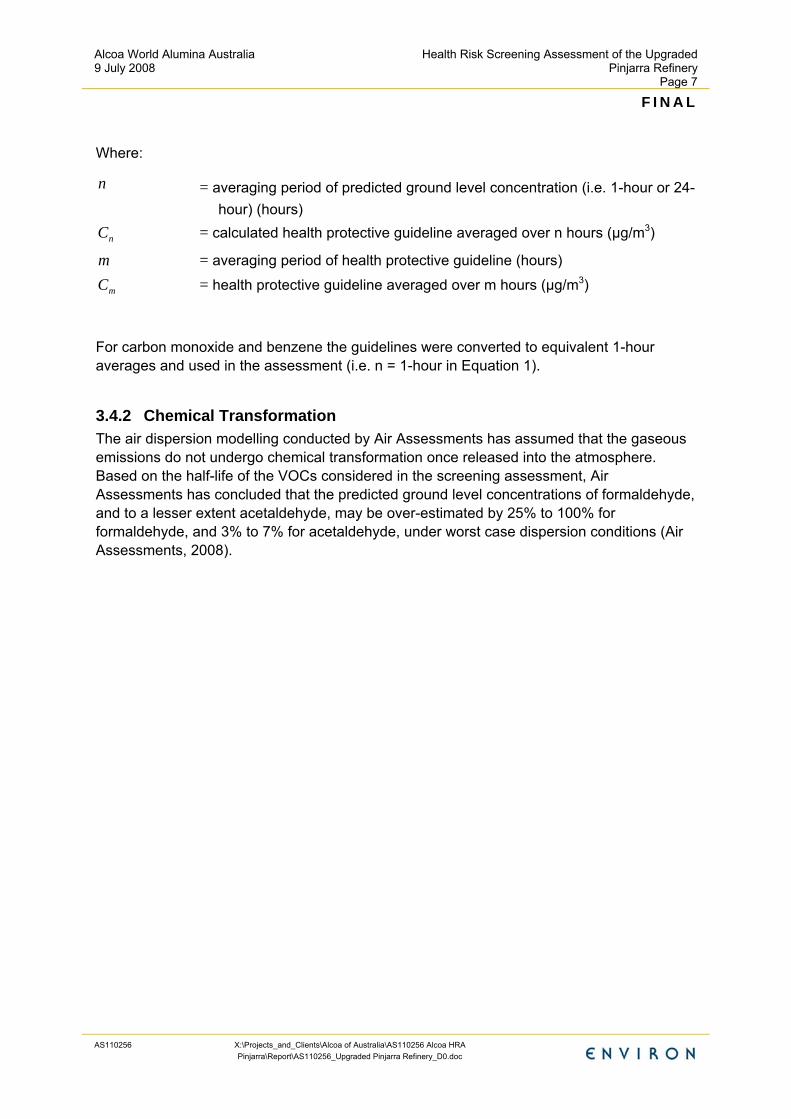
Where:
n = averaging period of predicted ground level concentration (i.e. 1-hour or 24-hour) (hours)
nC = calculated health protective guideline averaged over n hours (µg/m3)
m = averaging period of health protective guideline (hours)
mC = health protective guideline averaged over m hours (µg/m3)
For carbon monoxide and benzene the guidelines were converted to equivalent 1-hour averages and used in the assessment (i.e. n = 1-hour in Equation 1).
3.4.2 Chemical Transformation The air dispersion modelling conducted by Air Assessments has assumed that the gaseous emissions do not undergo chemical transformation once released into the atmosphere. Based on the half-life of the VOCs considered in the screening assessment, Air Assessments has concluded that the predicted ground level concentrations of formaldehyde, and to a lesser extent acetaldehyde, may be over-estimated by 25% to 100% for formaldehyde, and 3% to 7% for acetaldehyde, under worst case dispersion conditions (Air Assessments, 2008).
Alcoa World Alumina Australia 9 July 2008
Health Risk Screening Assessment of the Upgraded Pinjarra Refinery
Page 8
F I N A L
AS110256 X:\Projects_and_Clients\Alcoa of Australia\AS110256 Alcoa HRA Pinjarra\Report\AS110256_Upgraded Pinjarra Refinery_D0.doc
4 Toxicity Assessment The toxicity assessment determines the relationship between the magnitude of exposure to a chemical of interest and the nature and severity of adverse health effects that may result from such exposure. Chemical toxicity is divided into two categories for purposes of risk assessment: carcinogenic and non-carcinogenic. Some chemicals exert both types of effects. Whilst all non-carcinogenic effects are assumed to occur only at exposure levels greater than some threshold at which defence mechanisms are overwhelmed, carcinogens are thought to act via both threshold and non-threshold mechanisms. By convention, exposure to even one molecule of a genotoxic carcinogen is assumed to incur some small but finite risk of causing cancer; hence, the action of such compounds is considered to lack a threshold below which adverse effects are not expected to occur. In contrast, the effects of non-genotoxic carcinogens are thought to be manifested only at exposures in excess of compound-specific thresholds. Potential health risks are calculated differently for threshold and non-threshold effects because their toxicity criteria are based on different mechanistic assumptions and expressed in different units.
A number of national and international regulatory agencies have reviewed the toxicity of environmental chemicals and developed acceptable exposure criteria (herein referred to as “health protective guidelines’) in accordance with both carcinogenic and non-carcinogenic endpoints. Health protective guidelines from the following reputable authorities were considered for use in the screening assessment:
• National Environment Protection (Ambient Air Quality) Measure (NEPC, 1998);
• National Environment Protection (Air Toxics) Measure (NEPC, 2004);
• World Health Organisation (WHO) Air Quality Guidelines for Europe Second Edition (WHO, 2000);
• U.S. Environment Protection Agency’s (USEPA) Integrated Risk Information System (IRIS);
• U.S. Agency for Toxic Substances and Disease Registry’s (ATSDR) Minimal Risk Levels (MRLs) for Hazardous Substances;
• Dutch National Institute of Public Health and the Environment (RIVM) human-toxicological Maximum Permissible Risk Levels (RIVM, 2001); and
• California Office of Environmental Health Hazard Assessment’s (OEHHA) Toxicity Criteria Database.
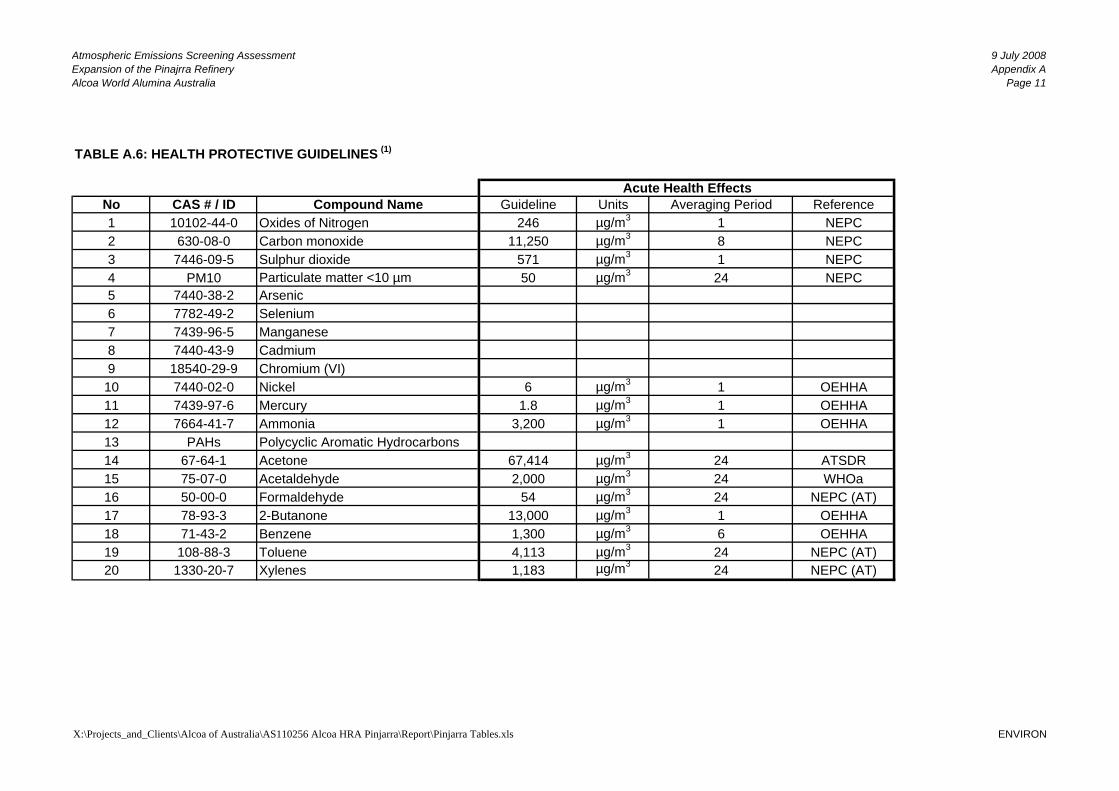
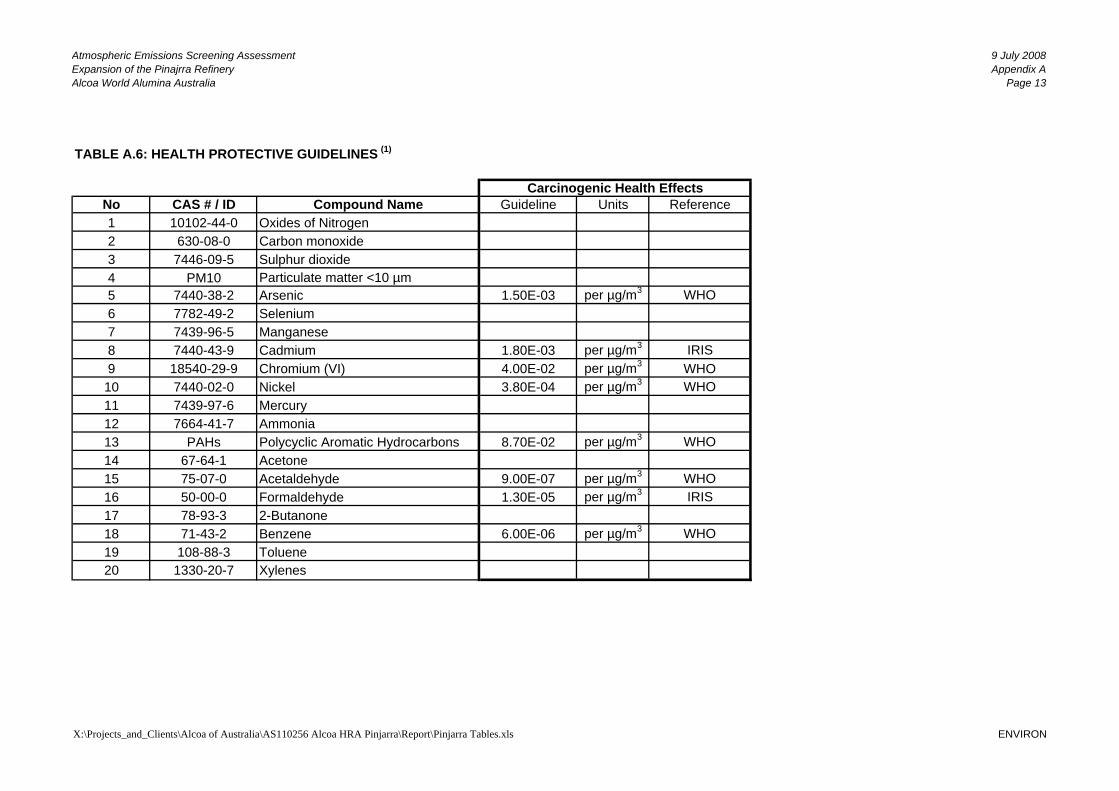
The health protective guidelines applied for the screening assessment are presented in Table A.6 of Appendix A, and briefly discussed in the following sections. In general the same health protective guidelines as applied in the health risk assessment conducted for the Expansion of the Wagerup Refinery to 4.7 Mtpa (ENVIRON and Benchmark, 2005) have been applied in this assessment.
Alcoa World Alumina Australia 9 July 2008
Health Risk Screening Assessment of the Upgraded Pinjarra Refinery
Page 9
F I N A L
AS110256 X:\Projects_and_Clients\Alcoa of Australia\AS110256 Alcoa HRA Pinjarra\Report\AS110256_Upgraded Pinjarra Refinery_D0.doc
4.1 Non-Carcinogenic Effects A non-carcinogenic effect is defined as any adverse response to a chemical that is not cancer. Any chemical can cause adverse health effects if given at a high enough dose. When the dose is sufficiently low, no adverse effect is observed. Thus, in characterising the non-carcinogenic effects of a chemical, the key parameter is the threshold dose at which an adverse effect first becomes evident. Doses below the threshold are considered to be "safe" (i.e., not associated with adverse effects), while doses above the threshold may cause an adverse effect.
The threshold dose is typically estimated from toxicological or epidemiological data by finding the highest dose level that produces no observable adverse effect (a NOAEL) or the lowest dose level that produces an observable adverse effect (a LOAEL). Where more than one such value is available, preference is given to studies using most sensitive species, strain and sex of experimental animal known, the assumption being that humans are no less sensitive than the most sensitive animal species tested. For the guidelines developed by all the authorities considered, NOAELs or LOAELs are divided by the product of a series of uncertainty factors representing experimental vs. environmental exposure duration, inter- and intra-species variability and the quality and completeness of the toxicological database. This procedure ensures that the resultant health protective guidelines are not higher than (and may be orders of magnitude lower than) the threshold level for adverse effects in the most sensitive potential receptor. Thus, there is a “margin of safety” built into the guideline, and doses equal to or less than that level are nearly certain to be without any adverse effect. The likelihood of an adverse effect at doses higher than the guideline increases, but because of the margin of safety, a greater dose does not mean that such an effect will necessarily occur.
4.1.1 Short-Term (Acute) Exposure Health protective guidelines for acute non-carcinogenic health effects are expressed as concentrations in air that are not expected to cause any adverse effects as a result of continuous exposure over a defined averaging period (typically 24 hours or less). These guidelines are appropriate for comparison with 1-hour or 24-hour average exposure estimates predicted by the air dispersion modelling. Although obtained from different organisations/reference sources, the guidelines selected for this assessment are all intended to be protective of continually exposed (i.e. residential) receptors, including potentially sensitive subpopulations.
4.1.2 Long-Term (Chronic) Exposure Health protective guidelines for chronic non-carcinogenic health effects are expressed as concentrations in air that are not expected to cause any adverse health effects as a result of continuous long-term exposure (a year or more). These guidelines are appropriate for comparison with annual average exposure estimates predicted by the air dispersion modelling.
Alcoa World Alumina Australia 9 July 2008
Health Risk Screening Assessment of the Upgraded Pinjarra Refinery
Page 10
F I N A L
AS110256 X:\Projects_and_Clients\Alcoa of Australia\AS110256 Alcoa HRA Pinjarra\Report\AS110256_Upgraded Pinjarra Refinery_D0.doc
4.2 Carcinogenic Effects Cancers are generally defined as diseases of mutation affecting cell growth and differentiation. Although many chemicals are known to cause cancer at high doses in studies with experimental animals, relatively few chemicals have been shown to be carcinogenic in humans at doses likely to be encountered in the ambient environment. Cancers are relatively slow to develop, and usually require prolonged exposure to carcinogenic chemicals. As a result, potential carcinogenic risks are only calculated for long-term exposures.
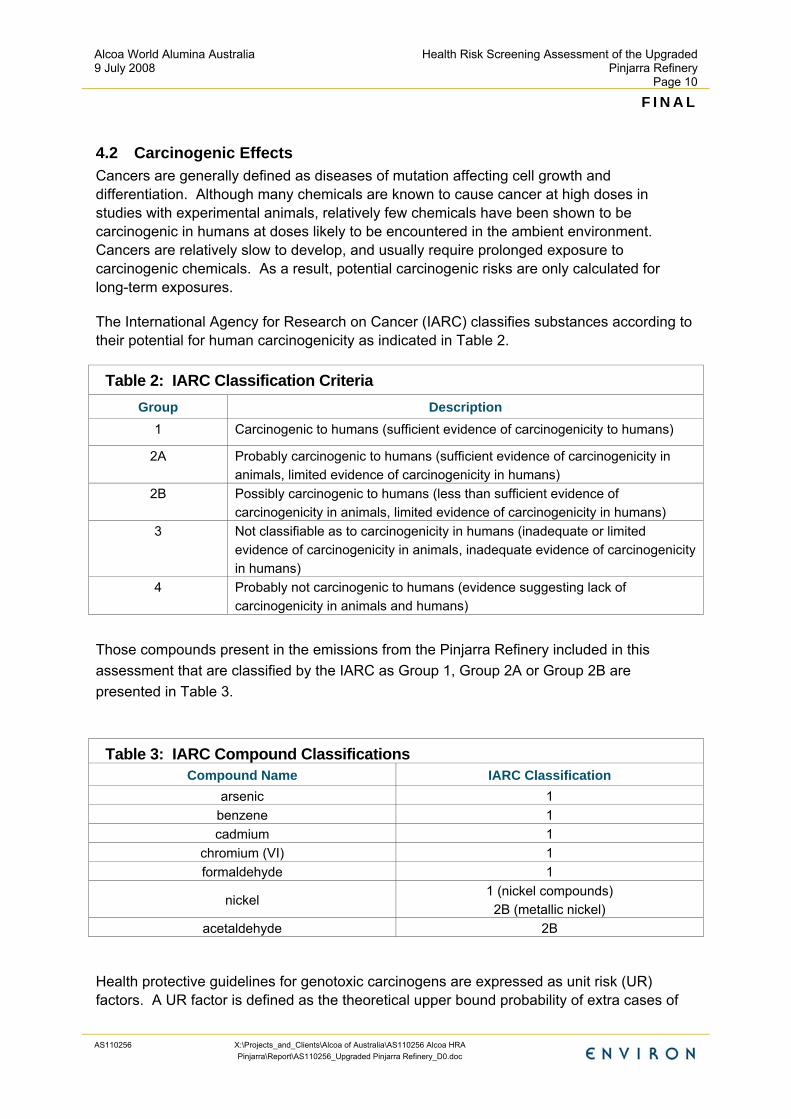
The International Agency for Research on Cancer (IARC) classifies substances according to their potential for human carcinogenicity as indicated in Table 2.
Table 2: IARC Classification Criteria Group Description
1 Carcinogenic to humans (sufficient evidence of carcinogenicity to humans)
2A Probably carcinogenic to humans (sufficient evidence of carcinogenicity in animals, limited evidence of carcinogenicity in humans)
2B Possibly carcinogenic to humans (less than sufficient evidence of carcinogenicity in animals, limited evidence of carcinogenicity in humans)
3 Not classifiable as to carcinogenicity in humans (inadequate or limited evidence of carcinogenicity in animals, inadequate evidence of carcinogenicity in humans)
4 Probably not carcinogenic to humans (evidence suggesting lack of carcinogenicity in animals and humans)
Those compounds present in the emissions from the Pinjarra Refinery included in this assessment that are classified by the IARC as Group 1, Group 2A or Group 2B are presented in Table 3.
Table 3: IARC Compound Classifications Compound Name IARC Classification
arsenic 1 benzene 1 cadmium 1
chromium (VI) 1 formaldehyde 1
nickel 1 (nickel compounds)
2B (metallic nickel) acetaldehyde 2B
Health protective guidelines for genotoxic carcinogens are expressed as unit risk (UR) factors. A UR factor is defined as the theoretical upper bound probability of extra cases of
Alcoa World Alumina Australia 9 July 2008
Health Risk Screening Assessment of the Upgraded Pinjarra Refinery
Page 11
F I N A L
AS110256 X:\Projects_and_Clients\Alcoa of Australia\AS110256 Alcoa HRA Pinjarra\Report\AS110256_Upgraded Pinjarra Refinery_D0.doc
cancer occurring in the exposed population assuming lifetime exposure by inhalation to 1 μg/m3 of the chemical (hence units are per µg/m3) (WHO 2000). These guidelines are appropriate for comparison with annual average exposure estimates predicted by the air dispersion modelling.
4.2.1 Formaldehyde Previously health risk assessments conducted of Alcoa’s Western Australian refineries have asserted that as irritation occurs at formaldehyde exposure levels associated with very low cancer risk, irritation is considered the more sensitive and hence more appropriate endpoint for guideline development, and accordingly a UR factor for formaldehyde has not been applied previously.
In June 2004 the IARC reclassified formaldehyde from a Group 2A (probable human carcinogen) to Group 1 (confirmed human carcinogen). With this reclassification it is considered appropriate to treat formaldehyde as a genotoxic carcinogen, and hence for this assessment the UR factor published in the USEPA’s IRIS database has been applied.
4.2.2 Polycyclic Aromatic Hydrocarbons (PAHs) Some individual PAHs are clearly carcinogenic and others appear not to cause cancer, but the majority of this large class of chemicals cannot be classified as to potential carcinogenicity due to lack of sufficient data. The relative carcinogenic potency of indicator PAHs has been published by the WHO relative to Benzo[a]pyrene (BaP), a widely reported PAH known for its carcinogenic potency.
Emissions monitoring has identified the presence of specific PAH compounds in the VOC monitoring using:
• USEPA Method 0030 Determination of Volatile Principal Organic Hazardous Constituents using Volatile Organic Sampling Train (VOST) Method for Stationary Source;
• USEPA Method 18 Measurement of Gaseous Organic Compounds Emissions by Gas Chromatography conducted at the Pinjarra Refinery; and
• Semi-volatile Organic Compound (SVOC) monitoring using USEPA Method 5 Determination of Semi-Volatile Organic Compound Emissions from Stationary Sources conducted at the Wagerup Refinery.
The only PAH detected by the Pinjarra Refinery VOC monitoring program was naphthalene, although the Wagerup Refinery SVOC monitoring program detected a number of additional PAH compounds, listed in Table 4. The difference in the PAH compounds identified by the Pinjarra and Wagerup emission testing programs is possibly a result of the different USEPA Methods applied. USEPA Method 5 is the more appropriate test method to apply for speciated PAH monitoring as it picks up most semi-volatile organic compounds including PAHs (P Coffey, Pers. comm. 24 June 2008). Accordingly, using Method 18 may be missing other PAHs, mainly 2-methylnaphthalene, which may account for around 42% of the total
Alcoa World Alumina Australia 9 July 2008
Health Risk Screening Assessment of the Upgraded Pinjarra Refinery
Page 12
F I N A L
AS110256 X:\Projects_and_Clients\Alcoa of Australia\AS110256 Alcoa HRA Pinjarra\Report\AS110256_Upgraded Pinjarra Refinery_D0.doc
PAHs (Table 4). For this assessment, the total PAH emissions at Pinjarra have been estimated from the measurements of naphthalene and assuming that the other PAHs are in the same ratio naphthalene as they are at Wagerup.
This is considered reasonable on the basis that the fundamental nature and composition of emissions to atmosphere from the Wagerup and Pinjarra Refineries, including the speciation of compounds, should be similar because:
• both refineries use essentially the same process (Bayer Process), with very similar process temperatures, pressures, residence times and chemical reactions;
• raw material inputs to the refineries are similar, with bauxite sourced from the same parent mineral ore body (although different mining locations), and the same materials suppliers used for chemicals added to the refinery process;
• combustion processes at both refineries use the same natural gas supplies, and the design and operating fundamentals of the combustion equipment, including the calciners, is essentially the same; and
• in all the testing that has been conducted, outputs are qualitatively and quantitatively similar.
Hence it is reasonable to assume that compounds not tested for at the Pinjarra Refinery but found at Wagerup, would nevertheless be present at Pinjarra, and in proportional amounts to those found at Wagerup Refinery.
PAH emissions from the Pinjarra Refinery have therefore been estimated based on the emission rate of naphthalene measured for the Pinjarra Refinery, and using the relative percent of each of the PAH compounds detected during the Wagerup Refinery SVOC monitoring (Table 4), according to Equation 2:
[ ]
[ ]enaphthalenPAHmm enaphthalenPAH ×= Equation 2
Where:
PAHm = mass emission rate of individual PAH applied for the Pinjarra Refinery (g/s)
enaphthalenm = mass emission rate of naphthalene obtained from testing at the Pinjarra Refinery (g/s)
[ ]PAH = composition of individual PAH obtained from testing at the Wagerup Refinery, as per Table 4 (%)
[ enaphthalen ] = composition of naphthalene obtained from testing at the Wagerup Refinery, as per Table 4 (%)
Alcoa World Alumina Australia 9 July 2008
Health Risk Screening Assessment of the Upgraded Pinjarra Refinery
Page 13
F I N A L
AS110256 X:\Projects_and_Clients\Alcoa of Australia\AS110256 Alcoa HRA Pinjarra\Report\AS110256_Upgraded Pinjarra Refinery_D0.doc
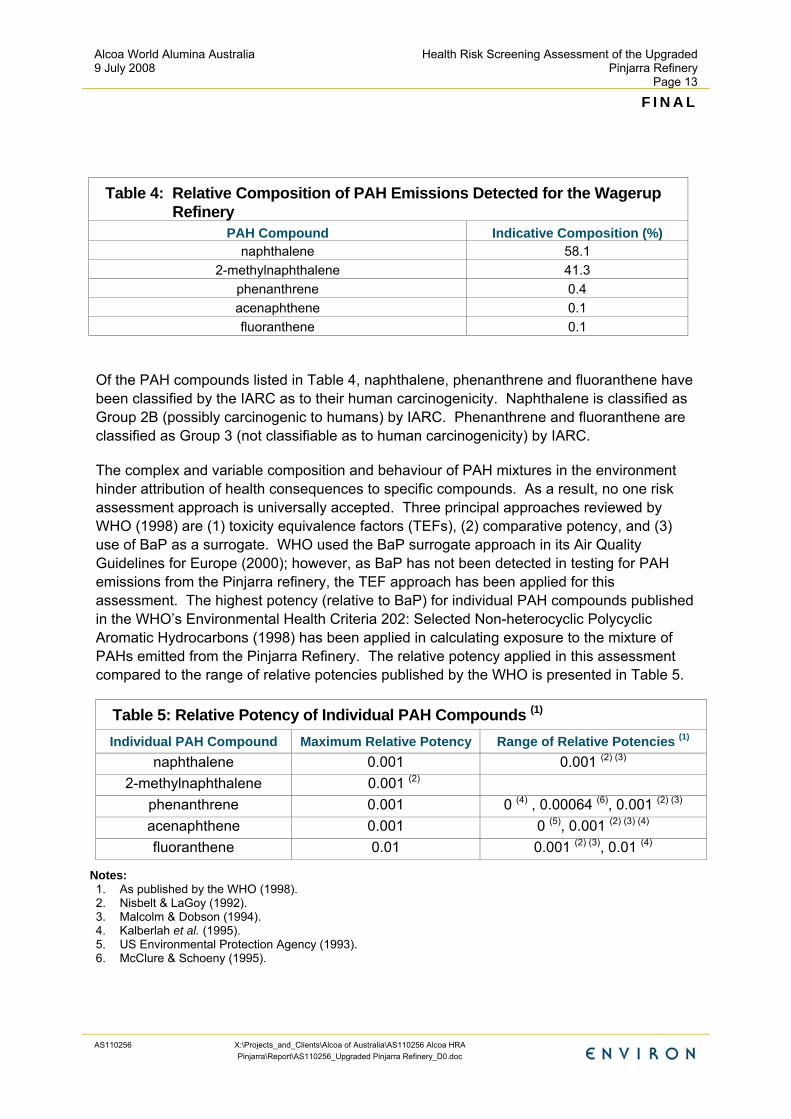
Table 4: Relative Composition of PAH Emissions Detected for the Wagerup Refinery
Of the PAH compounds listed in Table 4, naphthalene, phenanthrene and fluoranthene have been classified by the IARC as to their human carcinogenicity. Naphthalene is classified as Group 2B (possibly carcinogenic to humans) by IARC. Phenanthrene and fluoranthene are classified as Group 3 (not classifiable as to human carcinogenicity) by IARC.
The complex and variable composition and behaviour of PAH mixtures in the environment hinder attribution of health consequences to specific compounds. As a result, no one risk assessment approach is universally accepted. Three principal approaches reviewed by WHO (1998) are (1) toxicity equivalence factors (TEFs), (2) comparative potency, and (3) use of BaP as a surrogate. WHO used the BaP surrogate approach in its Air Quality Guidelines for Europe (2000); however, as BaP has not been detected in testing for PAH emissions from the Pinjarra refinery, the TEF approach has been applied for this assessment. The highest potency (relative to BaP) for individual PAH compounds published in the WHO’s Environmental Health Criteria 202: Selected Non-heterocyclic Polycyclic Aromatic Hydrocarbons (1998) has been applied in calculating exposure to the mixture of PAHs emitted from the Pinjarra Refinery. The relative potency applied in this assessment compared to the range of relative potencies published by the WHO is presented in Table 5.
Table 5: Relative Potency of Individual PAH Compounds (1) Individual PAH Compound Maximum Relative Potency Range of Relative Potencies (1)
Notes: 1. As published by the WHO (1998). 2. Nisbelt & LaGoy (1992). 3. Malcolm & Dobson (1994). 4. Kalberlah et al. (1995). 5. US Environmental Protection Agency (1993). 6. McClure & Schoeny (1995).
Alcoa World Alumina Australia 9 July 2008
Health Risk Screening Assessment of the Upgraded Pinjarra Refinery
Page 14
F I N A L
AS110256 X:\Projects_and_Clients\Alcoa of Australia\AS110256 Alcoa HRA Pinjarra\Report\AS110256_Upgraded Pinjarra Refinery_D0.doc
To calculate the carcinogenic risk associated with exposure to PAH emissions from the Pinjarra Refinery, the BaP equivalent exposure concentration for each individual PAH has been summed. The WHO’s UR factor for benzo[a]pyrene of 8.7 x 10⁻² per µg/m3 was then applied for this assessment, which is based on studies in coke-oven workers (WHO, 2000).
4.2.3 Dioxins and Furans Dioxins (polychlorinated dibenzo-p-dioxins [PCDDs]) and furans (polychlorinated dibenzofurans [PCDFs]) are a group of toxic organic chemicals that remain in the environment for a long time, and can accumulate in the body fat of animals and humans. For the general population, over 95 percent of exposure to dioxins is through the diet, with foods of animal origin such as meat, diary products and fish being the main sources. The estimated monthly level of dietary exposure to dioxins and furans in Australians ranges from 3.7 to 15.6 pg TEQ/kg body weight per month. Intake of dioxins and furans through the skin, ingestion from soil and from breathing are minor contributors to exposure of the general population (DEH, 2004).
The toxicity of a mixture of dioxins and furans is assessed by multiplying a congener’s concentration with its Toxicity Equivalency Factor (TEF) and summing the resulting values to derive the Toxic Equivalent (TEQ) emission. The most toxic congener is 2,3,7,8- Tetrachlorodibenzodioxin (TCDD) which has a factor of one, with all other 2,3,7 and 8-substitued congeners falling between 0.0001 and one. All compounds without this very specific substitution pattern have a toxicity rating of zero.
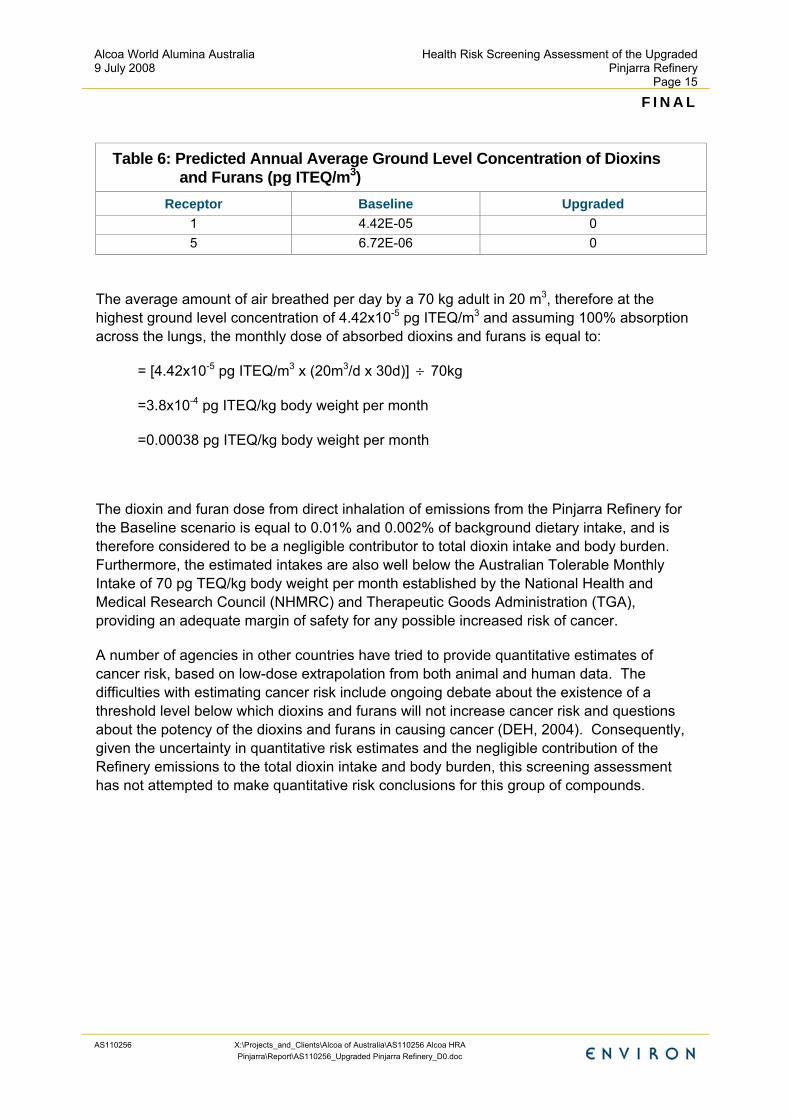
Low levels of dioxins and furans were detected in emissions from the Oxalate kiln prior to the PEU, equal to 235 pg ITEQ/s. The Oxalate kiln was found to be the only emission source with detectable levels of dioxins and furans. The annual average ground level concentrations predicted at the maximally affected receptor (receptor 1) and the least affected receptor (receptor 5) are presented in Table 6.
The potential for dioxins and furans to be emitted from Alcoa’s refineries has been eliminated by identifying and eliminating the chemical additives that were the precursors to the dioxin and furan emissions detected from the oxalate kiln (Alcoa, 2005). In addition, as part of the PEU the Oxalate kiln was fitted with a High Efficiency Wet Scrubber and Regenerative Thermal Oxidiser (RTO) to treat waste gases from this source, which provides an added level of protection from such emissions. Consistent with this, subsequent monitoring of emissions from the upgraded Oxalate kiln found no detectable levels of dioxins and furans. Therefore, it can be concluded that the combination of the changes to the Refinery inputs and the RTO has resulted in the complete elimination of dioxins and furans. As such, the emissions of dioxins and furans from the Upgraded Refinery were set equal to zero by Alcoa.
Alcoa World Alumina Australia 9 July 2008
Health Risk Screening Assessment of the Upgraded Pinjarra Refinery
Page 15
F I N A L
AS110256 X:\Projects_and_Clients\Alcoa of Australia\AS110256 Alcoa HRA Pinjarra\Report\AS110256_Upgraded Pinjarra Refinery_D0.doc
Table 6: Predicted Annual Average Ground Level Concentration of Dioxins and Furans (pg ITEQ/m3)
The average amount of air breathed per day by a 70 kg adult in 20 m3, therefore at the highest ground level concentration of 4.42x10⁻⁵ pg ITEQ/m3 and assuming 100% absorption across the lungs, the monthly dose of absorbed dioxins and furans is equal to:
= [4.42x10⁻⁵ pg ITEQ/m3 x (20m3/d x 30d)] ÷ 70kg
=3.8x10⁻⁴ pg ITEQ/kg body weight per month
=0.00038 pg ITEQ/kg body weight per month
The dioxin and furan dose from direct inhalation of emissions from the Pinjarra Refinery for the Baseline scenario is equal to 0.01% and 0.002% of background dietary intake, and is therefore considered to be a negligible contributor to total dioxin intake and body burden. Furthermore, the estimated intakes are also well below the Australian Tolerable Monthly Intake of 70 pg TEQ/kg body weight per month established by the National Health and Medical Research Council (NHMRC) and Therapeutic Goods Administration (TGA), providing an adequate margin of safety for any possible increased risk of cancer.
A number of agencies in other countries have tried to provide quantitative estimates of cancer risk, based on low-dose extrapolation from both animal and human data. The difficulties with estimating cancer risk include ongoing debate about the existence of a threshold level below which dioxins and furans will not increase cancer risk and questions about the potency of the dioxins and furans in causing cancer (DEH, 2004). Consequently, given the uncertainty in quantitative risk estimates and the negligible contribution of the Refinery emissions to the total dioxin intake and body burden, this screening assessment has not attempted to make quantitative risk conclusions for this group of compounds.
Alcoa World Alumina Australia 9 July 2008
Health Risk Screening Assessment of the Upgraded Pinjarra Refinery
Page 16
F I N A L
AS110256 X:\Projects_and_Clients\Alcoa of Australia\AS110256 Alcoa HRA Pinjarra\Report\AS110256_Upgraded Pinjarra Refinery_D0.doc
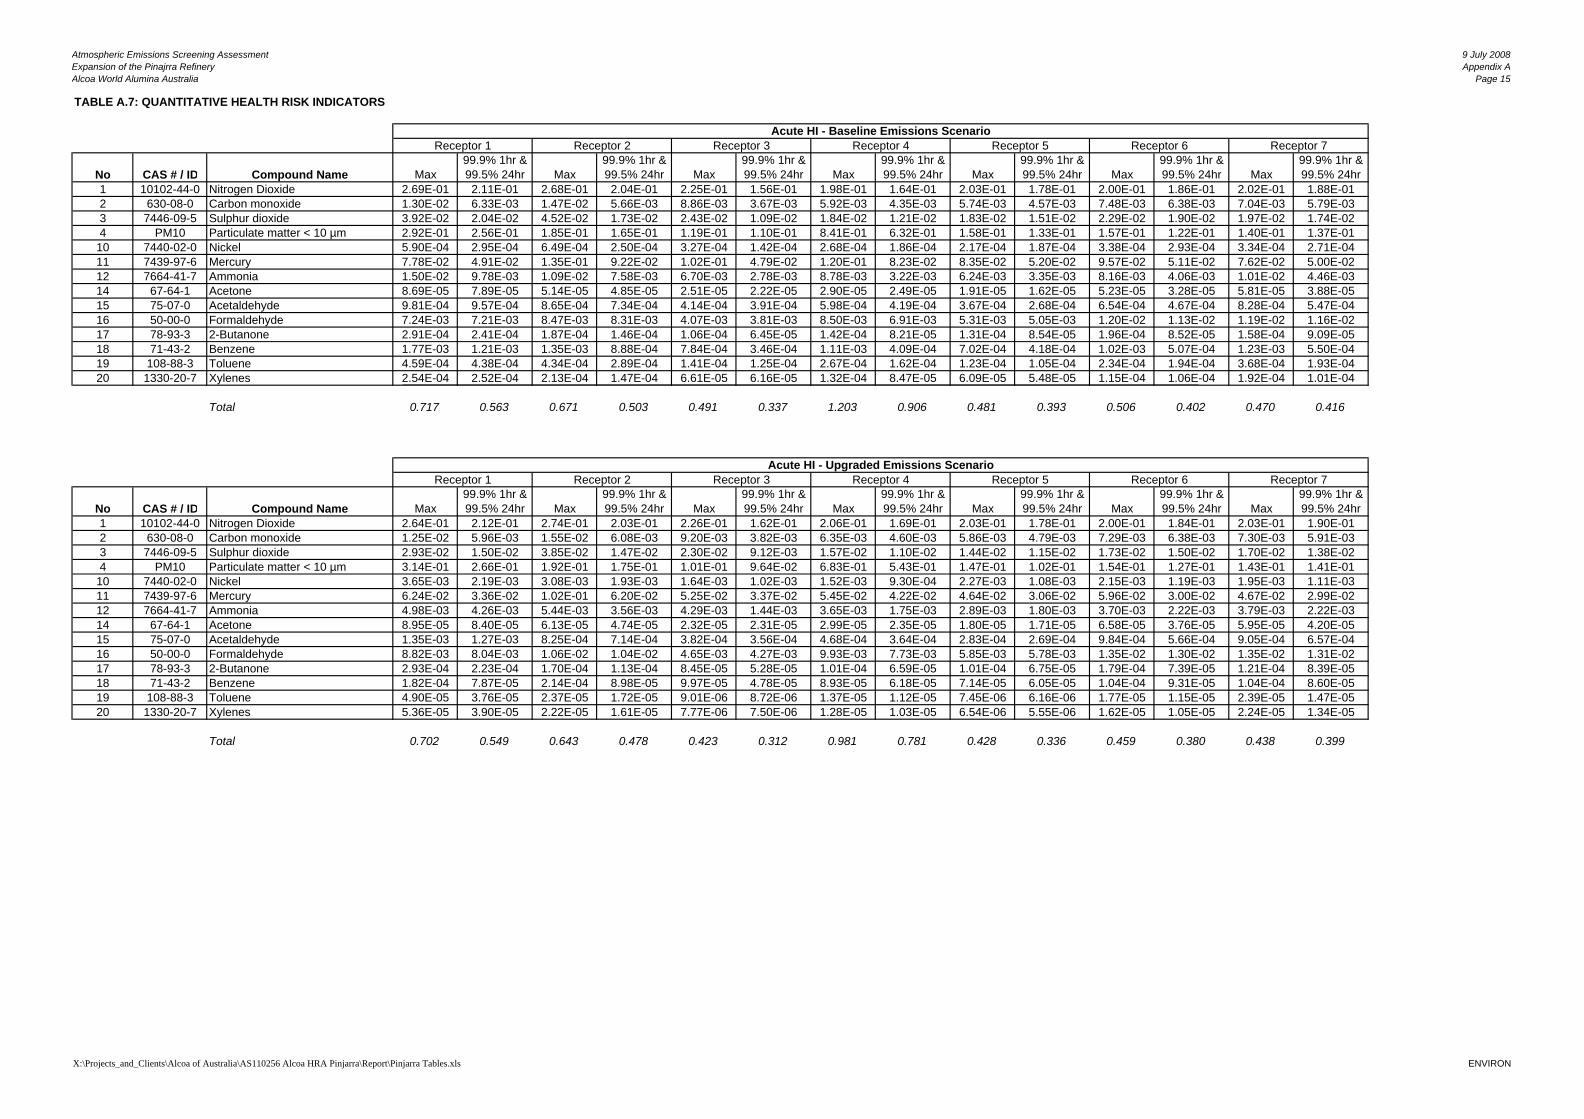
5 Risk Characterisation Screening-level quantitative health risk indicators have been calculated for potential acute and chronic non-carcinogenic health effects, and carcinogenic health effects for the Baseline and Upgraded Refinery emission scenarios.
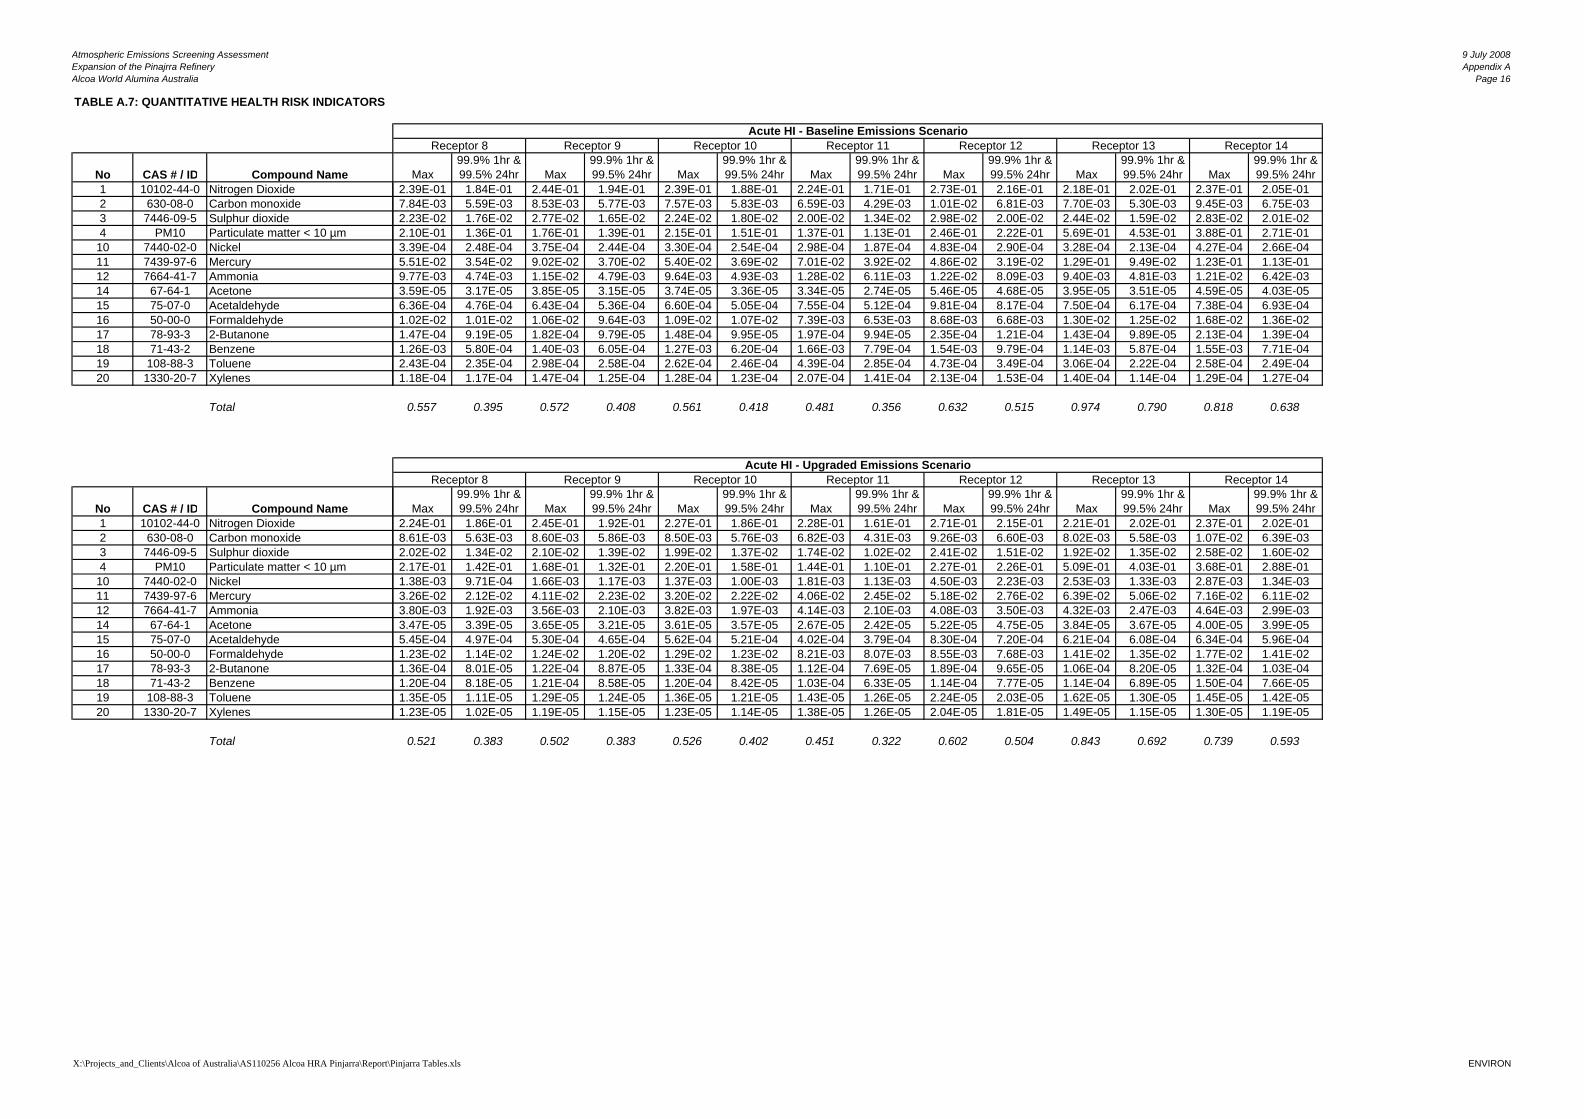
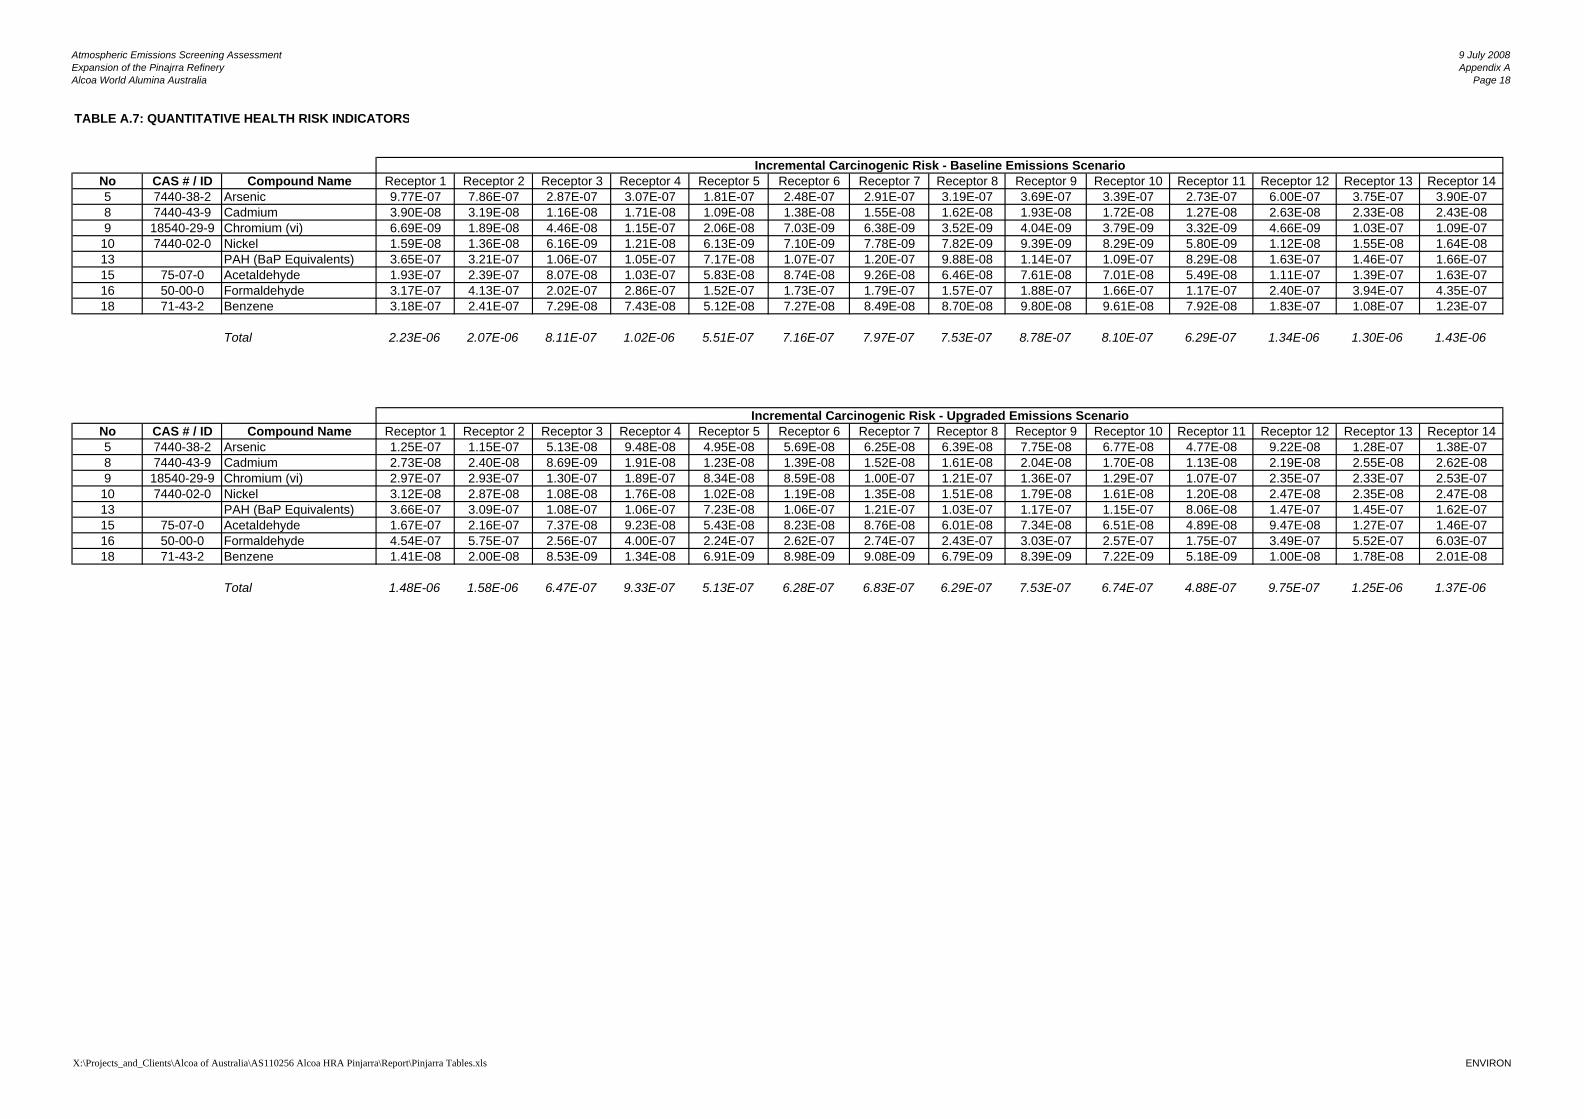
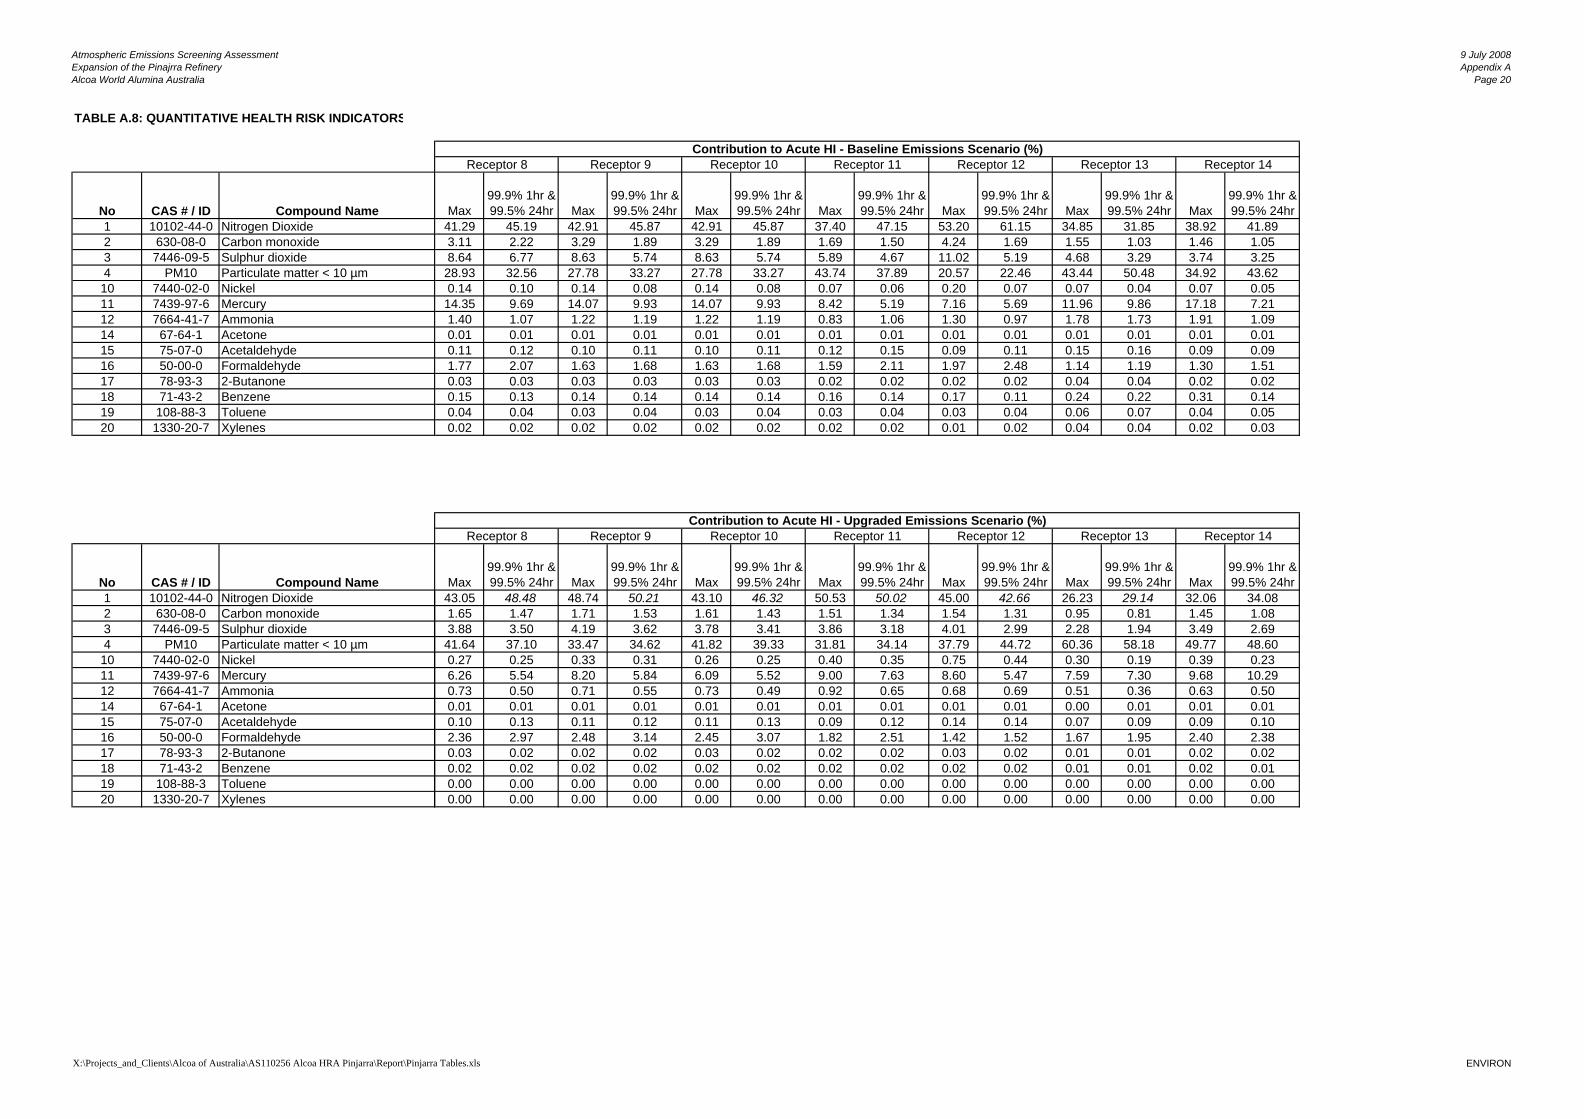
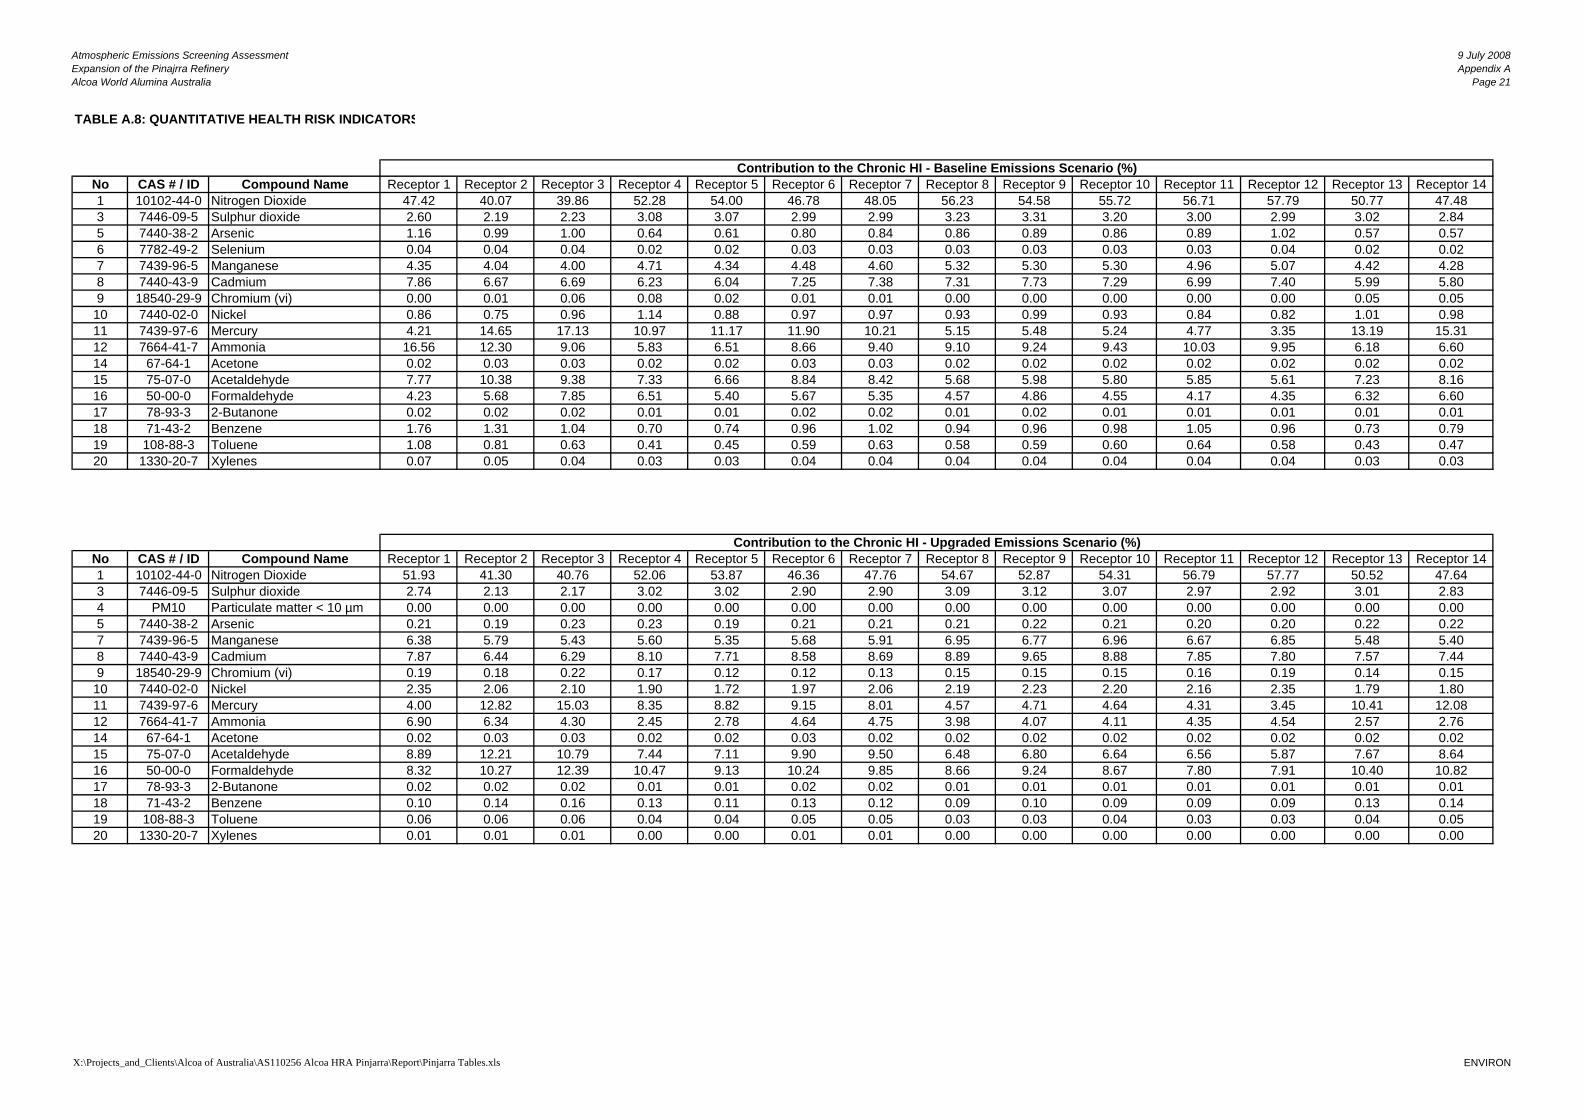
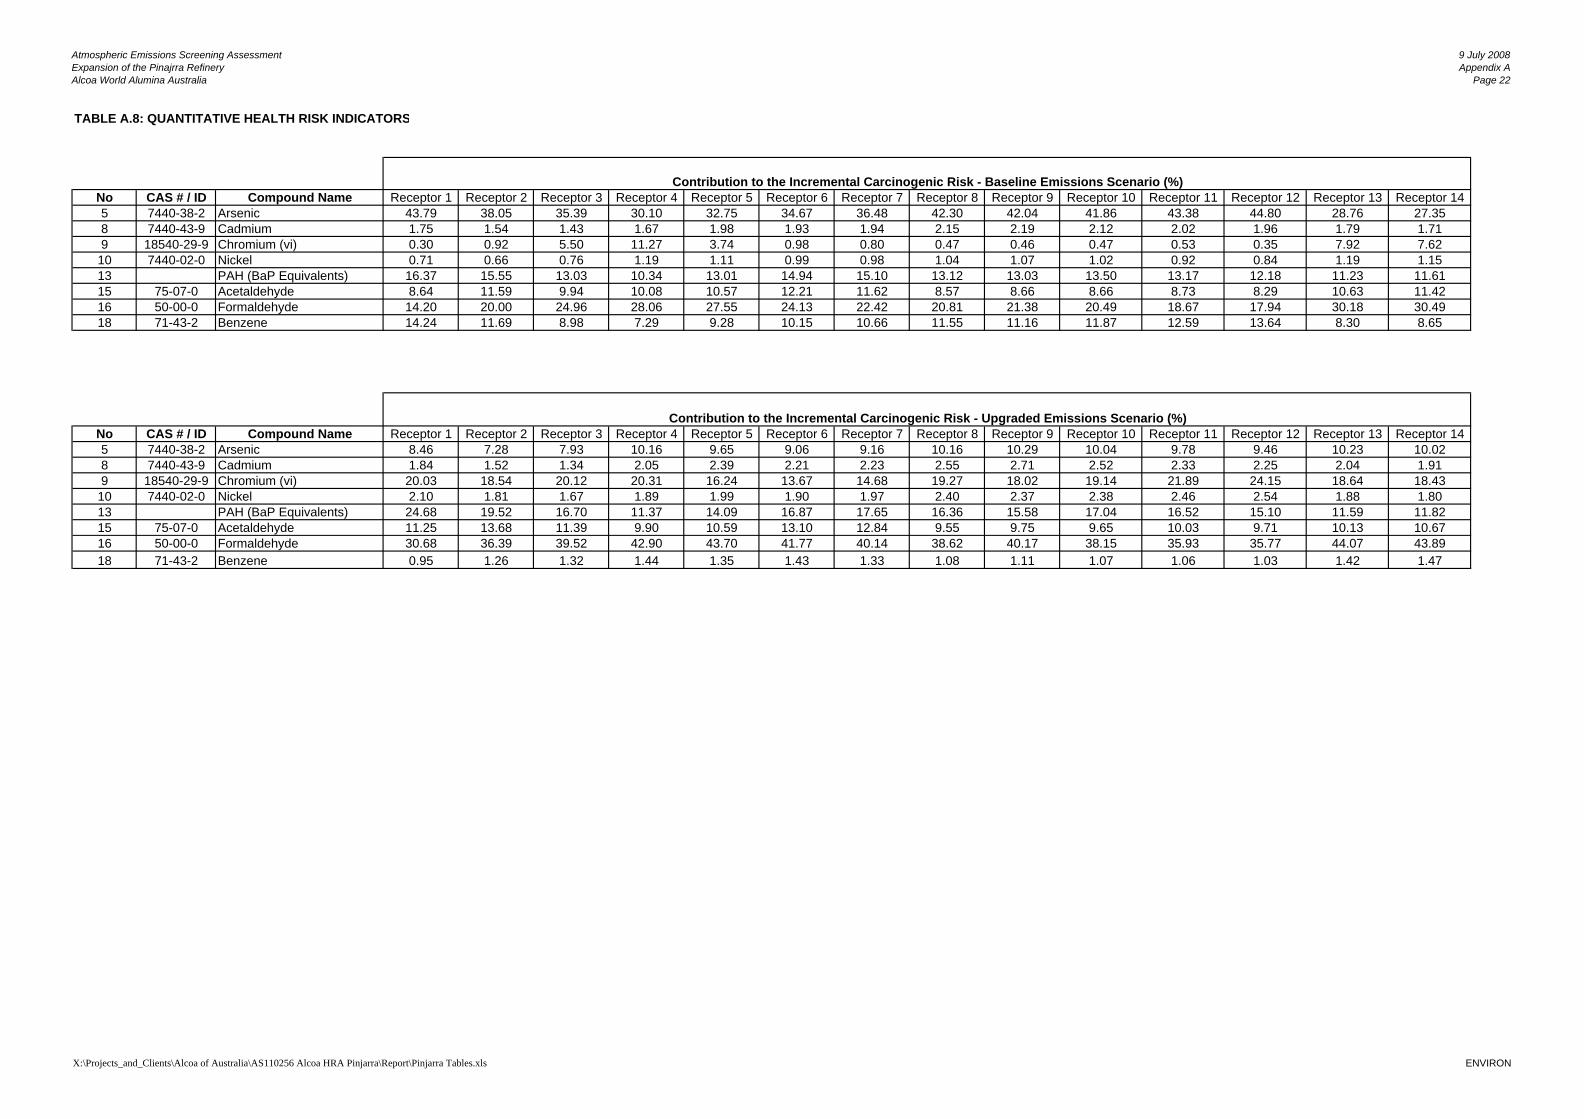
The quantitative risk indicators are described in Section 5.1, and the findings of the risk characterisation are presented in Sections 5.2 to 5.6. The sections focus on the maximally affected receptors (receptors 1, 2 and 4) and the least affected receptors (receptors 3, 5 and 11) as they represent the range of quantitative health risk indicators calculated for all of the receptor locations. The calculated health risk indicators at all 14 receptor locations and for each compound individually are presented in Table A.7 of Appendix A. Table A.8 of Appendix A presents the percent contribution of individual compounds to the quantitative risk indicators at all 14 receptor locations. Figures 3, 4, 6, 8 present contours of the calculated health risk indicators overlain on an aerial photograph of the region.
5.1 Quantitative Risk Indicators The Hazard Index (HI) is calculated to evaluate the potential for non-carcinogenic adverse health effects from simultaneous exposure to multiple compounds by summing the ratio of the estimated concentration in air to the health protective guidelines for individual compounds. The HI is calculated for acute (Equation 3) and chronic (Equation 4) exposures.
∑≤
=i
h
AcuteAcute C
HI24
Gdl Equation 3
∑= i
Annual
ChronicChronic C
HIGdl
Equation 4
Where:
= acute Hazard Index AcuteHI
hC 24≤ = ground level concentration predicted over an averaging period of typically ≤ 24 hours, matching the averaging time of the health protective guideline for compound (µg/m3)
AcuteGdl = acute health protective guideline for compound (µg/m3)
ChronicHI = chronic Hazard Index
AnnualC = annual average ground level concentration for compound (µg/m3)
ChronicGdl = chronic health protective guideline for compound (µg/m3)
Alcoa World Alumina Australia 9 July 2008
Health Risk Screening Assessment of the Upgraded Pinjarra Refinery
Page 17
F I N A L
AS110256 X:\Projects_and_Clients\Alcoa of Australia\AS110256 Alcoa HRA Pinjarra\Report\AS110256_Upgraded Pinjarra Refinery_D0.doc
For the screening assessment the acute air concentration used to calculate the acute HI has been based upon the maximum 1-hour and 24-hour average ground level concentrations predicted by the air dispersion modelling. The maximum 1-hour ground level concentration is predicted to occur once per year under “worst case” meteorological conditions and is therefore a conservative estimate of actual acute exposure. In addition, the acute HIs have also been calculated using the 99.9 percentile 1-hour average and 99.5 percentile 24-hour average ground level concentrations predicted from the air dispersion modelling, representing a more realistic, yet still conservative estimate of actual acute exposures. The CSIRO (2005) state that the 9th highest concentration (99.9 percentile) or robust highest concentration (RHC) is often chosen as the key statistic to represent the extremes, rather than the modelled or observed maximum. In this screening assessment, the use of the maximum predicted concentrations has been retained for consistency with the original PEU HRA.
The general rule of thumb for interpreting the HI is that:
• values less than one represent no cause for concern;
• values greater than one but less than 10 generally do not represent cause for concern because of the inherent conservatism embedded in the exposure and toxicity assessments; and
• values greater than ten may present some concern with respect to possible health effects (Toxikos, 2003).
The carcinogenic risk provides an indication of the incremental probability that an individual will develop cancer over a lifetime as a direct result of exposure to potential carcinogens, and is expressed as a unitless probability. The incremental carcinogenic risk for individual compounds is summed to calculate the potential total incremental carcinogenic risk from exposure to multiple compounds (Equation 5).
i
iAnnuali UR
ATEDEFCRisk ×
××= ∑ 1
Equation 5
Where:
= lifetime incremental total cancer risk Risk
AnnualC = annual average ground level concentration for compound (µg/m3)
EF = exposure frequency (365 days/year)
ED = exposure duration (70 years)
AT = averaging time (365 days/year x 70 years, or 25,550 days)
= Unit Risk factor for compound (per µg/m3) iUR
Alcoa World Alumina Australia 9 July 2008
Health Risk Screening Assessment of the Upgraded Pinjarra Refinery
Page 18
F I N A L
AS110256 X:\Projects_and_Clients\Alcoa of Australia\AS110256 Alcoa HRA Pinjarra\Report\AS110256_Upgraded Pinjarra Refinery_D0.doc
The incremental carcinogenic risk that is considered acceptable varies amongst jurisdictions, typically ranging from one in a million (1x10⁻⁶) to one in ten thousand (1x10⁻⁴). The most stringent criterion of one in a million represents the USEPA’s de minimis, or essentially negligible incremental risk level, and has therefore been adopted for this screening assessment as a conservative (i.e. health protective) indicator of acceptable carcinogenic risk.
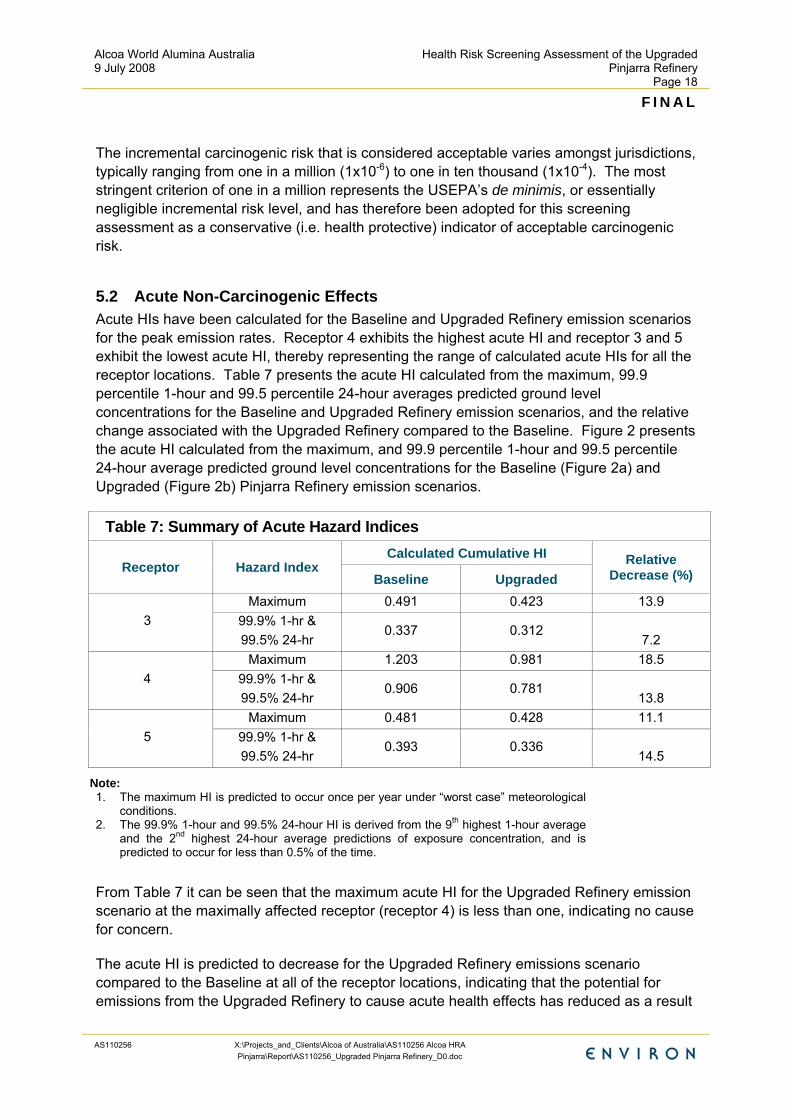
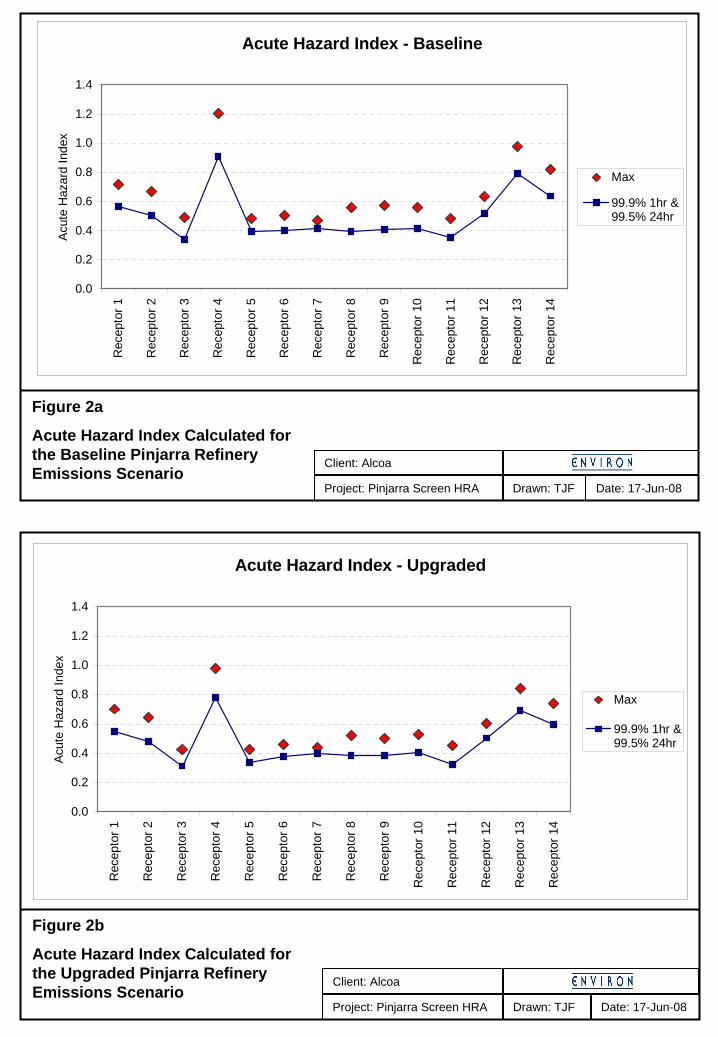
5.2 Acute Non-Carcinogenic Effects Acute HIs have been calculated for the Baseline and Upgraded Refinery emission scenarios for the peak emission rates. Receptor 4 exhibits the highest acute HI and receptor 3 and 5 exhibit the lowest acute HI, thereby representing the range of calculated acute HIs for all the receptor locations. Table 7 presents the acute HI calculated from the maximum, 99.9 percentile 1-hour and 99.5 percentile 24-hour averages predicted ground level concentrations for the Baseline and Upgraded Refinery emission scenarios, and the relative change associated with the Upgraded Refinery compared to the Baseline. Figure 2 presents the acute HI calculated from the maximum, and 99.9 percentile 1-hour and 99.5 percentile 24-hour average predicted ground level concentrations for the Baseline (Figure 2a) and Upgraded (Figure 2b) Pinjarra Refinery emission scenarios.
Table 7: Summary of Acute Hazard Indices Calculated Cumulative HI
Receptor Hazard Index Baseline Upgraded
Relative Decrease (%)
Maximum 0.491 0.423 13.9 3 99.9% 1-hr &
99.5% 24-hr 0.337 0.312
7.2 Maximum 1.203 0.981 18.5
4 99.9% 1-hr & 99.5% 24-hr
0.906 0.781 13.8
Maximum 0.481 0.428 11.1 5 99.9% 1-hr &
99.5% 24-hr 0.393 0.336
14.5
Note: 1. The maximum HI is predicted to occur once per year under “worst case” meteorological
conditions. 2. The 99.9% 1-hour and 99.5% 24-hour HI is derived from the 9th highest 1-hour average
and the 2nd highest 24-hour average predictions of exposure concentration, and is predicted to occur for less than 0.5% of the time.
From Table 7 it can be seen that the maximum acute HI for the Upgraded Refinery emission scenario at the maximally affected receptor (receptor 4) is less than one, indicating no cause for concern.
The acute HI is predicted to decrease for the Upgraded Refinery emissions scenario compared to the Baseline at all of the receptor locations, indicating that the potential for emissions from the Upgraded Refinery to cause acute health effects has reduced as a result
Alcoa World Alumina Australia 9 July 2008
Health Risk Screening Assessment of the Upgraded Pinjarra Refinery
Page 19
F I N A L
AS110256 X:\Projects_and_Clients\Alcoa of Australia\AS110256 Alcoa HRA Pinjarra\Report\AS110256_Upgraded Pinjarra Refinery_D0.doc
of the implementation of the PEU. A decrease in the maximum acute HI of 18% is predicted to occur at the maximally affected receptor (receptor 4).
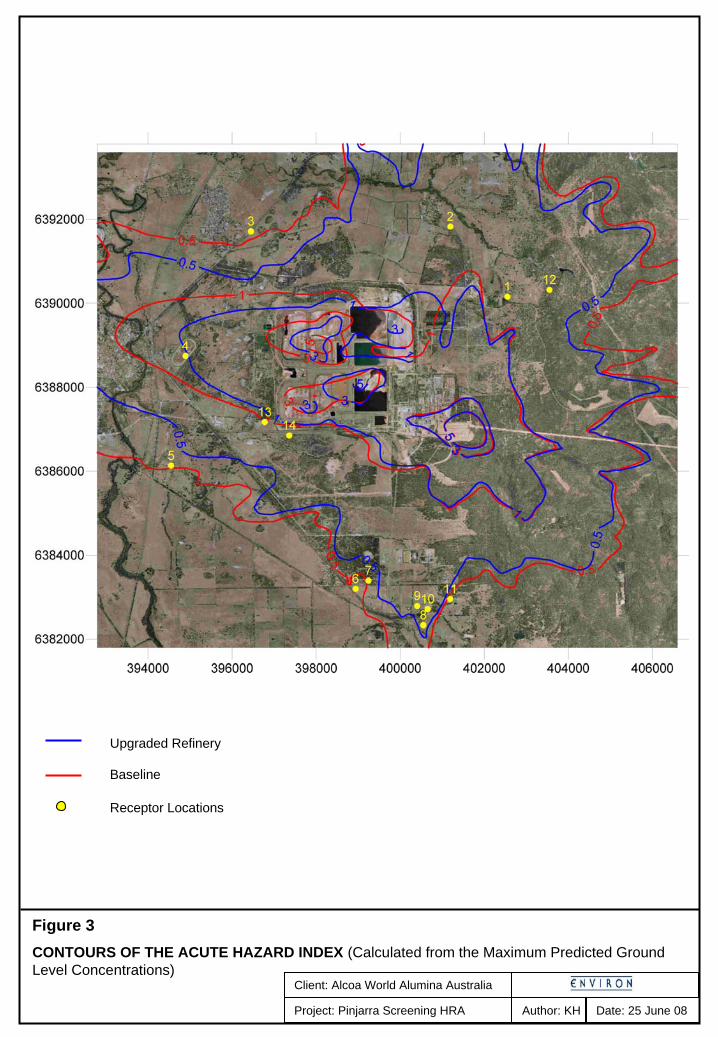
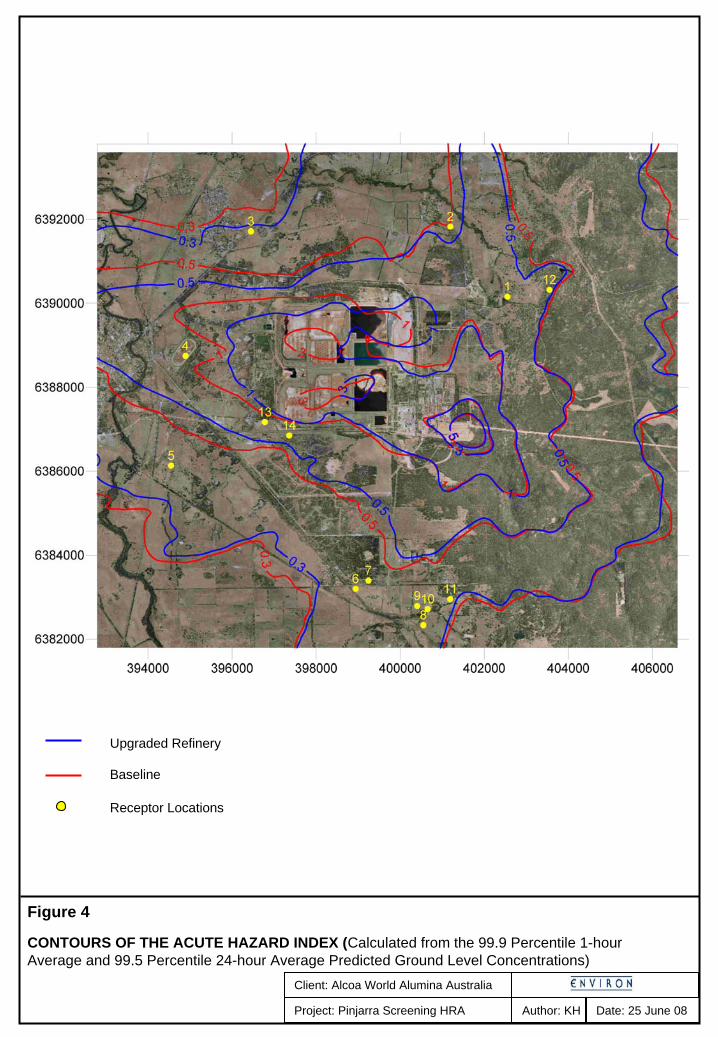
Figures 3 and 4 present the contours of the calculated acute HIs for the Baseline and Upgraded Refinery emission scenarios, overlain on an aerial photograph of the Pinjarra region. From these figures it can be seen that a decrease is exhibited in the contours of the acute HIs for the Upgraded Refinery emission scenario compared to the Baseline. It can also be seen that the highest acute HIs are predicted to occur in the immediate vicinity of the Pinjarra Refinery plant site and the RDA. The major contributors to the acute HI in this area are PM10 and nitrogen dioxide. The acute HI contours extend further to the east northeast of the Refinery, most likely as a result of prevailing south westerly winds combined with the terrain channelling effect of the Darling Scarp upon surface level winds in the region.
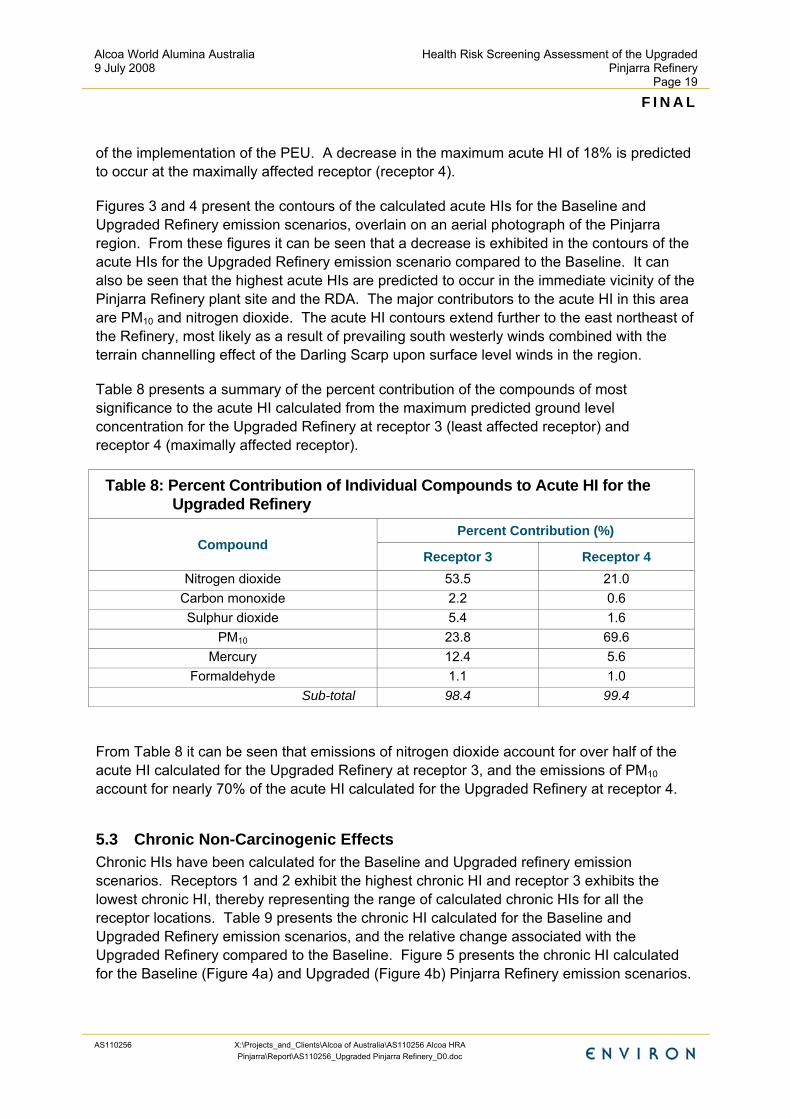
Table 8 presents a summary of the percent contribution of the compounds of most significance to the acute HI calculated from the maximum predicted ground level concentration for the Upgraded Refinery at receptor 3 (least affected receptor) and receptor 4 (maximally affected receptor).
Table 8: Percent Contribution of Individual Compounds to Acute HI for the Upgraded Refinery
Percent Contribution (%) Compound
Receptor 3 Receptor 4 Nitrogen dioxide 53.5 21.0
Carbon monoxide 2.2 0.6 Sulphur dioxide 5.4 1.6
PM10 23.8 69.6 Mercury 12.4 5.6
Formaldehyde 1.1 1.0 Sub-total 98.4 99.4
From Table 8 it can be seen that emissions of nitrogen dioxide account for over half of the acute HI calculated for the Upgraded Refinery at receptor 3, and the emissions of PM10 account for nearly 70% of the acute HI calculated for the Upgraded Refinery at receptor 4.
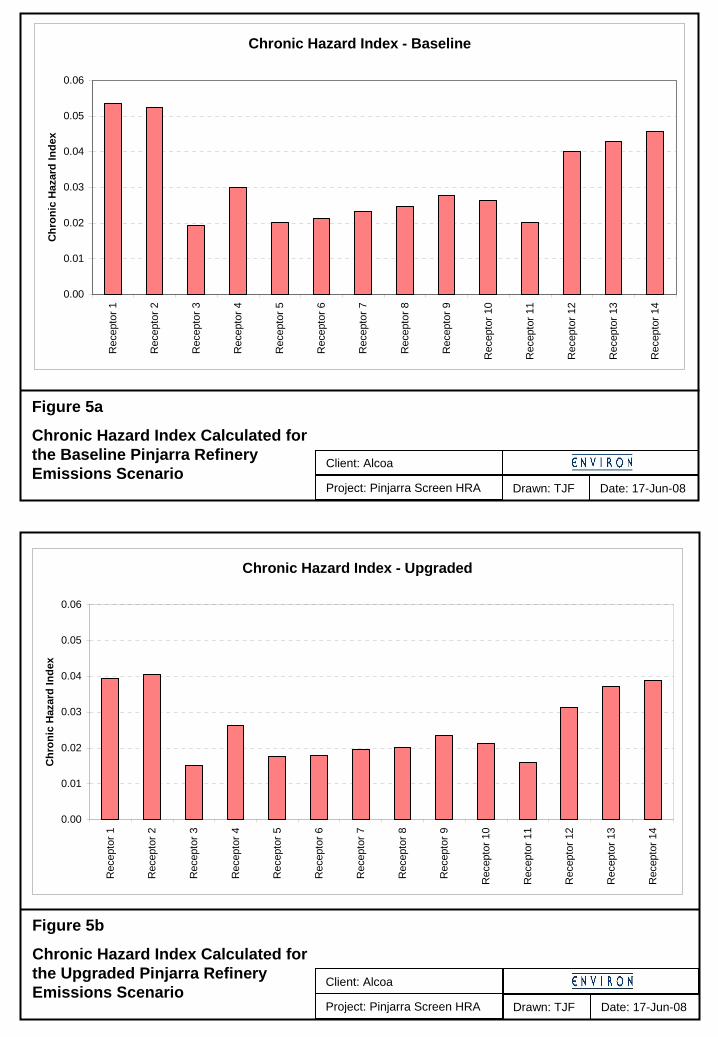
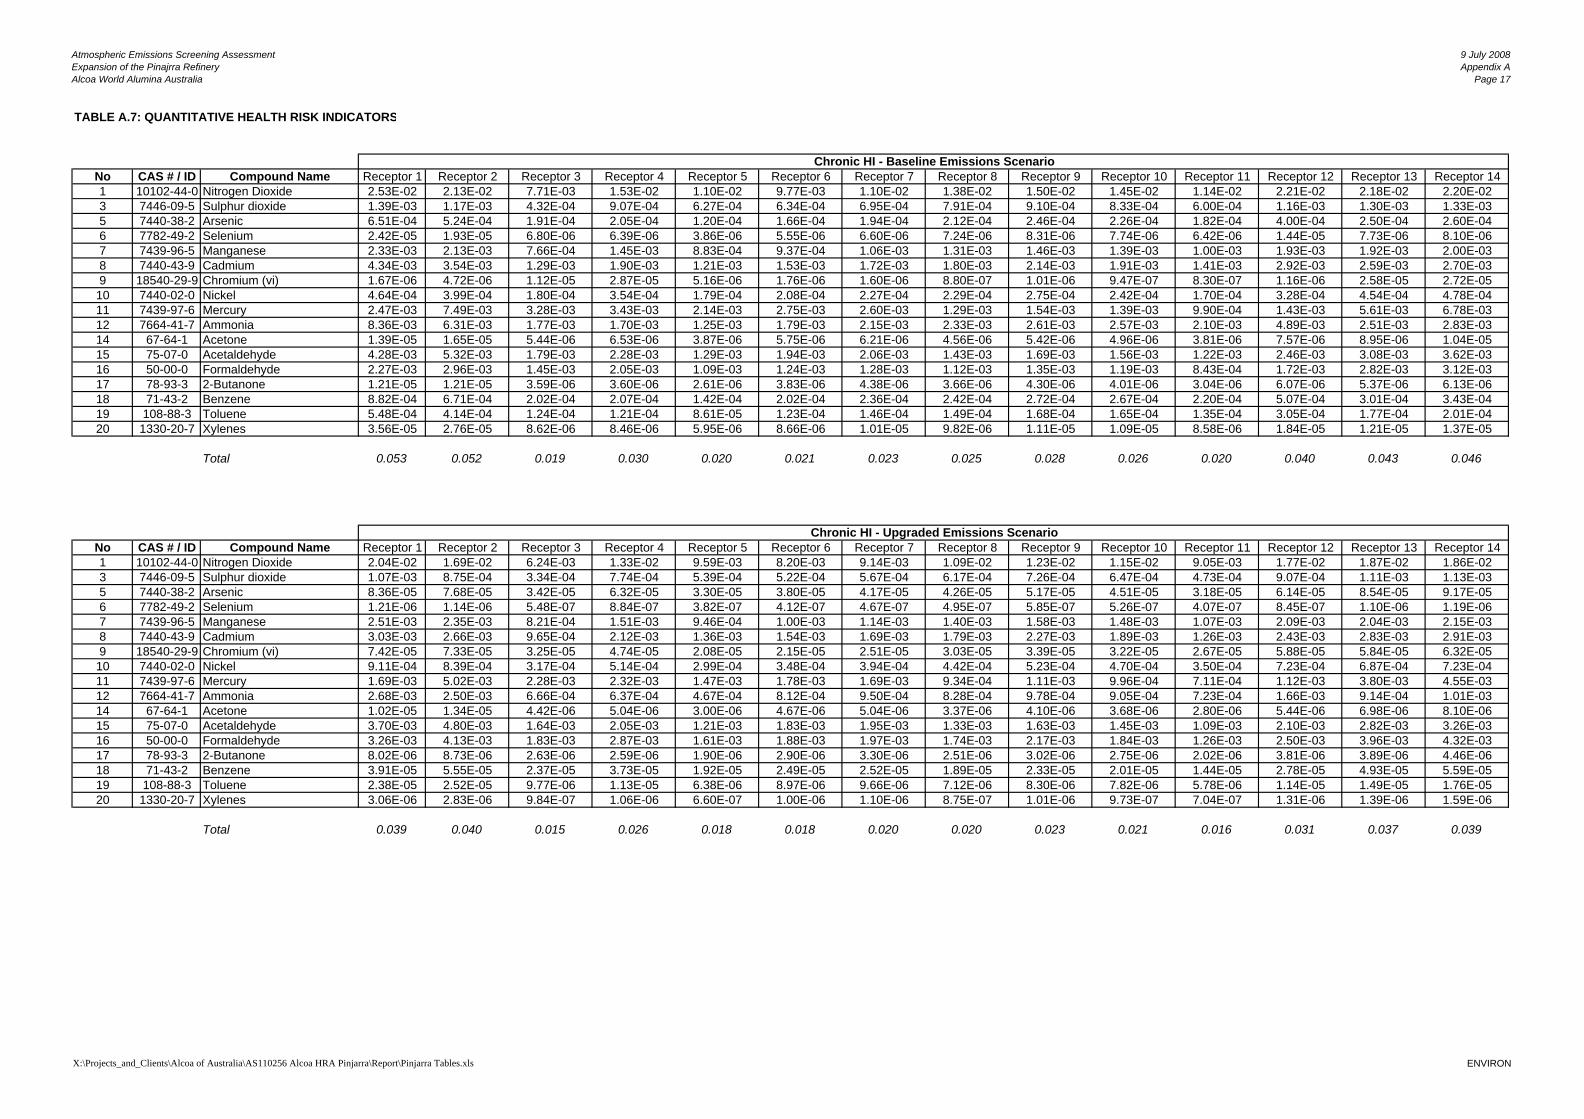
5.3 Chronic Non-Carcinogenic Effects Chronic HIs have been calculated for the Baseline and Upgraded refinery emission scenarios. Receptors 1 and 2 exhibit the highest chronic HI and receptor 3 exhibits the lowest chronic HI, thereby representing the range of calculated chronic HIs for all the receptor locations. Table 9 presents the chronic HI calculated for the Baseline and Upgraded Refinery emission scenarios, and the relative change associated with the Upgraded Refinery compared to the Baseline. Figure 5 presents the chronic HI calculated for the Baseline (Figure 4a) and Upgraded (Figure 4b) Pinjarra Refinery emission scenarios.
Alcoa World Alumina Australia 9 July 2008
Health Risk Screening Assessment of the Upgraded Pinjarra Refinery
Page 20
F I N A L
AS110256 X:\Projects_and_Clients\Alcoa of Australia\AS110256 Alcoa HRA Pinjarra\Report\AS110256_Upgraded Pinjarra Refinery_D0.doc
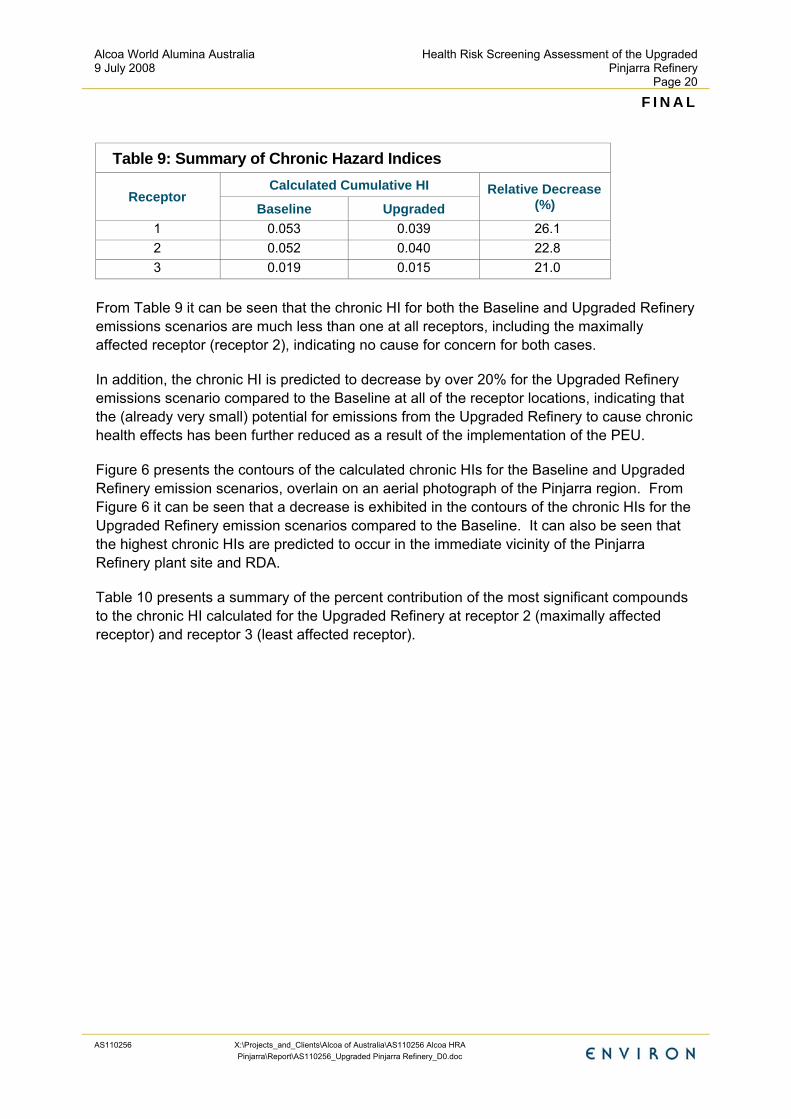
Table 9: Summary of Chronic Hazard Indices Calculated Cumulative HI
From Table 9 it can be seen that the chronic HI for both the Baseline and Upgraded Refinery emissions scenarios are much less than one at all receptors, including the maximally affected receptor (receptor 2), indicating no cause for concern for both cases.
In addition, the chronic HI is predicted to decrease by over 20% for the Upgraded Refinery emissions scenario compared to the Baseline at all of the receptor locations, indicating that the (already very small) potential for emissions from the Upgraded Refinery to cause chronic health effects has been further reduced as a result of the implementation of the PEU.
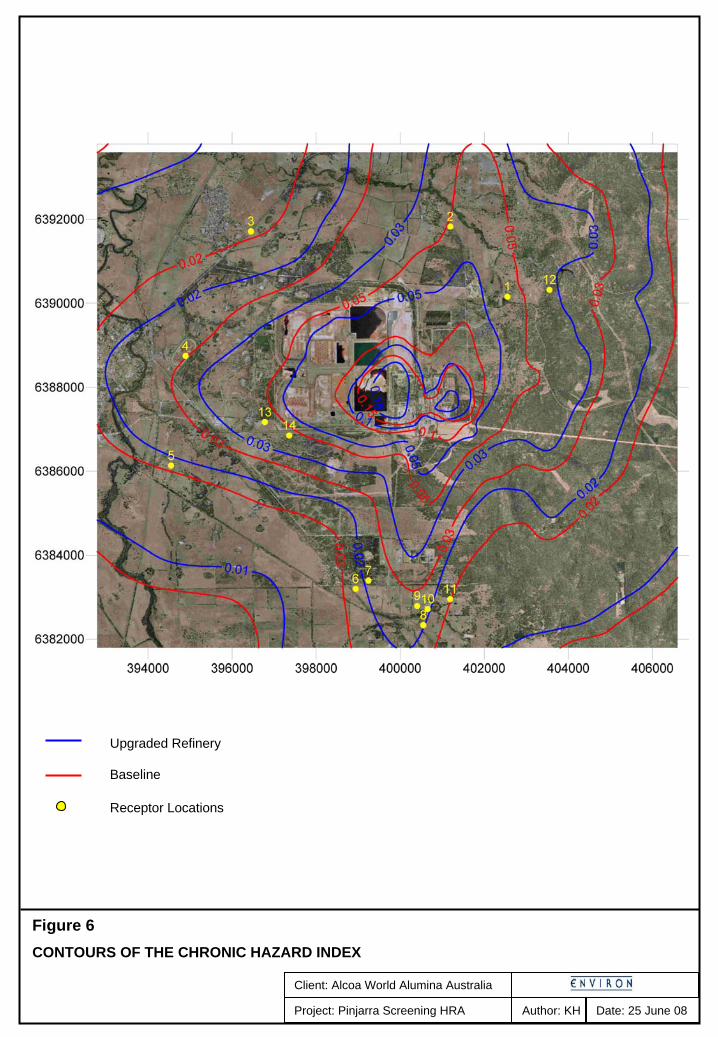
Figure 6 presents the contours of the calculated chronic HIs for the Baseline and Upgraded Refinery emission scenarios, overlain on an aerial photograph of the Pinjarra region. From Figure 6 it can be seen that a decrease is exhibited in the contours of the chronic HIs for the Upgraded Refinery emission scenarios compared to the Baseline. It can also be seen that the highest chronic HIs are predicted to occur in the immediate vicinity of the Pinjarra Refinery plant site and RDA.
Table 10 presents a summary of the percent contribution of the most significant compounds to the chronic HI calculated for the Upgraded Refinery at receptor 2 (maximally affected receptor) and receptor 3 (least affected receptor).
Alcoa World Alumina Australia 9 July 2008
Health Risk Screening Assessment of the Upgraded Pinjarra Refinery
Page 21
F I N A L
AS110256 X:\Projects_and_Clients\Alcoa of Australia\AS110256 Alcoa HRA Pinjarra\Report\AS110256_Upgraded Pinjarra Refinery_D0.doc
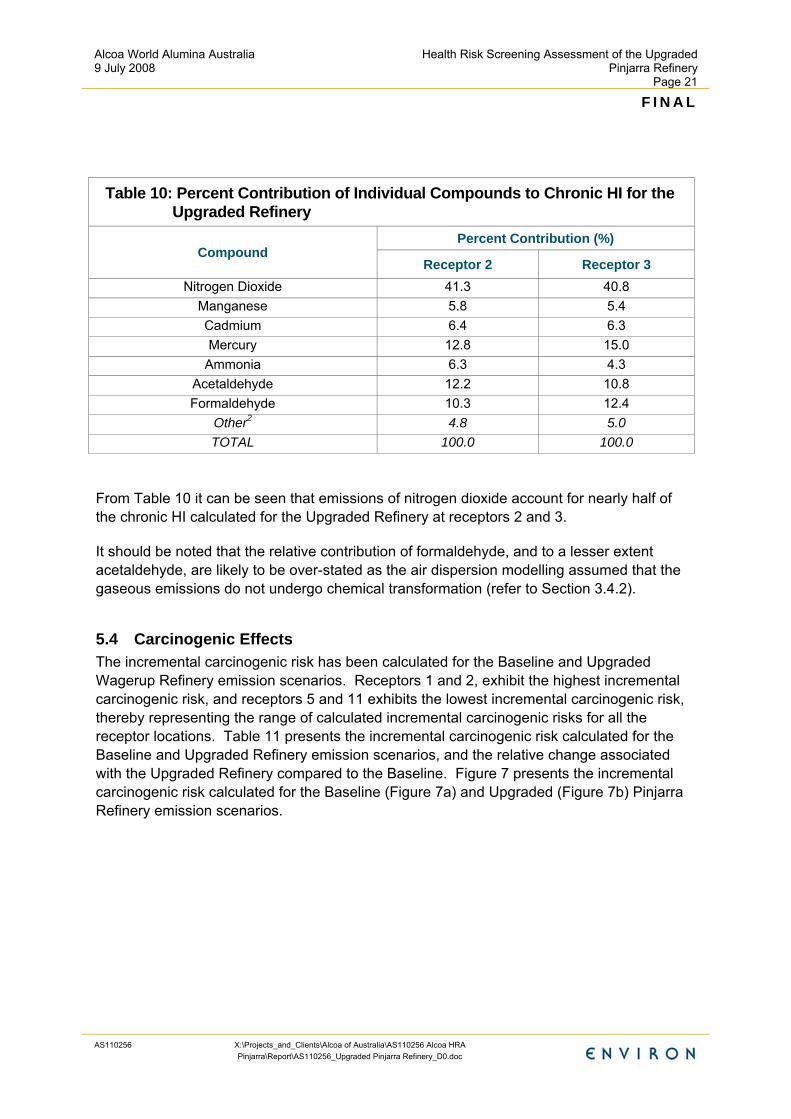
Table 10: Percent Contribution of Individual Compounds to Chronic HI for the Upgraded Refinery
From Table 10 it can be seen that emissions of nitrogen dioxide account for nearly half of the chronic HI calculated for the Upgraded Refinery at receptors 2 and 3.
It should be noted that the relative contribution of formaldehyde, and to a lesser extent acetaldehyde, are likely to be over-stated as the air dispersion modelling assumed that the gaseous emissions do not undergo chemical transformation (refer to Section 3.4.2).
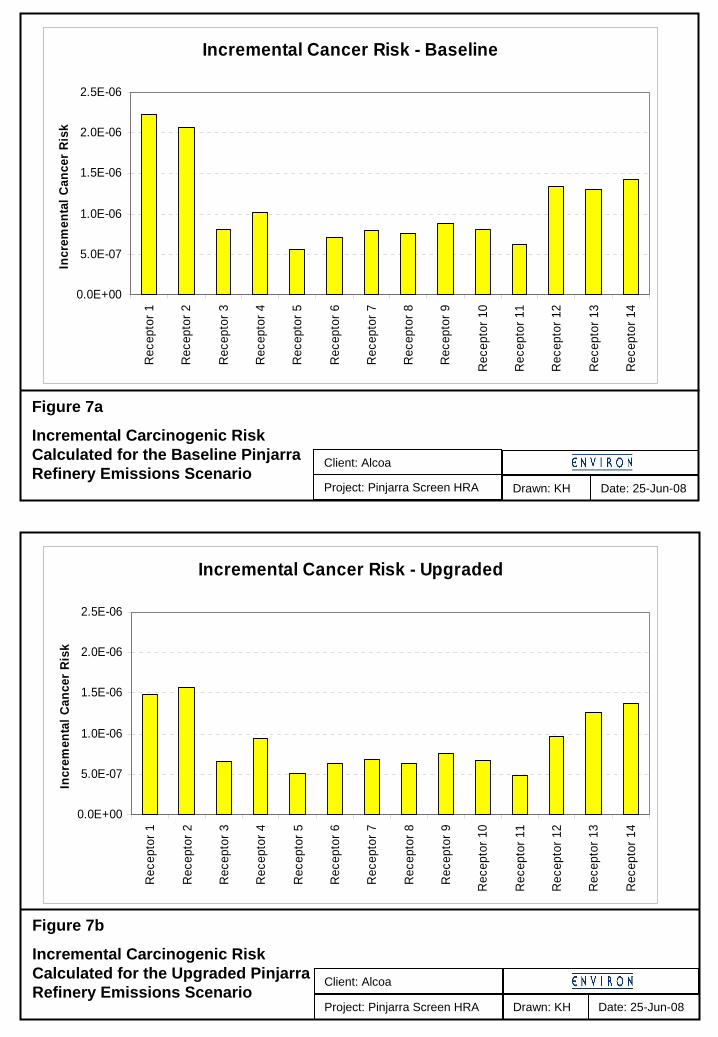
5.4 Carcinogenic Effects The incremental carcinogenic risk has been calculated for the Baseline and Upgraded Wagerup Refinery emission scenarios. Receptors 1 and 2, exhibit the highest incremental carcinogenic risk, and receptors 5 and 11 exhibits the lowest incremental carcinogenic risk, thereby representing the range of calculated incremental carcinogenic risks for all the receptor locations. Table 11 presents the incremental carcinogenic risk calculated for the Baseline and Upgraded Refinery emission scenarios, and the relative change associated with the Upgraded Refinery compared to the Baseline. Figure 7 presents the incremental carcinogenic risk calculated for the Baseline (Figure 7a) and Upgraded (Figure 7b) Pinjarra Refinery emission scenarios.
Alcoa World Alumina Australia 9 July 2008
Health Risk Screening Assessment of the Upgraded Pinjarra Refinery
Page 22
F I N A L
AS110256 X:\Projects_and_Clients\Alcoa of Australia\AS110256 Alcoa HRA Pinjarra\Report\AS110256_Upgraded Pinjarra Refinery_D0.doc
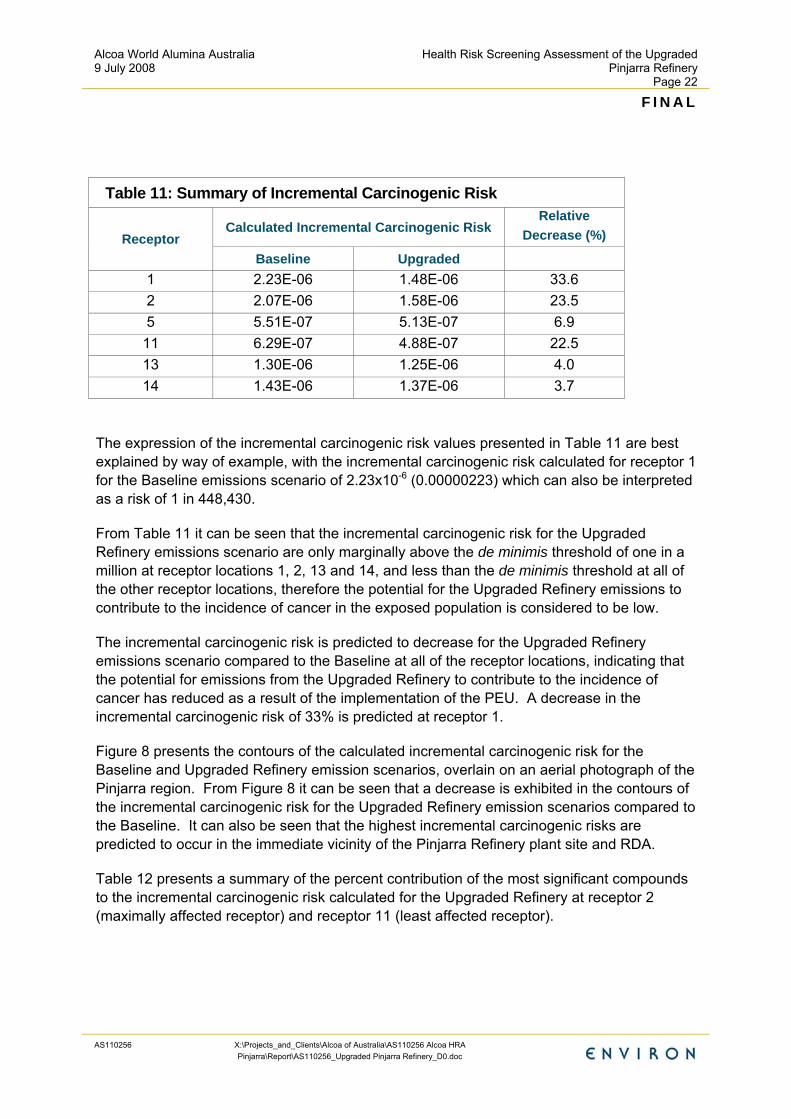
Table 11: Summary of Incremental Carcinogenic Risk
The expression of the incremental carcinogenic risk values presented in Table 11 are best explained by way of example, with the incremental carcinogenic risk calculated for receptor 1 for the Baseline emissions scenario of 2.23x10⁻⁶ (0.00000223) which can also be interpreted as a risk of 1 in 448,430.
From Table 11 it can be seen that the incremental carcinogenic risk for the Upgraded Refinery emissions scenario are only marginally above the de minimis threshold of one in a million at receptor locations 1, 2, 13 and 14, and less than the de minimis threshold at all of the other receptor locations, therefore the potential for the Upgraded Refinery emissions to contribute to the incidence of cancer in the exposed population is considered to be low.
The incremental carcinogenic risk is predicted to decrease for the Upgraded Refinery emissions scenario compared to the Baseline at all of the receptor locations, indicating that the potential for emissions from the Upgraded Refinery to contribute to the incidence of cancer has reduced as a result of the implementation of the PEU. A decrease in the incremental carcinogenic risk of 33% is predicted at receptor 1.
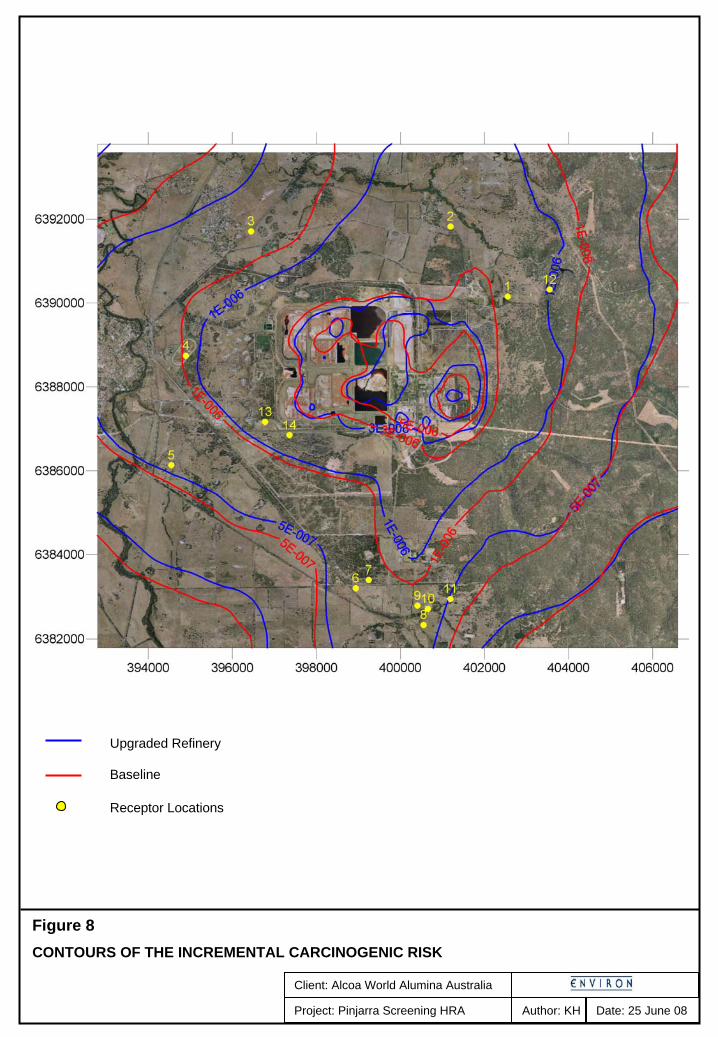
Figure 8 presents the contours of the calculated incremental carcinogenic risk for the Baseline and Upgraded Refinery emission scenarios, overlain on an aerial photograph of the Pinjarra region. From Figure 8 it can be seen that a decrease is exhibited in the contours of the incremental carcinogenic risk for the Upgraded Refinery emission scenarios compared to the Baseline. It can also be seen that the highest incremental carcinogenic risks are predicted to occur in the immediate vicinity of the Pinjarra Refinery plant site and RDA.
Table 12 presents a summary of the percent contribution of the most significant compounds to the incremental carcinogenic risk calculated for the Upgraded Refinery at receptor 2 (maximally affected receptor) and receptor 11 (least affected receptor).
Alcoa World Alumina Australia 9 July 2008
Health Risk Screening Assessment of the Upgraded Pinjarra Refinery
Page 23
F I N A L
AS110256 X:\Projects_and_Clients\Alcoa of Australia\AS110256 Alcoa HRA Pinjarra\Report\AS110256_Upgraded Pinjarra Refinery_D0.doc
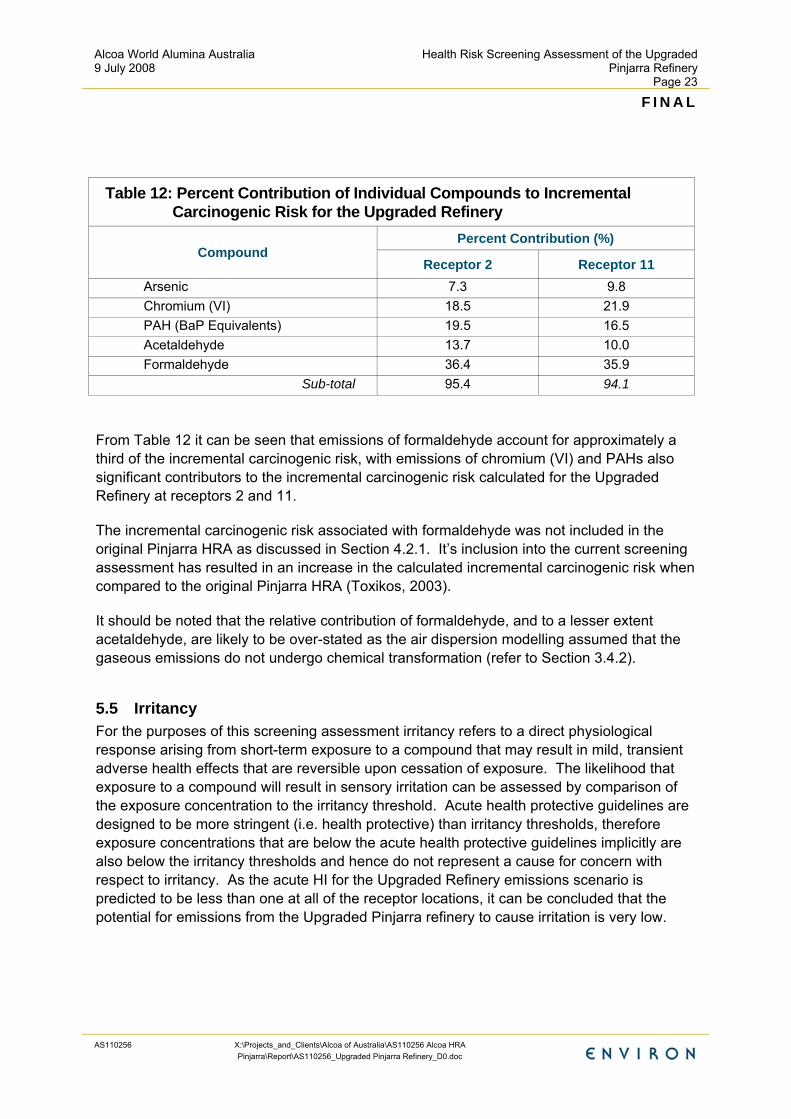
Table 12: Percent Contribution of Individual Compounds to Incremental Carcinogenic Risk for the Upgraded Refinery
From Table 12 it can be seen that emissions of formaldehyde account for approximately a third of the incremental carcinogenic risk, with emissions of chromium (VI) and PAHs also significant contributors to the incremental carcinogenic risk calculated for the Upgraded Refinery at receptors 2 and 11.
The incremental carcinogenic risk associated with formaldehyde was not included in the original Pinjarra HRA as discussed in Section 4.2.1. It’s inclusion into the current screening assessment has resulted in an increase in the calculated incremental carcinogenic risk when compared to the original Pinjarra HRA (Toxikos, 2003).
It should be noted that the relative contribution of formaldehyde, and to a lesser extent acetaldehyde, are likely to be over-stated as the air dispersion modelling assumed that the gaseous emissions do not undergo chemical transformation (refer to Section 3.4.2).
5.5 Irritancy For the purposes of this screening assessment irritancy refers to a direct physiological response arising from short-term exposure to a compound that may result in mild, transient adverse health effects that are reversible upon cessation of exposure. The likelihood that exposure to a compound will result in sensory irritation can be assessed by comparison of the exposure concentration to the irritancy threshold. Acute health protective guidelines are designed to be more stringent (i.e. health protective) than irritancy thresholds, therefore exposure concentrations that are below the acute health protective guidelines implicitly are also below the irritancy thresholds and hence do not represent a cause for concern with respect to irritancy. As the acute HI for the Upgraded Refinery emissions scenario is predicted to be less than one at all of the receptor locations, it can be concluded that the potential for emissions from the Upgraded Pinjarra refinery to cause irritation is very low.
Alcoa World Alumina Australia 9 July 2008
Health Risk Screening Assessment of the Upgraded Pinjarra Refinery
Page 24
F I N A L
AS110256 X:\Projects_and_Clients\Alcoa of Australia\AS110256 Alcoa HRA Pinjarra\Report\AS110256_Upgraded Pinjarra Refinery_D0.doc
5.6 Uncertainties Associated with Calculated Risks The risk assessment process relies on a set of assumptions and estimates with varying degrees of certainty and variability. Major sources of uncertainty in risk assessment include:
• natural variability (e.g., differences in body weight in a population);
• lack of knowledge about basic physical, chemical, and biological properties and processes;
• assumptions in the models used to estimate key inputs (e.g., air dispersion modelling, dose response models); and
• measurement error (e.g. in characterising emissions).
Perhaps the greatest single source of uncertainty in risk assessment is in the dose-response relationships for chemicals, particularly in relation to carcinogenic unit risks.
For this screening assessment, uniformly conservative assumptions have been used to ensure that potential exposures and associated health risks are over- rather than under-estimated. As a result of the compounding of conservatism, the quantitative risk indicators are considered to be upper-bound estimates, with the actual risk likely to be lower.
5.6.1 Emissions Characterisation and Quantification Uncertainty There is uncertainty associated with the identification and quantification of atmospheric emissions from the Pinjarra Refinery. The emission estimates were based on emissions testing results obtained by independent NATA accredited sampling contractors and analytical laboratories using appropriate techniques including quality control and quality assurance procedures. Alcoa believes that the uncertainty in emission rates associated with process variation is expected to be considerably lower now than at the time of the original PEU HRA, since the emissions monitoring database is now significantly larger resulting in lower inherent statistical uncertainty (Patrick Coffey pers comm. 3 July 2008).
5.6.2 Estimation of Exposure Concentration Uncertainty The air dispersion modelling was completed by Air Assessments. The assumptions used in the modelling are discussed in Air Assessment (2008) and have not been reviewed as part of this screening assessment.
The acute HIs were calculated based on the maximum, and 99.9th percentile 1-hour and 99.5th percentile 24-hour average predicted ground level concentrations. The maximum is predicted to occur once per year under the “worst-case” meteorological conditions and therefore provides the most conservative estimate of exposure concentrations. Concentrations in air at or above the 99.9 percentile 1-hour and 99.5 percentile 24-hour averages predicted ground level concentrations are predicted to occur for less than 0.5% of the time. Therefore, for the vast majority of the year, the potential acute health effects are expected to be less significant than the calculated acute HIs suggest.
Alcoa World Alumina Australia 9 July 2008
Health Risk Screening Assessment of the Upgraded Pinjarra Refinery
Page 25
F I N A L
AS110256 X:\Projects_and_Clients\Alcoa of Australia\AS110256 Alcoa HRA Pinjarra\Report\AS110256_Upgraded Pinjarra Refinery_D0.doc
5.6.3 Exposure Assumptions Uncertainty To calculate the incremental carcinogenic risk it has been assumed that residences located at the key receptor locations spend every hour of every day outdoors at that location for 70 years. Clearly, these exposure conditions are unlikely to be realised, because the actual exposure concentrations (of substances originating at the refinery) in the indoor environment is reasonably expected to be lower than experienced in outdoor air, and the exposure frequency (i.e. days per year) and exposure duration (years) likely to be considerably lower as people move about.
The screening assessment has been confined to exposure via the inhalation pathway, raising the possibility that the total exposure to specific compounds may have been underestimated.
The California Air Toxics Hot Spots Program Risk Assessment Guidelines (OEHHA, 2000) provides a list of compounds for which multi-pathway exposure needs to be assessed. The list has been developed based on a theoretical model for the portioning of the exchangeable fraction of an airborne compound between the vapour and particulate phases in the ambient air. The compounds tending towards the particulate phase have been identified as the most likely candidates for multi-pathway exposure as they will tend to deposit on to surfaces (e.g. soil and crops) and be available for ingestion. Compounds emitted from the Pinjarra Refinery that appear in the Air Toxics Hot Spots list of compounds requiring multi-pathway exposure assessment include:
• arsenic;
• cadmium;
• chromium (VI);
• mercury;
• nickel;
• dioxins and furans; and
• PAHs with three rings or greater.
The Californian Hot Spots Analysis and Reporting Program (HARP) was developed to assess the potential significance of multi-pathway exposure. Previous application of the HARP program as part of an assessment of the Pinjarra RDA (ENVIRON, 2004) found that non-inhalation exposure pathways were likely to be significant for arsenic and cadmium. However further assessment reported in the Wagerup ERMP HRA (ENVIRON, 2005) and the Pinjarra Refinery RDA Particulates HRA (ENVIRON, 2007) concluded that the alternative exposure pathways were not expected to have a significant impact for any of the identified receptors.
Alcoa World Alumina Australia 9 July 2008
Health Risk Screening Assessment of the Upgraded Pinjarra Refinery
Page 26
F I N A L
AS110256 X:\Projects_and_Clients\Alcoa of Australia\AS110256 Alcoa HRA Pinjarra\Report\AS110256_Upgraded Pinjarra Refinery_D0.doc
5.6.4 Toxicity Assessment Uncertainty The primary uncertainties associated with the toxicity assessment are related to the derivation of the health protective guidelines. Health protective guidelines published by reputable authorities have been applied for this assessment, which have been derived by applying various conservative (i.e. health protective) assumptions. The extrapolation of animal bioassay results or occupational exposure studies to human risk at much lower levels of exposure involves a number of assumptions regarding effect threshold, interspecies extrapolation, high- to low-dose extrapolation, and route-to-route extrapolation. The scientific validity of these assumptions is uncertain; because each of the individual extrapolations are intended to prevent underestimation of risk, in concert they result in unquantifiable but potentially very significant overestimation of risk.
5.6.5 Risk Characterisation Uncertainty It should be noted that the summing of the quantitative risk indicators for individual compounds to calculate the overall risk from exposure to multiple compounds does not take into account that different compounds can target different organs and therefore the potential health risk arising from exposure to multiple compounds is not necessarily additive, nor does it account for potential antagonistic or synergistic effects. However, the additive approach is considered to be appropriate for screening assessment purposes, and is considered to be conservative (i.e. health protective) in most circumstances.
Alcoa World Alumina Australia 9 July 2008
Health Risk Screening Assessment of the Upgraded Pinjarra Refinery
Page 27
F I N A L
AS110256 X:\Projects_and_Clients\Alcoa of Australia\AS110256 Alcoa HRA Pinjarra\Report\AS110256_Upgraded Pinjarra Refinery_D0.doc
6 Summary ENVIRON has conducted a screening assessment of the potential health risks arising from atmospheric emissions from the Pinjarra Refinery, considering the potential risks associated with a Baseline and an Upgraded Refinery emissions scenario, defined as follows:
• Baseline emissions scenario representative of emissions from the Pinjarra Refinery operating at an alumina production rate of approximately 3.5 Mtpa, prior to the commencement of the Pinjarra Efficiency Upgrade (PEU) project. Although it was not operating at the time, the Baseline emissions scenario included the Alinta Pinjarra cogeneration plant to remain consistent with original PEU HRA; and
• Upgraded Refinery emissions scenario representative of emissions from the Pinjarra Refinery operating at an alumina production rate of approximately 4.2 Mtpa, following implementation of the PEU project.
Quantitative health risk indicators were calculated for exposure via the inhalation pathway to atmospheric emissions from the Pinjarra Refinery in isolation, and therefore did not take into account the alternative exposure pathways (e.g. ingestion, dermal absorption), nor other sources of atmospheric emissions of these compounds. The following quantitative health risk indicators were calculated for key receptors located in the vicinity of the Pinjarra Refinery:
• acute HI;
• chronic HI; and
• incremental carcinogenic risk.
Based upon the results of the screening health risk assessment it can be concluded that:
• the inclusion of the fugitive emission sources (i.e. RDA and Bauxite stockpile area) resulted in PM10 being a more significant contributor to the Acute HIs than it was in the original PEU;
• the potential for emissions from the Upgraded Pinjarra Refinery to cause acute or chronic non-carcinogenic health effects is low;
• the potential for emissions from the Baseline or Upgraded Pinjarra Refinery to contribute to the incidence of cancer in the exposed population is low. The USEPA de minimis level is predicted to be exceeded by a small amount at a few receptors for both the Baseline and Upgraded Refinery emission scenarios, but with decreases in ICR predicted at all receptors following the upgrade; and
• implementation of the PEU is predicted to result in a decrease in the acute HI and chronic HI of between 11 and 18% and 21 and 26% respectively, and a decrease in the incremental carcinogenic risk of between 4 and 33%, for the receptor locations considered.
Alcoa World Alumina Australia 9 July 2008
Health Risk Screening Assessment of the Upgraded Pinjarra Refinery
Page 28
F I N A L
AS110256 X:\Projects_and_Clients\Alcoa of Australia\AS110256 Alcoa HRA Pinjarra\Report\AS110256_Upgraded Pinjarra Refinery_D0.doc
This screening assessment has not attempted to make quantitative risk conclusions for dioxins and furans, for the following reasons:
• The only emissions in which dioxins have been detected was in the oxalate kiln stack before the upgrade, and then in very small amounts such that the refinery was a measurable but negligible source of dioxins based on the original HRA; and
• The dioxin emissions from the oxalate kiln have been eliminated by reagent substitution (Alcoa, 2005) and the installation of the RTO.
As with any risk evaluation, there are areas of uncertainty in this screening assessment. To ensure that potential risks are not underestimated, uniformly conservative assumptions have been used to characterise exposure and toxicity. Due to the resultant compounding of conservatism, the quantitative risk indicators should be considered as over-estimates of potential health risks associated with emissions from the Pinjarra Refinery.
Alcoa World Alumina Australia 9 July 2008
Health Risk Screening Assessment of the Upgraded Pinjarra Refinery
Page 29
F I N A L
AS110256 X:\Projects_and_Clients\Alcoa of Australia\AS110256 Alcoa HRA Pinjarra\Report\AS110256_Upgraded Pinjarra Refinery_D0.doc
7 References Air Assessments. 2008. “Pinjarra Refinery Air Quality Modelling for the 2008 HRA”, June 2008.
Alcoa. 2005 “Elimination of Specific Dioxin and Furan Emissions from Pinjarra Oxalate Kiln by the Reformulation of Process Additives” Authors Marisa Ioppolo-Armanios and Ian Harrison, Alcoa Technology Delivery Group. Internal report/memorandum to Alcoa World Alumina Australia, October 2005
CSIRO 2005. “Meteorological and Dispersion Modelling Using TAPM for Wagerup Phase 3A: HRA (Health Risk Assessment) Concentration Modelling – Current Emission Scenario Final Report” Prepared for Prepared for Alcoa World Alumina Australia by CSIRO Atmospheric Research, Report C/0986, 14 February 2005
Department of Environment and Heritage (DEH). 2004. Dioxins in Australia: A Summary of the Findings of Studies Conducted from 2001 to 2004”, May 2004.
Ecowise Environmental 2007. “Evaluation of Dust Emissions Monitoring Report, Dec 2005 – Dec 2006.” Prepared for Alcoa World Alumina Australia
ENVIRON Australia 2003. “Pinjarra Refinery Efficiency Upgrade: Air Quality Data Environmental Protection Statement”, 28 October 2003.
ENVIRON Australia and Benchmark Toxicology Services. (ENVIRON and Benchmark). 2005. “Health Risk Assessment of Atmospheric Emissions Expansion of Wagerup refinery to 4.7 MTPA”, 19 April 2005.
ENVIRON Australia 2004. “Screening Level Multi-Pathway Exposure Assessment For The Pinjarra Refinery Residue Disposal Area.” Prepared for Alcoa World Alumina Australia, August 2004. Unpublished report.
ENVIRON Australia 2005. “Health Risk Assessment of Atmospheric Emissions. Expansion of Wagerup Refinery to 4.7 Mtpa.” Prepared for Alcoa World Alumina Australia, April 2005.
ENVIRON Australia 2007. “Screening Health Risk Assessment of Particulate Emissions From Alcoa’s Pinjarra Refinery Residue Disposal Area.” Prepared for Ecowise Environmental Pty Ltd. October 2007.
Hanna, S.R., Briggs, G.A., and Hosker, R.P. 1982, Handbook on Atmospheric Diffusion, DOE/TIC-11223, 91982.
National Environment Protection Council (NEPC). 1998. “National Environment Protection Measure for Ambient Air Quality”, 26 June 1998.
National Environment Protection Council (NEPC). 2004. “National Environment Protection (Air Toxics) Measure”, April 2004.
Alcoa World Alumina Australia 9 July 2008
Health Risk Screening Assessment of the Upgraded Pinjarra Refinery
Page 30
F I N A L
AS110256 X:\Projects_and_Clients\Alcoa of Australia\AS110256 Alcoa HRA Pinjarra\Report\AS110256_Upgraded Pinjarra Refinery_D0.doc
National Institute of Public Health and the Environment (RIVM). 2001. “Re-evaluation of human-toxicological maximum permissible risk levels (RIVM report 711701 025)”, A.J. Baars, R.M.C. Theelen, P.J.C.M. Janssen, J.M. Hesse, M.E. van Apeldoorn, M.C.M. Meijerink, L. Verdam, M.J. Zeolmaker,, March 2001.
Office of Environmental Health Hazard Assessment (OEHHA). 2000. “Air Toxics Hot Spots Program Risk Assessment Guidelines Part IV Technical Support Document Exposure Assessment and Stochastic Analysis”, September 2000.
Toxikos Pty Ltd (Toxikos). 2003. “Health Risk and Toxicological Assessment of Emissions from the Upgraded Alcoa Pinjarra Alumina Refinery”, 14 November 2003.
WA Minister for the Environment, Ministerial Statement 000646, Condition 8.2, 3 March 2004.
World Health Organisation (WHO). 2000. “Air Quality Guidelines for Europe – Second Edition”, 2000.
World Health Organisation International Programme on Chemical Safety (WHO). 1998. “Environmental Health Criteria 202. Selected Non-Heterocyclic Polycyclic Aromatic Hydrocarbons”, 1998.
Health Risk Screening Assessment of the Upgraded Pinjarra Refinery
Page 31
F I N A L
AS110256 X:\Projects_and_Clients\Alcoa of Australia\AS110256 Alcoa HRA Pinjarra\Report\AS110256_Upgraded Pinjarra Refinery_D0.doc
8 Limitations Environ Australia prepared this report in accordance with the scope of work as outlined in our proposal to Alcoa World Alumina Australia dated 3 May 2006 and in accordance with our understanding and interpretation of current regulatory standards.
The conclusions presented in this report represent ENVIRON’s professional judgement based on information made available during he course of this assignment and are true and correct to the best of ENVIRON’s knowledge as at the date of the assessment.
ENVIRON did not independently verify all of the written or oral information provided to ENVIRON during the course of this investigation. While ENVIRON has no reason to doubt the accuracy of the information provided to it, the report is complete and accurate only to the extent that the information provided to ENVIRON was itself complete and accurate.
This report does not purport to give legal advice. This advice can only be given by qualified legal advisors.
8.1 User Reliance This report has been prepared exclusively for Alcoa World Alumina Australia and may not be relied upon by any other person or entity without ENVIRON’s express written permission.
Alcoa World Alumina Australia 9 July 2008
Health Risk Screening Assessment of the Upgraded Pinjarra Refinery
Page 32
F I N A L
AS110256 X:\Projects_and_Clients\Alcoa of Australia\AS110256 Alcoa HRA Pinjarra\Report\AS110256_Upgraded Pinjarra Refinery_D0.doc
Alcoa World Alumina Australia 9 July 2008
Health Risk Screening Assessment of the Upgraded Pinjarra Refinery
F I N A L
AS110256
Figures
Alcoa World Alumina Australia 9 July 2008
Health Risk Screening Assessment of the Upgraded Pinjarra Refinery
F I N A L
AS110256
Figure 1LOCATION OF RECEPTORS IN RELATION TO THE PINJARRA REFINERY
Client: Alcoa World Alumina Australia
Author: KHProject: Pinjarra Screening HRA Date: 25 June 08
Receptor Locations
Pinjarra Refinery Plant Site
Residue Disposal Area
Drawn: TJF
Client: Alcoa
Project: Pinjarra Screen HRA Date: 17-Jun-08
Figure 2b
Acute Hazard Index Calculated for the Upgraded Pinjarra Refinery Emissions Scenario
Drawn: TJF
Client: Alcoa
Project: Pinjarra Screen HRA Date: 17-Jun-08
Figure 2a
Acute Hazard Index Calculated for the Baseline Pinjarra Refinery Emissions Scenario
Acute Hazard Index - Baseline
0.0
0.2
0.4
0.6
0.8
1.0
1.2
1.4
Rec
epto
r 1
Rec
epto
r 2
Rec
epto
r 3
Rec
epto
r 4
Rec
epto
r 5
Rec
epto
r 6
Rec
epto
r 7
Rec
epto
r 8
Rec
epto
r 9
Rec
epto
r 10
Rec
epto
r 11
Rec
epto
r 12
Rec
epto
r 13
Rec
epto
r 14
Acu
te H
azar
d In
dex
Max
99.9% 1hr &99.5% 24hr
Acute Hazard Index - Upgraded
0.0
0.2
0.4
0.6
0.8
1.0
1.2
1.4
Rec
epto
r 1
Rec
epto
r 2
Rec
epto
r 3
Rec
epto
r 4
Rec
epto
r 5
Rec
epto
r 6
Rec
epto
r 7
Rec
epto
r 8
Rec
epto
r 9
Rec
epto
r 10
Rec
epto
r 11
Rec
epto
r 12
Rec
epto
r 13
Rec
epto
r 14
Acu
te H
azar
d In
dex
Max
99.9% 1hr &99.5% 24hr
Figure 3CONTOURS OF THE ACUTE HAZARD INDEX (Calculated from the Maximum Predicted Ground Level Concentrations)
Client: Alcoa World Alumina Australia
Author: KHProject: Pinjarra Screening HRA Date: 25 June 08
Receptor Locations
Upgraded Refinery
Baseline
Figure 4
CONTOURS OF THE ACUTE HAZARD INDEX (Calculated from the 99.9 Percentile 1-hour Average and 99.5 Percentile 24-hour Average Predicted Ground Level Concentrations)
Client: Alcoa World Alumina Australia
Author: KHProject: Pinjarra Screening HRA Date: 25 June 08
Receptor Locations
Upgraded Refinery
Baseline
Drawn: TJF
Client: Alcoa
Project: Pinjarra Screen HRA Date: 17-Jun-08
Figure 5b
Chronic Hazard Index Calculated for the Upgraded Pinjarra Refinery Emissions Scenario
Drawn: TJF
Client: Alcoa
Project: Pinjarra Screen HRA Date: 17-Jun-08
Figure 5a
Chronic Hazard Index Calculated for the Baseline Pinjarra Refinery Emissions Scenario
Chronic Hazard Index - Baseline
0.00
0.01
0.02
0.03
0.04
0.05
0.06
Rec
epto
r 1
Rec
epto
r 2
Rec
epto
r 3
Rec
epto
r 4
Rec
epto
r 5
Rec
epto
r 6
Rec
epto
r 7
Rec
epto
r 8
Rec
epto
r 9
Rec
epto
r 10
Rec
epto
r 11
Rec
epto
r 12
Rec
epto
r 13
Rec
epto
r 14
Chr
onic
Haz
ard
Inde
x
Chronic Hazard Index - Upgraded
0.00
0.01
0.02
0.03
0.04
0.05
0.06
Rec
epto
r 1
Rec
epto
r 2
Rec
epto
r 3
Rec
epto
r 4
Rec
epto
r 5
Rec
epto
r 6
Rec
epto
r 7
Rec
epto
r 8
Rec
epto
r 9
Rec
epto
r 10
Rec
epto
r 11
Rec
epto
r 12
Rec
epto
r 13
Rec
epto
r 14
Chr
onic
Haz
ard
Inde
x
Figure 6CONTOURS OF THE CHRONIC HAZARD INDEX
Client: Alcoa World Alumina Australia
Author: KHProject: Pinjarra Screening HRA Date: 25 June 08
Receptor Locations
Upgraded Refinery
Baseline
Drawn: KH
Client: Alcoa
Project: Pinjarra Screen HRA Date: 25-Jun-08
Figure 7b
Incremental Carcinogenic Risk Calculated for the Upgraded Pinjarra Refinery Emissions Scenario
Drawn: KH
Client: Alcoa
Project: Pinjarra Screen HRA Date: 25-Jun-08
Figure 7a
Incremental Carcinogenic Risk Calculated for the Baseline Pinjarra Refinery Emissions Scenario
Incremental Cancer Risk - Upgraded
0.0E+00
5.0E-07
1.0E-06
1.5E-06
2.0E-06
2.5E-06
Rec
epto
r 1
Rec
epto
r 2
Rec
epto
r 3
Rec
epto
r 4
Rec
epto
r 5
Rec
epto
r 6
Rec
epto
r 7
Rec
epto
r 8
Rec
epto
r 9
Rec
epto
r 10
Rec
epto
r 11
Rec
epto
r 12
Rec
epto
r 13
Rec
epto
r 14
Incr
emen
tal C
ance
r R
isk
Incremental Cancer Risk - Baseline
0.0E+00
5.0E-07
1.0E-06
1.5E-06
2.0E-06
2.5E-06
Rec
epto
r 1
Rec
epto
r 2
Rec
epto
r 3
Rec
epto
r 4
Rec
epto
r 5
Rec
epto
r 6
Rec
epto
r 7
Rec
epto
r 8
Rec
epto
r 9
Rec
epto
r 10
Rec
epto
r 11
Rec
epto
r 12
Rec
epto
r 13
Rec
epto
r 14
Incr
emen
tal C
ance
r Ris
k
Figure 8CONTOURS OF THE INCREMENTAL CARCINOGENIC RISK
Client: Alcoa World Alumina Australia
Author: KHProject: Pinjarra Screening HRA Date: 25 June 08
Receptor Locations
Upgraded Refinery
Baseline
Alcoa World Alumina Australia 9 July 2008
Health Risk Screening Assessment of the Upgraded Pinjarra Refinery
F I N A L
AS110256
Appendix A Tabulated Data and Results
(Tables A.1 – A.8)
Alcoa World Alumina Australia 9 July 2008
Health Risk Screening Assessment of the Upgraded Pinjarra Refinery
F I N A L
AS110256
Atmospheric Emissions Screening AssessmentExpansion of the Pinajrra RefineryAlcoa World Alumina Australia
9 July 2008Appendix A
Page 1
TABLE A.1: COMPOUND LIST AND REFINERY TOTAL MASS EMISSION ESTIMATES (1)
(2) Polycyclic Aromatic Hydrocarbons (PAHs) reported as Benzo[a]pyrene (BaP) Equivalents.(3) Dioxin and Furan emissions reported as International Toxic Equivalents (ITEQ) in accordance with the NATO Toxic Equivalence Factors.
(1) Total mass emission rate for the Pinjarra Refinery sources only (i.e. excludes emissions from the RDA and bauxite areas).Notes
Baseline Pinjarra Refinery Emissions (g/s)
Upgraded Pinjarra Refinery Emissions (g/s)
No. CAS No. or Code Compound Name
X:\Projects_and_Clients\Alcoa of Australia\AS110256 Alcoa HRA Pinjarra\Report\Pinjarra Tables.xls ENVIRON
Atmospheric Emissions Screening AssessmentExpansion of the Pinajrra RefineryAlcoa World Alumina Australia
9 July 2008Appendix A
Page 2
1
X:\Projects_and_Clients\Alcoa of Australia\AS110256 Alcoa HRA Pinjarra\Report\Pinjarra Tables.xls ENVIRON
Atmospheric Emissions Screening AssessmentExpansion of the Pinajrra RefineryAlcoa World Alumina Australia
9 July 2008Appendix A
Page 3
TABLE A.2: BASE AVERAGE EMISSION RATES REFINERY SOURCES (g/s)
1.80E-03 per µg/m3 IRIS4.00E-02 per µg/m3 WHO3.80E-04 per µg/m3 WHO
8.70E-02 per µg/m3 WHO
9.00E-07 per µg/m3 WHO1.30E-05 per µg/m3 IRIS
6.00E-06 per µg/m3 WHO
Carcinogenic Health Effects
X:\Projects_and_Clients\Alcoa of Australia\AS110256 Alcoa HRA Pinjarra\Report\Pinjarra Tables.xls ENVIRON
Atmospheric Emissions Screening AssessmentExpansion of the Pinajrra RefineryAlcoa World Alumina Australia
9 July 2008Appendix A
Page 14
TABLE A.6: HEALTH PROTECTIVE GUIDELINES
Notes:
Blanks in the table indicate that no applicable guideline was able to be identified.NEPC: National Environment Protection (Ambient Air Quality) Measure (NEPC, 1998)NEPC (AT): National Environment Protection (Air Toxics) Measure, (NEPC, 2004)WHO: World Health Organisation (WHO) Air Quality Guidelines for Europe Second Edition (2000)WHOa: EHC 167 Environmental Health Criteria 167 Acetaldehyde, International Programme on Chemical Safety (WHO, 1995)OEHHA: California Office of Environmental Health Hazard Assessment’s (OEHHA) Toxicity Criteria DatabaseATSDR: U.S. Agency for Toxic Substances and Disease Registry’s (ATSDR) Minimal Risk Levels (MRLs) for Hazardous SubstancesIRIS: U.S. Environment Protection Agency’s (USEPA) Integrated Risk Information System (IRIS)RIVM: Dutch National Institute of Public Health and the Environment (RIVM) human-toxicological Maximum Permissible Risk Levels (2001)
X:\Projects_and_Clients\Alcoa of Australia\AS110256 Alcoa HRA Pinjarra\Report\Pinjarra Tables.xls ENVIRON
Atmospheric Emissions Screening AssessmentExpansion of the Pinajrra RefineryAlcoa World Alumina Australia
9 July 2008Appendix A
Page 15
No CAS # / ID Compound Name Max99.9% 1hr & 99.5% 24hr Max
Contribution to the Incremental Carcinogenic Risk - Baseline Emissions Scenario (%)
Contribution to the Incremental Carcinogenic Risk - Upgraded Emissions Scenario (%)
X:\Projects_and_Clients\Alcoa of Australia\AS110256 Alcoa HRA Pinjarra\Report\Pinjarra Tables.xls ENVIRON
Alcoa World Alumina Australia 9 July 2008
Health Risk Screening Assessment of the Upgraded Pinjarra Refinery
F I N A L
AS110256
Appendix B Approach Used to Derive Exposure
Concentrations
Alcoa World Alumina Australia 9 July 2008
Health Risk Screening Assessment of the Upgraded Pinjarra Refinery
F I N A L
AS110256
Alcoa World Alumina Australia 9 July 2008
Health Risk Screening Assessment of the Upgraded Pinjarra Refinery
Page B-1
F I N A L
AS110256
B1. POST PROCESSING OF MODELLING FILES
The air dispersion modelling for this screening Heath Risk Assessment (HRA) was conducted by Air Assessments (2008) using the CALPUFF model. The results of the air dispersion modelling were provided to ENVIRON as a number of CALPUFF output files for the Baseline and Upgraded Refinery average and peak emission cases as follows:
• For the Pinjarra Refinery point sources, the CALPUFF files contained the predicted ground level concentrations (GLCs) for the average and peak emission scenarios for each source modelled in the Refinery Baseline and Upgraded cases. The concentrations were based on an emission rate of 1 g/s from each source; and
• For the Pinjarra Refinery fugitive sources, the CALPUFF files contained the predicted GLCs for acetaldehyde, acetone, PAHs (as BaP Equivalents), benzene, mercury, toluene, xylene and PM10 from the Residue Disposal Area (RDA) and the bauxite stockpile areas.
ENVIRON read the CALPUFF files provided by Air Assessments and produced individual files that contained the predicted GLCs for each hour of the year for each grid point for each source (for the refinery) or compound (for the fugitive sources).
The predicted ground level concentrations for each compound were then calculated by:
• Scaling the GLCs predicted for each source (based on a unit emission rate) by the actual emission rate of that compound from the source (based on the emission rates presented in Tables A.2 to A.5 in Appendix A);
• Summing the scaled concentrations from each source for each hour and grid point;
• Including the GLCs predicted for the fugitive sources where they were modelled; and
• Writing the total concentrations (i.e. point and fugitive sources) calculated from the predicted GLCs for each compound to a separate file that contained the predicted concentration for each hour and for each grid point throughout the modelled year.
Variations to the above approach were required for the prediction of the ambient nitrogen dioxide concentrations and for determining the concentrations of selected metals in the fugitive (i.e. RDA and bauxite stockpile areas) PM10 concentrations as follows:
• For emissions of oxides of nitrogen:
the initial NO2/NOX ratio was set at 13% based on the results of emissions testing and the remainder of the emissions (i.e. 87%) were assumed to be nitric oxide (NO).
For each hour, the predicted concentration of NO and NO2 were calculated separately based on the contribution from each source and the initial NO2/NOX ratio.
When all emission sources for the hour had been process, the predicted NO concentration at each grid point was used in conjunction with the ozone
Alcoa World Alumina Australia 9 July 2008
Health Risk Screening Assessment of the Upgraded Pinjarra Refinery
Page B-2
F I N A L
AS110256
limiting method to calculate the amount of NO2 that would be formed from the NO in the presence of ozone (O3) as follows:
NO2photo = minimum (NO, O3) (in parts per million)
where NO2photo = NO2 concentration formed by the oxidation of NO by ozone
O3 = ambient ozone concentration for that hour.
The ambient ozone concentrations were varied for each hour of the day and based on ambient monitoring data collected at Wagerup as presented in CSIRO (2005) and tabulated below:
The total NO2 concentration was then calculated as the sum of the primary NO2 concentration (i.e. the GLC associated with the percentage of NOx emitted as NO2) and the secondary NO2 (i.e. NO2photo) for each hour and each grid point and written to the output file.
• For metals contained in the fugitive dust emissions:
the PM10 concentrations for each hour and grid point were modelled separately for the RDA and bauxite stockpiles.
The concentrations of metals in the PM10 was then calculated based on the metal concentrations derived during the Pinjarra RDA dust study (Ecowise, 2007; ENVIRON 2007). The multiplication factors determined in that study are as follows:
Ozone Concentration (ppb) for each Hour of the DayHour Ozone Hour Ozone Hour Ozone Hour Ozone
Health Risk Screening Assessment of the Upgraded Pinjarra Refinery
Page B-3
F I N A L
AS110256
Note that the Chromium VI factor in the above table is based on testing completed since the 2007 studies and was provided by Alcoa (Patrick Coffey pers comm., 7 May 2008).
The predicted metals GLCs from the fugitive sources were added to the predicted metal GLCs from the Refinery point sources and written to the output file for each hour and each grid point.
The files that contained the predicted concentrations for each individual compound for each hour of the year and for each grid point were then analysed to produce the following statistics for each grid point:
• Maximum 1-hour average GLC; • 99.9th percentile (i.e. 9th highest) 1-hour average GLC; • 99.5th percentile (i.e. 44th highest) 1-hour average GLC; • Maximum 24-hour average GLC; • 99.5th percentile (i.e. 2nd highest) 24-hour average GLC; • 95th percentile (i.e. 18th highest) 24-hour average GLC; and • Annual average GLC.
The predicted maximum 1-hour, 99.9th 1-hour, maximum 24-hour, 99.5th 24-hour and annual averaged concentrations for each of the 14 receptor points are presented in Tables B.1 to B.5 for the Baseline and Upgraded Refinery average and peak emissions.
The screening HRA used the predicted GLC statistics to calculate the individual hazard quotients and the total hazard index for the acute non-carcinogenic exposures based on the peak emission rates. The predicted annual average GLCs were used to calculate the chronic non-carcinogenic and carcinogenic exposures based on the average emission rates.
B2. PREDICTED GROUND LEVEL CONCENTRATIONS OF NITROGEN DIOXIDE AND PM10
Table B.6 and Figures B.1 and B.2 presents the predicted maximum and second highest 1-hour average GLCs of nitrogen dioxide for each of the 14 receptors. Table B.6 and Figures B.3 and B.4 presents the predicted maximum and fifth highest 24-hour average GLCs of PM10.
The ambient air quality standards and goals for nitrogen dioxide and PM10 defined in the National Environmental Protection Measure (NEPM) for Ambient Air Quality (NEPC, 1998), are also presented in Table B.6.
The results presented in Table B.6 show that the Air NEPM standards for nitrogen dioxide and PM10 are not predicted to be exceeded at any of the 14 receptors. Figures B.1 and B.2 show that there are no predicted exceedences of the NEPM standard for nitrogen dioxide across the model domain.
Alcoa World Alumina Australia 9 July 2008
Health Risk Screening Assessment of the Upgraded Pinjarra Refinery
Page B-4
F I N A L
AS110256
Figure B3 shows that the maximum 24-hour average ground level concentrations of PM10 are predicted to exceed the NEPM standard in areas in the immediate vicinity of the RDA and Bauxite stockpile areas. Figure B.4 shows that the fifth highest 24-hour average ground level concentration of PM10 is predicted to exceed the NEPM goal (i.e. five exceedences of the standard per year) but these are highly localised, occur on or immediately adjacent to the RDA and Bauxite stockpile areas, and are wholly contained within Alcoa's property. The NEPM goal is complied with everywhere beyond Alcoa's property.
Figure B.1MAXIMUM PREDICTED 1-HOUR AVERAGE GROUND LEVEL CONCENTRATIONS OF NITROGEN DIOXIDE (µg/m3) (Calculated from the Peak Emission rates)
Client: Alcoa World Alumina Australia
Author: BBProject: Pinjarra Screening HRA Date: 6 July 08
Receptor Locations
Upgraded Refinery
Baseline
Figure B.2SECOND HIGHEST PREDICTED 1-HOUR AVERAGE GROUND LEVEL CONCENTRATIONS OF NITROGEN DIOXIDE (µg/m3) (Calculated from the Peak Emission rates)
Client: Alcoa World Alumina Australia
Author: BBProject: Pinjarra Screening HRA Date: 6 July 08
Receptor Locations
Upgraded Refinery
Baseline
Figure B.3MAXIMUM PREDICTED 24-HOUR AVERAGE GROUND LEVEL CONCENTRATIONS OF PM10 (µg/m3) (Calculated from the Peak Emission rates)
Client: Alcoa World Alumina Australia
Author: BBProject: Pinjarra Screening HRA Date: 6 July 08
Receptor Locations
Upgraded Refinery
Baseline
Figure B.4FIFTH HIGHEST PREDICTED 24-HOUR AVERAGE GROUND LEVEL CONCENTRATIONS OF PM10 (µg/m3) (Calculated from the Peak Emission rates)
Client: Alcoa World Alumina Australia
Author: BBProject: Pinjarra Screening HRA Date: 6 July 08
Receptor Locations
Upgraded Refinery
Baseline
Atmospheric Emissions Screening AssessmentExpansion of the Pinajrra RefineryAlcoa World Alumina Australia