Health worker preferences for job attributes in Ethiopia: Results from a discrete choice experiment 12 Kara Hanson London School of Hygiene and Tropical Medicine William Jack Georgetown University April 23, 2008 1 This is a preliminary draft, not for citation. 2 The survey for this study was nanced by a grant from the Bill and Melinda Gates Foundation and Norad, administered through the World Bank. We thank Dr Tedros, Dr Kebede and Dr Nejmudin of the Ministry of Health, and the Government of Ethiopia. We are grateful to Dr. Aklilu Kidanu for providing invaluable assistance to the authors, and for leading the survey team of the Miz-Hasab Reserach Center in Addis Ababa. Thanks also to Joost de Laat, Christopher H. Herbst, Magnus Lindlow, Gebreselassie Okubagzhi, Pieter Serneels, Agnes Soucat, and Kate Tulenko for comments and assistance. The opinions expressed in the paper are those of the authors and do not reect the position of the Government of Ethiopia or the World Bank Group.
Transcript
Health worker preferences for job attributes inEthiopia: Results from a discrete choice
experiment12
Kara HansonLondon School of Hygiene and Tropical Medicine
William JackGeorgetown University
April 23, 2008
1This is a preliminary draft, not for citation.2The survey for this study was �nanced by a grant from the Bill and Melinda
Gates Foundation and Norad, administered through the World Bank. We thank DrTedros, Dr Kebede and Dr Nejmudin of the Ministry of Health, and the Governmentof Ethiopia. We are grateful to Dr. Aklilu Kidanu for providing invaluable assistanceto the authors, and for leading the survey team of the Miz-Hasab Reserach Centerin Addis Ababa. Thanks also to Joost de Laat, Christopher H. Herbst, MagnusLindlow, Gebreselassie Okubagzhi, Pieter Serneels, Agnes Soucat, and Kate Tulenkofor comments and assistance. The opinions expressed in the paper are those of theauthors and do not re�ect the position of the Government of Ethiopia or the WorldBank Group.
Abstract
This paper estimates the e¤ectiveness of a range of policy interventions aimed atimproving the supply of health workers to rural areas in Ethiopia. Using datafrom a survey of 861 health workers, it employs stated preference techniques topredict labor market responses of doctors and nurses to changes in rural wages,working conditions, housing bene�ts, and training opportunities. Doublingwages in areas outside the capital would increase the share of doctors willingto work there from about 7 percent to more than 50 percent. Providing highquality housing would increase physician labor supply to about 27 percent, whichis equivalent to paying a wage bonus of about 46 percent. Doubling wages paidto nurses for work in rural areas outside cities increases their labor supply from4 percent to 27 percent, while the non-wage attribute that is most e¤ective ininducing them to relocate to rural areas is the quality of equipment and drugs.The same impact could be achieved by increasing rural nursing wages by about57 percent for men and 69 percent for women.
1 Introduction
The supply and geographic distribution of health workers are major constraintsto improving health in low-income countries. A number of recent studies havehighlighted the shortage of skilled health workers in many settings (WHO, 2006),the impact this has on health outcomes (Anand and Barnighausen, 2004), andthe risk this poses for the achievement of the Millenium Development Goals(WHO, 2006; Joint Learning Initiative, 2004). However, there remains limitedevidence about what sorts of policies will attract nurses and doctors into medicaltraining, improve the retention of trained health workers, and encourage themto work in rural areas where problems of inaccessibility of services are mostacute.A number of strategies have been employed to address the human resources
challenge in low- and middle-income settings: these include compulsory ruralservice for new graduates (e.g. in South Africa); payment of incentives or �hard-ship allowances� for those posted to rural areas (as proposed in Rwanda); orencouraging self-selection by those with a commitment to rural service (as prac-ticed, for example, in Thailand, Wilbulpolpraser and Pengpaibon, 2003). Yetfew of these strategies have been systematically evaluated, and the e¤ectivenessof each will likely re�ect country-speci�c labour market conditions, politicalsystems, and culture and tradition.The challenges of human development are particularly extreme in Ethiopia,
a country with a population of over 70 million people, 85% of whom live in ruralareas. It is one of the poorest countries in the world, with per capita income ofabout $150, and although the poverty rate has fallen by 8 percentage points overthe last 10 years, it nonetheless remained at 37% in 2006. The country facesacute challenges in reaching all of the Millenium Development Goals, includingthe three goals relating to health - to reduce child mortality, improve maternalhealth, and combat HIV/AIDS, malaria, and other diseases. In 2005 the infantmortality rate was 77 per 1,000, the under-5 mortality rate was 123 per 1,000,and the maternal mortality rate was 673 per 100,000. In 2006 about half ofall mothers received some kind of antenatal service, and 15% of deliveries wereattended by a health worker. Ethiopia has escaped the ravages of HIV/AIDScompared with other countries in Africa, and had an adult prevalence of 2.1%in 2006.The WHO reports that in 2003 there were 1,936 physicians in Ethiopia, rep-
resenting a population-physician ratio of approximately 38,000, or 0.03 physi-cians per thousand individuals.1 This is the �fth highest population to physi-cian ratio among African countries, and compares pitifully with the ratio of10,000 as recommended by the WHO. If anything near this ratio is to be at-tained, there will clearly need to be a sustained long term increase in the netsupply of physicians to the Ethiopian market. The shortage of nurses is lessacute,2 but similar expansions will be necessary. The recruitment and retention
1See www.who.int/research/.2The WHO estimated that there were 14,270 nurses in Ethiopia in 2003, or about one
nurse for every 5,250 people.
1
of health workers in both the public and private sectors of the local marketdepends on the �nancial and non-fanancial rewards that they expect to reap,relative to alternatives (such as non-health sector work, or migration). On theother hand, the allocation of a given supply of health workers across geographicregions, as well as to tasks and specialties, often depends on the relative rewardsin the public and private sectors. Attracting health workers to remote areasis a particular challenge if the WHO-recommended ratios are to be met in ameaningful way.Rural and remote areas of Ethiopia are particularly underserved by health
workers. We do not have nationally representative data on health worker lo-cation by rural and urban areas, but Ministry of Health data indicate that in2004 about 20% of the approximately 1,000 doctors classi�ed as operating inthe "public sector" worked in Addis Ababa, home to about 5% of the popula-tion (Ministry of Health, 2005). It is likely, of course, that physicians in otherregions are also located in urban centers, so the share of public sector doctorsin rural areas would be far less than 80%. To add further to this rural-urbandisparity, Ministry of Health data suggest that a further 1,500 doctors workfor NGOs, other governmental organizations (e.g., the military), the "central"government, and in the private sector. We do not have speci�c data on theirlocation, but we believe that few of them serve the rural population. By someestimates, half of the physicians in Ethiopia serve the residents of the capital,Addis Ababa.During the 1980s and most of the 1990s, health workers trained in Ethiopia
were typically assigned to their �rst jobs by the central government. Thisassignment was by means of a lottery system, and the prevailing belief amongo¢ cials we interviewed is that the control exercised by the state was such thatmost health workers accepted their assignments. Workers were required to servea �xed number of years before being "released" and permitted to apply forother positions. During the past �ve years Ethiopia has embarked on a radicaldecentralization program across all areas of the public sector, with much of theresponsibility for service delivery being devolved to lower levels of government.In each of the 10 regions, plus Addis Ababa, a regional health bureau hasresponsibility for the hiring and deployment of public sector health workers.As competition between regions for health workers has grown, anecdotal
evidence suggests that the lottery system has become increasingly ine¤ective.It is believed that many new graduates do not register for the lottery, andthose who do participate are prone to disregard their assignment if they sowish, knowing that they can apply directly to the regional health bureau for ajob. The regions compete on salaries, time to release (which allows work inthe burgeoning private sector, at least in Addis Ababa), and other attributes.Some regions, for example Oromia, have recently introduced explicit �nancialincentives to attract individuals to remote areas within the region. Similarly,regions that are themselves remote (in terms of being far from Addis Ababa)have attempted to attract health workers by providing certain training optionsand �nancial incentives.In this paper we estimate health worker preferences over di¤erent job at-
2
tributes in an attempt to identify the factors that are important to health work-ers in in�uencing their labor supply decisions. One approach to this problem isto study actual choices made by health workers. However, this method maysu¤er from a range of selection and endogeneity problems, leading to biasedparameter estimates. In addition, there is often limited variation in key jobattributes (pay and non-pay), making it challenging to estimate the e¤ects ofthese parameters on labour market choices and to predict the e¤ects of changesin job attributes that lie outside the existing range over which these attributesvary in practice. Of course, the obvious downside to this approach is that wemight have more con�dence in choices people actually make, not in the choicesthey might say they would make.Stated preference techniques have been widely used in health and environ-
mental economics applications to study preferences for non-marketed commodi-ties. Discrete choice experiments (DCEs) have examined the valuation of dif-ferent attributes of health care service provision , dimensions of health bene�tbeyond health outcomes, and quality of care attributes (for reviews see Ryanand Gerrard 2003a and 2003b). Studies of health worker valuations of job at-tributes have also adopted DCE methods, both in the UK (Scott 2001) and ina variety of low- and middle-income settings (Chomitz et al., 1998; Manghamand Hanson, 2007; Penn-Kekana et al., 2005). Chomitz et al. provide a usefulreview of the bene�ts and shortcomings of the approach. A study of recentmedical and nursing school grauduates currently underway in Ethiopia (Lind-low and Serneels) elicits direct measures of the cost of taking a rural job, butdoes not employ the DCE technique.
2 Data and DCE methodology
In this section we report out sampling strategy and the details of the discretechoice experiment we conducted.
2.1 Sampling
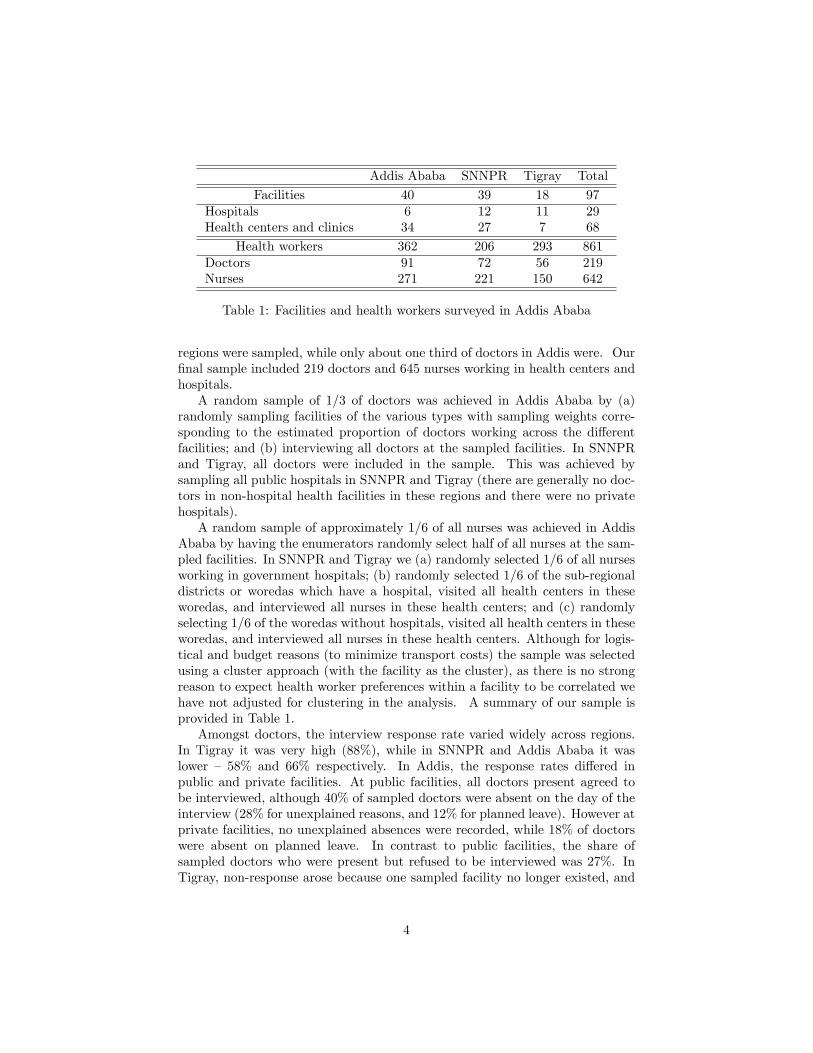
Our sampling strategy aimed at obtaining representative samples of doctors andnurses from three of Ethiopia�s eleven regions �the capital city of Addis Ababa,Tigray, and Southern Nations and Nationalities Peoples Republic (SNNPR).Addis is a city of about 3 million people and is located in the central highlands.Tigray has a population of about 4 million people and lies in the extreme northof the country, bordering Eritrea, while SNNPR, with a population of 14 millionborders Kenya to the south. Our sample is representative within these geo-graphic areas.3 The design over-sampled doctors in SNNPR and Tigray dueto the small number of doctors outside Addis Ababa: all doctors in these rural
3Other regions, such as Oromia (which surrounds Addis Ababa) and Amhara (which isimmediately north of Oromia) are larger (with 26 and 19 million residents respectively) andless remote, at least in terms of direct distance measures, but we have no reason to expectthis to have introduced systematic biases in our estimates.
Table 1: Facilities and health workers surveyed in Addis Ababa
regions were sampled, while only about one third of doctors in Addis were. Our�nal sample included 219 doctors and 645 nurses working in health centers andhospitals.A random sample of 1/3 of doctors was achieved in Addis Ababa by (a)
randomly sampling facilities of the various types with sampling weights corre-sponding to the estimated proportion of doctors working across the di¤erentfacilities; and (b) interviewing all doctors at the sampled facilities. In SNNPRand Tigray, all doctors were included in the sample. This was achieved bysampling all public hospitals in SNNPR and Tigray (there are generally no doc-tors in non-hospital health facilities in these regions and there were no privatehospitals).A random sample of approximately 1/6 of all nurses was achieved in Addis
Ababa by having the enumerators randomly select half of all nurses at the sam-pled facilities. In SNNPR and Tigray we (a) randomly selected 1/6 of all nursesworking in government hospitals; (b) randomly selected 1/6 of the sub-regionaldistricts or woredas which have a hospital, visited all health centers in theseworedas, and interviewed all nurses in these health centers; and (c) randomlyselecting 1/6 of the woredas without hospitals, visited all health centers in theseworedas, and interviewed all nurses in these health centers. Although for logis-tical and budget reasons (to minimize transport costs) the sample was selectedusing a cluster approach (with the facility as the cluster), as there is no strongreason to expect health worker preferences within a facility to be correlated wehave not adjusted for clustering in the analysis. A summary of our sample isprovided in Table 1.Amongst doctors, the interview response rate varied widely across regions.
In Tigray it was very high (88%), while in SNNPR and Addis Ababa it waslower � 58% and 66% respectively. In Addis, the response rates di¤ered inpublic and private facilities. At public facilities, all doctors present agreed tobe interviewed, although 40% of sampled doctors were absent on the day of theinterview (28% for unexplained reasons, and 12% for planned leave). However atprivate facilities, no unexplained absences were recorded, while 18% of doctorswere absent on planned leave. In contrast to public facilities, the share ofsampled doctors who were present but refused to be interviewed was 27%. InTigray, non-response arose because one sampled facility no longer existed, and
4
one was inaccessible for security reasons, but at visited facilities absenteeismand refusal rates were very low. In SNNPR, 42% of doctors listed as beingemployed were absent at the time of the facility visit, although nine out of tenof them were reported as being absent for training purposes.For nurses, we do not have data on refusals to be interviewed, but we have
calculated response rates as the ratio of the numbers of nurses interviewed to ourinitial target sample.4 These calculated rates varied by region: in Tigray, nursesat both hospitals and clinics appear to have been over-sampled, leading to aninterview rate of 143% (i.e. 43% more nurses were interviewed than initiallytargeted), while in SNNPR about 70% of the target number were interviewed.Most of the under-sampling seems to have occurred at health centers, whichmay have been under-sta¤ed compared with our pre-survey estimates. In Addisthere was a small degree of over-sampling �the sampling protocol appears tohave been followed in hosptials (where 50 percent of nurses in sampled facilitieswere to be interviewed), with slight over-sampling in health centers.
2.2 The discrete choice experiment
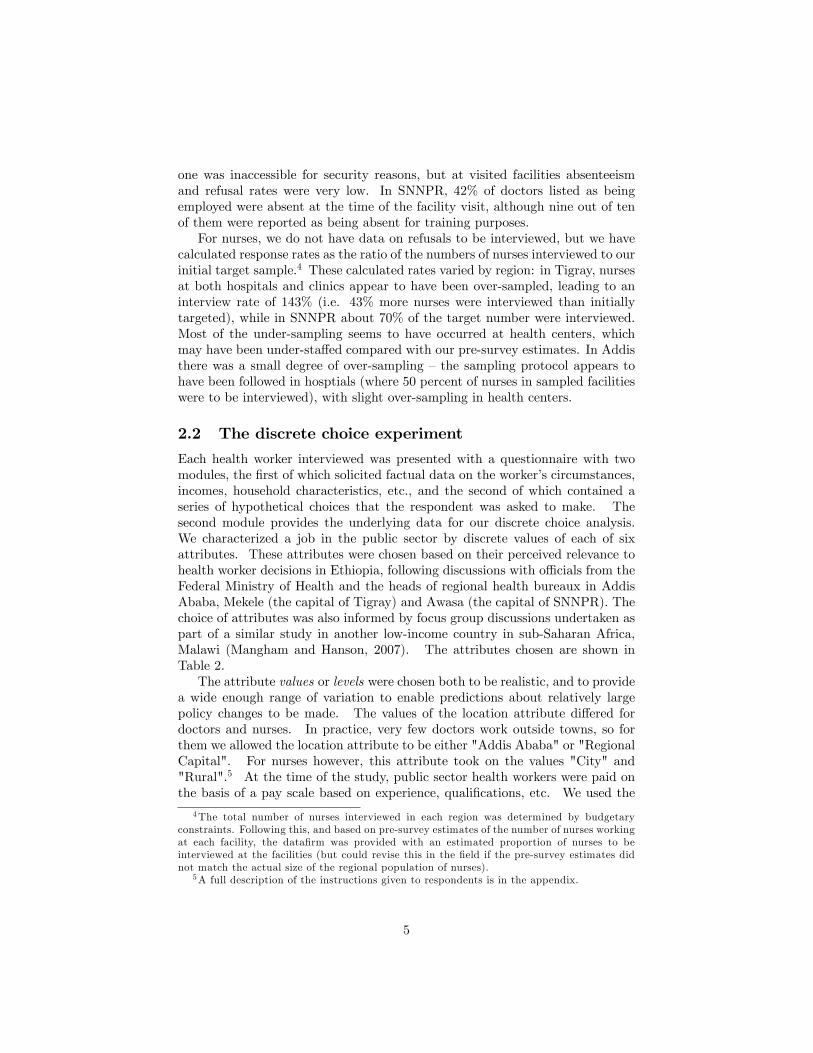
Each health worker interviewed was presented with a questionnaire with twomodules, the �rst of which solicited factual data on the worker�s circumstances,incomes, household characteristics, etc., and the second of which contained aseries of hypothetical choices that the respondent was asked to make. Thesecond module provides the underlying data for our discrete choice analysis.We characterized a job in the public sector by discrete values of each of sixattributes. These attributes were chosen based on their perceived relevance tohealth worker decisions in Ethiopia, following discussions with o¢ cials from theFederal Ministry of Health and the heads of regional health bureaux in AddisAbaba, Mekele (the capital of Tigray) and Awasa (the capital of SNNPR). Thechoice of attributes was also informed by focus group discussions undertaken aspart of a similar study in another low-income country in sub-Saharan Africa,Malawi (Mangham and Hanson, 2007). The attributes chosen are shown inTable 2.The attribute values or levels were chosen both to be realistic, and to provide
a wide enough range of variation to enable predictions about relatively largepolicy changes to be made. The values of the location attribute di¤ered fordoctors and nurses. In practice, very few doctors work outside towns, so forthem we allowed the location attribute to be either "Addis Ababa" or "RegionalCapital". For nurses however, this attribute took on the values "City" and"Rural".5 At the time of the study, public sector health workers were paid onthe basis of a pay scale based on experience, quali�cations, etc. We used the
4The total number of nurses interviewed in each region was determined by budgetaryconstraints. Following this, and based on pre-survey estimates of the number of nurses workingat each facility, the data�rm was provided with an estimated proportion of nurses to beinterviewed at the facilities (but could revise this in the �eld if the pre-survey estimates didnot match the actual size of the regional population of nurses).
5A full description of the instructions given to respondents is in the appendix.
5
DoctorsAttribute Possible levels
X1 Location Addis Ababa vs Regional CapitalX2 Net Monthly Pay (Base = 2; 500) 1�Base; 1:5�Base; 2�BaseX3 Housing None, Basic, SuperiorX4 Equipment and Drugs Inadequate vs ImprovedX5 Time Commitment 2 years vs 1 yearX6 Private Sector Yes vs No
NursesAttribute Possible levels
X1 Location City vs RuralX2 Net Monthly Pay (Base = 1; 250) Base; 1:5�Base; 2�BaseX3 Housing None, Basic, SuperiorX4 Equipment and Drugs Inadequate vs ImprovedX5 Time Commitment 2 years vs 1 yearX6 Supervision High vs Low
Table 2: Job attributes and levels
(unweighted) average monthly salary from these scales to determine a "base"salary for doctors and nurses separately, and let the pay attribute take on valueseach to 1, 1.5, and 2 times this value. The third (housing), fourth (equipmentand drugs), and �fth (time6) attributes in Table 2 took on the same values fordoctors and nurses. For doctors, the �nal attribute was permission to workin the private sector (taking the values yes and no). Since opportunities forproviding nursing services outside regular hours are limited, the opportunity towork in the private sector is of limited use for nurses. However, experiencefrom other countries has suggested that active and supportive supervision is animportant job attribute for these health workers. This is the sixth attribute weincluded for nurses.Our questionnaire presented individuals with a series of pairs of jobs, and
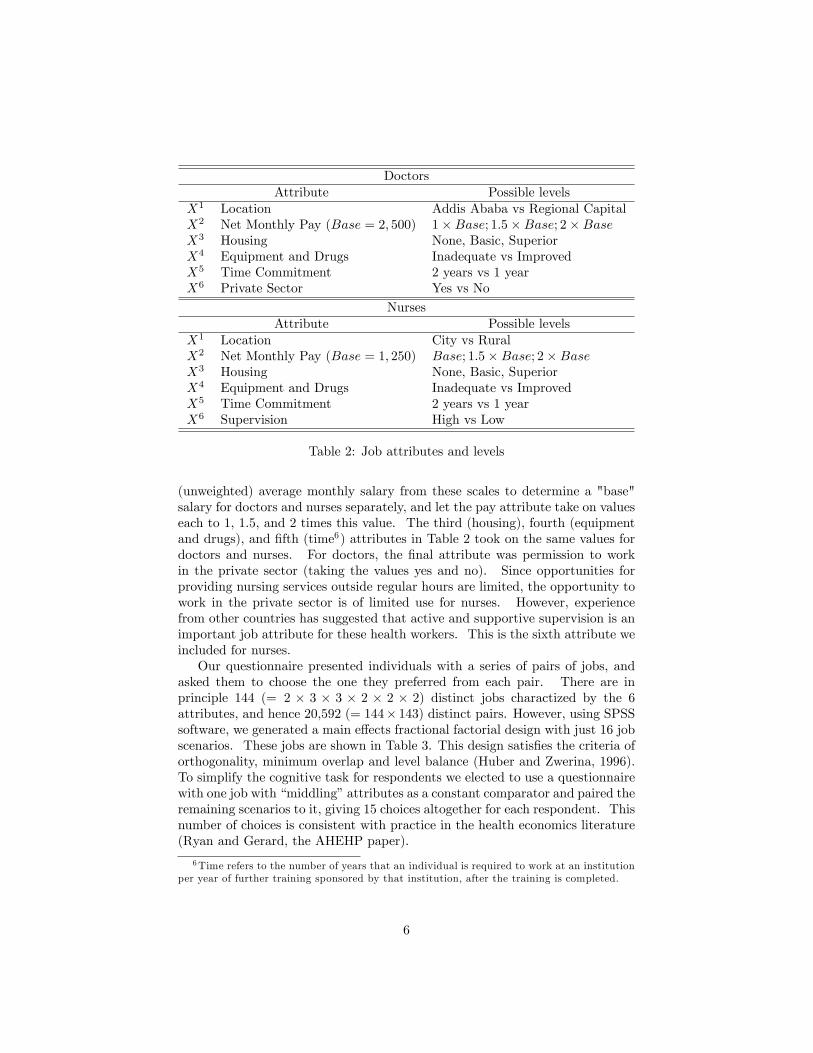
asked them to choose the one they preferred from each pair. There are inprinciple 144 (= 2 � 3 � 3 � 2 � 2 � 2) distinct jobs charactized by the 6attributes, and hence 20,592 (= 144� 143) distinct pairs. However, using SPSSsoftware, we generated a main e¤ects fractional factorial design with just 16 jobscenarios. These jobs are shown in Table 3. This design satis�es the criteria oforthogonality, minimum overlap and level balance (Huber and Zwerina, 1996).To simplify the cognitive task for respondents we elected to use a questionnairewith one job with �middling�attributes as a constant comparator and paired theremaining scenarios to it, giving 15 choices altogether for each respondent. Thisnumber of choices is consistent with practice in the health economics literature(Ryan and Gerard, the AHEHP paper).
6Time refers to the number of years that an individual is required to work at an institutionper year of further training sponsored by that institution, after the training is completed.
6
Equipment Pay-back Private sector/Location Pay Housing and drugs time Supervision
Table 3: The constant job, Job 1, and the 15 comparator jobs
To examine whether the placement or ordering of scenarios a¤ected responseswe administered the questionnaire in four formats. In two of these, the �con-stant�job was �rst (on the left-hand-side) in each of the 15 choices, and in theother 2 it was the second (on the right-hand-side). Similarly, in two formats,the series of 15 pairs were presented in the reverse order. While we did notidentify any major e¤ects of the questionnaire version on results, it did allow usto identify a small number of errors in the �nal versions of the questionnaires.Rationality of responses was investigated by including one scenario that was
clearly superior to the other, assuming that individuals prefer Addis Ababa(doctors) or urban (nurses) location, higher pay, better housing, more equip-ment and drugs, shorter time commitment, ability to work in the private sector(doctors), and more supervision (nurses). We found that over 95% of respon-dents chose the clearly superior job. As it is very possible that some doctors ornurses would have a preference against Addis or urban areas, we chose to retainthe full sample of respondents in our analysis.
3 Speci�cation and estimation
We label individuals by an index q = 1; :::; Q. Each potential job is characterizedby a set of a = 6 attributes, and we label the jobs i = 1; :::; 16. A pair of possiblejobs is called (i; j). To motivate our analysis of the data, let y(i;j)q be de�ned
7
by
y(i;j)q =
�1 if q chooses i over j0 otherwise
:
Let X be an a-dimensional column vector of attribute levels with kth elementXk, and let Xi be the vector of attribute levels that characterize option i.Similarly, let Zq be a c-dimensional column vector of personal characteristicsfor individual q, with lth element Zlq We hypothesize that individual q derivessome utility from option i given by
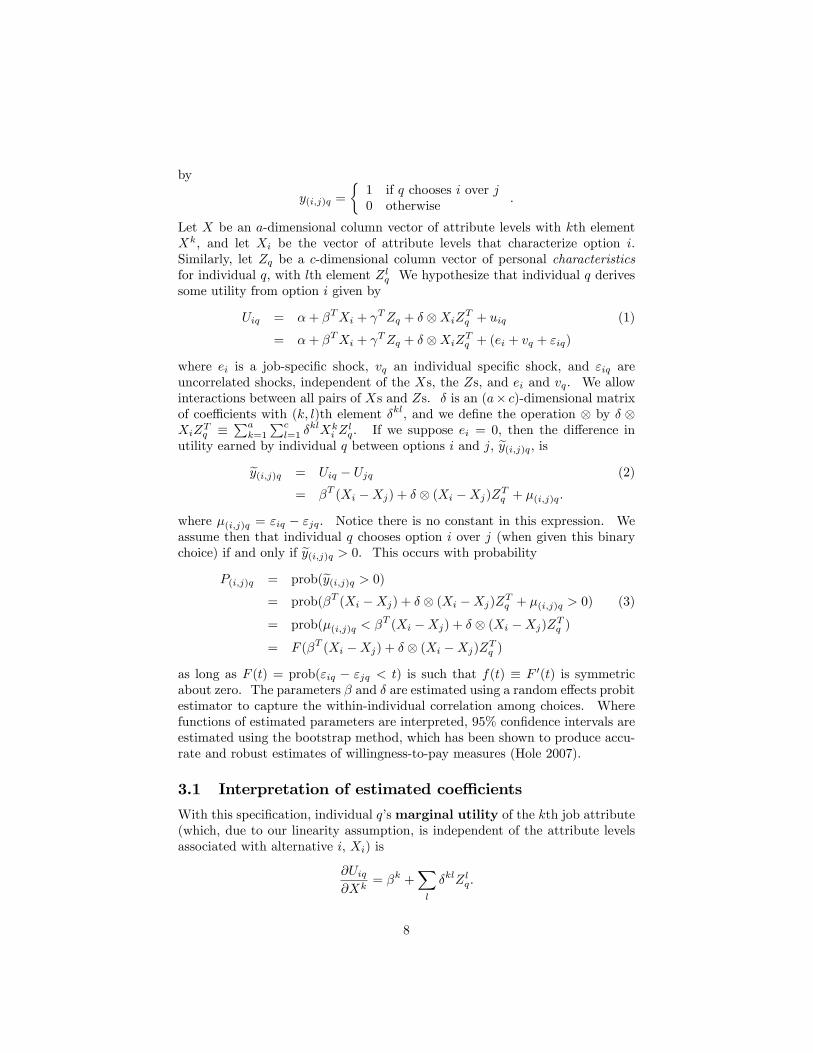
Uiq = �+ �TXi + TZq + � XiZTq + uiq (1)
= �+ �TXi + TZq + � XiZTq + (ei + vq + "iq)
where ei is a job-speci�c shock, vq an individual speci�c shock, and "iq areuncorrelated shocks, independent of the Xs, the Zs, and ei and vq. We allowinteractions between all pairs of Xs and Zs. � is an (a� c)-dimensional matrixof coe¢ cients with (k; l)th element �kl, and we de�ne the operation by � XiZ
Tq �
Pak=1
Pcl=1 �
klXki Z
lq. If we suppose ei = 0, then the di¤erence in
utility earned by individual q between options i and j, ey(i;j)q, isey(i;j)q = Uiq � Ujq (2)
= �T (Xi �Xj) + � (Xi �Xj)ZTq + �(i;j)q:
where �(i;j)q = "iq � "jq. Notice there is no constant in this expression. Weassume then that individual q chooses option i over j (when given this binarychoice) if and only if ey(i;j)q > 0. This occurs with probability
as long as F (t) = prob("iq � "jq < t) is such that f(t) � F 0(t) is symmetricabout zero. The parameters � and � are estimated using a random e¤ects probitestimator to capture the within-individual correlation among choices. Wherefunctions of estimated parameters are interpreted, 95% con�dence intervals areestimated using the bootstrap method, which has been shown to produce accu-rate and robust estimates of willingness-to-pay measures (Hole 2007).
3.1 Interpretation of estimated coe¢ cients
With this speci�cation, individual q�smarginal utility of the kth job attribute(which, due to our linearity assumption, is independent of the attribute levelsassociated with alternative i, Xi) is
@Uiq@Xk
= �k +Xl
�klZlq:
8
More meaningfully, themarginal rate of subsitution between the kth and hthattributes (which again, with this speci�cation is independent of the attributelevels associated with alternative i) is
MRSkhiq = � @Uiq@Xh
�@Uiq@Xk
(4)
= � �h +
Pl �hlZlq
�k +P
l �klZlq
!If Xk is pay (i.e., k = 2), then the absolute value of MRSkhiq is the marginalvalue of attribute h to individual q, or individual q�s marginal willingess to payfor attribute h.In the special case where Zq is a binary scalar variable (e.g., sex) taking on
the values 0 (male) and 1 (female), the marginal rate of substitution betweenthe kth and hth attributes is
MRSkhiq = ��h
�k
if Zq = 0 (i.e., for men) and
MRSkhiq = � �h + �h
�k + �k
!if Zq = 1 (i.e., for women).
3.2 Attribute interactions
Under the speci�cation in (1), the marginal rate of substitution between di¤er-ent attributes is independent of the attribute levels (see 4) - that is, indi¤erencecurves are straight lines, and the attributes are perfect substitutes. The mar-ginal rate of substitution can be allowed to vary with the mix of attributes byintroducing non-linear terms in (1). The simplest way to do this is to include acomplete set of interaction terms between the di¤erent components of Xi. (Weassume that of the interaction terms between attribute levels and individualcharacteristics, only the linear ones are potentially signi�cant - i.e., there are noterms of the form Xk
i Xhi Z
lq.) This yields a utility level for person q in job i of
Uiq = �+ �TXi + �XiXT
i + TZq + � XiZTq + uiq
where � is an (a�a) upper triangular matrix of coe¢ cients, with (k; h)th element�kh.7 The di¤erence in utility levels obtained by individual q between jobs iand j is
ey(i;j)q = Uiq � Ujq (5)
= �T (Xi �Xj) + ��XiX
Ti �XjXT
j
�+ � (Xi �Xj)ZTq + �(i;j)q:
7�kh � 0 for k � h, �kh = 0 for k < h.
9
Following (3), the probability that individual q will choose job i over j is
P(i;j)q = prob(ey(i;j)q > 0) (6)
= F (�T (Xi �Xj) + ��XiX
Ti �XjXT
j
�+ � (Xi �Xj)ZTq );
and the parameters are estimated using maximum likelihood methods for a givenassumption about F .The marginal rate of subsitution between the kth and hth attributes is
now
MRSkhiq = � @Uiq@Xh
�@Uiq@Xk
= �
0@�h +hPh
m=1 �mhXm
i +Pa
m=h �hmXm
i
i+P
l �hlZlq
�k +hPk
m=1 �mkXm
i +Pa
m=k �kmXm
i
i+P
l �klZlq
1A(7)As an example, consider the e¤ect that job location might have on the rela-
tive valuation of private practice and money for doctors. The attribue X1 cantake on two values, X1 = 1 if the job is in Addis and X1 = 0 if it is in anothercity, and similarly the attribute X6 can take on two values, X6 = 1 if privatesector work is permitted and X6 = 0 if it is not. If we �nd that the coe¢ cient�16 is positive, and that all other �kh = 0, then the marginal rate of substitutionbetween private sector work and money for a job in Addis is
MRS26Addis;q = � �6 + �16 +
Pl �hlZlq
�2 +P
l �klZlq
!;
and the MRS between private sector work and pay for a job outside Addis is
MRS26Non�Addis;q = � �6 +
Pl �hlZlq
�2 +P
l �klZlq
!:
Similarly, the valuation of housing could well depend on the location of the jobunder consideration. The marginal rate of substitution between housing andmoney being
MRS23Addis;q = � �3 + �13 +
Pl �hlZlq
�2 +P
l �klZlq
!;
in Addis, and
MRS23Non�Addis;q = � �3 +
Pl �hlZlq
�2 +P
l �klZlq
!:
for a job outside the capital.
10
3.3 Wage equivalents
We will �nd it useful to measure the supply response to changes in non-wageattributes in terms of equivalent changes in wage rates. If a change in say ruralhousing is estimated to have a certain impact on rural labor supply, we calculatethe change in the rural wage that would have the same quantitative e¤ect onthe willingness of health workers to take rural jobs. This sub-section outlinesthe methodology we employ.Suppose that a standard or typical job in Addis Ababa is described by a
certain bundle of characteristics, XA, and that the typical rural job is describedby a vector XR. A policy intervention that is aimed at attracting workers torural areas might improve one or more of the attributes typically found in arural job, such as improved housing, etc. The vector of attributes de�ning theaverage rural job under this policy is denoted XP . A particular example ofa policy intervention involves a change in just the wage earned in rural areas,keeping other attributes at the levels typically found in rural jobs. We thinkof this policy intervention as an equivalent wage policy. Denote such a vectorof attributes by XE - each component of XE is the same as the correspondingcomponent of XR, except for the wage.These bundles are represented by the following vectors, with the values of
the numerical components derived from the survey:
XA =
0BBBBBB@1wA0121
1CCCCCCA ;XR =0BBBBBB@
0wRXHR
XER
XTR
XPR
1CCCCCCA =
0BBBBBB@0wRh02s
1CCCCCCA ;XP =0BBBBBB@
0wPXHP
XEP
XTP
XPP
1CCCCCCA ;XE =0BBBBBB@
0wEXHR
XER
XTR
XPR
1CCCCCCA =
0BBBBBB@0wEh02s
1CCCCCCA :
Note that both h and s will typically vary between doctors and nurses: fordoctors, s = 0 as there is e¤ectively no private practice in rural areas, but fornurses s represents the prevailing level of supervision that nurses enjoy in ruraljobs, which might be non-zero. Similarly, about 40% of doctors in our sampleoutside Addis report receiving a housing allowance, but less than 10% of nursesin these regions do so (see Table 5 below).The attribute di¤erences between the rural job under the policy intervention
and the Addis job are
dXPA = XP �XA =
0BBBBBB@�1
wP � wAXHP
XEP � 1
XTP � 2
XPP � 1
1CCCCCCAwhile the di¤erences between the rural job with the equivalent wage policy (XE)
11
and the Addis job are
dXEA = XE �XA =
0BBBBBB@0
wE � wAXHR
XER � 1
XTR � 2
XPR � 1
1CCCCCCA =
0BBBBBB@�1
wE � wAh�10
s� 1
1CCCCCCAIn the base attribute-only model, the shares of respondents taking job P
over job A, and job E over job A, are respectively
PPA = F (�T (dXPA)) and PEA = F (�
T (dXEA)):
If these are set equal, then �T (dXPA) = �T (dXEA), or
��L + �W (wP � wA) +�HXHP + �
E(XEP � 1) + �T (XT
P � 2) + �P (XPP � 1)
= ��L +�W (wE � wA) + h�H � �E + �P (s� 1)
or
�W (wP�wA)+�H(XHP �h)+�EXE
P +�T (XT
P�2)+�P (XPP �s) = �W (wE�wA):
Alternatively,
�w = wE � wP
=1
�W
0BB@�H
�E
�T
�P
1CCA �0BB@XHP � h
XEP
XTP � 2
XPP � s
1CCA :This is the extent to which a simple wage bonus would need to exceed the wagein the rural bundle to have the same impact on labor supply. Note that ingeneral, the wage equivalent of a policy change that improves a single non-wageattribute will not be the same as the marginal value of, or marginal willingnessto pay for, that attribute. This is because the MRS between two attributesis calculated holding all other attributes constant, while the wage equivalentcompares two jobs with di¤erent attribute levels.In a model with characteristic interactions, the same attribute vectors are
used, but to �nd the wage equivalent for a given type of person we now equatethe di¤erences in mean latent utilities for that person type. The shares ofrespondents with characteristics Z taking job P over job A, and job E over jobA, are now respectively
PPA = F (�T (dXPA)+�dXPAZT ) and PEA = F (�
T (dXEA)+�dXEAZT ):
These are equal if
�T (dXPA) + � dXPAZT = �T (dXEA) + � dXEAZT
12
or�T (dXPA � dXEA) + � [dXPA � dXEA]ZT = 0:
In the case where Z has just one component, sex, (0 = male; 1 = female), thisreduces to
�wmale = wmaleE � wR =
1
�W
0BB@�H
�E
�T
�P
1CCA �0BB@XHP � h
XEP
XTP � 2
XPP � s
1CCAfor men, and
�wfemale = wfemaleE � wR =
1��W + �W
�0BB@�H + �H
�E + �E
�T + �T
�P + �P
1CCA �0BB@XHP � h
XEP
XTP � 2
XPP � s
1CCAwhere �W is the coe¢ cient on the wage-sex interaction, �H is the housing-sexinteraction, �E is equipment, �T is time, and �P is private/supervision.In general, the wage equivalent for individuals with a given characteristic
vector Z is
�w(Z) = wE(Z)�wR =1�
�W +P
l �WlZl
�0BB@�H +
Pl �HlZl
�E +P
l �ElZl
�T +P
l �TlZl
�P +P
l �PlZl
1CCA�0BB@XHP � h
XEP
XTP � 2
XPP � s
1CCAwhere �Xl is the coe¢ cient on the interaction term between attribute X andcharacteristic l. If we want to know the wage equivalents for men and womenseparately, just substitute Zsex = 0 or 1, and use the mean values of the othercharacteristics in the Z-vector.
4 Results
4.1 Summary statistics
A summary of facility-level information is provided in Table 4. This tableincludes information provided by a facility administrator in response to a thefacility survey, as well as information provided by individual health workers inresponse to questions about the quality of the facility. Both data sources in-dicate that workers and patients operate in facilities of generally poor quality,and that on some dimensions at least rural facilities face particular challenges.8
8The facility administrators paint a somewhat rosier picture of conditions than workers.Our interviewers did not independently verify conditions as reported by the administrators:but we could speculate that their relatively positive evaluations might have been due tostrategic mis-reporting (due to a sense of pride perhaps), or due to incomplete information (ifthe administrators did not face the realities of poor working conditions on a daily basis).
13
Private facilities in Addis Ababa appear to be ranked consistently better qual-ity than public facilities there and in rural areas. Within the public sector,di¤erences between Addis and rural areas are not large, and indeed sometimesfavor the rural areas. As well as physical infrastructure, the work environmentis conditioned by underlying work practices. One indicator of this is the levelof supportive supervision that health workers reported, which at less than 50percent, is rather low.9
Descriptive statistics regarding health workers, and indicators of their labormarket status, are reported in Table 5. In economic terms, doctors in Addisdo better than those in the regions. As reported in panel II of Table 5, assetownership is higher in Addis, with one half and one quarter the doctors workingin private and public facilities respectively reporting ownership of a car, com-pared with less than two and �ve percent, respectively, in SNNPR and Tigray.House ownership is higher among private sector physicians in Addis (35%), butthe rates among other doctors are similar (10-16%). These patterns of assetownership naturally match the patterns of earned incomes.Doctors working in the public sector in Addis earn salaries about 50% more
than the average doctor in the regions, while salaries of private sector doctorsare three times as much. Part of this di¤erential likely re�ects the return toexperience (Addis doctors are older) and specialization (they are more likely tobe specialized). However, we �nd that the rates of specialization in the publicand private sectors in Addis are virtually identical, suggesting that trainingis not the sole driver of observed income di¤erentials. Nurses in Addis earnsigni�cantly smaller premiums over regional salaries �about 14 percent if theywork in the public sector and 36 percent in the private sector.The gap between private sector salaries in Addis and those of other doctors is
partly o¤set by additional sources of income: public sector doctors in Addis earnadditional income equal to 21% of their salaries, while the �gures in SNNPR andTigray are 17% and 33% respectively, and between a third and a half of doctorsin the regions outside Addis report receiving housing allowances (although wedo not have data on the monetary value of these allowances). Indeed, signi�cantshares of doctors working outside the Addis private sector report holding morethan one job � from 23% in the Addis public sector, to 12% in Tigray. Onthe other hand, private sector doctors in Addis supplement their (much higher)salaries by only 3 percent. Although 20% report holding more than one job,we expect that these multiple jobs are in some sense considered together tomake up the worker�s primary occupation, which accounts for the small amountof supplemental income. Finally, physician household incomes are higher inAddis than elsewhere.
4.2 Direct e¤ects model
We �rst estimated a model containing only the direct e¤ects of the job attributes,running this separately on the data for doctors and nurses. The results, shown
9 In our analysis we include the level of supervision as a job attribute for nurses, but notfor doctors.
14
All regions Addis Ababa SNNPR TigrayFacility survey Public Private�
WorkloadOften not time to do tasks 55.1 48.2 67.3 58.2 22.0 20.3 82.1 61.2 61.6 31.5Usually time to do tasks 43.0 51.1 32.7 40.4 72.0 79.8 18.0 38.8 38.4 67.1
Idle time common 2.0 0.6 0.0 1.0 6.0 0.0 0.0 0.0 0.0 1.3Condition of facility
Table 4: Facility level information, based on interviews with an administrator("facility survey") and individual health workers * Includes for-pro�t and non-pro�t NGO and missionary facilities ** Includes 3 private facilities
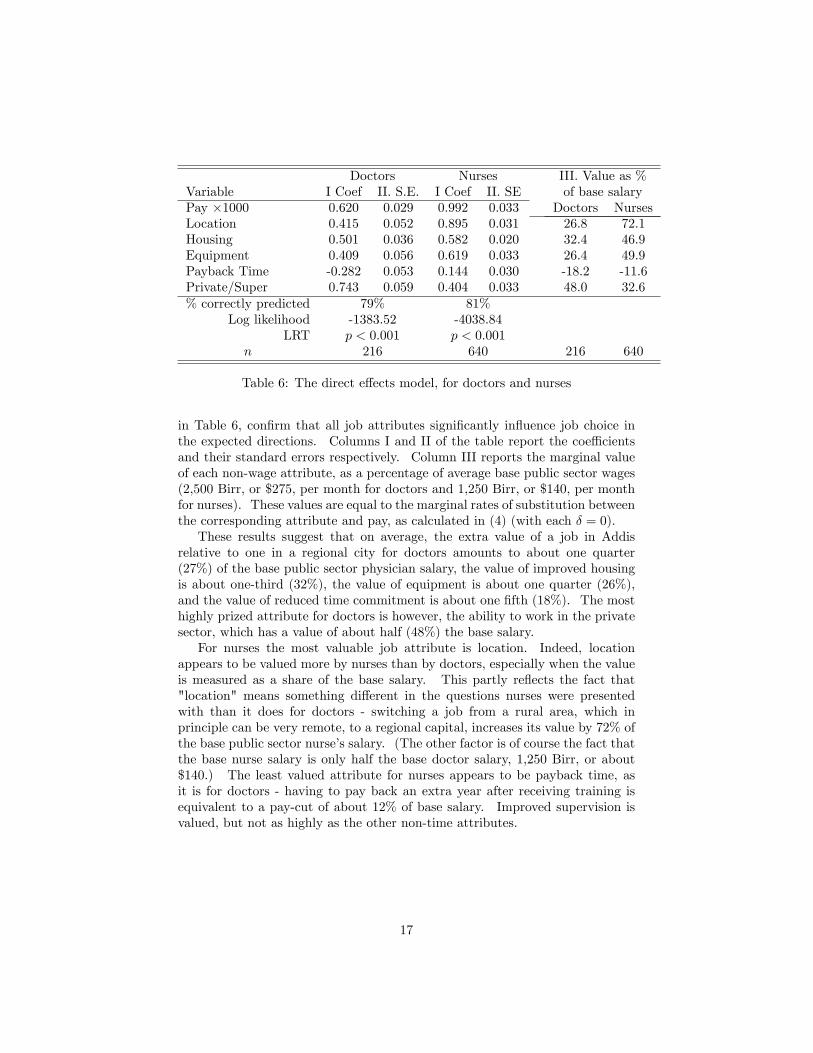
Doctors Nurses III. Value as %Variable I Coef II. S.E. I Coef II. SE of base salaryPay �1000 0.620 0.029 0.992 0.033 Doctors NursesLocation 0.415 0.052 0.895 0.031 26.8 72.1Housing 0.501 0.036 0.582 0.020 32.4 46.9Equipment 0.409 0.056 0.619 0.033 26.4 49.9Payback Time -0.282 0.053 0.144 0.030 -18.2 -11.6Private/Super 0.743 0.059 0.404 0.033 48.0 32.6% correctly predicted 79% 81%
Log likelihood -1383.52 -4038.84LRT p < 0:001 p < 0:001
n 216 640 216 640
Table 6: The direct e¤ects model, for doctors and nurses
in Table 6, con�rm that all job attributes signi�cantly in�uence job choice inthe expected directions. Columns I and II of the table report the coe¢ cientsand their standard errors respectively. Column III reports the marginal valueof each non-wage attribute, as a percentage of average base public sector wages(2,500 Birr, or $275, per month for doctors and 1,250 Birr, or $140, per monthfor nurses). These values are equal to the marginal rates of substitution betweenthe corresponding attribute and pay, as calculated in (4) (with each � = 0).These results suggest that on average, the extra value of a job in Addis
relative to one in a regional city for doctors amounts to about one quarter(27%) of the base public sector physician salary, the value of improved housingis about one-third (32%), the value of equipment is about one quarter (26%),and the value of reduced time commitment is about one �fth (18%). The mosthighly prized attribute for doctors is however, the ability to work in the privatesector, which has a value of about half (48%) the base salary.For nurses the most valuable job attribute is location. Indeed, location
appears to be valued more by nurses than by doctors, especially when the valueis measured as a share of the base salary. This partly re�ects the fact that"location" means something di¤erent in the questions nurses were presentedwith than it does for doctors - switching a job from a rural area, which inprinciple can be very remote, to a regional capital, increases its value by 72% ofthe base public sector nurse�s salary. (The other factor is of course the fact thatthe base nurse salary is only half the base doctor salary, 1,250 Birr, or about$140.) The least valued attribute for nurses appears to be payback time, asit is for doctors - having to pay back an extra year after receiving training isequivalent to a pay-cut of about 12% of base salary. Improved supervision isvalued, but not as highly as the other non-time attributes.
17
4.3 Full model with characeristic and attribute interac-tions
We extend the direct e¤ects-only model by incorporating interactions with char-acteristics that we expect might be correlated with marginal attribute valua-tions, and by including attribute-attribute interactions to assess non-linearitiesand synergies between attributes. We are particularly interested in explor-ing which attribute changes are likely to induce individuals to move to a ruralposting, and which types of people are more likely to respond to a particularpolicy intervention. The demographic characteristics of greatest interest mari-tal status, number of children, and sex. We are also interested in the e¤ects onattribute valuation of characteristics of the respondent�s current job, includingits location, housing bene�ts, and for nurses the level of supervision provided.We adopt a data-driven approach to model construction, in which we �rst
sequentially add interactions of a particular characteristic with pay and non-payattributes; we then estimate a full model including all the interactions that areindividually signi�cant (at the p = 0:10 level); �nally we remove from this fullmodel all the interactions that are no longer statistically signi�cant (at the p=.05level). Note, however, that because the MRS and other key model outputsare functions of multiple parameters, some otherwise insigni�cant interactionsare retained in the model in order to calculate standard errors around thesefunctions. Table 7 present the results for doctors and nurses.Our estimates in the full model allow us to examine the heterogeneity of
attribute valuations across health workers with di¤erent demographic charac-teristics. Table 8 reports selected marginal valuations for doctors, expressed asa percentage of the average base salary of all doctors (2,500 Birr per month).Note that the table includes only marginal valuations of those attributes withstatistically signi�cant characteristic interactions.We �nd that married doctors value a job in Addis twice as highly as single
doctors (38% versus 19% of base salary). The most natural explanation forthis e¤ect is a combination of joint-career issues, and children (although seebelow on the latter). Also, younger doctors are seen to value shorter pay-back periods following training � at �rst this seems surprising, as the younghave "time on their hands," and we might expect them to be willing and ableto pay back more time after training. The result likely arises from the factthat age is confounded with experience and training, so that older doctors,relatively many of whom are already specialized, do not place a high value onthe training o¤ered. Alternatively, younger doctors might feel more able totake advantage of their training, say by entering the private sector, or seekingfuture promotions. The future stream of bene�ts associated with training, evenaccounting for the length of career over which those bene�ts will accrue, maybe greater for younger, more adaptable, doctors, than for older generations.The impact of children seems perhaps surprisingly small, particularly the im-
pact of the �rst child: Doctors with one child value an Addis job (presumablywith better schools etc.) just 2 percentage points of base salary more than doc-tors without children, and there is virtually no di¤erence in the value of housing
Table 7: Full model with interactions for doctors and nurses
19
Marginal attribute value(percent of average base salary)
Characteristic Location Housing Payback time
Age *24
34.640
-23.2-13.0-8.0
Marital statusSingle
Married19.138.6
Number of children012
28.630.633.0
33.733.833.9
-13.0-11.0-8.4
SexMale
Female28.333.5
33.435.1
-14.1-7.1
* Ages are the 10th percentile, mean, and 90th percentile.
Table 8: Heterogeneity in attribute valuations: doctors
by number of children. Having a child reduces the value of reduced paybacktime following training, but from a relatively small base (13 percent). Theseresults on the e¤ects of children should however be interpreted with caution asthe median number of children in our sample of doctors was zero, so extrapo-lations to larger numbers of children are likely to be imprecise. Nonetheless,taken together with the e¤ect of marriage, they suggest that joint career con-cerns (and perhaps the prospect of children) are more important barriers to rurallabor supply than parenthood. Finally, in terms of di¤erences by sex, womenare observed to value work in the capital more than men (33% versus 28% ofbase salary), while men value reduced payback time about twice as much aswomen.In contrast, as reported in Table 9, married nurses value urban work, and
housing, less than single nurses. We do not know why marriage should a¤ectnurses�valuations di¤erently to those of doctors. One di¤erence is, of course,that "location" means something di¤erent in our estimation of the preferencesof nurses and doctors.10 Married nurses value reduced payback time half asmuch as singles, suggesting mobility might be more valuable to the latter. Theimpact of children seems somewhat larger for nurses than doctors (in terms ofthe percentage of base salary), but again, having children does not seem to bean especially impenetrable barrier to rural work.
5 Policy experiments
Our basic policy concern is over what the government can do to induce healthworkers to take jobs in underserved locations. The speci�cation in (1) allows
10Perhaps it is more important for single nurses to be in a city "marriage market" than itis for single doctors.
20
Marginal attribute value(percent of average base salary)
Characteristic Location Housing Payback time
Marital statusSingle
Married74.761.3
56.652.9
-12.2-6.9
Number of children012
60.466.572.9
Income25th percentile
Mean95th percentile
65.466.572.4
Lives in a city nowNoYes
61.470.8
30.245.3
Works in private sector nowNoYes
63.473.7
Receives housing allowance nowNoYes
53.872.7
Table 9: Heterogeneity in attribute valuations: nurses
us to infer the estimated probability of accepting one job (i) over another (j).We use this information in section 5.1 to calculate the probability that a workerwill accept a rural job over an urban job, and how this probability varies bothwith other job attributes and across di¤erent people, for example by sex. Insection 5.2 we convert the e¤ects of job attributes on labor supply to equivalentwage changes by asking what wage change would have the same e¤ect on theprobability of accepting a rural job as a given attribute change. Finally insection 5.3 we illustrate graphically the impact of job attribute improvementson the e¤ect of rural wage bonuses in increasing rural labor supply. Note thatin our simulations we do not report the impact of allowing doctors to engage inprivate sector work outside of Addis Ababa. This is due to the fact that whilerespondents reported a high valuation of working in the private sector, there arefew opportunities to do so outside Addis at this time (although the situation islikely to be changing rapidly), so application of the corresponding coe¢ cientsto rural jobs would be misleading.
5.1 Impact of attribute changes on rural labor supply
First we estimate the impacts of changes in job attributes on the probabilitythat an individual will accept a job in a rural area over a job in Addis Ababa(for doctors) or in a zonal capital (for nurses). For doctors we de�ne job j tobe in Addis Ababa, with the prevailing attributes of an average job there set atlevels approximating those reported by health workers in the �rst part of thesurvey instrument (and similarly for nurses in zonal capitals). Holding publicsector wages constant (i.e., without introducing wage bonuses), we calculate the
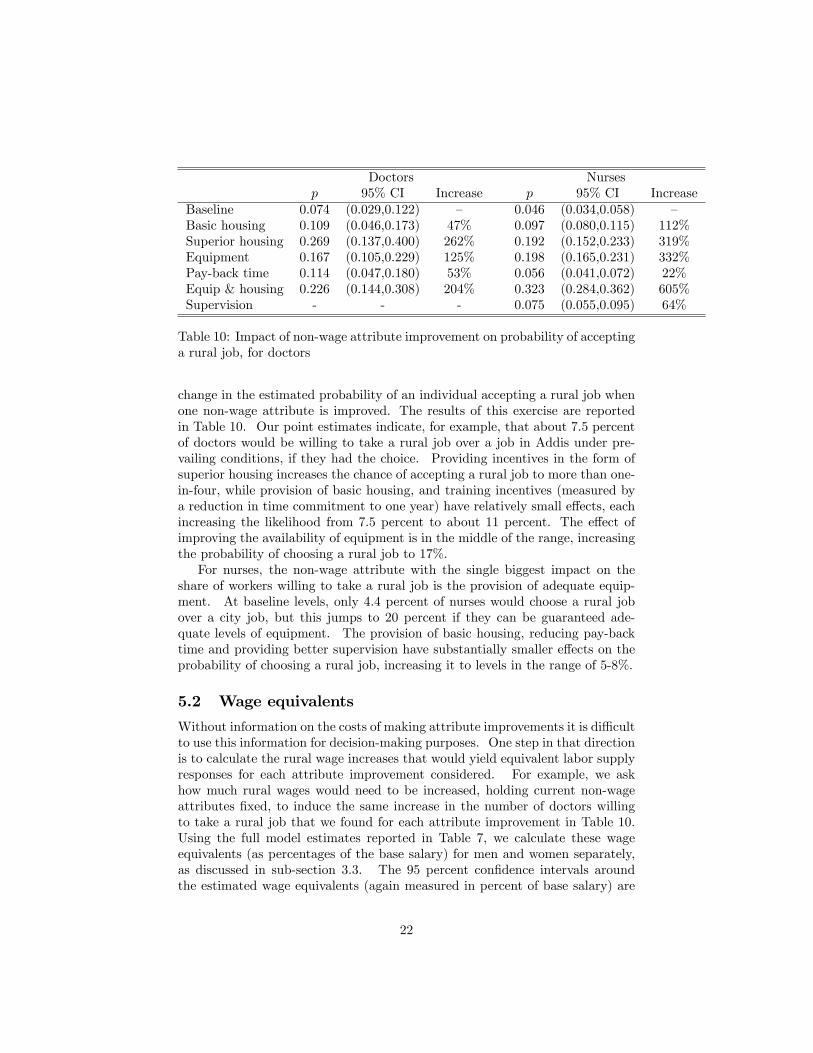
Table 10: Impact of non-wage attribute improvement on probability of acceptinga rural job, for doctors
change in the estimated probability of an individual accepting a rural job whenone non-wage attribute is improved. The results of this exercise are reportedin Table 10. Our point estimates indicate, for example, that about 7.5 percentof doctors would be willing to take a rural job over a job in Addis under pre-vailing conditions, if they had the choice. Providing incentives in the form ofsuperior housing increases the chance of accepting a rural job to more than one-in-four, while provision of basic housing, and training incentives (measured bya reduction in time commitment to one year) have relatively small e¤ects, eachincreasing the likelihood from 7.5 percent to about 11 percent. The e¤ect ofimproving the availability of equipment is in the middle of the range, increasingthe probability of choosing a rural job to 17%.For nurses, the non-wage attribute with the single biggest impact on the
share of workers willing to take a rural job is the provision of adequate equip-ment. At baseline levels, only 4.4 percent of nurses would choose a rural jobover a city job, but this jumps to 20 percent if they can be guaranteed ade-quate levels of equipment. The provision of basic housing, reducing pay-backtime and providing better supervision have substantially smaller e¤ects on theprobability of choosing a rural job, increasing it to levels in the range of 5-8%.
5.2 Wage equivalents
Without information on the costs of making attribute improvements it is di¢ cultto use this information for decision-making purposes. One step in that directionis to calculate the rural wage increases that would yield equivalent labor supplyresponses for each attribute improvement considered. For example, we askhow much rural wages would need to be increased, holding current non-wageattributes �xed, to induce the same increase in the number of doctors willingto take a rural job that we found for each attribute improvement in Table 10.Using the full model estimates reported in Table 7, we calculate these wageequivalents (as percentages of the base salary) for men and women separately,as discussed in sub-section 3.3. The 95 percent con�dence intervals aroundthe estimated wage equivalents (again measured in percent of base salary) are
22
50%
0%
50%
100%
150%
M F M F M F M F M F M F M F M F M F M F M F
DoctorsDoctorsDoctors
Doctors
DoctorsNurses
Nurses
Nurses
NursesNurses
Nurses
Basichousing
Superiorhousing
Equipment Paybacktime
Housingand
equipment
Supervision
Wag
eeq
uiva
lent
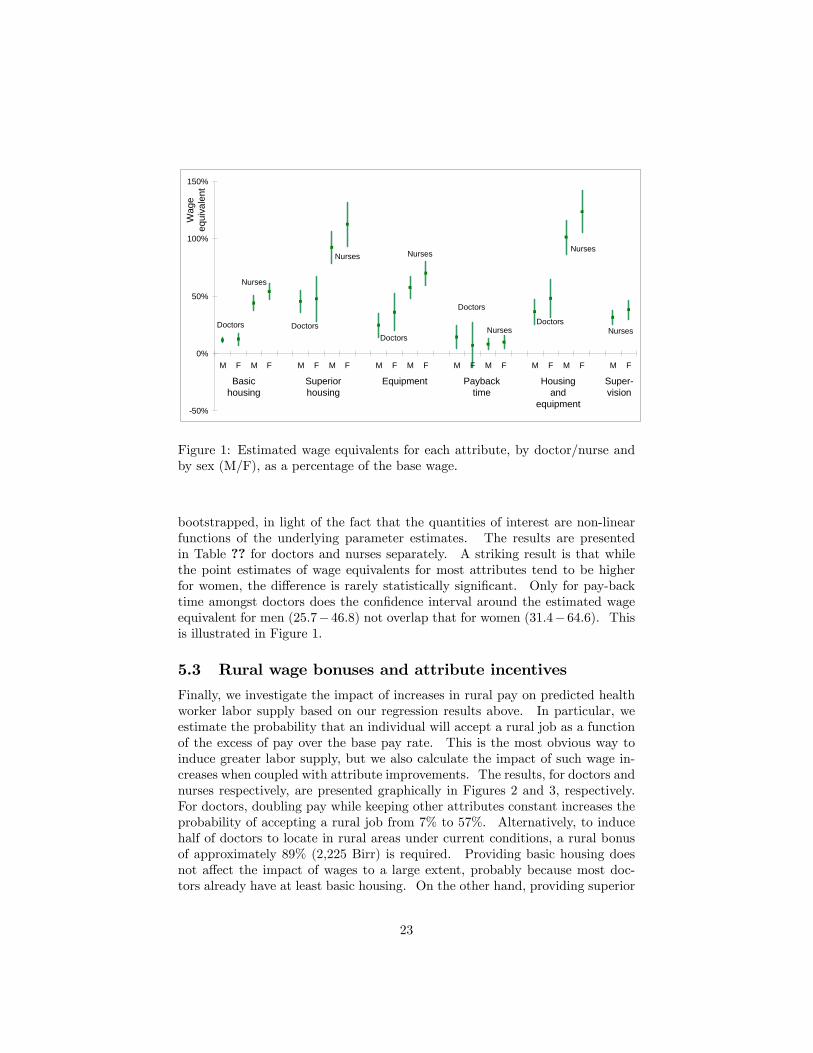
Figure 1: Estimated wage equivalents for each attribute, by doctor/nurse andby sex (M/F), as a percentage of the base wage.
bootstrapped, in light of the fact that the quantities of interest are non-linearfunctions of the underlying parameter estimates. The results are presentedin Table ?? for doctors and nurses separately. A striking result is that whilethe point estimates of wage equivalents for most attributes tend to be higherfor women, the di¤erence is rarely statistically signi�cant. Only for pay-backtime amongst doctors does the con�dence interval around the estimated wageequivalent for men (25:7�46:8) not overlap that for women (31:4�64:6). Thisis illustrated in Figure 1.
5.3 Rural wage bonuses and attribute incentives
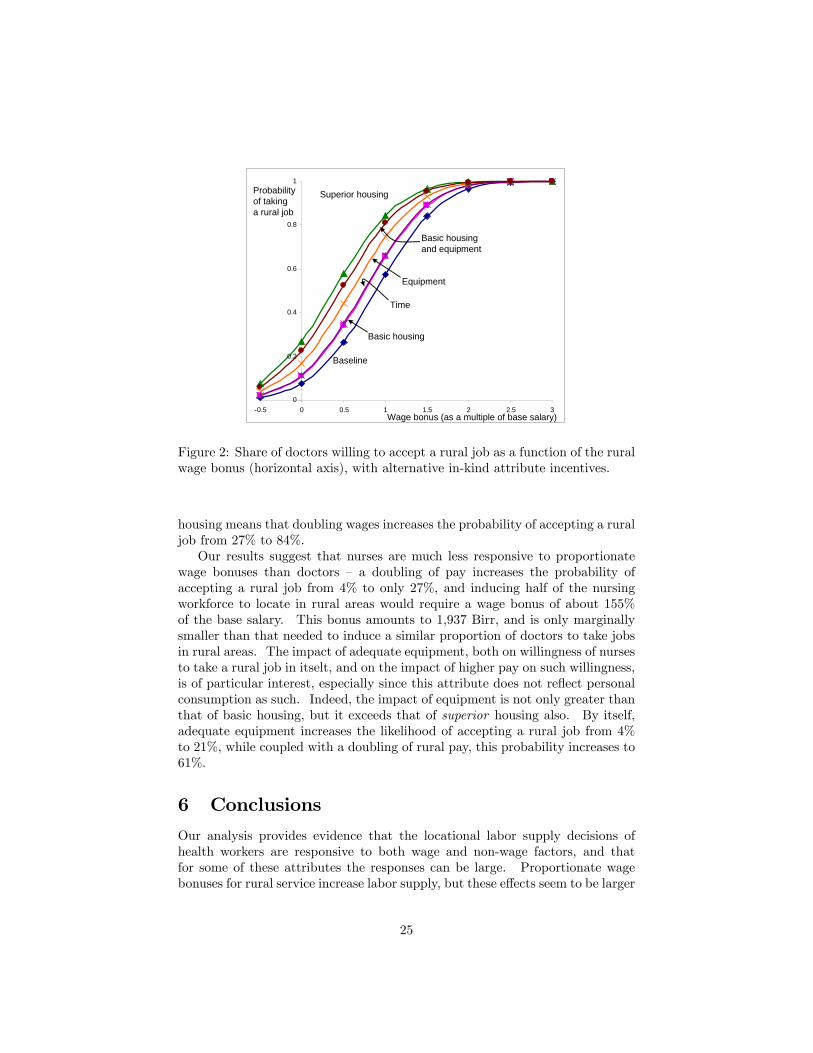
Finally, we investigate the impact of increases in rural pay on predicted healthworker labor supply based on our regression results above. In particular, weestimate the probability that an individual will accept a rural job as a functionof the excess of pay over the base pay rate. This is the most obvious way toinduce greater labor supply, but we also calculate the impact of such wage in-creases when coupled with attribute improvements. The results, for doctors andnurses respectively, are presented graphically in Figures 2 and 3, respectively.For doctors, doubling pay while keeping other attributes constant increases theprobability of accepting a rural job from 7% to 57%. Alternatively, to inducehalf of doctors to locate in rural areas under current conditions, a rural bonusof approximately 89% (2,225 Birr) is required. Providing basic housing doesnot a¤ect the impact of wages to a large extent, probably because most doc-tors already have at least basic housing. On the other hand, providing superior
Figure 2: Share of doctors willing to accept a rural job as a function of the ruralwage bonus (horizontal axis), with alternative in-kind attribute incentives.
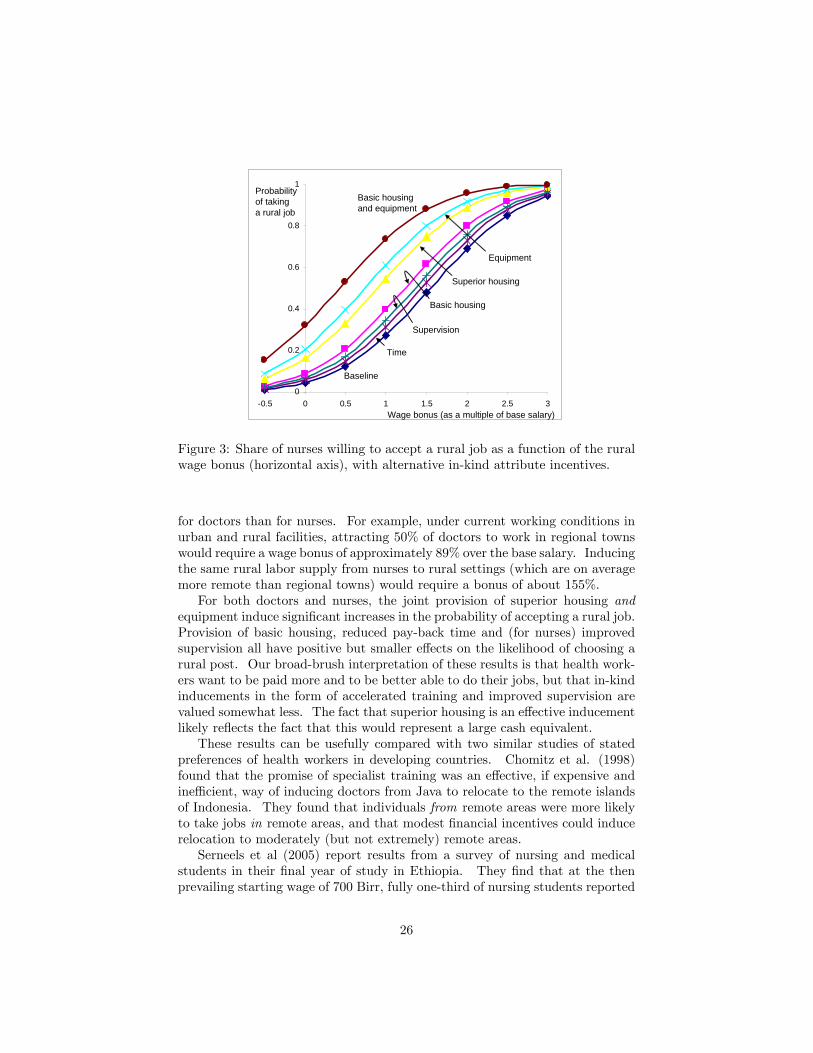
housing means that doubling wages increases the probability of accepting a ruraljob from 27% to 84%.Our results suggest that nurses are much less responsive to proportionate
wage bonuses than doctors � a doubling of pay increases the probability ofaccepting a rural job from 4% to only 27%, and inducing half of the nursingworkforce to locate in rural areas would require a wage bonus of about 155%of the base salary. This bonus amounts to 1,937 Birr, and is only marginallysmaller than that needed to induce a similar proportion of doctors to take jobsin rural areas. The impact of adequate equipment, both on willingness of nursesto take a rural job in itselt, and on the impact of higher pay on such willingness,is of particular interest, especially since this attribute does not re�ect personalconsumption as such. Indeed, the impact of equipment is not only greater thanthat of basic housing, but it exceeds that of superior housing also. By itself,adequate equipment increases the likelihood of accepting a rural job from 4%to 21%, while coupled with a doubling of rural pay, this probability increases to61%.
6 Conclusions
Our analysis provides evidence that the locational labor supply decisions ofhealth workers are responsive to both wage and non-wage factors, and thatfor some of these attributes the responses can be large. Proportionate wagebonuses for rural service increase labor supply, but these e¤ects seem to be larger
25
0
0.2
0.4
0.6
0.8
1
0.5 0 0.5 1 1.5 2 2.5 3
Baseline
Basic housing
Superior housing
Equipment
Time
Basic housingand equipment
Supervision
Wage bonus (as a multiple of base salary)
Probabilityof takinga rural job
Figure 3: Share of nurses willing to accept a rural job as a function of the ruralwage bonus (horizontal axis), with alternative in-kind attribute incentives.
for doctors than for nurses. For example, under current working conditions inurban and rural facilities, attracting 50% of doctors to work in regional townswould require a wage bonus of approximately 89% over the base salary. Inducingthe same rural labor supply from nurses to rural settings (which are on averagemore remote than regional towns) would require a bonus of about 155%.For both doctors and nurses, the joint provision of superior housing and
equipment induce signi�cant increases in the probability of accepting a rural job.Provision of basic housing, reduced pay-back time and (for nurses) improvedsupervision all have positive but smaller e¤ects on the likelihood of choosing arural post. Our broad-brush interpretation of these results is that health work-ers want to be paid more and to be better able to do their jobs, but that in-kindinducements in the form of accelerated training and improved supervision arevalued somewhat less. The fact that superior housing is an e¤ective inducementlikely re�ects the fact that this would represent a large cash equivalent.These results can be usefully compared with two similar studies of stated
preferences of health workers in developing countries. Chomitz et al. (1998)found that the promise of specialist training was an e¤ective, if expensive andine¢ cient, way of inducing doctors from Java to relocate to the remote islandsof Indonesia. They found that individuals from remote areas were more likelyto take jobs in remote areas, and that modest �nancial incentives could inducerelocation to moderately (but not extremely) remote areas.Serneels et al (2005) report results from a survey of nursing and medical
students in their �nal year of study in Ethiopia. They �nd that at the thenprevailing starting wage of 700 Birr, fully one-third of nursing students reported
26
that they would choose to work in a rural area (de�ned as 500km from Addis),and that a rural bonus of just 31% would be su¢ cient to induce all studentnurses to take such jobs. To get all graduating doctors to move to the ruralareas requires a bonus of just 39% of the starting salary. These results stand incontrast to those of this paper: we found above that doctors in our sample wouldneed to be paid a bonus of about two and a half times the base salary in orderto induce (nearly) all of them to work in a rural area, while the corresponding�gure for nurses is about three time. The di¤erence may stem from the factthat our samples were very di¤erent: Serneels et al. interviewed students, whilewe surveyed health workers at various stages of their careers. Finally, Serneelset al. report that the availability of children�s educational opportunities wasone of the main attractions of work in Addis Ababa. Somewhat surprisingly,we �nd only weak evidence of this e¤ect in our data: the number of children ahealth worker has does not appear to have an economically signi�cant in�uenceon her/his valuation of alternative job attributes (including location). Wespeculate that this may be due to the widespread practice of sending childrento boarding school amongst Ethiopia�s upper classes.These results can provide guidance to policy-makers about the potential
trade-o¤s between alternative policies to encourage health workers to acceptrural jobs. However, without detailed information on the costs of altering thespeci�ed attributes, it is impossible to rank the alternative policy interventionsin terms of any cost-e¤ectiveness measure.11 However, our wage-equivalentanalysis is a �rst step towards allowing such a comparison. In addition, thelimitations of stated preference studies should be kept in mind, and ideallywe would seek to validate our results by comparing them with evidence fromrevealed preference analyses.
11Note that cost-e¤ectiveness is a useful measure if the objective of increasing labor supplyis taken as given. It does not inform the question of whether such changes in labor supplyare warranted - we take this as self-evident in this case.
27
7 References
Anand and Barnighausen (2004): LancetChomitz, Kenneth, Gunawan Setiadi, Azrul Azwar, Nusye Ismail, and Widi-
yarti (1998): "What do doctors want? Developing Incentives for Doctors toServe in Indonesia�s Rural and Remote Areas," World Bank Policy ResearchWorking Paper 1888, World Bank, Washington DC.Hole AR (2007): "A comparison of approaches to estimating con�dence
intervals for willingness to pay measures," Health Economics 16(8): 827-40.Huber J and Zwerina K. (1996): The importance of utility balance in e¢ cient
choice designs. Journal of Marketing Research 33: 307-317.Joint Learning Initiative (2004). Human resources for health: overcoming
the crisis. Boston MA: Joint Learning InitiativeMangham L and Hanson K (2007): "Eliciting the employment preferences
of public sector nurses: results from a discrete choice experiment in Malawi,"Unpublished mimeo.Ministry of Health, Government of Ethiopia (2005): Health and health-
sta¤ dynamics and implications for maternal health provision in public healthfacilities in the context of HIV/AIDS," Johannesburg: Centre for Health Policy,University of the Witswatersrand.Ryan M and Gerard K (2003): "Using discrete choice experiments in health
economics: moving forward," In Scott A, Maynard A and Elliott R, eds. Ad-vances in Health Economics. John Wiley and SonsRyan M and Gerard K (2003): "Using discrete choice experiments to value
health care programmes: current practice and future research re�ections," Ap-plied Health Economics and Health Policy, 2(1): 55-64Scott A (2001): "Eliciting GPs preferences for pecuniary and non-pecuniary
job characteristics," Journal of Health Economics 20: 329-347.Serneels, Pieter, ose Garcia-Montalvo, Magnus Lindelow, and Abigail Barr
(2005): "For Public Service or for Money: Understanding Geographical Imbal-ances in the Health Workforce," World Bank Policy Research Working Paper3686, World Bank, Washington DC.WHO (2006): World Health Report 2006: Working together for health.
Geneva: World Health OrganizationWilbulpolprasert S, and Pengpaibon P. (2003): "Integrated strategies to
tackle the inequitable distribution of doctors in Thailand: four decades of ex-perience," Human Resources for Health, 1: 12.
28
8 Appendix: Description of job attributes fordoctors and nurses
Here we report the descriptions of job attributes and possible levels that werepresented to respondents.
8.1 Doctors
For doctors, the job attributes and possible levels were described to the respon-dents as follows:
� Geographic Location
This attribute speci�es whether your place of work is in Addis Ababa or ina zonal capital of one of the zones. If the latter, you should think of the job asbeing randomly situated in one of the zonal capitals in Ethiopia, or alternatively,in �an average zonal capital�.
� Net Monthly Pay (including regular allowances)
This attribute takes on di¤erent Birr levels. The �rst represents the basesalary for a physician at an �average�grade in the civil service pay scale, whilehigher levels are multiples of this average base level. Note that the base salarydoes not necessarily re�ect your current actual salary.
� Government-provided Housing
This attribute measures the existence, and quality, of government-providedhousing, and has three possible levels. �None�means there is no housing pro-vided by the government as part of the conditions of employment. �Basic�housing means the government provides housing for the health worker, but thatit is rudimentary, having no electricity or running water, and with at best anoutside toilet. �Superior� housing means the government provides housing ofhigher quality, including the presence of electricity and running water, includingan inside �ush toilet.
� Availability of Equipment and Drugs
This attribute simply takes on two values ��inadequate�and �improved�.�Inadequate� is the standard of equipment and availability of drugs that youmight expect in a poorly equipped public facility in the given location. �Im-proved�is that level of supplies that would result from a doubling of the budgetcurrently spent on equipment and drugs.
� Time Commitment following Training
Suppose your employer provides or sponsors training on your behalf. Thisattribute measures the number of years you are required to work for the sponsorfor each year of training provided. It can take on two values: 1 and 2.
29
� Permission to hold a Second Job in the Private Sector
This attribute is 1 if you are permitted work in the private sector (eitherusing the public facility or not), and 0 if you are not permitted to do so.
8.2 Nurses
For nurses, some of the job attributes and possible levels di¤er to those o¤eredto doctors:
� Geographic Location
This attribute speci�es whether your place of work is in a City (i.e., a zonalor regional capital, or Addis Ababa), or in a Rural area. If the job is a �City�job, you should think of it as being randomly situated in one of the zonal capitalsor larger cities in Ethiopia, or alternatively, in �an average city�. If the job isa �Rural� job, you should think of it as being randomly situated in a town orvillage outside of the zonal capitals and larger cities.
� Net Monthly Pay (including regular allowances)
This attribute takes on di¤erent Birr levels. The �rst represents the basesalary for a nurse at an �average� grade in the civil service pay scale, whilehigher levels are multiples of this average base level. Note that the base salarydoes not necessarily re�ect your current actual salary.
� Government-provided Housing
Same as for doctors.
� Availability of Equipment and Drugs
Same as for doctors.
� Time Commitment following Training
Same as for doctors.
� Level of supervision
This attribute attempts to measure the degree of professional interactionyou have with your superiors, and takes on two values �high and low. A highlevel of supervision could result from regular and productive interaction witha supervisor who works in the same facility as you, or from regular visits (sayevery one or two weeks) from a more senior health worker from another facility,such as a zonal hospital. A low level of supervision could arise due to lack ofinteraction by more senior health workers who work at your facility, or becauseof infrequent visits (say once every six months or less) by such superiors fromother institutions.