310
Healthcare-Associated Infections in Pennsylvania 2014 Report
Healthcare-Associated Infections in Pennsylvania
2014 Report

Contents
1 Executive Summary 3
2 Introduction 5
3 Data and Methods 7
4 Results 104.1 Hospital Characteristics . . . . . . . . . . . . . . . . . . . . . . . . . . . 104.2 Overall Patterns of Healthcare-Associated Infections (HAIs) . . . . . . . . . . . . . . 10
4.2.1 Methicillin-Resistant Staphylococcus aureus (MRSA) . . . . . . . . . . . . . . 114.2.2 HAIs and Unadjusted (Crude) Infection Rates by Facility. . . . . . . . . . . . . 12
4.3 Catheter-Associated Urinary Tract Infections (CAUTIs) . . . . . . . . . . . . . . . . 414.3.1 CAUTIs — Statewide Summary . . . . . . . . . . . . . . . . . . . . . . 414.3.2 CAUTIs — By Unit Type . . . . . . . . . . . . . . . . . . . . . . . . 414.3.3 CAUTIs — By Pathogen . . . . . . . . . . . . . . . . . . . . . . . . 444.3.4 CAUTIs — By Facility . . . . . . . . . . . . . . . . . . . . . . . . . 45
4.4 Central Line-Associated Bloodstream Infections (CLABSIs) . . . . . . . . . . . . . . 824.4.1 CLABSIs — Statewide Summary . . . . . . . . . . . . . . . . . . . . . 824.4.2 CLABSIs — By Unit Type . . . . . . . . . . . . . . . . . . . . . . . . 844.4.3 CLABSIs — By Pathogen . . . . . . . . . . . . . . . . . . . . . . . . 884.4.4 CLABSIs — By Facility . . . . . . . . . . . . . . . . . . . . . . . . . 88
4.5 Surgical site infections (SSIs) . . . . . . . . . . . . . . . . . . . . . . . . . 1374.5.1 SSIs — Statewide Summary . . . . . . . . . . . . . . . . . . . . . . . 1374.5.2 SSIs — By Pathogen . . . . . . . . . . . . . . . . . . . . . . . . . . 1394.5.3 SSIs — Risk-Adjusted Rates . . . . . . . . . . . . . . . . . . . . . . . 1394.5.4 SSIs — By Procedure Type and Facility . . . . . . . . . . . . . . . . . . . 141
4.6 Influenza Vaccination of Healthcare Providers (HCP) . . . . . . . . . . . . . . . . . 2764.6.1 Influenza Vaccination of HCP — Statewide Summary . . . . . . . . . . . . . . 2764.6.2 Influenza Vaccination of HCP — By Facility . . . . . . . . . . . . . . . . . 277
5 Conclusion 307
6 References 309
List of Tables
4.1.1 Hospital Characteristics . . . . . . . . . . . . . . . . . . . . . . . . . . . 104.2.1 HAIs Statewide . . . . . . . . . . . . . . . . . . . . . . . . . . . . . . 114.2.2 HAIs by Type . . . . . . . . . . . . . . . . . . . . . . . . . . . . . . . 114.2.3 HAIs with Methicillin Resistant Staphlococcus aureus by Type . . . . . . . . . . . . . 124.2.4 HAIs and Crude Infection Rates by Facility . . . . . . . . . . . . . . . . . . . . 134.3.1 CAUTIs Statewide . . . . . . . . . . . . . . . . . . . . . . . . . . . . . 414.3.2 CAUTIs and Device Utilization Rates by Location (within Facility) . . . . . . . . . . . 424.3.3 CAUTIs by Pathogen . . . . . . . . . . . . . . . . . . . . . . . . . . . . 454.3.4 Facilities with Significantly Fewer CAUTIs than Predicted (Better SIR) . . . . . . . . . . 474.3.5 Facilities with Significantly More CAUTIs than Predicted (Worse SIR) . . . . . . . . . . 484.3.6 Facilities Omitted from CAUTI SIR Analysis . . . . . . . . . . . . . . . . . . . . 494.3.7 CAUTIs and Standardized Infection Ratios (SIRs) by Facility. . . . . . . . . . . . . . 504.4.1 Reporting Locations Among Facilities with Central Line Days . . . . . . . . . . . . . 824.4.2 CLABSIs Statewide . . . . . . . . . . . . . . . . . . . . . . . . . . . . . 834.4.3 CLABSIs and Device Utilization Rates by Location (within Facility) . . . . . . . . . . . 844.4.4 CLABSIs by Pathogen . . . . . . . . . . . . . . . . . . . . . . . . . . . . 884.4.5 Hospitals with Significantly Fewer CLABSIs than Predicted (Better = Smaller SIR) . . . . . 904.4.6 Hospitals with Significantly More CLABSIs than Predicted (Worse = Larger SIR) . . . . . . 90
1

4.4.7 Hospitals Omitted from CLABSI SIR Analysis . . . . . . . . . . . . . . . . . . . 914.4.8 ICUs and Wards: CLABSIs and Standardized Infection Ratios (SIRs) By Facility . . . . . . 924.4.9 NICUs: CLABSIs and Standardized Infection Ratios (SIRs) By Facility . . . . . . . . . . 1154.4.10 SCAs: CLABSIs and Standardized Infection Ratios (SIRs) By Facility . . . . . . . . . . 1214.4.11 LTACs: CLABSIs and Standardized Infection Ratios (SIRs) By Facility . . . . . . . . . . 1244.5.1 SSIs Summary . . . . . . . . . . . . . . . . . . . . . . . . . . . . . . . 1384.5.2 SSIs by Pathogen . . . . . . . . . . . . . . . . . . . . . . . . . . . . . . 1394.5.3 SSIs by Benchmarked Procedure and Risk Index . . . . . . . . . . . . . . . . . . 1414.5.4 SSIs Hospital Performance . . . . . . . . . . . . . . . . . . . . . . . . . . 1444.5.5 Hospitals Omitted from SSI SIR Analysis . . . . . . . . . . . . . . . . . . . . . 1464.5.6 Hospitals with Significantly Fewer SSIs than Predicted (Better = Smaller SIR) . . . . . . . 1484.5.7 Hospitals with Significantly More SSIs than Predicted (Worse = Larger SIR) . . . . . . . . 1494.5.8 SSIs — Cardiac Procedures, SIRs by Hospital . . . . . . . . . . . . . . . . . . . 1504.5.9 SSIs — Coronary Bypass (Two Incision) Procedures, SIRs by Hospital . . . . . . . . . . 1604.5.10 SSIs — Coronary Bypass (One Incision) Procedures, SIRs by Hospital . . . . . . . . . . 1684.5.11 SSIs — Knee Arthroplasty, SIRs by Hospital . . . . . . . . . . . . . . . . . . . . 1774.5.12 SSIs — Hip Arthroplasty, SIRs by Hospital . . . . . . . . . . . . . . . . . . . . 1984.5.13 SSIs — Abdominal Hysterectomy, SIRs by Hospital . . . . . . . . . . . . . . . . . 2194.5.14 SSIs — Colon Surgery, SIRs by Hospital . . . . . . . . . . . . . . . . . . . . . 2394.5.15 SSIs — SIRs for Each Procedure by Hospital . . . . . . . . . . . . . . . . . . . . 2514.6.1 Summary of HCP Influenza Vaccination Rates . . . . . . . . . . . . . . . . . . . 2774.6.2 Hospitals with Seasonal Influenza Vaccination Rate of 90 Percent or Better . . . . . . . . . 2814.6.3 Influenza Vaccination Rates Among HCP By Facility . . . . . . . . . . . . . . . . . 284
List of Figures
4.3.1 Facility Ranking by CAUTI SIR (Grouped by Number of Predicted Infections: <1) . . . . . . 764.3.2 Facility Ranking by CAUTI SIR (Grouped by Number of Predicted Infections: 1–2.99) . . . . 774.3.3 Facility Ranking by CAUTI SIR (Grouped by Number of Predicted Infections: 3–7.49) . . . . 784.3.4 Facility Ranking by CAUTI SIR (Grouped by Number of Predicted Infections: 7.5–14.99) . . . 794.3.5 Facility Ranking by CAUTI SIR (Grouped by Number of Predicted Infections: 15–29.99). . . . 804.3.6 Facility Ranking by CAUTI SIR (Grouped by Number of Predicted Infections: > 30) . . . . . 814.4.1 CLABSI by Unit Type and Year . . . . . . . . . . . . . . . . . . . . . . . . 834.4.2 CLABSI Reported from SCA Among Patients with Permanent and Temporary Central Lines . . 874.4.3 ICUs and Wards: Facility Ranking by CLABSI SIR (Predicted Infections: 0–0.29) . . . . . . 1274.4.4 ICUs and Wards: Facility Ranking by CLABSI SIR (Predicted Infections: 0.5–0.99) . . . . . 1284.4.5 ICUs and Wards: Facility Ranking by CLABSI SIR (Predicted Infections: 1–2.99) . . . . . . 1294.4.6 ICUs and Wards: Facility Ranking by CLABSI SIR (Predicted Infections: 3–7.49) . . . . . . 1304.4.7 ICUs and Wards: Facility Ranking by CLABSI SIR (Predicted Infections: >= 7.5) . . . . . . 1314.4.8 LTACs: Facility Ranking by CLABSI SIR . . . . . . . . . . . . . . . . . . . . . 1324.4.9 NICUs: Facility Ranking by CLABSI SIR (Predicted Infections: < 1) . . . . . . . . . . . 1334.4.10 NICUs: Facility Ranking by CLABSI SIR (Predicted Infections: >= 1) . . . . . . . . . . 1344.4.11 SCAs: Facility Ranking by CLABSI SIR (Predicted Infections: < 7.5) . . . . . . . . . . 1354.4.12 SCAs: Facility Ranking by CLABSI SIR (Predicted Infections: >= 7.5) . . . . . . . . . . 1364.6.1 Distribution of Facility HCP Influneza Vaccination Rates by Worker Type . . . . . . . . . 2784.6.2 Distribution of Facility HCP Influneza Vaccination Rates Among 25 Largest Facilities . . . . . 2794.6.3 Map Employee Influenza Vaccination Rates by Facility . . . . . . . . . . . . . . . . 280
2
1 Executive Summary
Overview The 2014 report on the occurrence and patterns of healthcare-associated infections (HAIs) is the seventhto be released by the Pennsylvania Department of Health (PADOH). Overall, the incidence of HAIs has declinedsubstantially since the 2007 amendment of the MCARE Act (Act 52 of 2007). Compared to baseline Pennsylvaniadata from 2009, the rate of HAIs has decreased seven percent overall with more significant improvements in specificareas. Using conservative estimates, this translates to a minimum savings of $138 million in direct health care costs.
PADOH uses three specific categories of HAIs for benchmarking. These are: catheter-associated urinary tractinfections (CAUTIs), central line-associated bloodstream infections (CLABSIs) and selected surgical site infections(SSIs). The 2014 Pennsylvania CLABSI and CAUTI rates are 41 percent and 20 percent less than the rates reportedin 2009. While extensive trend analyses are limited by changes in the national case definition, hospitals have madesubstantial reductions in SSIs; the 2014 unadjusted crude rate of SSIs among 7 benchmarked procedures is fourpercent less than in 2013. From these rate reductions, we estimate that 3,047 CLABSIs and 2,063 CAUTIs wereprevented since 2009.
Healthcare worker influenza vaccination prevents absenteeism (30 percent reduction in some studies) and preventstransmission to patients and co-workers. During the 2014–2015 influenza season, 120 (48 percent) facilities reportedan employee vaccination rate of 90 percent or better, a Healthy People 2020 goal. This is a 173 percent increase sincethe 2011-2012 influenza season.
The observed reduction in HAIs is likely the result of ongoing efforts undertaken by infection preventionists, HCPs andsystems, professional societies, and governmental agencies to control and prevent the occurrence of HAIs. The impactof on-going efforts and new initiatives, guided by the best-available scientific evidence, should improve the healthstatus and outcomes of patients cared for in Pennsylvania hospitals — the primary motivation for HAI preventionand control — as well as reduce health care expenditures.
Background All hospitals in Pennsylvania are required to report any HAI that occurs in an inpatient location.These infections are reported by the hospitals to the Centers for Disease Control and Prevention’s (CDC’s) NationalHealthcare Safety Network (NHSN), which is now the primary data collection tool used for HAI reporting by morethan 5,000 hospitals across the country. The information submitted to NHSN from Pennsylvania hospitals is providedto PADOH in order to be compiled, analyzed and published on an annual basis.
As in previous reports, the 2014 report contains a summary of the overall and hospital-specific number and type ofHAIs. This is followed by separate sections on each of the three HAI categories that PADOH uses for benchmarkinghospital performance. Hospital comparisons in these sections are done using the same risk-adjusted standardizedinfection ratio (SIR) approach used in previous Pennsylvania reports. The SIR is a value based on the ratio ofinfections reported by each hospital to NHSN (referred to as observed infections) to the number of infectionspredicted to occur at that hospital (referred to as predicted infections). The number of predicted infections is acalculated value that PADOH assigns to the hospital based on the overall statewide rate for each type of infection.
Universal influenza vaccination is the single most important measure to prevent transmission of influenza, and it is animportant indicator of a hospital’s commitment to patient safety. Health care provider (HCP) influenza vaccinationof 90 percent or better is a Healthy People 2020 goal. The 2011 report was the first report in which PADOH reportedstatewide HCP influenza vaccination rates. This 2014 report includes hospital-specific HCP influenza vaccinationrates during the 2014–2015 influenza season and recognizes those facilities that have already achieved the HealthyPeople 2020 goal.
All Healthcare-Associated Infections (HAIs) In 2014, there were 247 hospitals in Pennsylvania that submitteddata to NHSN and were in continuous operation over the 12-month time period. Cumulatively, these hospitalsreported a total of 22,552 HAIs occurring over 9,757,224 patient days of hospital care. Patient-days are the numberof hospitalizations multiplied by the length of stay of each hospitalization (i.e., one patient hospitalized for five daysequals five patient days). This results in an overall statewide rate of 2.3 HAIs per 1,000 patient days. This is a6 percent decrease from the overall HAI rate in 2013 and a 7 percent decrease from 2009, which is considered the
3

baseline year of measurement for Act 52. This represents 9,280 fewer HAIs than would have occurred if the 2009 HAIrate had persisted into 2014. In this report, as in past reports, the most commonly reported categories of HAIs areSSIs (26.4 percent), urinary tract infections (UTI; 26.2 percent) and gastrointestinal infections (GI; 18.9 percent).
Catheter-Associated Urinary Tract Infections (CAUTIs) Among the 247 hospitals, there were 222 (90percent) that reported using urinary catheters and 169 (76.1 percent of those using urinary catheters) that reportedat least one CAUTI. There were a total of 2,725 CAUTIs reported in 2014 and more than 1.5 million days of urinarycatheter use, for a rate of 1.82 CAUTIs per 1,000 urinary catheter days. Compared to 2013, this represents a 5 percentdecrease in the CAUTI rate, and a 8 percent decline when compared to the baseline year of 2009. This translatesto 2,063 fewer CAUTIs in Pennsylvania since 2009. Among the 222 hospitals reporting use of urinary catheters in2014, there were 32 (14 percent) that reported significantly fewer CAUTIs than PADOH predicted would occur and21 (10 percent) that reported significantly more CAUTIs than predicted by PADOH.
Central Line-Associated Bloodstream Infections (CLABSIs) Among the 247 hospitals, there were 215 (87percent) that used central lines (catheters inserted into the large arteries near the heart) and 136 (63 percent ofthose using central lines) that reported at least one CLABSI. There were a total of 1,140 CLABSIs reported in 2014and more than 1.5 million days of central line use, giving an overall rate of 0.7 CLABSIs per 1,000 central line days.This is 18 percent less than the rate in 2013 and is 41 percent less than the baseline year of 2009. This translates to3,047 fewer CLABSIs in Pennsylvania since 2009. CLABSIs are subdivided by hospital location type. In neonatalintensive care units (NICUs), the CLABSI rate in 2014 was 1.6 per 1,000 central line days. This rate is 41 percentlower than the baseline 2009 rate of 2.46 per 1,000 central line days. In specialty care areas, the CLABSI rate in2014 was 1.1 per 1,000 central line days. In long term acute care units, the CLABSI rate in 2014 was 0.88 per 1,000central line days.
Surgical Site Infections (SSIs) A number of changes in SSI surveillance occurred in 2012 and 2013 as a result ofchanges to NHSN case definitions and CMS reporting requirements. These changes make year-to-year comparisonsdifficult. Colon surgeries were added in 2012 as a seventh benchmarked procedure. In addition, NHSN definitionsfor implant-associated surgical procedures currently require a 3-month follow-up period to detect an SSI. It shouldbe noted that this change in the NHSN case definition was only recently implemented in 2013 and prior to that,there was a 12-month follow-up period. Therefore, this report includes both 2012 and 2013 data. The number ofobserved infections within a 3-month follow-up period is likely to be modestly lower than with a 12-month follow-upperiod. It is also important to note that this data only reflects inpatient procedures and does not include proceduresperformed at ambulatory surgery centers or on an outpatient basis.
In 2014, at least one of the seven benchmarked procedures was performed in 167 Pennsylvania hospitals. For all sevenprocedures combined, a total of 94,179 procedures were performed in 2014. Knee prosthesis surgeries constitute 44percent of all benchmarked surgeries. For all seven procedures combined, a total of 1,786 SSIs were identified in2014. This produced overall rates of 1.5 SSIs per 100 procedures (unadjusted crude rates). These rates are higherthan rates reported prior to 2012 because colon surgeries, now included in aggregate rates, account for 17 percentof all procedures and result in a disproportion number of infections. Nonethless, SSI rates decreased to their lowestlevels among cardiac procedures, cardiac bypass graft surgery with one incision, cardiac bypass graft surgery withtwo incisions, knee prosthesis procedures and hip prosthesis surgeries.
4
2 Introduction
Healthcare-associated infection (HAI) is the term used for an infection that occurs in a patient as a direct consequenceof the health care interventions being delivered to them. HAIs are one of the major types of adverse events that canoccur in the health care environment and are a considerable patient safety concern. HAIs represent a diverse group ofcomplications, ranging from infections that occur in a surgical wound to pneumonias among patients on ventilators.They vary based on the reason that the patient is receiving care, the type of interventions being administered,the portion of the health care system being used by the patient, and the patient’s underlying health status andcircumstances. HAIs also vary substantially in terms of their impact on the patient, the outcome and their costs.They can be relatively minor and easily treatable (such as a minor skin infection in an outpatient) or they can resultin significant patient deterioration, longer hospital stays and even death. Taken as a group, HAIs are consideredamong the leading causes of death in the United States and have been estimated to cost the health care system tensof billions of dollars annually.
These factors have resulted in a growing awareness of the importance of HAIs and have helped to establish patientsafety as a core pillar of the health care system. Although HAIs are an important factor throughout the healthcare continuum, nowhere are they more impactful than in the hospital setting, where the sickest patients are usuallytreated.
As recently as the 1990s, HAIs were considered an inevitable consequence of health care delivery. But this view hasshifted dramatically as HAIs have come to be recognized as preventable. This had led to a paradigm shift throughoutthe health care system that the elimination of HAIs as a public health and patient safety concern is a possibility andthe ultimate goal. In a 2010 article co-authored by the Centers for Disease Control and Prevention (CDC) and aconsortium of patient safety organizations, four major pillars crucial to meeting the goal of elimination of HAIs wereidentified (Cardo et al., 2010). They are:
1. Comprehensive, systematic and continuous adherence to evidence-based prevention practices;
2. Alignment of incentives to promote the adoption of prevention practices;
3. Conducting research to identify strategies to reduce HAIs where knowledge gaps remain; and
4. Collecting, analyzing and disseminating data for action.
Pennsylvania is considered a national leader in all of these areas. Researchers in the commonwealth have conductedsome of the seminal studies used to develop the knowledge base for HAI prevention. Practitioners have demonstratedthe impact of systematic implementation of HAI prevention strategies. Pennsylvania was one of the first states torequire that all hospitals publicly disclose their HAI data.
The current report focuses on the fourth pillar of the HAI elimination blueprint published in 2010. Legislation knownas Act 52 was passed and enacted in 2007 that contains the most comprehensive reporting requirements of any state.The act requires PADOH to collect information on all inpatient HAIs, summarize the findings and publicly reportthe results.
Since Act 52 requirements took effect in February 2008, PADOH has published a comprehensive report on thepatterns of HAIs in Pennsylvania. The current report is the sixth in this series. It includes data on the overallpatterns of HAIs in Pennsylvania acute care inpatient institutions and focuses on the three types of HAIs that areused to measure the progress in HAI reductions. These HAI types are known as benchmark HAIs. They wereselected by PADOH in collaboration with a statewide HAI Advisory Committee established by Act 52 based on thevolume of infections and their human and economic toll and preventability. They are catheter-associated urinarytract infections (CAUTIs), central line-associated bloodstream infections (CLABSIs) and seven different types ofsurgical site infections (SSIs). These HAI types were also selected to allow some type of measure to be establishedacross the range of inpatient facilities present in a large, diverse state like Pennsylvania. Even the smallest hospitalsare likely to use urinary catheters and to perform at least one of the seven surgical procedures.
With the growing focus on patient safety, the demand for measures of progress in reducing HAIs and in demonstrating
5
a culture of patient safety is also growing. In addition to measuring actual trends in HAIs, there is growing interestin assessing process measures of patient safety. Therefore, PADOH started publishing influenza vaccination ratesfor health care workers in the 2011 report. This section examines vaccination coverage of the health care workforceagainst influenza. Influenza is recognized as a major cause of illness and death, can be transmitted in health caresettings, and is preventable through vaccination. Major health care organizations, societies, and federal and stategovernments have all promoted influenza vaccination of health care workers to control influenza and to keep theworkforce healthy. The U.S. Department of Health and Human Services has established a Healthy People 2020 goalof 90 percent of health care workers to be vaccinated against influenza annually.
This is the third PADOH HAI annual report to contain health care worker influenza vaccination data and the secondannual report to include facility-specific rates. Submission of data on health care worker vaccination is not a mandatedrequirement of Act 52. PADOH, in collaboration with the Pennsylvania Health care Quality Alliance (PHCQA), con-ducted a voluntary survey of hospital health care worker influenza vaccination rates during the 2012–2013 influenzaseason. PADOH and other partners also conducted trainings for hospitals in anticipation of pay-for-reporting re-quirements implemented by the federal Centers for Medicare and Medicaid Services (CMS). These requirements wentinto effect in January 2013. For hospitals to receive full reimbursement from CMS within the inpatient prospectivepayment system (IPPS), hospitals are required to submit data to NHSN system that is currently used by Pennsyl-vania to report HAIs. In the 2011 report, PADOH published aggregated health care worker vaccination rates andrecognized the accomplishments of those facilities that achieved employee vaccination rates of 90 percent or better,but PADOH did not publish facility-specific rates. Since then, PADOH has included facility-specific rates in itsannual reports.
Hospital-specific trends in the occurrence of HAIs are included in tabular format throughout the report and asfacility-specific report cards in Appendix A. This will enable any user of the data to see whether the overall rates ofHAIs, and the rates of CAUTIs and CLABSIs, are increasing, decreasing or remaining stable on a hospital-by-hospitalbasis; however, year-to-year comparisons are complicated by changes in case definitions and inclusion criteria andstatistically imprecise rates for small facilities with few persons at risk. Inferences from year-to-year trends shouldbe used cautiously.
As in previous reports, the information in 2014 is divided into several sections. First, composite information isprovided for the entire state. This is followed by hospital-specific data on the overall numbers of HAIs in eachreporting category in NHSN. Separate sections then focus on CAUTIs, CLABSIs and SSIs, followed by the sectionon health care worker flu vaccination. The hospital-specific trends over time are included in each section as appropriateand as an appendix to the report.
It is important to note that PADOH works collaboratively with a variety of stakeholder organizations to promotehealth care quality and reduce the incidence of healthcare-associated infections. In addition, two governmentalpartners, the Pennsylvania Patient Safety Authority (PSA) and the Pennsylvania Health Care Cost ContainmentCouncil (PHC4), have specific roles under Act 52 and work closely with PADOH on HAI prevention and control.Readers of the annual report are encouraged to examine companion reports published by PSA and PHC4. The PSAannual report for 2014 describes PSA HAI- related activities and can be found at http://patientsafetyauthority.org. The PHC4 report titled, ”The Impact of Healthcare-Associated Infections in Pennsylvania, 2014,” examinescosts, mortality, readmissions and underlying health conditions associated with HAIs. It can be found at http:
//www.phc4.org.
6
3 Data and Methods
The data, analytic approaches and methods used in this report are similar to those used in previous reports.They are described in much greater detail in the 2009 report, which is available on the Pennsylvania Depart-ment of Health website at the following address: http://www.portal.health.state.pa.us/portal/server.pt/
community/healthcare_associated_infections/14234.
All hospitals are required to report all HAIs associated with any inpatient location using the Patient Safety Moduleof CDCs National Healthcare Safety Network. These infection types are:
• Bone and joint infections (BJ);
• Blood stream infections (BSI) with or without a central line (BSI associated with a central line are known ascentral line associated bloodstream infections [CLABSI]);
• Central nervous system infections (CNS);
• Cardiovascular system infections (CVS);
• Eye, Ear, Nose and Throat infections (EENT);
• Gastrointestinal infections (GI);
• Lower respiratory tract infections (LRI);
• Pneumonia (PNEU) whether ventilator or non-ventilator associated;
• Reproductive tract infections (REPR);
• Skin and soft tissue infections (SST);
• Surgical site infections (SSI);
• Systemic infections (SYS); and
• Urinary tract infections (UTI) with or without a catheter (UTI associated with a urinary catheter are knownas catheter-associated urinary tract infections [CAUTI]).
NHSN uses standardized definitions for each of these infection types, including methods for their detection, howthey are to be identified, and the time frames for the infection to occur upon and after hospitalization. The NHSNdefinitions can be found in the NHSN Patient Safety Manual at http://www.cdc.gov/nhsn. Infection preventionistsand data reporters under Act 52 are required to use the standardized NHSN criteria and methods to determinewhether an identified infection should be reported as an HAI.
Hospitals also collect certain denominator information to enable the calculation of HAI rates. This informationincludes:
• Patient days: the total number of patients in the hospital per day over the entire calendar year (total hospital-izations multiplied by the duration of each hospitalization);
• Urinary catheter days: the total number of hospitalized patients with a urinary catheter in place per day overthe entire calendar year (total number of patients with a urinary catheter in place multiplied by the numberof days a catheter was used for each patient); and
• Central line days: the total number of hospitalized patients with a central line in place per day over the entirecalendar year (total number of patients with at least one central line in place multiplied by the number of days
7

a central line was in place for each patient).
For the seven benchmarked surgical procedures, hospitals collect and submit certain standardized information on allpatients who had the procedure performed during the period of interest, not just those in whom an HAI subsequentlydeveloped. This includes risk index information for all patients undergoing one of the benchmarked procedures,allowing risk index-specific HAI rates for each procedure category.
The overall rate of HAIs by hospital (Table 4.2.4) is calculated as infections per 1,000 patient days. This is a standardmethod of reporting HAIs. All of the reported rates are unadjusted for factors that might be related to differences inHAIs between or within a hospital, such as the type and intensity of care, size of the facility or differences in patientpopulations.
Elsewhere in the report, CLABSI and CAUTI rates are reported per 1,000 device days (either catheter days orcentral line days), since these are the more appropriate denominators. Similarly, for benchmarked SSIs, the rates arereported as infections per 100 procedures.
Hospitals also complete accessory reports that indicate the ward types present in their facility, the number of infectionpreventionists and hospital characteristics (including number of beds). This information is summarized in Table4.1.1.
NHSN contains certain basic error checks that help to ensure that the information reported into the system is valid.PADOH also reviews the information submitted by each Pennsylvania hospital on a quarterly basis to spot unusualpatterns or information that might suggest reporting errors or incomplete reporting. Each hospital receives a dataintegrity verification (DIV) report every 90 days that includes a list of any questionable reports submitted in thepreceding quarter. The hospital is then given 30 days to review and correct the information before the data areconsidered locked down for analytical purposes. In 2011, PADOH also initiated on-site auditing procedures forselected hospitals to further determine the accuracy of the information reported in NHSN. The auditing processfocused on the benchmarking categories of CAUTIs, CLABSIs and SSIs, in order to identify inaccurately reportedinfections and unreported infections.
Act 52 requires PADOH to: (1) assess overall trends in HAIs in Pennsylvania, (2) compare the rates of HAIs inPennsylvania to the rates elsewhere in the country, and (3) compare the occurrence of HAIs between hospitals andover time in each hospital. To assess overall HAI trends in Pennsylvania, PADOH produces summary statistics onthe patterns of HAIs by category, the overall rates of HAIs and the rates by category. Information is also providedon the pathogens causing HAIs, with an emphasis on infections caused by methicillin-resistant Staphylococcus aureus(MRSA), which was a special focus of Act 52.
To compare Pennsylvania’s rates and patterns of HAIs to the rest of the country, this report uses informationcontained in the NHSN progress report. NHSN now collects data from more than 5,000 hospitals across the UnitedStates and produces the definitive dataset on HAIs. The latest CDC progress report from NHSN can be found here:http://www.cdc.gov/hai/progress-report
To compare differences between hospitals, the recommended approach is the use of a standardized infection ratio,or SIR. The SIR is a comparison between the reported occurrence (the observed number of infections) of a specificHAI (e.g., CAUTI or CLABSI) in a hospital to the number that would be predicted to occur in that hospital if thehospitals rate was identical to the statewide HAI rate for that infection type. If a hospital reported 10 CAUTIsduring 2014 and, based on the overall statewide rate of CAUTIs per 1,000 catheter days, we would have predictedonly five CAUTIs should occur in that hospital, the SIR would be 10/5 or 2.00. If another hospital reported fiveCAUTIs and, based on statewide rates, we would have predicted the hospital would have 10 CAUTIs, the SIR wouldbe 5/10 or 0.50. An SIR of 1.00 means the hospital reported exactly the same number of infections as predictedbased on statewide rates (i.e., the hospitals rate was exactly the same as the statewide rate). A SIR >1.00 meansthe hospital reported more infections than predicted, and an SIR <1.00 means the hospital reported fewer infectionsthan predicted.
Differences between hospitals (such as intensity of care or patient populations) may explain why they have differencesin their HAI rates. Some hospitals care for sicker patients, and these patients are at higher risk for an HAI withall other factors being equal. To account for such differences, an adjustment is made to the predicted number of
8

infections (the predicted number is adjusted upward for hospitals that provide more complex care and downwardfor hospitals that provide less complex care). It is difficult to precisely measure complexity of care. Factors thatwere examined for this purpose for CAUTIs and CLABSIs include device utilization ratio (how often a catheter orcentral line is used in each hospital, calculated as the number of catheter or central line days divided by the numberof patient days), the bed size of the hospital, the geographic location of the hospital (urban or rural), and whetherthe hospital is affiliated with a medical school. These factors have been shown in medical literature to influence thelikelihood of an HAI as a surrogate for patient population differences or intensity of care. The final risk adjustmentmodel for CAUTIs and CLABSIs incorporates the device utilization ratio (DUR) and medical school affiliation,similar to previous reports. For SSIs, such adjustments are not needed, as information is collected on all patientswho underwent a procedure, whether or not an infection subsequently occurred. Adjustment factors for predictingthe number of infections used for SSIs include the American Society of Anesthesiology (ASA) score (the patients levelof health), duration of the surgical procedure, and whether the operation site was clean or contaminated. Together,these comprise the risk index.
Before 2013, the CDC definition of a SSI included a 12 month follow-up period. Since 2013, the follow-up periodwas reduced to 90 days. As a result, this report includes SSIs that occured after procedures performed in 2012 (12month follow-up) and 2013 (90 day follow-up). Any comparison of 2013 SSI data to previous years will be influencedby the case definition change and any year-to-year comparisons should be interpreted cautiously. In addition, colonsurgeries were added a seventh benchmarked procedure in 2012. For the first time, this state report includes colonsurgery data from 2012 and 2013.
After the SIR is calculated, a determination is made regarding whether any differences seen between hospitals arestatistically meaningful. For a small hospital that performs few operative procedures or uses very few catheters orcentral lines, the level of confidence in the reliability of the calculated rates is lower than for a larger hospital. Thisis reflected in a calculation known as the confidence interval or CI, for which a lower limit and an upper limit arecalculated and displayed. The true SIR for the hospital is found somewhere in between the lower value and the uppervalue of the confidence interval. In general, the smaller the facility, the wider the confidence interval, meaning ourconfidence in the calculated rate is low. Larger facilities tend to have narrower confidence intervals, meaning therewas more information available to calculate the rates. If the two values in the confidence interval are both <1.00,it means the observed number of infections in that hospital is significantly lower than predicted. If both values inthe confidence interval are >1.00, it means there are significantly more infections than predicted. If the confidenceinterval includes the value of 1.00, it means the observed number of infections is not statistically different thanpredicted based on statewide rates. Hospitals with a significantly lower number of observed infections are depictedin green in the graphs included in the report; hospitals with a significantly higher number of observed infections aredepicted in red in the graphs. Hospitals that are no different than predicted are depicted in yellow in the graphs.
For the section on healthcare worker influenza vaccination, hospitals were asked to voluntarily submit informationon the number of healthcare workers in their facility and the number of these workers that were documented tohave received influenza vaccine (whether or not the vaccine was administered at the hospital) for the 2014–2015 fluseason. The methods for counting vaccination are based on those developed by the National Quality Forum (NQF),which uses three separate categories (hospital employees, licensed independent practioners, and adult volunteers orstudents) and counts only those present in the hospital for at least 30 days during the flu season. For this report,hospitals submitted healthcare worker vaccination data directly to NHSN. That is the source of vaccination data inthis report for the 2014–2015 influenza season.
Manuscript preparation and all analyses were performed using R (version 3.2.0; R Core Team, 2015) and RStudio(version 0.99.467; RStudio Team, 2015).
9
4 Results
4.1 Hospital Characteristics
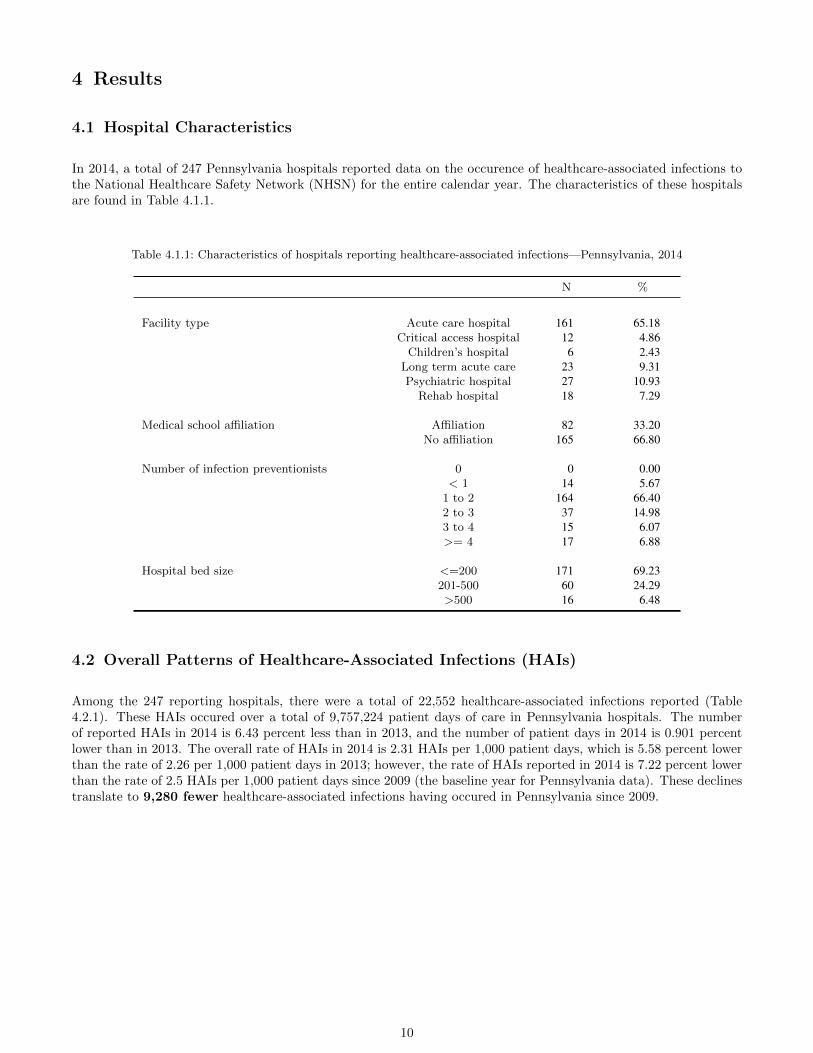
In 2014, a total of 247 Pennsylvania hospitals reported data on the occurence of healthcare-associated infections tothe National Healthcare Safety Network (NHSN) for the entire calendar year. The characteristics of these hospitalsare found in Table 4.1.1.
Table 4.1.1: Characteristics of hospitals reporting healthcare-associated infections—Pennsylvania, 2014
N %
Facility type Acute care hospital 161 65.18Critical access hospital 12 4.86
Children’s hospital 6 2.43Long term acute care 23 9.31Psychiatric hospital 27 10.93
Rehab hospital 18 7.29
Medical school affiliation Affiliation 82 33.20No affiliation 165 66.80
Number of infection preventionists 0 0 0.00< 1 14 5.67
1 to 2 164 66.402 to 3 37 14.983 to 4 15 6.07>= 4 17 6.88
Hospital bed size <=200 171 69.23201-500 60 24.29>500 16 6.48
4.2 Overall Patterns of Healthcare-Associated Infections (HAIs)
Among the 247 reporting hospitals, there were a total of 22,552 healthcare-associated infections reported (Table4.2.1). These HAIs occured over a total of 9,757,224 patient days of care in Pennsylvania hospitals. The numberof reported HAIs in 2014 is 6.43 percent less than in 2013, and the number of patient days in 2014 is 0.901 percentlower than in 2013. The overall rate of HAIs in 2014 is 2.31 HAIs per 1,000 patient days, which is 5.58 percent lowerthan the rate of 2.26 per 1,000 patient days in 2013; however, the rate of HAIs reported in 2014 is 7.22 percent lowerthan the rate of 2.5 HAIs per 1,000 patient days since 2009 (the baseline year for Pennsylvania data). These declinestranslate to 9,280 fewer healthcare-associated infections having occured in Pennsylvania since 2009.
10
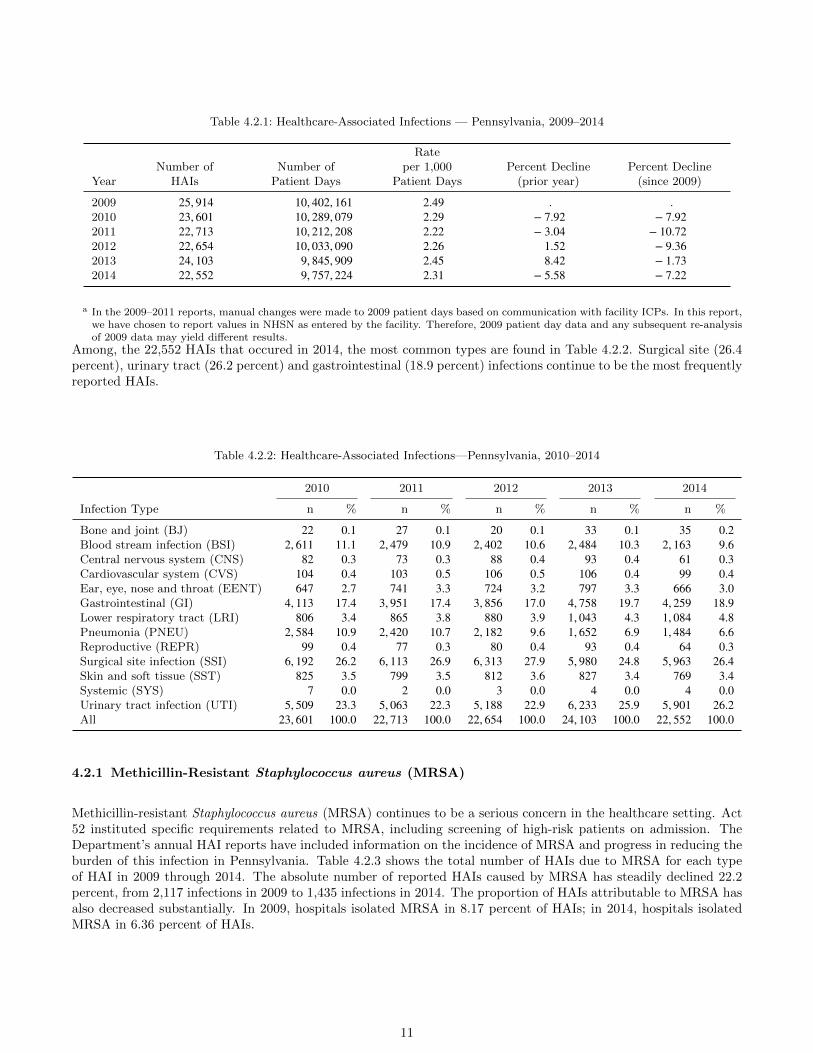
Table 4.2.1: Healthcare-Associated Infections — Pennsylvania, 2009–2014
YearNumber of
HAIsNumber of
Patient Days
Rateper 1,000
Patient DaysPercent Decline
(prior year)Percent Decline
(since 2009)
2009 25, 914 10, 402, 161 2.49 . .2010 23, 601 10, 289, 079 2.29 − 7.92 − 7.922011 22, 713 10, 212, 208 2.22 − 3.04 − 10.722012 22, 654 10, 033, 090 2.26 1.52 − 9.362013 24, 103 9, 845, 909 2.45 8.42 − 1.732014 22, 552 9, 757, 224 2.31 − 5.58 − 7.22
a In the 2009–2011 reports, manual changes were made to 2009 patient days based on communication with facility ICPs. In this report,we have chosen to report values in NHSN as entered by the facility. Therefore, 2009 patient day data and any subsequent re-analysisof 2009 data may yield different results.
Among, the 22,552 HAIs that occured in 2014, the most common types are found in Table 4.2.2. Surgical site (26.4percent), urinary tract (26.2 percent) and gastrointestinal (18.9 percent) infections continue to be the most frequentlyreported HAIs.
Table 4.2.2: Healthcare-Associated Infections—Pennsylvania, 2010–2014
2010 2011 2012 2013 2014
Infection Type n % n % n % n % n %
Bone and joint (BJ) 22 0.1 27 0.1 20 0.1 33 0.1 35 0.2Blood stream infection (BSI) 2, 611 11.1 2, 479 10.9 2, 402 10.6 2, 484 10.3 2, 163 9.6Central nervous system (CNS) 82 0.3 73 0.3 88 0.4 93 0.4 61 0.3Cardiovascular system (CVS) 104 0.4 103 0.5 106 0.5 106 0.4 99 0.4Ear, eye, nose and throat (EENT) 647 2.7 741 3.3 724 3.2 797 3.3 666 3.0Gastrointestinal (GI) 4, 113 17.4 3, 951 17.4 3, 856 17.0 4, 758 19.7 4, 259 18.9Lower respiratory tract (LRI) 806 3.4 865 3.8 880 3.9 1, 043 4.3 1, 084 4.8Pneumonia (PNEU) 2, 584 10.9 2, 420 10.7 2, 182 9.6 1, 652 6.9 1, 484 6.6Reproductive (REPR) 99 0.4 77 0.3 80 0.4 93 0.4 64 0.3Surgical site infection (SSI) 6, 192 26.2 6, 113 26.9 6, 313 27.9 5, 980 24.8 5, 963 26.4Skin and soft tissue (SST) 825 3.5 799 3.5 812 3.6 827 3.4 769 3.4Systemic (SYS) 7 0.0 2 0.0 3 0.0 4 0.0 4 0.0Urinary tract infection (UTI) 5, 509 23.3 5, 063 22.3 5, 188 22.9 6, 233 25.9 5, 901 26.2All 23, 601 100.0 22, 713 100.0 22, 654 100.0 24, 103 100.0 22, 552 100.0
4.2.1 Methicillin-Resistant Staphylococcus aureus (MRSA)
Methicillin-resistant Staphylococcus aureus (MRSA) continues to be a serious concern in the healthcare setting. Act52 instituted specific requirements related to MRSA, including screening of high-risk patients on admission. TheDepartment’s annual HAI reports have included information on the incidence of MRSA and progress in reducing theburden of this infection in Pennsylvania. Table 4.2.3 shows the total number of HAIs due to MRSA for each typeof HAI in 2009 through 2014. The absolute number of reported HAIs caused by MRSA has steadily declined 22.2percent, from 2,117 infections in 2009 to 1,435 infections in 2014. The proportion of HAIs attributable to MRSA hasalso decreased substantially. In 2009, hospitals isolated MRSA in 8.17 percent of HAIs; in 2014, hospitals isolatedMRSA in 6.36 percent of HAIs.
11
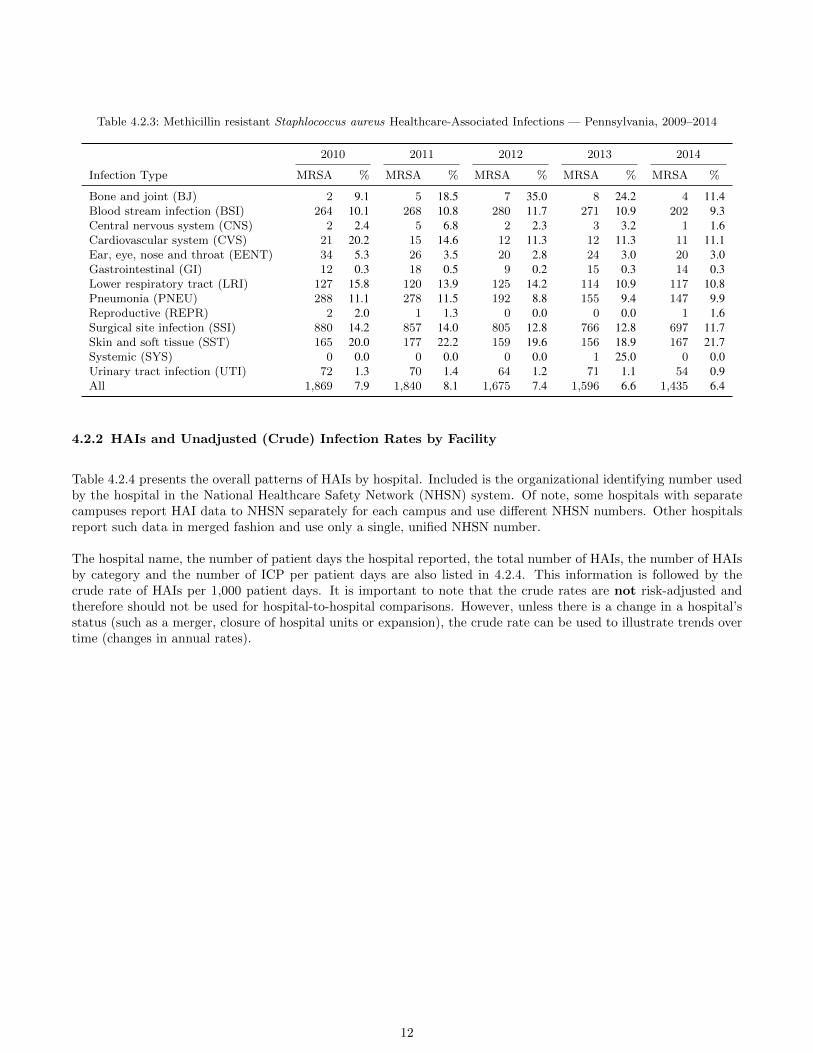
Table 4.2.3: Methicillin resistant Staphlococcus aureus Healthcare-Associated Infections — Pennsylvania, 2009–2014
2010 2011 2012 2013 2014
Infection Type MRSA % MRSA % MRSA % MRSA % MRSA %
Bone and joint (BJ) 2 9.1 5 18.5 7 35.0 8 24.2 4 11.4Blood stream infection (BSI) 264 10.1 268 10.8 280 11.7 271 10.9 202 9.3Central nervous system (CNS) 2 2.4 5 6.8 2 2.3 3 3.2 1 1.6Cardiovascular system (CVS) 21 20.2 15 14.6 12 11.3 12 11.3 11 11.1Ear, eye, nose and throat (EENT) 34 5.3 26 3.5 20 2.8 24 3.0 20 3.0Gastrointestinal (GI) 12 0.3 18 0.5 9 0.2 15 0.3 14 0.3Lower respiratory tract (LRI) 127 15.8 120 13.9 125 14.2 114 10.9 117 10.8Pneumonia (PNEU) 288 11.1 278 11.5 192 8.8 155 9.4 147 9.9Reproductive (REPR) 2 2.0 1 1.3 0 0.0 0 0.0 1 1.6Surgical site infection (SSI) 880 14.2 857 14.0 805 12.8 766 12.8 697 11.7Skin and soft tissue (SST) 165 20.0 177 22.2 159 19.6 156 18.9 167 21.7Systemic (SYS) 0 0.0 0 0.0 0 0.0 1 25.0 0 0.0Urinary tract infection (UTI) 72 1.3 70 1.4 64 1.2 71 1.1 54 0.9All 1,869 7.9 1,840 8.1 1,675 7.4 1,596 6.6 1,435 6.4
4.2.2 HAIs and Unadjusted (Crude) Infection Rates by Facility
Table 4.2.4 presents the overall patterns of HAIs by hospital. Included is the organizational identifying number usedby the hospital in the National Healthcare Safety Network (NHSN) system. Of note, some hospitals with separatecampuses report HAI data to NHSN separately for each campus and use different NHSN numbers. Other hospitalsreport such data in merged fashion and use only a single, unified NHSN number.
The hospital name, the number of patient days the hospital reported, the total number of HAIs, the number of HAIsby category and the number of ICP per patient days are also listed in 4.2.4. This information is followed by thecrude rate of HAIs per 1,000 patient days. It is important to note that the crude rates are not risk-adjusted andtherefore should not be used for hospital-to-hospital comparisons. However, unless there is a change in a hospital’sstatus (such as a merger, closure of hospital units or expansion), the crude rate can be used to illustrate trends overtime (changes in annual rates).
12
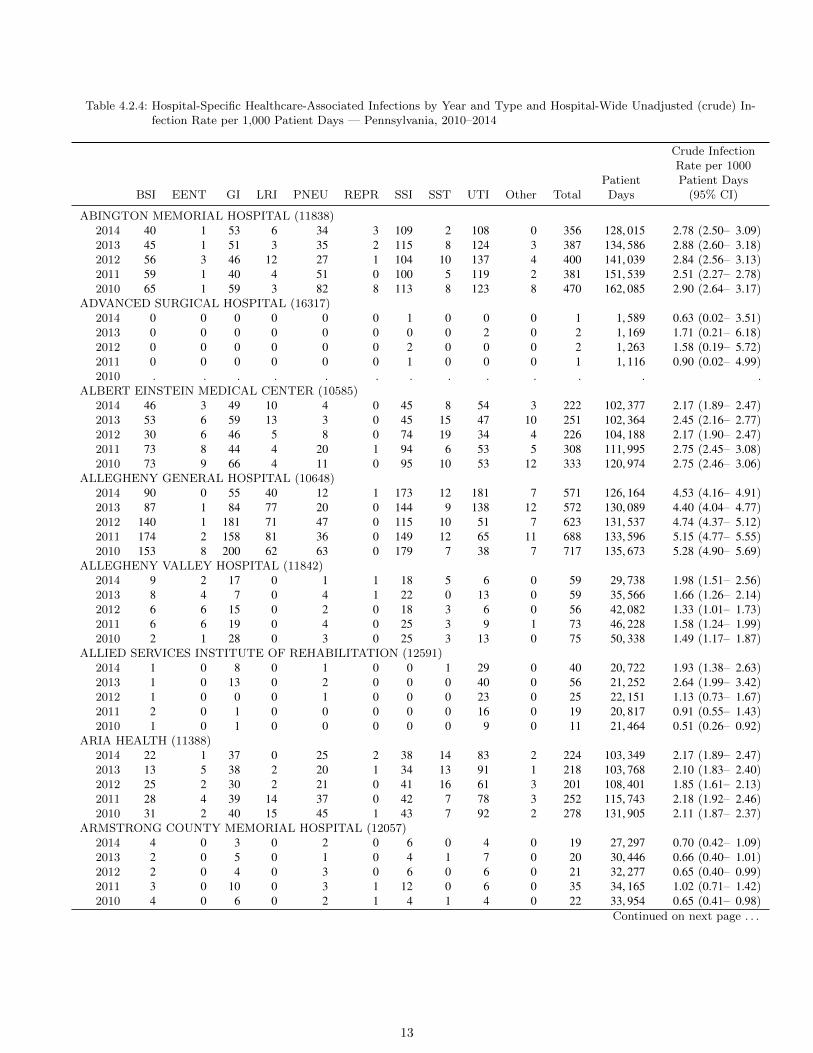
Table 4.2.4: Hospital-Specific Healthcare-Associated Infections by Year and Type and Hospital-Wide Unadjusted (crude) In-fection Rate per 1,000 Patient Days — Pennsylvania, 2010–2014
BSI EENT GI LRI PNEU REPR SSI SST UTI Other TotalPatientDays
Crude InfectionRate per 1000Patient Days
(95% CI)
ABINGTON MEMORIAL HOSPITAL (11838)2014 40 1 53 6 34 3 109 2 108 0 356 128, 015 2.78 (2.50– 3.09)2013 45 1 51 3 35 2 115 8 124 3 387 134, 586 2.88 (2.60– 3.18)2012 56 3 46 12 27 1 104 10 137 4 400 141, 039 2.84 (2.56– 3.13)2011 59 1 40 4 51 0 100 5 119 2 381 151, 539 2.51 (2.27– 2.78)2010 65 1 59 3 82 8 113 8 123 8 470 162, 085 2.90 (2.64– 3.17)
ADVANCED SURGICAL HOSPITAL (16317)2014 0 0 0 0 0 0 1 0 0 0 1 1, 589 0.63 (0.02– 3.51)2013 0 0 0 0 0 0 0 0 2 0 2 1, 169 1.71 (0.21– 6.18)2012 0 0 0 0 0 0 2 0 0 0 2 1, 263 1.58 (0.19– 5.72)2011 0 0 0 0 0 0 1 0 0 0 1 1, 116 0.90 (0.02– 4.99)2010 . . . . . . . . . . . . .
ALBERT EINSTEIN MEDICAL CENTER (10585)2014 46 3 49 10 4 0 45 8 54 3 222 102, 377 2.17 (1.89– 2.47)2013 53 6 59 13 3 0 45 15 47 10 251 102, 364 2.45 (2.16– 2.77)2012 30 6 46 5 8 0 74 19 34 4 226 104, 188 2.17 (1.90– 2.47)2011 73 8 44 4 20 1 94 6 53 5 308 111, 995 2.75 (2.45– 3.08)2010 73 9 66 4 11 0 95 10 53 12 333 120, 974 2.75 (2.46– 3.06)
ALLEGHENY GENERAL HOSPITAL (10648)2014 90 0 55 40 12 1 173 12 181 7 571 126, 164 4.53 (4.16– 4.91)2013 87 1 84 77 20 0 144 9 138 12 572 130, 089 4.40 (4.04– 4.77)2012 140 1 181 71 47 0 115 10 51 7 623 131, 537 4.74 (4.37– 5.12)2011 174 2 158 81 36 0 149 12 65 11 688 133, 596 5.15 (4.77– 5.55)2010 153 8 200 62 63 0 179 7 38 7 717 135, 673 5.28 (4.90– 5.69)
ALLEGHENY VALLEY HOSPITAL (11842)2014 9 2 17 0 1 1 18 5 6 0 59 29, 738 1.98 (1.51– 2.56)2013 8 4 7 0 4 1 22 0 13 0 59 35, 566 1.66 (1.26– 2.14)2012 6 6 15 0 2 0 18 3 6 0 56 42, 082 1.33 (1.01– 1.73)2011 6 6 19 0 4 0 25 3 9 1 73 46, 228 1.58 (1.24– 1.99)2010 2 1 28 0 3 0 25 3 13 0 75 50, 338 1.49 (1.17– 1.87)
ALLIED SERVICES INSTITUTE OF REHABILITATION (12591)2014 1 0 8 0 1 0 0 1 29 0 40 20, 722 1.93 (1.38– 2.63)2013 1 0 13 0 2 0 0 0 40 0 56 21, 252 2.64 (1.99– 3.42)2012 1 0 0 0 1 0 0 0 23 0 25 22, 151 1.13 (0.73– 1.67)2011 2 0 1 0 0 0 0 0 16 0 19 20, 817 0.91 (0.55– 1.43)2010 1 0 1 0 0 0 0 0 9 0 11 21, 464 0.51 (0.26– 0.92)
ARIA HEALTH (11388)2014 22 1 37 0 25 2 38 14 83 2 224 103, 349 2.17 (1.89– 2.47)2013 13 5 38 2 20 1 34 13 91 1 218 103, 768 2.10 (1.83– 2.40)2012 25 2 30 2 21 0 41 16 61 3 201 108, 401 1.85 (1.61– 2.13)2011 28 4 39 14 37 0 42 7 78 3 252 115, 743 2.18 (1.92– 2.46)2010 31 2 40 15 45 1 43 7 92 2 278 131, 905 2.11 (1.87– 2.37)
ARMSTRONG COUNTY MEMORIAL HOSPITAL (12057)2014 4 0 3 0 2 0 6 0 4 0 19 27, 297 0.70 (0.42– 1.09)2013 2 0 5 0 1 0 4 1 7 0 20 30, 446 0.66 (0.40– 1.01)2012 2 0 4 0 3 0 6 0 6 0 21 32, 277 0.65 (0.40– 0.99)2011 3 0 10 0 3 1 12 0 6 0 35 34, 165 1.02 (0.71– 1.42)2010 4 0 6 0 2 1 4 1 4 0 22 33, 954 0.65 (0.41– 0.98)
Continued on next page . . .
13

Table 4.2.4 – Continued from previous page
BSI EENT GI LRI PNEU REPR SSI SST UTI Other TotalPatientDays
Crude InfectionRate per 1,000Patient Days
(95% CI)
BARIX CLINICS OF PENNSYLVANIA (12037)2014 0 0 0 0 0 0 1 0 0 0 1 464 2.16 (0.05–12.01)2013 0 0 0 0 0 0 0 0 0 0 0 436 0.00 (0.00– 8.46)2012 0 0 0 0 0 0 0 0 0 0 0 539 0.00 (0.00– 6.84)2011 0 0 0 0 0 0 1 0 0 0 1 661 1.51 (0.04– 8.43)2010 0 0 0 0 1 0 2 0 0 0 3 882 3.40 (0.70– 9.94)
BARNES-KASSON COUNTY HOSPITAL (12404)2014 0 0 0 0 0 0 0 0 0 0 0 4, 670 0.00 (0.00– 0.79)2013 0 0 0 0 0 0 0 0 0 0 0 4, 230 0.00 (0.00– 0.87)2012 0 0 0 0 0 0 0 0 0 0 0 4, 386 0.00 (0.00– 0.84)2011 0 0 0 0 0 0 0 0 0 0 0 4, 251 0.00 (0.00– 0.87)2010 0 0 0 0 0 0 0 0 0 0 0 4, 933 0.00 (0.00– 0.75)
BELMONT CENTER FOR COMPREHENSIVE TREATMENT (12505)2014 0 11 0 0 0 0 0 1 1 0 13 47, 706 0.27 (0.15– 0.47)2013 0 1 14 0 0 0 0 2 0 0 17 44, 535 0.38 (0.22– 0.61)2012 0 2 0 0 0 0 0 0 1 0 3 48, 168 0.06 (0.01– 0.18)2011 0 9 0 0 0 0 0 1 0 0 10 47, 456 0.21 (0.10– 0.39)2010 0 3 1 0 0 0 0 2 1 0 7 49, 557 0.14 (0.06– 0.29)
BERWICK HOSPITAL CENTER (11442)2014 0 0 0 0 3 0 2 0 1 0 6 8, 825 0.68 (0.25– 1.48)2013 1 0 0 0 0 0 0 1 1 0 3 10, 648 0.28 (0.06– 0.82)2012 0 0 1 0 1 0 3 0 1 1 7 12, 578 0.56 (0.22– 1.15)2011 2 0 0 1 2 0 1 0 2 0 8 14, 647 0.55 (0.24– 1.08)2010 0 0 0 1 0 0 4 0 2 0 7 15, 376 0.46 (0.18– 0.94)
BRADFORD REGIONAL MEDICAL CENTER (12361)2014 0 0 4 0 3 2 12 0 1 0 22 10, 773 2.04 (1.28– 3.09)2013 0 0 5 1 4 0 9 1 1 0 21 13, 247 1.59 (0.98– 2.42)2012 0 0 4 0 5 0 1 4 0 0 14 12, 697 1.10 (0.60– 1.85)2011 0 0 3 0 2 0 3 3 1 0 12 11, 423 1.05 (0.54– 1.84)2010 1 0 4 0 6 0 1 0 5 0 17 11, 429 1.49 (0.87– 2.38)
BRANDYWINE HOSPITAL (11979)2014 4 0 2 0 5 0 16 1 13 0 41 35, 609 1.15 (0.83– 1.56)2013 12 0 10 0 7 0 24 2 18 0 73 36, 865 1.98 (1.55– 2.49)2012 3 0 4 0 14 0 19 0 19 0 59 37, 089 1.59 (1.21– 2.05)2011 4 0 6 0 12 0 19 0 11 0 52 37, 170 1.40 (1.04– 1.83)2010 4 0 9 0 10 0 19 0 12 0 54 25, 194 2.14 (1.61– 2.80)
BROOKE GLEN BEHAVIORAL HOSPITAL (12623)2014 0 1 0 0 0 0 0 0 0 0 1 44, 754 0.02 (0.00– 0.12)2013 0 0 0 0 0 0 0 0 0 0 0 45, 561 0.00 (0.00– 0.08)2012 0 1 0 0 0 0 0 0 0 0 1 34, 344 0.03 (0.00– 0.16)2011 0 0 0 0 0 0 0 0 0 0 0 31, 602 0.00 (0.00– 0.12)2010 0 1 10 0 0 0 0 0 0 0 11 45, 655 0.24 (0.12– 0.43)
BUCKTAIL MEDICAL CENTER (12461)2014 0 0 0 0 0 0 0 3 3 0 6 979 6.13 (2.25–13.34)2013 0 1 3 0 1 0 0 2 3 0 10 1, 056 9.47 (4.54–17.42)2012 0 0 2 0 0 0 0 1 0 0 3 1, 260 2.38 (0.49– 6.96)2011 0 0 1 0 0 0 0 0 0 0 1 1, 078 0.93 (0.02– 5.17)2010 0 0 0 0 0 0 0 0 0 0 0 1, 264 0.00 (0.00– 2.92)
BUTLER MEMORIAL HOSPITAL (11736)2014 7 0 15 0 2 0 39 0 20 0 83 62, 042 1.34 (1.07– 1.66)2013 4 1 22 3 14 0 63 2 34 0 143 62, 866 2.27 (1.92– 2.68)2012 10 0 17 2 16 0 75 3 40 1 164 65, 912 2.49 (2.12– 2.90)2011 8 0 11 4 10 1 57 5 20 0 116 67, 225 1.73 (1.43– 2.07)2010 7 2 12 3 22 0 74 4 34 0 158 63, 971 2.47 (2.10– 2.89)
Continued on next page . . .
14

Table 4.2.4 – Continued from previous page
BSI EENT GI LRI PNEU REPR SSI SST UTI Other TotalPatientDays
Crude InfectionRate per 1,000Patient Days
(95% CI)
CANONSBURG HOSPITAL (11586)2014 0 0 4 0 0 0 7 0 1 0 12 14, 210 0.84 (0.44– 1.48)2013 3 0 4 1 0 0 8 1 5 0 22 14, 862 1.48 (0.93– 2.24)2012 1 0 2 0 0 0 16 1 9 0 29 17, 168 1.69 (1.13– 2.43)2011 1 0 5 0 1 0 6 1 6 1 21 17, 798 1.18 (0.73– 1.80)2010 2 0 8 0 0 0 10 0 1 2 23 18, 963 1.21 (0.77– 1.82)
CARLISLE REGIONAL MEDICAL CENTER (11997)2014 0 0 0 0 0 0 15 0 0 0 15 16, 385 0.92 (0.51– 1.51)2013 0 0 0 0 1 0 27 1 3 0 32 17, 358 1.84 (1.26– 2.60)2012 0 0 0 0 1 0 10 0 1 0 12 20, 990 0.57 (0.30– 1.00)2011 1 0 1 0 0 0 21 0 2 0 25 26, 235 0.95 (0.62– 1.41)2010 1 0 1 0 5 0 33 0 39 0 79 28, 397 2.78 (2.20– 3.47)
CHAMBERSBURG HOSPITAL (11913)2014 19 0 34 1 6 0 45 1 23 0 129 56, 806 2.27 (1.90– 2.70)2013 23 1 32 0 9 0 56 1 19 0 141 58, 513 2.41 (2.03– 2.84)2012 11 0 27 0 16 0 44 5 30 2 135 54, 266 2.49 (2.09– 2.94)2011 6 0 22 0 12 0 62 1 21 0 124 56, 846 2.18 (1.81– 2.60)2010 3 0 3 1 9 0 60 0 33 1 110 52, 912 2.08 (1.71– 2.51)
CHARLES COLE MEMORIAL HOSPITAL (11956)2014 1 0 4 0 2 0 6 1 4 3 21 10, 668 1.97 (1.22– 3.01)2013 1 2 1 0 2 0 7 1 7 0 21 11, 574 1.81 (1.12– 2.77)2012 1 0 0 0 3 0 6 0 7 0 17 10, 297 1.65 (0.96– 2.64)2011 1 0 0 0 1 0 4 0 4 0 10 9, 233 1.08 (0.52– 1.99)2010 1 0 1 0 10 0 4 0 1 0 17 9, 535 1.78 (1.04– 2.85)
CHESTER COUNTY HOSPITAL (12016)2014 16 4 20 3 30 2 23 3 39 3 143 56, 671 2.52 (2.13– 2.97)2013 14 2 26 7 27 4 37 6 50 1 174 56, 624 3.07 (2.63– 3.56)2012 16 2 32 3 9 5 42 2 38 0 149 58, 920 2.53 (2.14– 2.97)2011 10 4 33 6 14 2 30 10 46 1 156 59, 845 2.61 (2.21– 3.05)2010 8 4 20 9 17 4 20 7 41 3 133 58, 559 2.27 (1.90– 2.69)
CHESTNUT HILL HOSPITAL (12304)2014 4 0 0 0 1 0 15 2 4 0 26 29, 926 0.87 (0.57– 1.27)2013 3 0 0 0 0 0 9 0 2 0 14 27, 547 0.51 (0.28– 0.85)2012 5 0 1 0 1 0 7 0 1 0 15 26, 818 0.56 (0.31– 0.92)2011 1 0 6 0 0 0 13 3 4 0 27 27, 803 0.97 (0.64– 1.41)2010 3 0 1 0 3 0 10 0 7 0 24 27, 053 0.89 (0.57– 1.32)
CHILDRENS HOME OF PITTSBURGH, THE (12336)2014 1 0 0 5 0 0 0 0 1 0 7 4, 856 1.44 (0.58– 2.97)2013 5 3 1 4 0 0 0 0 2 0 15 5, 881 2.55 (1.43– 4.21)2012 3 3 0 0 0 0 0 0 2 0 8 5, 923 1.35 (0.58– 2.66)2011 5 3 0 0 0 0 0 3 0 0 11 4, 665 2.36 (1.18– 4.22)2010 2 0 2 0 0 0 0 0 1 0 5 4, 581 1.09 (0.35– 2.55)
CHILDRENS HOSPITAL OF PHILADELPHIA (10306)2014 106 54 89 89 16 0 73 47 88 11 573 154, 804 3.70 (3.40– 4.02)2013 100 93 114 87 17 5 48 55 91 16 626 158, 179 3.96 (3.65– 4.28)2012 103 78 77 71 20 1 73 32 70 10 535 154, 870 3.45 (3.17– 3.76)2011 97 78 73 50 24 1 68 43 45 17 496 150, 455 3.30 (3.01– 3.60)2010 98 24 22 9 19 1 75 22 61 9 340 137, 053 2.48 (2.22– 2.76)
CHILDRENS HOSPITAL OF PITTSBURGH OF UPMC (11640)2014 42 11 18 15 1 0 33 5 30 6 161 91, 318 1.76 (1.50– 2.06)2013 78 7 11 20 5 0 44 6 35 4 210 86, 033 2.44 (2.12– 2.79)2012 53 7 34 7 3 0 54 6 11 6 181 84, 386 2.14 (1.84– 2.48)2011 62 7 26 26 11 0 40 8 11 5 196 84, 133 2.33 (2.01– 2.68)2010 75 6 9 14 7 0 16 11 20 8 166 79, 661 2.08 (1.78– 2.43)
Continued on next page . . .
15
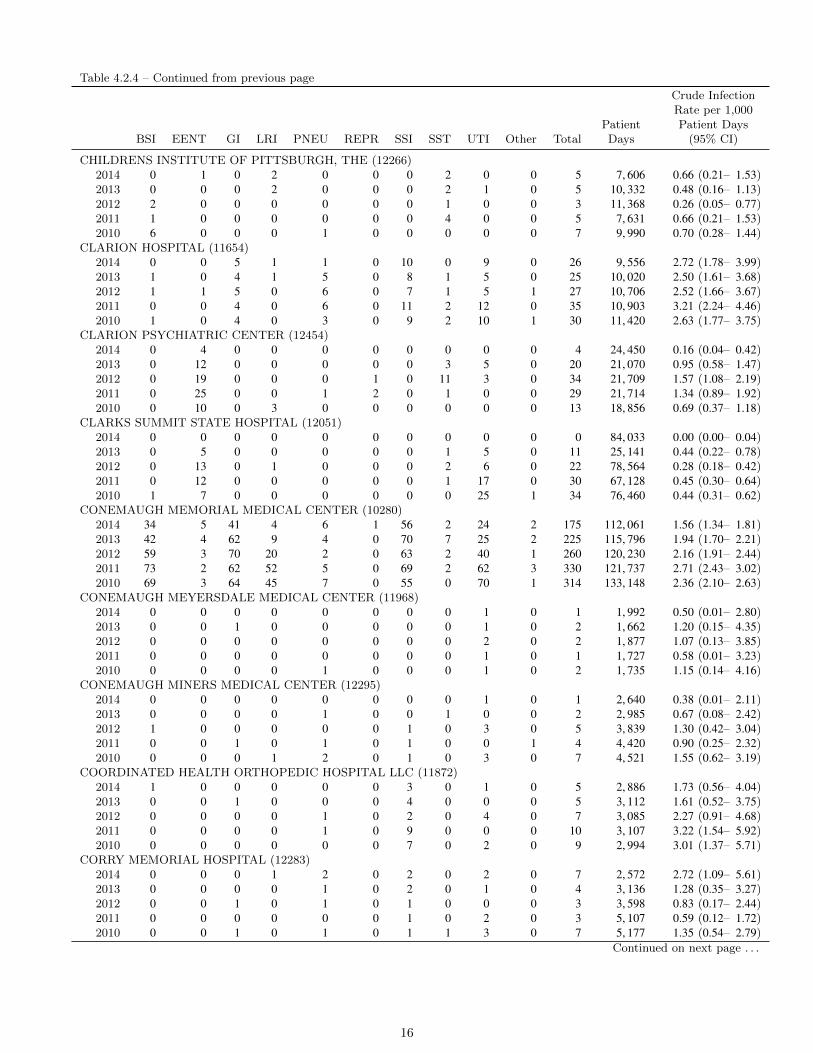
Table 4.2.4 – Continued from previous page
BSI EENT GI LRI PNEU REPR SSI SST UTI Other TotalPatientDays
Crude InfectionRate per 1,000Patient Days
(95% CI)
CHILDRENS INSTITUTE OF PITTSBURGH, THE (12266)2014 0 1 0 2 0 0 0 2 0 0 5 7, 606 0.66 (0.21– 1.53)2013 0 0 0 2 0 0 0 2 1 0 5 10, 332 0.48 (0.16– 1.13)2012 2 0 0 0 0 0 0 1 0 0 3 11, 368 0.26 (0.05– 0.77)2011 1 0 0 0 0 0 0 4 0 0 5 7, 631 0.66 (0.21– 1.53)2010 6 0 0 0 1 0 0 0 0 0 7 9, 990 0.70 (0.28– 1.44)
CLARION HOSPITAL (11654)2014 0 0 5 1 1 0 10 0 9 0 26 9, 556 2.72 (1.78– 3.99)2013 1 0 4 1 5 0 8 1 5 0 25 10, 020 2.50 (1.61– 3.68)2012 1 1 5 0 6 0 7 1 5 1 27 10, 706 2.52 (1.66– 3.67)2011 0 0 4 0 6 0 11 2 12 0 35 10, 903 3.21 (2.24– 4.46)2010 1 0 4 0 3 0 9 2 10 1 30 11, 420 2.63 (1.77– 3.75)
CLARION PSYCHIATRIC CENTER (12454)2014 0 4 0 0 0 0 0 0 0 0 4 24, 450 0.16 (0.04– 0.42)2013 0 12 0 0 0 0 0 3 5 0 20 21, 070 0.95 (0.58– 1.47)2012 0 19 0 0 0 1 0 11 3 0 34 21, 709 1.57 (1.08– 2.19)2011 0 25 0 0 1 2 0 1 0 0 29 21, 714 1.34 (0.89– 1.92)2010 0 10 0 3 0 0 0 0 0 0 13 18, 856 0.69 (0.37– 1.18)
CLARKS SUMMIT STATE HOSPITAL (12051)2014 0 0 0 0 0 0 0 0 0 0 0 84, 033 0.00 (0.00– 0.04)2013 0 5 0 0 0 0 0 1 5 0 11 25, 141 0.44 (0.22– 0.78)2012 0 13 0 1 0 0 0 2 6 0 22 78, 564 0.28 (0.18– 0.42)2011 0 12 0 0 0 0 0 1 17 0 30 67, 128 0.45 (0.30– 0.64)2010 1 7 0 0 0 0 0 0 25 1 34 76, 460 0.44 (0.31– 0.62)
CONEMAUGH MEMORIAL MEDICAL CENTER (10280)2014 34 5 41 4 6 1 56 2 24 2 175 112, 061 1.56 (1.34– 1.81)2013 42 4 62 9 4 0 70 7 25 2 225 115, 796 1.94 (1.70– 2.21)2012 59 3 70 20 2 0 63 2 40 1 260 120, 230 2.16 (1.91– 2.44)2011 73 2 62 52 5 0 69 2 62 3 330 121, 737 2.71 (2.43– 3.02)2010 69 3 64 45 7 0 55 0 70 1 314 133, 148 2.36 (2.10– 2.63)
CONEMAUGH MEYERSDALE MEDICAL CENTER (11968)2014 0 0 0 0 0 0 0 0 1 0 1 1, 992 0.50 (0.01– 2.80)2013 0 0 1 0 0 0 0 0 1 0 2 1, 662 1.20 (0.15– 4.35)2012 0 0 0 0 0 0 0 0 2 0 2 1, 877 1.07 (0.13– 3.85)2011 0 0 0 0 0 0 0 0 1 0 1 1, 727 0.58 (0.01– 3.23)2010 0 0 0 0 1 0 0 0 1 0 2 1, 735 1.15 (0.14– 4.16)
CONEMAUGH MINERS MEDICAL CENTER (12295)2014 0 0 0 0 0 0 0 0 1 0 1 2, 640 0.38 (0.01– 2.11)2013 0 0 0 0 1 0 0 1 0 0 2 2, 985 0.67 (0.08– 2.42)2012 1 0 0 0 0 0 1 0 3 0 5 3, 839 1.30 (0.42– 3.04)2011 0 0 1 0 1 0 1 0 0 1 4 4, 420 0.90 (0.25– 2.32)2010 0 0 0 1 2 0 1 0 3 0 7 4, 521 1.55 (0.62– 3.19)
COORDINATED HEALTH ORTHOPEDIC HOSPITAL LLC (11872)2014 1 0 0 0 0 0 3 0 1 0 5 2, 886 1.73 (0.56– 4.04)2013 0 0 1 0 0 0 4 0 0 0 5 3, 112 1.61 (0.52– 3.75)2012 0 0 0 0 1 0 2 0 4 0 7 3, 085 2.27 (0.91– 4.68)2011 0 0 0 0 1 0 9 0 0 0 10 3, 107 3.22 (1.54– 5.92)2010 0 0 0 0 0 0 7 0 2 0 9 2, 994 3.01 (1.37– 5.71)
CORRY MEMORIAL HOSPITAL (12283)2014 0 0 0 1 2 0 2 0 2 0 7 2, 572 2.72 (1.09– 5.61)2013 0 0 0 0 1 0 2 0 1 0 4 3, 136 1.28 (0.35– 3.27)2012 0 0 1 0 1 0 1 0 0 0 3 3, 598 0.83 (0.17– 2.44)2011 0 0 0 0 0 0 1 0 2 0 3 5, 107 0.59 (0.12– 1.72)2010 0 0 1 0 1 0 1 1 3 0 7 5, 177 1.35 (0.54– 2.79)
Continued on next page . . .
16
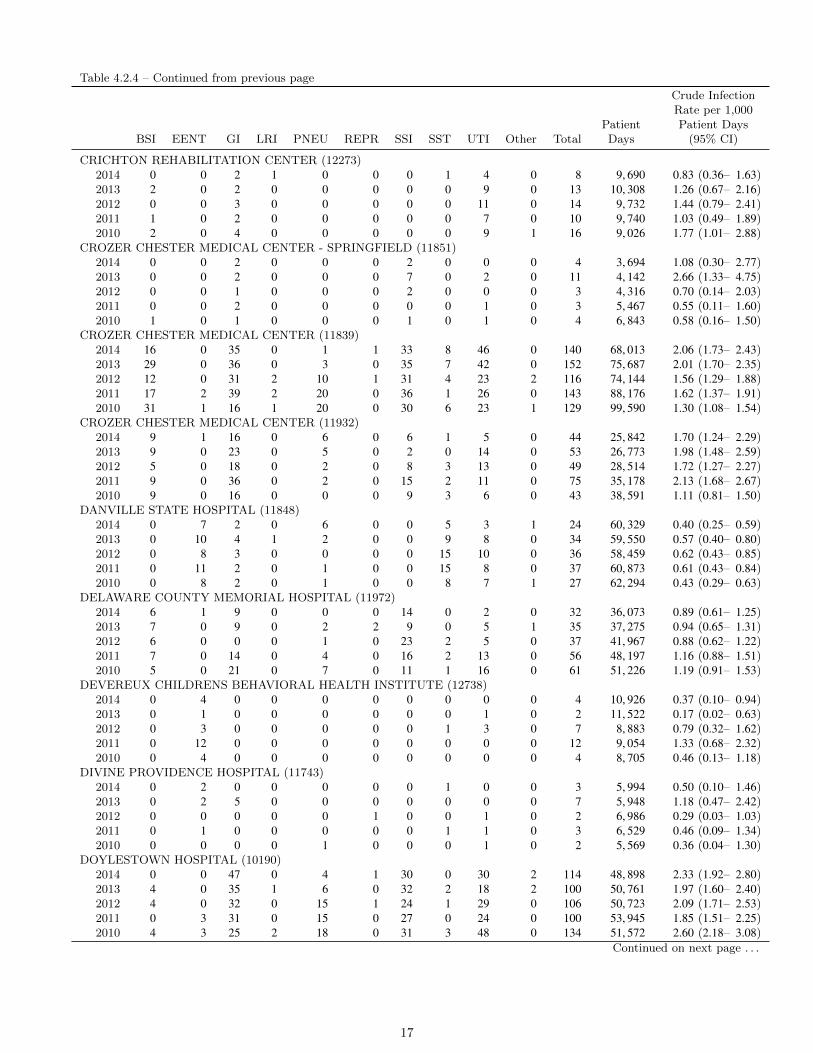
Table 4.2.4 – Continued from previous page
BSI EENT GI LRI PNEU REPR SSI SST UTI Other TotalPatientDays
Crude InfectionRate per 1,000Patient Days
(95% CI)
CRICHTON REHABILITATION CENTER (12273)2014 0 0 2 1 0 0 0 1 4 0 8 9, 690 0.83 (0.36– 1.63)2013 2 0 2 0 0 0 0 0 9 0 13 10, 308 1.26 (0.67– 2.16)2012 0 0 3 0 0 0 0 0 11 0 14 9, 732 1.44 (0.79– 2.41)2011 1 0 2 0 0 0 0 0 7 0 10 9, 740 1.03 (0.49– 1.89)2010 2 0 4 0 0 0 0 0 9 1 16 9, 026 1.77 (1.01– 2.88)
CROZER CHESTER MEDICAL CENTER - SPRINGFIELD (11851)2014 0 0 2 0 0 0 2 0 0 0 4 3, 694 1.08 (0.30– 2.77)2013 0 0 2 0 0 0 7 0 2 0 11 4, 142 2.66 (1.33– 4.75)2012 0 0 1 0 0 0 2 0 0 0 3 4, 316 0.70 (0.14– 2.03)2011 0 0 2 0 0 0 0 0 1 0 3 5, 467 0.55 (0.11– 1.60)2010 1 0 1 0 0 0 1 0 1 0 4 6, 843 0.58 (0.16– 1.50)
CROZER CHESTER MEDICAL CENTER (11839)2014 16 0 35 0 1 1 33 8 46 0 140 68, 013 2.06 (1.73– 2.43)2013 29 0 36 0 3 0 35 7 42 0 152 75, 687 2.01 (1.70– 2.35)2012 12 0 31 2 10 1 31 4 23 2 116 74, 144 1.56 (1.29– 1.88)2011 17 2 39 2 20 0 36 1 26 0 143 88, 176 1.62 (1.37– 1.91)2010 31 1 16 1 20 0 30 6 23 1 129 99, 590 1.30 (1.08– 1.54)
CROZER CHESTER MEDICAL CENTER (11932)2014 9 1 16 0 6 0 6 1 5 0 44 25, 842 1.70 (1.24– 2.29)2013 9 0 23 0 5 0 2 0 14 0 53 26, 773 1.98 (1.48– 2.59)2012 5 0 18 0 2 0 8 3 13 0 49 28, 514 1.72 (1.27– 2.27)2011 9 0 36 0 2 0 15 2 11 0 75 35, 178 2.13 (1.68– 2.67)2010 9 0 16 0 0 0 9 3 6 0 43 38, 591 1.11 (0.81– 1.50)
DANVILLE STATE HOSPITAL (11848)2014 0 7 2 0 6 0 0 5 3 1 24 60, 329 0.40 (0.25– 0.59)2013 0 10 4 1 2 0 0 9 8 0 34 59, 550 0.57 (0.40– 0.80)2012 0 8 3 0 0 0 0 15 10 0 36 58, 459 0.62 (0.43– 0.85)2011 0 11 2 0 1 0 0 15 8 0 37 60, 873 0.61 (0.43– 0.84)2010 0 8 2 0 1 0 0 8 7 1 27 62, 294 0.43 (0.29– 0.63)
DELAWARE COUNTY MEMORIAL HOSPITAL (11972)2014 6 1 9 0 0 0 14 0 2 0 32 36, 073 0.89 (0.61– 1.25)2013 7 0 9 0 2 2 9 0 5 1 35 37, 275 0.94 (0.65– 1.31)2012 6 0 0 0 1 0 23 2 5 0 37 41, 967 0.88 (0.62– 1.22)2011 7 0 14 0 4 0 16 2 13 0 56 48, 197 1.16 (0.88– 1.51)2010 5 0 21 0 7 0 11 1 16 0 61 51, 226 1.19 (0.91– 1.53)
DEVEREUX CHILDRENS BEHAVIORAL HEALTH INSTITUTE (12738)2014 0 4 0 0 0 0 0 0 0 0 4 10, 926 0.37 (0.10– 0.94)2013 0 1 0 0 0 0 0 0 1 0 2 11, 522 0.17 (0.02– 0.63)2012 0 3 0 0 0 0 0 1 3 0 7 8, 883 0.79 (0.32– 1.62)2011 0 12 0 0 0 0 0 0 0 0 12 9, 054 1.33 (0.68– 2.32)2010 0 4 0 0 0 0 0 0 0 0 4 8, 705 0.46 (0.13– 1.18)
DIVINE PROVIDENCE HOSPITAL (11743)2014 0 2 0 0 0 0 0 1 0 0 3 5, 994 0.50 (0.10– 1.46)2013 0 2 5 0 0 0 0 0 0 0 7 5, 948 1.18 (0.47– 2.42)2012 0 0 0 0 0 1 0 0 1 0 2 6, 986 0.29 (0.03– 1.03)2011 0 1 0 0 0 0 0 1 1 0 3 6, 529 0.46 (0.09– 1.34)2010 0 0 0 0 1 0 0 0 1 0 2 5, 569 0.36 (0.04– 1.30)
DOYLESTOWN HOSPITAL (10190)2014 0 0 47 0 4 1 30 0 30 2 114 48, 898 2.33 (1.92– 2.80)2013 4 0 35 1 6 0 32 2 18 2 100 50, 761 1.97 (1.60– 2.40)2012 4 0 32 0 15 1 24 1 29 0 106 50, 723 2.09 (1.71– 2.53)2011 0 3 31 0 15 0 27 0 24 0 100 53, 945 1.85 (1.51– 2.25)2010 4 3 25 2 18 0 31 3 48 0 134 51, 572 2.60 (2.18– 3.08)
Continued on next page . . .
17
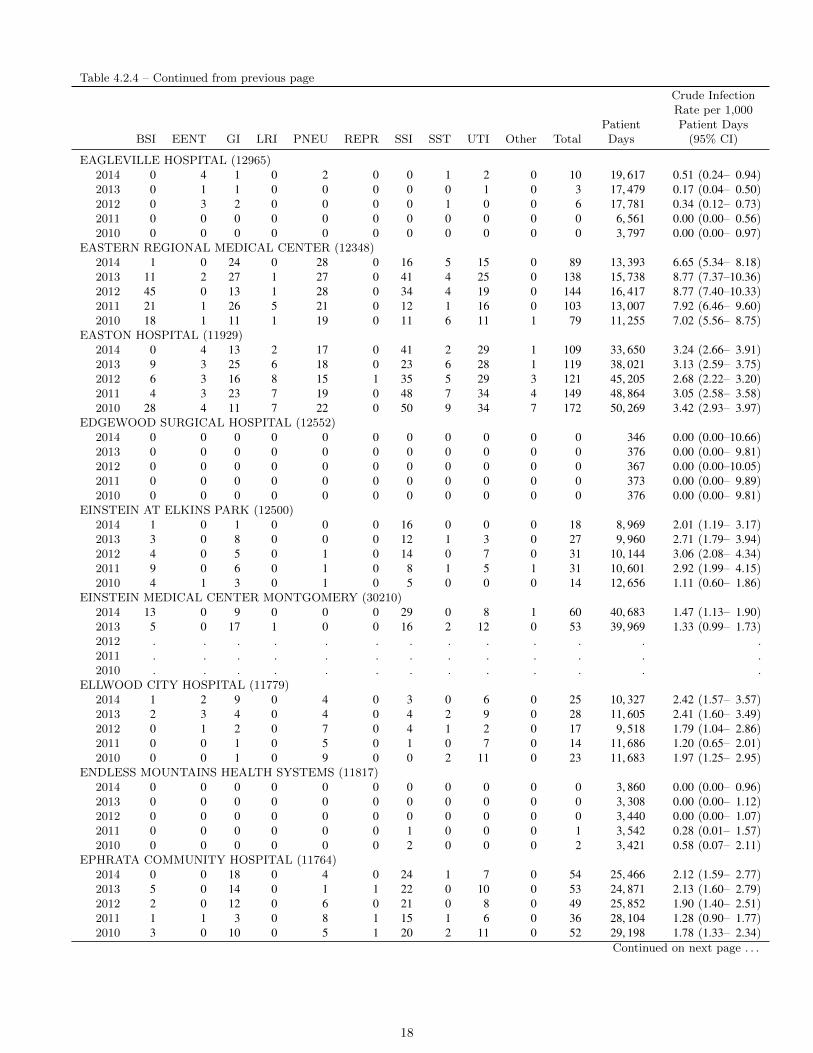
Table 4.2.4 – Continued from previous page
BSI EENT GI LRI PNEU REPR SSI SST UTI Other TotalPatientDays
Crude InfectionRate per 1,000Patient Days
(95% CI)
EAGLEVILLE HOSPITAL (12965)2014 0 4 1 0 2 0 0 1 2 0 10 19, 617 0.51 (0.24– 0.94)2013 0 1 1 0 0 0 0 0 1 0 3 17, 479 0.17 (0.04– 0.50)2012 0 3 2 0 0 0 0 1 0 0 6 17, 781 0.34 (0.12– 0.73)2011 0 0 0 0 0 0 0 0 0 0 0 6, 561 0.00 (0.00– 0.56)2010 0 0 0 0 0 0 0 0 0 0 0 3, 797 0.00 (0.00– 0.97)
EASTERN REGIONAL MEDICAL CENTER (12348)2014 1 0 24 0 28 0 16 5 15 0 89 13, 393 6.65 (5.34– 8.18)2013 11 2 27 1 27 0 41 4 25 0 138 15, 738 8.77 (7.37–10.36)2012 45 0 13 1 28 0 34 4 19 0 144 16, 417 8.77 (7.40–10.33)2011 21 1 26 5 21 0 12 1 16 0 103 13, 007 7.92 (6.46– 9.60)2010 18 1 11 1 19 0 11 6 11 1 79 11, 255 7.02 (5.56– 8.75)
EASTON HOSPITAL (11929)2014 0 4 13 2 17 0 41 2 29 1 109 33, 650 3.24 (2.66– 3.91)2013 9 3 25 6 18 0 23 6 28 1 119 38, 021 3.13 (2.59– 3.75)2012 6 3 16 8 15 1 35 5 29 3 121 45, 205 2.68 (2.22– 3.20)2011 4 3 23 7 19 0 48 7 34 4 149 48, 864 3.05 (2.58– 3.58)2010 28 4 11 7 22 0 50 9 34 7 172 50, 269 3.42 (2.93– 3.97)
EDGEWOOD SURGICAL HOSPITAL (12552)2014 0 0 0 0 0 0 0 0 0 0 0 346 0.00 (0.00–10.66)2013 0 0 0 0 0 0 0 0 0 0 0 376 0.00 (0.00– 9.81)2012 0 0 0 0 0 0 0 0 0 0 0 367 0.00 (0.00–10.05)2011 0 0 0 0 0 0 0 0 0 0 0 373 0.00 (0.00– 9.89)2010 0 0 0 0 0 0 0 0 0 0 0 376 0.00 (0.00– 9.81)
EINSTEIN AT ELKINS PARK (12500)2014 1 0 1 0 0 0 16 0 0 0 18 8, 969 2.01 (1.19– 3.17)2013 3 0 8 0 0 0 12 1 3 0 27 9, 960 2.71 (1.79– 3.94)2012 4 0 5 0 1 0 14 0 7 0 31 10, 144 3.06 (2.08– 4.34)2011 9 0 6 0 1 0 8 1 5 1 31 10, 601 2.92 (1.99– 4.15)2010 4 1 3 0 1 0 5 0 0 0 14 12, 656 1.11 (0.60– 1.86)
EINSTEIN MEDICAL CENTER MONTGOMERY (30210)2014 13 0 9 0 0 0 29 0 8 1 60 40, 683 1.47 (1.13– 1.90)2013 5 0 17 1 0 0 16 2 12 0 53 39, 969 1.33 (0.99– 1.73)2012 . . . . . . . . . . . . .2011 . . . . . . . . . . . . .2010 . . . . . . . . . . . . .
ELLWOOD CITY HOSPITAL (11779)2014 1 2 9 0 4 0 3 0 6 0 25 10, 327 2.42 (1.57– 3.57)2013 2 3 4 0 4 0 4 2 9 0 28 11, 605 2.41 (1.60– 3.49)2012 0 1 2 0 7 0 4 1 2 0 17 9, 518 1.79 (1.04– 2.86)2011 0 0 1 0 5 0 1 0 7 0 14 11, 686 1.20 (0.65– 2.01)2010 0 0 1 0 9 0 0 2 11 0 23 11, 683 1.97 (1.25– 2.95)
ENDLESS MOUNTAINS HEALTH SYSTEMS (11817)2014 0 0 0 0 0 0 0 0 0 0 0 3, 860 0.00 (0.00– 0.96)2013 0 0 0 0 0 0 0 0 0 0 0 3, 308 0.00 (0.00– 1.12)2012 0 0 0 0 0 0 0 0 0 0 0 3, 440 0.00 (0.00– 1.07)2011 0 0 0 0 0 0 1 0 0 0 1 3, 542 0.28 (0.01– 1.57)2010 0 0 0 0 0 0 2 0 0 0 2 3, 421 0.58 (0.07– 2.11)
EPHRATA COMMUNITY HOSPITAL (11764)2014 0 0 18 0 4 0 24 1 7 0 54 25, 466 2.12 (1.59– 2.77)2013 5 0 14 0 1 1 22 0 10 0 53 24, 871 2.13 (1.60– 2.79)2012 2 0 12 0 6 0 21 0 8 0 49 25, 852 1.90 (1.40– 2.51)2011 1 1 3 0 8 1 15 1 6 0 36 28, 104 1.28 (0.90– 1.77)2010 3 0 10 0 5 1 20 2 11 0 52 29, 198 1.78 (1.33– 2.34)
Continued on next page . . .
18

Table 4.2.4 – Continued from previous page
BSI EENT GI LRI PNEU REPR SSI SST UTI Other TotalPatientDays
Crude InfectionRate per 1,000Patient Days
(95% CI)
EVANGELICAL COMMUNITY HOSPITAL (11701)2014 1 3 5 2 6 0 26 2 16 0 61 22, 122 2.76 (2.11– 3.54)2013 1 1 6 0 6 1 40 1 13 1 70 21, 582 3.24 (2.53– 4.10)2012 2 2 2 0 3 0 43 4 11 0 67 21, 725 3.08 (2.39– 3.92)2011 0 1 2 3 7 0 35 0 10 0 58 21, 474 2.70 (2.05– 3.49)2010 1 0 10 0 3 0 34 1 4 0 53 19, 122 2.77 (2.08– 3.63)
EXCELA HEALTH FRICK HOSPITAL (11639)2014 0 0 9 0 3 0 1 0 5 0 18 10, 832 1.66 (0.98– 2.63)2013 2 0 5 1 4 0 5 0 2 0 19 12, 692 1.50 (0.90– 2.34)2012 2 0 5 0 1 0 3 1 4 0 16 12, 696 1.26 (0.72– 2.05)2011 2 0 8 0 4 0 3 1 6 0 24 14, 998 1.60 (1.03– 2.38)2010 0 1 11 0 0 0 2 1 2 0 17 15, 584 1.09 (0.64– 1.75)
EXCELA HEALTH LATROBE HOSPITAL (11651)2014 5 0 14 0 2 0 25 0 9 1 56 22, 094 2.53 (1.91– 3.29)2013 9 0 8 0 2 0 21 2 11 2 55 22, 665 2.43 (1.83– 3.16)2012 4 0 8 1 6 0 18 1 16 0 54 24, 746 2.18 (1.64– 2.85)2011 10 1 8 1 7 0 23 1 13 0 64 28, 678 2.23 (1.72– 2.85)2010 6 0 10 0 2 0 28 3 6 0 55 30, 030 1.83 (1.38– 2.38)
EXCELA HEALTH WESTMORELAND REGIONAL HOSPITAL (11637)2014 7 1 27 0 4 0 37 1 34 1 112 75, 458 1.48 (1.22– 1.79)2013 20 0 26 0 7 0 30 4 38 4 129 79, 133 1.63 (1.36– 1.94)2012 16 0 15 0 13 0 39 5 30 1 119 87, 500 1.36 (1.13– 1.63)2011 11 3 22 1 10 0 33 0 27 0 107 94, 631 1.13 (0.93– 1.37)2010 8 1 20 2 16 0 40 11 37 3 138 95, 320 1.45 (1.22– 1.71)
FAIRMOUNT BEHAVIORAL HEALTH SYSTEM (12565)2014 0 1 0 0 0 0 0 0 0 0 1 81, 435 0.01 (0.00– 0.07)2013 0 2 0 0 0 1 0 1 0 0 4 80, 158 0.05 (0.01– 0.13)2012 0 3 0 0 0 0 0 2 1 0 6 78, 553 0.08 (0.03– 0.17)2011 0 31 0 0 0 4 0 3 0 0 38 41, 349 0.92 (0.65– 1.26)2010 0 104 0 0 0 12 0 7 0 0 123 48, 188 2.55 (2.12– 3.05)
FIRST HOSPITAL OF WYOMING VALLEY (12050)2014 0 10 0 0 0 0 0 0 4 0 14 37, 248 0.38 (0.21– 0.63)2013 0 0 0 0 1 0 0 0 0 0 1 34, 150 0.03 (0.00– 0.16)2012 0 0 0 0 0 0 0 0 0 0 0 33, 278 0.00 (0.00– 0.11)2011 0 0 0 0 0 0 0 0 0 0 0 33, 733 0.00 (0.00– 0.11)2010 0 0 0 0 0 0 0 0 0 0 0 32, 369 0.00 (0.00– 0.11)
FORBES HOSPITAL (11265)2014 12 3 40 4 8 1 47 2 28 2 147 79, 832 1.84 (1.56– 2.16)2013 9 1 41 3 10 1 39 3 38 1 146 82, 592 1.77 (1.49– 2.08)2012 17 1 60 3 12 1 46 3 38 1 182 84, 685 2.15 (1.85– 2.49)2011 16 0 68 1 13 0 41 1 24 1 165 85, 996 1.92 (1.64– 2.23)2010 13 0 49 4 23 0 44 8 23 5 169 79, 998 2.11 (1.81– 2.46)
FOUNDATIONS BEHAVIORAL HEALTH (12832)2014 0 32 12 0 0 1 0 8 1 0 54 17, 388 3.11 (2.33– 4.05)2013 0 16 0 0 0 1 0 3 3 0 23 16, 853 1.36 (0.87– 2.05)2012 0 24 2 0 0 0 0 2 0 0 28 16, 352 1.71 (1.14– 2.47)2011 0 13 0 0 0 1 0 2 3 0 19 15, 372 1.24 (0.74– 1.93)2010 0 1 0 0 0 0 0 0 1 0 2 13, 331 0.15 (0.02– 0.54)
FRIENDS HOSPITAL (12488)2014 0 11 0 0 0 1 0 2 1 0 15 62, 353 0.24 (0.13– 0.40)2013 0 29 0 0 2 0 0 5 1 0 37 61, 857 0.60 (0.42– 0.82)2012 0 26 0 2 1 0 0 3 1 0 33 58, 046 0.57 (0.39– 0.80)2011 0 36 0 0 0 0 0 6 3 0 45 52, 675 0.85 (0.62– 1.14)2010 0 0 0 0 0 0 0 0 0 0 0 51, 693 0.00 (0.00– 0.07)
Continued on next page . . .
19

Table 4.2.4 – Continued from previous page
BSI EENT GI LRI PNEU REPR SSI SST UTI Other TotalPatientDays
Crude InfectionRate per 1,000Patient Days
(95% CI)
FULTON COUNTY MEDICAL CENTER (11939)2014 0 0 0 0 0 0 0 0 1 0 1 3, 761 0.27 (0.01– 1.48)2013 0 0 0 0 0 0 0 0 1 0 1 4, 192 0.24 (0.01– 1.33)2012 0 0 2 0 1 0 0 2 1 0 6 4, 625 1.30 (0.48– 2.82)2011 0 0 0 0 3 0 0 0 3 0 6 4, 065 1.48 (0.54– 3.21)2010 0 0 0 0 0 0 0 0 0 0 0 4, 574 0.00 (0.00– 0.81)
GEISINGER HEALTHSOUTH REHABILITATION HOSPITAL (11993)2014 1 0 0 0 1 0 0 0 3 0 5 11, 122 0.45 (0.15– 1.05)2013 0 0 0 0 0 0 0 0 1 0 1 11, 322 0.09 (0.00– 0.49)2012 0 0 4 0 0 0 0 0 8 0 12 11, 741 1.02 (0.53– 1.79)2011 0 0 5 0 0 0 0 0 3 0 8 10, 978 0.73 (0.31– 1.44)2010 0 0 3 0 1 0 0 0 2 0 6 10, 867 0.55 (0.20– 1.20)
GEISINGER MEDICAL CENTER (11775)2014 54 9 49 37 34 1 210 13 90 7 504 141, 137 3.57 (3.27– 3.90)2013 53 8 96 14 31 3 227 14 127 5 578 146, 288 3.95 (3.64– 4.29)2012 59 4 59 13 22 0 204 19 114 4 498 142, 149 3.50 (3.20– 3.83)2011 82 3 76 19 34 0 213 19 112 1 559 136, 175 4.11 (3.77– 4.46)2010 56 2 66 6 15 0 176 6 91 2 420 129, 984 3.23 (2.93– 3.56)
GEISINGER WYOMING VALLEY MEDICAL CENTER (11780)2014 13 3 41 9 15 0 111 7 67 2 268 73, 523 3.65 (3.22– 4.11)2013 13 1 56 7 24 1 88 2 68 1 261 74, 115 3.52 (3.11– 3.98)2012 15 6 48 10 19 1 120 9 60 3 291 67, 922 4.28 (3.81– 4.81)2011 14 0 40 14 32 0 111 5 67 2 285 64, 749 4.40 (3.91– 4.94)2010 12 0 40 6 29 0 134 8 40 1 270 58, 226 4.64 (4.10– 5.22)
GEISINGER-BLOOMSBURG HOSPITAL (12008)2014 0 1 1 0 1 0 8 0 1 0 12 9, 313 1.29 (0.67– 2.25)2013 0 0 2 0 1 0 12 0 2 0 17 11, 701 1.45 (0.85– 2.33)2012 3 0 0 0 2 0 6 0 0 1 12 12, 590 0.95 (0.49– 1.66)2011 2 0 0 0 2 0 3 0 0 0 7 13, 619 0.51 (0.21– 1.06)2010 0 0 0 0 0 0 9 0 1 1 11 14, 502 0.76 (0.38– 1.36)
GEISINGER-COMMUNITY MEDICAL CENTER (11914)2014 8 0 40 2 26 0 60 0 36 0 172 55, 497 3.10 (2.65– 3.60)2013 13 0 8 3 16 0 42 2 33 0 117 53, 698 2.18 (1.80– 2.61)2012 1 0 2 0 9 0 26 0 6 0 44 54, 768 0.80 (0.58– 1.08)2011 1 0 1 0 14 0 36 0 6 0 58 52, 727 1.10 (0.84– 1.42)2010 4 0 1 0 11 0 37 0 12 0 65 51, 767 1.26 (0.97– 1.60)
GEISINGER-LEWISTOWN HOSPITAL (11825)2014 1 0 5 0 5 0 13 1 3 0 28 24, 948 1.12 (0.75– 1.62)2013 4 0 13 0 11 0 11 0 7 0 46 25, 830 1.78 (1.30– 2.38)2012 2 0 7 1 13 1 15 3 4 0 46 25, 305 1.82 (1.33– 2.42)2011 1 0 7 0 4 2 18 0 8 0 40 24, 902 1.61 (1.15– 2.19)2010 1 0 3 0 9 0 19 0 13 0 45 23, 437 1.92 (1.40– 2.57)
GETTYSBURG HOSPITAL (11531)2014 3 0 7 0 1 0 20 2 7 0 40 19, 313 2.07 (1.48– 2.82)2013 3 0 12 0 2 0 12 0 8 1 38 19, 474 1.95 (1.38– 2.68)2012 2 0 5 0 6 0 16 0 2 0 31 18, 278 1.70 (1.15– 2.41)2011 0 0 10 0 2 2 19 0 2 0 35 18, 089 1.93 (1.35– 2.69)2010 0 0 13 0 4 0 8 0 4 0 29 17, 456 1.66 (1.11– 2.39)
GNADEN HUETTEN MEMORIAL HOSPITAL (12241)2014 2 0 3 0 5 0 8 1 6 0 25 18, 770 1.33 (0.86– 1.97)2013 2 12 9 2 6 0 12 0 11 0 54 17, 291 3.12 (2.35– 4.07)2012 3 8 9 0 4 2 10 1 22 0 59 18, 176 3.25 (2.47– 4.19)2011 1 4 3 0 3 0 6 2 13 0 32 16, 886 1.90 (1.30– 2.68)2010 1 5 2 0 1 0 9 1 7 1 27 16, 243 1.66 (1.10– 2.42)
Continued on next page . . .
20

Table 4.2.4 – Continued from previous page
BSI EENT GI LRI PNEU REPR SSI SST UTI Other TotalPatientDays
Crude InfectionRate per 1,000Patient Days
(95% CI)
GOOD SAMARITAN HOSPITAL, THE (11712)2014 2 0 1 4 10 0 8 2 11 3 41 38, 800 1.06 (0.76– 1.43)2013 7 0 4 1 14 0 15 2 10 1 54 38, 759 1.39 (1.05– 1.82)2012 7 0 11 0 4 0 14 1 26 0 63 39, 790 1.58 (1.22– 2.03)2011 4 1 16 2 9 0 14 5 25 1 77 42, 849 1.80 (1.42– 2.25)2010 11 1 22 3 13 0 20 8 26 4 108 41, 180 2.62 (2.15– 3.17)
GOOD SHEPHERD PENN PARTNERS AT RITTENHOUSE (13929)2014 15 0 14 44 12 0 0 1 37 2 125 9, 423 13.27 (11.04–15.81)2013 19 0 22 46 1 0 0 3 30 0 121 10, 506 11.52 (9.56–13.76)2012 22 0 16 22 7 0 0 1 26 0 94 9, 813 9.58 (7.74–11.72)2011 22 0 11 15 1 0 0 2 4 0 55 8, 537 6.44 (4.85– 8.39)2010 9 0 47 15 1 0 0 6 18 2 98 8, 874 11.04 (8.97–13.46)
GOOD SHEPHERD REHABILITATION HOSPITAL, THE (11896)2014 5 24 9 7 2 0 0 8 54 1 110 28, 742 3.83 (3.15– 4.61)2013 4 22 8 5 7 0 0 16 62 0 124 28, 995 4.28 (3.56– 5.10)2012 4 7 10 7 8 0 0 7 44 0 87 28, 461 3.06 (2.45– 3.77)2011 4 1 3 0 1 0 0 4 24 0 37 29, 920 1.24 (0.87– 1.70)2010 4 1 9 0 0 0 0 4 19 0 37 24, 553 1.51 (1.06– 2.08)
GOOD SHEPHERD SPECIALTY HOSPITAL (11887)2014 15 18 9 43 7 0 0 8 40 2 142 10, 650 13.33 (11.23–15.72)2013 11 11 17 26 8 1 0 12 35 4 125 9, 365 13.35 (11.11–15.90)2012 8 1 9 13 9 0 0 4 36 0 80 9, 982 8.01 (6.35– 9.97)2011 9 0 6 0 0 0 0 3 12 0 30 10, 551 2.84 (1.92– 4.06)2010 15 1 4 1 0 0 0 1 17 2 41 10, 503 3.90 (2.80– 5.30)
GRAND VIEW HOSPITAL (11847)2014 1 0 2 0 11 0 17 0 28 1 60 40, 456 1.48 (1.13– 1.91)2013 5 1 12 0 29 1 25 4 42 0 119 41, 380 2.88 (2.38– 3.44)2012 7 0 5 0 8 0 14 0 26 0 60 40, 826 1.47 (1.12– 1.89)2011 7 2 21 0 46 0 21 2 35 0 134 42, 899 3.12 (2.62– 3.70)2010 7 2 18 0 28 0 20 1 22 0 98 41, 631 2.35 (1.91– 2.87)
GROVE CITY MEDICAL CENTER (11722)2014 1 0 2 0 0 0 2 0 2 0 7 7, 752 0.90 (0.36– 1.86)2013 0 0 1 0 0 0 2 1 2 0 6 7, 717 0.78 (0.29– 1.69)2012 0 0 4 0 0 0 6 0 1 0 11 8, 181 1.34 (0.67– 2.41)2011 0 0 5 0 1 0 5 0 0 0 11 7, 906 1.39 (0.69– 2.49)2010 1 0 8 0 2 0 4 1 3 0 19 7, 396 2.57 (1.55– 4.01)
GUTHRIE TOWANDA MEMORIAL HOSPITAL (12549)2014 0 0 0 1 0 0 2 0 0 0 3 4, 790 0.63 (0.13– 1.83)2013 1 0 1 0 3 0 2 0 0 0 7 4, 867 1.44 (0.58– 2.96)2012 0 0 0 0 2 0 4 0 1 0 7 6, 544 1.07 (0.43– 2.20)2011 0 0 0 0 0 0 0 1 0 0 1 4, 432 0.23 (0.01– 1.26)2010 0 0 0 0 1 0 4 0 0 0 5 4, 659 1.07 (0.35– 2.50)
HAHNEMANN UNIVERSITY HOSPITAL (11437)2014 37 12 107 4 10 3 76 16 98 2 365 110, 786 3.29 (2.97– 3.65)2013 46 7 116 6 7 0 60 9 64 2 317 114, 138 2.78 (2.48– 3.10)2012 24 14 76 5 23 1 89 15 30 0 277 115, 028 2.41 (2.13– 2.71)2011 46 6 75 7 16 0 54 10 44 4 262 127, 259 2.06 (1.82– 2.32)2010 49 0 39 2 5 1 60 11 33 3 203 123, 052 1.65 (1.43– 1.89)
HANOVER HOSPITAL (11899)2014 2 0 14 0 8 0 24 2 13 0 63 26, 431 2.38 (1.83– 3.05)2013 3 0 25 0 8 0 10 0 31 0 77 26, 879 2.86 (2.26– 3.58)2012 6 0 10 0 9 0 26 0 22 3 76 24, 815 3.06 (2.41– 3.83)2011 0 0 23 1 8 0 20 3 27 0 82 25, 152 3.26 (2.59– 4.05)2010 6 0 17 0 6 0 26 1 20 1 77 26, 527 2.90 (2.29– 3.63)
Continued on next page . . .
21
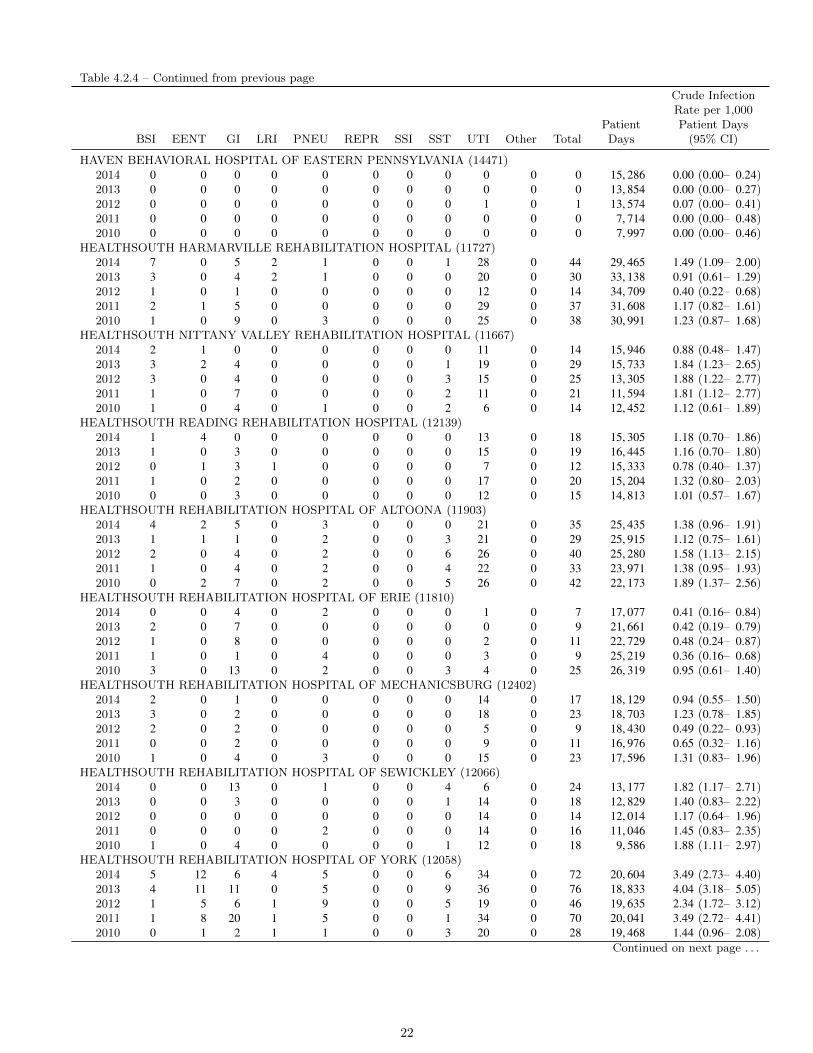
Table 4.2.4 – Continued from previous page
BSI EENT GI LRI PNEU REPR SSI SST UTI Other TotalPatientDays
Crude InfectionRate per 1,000Patient Days
(95% CI)
HAVEN BEHAVIORAL HOSPITAL OF EASTERN PENNSYLVANIA (14471)2014 0 0 0 0 0 0 0 0 0 0 0 15, 286 0.00 (0.00– 0.24)2013 0 0 0 0 0 0 0 0 0 0 0 13, 854 0.00 (0.00– 0.27)2012 0 0 0 0 0 0 0 0 1 0 1 13, 574 0.07 (0.00– 0.41)2011 0 0 0 0 0 0 0 0 0 0 0 7, 714 0.00 (0.00– 0.48)2010 0 0 0 0 0 0 0 0 0 0 0 7, 997 0.00 (0.00– 0.46)
HEALTHSOUTH HARMARVILLE REHABILITATION HOSPITAL (11727)2014 7 0 5 2 1 0 0 1 28 0 44 29, 465 1.49 (1.09– 2.00)2013 3 0 4 2 1 0 0 0 20 0 30 33, 138 0.91 (0.61– 1.29)2012 1 0 1 0 0 0 0 0 12 0 14 34, 709 0.40 (0.22– 0.68)2011 2 1 5 0 0 0 0 0 29 0 37 31, 608 1.17 (0.82– 1.61)2010 1 0 9 0 3 0 0 0 25 0 38 30, 991 1.23 (0.87– 1.68)
HEALTHSOUTH NITTANY VALLEY REHABILITATION HOSPITAL (11667)2014 2 1 0 0 0 0 0 0 11 0 14 15, 946 0.88 (0.48– 1.47)2013 3 2 4 0 0 0 0 1 19 0 29 15, 733 1.84 (1.23– 2.65)2012 3 0 4 0 0 0 0 3 15 0 25 13, 305 1.88 (1.22– 2.77)2011 1 0 7 0 0 0 0 2 11 0 21 11, 594 1.81 (1.12– 2.77)2010 1 0 4 0 1 0 0 2 6 0 14 12, 452 1.12 (0.61– 1.89)
HEALTHSOUTH READING REHABILITATION HOSPITAL (12139)2014 1 4 0 0 0 0 0 0 13 0 18 15, 305 1.18 (0.70– 1.86)2013 1 0 3 0 0 0 0 0 15 0 19 16, 445 1.16 (0.70– 1.80)2012 0 1 3 1 0 0 0 0 7 0 12 15, 333 0.78 (0.40– 1.37)2011 1 0 2 0 0 0 0 0 17 0 20 15, 204 1.32 (0.80– 2.03)2010 0 0 3 0 0 0 0 0 12 0 15 14, 813 1.01 (0.57– 1.67)
HEALTHSOUTH REHABILITATION HOSPITAL OF ALTOONA (11903)2014 4 2 5 0 3 0 0 0 21 0 35 25, 435 1.38 (0.96– 1.91)2013 1 1 1 0 2 0 0 3 21 0 29 25, 915 1.12 (0.75– 1.61)2012 2 0 4 0 2 0 0 6 26 0 40 25, 280 1.58 (1.13– 2.15)2011 1 0 4 0 2 0 0 4 22 0 33 23, 971 1.38 (0.95– 1.93)2010 0 2 7 0 2 0 0 5 26 0 42 22, 173 1.89 (1.37– 2.56)
HEALTHSOUTH REHABILITATION HOSPITAL OF ERIE (11810)2014 0 0 4 0 2 0 0 0 1 0 7 17, 077 0.41 (0.16– 0.84)2013 2 0 7 0 0 0 0 0 0 0 9 21, 661 0.42 (0.19– 0.79)2012 1 0 8 0 0 0 0 0 2 0 11 22, 729 0.48 (0.24– 0.87)2011 1 0 1 0 4 0 0 0 3 0 9 25, 219 0.36 (0.16– 0.68)2010 3 0 13 0 2 0 0 3 4 0 25 26, 319 0.95 (0.61– 1.40)
HEALTHSOUTH REHABILITATION HOSPITAL OF MECHANICSBURG (12402)2014 2 0 1 0 0 0 0 0 14 0 17 18, 129 0.94 (0.55– 1.50)2013 3 0 2 0 0 0 0 0 18 0 23 18, 703 1.23 (0.78– 1.85)2012 2 0 2 0 0 0 0 0 5 0 9 18, 430 0.49 (0.22– 0.93)2011 0 0 2 0 0 0 0 0 9 0 11 16, 976 0.65 (0.32– 1.16)2010 1 0 4 0 3 0 0 0 15 0 23 17, 596 1.31 (0.83– 1.96)
HEALTHSOUTH REHABILITATION HOSPITAL OF SEWICKLEY (12066)2014 0 0 13 0 1 0 0 4 6 0 24 13, 177 1.82 (1.17– 2.71)2013 0 0 3 0 0 0 0 1 14 0 18 12, 829 1.40 (0.83– 2.22)2012 0 0 0 0 0 0 0 0 14 0 14 12, 014 1.17 (0.64– 1.96)2011 0 0 0 0 2 0 0 0 14 0 16 11, 046 1.45 (0.83– 2.35)2010 1 0 4 0 0 0 0 1 12 0 18 9, 586 1.88 (1.11– 2.97)
HEALTHSOUTH REHABILITATION HOSPITAL OF YORK (12058)2014 5 12 6 4 5 0 0 6 34 0 72 20, 604 3.49 (2.73– 4.40)2013 4 11 11 0 5 0 0 9 36 0 76 18, 833 4.04 (3.18– 5.05)2012 1 5 6 1 9 0 0 5 19 0 46 19, 635 2.34 (1.72– 3.12)2011 1 8 20 1 5 0 0 1 34 0 70 20, 041 3.49 (2.72– 4.41)2010 0 1 2 1 1 0 0 3 20 0 28 19, 468 1.44 (0.96– 2.08)
Continued on next page . . .
22
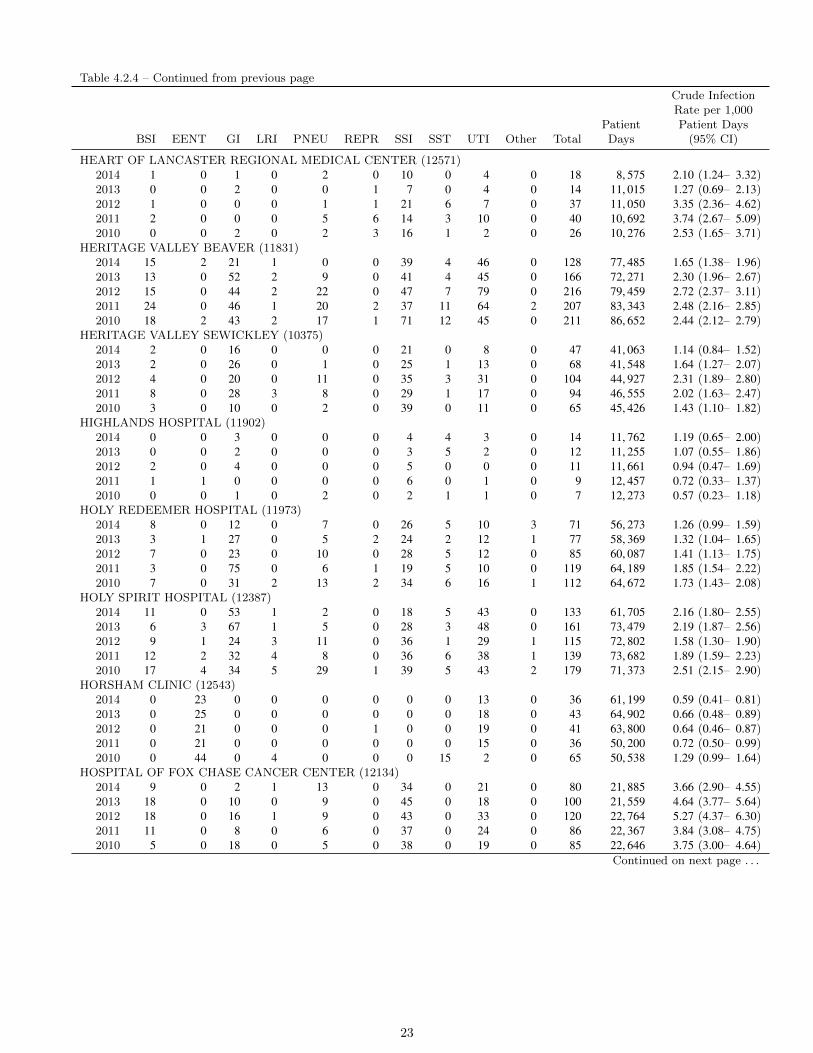
Table 4.2.4 – Continued from previous page
BSI EENT GI LRI PNEU REPR SSI SST UTI Other TotalPatientDays
Crude InfectionRate per 1,000Patient Days
(95% CI)
HEART OF LANCASTER REGIONAL MEDICAL CENTER (12571)2014 1 0 1 0 2 0 10 0 4 0 18 8, 575 2.10 (1.24– 3.32)2013 0 0 2 0 0 1 7 0 4 0 14 11, 015 1.27 (0.69– 2.13)2012 1 0 0 0 1 1 21 6 7 0 37 11, 050 3.35 (2.36– 4.62)2011 2 0 0 0 5 6 14 3 10 0 40 10, 692 3.74 (2.67– 5.09)2010 0 0 2 0 2 3 16 1 2 0 26 10, 276 2.53 (1.65– 3.71)
HERITAGE VALLEY BEAVER (11831)2014 15 2 21 1 0 0 39 4 46 0 128 77, 485 1.65 (1.38– 1.96)2013 13 0 52 2 9 0 41 4 45 0 166 72, 271 2.30 (1.96– 2.67)2012 15 0 44 2 22 0 47 7 79 0 216 79, 459 2.72 (2.37– 3.11)2011 24 0 46 1 20 2 37 11 64 2 207 83, 343 2.48 (2.16– 2.85)2010 18 2 43 2 17 1 71 12 45 0 211 86, 652 2.44 (2.12– 2.79)
HERITAGE VALLEY SEWICKLEY (10375)2014 2 0 16 0 0 0 21 0 8 0 47 41, 063 1.14 (0.84– 1.52)2013 2 0 26 0 1 0 25 1 13 0 68 41, 548 1.64 (1.27– 2.07)2012 4 0 20 0 11 0 35 3 31 0 104 44, 927 2.31 (1.89– 2.80)2011 8 0 28 3 8 0 29 1 17 0 94 46, 555 2.02 (1.63– 2.47)2010 3 0 10 0 2 0 39 0 11 0 65 45, 426 1.43 (1.10– 1.82)
HIGHLANDS HOSPITAL (11902)2014 0 0 3 0 0 0 4 4 3 0 14 11, 762 1.19 (0.65– 2.00)2013 0 0 2 0 0 0 3 5 2 0 12 11, 255 1.07 (0.55– 1.86)2012 2 0 4 0 0 0 5 0 0 0 11 11, 661 0.94 (0.47– 1.69)2011 1 1 0 0 0 0 6 0 1 0 9 12, 457 0.72 (0.33– 1.37)2010 0 0 1 0 2 0 2 1 1 0 7 12, 273 0.57 (0.23– 1.18)
HOLY REDEEMER HOSPITAL (11973)2014 8 0 12 0 7 0 26 5 10 3 71 56, 273 1.26 (0.99– 1.59)2013 3 1 27 0 5 2 24 2 12 1 77 58, 369 1.32 (1.04– 1.65)2012 7 0 23 0 10 0 28 5 12 0 85 60, 087 1.41 (1.13– 1.75)2011 3 0 75 0 6 1 19 5 10 0 119 64, 189 1.85 (1.54– 2.22)2010 7 0 31 2 13 2 34 6 16 1 112 64, 672 1.73 (1.43– 2.08)
HOLY SPIRIT HOSPITAL (12387)2014 11 0 53 1 2 0 18 5 43 0 133 61, 705 2.16 (1.80– 2.55)2013 6 3 67 1 5 0 28 3 48 0 161 73, 479 2.19 (1.87– 2.56)2012 9 1 24 3 11 0 36 1 29 1 115 72, 802 1.58 (1.30– 1.90)2011 12 2 32 4 8 0 36 6 38 1 139 73, 682 1.89 (1.59– 2.23)2010 17 4 34 5 29 1 39 5 43 2 179 71, 373 2.51 (2.15– 2.90)
HORSHAM CLINIC (12543)2014 0 23 0 0 0 0 0 0 13 0 36 61, 199 0.59 (0.41– 0.81)2013 0 25 0 0 0 0 0 0 18 0 43 64, 902 0.66 (0.48– 0.89)2012 0 21 0 0 0 1 0 0 19 0 41 63, 800 0.64 (0.46– 0.87)2011 0 21 0 0 0 0 0 0 15 0 36 50, 200 0.72 (0.50– 0.99)2010 0 44 0 4 0 0 0 15 2 0 65 50, 538 1.29 (0.99– 1.64)
HOSPITAL OF FOX CHASE CANCER CENTER (12134)2014 9 0 2 1 13 0 34 0 21 0 80 21, 885 3.66 (2.90– 4.55)2013 18 0 10 0 9 0 45 0 18 0 100 21, 559 4.64 (3.77– 5.64)2012 18 0 16 1 9 0 43 0 33 0 120 22, 764 5.27 (4.37– 6.30)2011 11 0 8 0 6 0 37 0 24 0 86 22, 367 3.84 (3.08– 4.75)2010 5 0 18 0 5 0 38 0 19 0 85 22, 646 3.75 (3.00– 4.64)
Continued on next page . . .
23
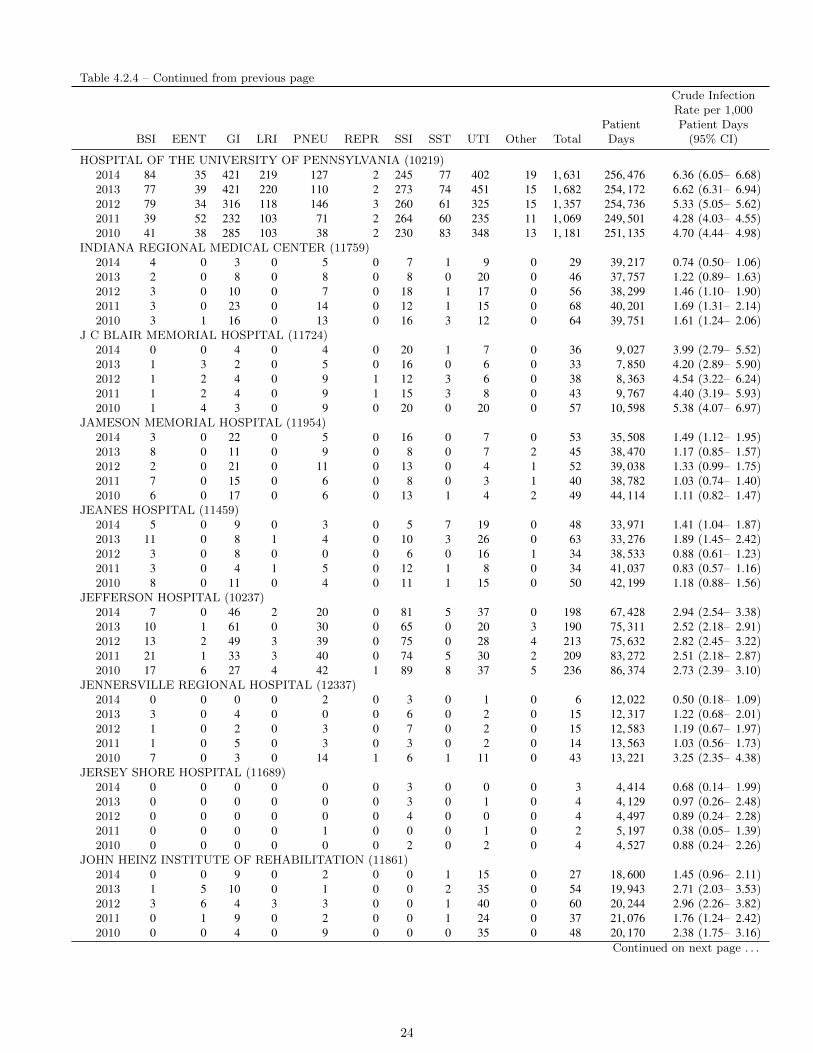
Table 4.2.4 – Continued from previous page
BSI EENT GI LRI PNEU REPR SSI SST UTI Other TotalPatientDays
Crude InfectionRate per 1,000Patient Days
(95% CI)
HOSPITAL OF THE UNIVERSITY OF PENNSYLVANIA (10219)2014 84 35 421 219 127 2 245 77 402 19 1, 631 256, 476 6.36 (6.05– 6.68)2013 77 39 421 220 110 2 273 74 451 15 1, 682 254, 172 6.62 (6.31– 6.94)2012 79 34 316 118 146 3 260 61 325 15 1, 357 254, 736 5.33 (5.05– 5.62)2011 39 52 232 103 71 2 264 60 235 11 1, 069 249, 501 4.28 (4.03– 4.55)2010 41 38 285 103 38 2 230 83 348 13 1, 181 251, 135 4.70 (4.44– 4.98)
INDIANA REGIONAL MEDICAL CENTER (11759)2014 4 0 3 0 5 0 7 1 9 0 29 39, 217 0.74 (0.50– 1.06)2013 2 0 8 0 8 0 8 0 20 0 46 37, 757 1.22 (0.89– 1.63)2012 3 0 10 0 7 0 18 1 17 0 56 38, 299 1.46 (1.10– 1.90)2011 3 0 23 0 14 0 12 1 15 0 68 40, 201 1.69 (1.31– 2.14)2010 3 1 16 0 13 0 16 3 12 0 64 39, 751 1.61 (1.24– 2.06)
J C BLAIR MEMORIAL HOSPITAL (11724)2014 0 0 4 0 4 0 20 1 7 0 36 9, 027 3.99 (2.79– 5.52)2013 1 3 2 0 5 0 16 0 6 0 33 7, 850 4.20 (2.89– 5.90)2012 1 2 4 0 9 1 12 3 6 0 38 8, 363 4.54 (3.22– 6.24)2011 1 2 4 0 9 1 15 3 8 0 43 9, 767 4.40 (3.19– 5.93)2010 1 4 3 0 9 0 20 0 20 0 57 10, 598 5.38 (4.07– 6.97)
JAMESON MEMORIAL HOSPITAL (11954)2014 3 0 22 0 5 0 16 0 7 0 53 35, 508 1.49 (1.12– 1.95)2013 8 0 11 0 9 0 8 0 7 2 45 38, 470 1.17 (0.85– 1.57)2012 2 0 21 0 11 0 13 0 4 1 52 39, 038 1.33 (0.99– 1.75)2011 7 0 15 0 6 0 8 0 3 1 40 38, 782 1.03 (0.74– 1.40)2010 6 0 17 0 6 0 13 1 4 2 49 44, 114 1.11 (0.82– 1.47)
JEANES HOSPITAL (11459)2014 5 0 9 0 3 0 5 7 19 0 48 33, 971 1.41 (1.04– 1.87)2013 11 0 8 1 4 0 10 3 26 0 63 33, 276 1.89 (1.45– 2.42)2012 3 0 8 0 0 0 6 0 16 1 34 38, 533 0.88 (0.61– 1.23)2011 3 0 4 1 5 0 12 1 8 0 34 41, 037 0.83 (0.57– 1.16)2010 8 0 11 0 4 0 11 1 15 0 50 42, 199 1.18 (0.88– 1.56)
JEFFERSON HOSPITAL (10237)2014 7 0 46 2 20 0 81 5 37 0 198 67, 428 2.94 (2.54– 3.38)2013 10 1 61 0 30 0 65 0 20 3 190 75, 311 2.52 (2.18– 2.91)2012 13 2 49 3 39 0 75 0 28 4 213 75, 632 2.82 (2.45– 3.22)2011 21 1 33 3 40 0 74 5 30 2 209 83, 272 2.51 (2.18– 2.87)2010 17 6 27 4 42 1 89 8 37 5 236 86, 374 2.73 (2.39– 3.10)
JENNERSVILLE REGIONAL HOSPITAL (12337)2014 0 0 0 0 2 0 3 0 1 0 6 12, 022 0.50 (0.18– 1.09)2013 3 0 4 0 0 0 6 0 2 0 15 12, 317 1.22 (0.68– 2.01)2012 1 0 2 0 3 0 7 0 2 0 15 12, 583 1.19 (0.67– 1.97)2011 1 0 5 0 3 0 3 0 2 0 14 13, 563 1.03 (0.56– 1.73)2010 7 0 3 0 14 1 6 1 11 0 43 13, 221 3.25 (2.35– 4.38)
JERSEY SHORE HOSPITAL (11689)2014 0 0 0 0 0 0 3 0 0 0 3 4, 414 0.68 (0.14– 1.99)2013 0 0 0 0 0 0 3 0 1 0 4 4, 129 0.97 (0.26– 2.48)2012 0 0 0 0 0 0 4 0 0 0 4 4, 497 0.89 (0.24– 2.28)2011 0 0 0 0 1 0 0 0 1 0 2 5, 197 0.38 (0.05– 1.39)2010 0 0 0 0 0 0 2 0 2 0 4 4, 527 0.88 (0.24– 2.26)
JOHN HEINZ INSTITUTE OF REHABILITATION (11861)2014 0 0 9 0 2 0 0 1 15 0 27 18, 600 1.45 (0.96– 2.11)2013 1 5 10 0 1 0 0 2 35 0 54 19, 943 2.71 (2.03– 3.53)2012 3 6 4 3 3 0 0 1 40 0 60 20, 244 2.96 (2.26– 3.82)2011 0 1 9 0 2 0 0 1 24 0 37 21, 076 1.76 (1.24– 2.42)2010 0 0 4 0 9 0 0 0 35 0 48 20, 170 2.38 (1.75– 3.16)
Continued on next page . . .
24

Table 4.2.4 – Continued from previous page
BSI EENT GI LRI PNEU REPR SSI SST UTI Other TotalPatientDays
Crude InfectionRate per 1,000Patient Days
(95% CI)
KANE COMMUNITY HOSPITAL (12111)2014 0 0 1 0 1 0 3 0 0 0 5 3, 806 1.31 (0.43– 3.07)2013 0 0 1 0 1 0 4 0 0 0 6 4, 230 1.42 (0.52– 3.09)2012 2 0 6 0 0 0 0 0 1 0 9 4, 769 1.89 (0.86– 3.58)2011 0 0 2 0 3 0 0 0 1 0 6 5, 398 1.11 (0.41– 2.42)2010 0 0 0 0 0 0 0 0 2 0 2 4, 608 0.43 (0.05– 1.57)
KENSINGTON HOSPITAL (12609)2014 1 0 0 0 0 0 0 0 0 0 1 2, 536 0.39 (0.01– 2.20)2013 0 0 0 0 0 0 0 0 0 0 0 2, 421 0.00 (0.00– 1.52)2012 0 0 0 0 0 0 0 1 1 0 2 2, 885 0.69 (0.08– 2.50)2011 1 0 0 0 0 0 0 0 1 0 2 2, 751 0.73 (0.09– 2.63)2010 1 0 0 0 0 0 0 0 0 0 1 2, 732 0.37 (0.01– 2.04)
KIDSPEACE ORCHARD HILLS CAMPUS (12430)2014 0 2 0 0 0 0 0 0 0 0 2 28, 286 0.07 (0.01– 0.26)2013 0 2 0 0 0 0 0 1 0 0 3 27, 338 0.11 (0.02– 0.32)2012 0 8 0 0 0 0 0 1 0 0 9 26, 389 0.34 (0.16– 0.65)2011 0 0 0 0 0 0 0 0 0 0 0 25, 124 0.00 (0.00– 0.15)2010 0 2 0 0 0 1 0 0 0 0 3 21, 724 0.14 (0.03– 0.40)
KINDRED HOSPITAL - PHILADELPHIA (11832)2014 10 1 8 11 1 0 0 11 24 0 66 11, 947 5.52 (4.27– 7.03)2013 18 0 10 2 1 0 0 6 25 1 63 11, 096 5.68 (4.36– 7.26)2012 25 0 8 1 1 0 0 2 35 1 73 11, 725 6.23 (4.88– 7.83)2011 24 0 19 6 3 0 0 2 57 0 111 13, 457 8.25 (6.79– 9.93)2010 37 1 8 11 3 0 0 2 56 0 118 14, 138 8.35 (6.91–10.00)
KINDRED HOSPITAL - PITTSBURGH (12358)2014 16 1 17 17 2 0 0 10 12 5 80 10, 161 7.87 (6.24– 9.80)2013 13 0 9 14 0 0 0 3 15 3 57 10, 270 5.55 (4.20– 7.19)2012 10 1 11 16 2 0 0 5 22 1 68 10, 309 6.60 (5.12– 8.36)2011 12 0 4 15 1 0 0 4 11 0 47 10, 214 4.60 (3.38– 6.12)2010 4 0 7 9 1 0 0 3 10 1 35 12, 513 2.80 (1.95– 3.89)
KINDRED HOSPITAL AT HERITAGE VALLEY (12268)2014 3 0 18 0 0 0 0 0 8 0 29 7, 953 3.65 (2.44– 5.24)2013 7 0 22 0 0 0 0 0 10 0 39 8, 223 4.74 (3.37– 6.48)2012 4 0 19 2 0 0 0 0 5 0 30 8, 898 3.37 (2.27– 4.81)2011 6 0 8 10 0 0 0 2 15 0 41 8, 765 4.68 (3.36– 6.35)2010 6 0 14 14 0 0 0 1 8 0 43 8, 815 4.88 (3.53– 6.57)
KINDRED HOSPITAL PHILADELPHIA-HAVERTOWN (12908)2014 7 0 22 2 0 0 0 3 9 0 43 13, 913 3.09 (2.24– 4.16)2013 7 0 17 4 0 0 0 1 12 2 43 14, 732 2.92 (2.11– 3.93)2012 10 0 13 1 2 0 0 2 19 1 48 15, 040 3.19 (2.35– 4.23)2011 11 0 7 0 0 0 0 5 13 0 36 12, 225 2.94 (2.06– 4.08)2010 18 0 0 0 2 0 0 2 14 0 36 12, 095 2.98 (2.08– 4.12)
KINDRED HOSPITAL SOUTH PHILADELPHIA (11940)2014 0 0 0 2 2 0 0 2 3 1 10 12, 158 0.82 (0.39– 1.51)2013 4 0 2 4 1 0 0 2 12 0 25 10, 174 2.46 (1.59– 3.63)2012 8 0 2 5 15 0 0 0 8 0 38 9, 100 4.18 (2.96– 5.73)2011 20 2 11 9 21 0 0 2 10 0 75 6, 625 11.32 (8.90–14.19)2010 22 0 2 0 11 0 0 3 20 2 60 7, 458 8.05 (6.14–10.36)
KIRKBRIDE CENTER (12624)2014 0 1 0 0 0 0 0 0 2 0 3 5, 130 0.58 (0.12– 1.71)2013 0 2 0 1 0 2 0 3 3 0 11 5, 811 1.89 (0.94– 3.39)2012 0 2 0 0 0 0 0 4 4 0 10 5, 369 1.86 (0.89– 3.43)2011 0 4 0 0 0 0 0 0 0 0 4 3, 593 1.11 (0.30– 2.85)2010 0 0 0 0 0 0 0 0 0 0 0 7, 803 0.00 (0.00– 0.47)
Continued on next page . . .
25
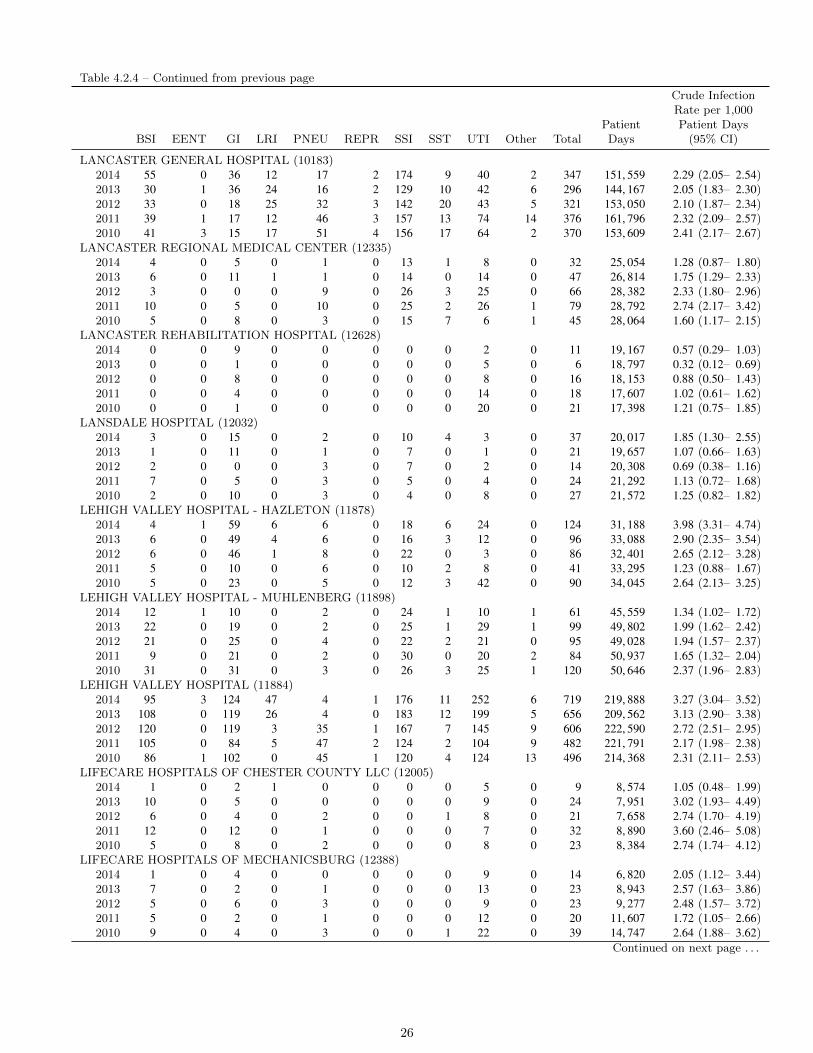
Table 4.2.4 – Continued from previous page
BSI EENT GI LRI PNEU REPR SSI SST UTI Other TotalPatientDays
Crude InfectionRate per 1,000Patient Days
(95% CI)
LANCASTER GENERAL HOSPITAL (10183)2014 55 0 36 12 17 2 174 9 40 2 347 151, 559 2.29 (2.05– 2.54)2013 30 1 36 24 16 2 129 10 42 6 296 144, 167 2.05 (1.83– 2.30)2012 33 0 18 25 32 3 142 20 43 5 321 153, 050 2.10 (1.87– 2.34)2011 39 1 17 12 46 3 157 13 74 14 376 161, 796 2.32 (2.09– 2.57)2010 41 3 15 17 51 4 156 17 64 2 370 153, 609 2.41 (2.17– 2.67)
LANCASTER REGIONAL MEDICAL CENTER (12335)2014 4 0 5 0 1 0 13 1 8 0 32 25, 054 1.28 (0.87– 1.80)2013 6 0 11 1 1 0 14 0 14 0 47 26, 814 1.75 (1.29– 2.33)2012 3 0 0 0 9 0 26 3 25 0 66 28, 382 2.33 (1.80– 2.96)2011 10 0 5 0 10 0 25 2 26 1 79 28, 792 2.74 (2.17– 3.42)2010 5 0 8 0 3 0 15 7 6 1 45 28, 064 1.60 (1.17– 2.15)
LANCASTER REHABILITATION HOSPITAL (12628)2014 0 0 9 0 0 0 0 0 2 0 11 19, 167 0.57 (0.29– 1.03)2013 0 0 1 0 0 0 0 0 5 0 6 18, 797 0.32 (0.12– 0.69)2012 0 0 8 0 0 0 0 0 8 0 16 18, 153 0.88 (0.50– 1.43)2011 0 0 4 0 0 0 0 0 14 0 18 17, 607 1.02 (0.61– 1.62)2010 0 0 1 0 0 0 0 0 20 0 21 17, 398 1.21 (0.75– 1.85)
LANSDALE HOSPITAL (12032)2014 3 0 15 0 2 0 10 4 3 0 37 20, 017 1.85 (1.30– 2.55)2013 1 0 11 0 1 0 7 0 1 0 21 19, 657 1.07 (0.66– 1.63)2012 2 0 0 0 3 0 7 0 2 0 14 20, 308 0.69 (0.38– 1.16)2011 7 0 5 0 3 0 5 0 4 0 24 21, 292 1.13 (0.72– 1.68)2010 2 0 10 0 3 0 4 0 8 0 27 21, 572 1.25 (0.82– 1.82)
LEHIGH VALLEY HOSPITAL - HAZLETON (11878)2014 4 1 59 6 6 0 18 6 24 0 124 31, 188 3.98 (3.31– 4.74)2013 6 0 49 4 6 0 16 3 12 0 96 33, 088 2.90 (2.35– 3.54)2012 6 0 46 1 8 0 22 0 3 0 86 32, 401 2.65 (2.12– 3.28)2011 5 0 10 0 6 0 10 2 8 0 41 33, 295 1.23 (0.88– 1.67)2010 5 0 23 0 5 0 12 3 42 0 90 34, 045 2.64 (2.13– 3.25)
LEHIGH VALLEY HOSPITAL - MUHLENBERG (11898)2014 12 1 10 0 2 0 24 1 10 1 61 45, 559 1.34 (1.02– 1.72)2013 22 0 19 0 2 0 25 1 29 1 99 49, 802 1.99 (1.62– 2.42)2012 21 0 25 0 4 0 22 2 21 0 95 49, 028 1.94 (1.57– 2.37)2011 9 0 21 0 2 0 30 0 20 2 84 50, 937 1.65 (1.32– 2.04)2010 31 0 31 0 3 0 26 3 25 1 120 50, 646 2.37 (1.96– 2.83)
LEHIGH VALLEY HOSPITAL (11884)2014 95 3 124 47 4 1 176 11 252 6 719 219, 888 3.27 (3.04– 3.52)2013 108 0 119 26 4 0 183 12 199 5 656 209, 562 3.13 (2.90– 3.38)2012 120 0 119 3 35 1 167 7 145 9 606 222, 590 2.72 (2.51– 2.95)2011 105 0 84 5 47 2 124 2 104 9 482 221, 791 2.17 (1.98– 2.38)2010 86 1 102 0 45 1 120 4 124 13 496 214, 368 2.31 (2.11– 2.53)
LIFECARE HOSPITALS OF CHESTER COUNTY LLC (12005)2014 1 0 2 1 0 0 0 0 5 0 9 8, 574 1.05 (0.48– 1.99)2013 10 0 5 0 0 0 0 0 9 0 24 7, 951 3.02 (1.93– 4.49)2012 6 0 4 0 2 0 0 1 8 0 21 7, 658 2.74 (1.70– 4.19)2011 12 0 12 0 1 0 0 0 7 0 32 8, 890 3.60 (2.46– 5.08)2010 5 0 8 0 2 0 0 0 8 0 23 8, 384 2.74 (1.74– 4.12)
LIFECARE HOSPITALS OF MECHANICSBURG (12388)2014 1 0 4 0 0 0 0 0 9 0 14 6, 820 2.05 (1.12– 3.44)2013 7 0 2 0 1 0 0 0 13 0 23 8, 943 2.57 (1.63– 3.86)2012 5 0 6 0 3 0 0 0 9 0 23 9, 277 2.48 (1.57– 3.72)2011 5 0 2 0 1 0 0 0 12 0 20 11, 607 1.72 (1.05– 2.66)2010 9 0 4 0 3 0 0 1 22 0 39 14, 747 2.64 (1.88– 3.62)
Continued on next page . . .
26

Table 4.2.4 – Continued from previous page
BSI EENT GI LRI PNEU REPR SSI SST UTI Other TotalPatientDays
Crude InfectionRate per 1,000Patient Days
(95% CI)
LIFECARE HOSPITALS OF PITTSBURGH - ALLE-KISKI CAMPUS (18955)2014 5 0 1 0 0 0 0 1 3 0 10 6, 352 1.57 (0.75– 2.90)2013 3 0 1 0 0 0 0 0 2 0 6 6, 744 0.89 (0.33– 1.94)2012 1 0 0 0 0 0 0 0 1 0 2 6, 811 0.29 (0.04– 1.06)2011 1 0 3 0 1 0 0 0 10 0 15 7, 254 2.07 (1.16– 3.41)2010 . . . . . . . . . . . . .
LIFECARE HOSPITALS OF PITTSBURGH - MONROEVILLE (12254)2014 6 0 3 1 0 0 0 0 8 0 18 11, 374 1.58 (0.94– 2.50)2013 9 0 9 0 2 0 0 0 9 0 29 13, 998 2.07 (1.39– 2.98)2012 6 0 6 2 2 0 0 0 13 0 29 12, 994 2.23 (1.49– 3.21)2011 10 0 17 4 0 0 0 0 19 0 50 14, 075 3.55 (2.64– 4.68)2010 10 0 17 8 3 0 0 0 19 0 57 15, 345 3.71 (2.81– 4.81)
LIFECARE HOSPITALS OF PITTSBURGH - SUBURBAN CAMPUS (12385)2014 13 0 0 0 0 0 0 0 1 0 14 7, 673 1.82 (1.00– 3.06)2013 1 0 1 0 0 0 0 0 1 0 3 7, 167 0.42 (0.09– 1.22)2012 7 0 3 0 0 0 0 0 0 0 10 8, 068 1.24 (0.59– 2.28)2011 9 0 9 0 0 0 0 0 2 0 20 7, 155 2.80 (1.71– 4.32)2010 4 0 12 0 0 0 0 0 6 0 22 6, 461 3.41 (2.13– 5.16)
LIFECARE HOSPITALS OF PITTSBURGH (11945)2014 3 0 6 0 1 0 0 1 7 0 18 16, 146 1.11 (0.66– 1.76)2013 11 0 7 1 3 0 0 0 12 0 34 24, 376 1.39 (0.97– 1.95)2012 8 0 8 0 3 0 0 0 6 0 25 25, 487 0.98 (0.63– 1.45)2011 19 0 19 0 6 0 0 1 5 0 50 27, 933 1.79 (1.33– 2.36)2010 21 1 28 6 13 0 0 1 15 0 85 33, 719 2.52 (2.01– 3.12)
LOCK HAVEN HOSPITAL (12097)2014 2 1 0 0 0 0 2 1 4 0 10 3, 611 2.77 (1.33– 5.09)2013 1 0 0 0 0 0 1 0 0 0 2 4, 229 0.47 (0.06– 1.71)2012 1 0 0 0 0 0 1 0 1 0 3 4, 456 0.67 (0.14– 1.97)2011 0 0 0 0 2 0 2 0 1 0 5 4, 158 1.20 (0.39– 2.81)2010 0 0 1 0 8 0 5 1 3 2 20 4, 819 4.15 (2.54– 6.41)
LOWER BUCKS HOSPITAL (12390)2014 10 0 1 0 1 0 1 0 3 0 16 21, 237 0.75 (0.43– 1.22)2013 6 0 0 0 1 0 3 0 3 0 13 22, 009 0.59 (0.31– 1.01)2012 4 0 0 0 1 1 0 0 6 0 12 30, 332 0.40 (0.20– 0.69)2011 1 0 0 5 2 0 13 0 5 0 26 31, 448 0.83 (0.54– 1.21)2010 5 0 0 0 6 0 10 0 11 0 32 35, 488 0.90 (0.62– 1.27)
MAGEE REHABILITATION HOSPITAL (12146)2014 1 0 2 0 0 0 0 0 29 0 32 25, 440 1.26 (0.86– 1.78)2013 0 0 15 0 0 0 0 0 29 0 44 29, 844 1.47 (1.07– 1.98)2012 1 0 10 0 0 0 0 0 21 0 32 26, 781 1.19 (0.82– 1.69)2011 2 0 10 0 1 0 0 0 60 0 73 28, 612 2.55 (2.00– 3.21)2010 0 0 0 0 0 0 0 0 98 0 98 28, 308 3.46 (2.81– 4.22)
MAGEE WOMENS HOSPITAL OF UPMC HEALTH SYSTEM (10301)2014 14 2 14 0 3 2 77 3 11 1 127 101, 499 1.25 (1.04– 1.49)2013 26 7 42 1 6 4 116 7 34 2 245 89, 478 2.74 (2.41– 3.10)2012 22 6 30 2 12 1 154 15 21 0 263 85, 243 3.09 (2.72– 3.48)2011 18 7 4 5 17 1 95 7 15 0 169 77, 844 2.17 (1.86– 2.52)2010 22 5 10 14 20 2 91 5 17 2 188 78, 301 2.40 (2.07– 2.77)
MAIN LINE HOSPITAL - PAOLI (11750)2014 11 2 32 3 15 3 33 0 23 1 123 55, 634 2.21 (1.84– 2.64)2013 8 1 23 3 8 0 39 5 30 0 117 55, 569 2.11 (1.74– 2.52)2012 11 1 21 3 19 5 25 1 15 1 102 56, 763 1.80 (1.47– 2.18)2011 6 1 15 3 14 0 33 2 20 2 96 59, 968 1.60 (1.30– 1.95)2010 6 1 13 0 20 0 35 2 25 1 103 57, 279 1.80 (1.47– 2.18)
Continued on next page . . .
27
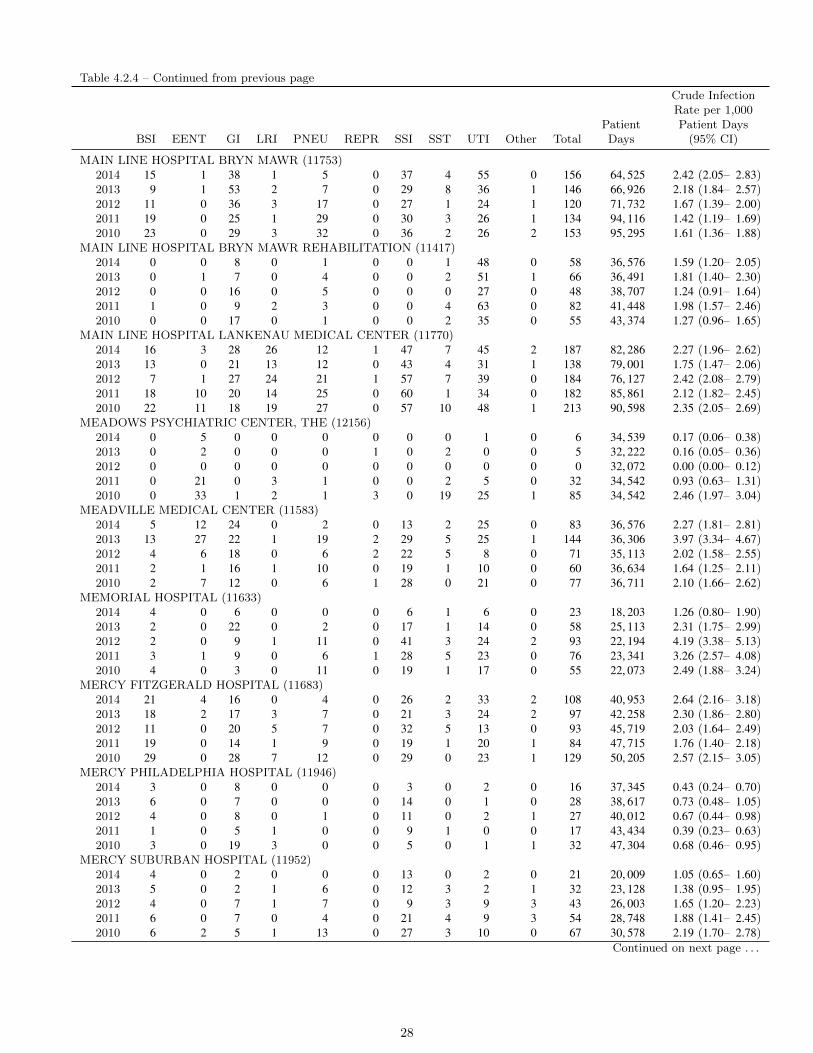
Table 4.2.4 – Continued from previous page
BSI EENT GI LRI PNEU REPR SSI SST UTI Other TotalPatientDays
Crude InfectionRate per 1,000Patient Days
(95% CI)
MAIN LINE HOSPITAL BRYN MAWR (11753)2014 15 1 38 1 5 0 37 4 55 0 156 64, 525 2.42 (2.05– 2.83)2013 9 1 53 2 7 0 29 8 36 1 146 66, 926 2.18 (1.84– 2.57)2012 11 0 36 3 17 0 27 1 24 1 120 71, 732 1.67 (1.39– 2.00)2011 19 0 25 1 29 0 30 3 26 1 134 94, 116 1.42 (1.19– 1.69)2010 23 0 29 3 32 0 36 2 26 2 153 95, 295 1.61 (1.36– 1.88)
MAIN LINE HOSPITAL BRYN MAWR REHABILITATION (11417)2014 0 0 8 0 1 0 0 1 48 0 58 36, 576 1.59 (1.20– 2.05)2013 0 1 7 0 4 0 0 2 51 1 66 36, 491 1.81 (1.40– 2.30)2012 0 0 16 0 5 0 0 0 27 0 48 38, 707 1.24 (0.91– 1.64)2011 1 0 9 2 3 0 0 4 63 0 82 41, 448 1.98 (1.57– 2.46)2010 0 0 17 0 1 0 0 2 35 0 55 43, 374 1.27 (0.96– 1.65)
MAIN LINE HOSPITAL LANKENAU MEDICAL CENTER (11770)2014 16 3 28 26 12 1 47 7 45 2 187 82, 286 2.27 (1.96– 2.62)2013 13 0 21 13 12 0 43 4 31 1 138 79, 001 1.75 (1.47– 2.06)2012 7 1 27 24 21 1 57 7 39 0 184 76, 127 2.42 (2.08– 2.79)2011 18 10 20 14 25 0 60 1 34 0 182 85, 861 2.12 (1.82– 2.45)2010 22 11 18 19 27 0 57 10 48 1 213 90, 598 2.35 (2.05– 2.69)
MEADOWS PSYCHIATRIC CENTER, THE (12156)2014 0 5 0 0 0 0 0 0 1 0 6 34, 539 0.17 (0.06– 0.38)2013 0 2 0 0 0 1 0 2 0 0 5 32, 222 0.16 (0.05– 0.36)2012 0 0 0 0 0 0 0 0 0 0 0 32, 072 0.00 (0.00– 0.12)2011 0 21 0 3 1 0 0 2 5 0 32 34, 542 0.93 (0.63– 1.31)2010 0 33 1 2 1 3 0 19 25 1 85 34, 542 2.46 (1.97– 3.04)
MEADVILLE MEDICAL CENTER (11583)2014 5 12 24 0 2 0 13 2 25 0 83 36, 576 2.27 (1.81– 2.81)2013 13 27 22 1 19 2 29 5 25 1 144 36, 306 3.97 (3.34– 4.67)2012 4 6 18 0 6 2 22 5 8 0 71 35, 113 2.02 (1.58– 2.55)2011 2 1 16 1 10 0 19 1 10 0 60 36, 634 1.64 (1.25– 2.11)2010 2 7 12 0 6 1 28 0 21 0 77 36, 711 2.10 (1.66– 2.62)
MEMORIAL HOSPITAL (11633)2014 4 0 6 0 0 0 6 1 6 0 23 18, 203 1.26 (0.80– 1.90)2013 2 0 22 0 2 0 17 1 14 0 58 25, 113 2.31 (1.75– 2.99)2012 2 0 9 1 11 0 41 3 24 2 93 22, 194 4.19 (3.38– 5.13)2011 3 1 9 0 6 1 28 5 23 0 76 23, 341 3.26 (2.57– 4.08)2010 4 0 3 0 11 0 19 1 17 0 55 22, 073 2.49 (1.88– 3.24)
MERCY FITZGERALD HOSPITAL (11683)2014 21 4 16 0 4 0 26 2 33 2 108 40, 953 2.64 (2.16– 3.18)2013 18 2 17 3 7 0 21 3 24 2 97 42, 258 2.30 (1.86– 2.80)2012 11 0 20 5 7 0 32 5 13 0 93 45, 719 2.03 (1.64– 2.49)2011 19 0 14 1 9 0 19 1 20 1 84 47, 715 1.76 (1.40– 2.18)2010 29 0 28 7 12 0 29 0 23 1 129 50, 205 2.57 (2.15– 3.05)
MERCY PHILADELPHIA HOSPITAL (11946)2014 3 0 8 0 0 0 3 0 2 0 16 37, 345 0.43 (0.24– 0.70)2013 6 0 7 0 0 0 14 0 1 0 28 38, 617 0.73 (0.48– 1.05)2012 4 0 8 0 1 0 11 0 2 1 27 40, 012 0.67 (0.44– 0.98)2011 1 0 5 1 0 0 9 1 0 0 17 43, 434 0.39 (0.23– 0.63)2010 3 0 19 3 0 0 5 0 1 1 32 47, 304 0.68 (0.46– 0.95)
MERCY SUBURBAN HOSPITAL (11952)2014 4 0 2 0 0 0 13 0 2 0 21 20, 009 1.05 (0.65– 1.60)2013 5 0 2 1 6 0 12 3 2 1 32 23, 128 1.38 (0.95– 1.95)2012 4 0 7 1 7 0 9 3 9 3 43 26, 003 1.65 (1.20– 2.23)2011 6 0 7 0 4 0 21 4 9 3 54 28, 748 1.88 (1.41– 2.45)2010 6 2 5 1 13 0 27 3 10 0 67 30, 578 2.19 (1.70– 2.78)
Continued on next page . . .
28
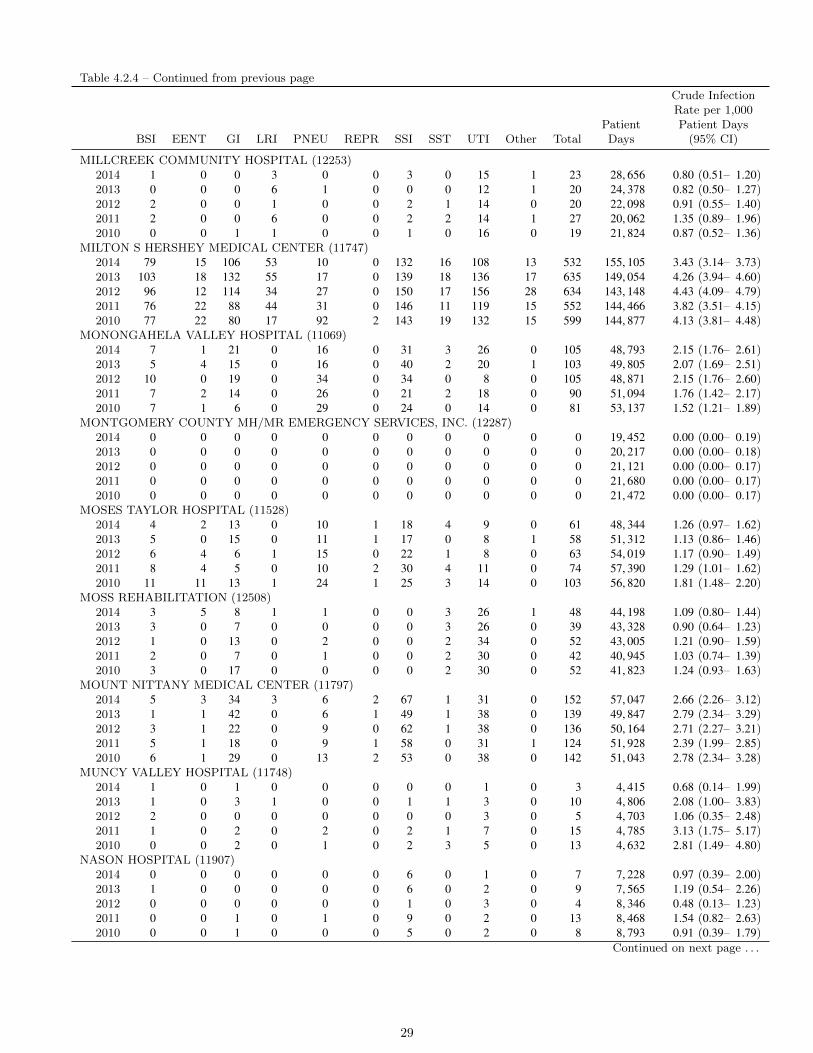
Table 4.2.4 – Continued from previous page
BSI EENT GI LRI PNEU REPR SSI SST UTI Other TotalPatientDays
Crude InfectionRate per 1,000Patient Days
(95% CI)
MILLCREEK COMMUNITY HOSPITAL (12253)2014 1 0 0 3 0 0 3 0 15 1 23 28, 656 0.80 (0.51– 1.20)2013 0 0 0 6 1 0 0 0 12 1 20 24, 378 0.82 (0.50– 1.27)2012 2 0 0 1 0 0 2 1 14 0 20 22, 098 0.91 (0.55– 1.40)2011 2 0 0 6 0 0 2 2 14 1 27 20, 062 1.35 (0.89– 1.96)2010 0 0 1 1 0 0 1 0 16 0 19 21, 824 0.87 (0.52– 1.36)
MILTON S HERSHEY MEDICAL CENTER (11747)2014 79 15 106 53 10 0 132 16 108 13 532 155, 105 3.43 (3.14– 3.73)2013 103 18 132 55 17 0 139 18 136 17 635 149, 054 4.26 (3.94– 4.60)2012 96 12 114 34 27 0 150 17 156 28 634 143, 148 4.43 (4.09– 4.79)2011 76 22 88 44 31 0 146 11 119 15 552 144, 466 3.82 (3.51– 4.15)2010 77 22 80 17 92 2 143 19 132 15 599 144, 877 4.13 (3.81– 4.48)
MONONGAHELA VALLEY HOSPITAL (11069)2014 7 1 21 0 16 0 31 3 26 0 105 48, 793 2.15 (1.76– 2.61)2013 5 4 15 0 16 0 40 2 20 1 103 49, 805 2.07 (1.69– 2.51)2012 10 0 19 0 34 0 34 0 8 0 105 48, 871 2.15 (1.76– 2.60)2011 7 2 14 0 26 0 21 2 18 0 90 51, 094 1.76 (1.42– 2.17)2010 7 1 6 0 29 0 24 0 14 0 81 53, 137 1.52 (1.21– 1.89)
MONTGOMERY COUNTY MH/MR EMERGENCY SERVICES, INC. (12287)2014 0 0 0 0 0 0 0 0 0 0 0 19, 452 0.00 (0.00– 0.19)2013 0 0 0 0 0 0 0 0 0 0 0 20, 217 0.00 (0.00– 0.18)2012 0 0 0 0 0 0 0 0 0 0 0 21, 121 0.00 (0.00– 0.17)2011 0 0 0 0 0 0 0 0 0 0 0 21, 680 0.00 (0.00– 0.17)2010 0 0 0 0 0 0 0 0 0 0 0 21, 472 0.00 (0.00– 0.17)
MOSES TAYLOR HOSPITAL (11528)2014 4 2 13 0 10 1 18 4 9 0 61 48, 344 1.26 (0.97– 1.62)2013 5 0 15 0 11 1 17 0 8 1 58 51, 312 1.13 (0.86– 1.46)2012 6 4 6 1 15 0 22 1 8 0 63 54, 019 1.17 (0.90– 1.49)2011 8 4 5 0 10 2 30 4 11 0 74 57, 390 1.29 (1.01– 1.62)2010 11 11 13 1 24 1 25 3 14 0 103 56, 820 1.81 (1.48– 2.20)
MOSS REHABILITATION (12508)2014 3 5 8 1 1 0 0 3 26 1 48 44, 198 1.09 (0.80– 1.44)2013 3 0 7 0 0 0 0 3 26 0 39 43, 328 0.90 (0.64– 1.23)2012 1 0 13 0 2 0 0 2 34 0 52 43, 005 1.21 (0.90– 1.59)2011 2 0 7 0 1 0 0 2 30 0 42 40, 945 1.03 (0.74– 1.39)2010 3 0 17 0 0 0 0 2 30 0 52 41, 823 1.24 (0.93– 1.63)
MOUNT NITTANY MEDICAL CENTER (11797)2014 5 3 34 3 6 2 67 1 31 0 152 57, 047 2.66 (2.26– 3.12)2013 1 1 42 0 6 1 49 1 38 0 139 49, 847 2.79 (2.34– 3.29)2012 3 1 22 0 9 0 62 1 38 0 136 50, 164 2.71 (2.27– 3.21)2011 5 1 18 0 9 1 58 0 31 1 124 51, 928 2.39 (1.99– 2.85)2010 6 1 29 0 13 2 53 0 38 0 142 51, 043 2.78 (2.34– 3.28)
MUNCY VALLEY HOSPITAL (11748)2014 1 0 1 0 0 0 0 0 1 0 3 4, 415 0.68 (0.14– 1.99)2013 1 0 3 1 0 0 1 1 3 0 10 4, 806 2.08 (1.00– 3.83)2012 2 0 0 0 0 0 0 0 3 0 5 4, 703 1.06 (0.35– 2.48)2011 1 0 2 0 2 0 2 1 7 0 15 4, 785 3.13 (1.75– 5.17)2010 0 0 2 0 1 0 2 3 5 0 13 4, 632 2.81 (1.49– 4.80)
NASON HOSPITAL (11907)2014 0 0 0 0 0 0 6 0 1 0 7 7, 228 0.97 (0.39– 2.00)2013 1 0 0 0 0 0 6 0 2 0 9 7, 565 1.19 (0.54– 2.26)2012 0 0 0 0 0 0 1 0 3 0 4 8, 346 0.48 (0.13– 1.23)2011 0 0 1 0 1 0 9 0 2 0 13 8, 468 1.54 (0.82– 2.63)2010 0 0 1 0 0 0 5 0 2 0 8 8, 793 0.91 (0.39– 1.79)
Continued on next page . . .
29
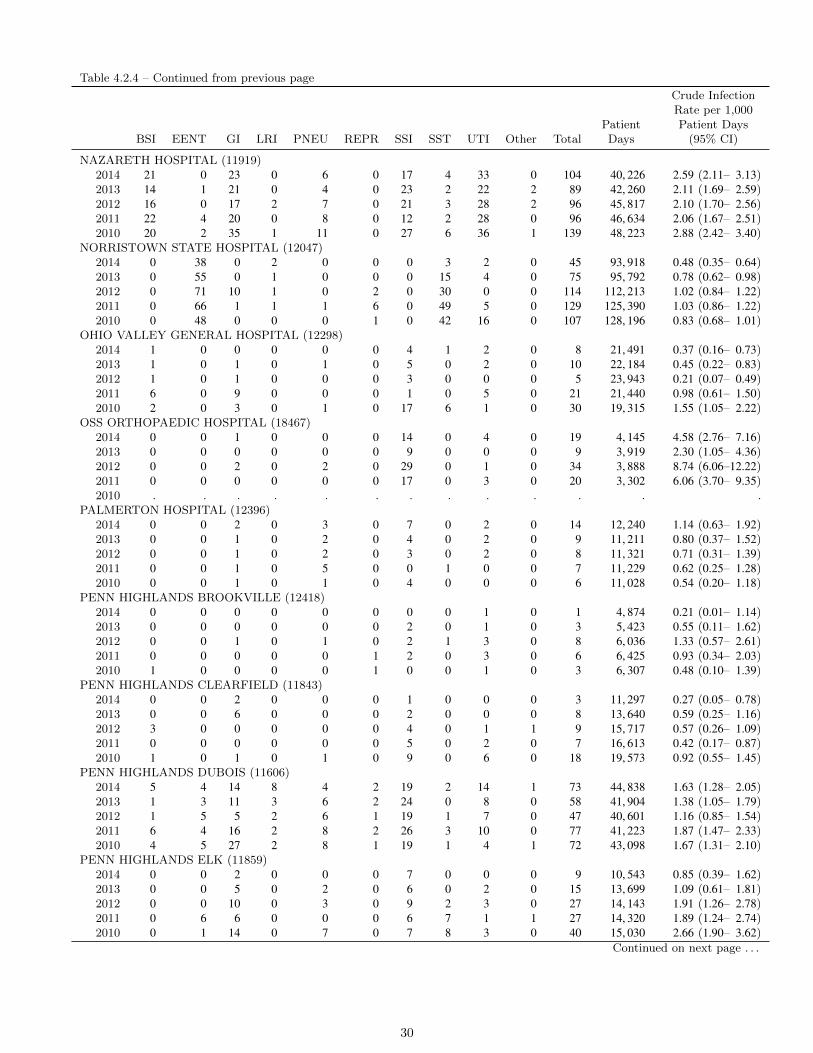
Table 4.2.4 – Continued from previous page
BSI EENT GI LRI PNEU REPR SSI SST UTI Other TotalPatientDays
Crude InfectionRate per 1,000Patient Days
(95% CI)
NAZARETH HOSPITAL (11919)2014 21 0 23 0 6 0 17 4 33 0 104 40, 226 2.59 (2.11– 3.13)2013 14 1 21 0 4 0 23 2 22 2 89 42, 260 2.11 (1.69– 2.59)2012 16 0 17 2 7 0 21 3 28 2 96 45, 817 2.10 (1.70– 2.56)2011 22 4 20 0 8 0 12 2 28 0 96 46, 634 2.06 (1.67– 2.51)2010 20 2 35 1 11 0 27 6 36 1 139 48, 223 2.88 (2.42– 3.40)
NORRISTOWN STATE HOSPITAL (12047)2014 0 38 0 2 0 0 0 3 2 0 45 93, 918 0.48 (0.35– 0.64)2013 0 55 0 1 0 0 0 15 4 0 75 95, 792 0.78 (0.62– 0.98)2012 0 71 10 1 0 2 0 30 0 0 114 112, 213 1.02 (0.84– 1.22)2011 0 66 1 1 1 6 0 49 5 0 129 125, 390 1.03 (0.86– 1.22)2010 0 48 0 0 0 1 0 42 16 0 107 128, 196 0.83 (0.68– 1.01)
OHIO VALLEY GENERAL HOSPITAL (12298)2014 1 0 0 0 0 0 4 1 2 0 8 21, 491 0.37 (0.16– 0.73)2013 1 0 1 0 1 0 5 0 2 0 10 22, 184 0.45 (0.22– 0.83)2012 1 0 1 0 0 0 3 0 0 0 5 23, 943 0.21 (0.07– 0.49)2011 6 0 9 0 0 0 1 0 5 0 21 21, 440 0.98 (0.61– 1.50)2010 2 0 3 0 1 0 17 6 1 0 30 19, 315 1.55 (1.05– 2.22)
OSS ORTHOPAEDIC HOSPITAL (18467)2014 0 0 1 0 0 0 14 0 4 0 19 4, 145 4.58 (2.76– 7.16)2013 0 0 0 0 0 0 9 0 0 0 9 3, 919 2.30 (1.05– 4.36)2012 0 0 2 0 2 0 29 0 1 0 34 3, 888 8.74 (6.06–12.22)2011 0 0 0 0 0 0 17 0 3 0 20 3, 302 6.06 (3.70– 9.35)2010 . . . . . . . . . . . . .
PALMERTON HOSPITAL (12396)2014 0 0 2 0 3 0 7 0 2 0 14 12, 240 1.14 (0.63– 1.92)2013 0 0 1 0 2 0 4 0 2 0 9 11, 211 0.80 (0.37– 1.52)2012 0 0 1 0 2 0 3 0 2 0 8 11, 321 0.71 (0.31– 1.39)2011 0 0 1 0 5 0 0 1 0 0 7 11, 229 0.62 (0.25– 1.28)2010 0 0 1 0 1 0 4 0 0 0 6 11, 028 0.54 (0.20– 1.18)
PENN HIGHLANDS BROOKVILLE (12418)2014 0 0 0 0 0 0 0 0 1 0 1 4, 874 0.21 (0.01– 1.14)2013 0 0 0 0 0 0 2 0 1 0 3 5, 423 0.55 (0.11– 1.62)2012 0 0 1 0 1 0 2 1 3 0 8 6, 036 1.33 (0.57– 2.61)2011 0 0 0 0 0 1 2 0 3 0 6 6, 425 0.93 (0.34– 2.03)2010 1 0 0 0 0 1 0 0 1 0 3 6, 307 0.48 (0.10– 1.39)
PENN HIGHLANDS CLEARFIELD (11843)2014 0 0 2 0 0 0 1 0 0 0 3 11, 297 0.27 (0.05– 0.78)2013 0 0 6 0 0 0 2 0 0 0 8 13, 640 0.59 (0.25– 1.16)2012 3 0 0 0 0 0 4 0 1 1 9 15, 717 0.57 (0.26– 1.09)2011 0 0 0 0 0 0 5 0 2 0 7 16, 613 0.42 (0.17– 0.87)2010 1 0 1 0 1 0 9 0 6 0 18 19, 573 0.92 (0.55– 1.45)
PENN HIGHLANDS DUBOIS (11606)2014 5 4 14 8 4 2 19 2 14 1 73 44, 838 1.63 (1.28– 2.05)2013 1 3 11 3 6 2 24 0 8 0 58 41, 904 1.38 (1.05– 1.79)2012 1 5 5 2 6 1 19 1 7 0 47 40, 601 1.16 (0.85– 1.54)2011 6 4 16 2 8 2 26 3 10 0 77 41, 223 1.87 (1.47– 2.33)2010 4 5 27 2 8 1 19 1 4 1 72 43, 098 1.67 (1.31– 2.10)
PENN HIGHLANDS ELK (11859)2014 0 0 2 0 0 0 7 0 0 0 9 10, 543 0.85 (0.39– 1.62)2013 0 0 5 0 2 0 6 0 2 0 15 13, 699 1.09 (0.61– 1.81)2012 0 0 10 0 3 0 9 2 3 0 27 14, 143 1.91 (1.26– 2.78)2011 0 6 6 0 0 0 6 7 1 1 27 14, 320 1.89 (1.24– 2.74)2010 0 1 14 0 7 0 7 8 3 0 40 15, 030 2.66 (1.90– 3.62)
Continued on next page . . .
30

Table 4.2.4 – Continued from previous page
BSI EENT GI LRI PNEU REPR SSI SST UTI Other TotalPatientDays
Crude InfectionRate per 1,000Patient Days
(95% CI)
PENN PRESBYTERIAN MEDICAL CENTER (11814)2014 37 1 20 10 3 0 56 2 48 4 181 63, 103 2.87 (2.47– 3.32)2013 37 4 17 14 12 0 55 4 44 1 188 60, 943 3.08 (2.66– 3.56)2012 27 0 13 21 12 0 66 5 40 0 184 62, 055 2.97 (2.55– 3.43)2011 33 1 20 20 10 0 59 4 33 0 180 65, 272 2.76 (2.37– 3.19)2010 20 0 14 10 7 0 44 1 41 0 137 64, 014 2.14 (1.80– 2.53)
PENN STATE HERSHEY REHABILITATION LLC (11915)2014 0 0 4 0 0 0 0 0 27 0 31 18, 144 1.71 (1.16– 2.43)2013 1 0 3 1 0 0 0 0 30 0 35 17, 246 2.03 (1.41– 2.82)2012 1 1 5 1 0 0 0 2 38 0 48 15, 851 3.03 (2.23– 4.01)2011 2 0 5 0 0 0 0 1 26 0 34 14, 130 2.41 (1.67– 3.36)2010 0 0 4 0 0 0 0 0 8 0 12 9, 804 1.22 (0.63– 2.14)
PENNSYLVANIA HOSPITAL OF THE UNIVERSITY OF PA HEALTH SYS (11448)2014 32 4 52 7 24 5 115 14 66 4 323 96, 178 3.36 (3.00– 3.75)2013 38 16 43 12 13 3 125 7 65 3 325 97, 602 3.33 (2.98– 3.71)2012 47 16 54 9 26 13 149 12 60 1 387 104, 403 3.71 (3.35– 4.10)2011 42 12 73 14 20 9 161 21 59 2 413 129, 191 3.20 (2.90– 3.52)2010 62 22 50 19 34 11 180 8 53 1 440 112, 059 3.93 (3.57– 4.31)
PENNSYLVANIA PSYCHIATRIC INSTITUTE (14190)2014 0 2 0 0 0 0 0 1 2 0 5 19, 057 0.26 (0.09– 0.61)2013 0 5 1 0 0 1 0 4 2 0 13 20, 998 0.62 (0.33– 1.06)2012 0 4 0 0 0 0 0 2 0 0 6 19, 892 0.30 (0.11– 0.66)2011 0 1 0 0 1 0 0 0 1 0 3 20, 269 0.15 (0.03– 0.43)2010 0 0 0 0 1 0 0 0 1 0 2 19, 437 0.10 (0.01– 0.37)
PHILHAVEN HOSPITAL (11740)2014 1 28 3 1 0 1 0 8 5 0 47 34, 882 1.35 (0.99– 1.79)2013 0 14 0 0 0 0 0 2 12 0 28 32, 171 0.87 (0.58– 1.26)2012 0 7 0 0 0 0 0 1 4 0 12 31, 017 0.39 (0.20– 0.68)2011 0 0 0 0 0 0 0 0 0 0 0 28, 128 0.00 (0.00– 0.13)2010 0 0 0 0 0 0 0 0 0 0 0 26, 943 0.00 (0.00– 0.14)
PHOENIXVILLE HOSPITAL COMPANY LLC (11836)2014 2 0 11 1 9 0 14 0 22 1 60 35, 174 1.71 (1.30– 2.20)2013 9 1 15 0 6 0 19 0 5 0 55 32, 971 1.67 (1.26– 2.17)2012 3 0 5 1 9 0 26 0 8 0 52 33, 584 1.55 (1.16– 2.03)2011 3 0 11 0 12 0 24 2 11 1 64 34, 445 1.86 (1.43– 2.37)2010 3 2 6 0 28 1 27 0 10 1 78 34, 362 2.27 (1.79– 2.83)
PHYSICIANS CARE SURGICAL HOSPITAL (19630)2014 0 0 0 0 0 0 1 0 0 0 1 1, 341 0.75 (0.02– 4.15)2013 0 0 0 0 0 0 1 0 0 0 1 1, 036 0.97 (0.02– 5.38)2012 0 0 0 0 0 0 0 0 0 0 0 381 0.00 (0.00– 9.68)2011 0 0 0 0 0 0 0 0 0 0 0 215 0.00 (0.00–17.16)2010 . . . . . . . . . . . . .
PINNACLE HEALTH HOSPITALS - COMMUNITY GENERAL OSTEOPATHIC HOSPITAL (34069)2014 14 0 28 2 7 0 42 7 32 2 134 48, 295 2.77 (2.32– 3.29)2013 . . . . . . . . . . . . .2012 . . . . . . . . . . . . .2011 . . . . . . . . . . . . .2010 . . . . . . . . . . . . .
PINNACLE HEALTH HOSPITALS - HARRISBURG HOSPITAL (34068)2014 16 5 77 3 6 0 79 17 75 1 279 105, 146 2.65 (2.35– 2.98)2013 . . . . . . . . . . . . .2012 . . . . . . . . . . . . .2011 . . . . . . . . . . . . .2010 . . . . . . . . . . . . .
Continued on next page . . .
31
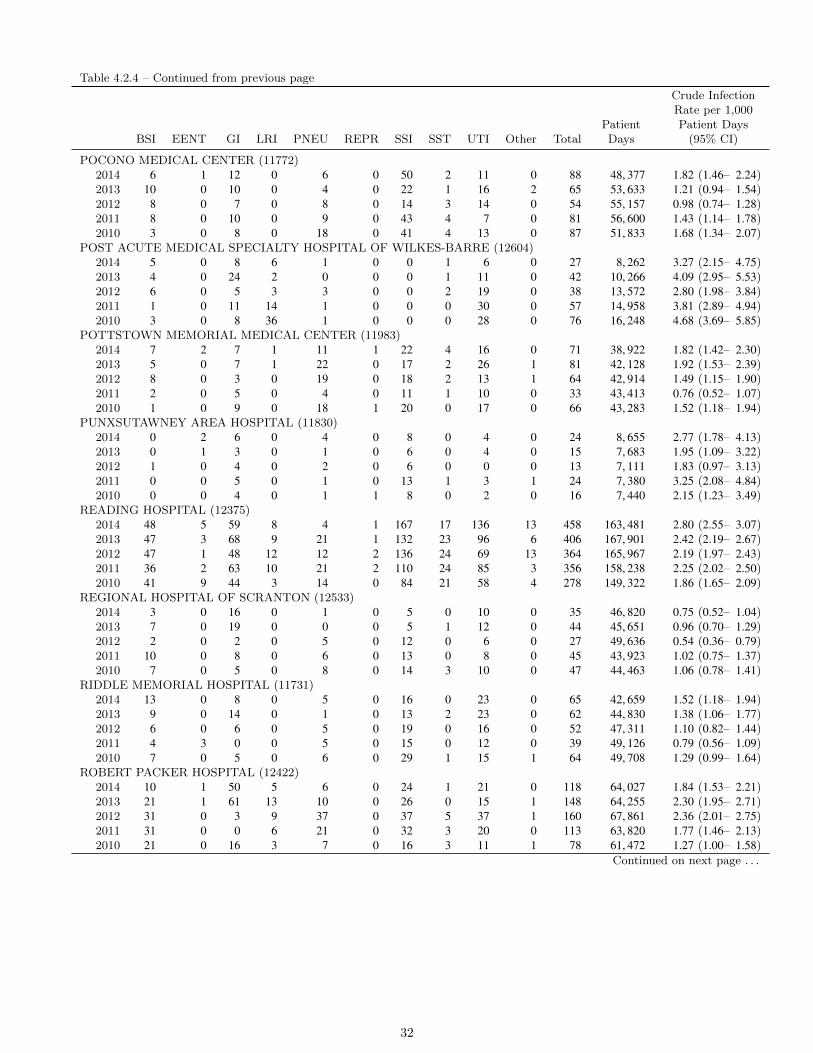
Table 4.2.4 – Continued from previous page
BSI EENT GI LRI PNEU REPR SSI SST UTI Other TotalPatientDays
Crude InfectionRate per 1,000Patient Days
(95% CI)
POCONO MEDICAL CENTER (11772)2014 6 1 12 0 6 0 50 2 11 0 88 48, 377 1.82 (1.46– 2.24)2013 10 0 10 0 4 0 22 1 16 2 65 53, 633 1.21 (0.94– 1.54)2012 8 0 7 0 8 0 14 3 14 0 54 55, 157 0.98 (0.74– 1.28)2011 8 0 10 0 9 0 43 4 7 0 81 56, 600 1.43 (1.14– 1.78)2010 3 0 8 0 18 0 41 4 13 0 87 51, 833 1.68 (1.34– 2.07)
POST ACUTE MEDICAL SPECIALTY HOSPITAL OF WILKES-BARRE (12604)2014 5 0 8 6 1 0 0 1 6 0 27 8, 262 3.27 (2.15– 4.75)2013 4 0 24 2 0 0 0 1 11 0 42 10, 266 4.09 (2.95– 5.53)2012 6 0 5 3 3 0 0 2 19 0 38 13, 572 2.80 (1.98– 3.84)2011 1 0 11 14 1 0 0 0 30 0 57 14, 958 3.81 (2.89– 4.94)2010 3 0 8 36 1 0 0 0 28 0 76 16, 248 4.68 (3.69– 5.85)
POTTSTOWN MEMORIAL MEDICAL CENTER (11983)2014 7 2 7 1 11 1 22 4 16 0 71 38, 922 1.82 (1.42– 2.30)2013 5 0 7 1 22 0 17 2 26 1 81 42, 128 1.92 (1.53– 2.39)2012 8 0 3 0 19 0 18 2 13 1 64 42, 914 1.49 (1.15– 1.90)2011 2 0 5 0 4 0 11 1 10 0 33 43, 413 0.76 (0.52– 1.07)2010 1 0 9 0 18 1 20 0 17 0 66 43, 283 1.52 (1.18– 1.94)
PUNXSUTAWNEY AREA HOSPITAL (11830)2014 0 2 6 0 4 0 8 0 4 0 24 8, 655 2.77 (1.78– 4.13)2013 0 1 3 0 1 0 6 0 4 0 15 7, 683 1.95 (1.09– 3.22)2012 1 0 4 0 2 0 6 0 0 0 13 7, 111 1.83 (0.97– 3.13)2011 0 0 5 0 1 0 13 1 3 1 24 7, 380 3.25 (2.08– 4.84)2010 0 0 4 0 1 1 8 0 2 0 16 7, 440 2.15 (1.23– 3.49)
READING HOSPITAL (12375)2014 48 5 59 8 4 1 167 17 136 13 458 163, 481 2.80 (2.55– 3.07)2013 47 3 68 9 21 1 132 23 96 6 406 167, 901 2.42 (2.19– 2.67)2012 47 1 48 12 12 2 136 24 69 13 364 165, 967 2.19 (1.97– 2.43)2011 36 2 63 10 21 2 110 24 85 3 356 158, 238 2.25 (2.02– 2.50)2010 41 9 44 3 14 0 84 21 58 4 278 149, 322 1.86 (1.65– 2.09)
REGIONAL HOSPITAL OF SCRANTON (12533)2014 3 0 16 0 1 0 5 0 10 0 35 46, 820 0.75 (0.52– 1.04)2013 7 0 19 0 0 0 5 1 12 0 44 45, 651 0.96 (0.70– 1.29)2012 2 0 2 0 5 0 12 0 6 0 27 49, 636 0.54 (0.36– 0.79)2011 10 0 8 0 6 0 13 0 8 0 45 43, 923 1.02 (0.75– 1.37)2010 7 0 5 0 8 0 14 3 10 0 47 44, 463 1.06 (0.78– 1.41)
RIDDLE MEMORIAL HOSPITAL (11731)2014 13 0 8 0 5 0 16 0 23 0 65 42, 659 1.52 (1.18– 1.94)2013 9 0 14 0 1 0 13 2 23 0 62 44, 830 1.38 (1.06– 1.77)2012 6 0 6 0 5 0 19 0 16 0 52 47, 311 1.10 (0.82– 1.44)2011 4 3 0 0 5 0 15 0 12 0 39 49, 126 0.79 (0.56– 1.09)2010 7 0 5 0 6 0 29 1 15 1 64 49, 708 1.29 (0.99– 1.64)
ROBERT PACKER HOSPITAL (12422)2014 10 1 50 5 6 0 24 1 21 0 118 64, 027 1.84 (1.53– 2.21)2013 21 1 61 13 10 0 26 0 15 1 148 64, 255 2.30 (1.95– 2.71)2012 31 0 3 9 37 0 37 5 37 1 160 67, 861 2.36 (2.01– 2.75)2011 31 0 0 6 21 0 32 3 20 0 113 63, 820 1.77 (1.46– 2.13)2010 21 0 16 3 7 0 16 3 11 1 78 61, 472 1.27 (1.00– 1.58)
Continued on next page . . .
32
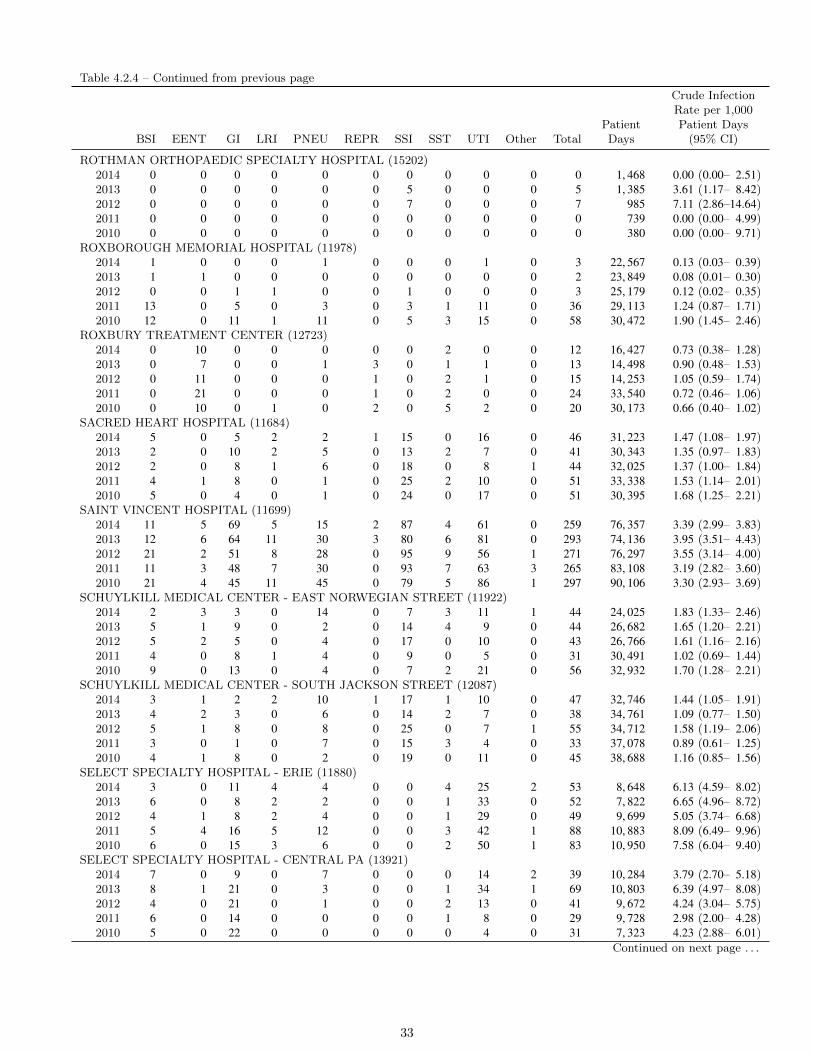
Table 4.2.4 – Continued from previous page
BSI EENT GI LRI PNEU REPR SSI SST UTI Other TotalPatientDays
Crude InfectionRate per 1,000Patient Days
(95% CI)
ROTHMAN ORTHOPAEDIC SPECIALTY HOSPITAL (15202)2014 0 0 0 0 0 0 0 0 0 0 0 1, 468 0.00 (0.00– 2.51)2013 0 0 0 0 0 0 5 0 0 0 5 1, 385 3.61 (1.17– 8.42)2012 0 0 0 0 0 0 7 0 0 0 7 985 7.11 (2.86–14.64)2011 0 0 0 0 0 0 0 0 0 0 0 739 0.00 (0.00– 4.99)2010 0 0 0 0 0 0 0 0 0 0 0 380 0.00 (0.00– 9.71)
ROXBOROUGH MEMORIAL HOSPITAL (11978)2014 1 0 0 0 1 0 0 0 1 0 3 22, 567 0.13 (0.03– 0.39)2013 1 1 0 0 0 0 0 0 0 0 2 23, 849 0.08 (0.01– 0.30)2012 0 0 1 1 0 0 1 0 0 0 3 25, 179 0.12 (0.02– 0.35)2011 13 0 5 0 3 0 3 1 11 0 36 29, 113 1.24 (0.87– 1.71)2010 12 0 11 1 11 0 5 3 15 0 58 30, 472 1.90 (1.45– 2.46)
ROXBURY TREATMENT CENTER (12723)2014 0 10 0 0 0 0 0 2 0 0 12 16, 427 0.73 (0.38– 1.28)2013 0 7 0 0 1 3 0 1 1 0 13 14, 498 0.90 (0.48– 1.53)2012 0 11 0 0 0 1 0 2 1 0 15 14, 253 1.05 (0.59– 1.74)2011 0 21 0 0 0 1 0 2 0 0 24 33, 540 0.72 (0.46– 1.06)2010 0 10 0 1 0 2 0 5 2 0 20 30, 173 0.66 (0.40– 1.02)
SACRED HEART HOSPITAL (11684)2014 5 0 5 2 2 1 15 0 16 0 46 31, 223 1.47 (1.08– 1.97)2013 2 0 10 2 5 0 13 2 7 0 41 30, 343 1.35 (0.97– 1.83)2012 2 0 8 1 6 0 18 0 8 1 44 32, 025 1.37 (1.00– 1.84)2011 4 1 8 0 1 0 25 2 10 0 51 33, 338 1.53 (1.14– 2.01)2010 5 0 4 0 1 0 24 0 17 0 51 30, 395 1.68 (1.25– 2.21)
SAINT VINCENT HOSPITAL (11699)2014 11 5 69 5 15 2 87 4 61 0 259 76, 357 3.39 (2.99– 3.83)2013 12 6 64 11 30 3 80 6 81 0 293 74, 136 3.95 (3.51– 4.43)2012 21 2 51 8 28 0 95 9 56 1 271 76, 297 3.55 (3.14– 4.00)2011 11 3 48 7 30 0 93 7 63 3 265 83, 108 3.19 (2.82– 3.60)2010 21 4 45 11 45 0 79 5 86 1 297 90, 106 3.30 (2.93– 3.69)
SCHUYLKILL MEDICAL CENTER - EAST NORWEGIAN STREET (11922)2014 2 3 3 0 14 0 7 3 11 1 44 24, 025 1.83 (1.33– 2.46)2013 5 1 9 0 2 0 14 4 9 0 44 26, 682 1.65 (1.20– 2.21)2012 5 2 5 0 4 0 17 0 10 0 43 26, 766 1.61 (1.16– 2.16)2011 4 0 8 1 4 0 9 0 5 0 31 30, 491 1.02 (0.69– 1.44)2010 9 0 13 0 4 0 7 2 21 0 56 32, 932 1.70 (1.28– 2.21)
SCHUYLKILL MEDICAL CENTER - SOUTH JACKSON STREET (12087)2014 3 1 2 2 10 1 17 1 10 0 47 32, 746 1.44 (1.05– 1.91)2013 4 2 3 0 6 0 14 2 7 0 38 34, 761 1.09 (0.77– 1.50)2012 5 1 8 0 8 0 25 0 7 1 55 34, 712 1.58 (1.19– 2.06)2011 3 0 1 0 7 0 15 3 4 0 33 37, 078 0.89 (0.61– 1.25)2010 4 1 8 0 2 0 19 0 11 0 45 38, 688 1.16 (0.85– 1.56)
SELECT SPECIALTY HOSPITAL - ERIE (11880)2014 3 0 11 4 4 0 0 4 25 2 53 8, 648 6.13 (4.59– 8.02)2013 6 0 8 2 2 0 0 1 33 0 52 7, 822 6.65 (4.96– 8.72)2012 4 1 8 2 4 0 0 1 29 0 49 9, 699 5.05 (3.74– 6.68)2011 5 4 16 5 12 0 0 3 42 1 88 10, 883 8.09 (6.49– 9.96)2010 6 0 15 3 6 0 0 2 50 1 83 10, 950 7.58 (6.04– 9.40)
SELECT SPECIALTY HOSPITAL - CENTRAL PA (13921)2014 7 0 9 0 7 0 0 0 14 2 39 10, 284 3.79 (2.70– 5.18)2013 8 1 21 0 3 0 0 1 34 1 69 10, 803 6.39 (4.97– 8.08)2012 4 0 21 0 1 0 0 2 13 0 41 9, 672 4.24 (3.04– 5.75)2011 6 0 14 0 0 0 0 1 8 0 29 9, 728 2.98 (2.00– 4.28)2010 5 0 22 0 0 0 0 0 4 0 31 7, 323 4.23 (2.88– 6.01)
Continued on next page . . .
33
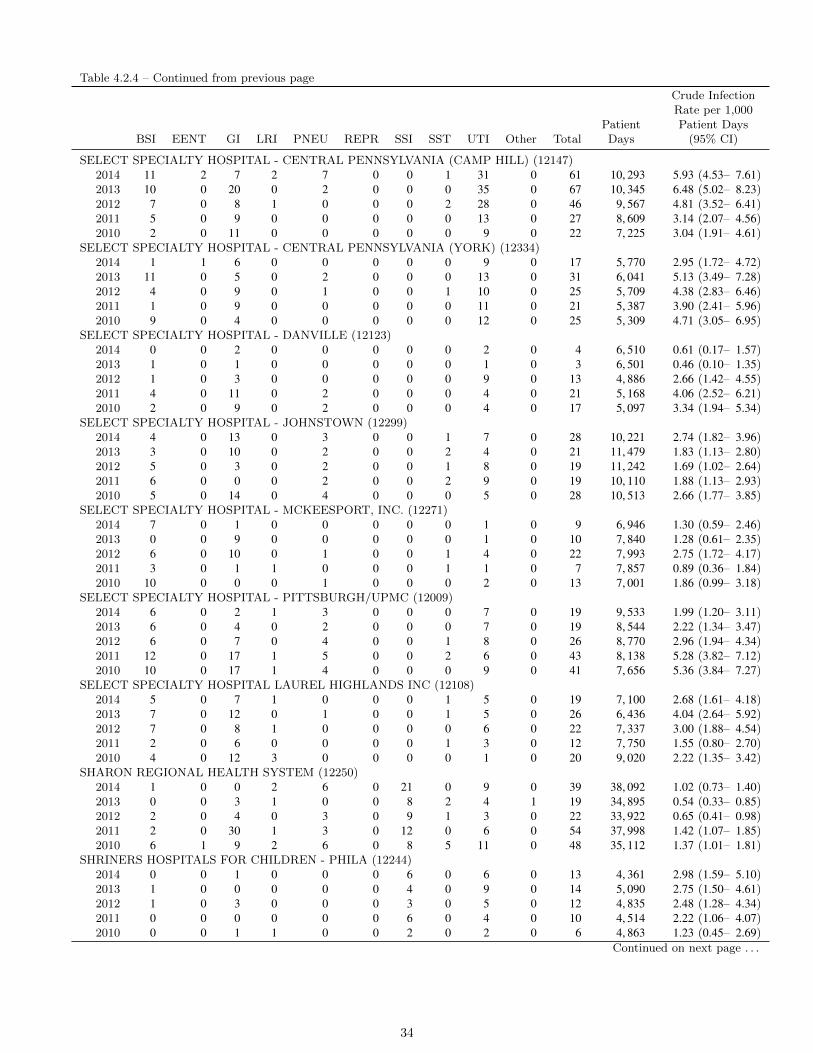
Table 4.2.4 – Continued from previous page
BSI EENT GI LRI PNEU REPR SSI SST UTI Other TotalPatientDays
Crude InfectionRate per 1,000Patient Days
(95% CI)
SELECT SPECIALTY HOSPITAL - CENTRAL PENNSYLVANIA (CAMP HILL) (12147)2014 11 2 7 2 7 0 0 1 31 0 61 10, 293 5.93 (4.53– 7.61)2013 10 0 20 0 2 0 0 0 35 0 67 10, 345 6.48 (5.02– 8.23)2012 7 0 8 1 0 0 0 2 28 0 46 9, 567 4.81 (3.52– 6.41)2011 5 0 9 0 0 0 0 0 13 0 27 8, 609 3.14 (2.07– 4.56)2010 2 0 11 0 0 0 0 0 9 0 22 7, 225 3.04 (1.91– 4.61)
SELECT SPECIALTY HOSPITAL - CENTRAL PENNSYLVANIA (YORK) (12334)2014 1 1 6 0 0 0 0 0 9 0 17 5, 770 2.95 (1.72– 4.72)2013 11 0 5 0 2 0 0 0 13 0 31 6, 041 5.13 (3.49– 7.28)2012 4 0 9 0 1 0 0 1 10 0 25 5, 709 4.38 (2.83– 6.46)2011 1 0 9 0 0 0 0 0 11 0 21 5, 387 3.90 (2.41– 5.96)2010 9 0 4 0 0 0 0 0 12 0 25 5, 309 4.71 (3.05– 6.95)
SELECT SPECIALTY HOSPITAL - DANVILLE (12123)2014 0 0 2 0 0 0 0 0 2 0 4 6, 510 0.61 (0.17– 1.57)2013 1 0 1 0 0 0 0 0 1 0 3 6, 501 0.46 (0.10– 1.35)2012 1 0 3 0 0 0 0 0 9 0 13 4, 886 2.66 (1.42– 4.55)2011 4 0 11 0 2 0 0 0 4 0 21 5, 168 4.06 (2.52– 6.21)2010 2 0 9 0 2 0 0 0 4 0 17 5, 097 3.34 (1.94– 5.34)
SELECT SPECIALTY HOSPITAL - JOHNSTOWN (12299)2014 4 0 13 0 3 0 0 1 7 0 28 10, 221 2.74 (1.82– 3.96)2013 3 0 10 0 2 0 0 2 4 0 21 11, 479 1.83 (1.13– 2.80)2012 5 0 3 0 2 0 0 1 8 0 19 11, 242 1.69 (1.02– 2.64)2011 6 0 0 0 2 0 0 2 9 0 19 10, 110 1.88 (1.13– 2.93)2010 5 0 14 0 4 0 0 0 5 0 28 10, 513 2.66 (1.77– 3.85)
SELECT SPECIALTY HOSPITAL - MCKEESPORT, INC. (12271)2014 7 0 1 0 0 0 0 0 1 0 9 6, 946 1.30 (0.59– 2.46)2013 0 0 9 0 0 0 0 0 1 0 10 7, 840 1.28 (0.61– 2.35)2012 6 0 10 0 1 0 0 1 4 0 22 7, 993 2.75 (1.72– 4.17)2011 3 0 1 1 0 0 0 1 1 0 7 7, 857 0.89 (0.36– 1.84)2010 10 0 0 0 1 0 0 0 2 0 13 7, 001 1.86 (0.99– 3.18)
SELECT SPECIALTY HOSPITAL - PITTSBURGH/UPMC (12009)2014 6 0 2 1 3 0 0 0 7 0 19 9, 533 1.99 (1.20– 3.11)2013 6 0 4 0 2 0 0 0 7 0 19 8, 544 2.22 (1.34– 3.47)2012 6 0 7 0 4 0 0 1 8 0 26 8, 770 2.96 (1.94– 4.34)2011 12 0 17 1 5 0 0 2 6 0 43 8, 138 5.28 (3.82– 7.12)2010 10 0 17 1 4 0 0 0 9 0 41 7, 656 5.36 (3.84– 7.27)
SELECT SPECIALTY HOSPITAL LAUREL HIGHLANDS INC (12108)2014 5 0 7 1 0 0 0 1 5 0 19 7, 100 2.68 (1.61– 4.18)2013 7 0 12 0 1 0 0 1 5 0 26 6, 436 4.04 (2.64– 5.92)2012 7 0 8 1 0 0 0 0 6 0 22 7, 337 3.00 (1.88– 4.54)2011 2 0 6 0 0 0 0 1 3 0 12 7, 750 1.55 (0.80– 2.70)2010 4 0 12 3 0 0 0 0 1 0 20 9, 020 2.22 (1.35– 3.42)
SHARON REGIONAL HEALTH SYSTEM (12250)2014 1 0 0 2 6 0 21 0 9 0 39 38, 092 1.02 (0.73– 1.40)2013 0 0 3 1 0 0 8 2 4 1 19 34, 895 0.54 (0.33– 0.85)2012 2 0 4 0 3 0 9 1 3 0 22 33, 922 0.65 (0.41– 0.98)2011 2 0 30 1 3 0 12 0 6 0 54 37, 998 1.42 (1.07– 1.85)2010 6 1 9 2 6 0 8 5 11 0 48 35, 112 1.37 (1.01– 1.81)
SHRINERS HOSPITALS FOR CHILDREN - PHILA (12244)2014 0 0 1 0 0 0 6 0 6 0 13 4, 361 2.98 (1.59– 5.10)2013 1 0 0 0 0 0 4 0 9 0 14 5, 090 2.75 (1.50– 4.61)2012 1 0 3 0 0 0 3 0 5 0 12 4, 835 2.48 (1.28– 4.34)2011 0 0 0 0 0 0 6 0 4 0 10 4, 514 2.22 (1.06– 4.07)2010 0 0 1 1 0 0 2 0 2 0 6 4, 863 1.23 (0.45– 2.69)
Continued on next page . . .
34

Table 4.2.4 – Continued from previous page
BSI EENT GI LRI PNEU REPR SSI SST UTI Other TotalPatientDays
Crude InfectionRate per 1,000Patient Days
(95% CI)
SOLDIERS AND SAILORS MEMORIAL HOSPITAL (11688)2014 2 1 8 2 3 0 6 2 2 0 26 10, 117 2.57 (1.68– 3.77)2013 5 3 8 0 10 0 9 4 5 1 45 11, 623 3.87 (2.82– 5.18)2012 3 0 0 0 2 1 11 1 4 0 22 11, 622 1.89 (1.19– 2.87)2011 1 0 3 0 7 0 10 0 3 1 25 11, 733 2.13 (1.38– 3.15)2010 0 0 6 0 2 1 5 1 2 0 17 12, 009 1.42 (0.82– 2.27)
SOMERSET HOSPITAL (12282)2014 1 0 2 0 1 0 2 0 0 0 6 15, 166 0.40 (0.15– 0.86)2013 3 0 3 0 4 0 5 0 5 0 20 18, 930 1.06 (0.65– 1.63)2012 0 1 3 0 3 0 4 3 5 0 19 17, 538 1.08 (0.65– 1.69)2011 2 0 1 0 1 0 3 0 1 0 8 19, 366 0.41 (0.18– 0.81)2010 0 0 1 0 2 0 3 0 0 0 6 19, 768 0.30 (0.11– 0.66)
SOUTHWEST REGIONAL MEDICAL CENTER (11942)2014 2 0 0 0 0 0 2 0 3 0 7 10, 418 0.67 (0.27– 1.38)2013 0 0 0 0 0 0 2 0 0 0 2 11, 449 0.17 (0.02– 0.63)2012 0 0 0 0 0 0 0 0 3 0 3 14, 297 0.21 (0.04– 0.61)2011 1 0 0 0 0 0 4 0 0 0 5 16, 853 0.30 (0.10– 0.69)2010 1 0 0 0 0 0 2 0 2 0 5 17, 904 0.28 (0.09– 0.65)
SOUTHWOOD PSYCHIATRIC HOSPITAL (12453)2014 0 0 0 0 0 0 0 0 0 0 0 17, 291 0.00 (0.00– 0.21)2013 0 25 0 0 0 7 0 10 1 0 43 15, 073 2.85 (2.06– 3.84)2012 0 20 0 0 0 1 0 3 1 0 25 13, 263 1.88 (1.22– 2.78)2011 0 20 0 1 0 0 0 8 1 0 30 11, 388 2.63 (1.78– 3.76)2010 0 6 0 0 0 0 0 7 0 0 13 9, 686 1.34 (0.71– 2.30)
ST. CHRISTOPHERS HOSPITAL FOR CHILDREN (12290)2014 12 18 12 12 1 0 15 2 8 3 83 40, 772 2.04 (1.62– 2.52)2013 21 9 12 16 2 0 15 5 6 1 87 44, 274 1.97 (1.57– 2.42)2012 21 20 8 17 3 0 15 6 8 3 101 47, 658 2.12 (1.73– 2.58)2011 27 17 7 15 3 0 16 8 12 2 107 46, 423 2.30 (1.89– 2.79)2010 21 12 7 12 1 0 19 6 11 1 90 41, 556 2.17 (1.74– 2.66)
ST. CLAIR MEMORIAL HOSPITAL (10561)2014 4 0 36 2 3 0 52 2 13 0 112 86, 277 1.30 (1.07– 1.56)2013 1 0 48 1 7 1 65 1 18 1 143 83, 028 1.72 (1.45– 2.03)2012 4 0 77 1 5 1 74 3 20 0 185 83, 473 2.22 (1.91– 2.56)2011 2 1 81 1 15 0 66 4 8 2 180 85, 606 2.10 (1.81– 2.43)2010 5 3 65 2 10 1 77 3 17 0 183 86, 799 2.11 (1.81– 2.44)
ST. JOHN VIANNEY HOSPITAL (12548)2014 0 0 0 0 0 0 0 0 1 0 1 13, 998 0.07 (0.00– 0.40)2013 0 1 0 0 0 0 0 1 0 0 2 11, 963 0.17 (0.02– 0.60)2012 0 1 0 0 0 0 0 2 0 0 3 11, 673 0.26 (0.05– 0.75)2011 0 0 4 0 0 0 0 4 0 0 8 14, 231 0.56 (0.24– 1.11)2010 0 0 0 0 0 0 0 1 0 0 1 12, 687 0.08 (0.00– 0.44)
ST. JOSEPH MEDICAL CTR (11961)2014 7 0 20 0 0 1 31 0 7 1 67 32, 614 2.05 (1.59– 2.61)2013 11 0 24 1 8 1 27 0 18 0 90 33, 728 2.67 (2.15– 3.28)2012 11 0 10 1 7 0 24 3 14 0 70 37, 252 1.88 (1.46– 2.37)2011 10 0 2 1 4 0 28 0 16 0 61 37, 733 1.62 (1.24– 2.08)2010 7 0 2 0 2 0 19 1 14 0 45 38, 065 1.18 (0.86– 1.58)
ST. JOSEPHS HOSPITAL (12438)2014 12 0 0 0 12 0 4 0 21 1 50 30, 140 1.66 (1.23– 2.19)2013 26 0 14 1 10 0 2 1 19 0 73 30, 941 2.36 (1.85– 2.97)2012 6 0 4 1 6 0 0 0 11 0 28 31, 637 0.89 (0.59– 1.28)2011 20 0 3 0 7 0 1 1 25 0 57 23, 411 2.43 (1.84– 3.15)2010 27 0 8 0 5 0 2 0 22 0 64 22, 626 2.83 (2.18– 3.61)
Continued on next page . . .
35

Table 4.2.4 – Continued from previous page
BSI EENT GI LRI PNEU REPR SSI SST UTI Other TotalPatientDays
Crude InfectionRate per 1,000Patient Days
(95% CI)
ST. LUKES HOSPITAL BETHLEHEM (11718)2014 30 8 51 11 27 1 83 16 88 3 318 150, 512 2.11 (1.89– 2.36)2013 36 14 61 16 19 0 88 8 78 8 328 137, 377 2.39 (2.14– 2.66)2012 39 21 11 49 26 0 81 14 66 7 314 134, 196 2.34 (2.09– 2.61)2011 38 10 75 41 36 1 105 9 104 6 425 142, 433 2.98 (2.71– 3.28)2010 54 9 56 59 49 3 91 18 89 4 432 146, 029 2.96 (2.69– 3.25)
ST. LUKES HOSPITAL- ANDERSON CAMPUS (21487)2014 2 0 12 0 3 0 10 0 9 0 36 22, 218 1.62 (1.13– 2.24)2013 0 0 5 0 2 0 8 4 3 0 22 20, 370 1.08 (0.68– 1.64)2012 6 0 9 1 2 0 4 4 8 0 34 16, 294 2.09 (1.45– 2.92)2011 . . . . . . . . . . . . .2010 . . . . . . . . . . . . .
ST. LUKES MINERS MEMORIAL HOSPITAL (11784)2014 0 0 1 0 0 1 4 1 2 0 9 7, 403 1.22 (0.56– 2.31)2013 0 0 2 0 0 0 3 0 1 0 6 7, 001 0.86 (0.31– 1.87)2012 1 0 1 0 1 0 5 2 1 0 11 7, 014 1.57 (0.78– 2.81)2011 0 0 0 0 0 0 2 0 3 0 5 6, 390 0.78 (0.25– 1.83)2010 0 1 4 0 0 0 2 0 2 0 9 6, 549 1.37 (0.63– 2.61)
ST. LUKES QUAKERTOWN HOSPITAL (11711)2014 0 0 1 0 0 0 3 2 2 0 8 13, 846 0.58 (0.25– 1.14)2013 1 1 0 0 0 0 8 0 3 0 13 14, 419 0.90 (0.48– 1.54)2012 2 1 1 0 3 0 5 0 4 0 16 14, 938 1.07 (0.61– 1.74)2011 0 0 4 0 2 0 7 1 3 0 17 15, 057 1.13 (0.66– 1.81)2010 0 0 5 0 2 0 9 2 5 0 23 14, 903 1.54 (0.98– 2.32)
ST. MARY MEDICAL CENTER (11885)2014 20 2 93 2 20 2 68 4 93 0 304 98, 939 3.07 (2.74– 3.44)2013 16 2 84 2 16 0 47 6 78 1 252 100, 245 2.51 (2.21– 2.84)2012 15 1 37 1 19 0 43 5 69 1 191 94, 985 2.01 (1.74– 2.32)2011 15 0 27 1 19 0 30 7 64 2 165 99, 643 1.66 (1.41– 1.93)2010 15 1 43 2 30 0 35 1 76 0 203 99, 895 2.03 (1.76– 2.33)
SUNBURY COMMUNITY HOSP (12105)2014 0 0 0 0 0 0 0 0 0 0 0 6, 350 0.00 (0.00– 0.58)2013 0 0 1 0 3 0 2 0 1 0 7 6, 541 1.07 (0.43– 2.20)2012 1 1 0 0 1 0 4 0 0 0 7 6, 518 1.07 (0.43– 2.21)2011 0 3 1 0 6 0 2 0 0 0 12 7, 897 1.52 (0.79– 2.65)2010 0 4 0 0 1 0 4 1 0 0 10 7, 978 1.25 (0.60– 2.31)
SURGICAL INSTITUTE OF READING (12535)2014 0 0 0 0 0 0 8 0 0 0 8 1, 693 4.73 (2.04– 9.31)2013 0 0 0 0 0 0 7 0 1 0 8 2, 015 3.97 (1.71– 7.82)2012 0 0 0 0 0 0 4 0 5 0 9 2, 585 3.48 (1.59– 6.61)2011 0 0 0 0 0 0 3 0 1 0 4 2, 646 1.51 (0.41– 3.87)2010 0 0 0 0 0 0 6 0 1 0 7 2, 962 2.36 (0.95– 4.87)
SURGICAL SPECIALTY CENTER AT COORDINATED HEALTH, THE (15259)2014 0 0 0 0 0 0 4 0 0 0 4 1, 955 2.05 (0.56– 5.24)2013 0 0 0 0 0 0 2 0 0 0 2 1, 941 1.03 (0.12– 3.72)2012 0 0 0 0 0 0 5 0 0 0 5 2, 052 2.44 (0.79– 5.69)2011 0 0 0 0 0 0 2 0 1 0 3 1, 913 1.57 (0.32– 4.58)2010 0 0 0 0 0 0 6 0 0 0 6 1, 611 3.72 (1.37– 8.11)
TEMPLE UNIVERSITY HOSPITAL (12382)2014 28 5 36 10 9 0 64 7 78 0 237 146, 564 1.62 (1.42– 1.84)2013 37 1 51 12 29 0 66 7 95 0 298 143, 434 2.08 (1.85– 2.33)2012 27 2 21 18 50 0 62 10 67 2 259 152, 814 1.69 (1.49– 1.91)2011 62 3 46 16 65 0 60 9 69 0 330 145, 364 2.27 (2.03– 2.53)2010 108 2 72 36 64 1 78 8 65 4 438 141, 832 3.09 (2.81– 3.39)
Continued on next page . . .
36
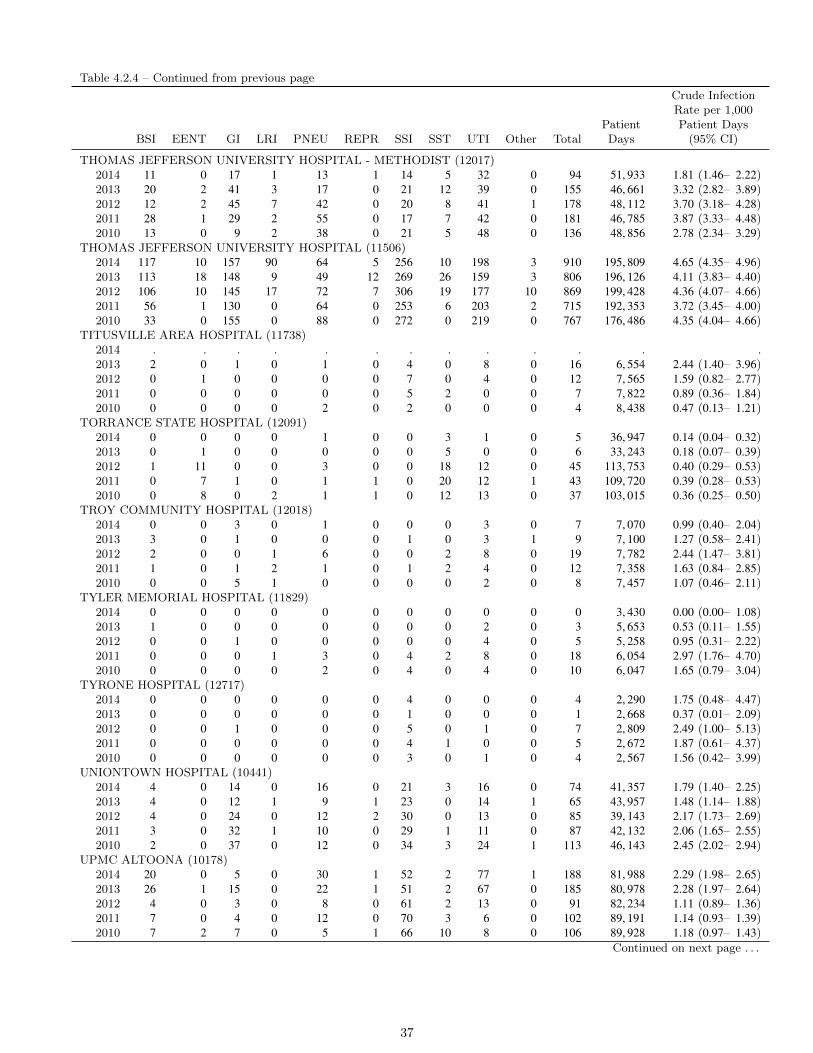
Table 4.2.4 – Continued from previous page
BSI EENT GI LRI PNEU REPR SSI SST UTI Other TotalPatientDays
Crude InfectionRate per 1,000Patient Days
(95% CI)
THOMAS JEFFERSON UNIVERSITY HOSPITAL - METHODIST (12017)2014 11 0 17 1 13 1 14 5 32 0 94 51, 933 1.81 (1.46– 2.22)2013 20 2 41 3 17 0 21 12 39 0 155 46, 661 3.32 (2.82– 3.89)2012 12 2 45 7 42 0 20 8 41 1 178 48, 112 3.70 (3.18– 4.28)2011 28 1 29 2 55 0 17 7 42 0 181 46, 785 3.87 (3.33– 4.48)2010 13 0 9 2 38 0 21 5 48 0 136 48, 856 2.78 (2.34– 3.29)
THOMAS JEFFERSON UNIVERSITY HOSPITAL (11506)2014 117 10 157 90 64 5 256 10 198 3 910 195, 809 4.65 (4.35– 4.96)2013 113 18 148 9 49 12 269 26 159 3 806 196, 126 4.11 (3.83– 4.40)2012 106 10 145 17 72 7 306 19 177 10 869 199, 428 4.36 (4.07– 4.66)2011 56 1 130 0 64 0 253 6 203 2 715 192, 353 3.72 (3.45– 4.00)2010 33 0 155 0 88 0 272 0 219 0 767 176, 486 4.35 (4.04– 4.66)
TITUSVILLE AREA HOSPITAL (11738)2014 . . . . . . . . . . . . .2013 2 0 1 0 1 0 4 0 8 0 16 6, 554 2.44 (1.40– 3.96)2012 0 1 0 0 0 0 7 0 4 0 12 7, 565 1.59 (0.82– 2.77)2011 0 0 0 0 0 0 5 2 0 0 7 7, 822 0.89 (0.36– 1.84)2010 0 0 0 0 2 0 2 0 0 0 4 8, 438 0.47 (0.13– 1.21)
TORRANCE STATE HOSPITAL (12091)2014 0 0 0 0 1 0 0 3 1 0 5 36, 947 0.14 (0.04– 0.32)2013 0 1 0 0 0 0 0 5 0 0 6 33, 243 0.18 (0.07– 0.39)2012 1 11 0 0 3 0 0 18 12 0 45 113, 753 0.40 (0.29– 0.53)2011 0 7 1 0 1 1 0 20 12 1 43 109, 720 0.39 (0.28– 0.53)2010 0 8 0 2 1 1 0 12 13 0 37 103, 015 0.36 (0.25– 0.50)
TROY COMMUNITY HOSPITAL (12018)2014 0 0 3 0 1 0 0 0 3 0 7 7, 070 0.99 (0.40– 2.04)2013 3 0 1 0 0 0 1 0 3 1 9 7, 100 1.27 (0.58– 2.41)2012 2 0 0 1 6 0 0 2 8 0 19 7, 782 2.44 (1.47– 3.81)2011 1 0 1 2 1 0 1 2 4 0 12 7, 358 1.63 (0.84– 2.85)2010 0 0 5 1 0 0 0 0 2 0 8 7, 457 1.07 (0.46– 2.11)
TYLER MEMORIAL HOSPITAL (11829)2014 0 0 0 0 0 0 0 0 0 0 0 3, 430 0.00 (0.00– 1.08)2013 1 0 0 0 0 0 0 0 2 0 3 5, 653 0.53 (0.11– 1.55)2012 0 0 1 0 0 0 0 0 4 0 5 5, 258 0.95 (0.31– 2.22)2011 0 0 0 1 3 0 4 2 8 0 18 6, 054 2.97 (1.76– 4.70)2010 0 0 0 0 2 0 4 0 4 0 10 6, 047 1.65 (0.79– 3.04)
TYRONE HOSPITAL (12717)2014 0 0 0 0 0 0 4 0 0 0 4 2, 290 1.75 (0.48– 4.47)2013 0 0 0 0 0 0 1 0 0 0 1 2, 668 0.37 (0.01– 2.09)2012 0 0 1 0 0 0 5 0 1 0 7 2, 809 2.49 (1.00– 5.13)2011 0 0 0 0 0 0 4 1 0 0 5 2, 672 1.87 (0.61– 4.37)2010 0 0 0 0 0 0 3 0 1 0 4 2, 567 1.56 (0.42– 3.99)
UNIONTOWN HOSPITAL (10441)2014 4 0 14 0 16 0 21 3 16 0 74 41, 357 1.79 (1.40– 2.25)2013 4 0 12 1 9 1 23 0 14 1 65 43, 957 1.48 (1.14– 1.88)2012 4 0 24 0 12 2 30 0 13 0 85 39, 143 2.17 (1.73– 2.69)2011 3 0 32 1 10 0 29 1 11 0 87 42, 132 2.06 (1.65– 2.55)2010 2 0 37 0 12 0 34 3 24 1 113 46, 143 2.45 (2.02– 2.94)
UPMC ALTOONA (10178)2014 20 0 5 0 30 1 52 2 77 1 188 81, 988 2.29 (1.98– 2.65)2013 26 1 15 0 22 1 51 2 67 0 185 80, 978 2.28 (1.97– 2.64)2012 4 0 3 0 8 0 61 2 13 0 91 82, 234 1.11 (0.89– 1.36)2011 7 0 4 0 12 0 70 3 6 0 102 89, 191 1.14 (0.93– 1.39)2010 7 2 7 0 5 1 66 10 8 0 106 89, 928 1.18 (0.97– 1.43)
Continued on next page . . .
37
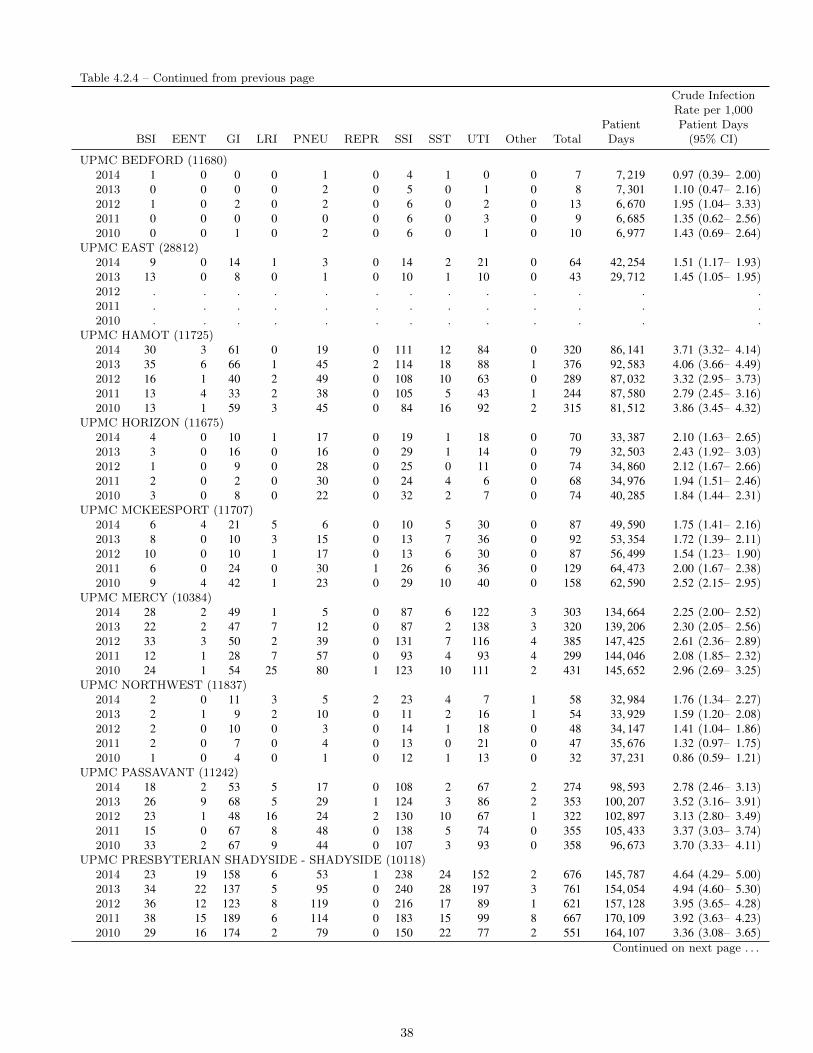
Table 4.2.4 – Continued from previous page
BSI EENT GI LRI PNEU REPR SSI SST UTI Other TotalPatientDays
Crude InfectionRate per 1,000Patient Days
(95% CI)
UPMC BEDFORD (11680)2014 1 0 0 0 1 0 4 1 0 0 7 7, 219 0.97 (0.39– 2.00)2013 0 0 0 0 2 0 5 0 1 0 8 7, 301 1.10 (0.47– 2.16)2012 1 0 2 0 2 0 6 0 2 0 13 6, 670 1.95 (1.04– 3.33)2011 0 0 0 0 0 0 6 0 3 0 9 6, 685 1.35 (0.62– 2.56)2010 0 0 1 0 2 0 6 0 1 0 10 6, 977 1.43 (0.69– 2.64)
UPMC EAST (28812)2014 9 0 14 1 3 0 14 2 21 0 64 42, 254 1.51 (1.17– 1.93)2013 13 0 8 0 1 0 10 1 10 0 43 29, 712 1.45 (1.05– 1.95)2012 . . . . . . . . . . . . .2011 . . . . . . . . . . . . .2010 . . . . . . . . . . . . .
UPMC HAMOT (11725)2014 30 3 61 0 19 0 111 12 84 0 320 86, 141 3.71 (3.32– 4.14)2013 35 6 66 1 45 2 114 18 88 1 376 92, 583 4.06 (3.66– 4.49)2012 16 1 40 2 49 0 108 10 63 0 289 87, 032 3.32 (2.95– 3.73)2011 13 4 33 2 38 0 105 5 43 1 244 87, 580 2.79 (2.45– 3.16)2010 13 1 59 3 45 0 84 16 92 2 315 81, 512 3.86 (3.45– 4.32)
UPMC HORIZON (11675)2014 4 0 10 1 17 0 19 1 18 0 70 33, 387 2.10 (1.63– 2.65)2013 3 0 16 0 16 0 29 1 14 0 79 32, 503 2.43 (1.92– 3.03)2012 1 0 9 0 28 0 25 0 11 0 74 34, 860 2.12 (1.67– 2.66)2011 2 0 2 0 30 0 24 4 6 0 68 34, 976 1.94 (1.51– 2.46)2010 3 0 8 0 22 0 32 2 7 0 74 40, 285 1.84 (1.44– 2.31)
UPMC MCKEESPORT (11707)2014 6 4 21 5 6 0 10 5 30 0 87 49, 590 1.75 (1.41– 2.16)2013 8 0 10 3 15 0 13 7 36 0 92 53, 354 1.72 (1.39– 2.11)2012 10 0 10 1 17 0 13 6 30 0 87 56, 499 1.54 (1.23– 1.90)2011 6 0 24 0 30 1 26 6 36 0 129 64, 473 2.00 (1.67– 2.38)2010 9 4 42 1 23 0 29 10 40 0 158 62, 590 2.52 (2.15– 2.95)
UPMC MERCY (10384)2014 28 2 49 1 5 0 87 6 122 3 303 134, 664 2.25 (2.00– 2.52)2013 22 2 47 7 12 0 87 2 138 3 320 139, 206 2.30 (2.05– 2.56)2012 33 3 50 2 39 0 131 7 116 4 385 147, 425 2.61 (2.36– 2.89)2011 12 1 28 7 57 0 93 4 93 4 299 144, 046 2.08 (1.85– 2.32)2010 24 1 54 25 80 1 123 10 111 2 431 145, 652 2.96 (2.69– 3.25)
UPMC NORTHWEST (11837)2014 2 0 11 3 5 2 23 4 7 1 58 32, 984 1.76 (1.34– 2.27)2013 2 1 9 2 10 0 11 2 16 1 54 33, 929 1.59 (1.20– 2.08)2012 2 0 10 0 3 0 14 1 18 0 48 34, 147 1.41 (1.04– 1.86)2011 2 0 7 0 4 0 13 0 21 0 47 35, 676 1.32 (0.97– 1.75)2010 1 0 4 0 1 0 12 1 13 0 32 37, 231 0.86 (0.59– 1.21)
UPMC PASSAVANT (11242)2014 18 2 53 5 17 0 108 2 67 2 274 98, 593 2.78 (2.46– 3.13)2013 26 9 68 5 29 1 124 3 86 2 353 100, 207 3.52 (3.16– 3.91)2012 23 1 48 16 24 2 130 10 67 1 322 102, 897 3.13 (2.80– 3.49)2011 15 0 67 8 48 0 138 5 74 0 355 105, 433 3.37 (3.03– 3.74)2010 33 2 67 9 44 0 107 3 93 0 358 96, 673 3.70 (3.33– 4.11)
UPMC PRESBYTERIAN SHADYSIDE - SHADYSIDE (10118)2014 23 19 158 6 53 1 238 24 152 2 676 145, 787 4.64 (4.29– 5.00)2013 34 22 137 5 95 0 240 28 197 3 761 154, 054 4.94 (4.60– 5.30)2012 36 12 123 8 119 0 216 17 89 1 621 157, 128 3.95 (3.65– 4.28)2011 38 15 189 6 114 0 183 15 99 8 667 170, 109 3.92 (3.63– 4.23)2010 29 16 174 2 79 0 150 22 77 2 551 164, 107 3.36 (3.08– 3.65)
Continued on next page . . .
38

Table 4.2.4 – Continued from previous page
BSI EENT GI LRI PNEU REPR SSI SST UTI Other TotalPatientDays
Crude InfectionRate per 1,000Patient Days
(95% CI)
UPMC PRESBYTERIAN SHADYSIDE (10348)2014 99 16 197 25 98 0 318 40 411 13 1, 217 216, 611 5.62 (5.31– 5.94)2013 94 8 192 23 91 0 278 37 436 30 1, 189 221, 480 5.37 (5.07– 5.68)2012 111 8 116 21 148 0 264 14 308 15 1, 005 227, 985 4.41 (4.14– 4.69)2011 95 13 150 27 198 0 315 17 193 13 1, 021 224, 769 4.54 (4.27– 4.83)2010 96 10 184 24 161 0 283 17 202 8 985 222, 461 4.43 (4.16– 4.71)
UPMC ST. MARGARET (11561)2014 17 0 36 3 17 0 48 5 64 0 190 70, 654 2.69 (2.32– 3.10)2013 10 0 27 1 7 0 60 2 53 0 160 69, 846 2.29 (1.95– 2.67)2012 10 2 32 0 13 0 46 2 43 0 148 75, 976 1.95 (1.65– 2.29)2011 12 1 19 1 23 0 59 3 25 0 143 79, 022 1.81 (1.53– 2.13)2010 10 1 24 0 26 0 51 2 35 1 150 76, 041 1.97 (1.67– 2.31)
VALLEY FORGE MEDICAL CENTER AND HOSPITAL (12029)2014 0 0 0 0 0 0 0 0 0 0 0 15, 363 0.00 (0.00– 0.24)2013 0 0 0 0 0 0 0 0 0 0 0 16, 356 0.00 (0.00– 0.23)2012 0 0 0 0 0 0 0 0 0 0 0 16, 874 0.00 (0.00– 0.22)2011 0 0 0 0 0 0 0 0 0 0 0 17, 024 0.00 (0.00– 0.22)2010 0 0 0 0 0 0 0 0 0 0 0 16, 659 0.00 (0.00– 0.22)
WARREN GENERAL HOSPITAL (12216)2014 0 0 4 0 2 0 10 0 3 0 19 14, 525 1.31 (0.79– 2.04)2013 0 0 7 0 0 0 7 0 6 0 20 15, 355 1.30 (0.80– 2.01)2012 2 0 3 0 0 1 11 1 2 2 22 13, 257 1.66 (1.04– 2.51)2011 2 0 8 0 4 0 8 0 2 0 24 13, 033 1.84 (1.18– 2.74)2010 0 0 2 0 2 0 7 1 7 0 19 11, 870 1.60 (0.96– 2.50)
WARREN STATE HOSPITAL (12081)2014 0 0 0 0 0 0 0 0 0 0 0 61, 676 0.00 (0.00– 0.06)2013 0 0 0 0 0 0 0 0 0 0 0 66, 410 0.00 (0.00– 0.06)2012 0 0 0 0 0 0 0 0 0 0 0 42, 705 0.00 (0.00– 0.09)2011 0 0 0 0 0 0 0 0 0 0 0 5, 042 0.00 (0.00– 0.73)2010 0 0 0 0 0 0 0 0 0 0 0 65, 960 0.00 (0.00– 0.06)
WASHINGTON HOSPITAL, THE (11460)2014 1 0 29 0 10 0 22 1 30 0 93 52, 992 1.75 (1.42– 2.15)2013 1 1 30 0 14 0 29 2 26 0 103 54, 165 1.90 (1.55– 2.31)2012 4 1 23 0 8 0 36 1 16 0 89 54, 486 1.63 (1.31– 2.01)2011 3 0 22 1 21 0 31 0 28 0 106 62, 228 1.70 (1.39– 2.06)2010 0 0 27 0 23 0 37 1 24 0 112 65, 063 1.72 (1.42– 2.07)
WAYNE MEMORIAL HOSPITAL (12004)2014 1 2 5 0 7 0 15 0 6 0 36 16, 887 2.13 (1.49– 2.95)2013 2 2 5 0 7 2 21 0 5 0 44 16, 857 2.61 (1.90– 3.50)2012 4 2 6 0 9 1 19 1 11 0 53 18, 519 2.86 (2.14– 3.74)2011 1 1 3 0 11 0 13 0 5 0 34 15, 942 2.13 (1.48– 2.98)2010 0 0 3 0 6 1 6 1 8 0 25 18, 141 1.38 (0.89– 2.03)
WAYNESBORO HOSPITAL (11642)2014 1 1 1 2 2 0 6 0 1 0 14 8, 868 1.58 (0.86– 2.65)2013 3 0 1 0 12 0 9 0 1 0 26 9, 414 2.76 (1.80– 4.05)2012 0 0 0 0 14 0 6 0 2 0 22 9, 841 2.24 (1.40– 3.38)2011 0 0 0 0 2 0 1 0 1 0 4 9, 729 0.41 (0.11– 1.05)2010 0 0 3 0 7 1 5 0 4 0 20 9, 970 2.01 (1.23– 3.10)
WELLSPAN SURGERY AND REHABILITATION HOSPITAL (27430)2014 1 0 5 0 3 0 8 3 26 0 46 16, 960 2.71 (1.99– 3.62)2013 1 0 7 1 3 0 14 1 20 1 48 15, 195 3.16 (2.33– 4.19)2012 . . . . . . . . . . . . .2011 . . . . . . . . . . . . .2010 . . . . . . . . . . . . .
Continued on next page . . .
39

Table 4.2.4 – Continued from previous page
BSI EENT GI LRI PNEU REPR SSI SST UTI Other TotalPatientDays
Crude InfectionRate per 1,000Patient Days
(95% CI)
WERNERSVILLE STATE HOSPITAL (12368)2014 0 0 0 0 0 0 0 0 0 0 0 94, 320 0.00 (0.00– 0.04)2013 0 3 0 0 0 0 0 2 1 0 6 94, 600 0.06 (0.02– 0.14)2012 0 15 1 0 0 0 0 25 8 0 49 97, 099 0.50 (0.37– 0.67)2011 0 12 1 0 0 0 0 15 8 0 36 97, 823 0.37 (0.26– 0.51)2010 0 10 0 0 0 0 0 13 14 0 37 89, 641 0.41 (0.29– 0.57)
WEST PENN HOSPITAL (11864)2014 16 4 23 11 18 0 39 3 27 2 143 62, 189 2.30 (1.94– 2.71)2013 19 2 26 15 9 0 39 8 27 0 145 57, 409 2.53 (2.13– 2.97)2012 31 4 32 10 14 0 31 2 19 0 143 53, 366 2.68 (2.26– 3.16)2011 32 1 24 11 1 0 17 1 10 0 97 41, 736 2.32 (1.88– 2.84)2010 65 9 65 20 26 0 57 2 33 1 278 88, 109 3.16 (2.80– 3.55)
WESTERN PSYCHIATRIC INSTITUTE AND CLINIC (13702)2014 1 8 6 1 1 0 0 7 21 0 45 97, 915 0.46 (0.34– 0.61)2013 1 6 6 0 1 0 0 1 14 0 29 103, 422 0.28 (0.19– 0.40)2012 2 23 2 0 1 0 0 3 10 0 41 104, 169 0.39 (0.28– 0.53)2011 3 14 3 0 3 0 0 5 20 0 48 102, 650 0.47 (0.34– 0.62)2010 1 1 2 0 2 0 0 2 17 0 25 102, 693 0.24 (0.16– 0.36)
WILKES-BARRE GENERAL HOSPITAL (11916)2014 21 5 27 2 22 0 47 4 41 0 169 82, 084 2.06 (1.76– 2.39)2013 24 9 20 5 23 2 63 6 83 0 235 83, 844 2.80 (2.46– 3.19)2012 16 4 40 7 24 1 79 3 64 0 238 88, 283 2.70 (2.36– 3.06)2011 32 3 25 5 37 2 56 5 67 3 235 84, 294 2.79 (2.44– 3.17)2010 29 3 21 5 46 0 80 4 81 3 272 82, 205 3.31 (2.93– 3.73)
WILLIAMSPORT REGIONAL MEDICAL CENTER (11732)2014 11 35 21 0 8 0 21 13 18 3 130 53, 831 2.41 (2.02– 2.87)2013 13 66 36 0 17 1 44 7 32 0 216 57, 713 3.74 (3.26– 4.28)2012 5 39 20 2 9 3 42 5 45 0 170 53, 152 3.20 (2.74– 3.72)2011 7 10 21 4 15 1 47 9 48 2 164 54, 085 3.03 (2.59– 3.53)2010 9 0 18 6 6 4 43 9 29 0 124 49, 673 2.50 (2.08– 2.98)
WILLS EYE HOSPITAL (34846)2014 0 0 0 0 0 0 0 0 0 0 0 170 0.00 (0.00–21.70)2013 . . . . . . . . . . . . .2012 . . . . . . . . . . . . .2011 . . . . . . . . . . . . .2010 . . . . . . . . . . . . .
WINDBER HOSPITAL (12031)2014 0 0 0 0 0 0 4 0 3 0 7 5, 609 1.25 (0.50– 2.57)2013 0 0 0 0 0 0 5 0 3 0 8 6, 417 1.25 (0.54– 2.46)2012 0 0 0 0 1 0 9 0 6 0 16 7, 704 2.08 (1.19– 3.37)2011 0 0 0 0 1 0 6 0 2 0 9 7, 878 1.14 (0.52– 2.17)2010 1 0 0 0 1 0 8 0 2 0 12 8, 114 1.48 (0.76– 2.58)
YORK HOSPITAL (10108)2014 19 10 102 59 65 0 165 36 127 6 589 167, 963 3.51 (3.23– 3.80)2013 33 9 86 81 42 2 115 17 108 8 501 162, 441 3.08 (2.82– 3.37)2012 23 11 78 55 61 3 128 13 101 4 477 162, 496 2.94 (2.68– 3.21)2011 17 7 89 30 85 8 147 19 112 5 519 175, 653 2.95 (2.71– 3.22)2010 26 5 94 18 87 7 145 8 102 1 493 167, 442 2.94 (2.69– 3.22)
40

4.3 Catheter-Associated Urinary Tract Infections (CAUTIs)
4.3.1 CAUTIs — Statewide Summary
In 2014, urinary tract infections constitute the second most commonly reported category of HAIs in Pennsylvania,with 5,901 (26.17 percent; see Table 4.2.2) occurences. Almost half (2,725 or 46.18 percent) of the UTIs wereassociated with the use of urinary catheters, which are one of the more commonly used medical devices in hospitalsettings. In 2014, a total of 1,500,982 urinary catheter days (Table 4.3.1) were reported by 222 Pennsylvania hospitals(urinary catheter days ranged from a low of one for the year to a high of 65,367 among the 222 hospitals). Thenumber of hospitals that reported using urinary catheters in 2014 represents 89.88 percent of the 247 hospitals thatreported data through NHSN. The 25 with no reported use of urinary catheters are mostly psychiatric or drug andalcohol rehabilitation facilities and can be found in Table 4.3.6.
Table 4.3.1: Summary of Catheter-Associated Urinary Tract Infections — Pennsylvania, 2009–2014
Numberof
CAUTI
UrinaryCatheter
Days
Rateper 1,000
Catheter Days(95%CI)
PercentChange in Rate
Prior Year(Since 2009)
PatientDays
DeviceUtilization
Ratio(DUR)
PercentChange in DUR
Prior Year(Since 2009)
2009 3, 935 1, 995, 114 1.97 (1.91–2.03) . 10, 402, 161 0.19 .2010 3, 245 1, 894, 709 1.71 (1.65–1.77) − 13.16 ( − 13.16) 10, 289, 079 0.18 − 3.99 ( − 3.99)2011 2, 819 1, 820, 899 1.55 (1.49–1.61) − 9.61 ( − 21.51) 10, 212, 208 0.18 − 3.17 ( − 7.03)2012 2, 870 1, 682, 014 1.71 (1.64–1.77) 10.22 ( − 13.49) 10, 033, 090 0.17 − 5.98 ( − 12.59)2013 3, 111 1, 636, 227 1.90 (1.84–1.97) 11.43 ( − 3.60) 9, 845, 909 0.17 − 0.87 ( − 13.35)2014 2, 725 1, 500, 982 1.82 (1.75–1.88) − 4.52 ( − 7.95) 9, 757, 224 0.15 − 7.43 ( − 19.79)
The number of urinary catheter days (1,500,982), divided by the total number of patient days (9,757,224) reportedin 2014 produces a device utilization ratio (DUR) of 0.15, meaning that a urinary catheter was used 15.38 percent ofthe time in Pennsylvania’s hospitalized patients (Table 4.3.1). As expected, urinary catheter use is highest in criticalcare units where the sickest patients are receiving care. Catheter use was highest in surgical intensive care units(70.14 percent of the time), in surgical trauma intensive care units (67.10 percent of the time) and in cardiothoraciccritical care units (63.83 percent of the time).
Among the 222 hospitals that reported any use of urinary catheters, 169 (76.1 percent) of them reported at leastone CAUTI while the other 53 (23.9 percent) reported no identified CAUTIs. Pennsylvania’s CAUTI rate for 2014was 1.82 CAUTIs per 1,000 urinary catheter days (Table 4.3.1). This is a decrease of 4.52 percent compared to lastyear’s rate of 1.90 CAUTIs per 1,000 urinary catheter days and is a 7.95 percent decrease from the baseline rate of1.97 CAUTIs per 1,000 catheter days reported in 2009. Overall, the rate reductions since 2009 translate to 2,063fewer CAUTIs than would have otherwise occurred if the 2009 rate persisted into 2014. This likely under estimatesthe true impact of prevention efforts because urinary catheter use (DUR) has also decreased a total of 19.79 percentsince 2009 (Table 4.3.1).
4.3.2 CAUTIs — By Unit Type
The risk of a CAUTI varies substantially in the different areas of a hospital (Table 4.3.2). In 2014, CAUTI rates (per1,000 catheter days) were highest in intensive care burn units (cc:Burn: 4.29), surgical intensive care units (cc:Surgery:3.64) and trauma intensive care units (cc:Trauma: 3.59). Among locations with at least 1,000 urinary catheter days,NICU (NICU: 0), labor and delivery and post-partum units (w:LD pp: 0.098) and pediatric medical/surgical units(w:Ped ms: 0.51) reported the lowest CAUTI rates per 1,000 urinary catheter days (Table 4.3.2).
41

Table 4.3.2: Catheter-Associated Urinary Tract Infections (CAUTI), Infection Rates per 1,000 Patient Days and Device Uti-lization Rates (DUR) by Location within Facility—Pennsylvania, 2009–2014
Number ofCAUTI
UrinaryCatheter Days
Rateper 1,000
Catheter Days Patient Days
Device UtilizationRatio — DUR
(Cath. Days / Pt. Days)
NICU2014 0 2, 652 0.00 275, 572 0.012013 2 2, 343 0.85 268, 868 0.012012 0 3, 542 0.00 270, 917 0.012011 3 . . 271, 973 .2010 4 . . 269, 940 .2009 2 . . 269, 141 .
SCA2014 37 20, 366 1.82 206, 506 0.102013 49 20, 719 2.36 207, 810 0.102012 58 25, 180 2.30 214, 677 0.122011 68 26, 848 2.53 213, 907 0.132010 52 28, 651 1.81 211, 508 0.142009 72 30, 258 2.38 193, 468 0.16
Step2014 205 114, 606 1.79 612, 059 0.192013 212 126, 032 1.68 613, 261 0.212012 192 120, 565 1.59 568, 933 0.212011 208 132, 154 1.57 598, 034 0.222010 245 141, 233 1.73 634, 482 0.222009 254 136, 803 1.86 616, 096 0.22
LTAC2014 155 72, 696 2.13 216, 711 0.342013 239 100, 595 2.38 251, 711 0.402012 233 107, 120 2.18 256, 287 0.422011 285 121, 637 2.34 271, 324 0.452010 315 132, 646 2.37 291, 486 0.462009 327 139, 236 2.35 299, 105 0.47
cc:Burn2014 19 4, 425 4.29 12, 671 0.352013 13 4, 712 2.76 13, 088 0.362012 15 4, 115 3.65 12, 251 0.342011 6 4, 465 1.34 11, 135 0.402010 8 4, 828 1.66 12, 225 0.392009 11 5, 698 1.93 12, 389 0.46
cc:CT2014 124 60, 057 2.06 94, 088 0.642013 129 60, 820 2.12 91, 830 0.662012 76 58, 742 1.29 88, 143 0.672011 95 66, 597 1.43 97, 189 0.692010 112 68, 294 1.64 100, 018 0.682009 114 69, 772 1.63 102, 092 0.68
cc:MS2014 487 266, 777 1.83 440, 304 0.612013 527 285, 719 1.84 463, 063 0.622012 434 278, 507 1.56 444, 683 0.632011 410 289, 168 1.42 447, 121 0.652010 403 287, 004 1.40 439, 955 0.652009 452 287, 116 1.57 435, 264 0.66
Continued on next page . . .
42

Table 4.3.2 – Continued from previous page
Number ofCAUTI
UrinaryCatheter Days
Rateper 1,000
Catheter Days Patient Days
Device UtilizationRatio
(Cath. Days / Pt. Days)
cc:Med2014 218 72, 237 3.02 124, 738 0.582013 216 78, 199 2.76 125, 925 0.622012 148 80, 301 1.84 127, 491 0.632011 100 88, 633 1.13 144, 364 0.612010 136 85, 991 1.58 140, 201 0.612009 161 89, 833 1.79 143, 532 0.63
cc:Peds2014 19 12, 272 1.55 61, 738 0.202013 25 12, 515 2.00 62, 108 0.202012 21 11, 447 1.83 58, 071 0.202011 23 10, 992 2.09 57, 395 0.192010 32 11, 788 2.71 55, 559 0.212009 20 13, 549 1.48 55, 775 0.24
cc:SpecMed2014 90 33, 306 2.70 76, 244 0.442013 98 34, 341 2.85 74, 545 0.462012 96 41, 254 2.33 101, 137 0.412011 73 43, 044 1.70 106, 767 0.402010 114 58, 292 1.96 126, 836 0.462009 162 63, 960 2.53 134, 101 0.48
cc:Surgery2014 254 69, 771 3.64 99, 475 0.702013 276 74, 180 3.72 102, 849 0.722012 237 85, 574 2.77 118, 824 0.722011 214 89, 318 2.40 123, 348 0.722010 208 85, 408 2.44 113, 392 0.752009 324 90, 406 3.58 114, 173 0.79
cc:Trauma2014 123 34, 233 3.59 51, 018 0.672013 131 36, 889 3.55 50, 959 0.722012 94 38, 971 2.41 53, 226 0.732011 68 41, 299 1.65 54, 962 0.752010 61 42, 997 1.42 54, 220 0.792009 124 42, 128 2.94 51, 572 0.82
w:Behavior2014 5 2, 540 1.97 1, 694, 136 0.002013 6 3, 295 1.82 1, 626, 139 0.002012 8 5, 742 1.39 1, 735, 712 0.002011 8 3, 940 2.03 1, 614, 797 0.002010 10 5, 237 1.91 1, 678, 564 0.002009 7 4, 343 1.61 1, 579, 712 0.00
w:LD pp2014 4 40, 687 0.10 374, 919 0.112013 5 42, 853 0.12 372, 699 0.112012 29 44, 400 0.65 372, 423 0.122011 22 47, 479 0.46 382, 131 0.122010 33 53, 289 0.62 382, 546 0.142009 39 54, 282 0.72 399, 601 0.14
Continued on next page . . .
43
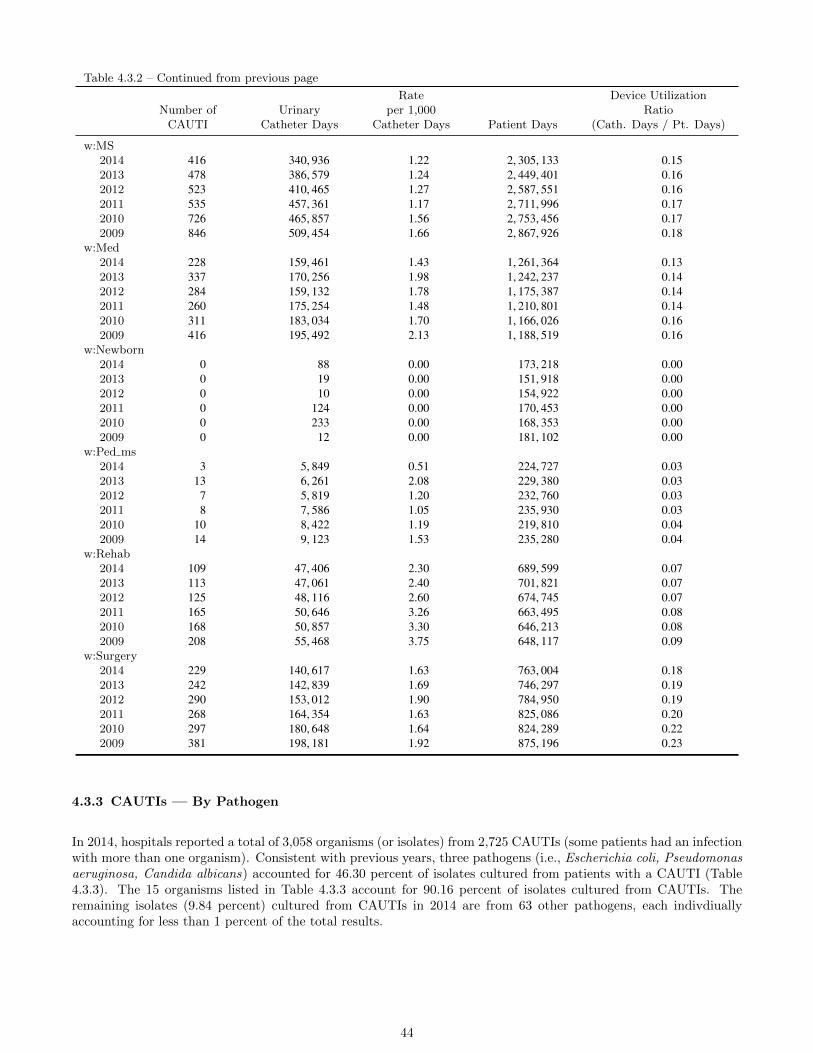
Table 4.3.2 – Continued from previous page
Number ofCAUTI
UrinaryCatheter Days
Rateper 1,000
Catheter Days Patient Days
Device UtilizationRatio
(Cath. Days / Pt. Days)
w:MS2014 416 340, 936 1.22 2, 305, 133 0.152013 478 386, 579 1.24 2, 449, 401 0.162012 523 410, 465 1.27 2, 587, 551 0.162011 535 457, 361 1.17 2, 711, 996 0.172010 726 465, 857 1.56 2, 753, 456 0.172009 846 509, 454 1.66 2, 867, 926 0.18
w:Med2014 228 159, 461 1.43 1, 261, 364 0.132013 337 170, 256 1.98 1, 242, 237 0.142012 284 159, 132 1.78 1, 175, 387 0.142011 260 175, 254 1.48 1, 210, 801 0.142010 311 183, 034 1.70 1, 166, 026 0.162009 416 195, 492 2.13 1, 188, 519 0.16
w:Newborn2014 0 88 0.00 173, 218 0.002013 0 19 0.00 151, 918 0.002012 0 10 0.00 154, 922 0.002011 0 124 0.00 170, 453 0.002010 0 233 0.00 168, 353 0.002009 0 12 0.00 181, 102 0.00
w:Ped ms2014 3 5, 849 0.51 224, 727 0.032013 13 6, 261 2.08 229, 380 0.032012 7 5, 819 1.20 232, 760 0.032011 8 7, 586 1.05 235, 930 0.032010 10 8, 422 1.19 219, 810 0.042009 14 9, 123 1.53 235, 280 0.04
w:Rehab2014 109 47, 406 2.30 689, 599 0.072013 113 47, 061 2.40 701, 821 0.072012 125 48, 116 2.60 674, 745 0.072011 165 50, 646 3.26 663, 495 0.082010 168 50, 857 3.30 646, 213 0.082009 208 55, 468 3.75 648, 117 0.09
w:Surgery2014 229 140, 617 1.63 763, 004 0.182013 242 142, 839 1.69 746, 297 0.192012 290 153, 012 1.90 784, 950 0.192011 268 164, 354 1.63 825, 086 0.202010 297 180, 648 1.64 824, 289 0.222009 381 198, 181 1.92 875, 196 0.23
4.3.3 CAUTIs — By Pathogen
In 2014, hospitals reported a total of 3,058 organisms (or isolates) from 2,725 CAUTIs (some patients had an infectionwith more than one organism). Consistent with previous years, three pathogens (i.e., Escherichia coli, Pseudomonasaeruginosa, Candida albicans) accounted for 46.30 percent of isolates cultured from patients with a CAUTI (Table4.3.3). The 15 organisms listed in Table 4.3.3 account for 90.16 percent of isolates cultured from CAUTIs. Theremaining isolates (9.84 percent) cultured from CAUTIs in 2014 are from 63 other pathogens, each indivdiuallyaccounting for less than 1 percent of the total results.
44
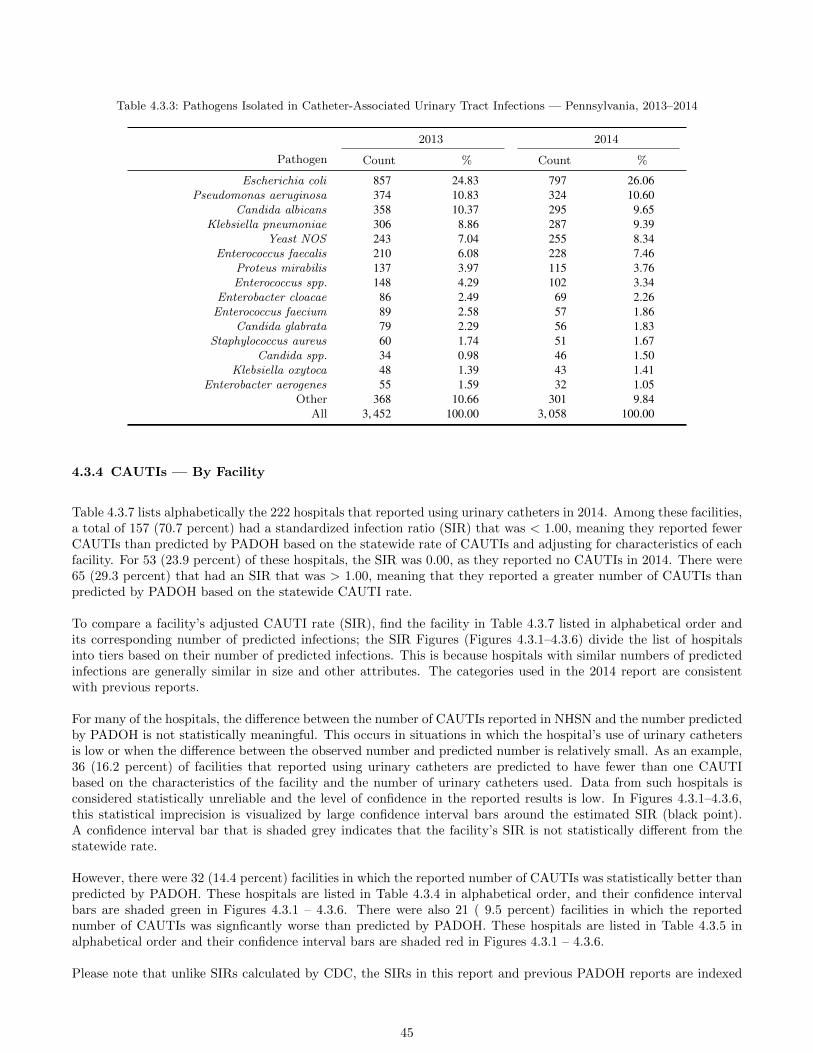
Table 4.3.3: Pathogens Isolated in Catheter-Associated Urinary Tract Infections — Pennsylvania, 2013–2014
2013 2014
Pathogen Count % Count %
Escherichia coli 857 24.83 797 26.06Pseudomonas aeruginosa 374 10.83 324 10.60
Candida albicans 358 10.37 295 9.65Klebsiella pneumoniae 306 8.86 287 9.39
Yeast NOS 243 7.04 255 8.34Enterococcus faecalis 210 6.08 228 7.46
Proteus mirabilis 137 3.97 115 3.76Enterococcus spp. 148 4.29 102 3.34
Enterobacter cloacae 86 2.49 69 2.26Enterococcus faecium 89 2.58 57 1.86
Candida glabrata 79 2.29 56 1.83Staphylococcus aureus 60 1.74 51 1.67
Candida spp. 34 0.98 46 1.50Klebsiella oxytoca 48 1.39 43 1.41
Enterobacter aerogenes 55 1.59 32 1.05Other 368 10.66 301 9.84
All 3, 452 100.00 3, 058 100.00
4.3.4 CAUTIs — By Facility
Table 4.3.7 lists alphabetically the 222 hospitals that reported using urinary catheters in 2014. Among these facilities,a total of 157 (70.7 percent) had a standardized infection ratio (SIR) that was < 1.00, meaning they reported fewerCAUTIs than predicted by PADOH based on the statewide rate of CAUTIs and adjusting for characteristics of eachfacility. For 53 (23.9 percent) of these hospitals, the SIR was 0.00, as they reported no CAUTIs in 2014. There were65 (29.3 percent) that had an SIR that was > 1.00, meaning that they reported a greater number of CAUTIs thanpredicted by PADOH based on the statewide CAUTI rate.
To compare a facility’s adjusted CAUTI rate (SIR), find the facility in Table 4.3.7 listed in alphabetical order andits corresponding number of predicted infections; the SIR Figures (Figures 4.3.1–4.3.6) divide the list of hospitalsinto tiers based on their number of predicted infections. This is because hospitals with similar numbers of predictedinfections are generally similar in size and other attributes. The categories used in the 2014 report are consistentwith previous reports.
For many of the hospitals, the difference between the number of CAUTIs reported in NHSN and the number predictedby PADOH is not statistically meaningful. This occurs in situations in which the hospital’s use of urinary cathetersis low or when the difference between the observed number and predicted number is relatively small. As an example,36 (16.2 percent) of facilities that reported using urinary catheters are predicted to have fewer than one CAUTIbased on the characteristics of the facility and the number of urinary catheters used. Data from such hospitals isconsidered statistically unreliable and the level of confidence in the reported results is low. In Figures 4.3.1–4.3.6,this statistical imprecision is visualized by large confidence interval bars around the estimated SIR (black point).A confidence interval bar that is shaded grey indicates that the facility’s SIR is not statistically different from thestatewide rate.
However, there were 32 (14.4 percent) facilities in which the reported number of CAUTIs was statistically better thanpredicted by PADOH. These hospitals are listed in Table 4.3.4 in alphabetical order, and their confidence intervalbars are shaded green in Figures 4.3.1 – 4.3.6. There were also 21 ( 9.5 percent) facilities in which the reportednumber of CAUTIs was signficantly worse than predicted by PADOH. These hospitals are listed in Table 4.3.5 inalphabetical order and their confidence interval bars are shaded red in Figures 4.3.1 – 4.3.6.
Please note that unlike SIRs calculated by CDC, the SIRs in this report and previous PADOH reports are indexed
45

relative to the performance of facilities with similar attributes for the same year. Therefore, a facility’s crude CAUTIrate (number of infections per 1,000 catheter days) may improve from year-to-year, but the improvement might notbe reflected in the facility’s SIR if the facility’s improvement is consistent with improvements made statewide overthe same period. SIRs should only be used to compare facility performance to other facilities in the state during thesame reporting period. Furthermore, SIRs calculated by PADOH should not be compared to national SIRs or ratiosreported from other states. For these reasons, crude rates should be used for trend analyses as reported in Tables4.2.4 and 4.3.7,
46
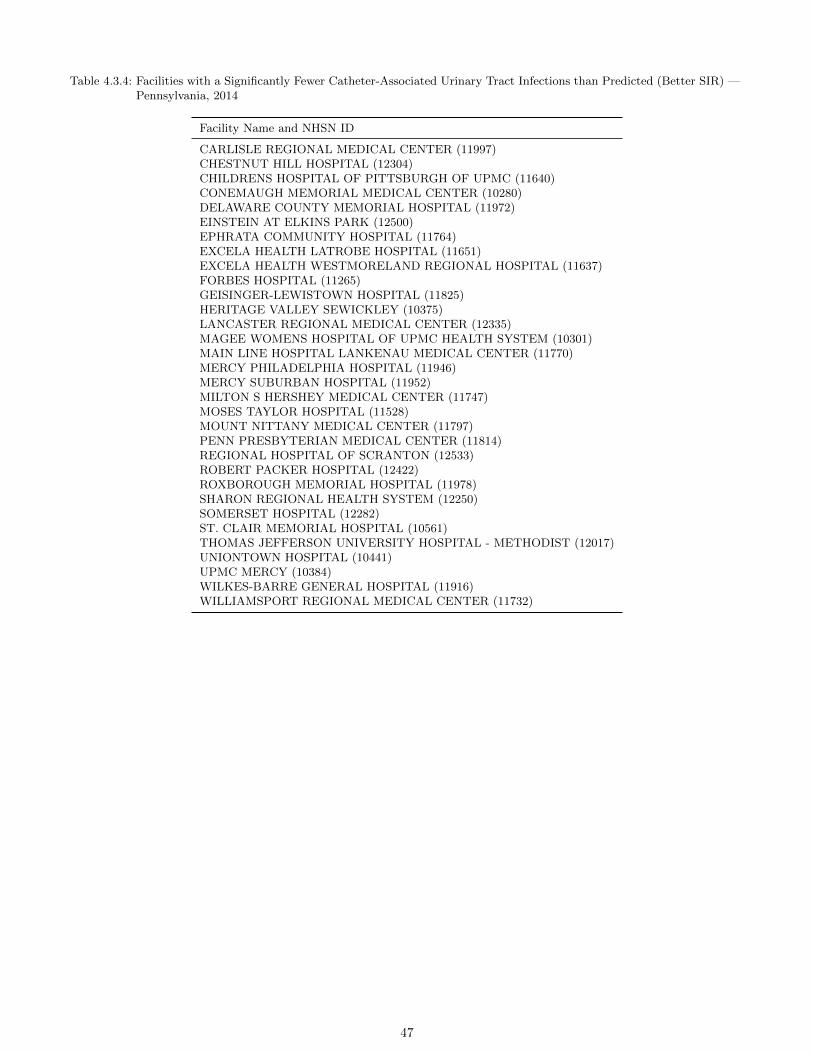
Table 4.3.4: Facilities with a Significantly Fewer Catheter-Associated Urinary Tract Infections than Predicted (Better SIR) —Pennsylvania, 2014
Facility Name and NHSN ID
CARLISLE REGIONAL MEDICAL CENTER (11997)CHESTNUT HILL HOSPITAL (12304)CHILDRENS HOSPITAL OF PITTSBURGH OF UPMC (11640)CONEMAUGH MEMORIAL MEDICAL CENTER (10280)DELAWARE COUNTY MEMORIAL HOSPITAL (11972)EINSTEIN AT ELKINS PARK (12500)EPHRATA COMMUNITY HOSPITAL (11764)EXCELA HEALTH LATROBE HOSPITAL (11651)EXCELA HEALTH WESTMORELAND REGIONAL HOSPITAL (11637)FORBES HOSPITAL (11265)GEISINGER-LEWISTOWN HOSPITAL (11825)HERITAGE VALLEY SEWICKLEY (10375)LANCASTER REGIONAL MEDICAL CENTER (12335)MAGEE WOMENS HOSPITAL OF UPMC HEALTH SYSTEM (10301)MAIN LINE HOSPITAL LANKENAU MEDICAL CENTER (11770)MERCY PHILADELPHIA HOSPITAL (11946)MERCY SUBURBAN HOSPITAL (11952)MILTON S HERSHEY MEDICAL CENTER (11747)MOSES TAYLOR HOSPITAL (11528)MOUNT NITTANY MEDICAL CENTER (11797)PENN PRESBYTERIAN MEDICAL CENTER (11814)REGIONAL HOSPITAL OF SCRANTON (12533)ROBERT PACKER HOSPITAL (12422)ROXBOROUGH MEMORIAL HOSPITAL (11978)SHARON REGIONAL HEALTH SYSTEM (12250)SOMERSET HOSPITAL (12282)ST. CLAIR MEMORIAL HOSPITAL (10561)THOMAS JEFFERSON UNIVERSITY HOSPITAL - METHODIST (12017)UNIONTOWN HOSPITAL (10441)UPMC MERCY (10384)WILKES-BARRE GENERAL HOSPITAL (11916)WILLIAMSPORT REGIONAL MEDICAL CENTER (11732)
47
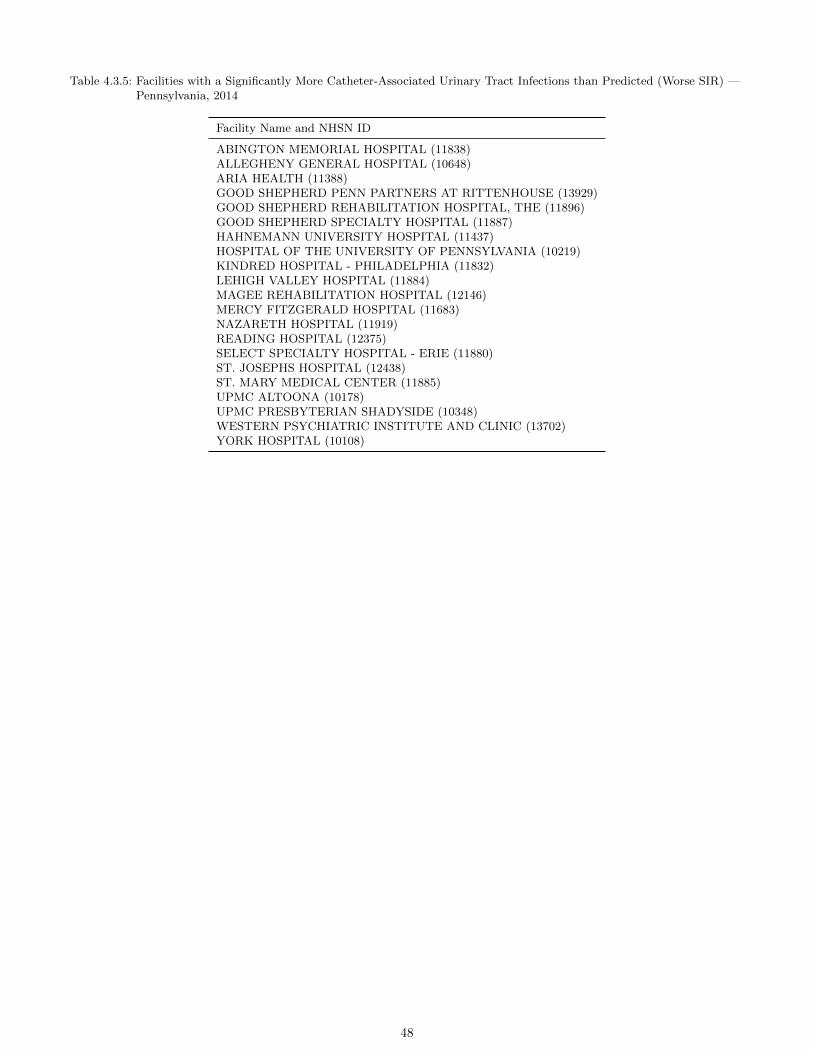
Table 4.3.5: Facilities with a Significantly More Catheter-Associated Urinary Tract Infections than Predicted (Worse SIR) —Pennsylvania, 2014
Facility Name and NHSN ID
ABINGTON MEMORIAL HOSPITAL (11838)ALLEGHENY GENERAL HOSPITAL (10648)ARIA HEALTH (11388)GOOD SHEPHERD PENN PARTNERS AT RITTENHOUSE (13929)GOOD SHEPHERD REHABILITATION HOSPITAL, THE (11896)GOOD SHEPHERD SPECIALTY HOSPITAL (11887)HAHNEMANN UNIVERSITY HOSPITAL (11437)HOSPITAL OF THE UNIVERSITY OF PENNSYLVANIA (10219)KINDRED HOSPITAL - PHILADELPHIA (11832)LEHIGH VALLEY HOSPITAL (11884)MAGEE REHABILITATION HOSPITAL (12146)MERCY FITZGERALD HOSPITAL (11683)NAZARETH HOSPITAL (11919)READING HOSPITAL (12375)SELECT SPECIALTY HOSPITAL - ERIE (11880)ST. JOSEPHS HOSPITAL (12438)ST. MARY MEDICAL CENTER (11885)UPMC ALTOONA (10178)UPMC PRESBYTERIAN SHADYSIDE (10348)WESTERN PSYCHIATRIC INSTITUTE AND CLINIC (13702)YORK HOSPITAL (10108)
48

Table 4.3.6: Facilities Omitted from CAUTI SIR Analysis Due to No Reported Urinary Catheter Use — Pennsylvania, 2014
Facility Name and NHSN ID
BELMONT CENTER FOR COMPREHENSIVE TREATMENT (12505)BROOKE GLEN BEHAVIORAL HOSPITAL (12623)CHILDRENS HOME OF PITTSBURGH, THE (12336)CLARION PSYCHIATRIC CENTER (12454)CLARKS SUMMIT STATE HOSPITAL (12051)DEVEREUX CHILDRENS BEHAVIORAL HEALTH INSTITUTE (12738)FAIRMOUNT BEHAVIORAL HEALTH SYSTEM (12565)FOUNDATIONS BEHAVIORAL HEALTH (12832)FRIENDS HOSPITAL (12488)HAVEN BEHAVIORAL HOSPITAL OF EASTERN PENNSYLVANIA (14471)HAVEN BEHAVIORAL HOSPITAL OF PHILADELPHIA (37622)HELEN M. SIMPSON REHABILITATION HOSPITAL (40371)HORSHAM CLINIC (12543)KIDSPEACE ORCHARD HILLS CAMPUS (12430)KIRKBRIDE CENTER (12624)MEADOWS PSYCHIATRIC CENTER, THE (12156)MONTGOMERY COUNTY MH/MR EMERGENCY SERVICES, INC. (12287)PENNSYLVANIA PSYCHIATRIC INSTITUTE (14190)PHILHAVEN HOSPITAL (11740)PINNACLE HEALTH HOSPITALS - WEST SHORE HOSPITAL (35123)ROXBURY TREATMENT CENTER (12723)SOUTHWOOD PSYCHIATRIC HOSPITAL (12453)ST. JOHN VIANNEY HOSPITAL (12548)ST. MARY REHABILITATION HOSPITAL LLP (36959)TITUSVILLE AREA HOSPITAL (11738)TORRANCE STATE HOSPITAL (12091)VALLEY FORGE MEDICAL CENTER AND HOSPITAL (12029)WARREN STATE HOSPITAL (12081)WERNERSVILLE STATE HOSPITAL (12368)WILLS EYE HOSPITAL (34846)
49
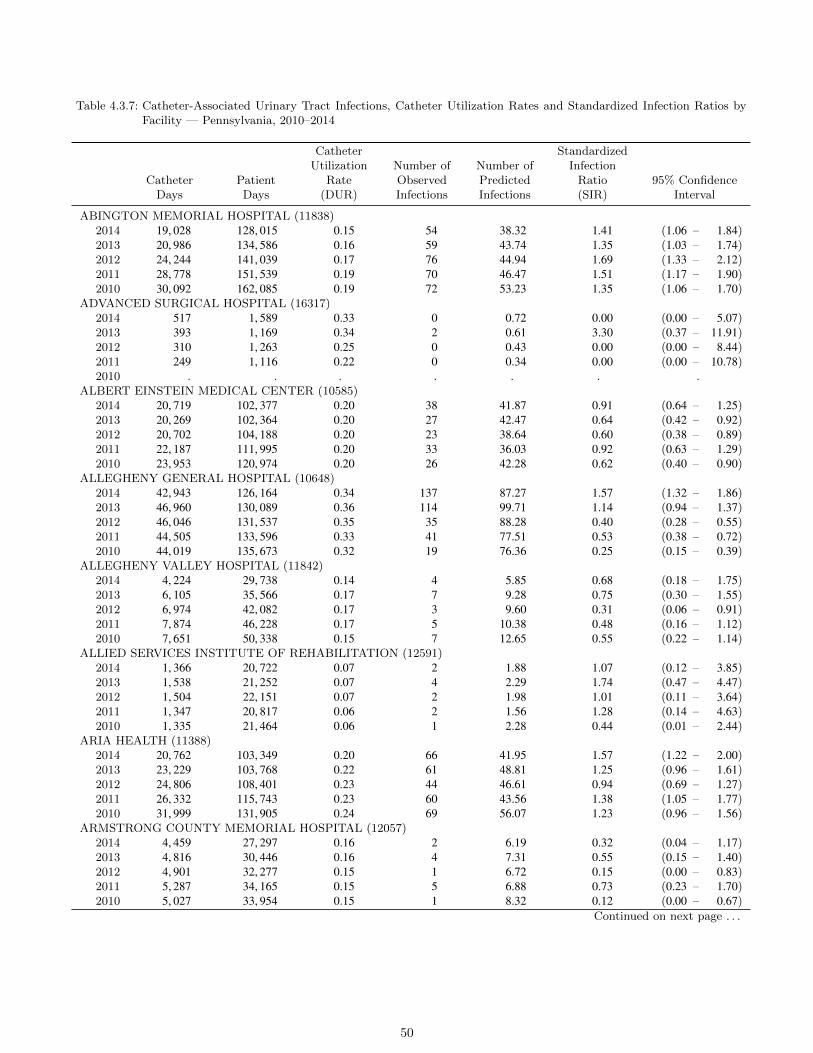
Table 4.3.7: Catheter-Associated Urinary Tract Infections, Catheter Utilization Rates and Standardized Infection Ratios byFacility — Pennsylvania, 2010–2014
CatheterDays
PatientDays
CatheterUtilization
Rate(DUR)
Number ofObservedInfections
Number ofPredictedInfections
StandardizedInfection
Ratio(SIR)
95% ConfidenceInterval
ABINGTON MEMORIAL HOSPITAL (11838)2014 19, 028 128, 015 0.15 54 38.32 1.41 (1.06 – 1.84)2013 20, 986 134, 586 0.16 59 43.74 1.35 (1.03 – 1.74)2012 24, 244 141, 039 0.17 76 44.94 1.69 (1.33 – 2.12)2011 28, 778 151, 539 0.19 70 46.47 1.51 (1.17 – 1.90)2010 30, 092 162, 085 0.19 72 53.23 1.35 (1.06 – 1.70)
ADVANCED SURGICAL HOSPITAL (16317)2014 517 1, 589 0.33 0 0.72 0.00 (0.00 – 5.07)2013 393 1, 169 0.34 2 0.61 3.30 (0.37 – 11.91)2012 310 1, 263 0.25 0 0.43 0.00 (0.00 – 8.44)2011 249 1, 116 0.22 0 0.34 0.00 (0.00 – 10.78)2010 . . . . . . .
ALBERT EINSTEIN MEDICAL CENTER (10585)2014 20, 719 102, 377 0.20 38 41.87 0.91 (0.64 – 1.25)2013 20, 269 102, 364 0.20 27 42.47 0.64 (0.42 – 0.92)2012 20, 702 104, 188 0.20 23 38.64 0.60 (0.38 – 0.89)2011 22, 187 111, 995 0.20 33 36.03 0.92 (0.63 – 1.29)2010 23, 953 120, 974 0.20 26 42.28 0.62 (0.40 – 0.90)
ALLEGHENY GENERAL HOSPITAL (10648)2014 42, 943 126, 164 0.34 137 87.27 1.57 (1.32 – 1.86)2013 46, 960 130, 089 0.36 114 99.71 1.14 (0.94 – 1.37)2012 46, 046 131, 537 0.35 35 88.28 0.40 (0.28 – 0.55)2011 44, 505 133, 596 0.33 41 77.51 0.53 (0.38 – 0.72)2010 44, 019 135, 673 0.32 19 76.36 0.25 (0.15 – 0.39)
ALLEGHENY VALLEY HOSPITAL (11842)2014 4, 224 29, 738 0.14 4 5.85 0.68 (0.18 – 1.75)2013 6, 105 35, 566 0.17 7 9.28 0.75 (0.30 – 1.55)2012 6, 974 42, 082 0.17 3 9.60 0.31 (0.06 – 0.91)2011 7, 874 46, 228 0.17 5 10.38 0.48 (0.16 – 1.12)2010 7, 651 50, 338 0.15 7 12.65 0.55 (0.22 – 1.14)
ALLIED SERVICES INSTITUTE OF REHABILITATION (12591)2014 1, 366 20, 722 0.07 2 1.88 1.07 (0.12 – 3.85)2013 1, 538 21, 252 0.07 4 2.29 1.74 (0.47 – 4.47)2012 1, 504 22, 151 0.07 2 1.98 1.01 (0.11 – 3.64)2011 1, 347 20, 817 0.06 2 1.56 1.28 (0.14 – 4.63)2010 1, 335 21, 464 0.06 1 2.28 0.44 (0.01 – 2.44)
ARIA HEALTH (11388)2014 20, 762 103, 349 0.20 66 41.95 1.57 (1.22 – 2.00)2013 23, 229 103, 768 0.22 61 48.81 1.25 (0.96 – 1.61)2012 24, 806 108, 401 0.23 44 46.61 0.94 (0.69 – 1.27)2011 26, 332 115, 743 0.23 60 43.56 1.38 (1.05 – 1.77)2010 31, 999 131, 905 0.24 69 56.07 1.23 (0.96 – 1.56)
ARMSTRONG COUNTY MEMORIAL HOSPITAL (12057)2014 4, 459 27, 297 0.16 2 6.19 0.32 (0.04 – 1.17)2013 4, 816 30, 446 0.16 4 7.31 0.55 (0.15 – 1.40)2012 4, 901 32, 277 0.15 1 6.72 0.15 (0.00 – 0.83)2011 5, 287 34, 165 0.15 5 6.88 0.73 (0.23 – 1.70)2010 5, 027 33, 954 0.15 1 8.32 0.12 (0.00 – 0.67)
Continued on next page . . .
50
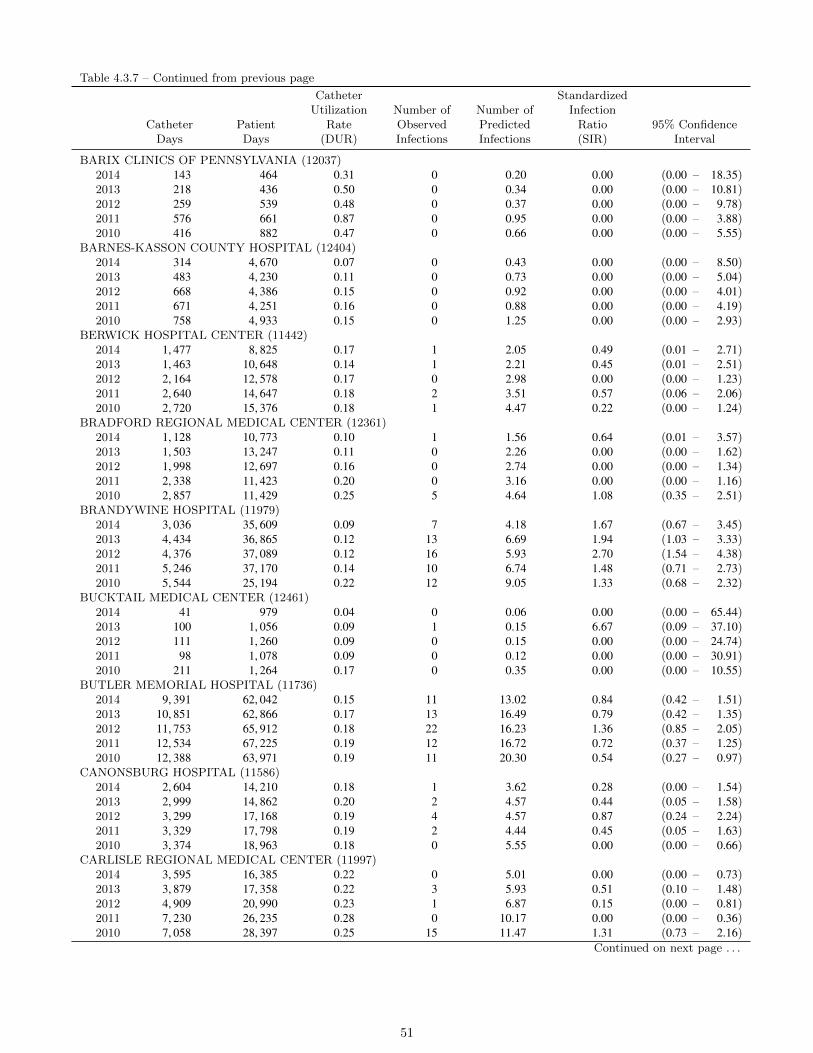
Table 4.3.7 – Continued from previous page
CatheterDays
PatientDays
CatheterUtilization
Rate(DUR)
Number ofObservedInfections
Number ofPredictedInfections
StandardizedInfection
Ratio(SIR)
95% ConfidenceInterval
BARIX CLINICS OF PENNSYLVANIA (12037)2014 143 464 0.31 0 0.20 0.00 (0.00 – 18.35)2013 218 436 0.50 0 0.34 0.00 (0.00 – 10.81)2012 259 539 0.48 0 0.37 0.00 (0.00 – 9.78)2011 576 661 0.87 0 0.95 0.00 (0.00 – 3.88)2010 416 882 0.47 0 0.66 0.00 (0.00 – 5.55)
BARNES-KASSON COUNTY HOSPITAL (12404)2014 314 4, 670 0.07 0 0.43 0.00 (0.00 – 8.50)2013 483 4, 230 0.11 0 0.73 0.00 (0.00 – 5.04)2012 668 4, 386 0.15 0 0.92 0.00 (0.00 – 4.01)2011 671 4, 251 0.16 0 0.88 0.00 (0.00 – 4.19)2010 758 4, 933 0.15 0 1.25 0.00 (0.00 – 2.93)
BERWICK HOSPITAL CENTER (11442)2014 1, 477 8, 825 0.17 1 2.05 0.49 (0.01 – 2.71)2013 1, 463 10, 648 0.14 1 2.21 0.45 (0.01 – 2.51)2012 2, 164 12, 578 0.17 0 2.98 0.00 (0.00 – 1.23)2011 2, 640 14, 647 0.18 2 3.51 0.57 (0.06 – 2.06)2010 2, 720 15, 376 0.18 1 4.47 0.22 (0.00 – 1.24)
BRADFORD REGIONAL MEDICAL CENTER (12361)2014 1, 128 10, 773 0.10 1 1.56 0.64 (0.01 – 3.57)2013 1, 503 13, 247 0.11 0 2.26 0.00 (0.00 – 1.62)2012 1, 998 12, 697 0.16 0 2.74 0.00 (0.00 – 1.34)2011 2, 338 11, 423 0.20 0 3.16 0.00 (0.00 – 1.16)2010 2, 857 11, 429 0.25 5 4.64 1.08 (0.35 – 2.51)
BRANDYWINE HOSPITAL (11979)2014 3, 036 35, 609 0.09 7 4.18 1.67 (0.67 – 3.45)2013 4, 434 36, 865 0.12 13 6.69 1.94 (1.03 – 3.33)2012 4, 376 37, 089 0.12 16 5.93 2.70 (1.54 – 4.38)2011 5, 246 37, 170 0.14 10 6.74 1.48 (0.71 – 2.73)2010 5, 544 25, 194 0.22 12 9.05 1.33 (0.68 – 2.32)
BUCKTAIL MEDICAL CENTER (12461)2014 41 979 0.04 0 0.06 0.00 (0.00 – 65.44)2013 100 1, 056 0.09 1 0.15 6.67 (0.09 – 37.10)2012 111 1, 260 0.09 0 0.15 0.00 (0.00 – 24.74)2011 98 1, 078 0.09 0 0.12 0.00 (0.00 – 30.91)2010 211 1, 264 0.17 0 0.35 0.00 (0.00 – 10.55)
BUTLER MEMORIAL HOSPITAL (11736)2014 9, 391 62, 042 0.15 11 13.02 0.84 (0.42 – 1.51)2013 10, 851 62, 866 0.17 13 16.49 0.79 (0.42 – 1.35)2012 11, 753 65, 912 0.18 22 16.23 1.36 (0.85 – 2.05)2011 12, 534 67, 225 0.19 12 16.72 0.72 (0.37 – 1.25)2010 12, 388 63, 971 0.19 11 20.30 0.54 (0.27 – 0.97)
CANONSBURG HOSPITAL (11586)2014 2, 604 14, 210 0.18 1 3.62 0.28 (0.00 – 1.54)2013 2, 999 14, 862 0.20 2 4.57 0.44 (0.05 – 1.58)2012 3, 299 17, 168 0.19 4 4.57 0.87 (0.24 – 2.24)2011 3, 329 17, 798 0.19 2 4.44 0.45 (0.05 – 1.63)2010 3, 374 18, 963 0.18 0 5.55 0.00 (0.00 – 0.66)
CARLISLE REGIONAL MEDICAL CENTER (11997)2014 3, 595 16, 385 0.22 0 5.01 0.00 (0.00 – 0.73)2013 3, 879 17, 358 0.22 3 5.93 0.51 (0.10 – 1.48)2012 4, 909 20, 990 0.23 1 6.87 0.15 (0.00 – 0.81)2011 7, 230 26, 235 0.28 0 10.17 0.00 (0.00 – 0.36)2010 7, 058 28, 397 0.25 15 11.47 1.31 (0.73 – 2.16)
Continued on next page . . .
51

Table 4.3.7 – Continued from previous page
CatheterDays
PatientDays
CatheterUtilization
Rate(DUR)
Number ofObservedInfections
Number ofPredictedInfections
StandardizedInfection
Ratio(SIR)
95% ConfidenceInterval
CHAMBERSBURG HOSPITAL (11913)2014 9, 316 56, 806 0.16 11 12.93 0.85 (0.42 – 1.52)2013 10, 028 58, 513 0.17 8 15.24 0.52 (0.23 – 1.03)2012 9, 207 54, 266 0.17 19 12.69 1.50 (0.90 – 2.34)2011 9, 954 56, 846 0.18 8 13.17 0.61 (0.26 – 1.20)2010 10, 045 52, 912 0.19 14 16.47 0.85 (0.46 – 1.43)
CHARLES COLE MEMORIAL HOSPITAL (11956)2014 1, 173 10, 668 0.11 0 1.62 0.00 (0.00 – 2.26)2013 1, 265 11, 574 0.11 4 1.90 2.10 (0.57 – 5.38)2012 1, 233 10, 297 0.12 5 1.67 2.99 (0.96 – 6.98)2011 1, 448 9, 233 0.16 2 1.89 1.06 (0.12 – 3.83)2010 1, 644 9, 535 0.17 0 2.71 0.00 (0.00 – 1.36)
CHESTER COUNTY HOSPITAL (12016)2014 6, 688 56, 671 0.12 9 9.25 0.97 (0.44 – 1.85)2013 7, 439 56, 624 0.13 25 11.24 2.22 (1.44 – 3.28)2012 7, 700 58, 920 0.13 21 10.48 2.00 (1.24 – 3.06)2011 8, 779 59, 845 0.15 26 13.69 1.90 (1.24 – 2.78)2010 9, 737 58, 559 0.17 22 17.29 1.27 (0.80 – 1.93)
CHESTNUT HILL HOSPITAL (12304)2014 6, 399 29, 926 0.21 1 12.94 0.08 (0.00 – 0.43)2013 6, 447 27, 547 0.23 1 13.56 0.07 (0.00 – 0.41)2012 6, 035 26, 818 0.23 1 8.43 0.12 (0.00 – 0.66)2011 6, 698 27, 803 0.24 4 9.25 0.43 (0.12 – 1.11)2010 6, 693 27, 053 0.25 7 11.72 0.60 (0.24 – 1.23)
CHILDRENS HOSPITAL OF PHILADELPHIA (10306)2014 6, 264 154, 804 0.04 12 12.43 0.97 (0.50 – 1.69)2013 7, 022 158, 179 0.04 17 14.24 1.19 (0.70 – 1.91)2012 5, 464 154, 870 0.04 11 9.39 1.17 (0.58 – 2.10)2011 4, 108 150, 455 0.03 10 5.11 1.96 (0.94 – 3.60)2010 3, 638 137, 053 0.03 18 6.89 2.61 (1.55 – 4.13)
CHILDRENS HOSPITAL OF PITTSBURGH OF UPMC (11640)2014 8, 879 91, 318 0.10 5 17.80 0.28 (0.09 – 0.66)2013 8, 390 86, 033 0.10 16 17.31 0.92 (0.53 – 1.50)2012 7, 570 84, 386 0.09 8 13.60 0.59 (0.25 – 1.16)2011 7, 579 84, 133 0.09 6 11.07 0.54 (0.20 – 1.18)2010 8, 226 79, 661 0.10 13 14.85 0.88 (0.47 – 1.50)
CHILDRENS INSTITUTE OF PITTSBURGH, THE (12266)2014 144 7, 606 0.02 0 0.20 0.00 (0.00 – 18.80)2013 45 10, 332 0.00 1 0.06 15.86 (0.21 – 88.25)2012 138 11, 368 0.01 0 0.17 0.00 (0.00 – 21.86)2011 18 7, 631 0.00 0 0.01 0.00 (0.00 – 275.22)2010 153 9, 990 0.02 0 0.27 0.00 (0.00 – 13.38)
CLARION HOSPITAL (11654)2014 1, 222 9, 556 0.13 3 2.46 1.22 (0.25 – 3.57)2013 1, 560 10, 020 0.16 0 3.25 0.00 (0.00 – 1.13)2012 1, 696 10, 706 0.16 3 3.13 0.96 (0.19 – 2.80)2011 2, 541 10, 903 0.23 5 4.22 1.19 (0.38 – 2.77)2010 2, 539 11, 420 0.22 2 4.46 0.45 (0.05 – 1.62)
CONEMAUGH MEMORIAL MEDICAL CENTER (10280)2014 27, 234 112, 061 0.24 14 55.14 0.25 (0.14 – 0.43)2013 27, 254 115, 796 0.24 12 57.33 0.21 (0.11 – 0.37)2012 28, 621 120, 230 0.24 30 53.88 0.56 (0.38 – 0.79)2011 30, 984 121, 737 0.25 42 52.04 0.81 (0.58 – 1.09)2010 32, 055 133, 148 0.24 50 56.19 0.89 (0.66 – 1.17)
Continued on next page . . .
52

Table 4.3.7 – Continued from previous page
CatheterDays
PatientDays
CatheterUtilization
Rate(DUR)
Number ofObservedInfections
Number ofPredictedInfections
StandardizedInfection
Ratio(SIR)
95% ConfidenceInterval
CONEMAUGH MEYERSDALE MEDICAL CENTER (11968)2014 248 1, 992 0.12 1 0.34 2.91 (0.04 – 16.21)2013 89 1, 662 0.05 0 0.13 0.00 (0.00 – 27.83)2012 208 1, 877 0.11 1 0.28 3.56 (0.05 – 19.81)2011 126 1, 727 0.07 0 0.15 0.00 (0.00 – 24.76)2010 188 1, 735 0.11 1 0.31 3.18 (0.04 – 17.69)
CONEMAUGH MINERS MEDICAL CENTER (12295)2014 233 2, 640 0.09 1 0.32 3.11 (0.04 – 17.32)2013 394 2, 985 0.13 0 0.60 0.00 (0.00 – 6.16)2012 642 3, 839 0.17 1 0.88 1.13 (0.01 – 6.29)2011 854 4, 420 0.19 0 1.14 0.00 (0.00 – 3.20)2010 845 4, 521 0.19 1 1.39 0.72 (0.01 – 4.01)
COORDINATED HEALTH ORTHOPEDIC HOSPITAL LLC (11872)2014 956 2, 886 0.33 0 1.34 0.00 (0.00 – 2.74)2013 1, 050 3, 112 0.34 0 1.62 0.00 (0.00 – 2.26)2012 1, 353 3, 085 0.44 4 1.95 2.05 (0.55 – 5.25)2011 1, 431 3, 107 0.46 0 2.16 0.00 (0.00 – 1.70)2010 1, 077 2, 994 0.36 2 1.73 1.16 (0.13 – 4.18)
CORRY MEMORIAL HOSPITAL (12283)2014 465 2, 572 0.18 0 0.65 0.00 (0.00 – 5.68)2013 597 3, 136 0.19 0 0.91 0.00 (0.00 – 4.03)2012 440 3, 598 0.12 0 0.60 0.00 (0.00 – 6.14)2011 639 5, 107 0.13 0 0.81 0.00 (0.00 – 4.54)2010 559 5, 177 0.11 0 0.94 0.00 (0.00 – 3.92)
CRICHTON REHABILITATION CENTER (12273)2014 917 9, 690 0.09 0 1.27 0.00 (0.00 – 2.90)2013 1, 009 10, 308 0.10 2 1.51 1.32 (0.15 – 4.77)2012 811 9, 732 0.08 2 1.08 1.85 (0.21 – 6.68)2011 845 9, 740 0.09 3 1.02 2.95 (0.59 – 8.62)2010 728 9, 026 0.08 1 1.33 0.75 (0.01 – 4.20)
CROZER CHESTER MEDICAL CENTER - SPRINGFIELD (11851)2014 768 3, 694 0.21 0 1.55 0.00 (0.00 – 2.36)2013 895 4, 142 0.22 2 1.88 1.06 (0.12 – 3.84)2012 1, 104 4, 316 0.26 0 2.09 0.00 (0.00 – 1.76)2011 1, 200 5, 467 0.22 1 1.98 0.51 (0.01 – 2.82)2010 1, 314 6, 843 0.19 1 2.32 0.43 (0.01 – 2.40)
CROZER CHESTER MEDICAL CENTER (11839)2014 11, 789 68, 013 0.17 31 23.78 1.30 (0.89 – 1.85)2013 13, 429 75, 687 0.18 31 28.07 1.10 (0.75 – 1.57)2012 14, 662 74, 144 0.20 18 27.36 0.66 (0.39 – 1.04)2011 18, 174 88, 176 0.21 18 29.67 0.61 (0.36 – 0.96)2010 21, 911 99, 590 0.22 14 38.53 0.36 (0.20 – 0.61)
CROZER CHESTER MEDICAL CENTER (11932)2014 4, 486 25, 842 0.17 5 9.05 0.55 (0.18 – 1.29)2013 4, 786 26, 773 0.18 9 10.01 0.90 (0.41 – 1.71)2012 5, 414 28, 514 0.19 9 10.08 0.89 (0.41 – 1.69)2011 7, 564 35, 178 0.22 5 12.42 0.40 (0.13 – 0.94)2010 8, 258 38, 591 0.21 5 14.54 0.34 (0.11 – 0.80)
Continued on next page . . .
53

Table 4.3.7 – Continued from previous page
CatheterDays
PatientDays
CatheterUtilization
Rate(DUR)
Number ofObservedInfections
Number ofPredictedInfections
StandardizedInfection
Ratio(SIR)
95% ConfidenceInterval
DANVILLE STATE HOSPITAL (11848)2014 9 60, 329 0.00 0 0.01 0.00 (0.00 – 317.24)2013 188 59, 550 0.00 0 0.26 0.00 (0.00 – 14.03)2012 610 58, 459 0.01 1 0.74 1.36 (0.02 – 7.56)2011 365 60, 873 0.01 0 0.31 0.00 (0.00 – 11.97)2010 668 62, 294 0.01 0 1.21 0.00 (0.00 – 3.03)
DELAWARE COUNTY MEMORIAL HOSPITAL (11972)2014 6, 905 36, 073 0.19 2 13.94 0.14 (0.02 – 0.52)2013 8, 005 37, 275 0.21 3 16.80 0.18 (0.04 – 0.52)2012 9, 339 41, 967 0.22 2 17.52 0.11 (0.01 – 0.41)2011 10, 673 48, 197 0.22 11 17.59 0.63 (0.31 – 1.12)2010 11, 193 51, 226 0.22 12 19.69 0.61 (0.31 – 1.06)
DIVINE PROVIDENCE HOSPITAL (11743)2014 38 5, 994 0.01 0 0.05 0.00 (0.00 – 72.09)2013 66 5, 948 0.01 0 0.09 0.00 (0.00 – 38.86)2012 22 6, 986 0.00 0 0.03 0.00 (0.00 – 146.22)2011 29 6, 529 0.00 0 0.02 0.00 (0.00 – 156.86)2010 11 5, 569 0.00 0 0.02 0.00 (0.00 – 173.21)
DOYLESTOWN HOSPITAL (10190)2014 8, 976 48, 898 0.18 7 12.47 0.56 (0.22 – 1.16)2013 8, 982 50, 761 0.18 7 13.66 0.51 (0.21 – 1.06)2012 8, 374 50, 723 0.17 14 11.52 1.21 (0.66 – 2.04)2011 8, 450 53, 945 0.16 15 11.01 1.36 (0.76 – 2.25)2010 8, 279 51, 572 0.16 25 13.66 1.83 (1.18 – 2.70)
EAGLEVILLE HOSPITAL (12965)2014 125 19, 617 0.01 0 0.17 0.00 (0.00 – 21.91)2013 68 17, 479 0.00 0 0.10 0.00 (0.00 – 38.60)2012 36 17, 781 0.00 0 0.04 0.00 (0.00 – 91.25)2011 24 6, 561 0.00 0 0.02 0.00 (0.00 – 194.57)2010 . . . . . . .
EASTERN REGIONAL MEDICAL CENTER (12348)2014 2, 125 13, 393 0.16 4 2.95 1.36 (0.36 – 3.47)2013 2, 795 15, 738 0.18 8 4.25 1.88 (0.81 – 3.71)2012 2, 443 16, 417 0.15 8 3.35 2.39 (1.03 – 4.71)2011 2, 055 13, 007 0.16 5 2.68 1.86 (0.60 – 4.35)2010 1, 846 11, 255 0.16 5 3.04 1.64 (0.53 – 3.83)
EASTON HOSPITAL (11929)2014 5, 997 33, 650 0.18 16 12.10 1.32 (0.76 – 2.15)2013 7, 250 38, 021 0.19 15 15.18 0.99 (0.55 – 1.63)2012 9, 266 45, 205 0.20 19 17.32 1.10 (0.66 – 1.71)2011 10, 583 48, 864 0.22 27 17.39 1.55 (1.02 – 2.26)2010 10, 898 50, 269 0.22 21 19.17 1.10 (0.68 – 1.67)
EDGEWOOD SURGICAL HOSPITAL (12552)2014 18 346 0.05 0 0.02 0.00 (0.00 – 148.70)2013 34 376 0.09 0 0.05 0.00 (0.00 – 72.01)2012 39 367 0.11 0 0.05 0.00 (0.00 – 69.79)2011 32 373 0.09 0 0.04 0.00 (0.00 – 95.40)2010 48 376 0.13 0 0.08 0.00 (0.00 – 45.95)
EINSTEIN AT ELKINS PARK (12500)2014 2, 144 8, 969 0.24 0 4.34 0.00 (0.00 – 0.85)2013 2, 516 9, 960 0.25 3 5.30 0.57 (0.11 – 1.65)2012 2, 772 10, 144 0.27 6 5.25 1.14 (0.42 – 2.49)2011 2, 716 10, 601 0.26 4 4.57 0.88 (0.24 – 2.24)2010 2, 994 12, 656 0.24 0 5.25 0.00 (0.00 – 0.70)
Continued on next page . . .
54
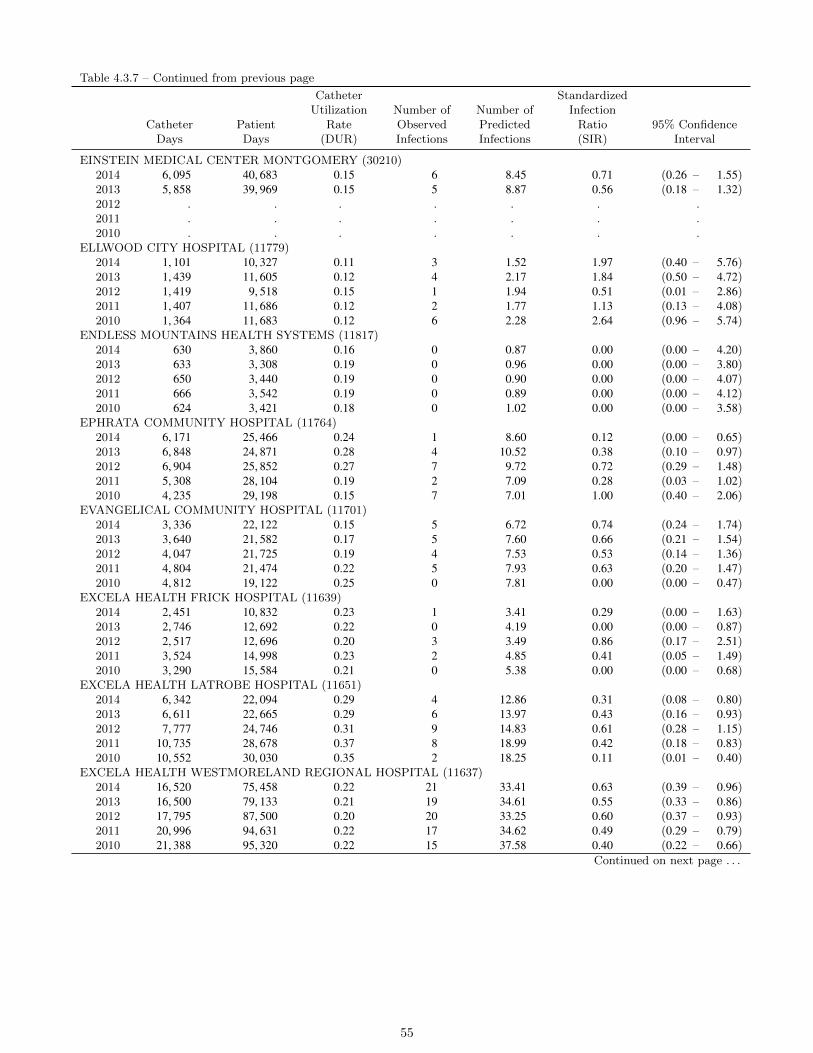
Table 4.3.7 – Continued from previous page
CatheterDays
PatientDays
CatheterUtilization
Rate(DUR)
Number ofObservedInfections
Number ofPredictedInfections
StandardizedInfection
Ratio(SIR)
95% ConfidenceInterval
EINSTEIN MEDICAL CENTER MONTGOMERY (30210)2014 6, 095 40, 683 0.15 6 8.45 0.71 (0.26 – 1.55)2013 5, 858 39, 969 0.15 5 8.87 0.56 (0.18 – 1.32)2012 . . . . . . .2011 . . . . . . .2010 . . . . . . .
ELLWOOD CITY HOSPITAL (11779)2014 1, 101 10, 327 0.11 3 1.52 1.97 (0.40 – 5.76)2013 1, 439 11, 605 0.12 4 2.17 1.84 (0.50 – 4.72)2012 1, 419 9, 518 0.15 1 1.94 0.51 (0.01 – 2.86)2011 1, 407 11, 686 0.12 2 1.77 1.13 (0.13 – 4.08)2010 1, 364 11, 683 0.12 6 2.28 2.64 (0.96 – 5.74)
ENDLESS MOUNTAINS HEALTH SYSTEMS (11817)2014 630 3, 860 0.16 0 0.87 0.00 (0.00 – 4.20)2013 633 3, 308 0.19 0 0.96 0.00 (0.00 – 3.80)2012 650 3, 440 0.19 0 0.90 0.00 (0.00 – 4.07)2011 666 3, 542 0.19 0 0.89 0.00 (0.00 – 4.12)2010 624 3, 421 0.18 0 1.02 0.00 (0.00 – 3.58)
EPHRATA COMMUNITY HOSPITAL (11764)2014 6, 171 25, 466 0.24 1 8.60 0.12 (0.00 – 0.65)2013 6, 848 24, 871 0.28 4 10.52 0.38 (0.10 – 0.97)2012 6, 904 25, 852 0.27 7 9.72 0.72 (0.29 – 1.48)2011 5, 308 28, 104 0.19 2 7.09 0.28 (0.03 – 1.02)2010 4, 235 29, 198 0.15 7 7.01 1.00 (0.40 – 2.06)
EVANGELICAL COMMUNITY HOSPITAL (11701)2014 3, 336 22, 122 0.15 5 6.72 0.74 (0.24 – 1.74)2013 3, 640 21, 582 0.17 5 7.60 0.66 (0.21 – 1.54)2012 4, 047 21, 725 0.19 4 7.53 0.53 (0.14 – 1.36)2011 4, 804 21, 474 0.22 5 7.93 0.63 (0.20 – 1.47)2010 4, 812 19, 122 0.25 0 7.81 0.00 (0.00 – 0.47)
EXCELA HEALTH FRICK HOSPITAL (11639)2014 2, 451 10, 832 0.23 1 3.41 0.29 (0.00 – 1.63)2013 2, 746 12, 692 0.22 0 4.19 0.00 (0.00 – 0.87)2012 2, 517 12, 696 0.20 3 3.49 0.86 (0.17 – 2.51)2011 3, 524 14, 998 0.23 2 4.85 0.41 (0.05 – 1.49)2010 3, 290 15, 584 0.21 0 5.38 0.00 (0.00 – 0.68)
EXCELA HEALTH LATROBE HOSPITAL (11651)2014 6, 342 22, 094 0.29 4 12.86 0.31 (0.08 – 0.80)2013 6, 611 22, 665 0.29 6 13.97 0.43 (0.16 – 0.93)2012 7, 777 24, 746 0.31 9 14.83 0.61 (0.28 – 1.15)2011 10, 735 28, 678 0.37 8 18.99 0.42 (0.18 – 0.83)2010 10, 552 30, 030 0.35 2 18.25 0.11 (0.01 – 0.40)
EXCELA HEALTH WESTMORELAND REGIONAL HOSPITAL (11637)2014 16, 520 75, 458 0.22 21 33.41 0.63 (0.39 – 0.96)2013 16, 500 79, 133 0.21 19 34.61 0.55 (0.33 – 0.86)2012 17, 795 87, 500 0.20 20 33.25 0.60 (0.37 – 0.93)2011 20, 996 94, 631 0.22 17 34.62 0.49 (0.29 – 0.79)2010 21, 388 95, 320 0.22 15 37.58 0.40 (0.22 – 0.66)
Continued on next page . . .
55

Table 4.3.7 – Continued from previous page
CatheterDays
PatientDays
CatheterUtilization
Rate(DUR)
Number ofObservedInfections
Number ofPredictedInfections
StandardizedInfection
Ratio(SIR)
95% ConfidenceInterval
FIRST HOSPITAL OF WYOMING VALLEY (12050)2014 14 37, 248 0.00 0 0.02 0.00 (0.00 – 201.87)2013 . . . . . . .2012 9 33, 278 0.00 0 0.01 0.00 (0.00 – 401.64)2011 . . . . . . .2010 12 32, 369 0.00 0 0.02 0.00 (0.00 – 149.71)
FORBES HOSPITAL (11265)2014 14, 013 79, 832 0.18 13 28.27 0.46 (0.24 – 0.79)2013 13, 991 82, 592 0.17 22 29.22 0.75 (0.47 – 1.14)2012 12, 531 84, 685 0.15 23 23.06 1.00 (0.63 – 1.50)2011 12, 707 85, 996 0.15 18 19.83 0.91 (0.54 – 1.43)2010 13, 209 79, 998 0.17 12 23.46 0.51 (0.26 – 0.89)
FULTON COUNTY MEDICAL CENTER (11939)2014 336 3, 761 0.09 1 0.46 2.16 (0.03 – 12.01)2013 460 4, 192 0.11 1 0.69 1.44 (0.02 – 8.04)2012 433 4, 625 0.09 1 0.58 1.72 (0.02 – 9.59)2011 500 4, 065 0.12 1 0.63 1.59 (0.02 – 8.82)2010 279 4, 574 0.06 0 0.48 0.00 (0.00 – 7.70)
GEISINGER HEALTHSOUTH REHABILITATION HOSPITAL (11993)2014 441 11, 122 0.04 0 0.60 0.00 (0.00 – 6.09)2013 574 11, 322 0.05 0 0.85 0.00 (0.00 – 4.32)2012 504 11, 741 0.04 0 0.65 0.00 (0.00 – 5.64)2011 321 10, 978 0.03 0 0.33 0.00 (0.00 – 10.99)2010 200 10, 867 0.02 2 0.36 5.62 (0.63 – 20.28)
GEISINGER MEDICAL CENTER (11775)2014 19, 995 141, 137 0.14 34 40.24 0.84 (0.58 – 1.18)2013 23, 223 146, 288 0.16 48 48.42 0.99 (0.73 – 1.31)2012 23, 257 142, 149 0.16 60 43.01 1.40 (1.06 – 1.80)2011 25, 082 136, 175 0.18 63 40.33 1.56 (1.20 – 2.00)2010 22, 910 129, 984 0.18 61 40.60 1.50 (1.15 – 1.93)
GEISINGER WYOMING VALLEY MEDICAL CENTER (11780)2014 10, 604 73, 523 0.14 24 21.35 1.12 (0.72 – 1.67)2013 15, 103 74, 115 0.20 43 31.67 1.36 (0.98 – 1.83)2012 15, 183 67, 922 0.22 38 28.50 1.33 (0.94 – 1.83)2011 15, 876 64, 749 0.25 47 26.53 1.77 (1.30 – 2.36)2010 14, 638 58, 226 0.25 30 25.62 1.17 (0.79 – 1.67)
GEISINGER-BLOOMSBURG HOSPITAL (12008)2014 618 9, 313 0.07 0 0.85 0.00 (0.00 – 4.32)2013 1, 259 11, 701 0.11 2 1.89 1.06 (0.12 – 3.81)2012 1, 590 12, 590 0.13 0 2.16 0.00 (0.00 – 1.70)2011 2, 192 13, 619 0.16 0 2.87 0.00 (0.00 – 1.28)2010 2, 589 14, 502 0.18 1 4.26 0.24 (0.00 – 1.31)
GEISINGER-COMMUNITY MEDICAL CENTER (11914)2014 12, 695 55, 497 0.23 23 25.69 0.90 (0.57 – 1.34)2013 12, 105 53, 698 0.23 21 25.44 0.83 (0.51 – 1.26)2012 13, 661 54, 768 0.25 5 25.77 0.19 (0.06 – 0.45)2011 12, 141 52, 727 0.23 4 20.12 0.20 (0.05 – 0.51)2010 10, 814 51, 767 0.21 8 19.05 0.42 (0.18 – 0.83)
GEISINGER-LEWISTOWN HOSPITAL (11825)2014 3, 957 24, 948 0.16 2 7.97 0.25 (0.03 – 0.91)2013 3, 782 25, 830 0.15 4 5.73 0.70 (0.19 – 1.79)2012 3, 715 25, 305 0.15 1 5.08 0.20 (0.00 – 1.09)2011 3, 526 24, 902 0.14 3 4.53 0.66 (0.13 – 1.93)2010 3, 916 23, 437 0.17 10 6.45 1.55 (0.74 – 2.85)
Continued on next page . . .
56
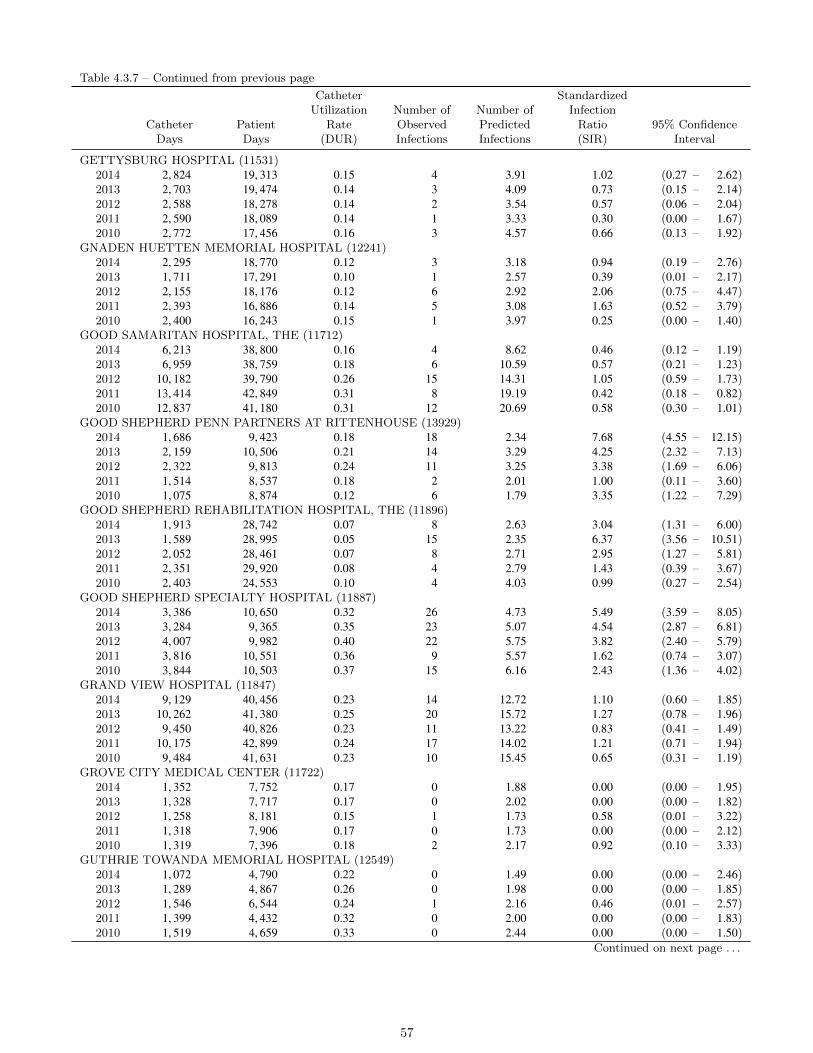
Table 4.3.7 – Continued from previous page
CatheterDays
PatientDays
CatheterUtilization
Rate(DUR)
Number ofObservedInfections
Number ofPredictedInfections
StandardizedInfection
Ratio(SIR)
95% ConfidenceInterval
GETTYSBURG HOSPITAL (11531)2014 2, 824 19, 313 0.15 4 3.91 1.02 (0.27 – 2.62)2013 2, 703 19, 474 0.14 3 4.09 0.73 (0.15 – 2.14)2012 2, 588 18, 278 0.14 2 3.54 0.57 (0.06 – 2.04)2011 2, 590 18, 089 0.14 1 3.33 0.30 (0.00 – 1.67)2010 2, 772 17, 456 0.16 3 4.57 0.66 (0.13 – 1.92)
GNADEN HUETTEN MEMORIAL HOSPITAL (12241)2014 2, 295 18, 770 0.12 3 3.18 0.94 (0.19 – 2.76)2013 1, 711 17, 291 0.10 1 2.57 0.39 (0.01 – 2.17)2012 2, 155 18, 176 0.12 6 2.92 2.06 (0.75 – 4.47)2011 2, 393 16, 886 0.14 5 3.08 1.63 (0.52 – 3.79)2010 2, 400 16, 243 0.15 1 3.97 0.25 (0.00 – 1.40)
GOOD SAMARITAN HOSPITAL, THE (11712)2014 6, 213 38, 800 0.16 4 8.62 0.46 (0.12 – 1.19)2013 6, 959 38, 759 0.18 6 10.59 0.57 (0.21 – 1.23)2012 10, 182 39, 790 0.26 15 14.31 1.05 (0.59 – 1.73)2011 13, 414 42, 849 0.31 8 19.19 0.42 (0.18 – 0.82)2010 12, 837 41, 180 0.31 12 20.69 0.58 (0.30 – 1.01)
GOOD SHEPHERD PENN PARTNERS AT RITTENHOUSE (13929)2014 1, 686 9, 423 0.18 18 2.34 7.68 (4.55 – 12.15)2013 2, 159 10, 506 0.21 14 3.29 4.25 (2.32 – 7.13)2012 2, 322 9, 813 0.24 11 3.25 3.38 (1.69 – 6.06)2011 1, 514 8, 537 0.18 2 2.01 1.00 (0.11 – 3.60)2010 1, 075 8, 874 0.12 6 1.79 3.35 (1.22 – 7.29)
GOOD SHEPHERD REHABILITATION HOSPITAL, THE (11896)2014 1, 913 28, 742 0.07 8 2.63 3.04 (1.31 – 6.00)2013 1, 589 28, 995 0.05 15 2.35 6.37 (3.56 – 10.51)2012 2, 052 28, 461 0.07 8 2.71 2.95 (1.27 – 5.81)2011 2, 351 29, 920 0.08 4 2.79 1.43 (0.39 – 3.67)2010 2, 403 24, 553 0.10 4 4.03 0.99 (0.27 – 2.54)
GOOD SHEPHERD SPECIALTY HOSPITAL (11887)2014 3, 386 10, 650 0.32 26 4.73 5.49 (3.59 – 8.05)2013 3, 284 9, 365 0.35 23 5.07 4.54 (2.87 – 6.81)2012 4, 007 9, 982 0.40 22 5.75 3.82 (2.40 – 5.79)2011 3, 816 10, 551 0.36 9 5.57 1.62 (0.74 – 3.07)2010 3, 844 10, 503 0.37 15 6.16 2.43 (1.36 – 4.02)
GRAND VIEW HOSPITAL (11847)2014 9, 129 40, 456 0.23 14 12.72 1.10 (0.60 – 1.85)2013 10, 262 41, 380 0.25 20 15.72 1.27 (0.78 – 1.96)2012 9, 450 40, 826 0.23 11 13.22 0.83 (0.41 – 1.49)2011 10, 175 42, 899 0.24 17 14.02 1.21 (0.71 – 1.94)2010 9, 484 41, 631 0.23 10 15.45 0.65 (0.31 – 1.19)
GROVE CITY MEDICAL CENTER (11722)2014 1, 352 7, 752 0.17 0 1.88 0.00 (0.00 – 1.95)2013 1, 328 7, 717 0.17 0 2.02 0.00 (0.00 – 1.82)2012 1, 258 8, 181 0.15 1 1.73 0.58 (0.01 – 3.22)2011 1, 318 7, 906 0.17 0 1.73 0.00 (0.00 – 2.12)2010 1, 319 7, 396 0.18 2 2.17 0.92 (0.10 – 3.33)
GUTHRIE TOWANDA MEMORIAL HOSPITAL (12549)2014 1, 072 4, 790 0.22 0 1.49 0.00 (0.00 – 2.46)2013 1, 289 4, 867 0.26 0 1.98 0.00 (0.00 – 1.85)2012 1, 546 6, 544 0.24 1 2.16 0.46 (0.01 – 2.57)2011 1, 399 4, 432 0.32 0 2.00 0.00 (0.00 – 1.83)2010 1, 519 4, 659 0.33 0 2.44 0.00 (0.00 – 1.50)
Continued on next page . . .
57

Table 4.3.7 – Continued from previous page
CatheterDays
PatientDays
CatheterUtilization
Rate(DUR)
Number ofObservedInfections
Number ofPredictedInfections
StandardizedInfection
Ratio(SIR)
95% ConfidenceInterval
HAHNEMANN UNIVERSITY HOSPITAL (11437)2014 13, 811 110, 786 0.12 51 27.76 1.84 (1.37 – 2.42)2013 15, 972 114, 138 0.14 29 33.21 0.87 (0.58 – 1.25)2012 15, 090 115, 028 0.13 11 27.61 0.40 (0.20 – 0.71)2011 17, 887 127, 259 0.14 23 27.73 0.83 (0.53 – 1.24)2010 18, 367 123, 052 0.15 15 32.74 0.46 (0.26 – 0.76)
HANOVER HOSPITAL (11899)2014 3, 878 26, 431 0.15 5 5.38 0.93 (0.30 – 2.17)2013 4, 689 26, 879 0.17 8 7.13 1.12 (0.48 – 2.21)2012 4, 493 24, 815 0.18 10 6.21 1.61 (0.77 – 2.96)2011 5, 509 25, 152 0.22 11 7.51 1.46 (0.73 – 2.62)2010 8, 738 26, 527 0.33 10 14.06 0.71 (0.34 – 1.31)
HEALTHSOUTH HARMARVILLE REHABILITATION HOSPITAL (11727)2014 3, 237 29, 465 0.11 7 4.47 1.56 (0.63 – 3.22)2013 3, 008 33, 138 0.09 5 4.51 1.11 (0.36 – 2.59)2012 3, 421 34, 709 0.10 6 4.59 1.31 (0.48 – 2.84)2011 3, 767 31, 608 0.12 3 4.73 0.63 (0.13 – 1.85)2010 3, 579 30, 991 0.12 10 5.97 1.67 (0.80 – 3.08)
HEALTHSOUTH NITTANY VALLEY REHABILITATION HOSPITAL (11667)2014 838 15, 946 0.05 0 1.15 0.00 (0.00 – 3.19)2013 709 15, 733 0.05 1 1.05 0.96 (0.01 – 5.32)2012 654 13, 305 0.05 3 0.85 3.53 (0.71 – 10.32)2011 472 11, 594 0.04 0 0.51 0.00 (0.00 – 7.15)2010 681 12, 452 0.05 0 1.17 0.00 (0.00 – 3.14)
HEALTHSOUTH READING REHABILITATION HOSPITAL (12139)2014 659 15, 305 0.04 0 0.90 0.00 (0.00 – 4.07)2013 430 16, 445 0.03 0 0.63 0.00 (0.00 – 5.85)2012 558 15, 333 0.04 0 0.71 0.00 (0.00 – 5.13)2011 742 15, 204 0.05 1 0.83 1.21 (0.02 – 6.73)2010 534 14, 813 0.04 0 0.93 0.00 (0.00 – 3.95)
HEALTHSOUTH REHABILITATION HOSPITAL OF ALTOONA (11903)2014 1, 192 25, 435 0.05 0 1.63 0.00 (0.00 – 2.25)2013 1, 443 25, 915 0.06 2 2.14 0.94 (0.11 – 3.38)2012 1, 421 25, 280 0.06 3 1.86 1.61 (0.32 – 4.72)2011 1, 382 23, 971 0.06 1 1.57 0.64 (0.01 – 3.53)2010 1, 517 22, 173 0.07 5 2.58 1.94 (0.62 – 4.52)
HEALTHSOUTH REHABILITATION HOSPITAL OF ERIE (11810)2014 634 17, 077 0.04 0 0.87 0.00 (0.00 – 4.24)2013 961 21, 661 0.04 0 1.42 0.00 (0.00 – 2.59)2012 766 22, 729 0.03 1 0.98 1.02 (0.01 – 5.69)2011 1, 131 25, 219 0.04 0 1.25 0.00 (0.00 – 2.95)2010 1, 203 26, 319 0.05 0 2.07 0.00 (0.00 – 1.77)
HEALTHSOUTH REHABILITATION HOSPITAL OF MECHANICSBURG (12402)2014 1, 460 18, 129 0.08 2 2.01 0.99 (0.11 – 3.59)2013 1, 412 18, 703 0.08 2 2.11 0.95 (0.11 – 3.43)2012 1, 831 18, 430 0.10 1 2.46 0.41 (0.01 – 2.26)2011 1, 866 16, 976 0.11 1 2.32 0.43 (0.01 – 2.40)2010 1, 877 17, 596 0.11 7 3.14 2.23 (0.89 – 4.59)
Continued on next page . . .
58

Table 4.3.7 – Continued from previous page
CatheterDays
PatientDays
CatheterUtilization
Rate(DUR)
Number ofObservedInfections
Number ofPredictedInfections
StandardizedInfection
Ratio(SIR)
95% ConfidenceInterval
HEALTHSOUTH REHABILITATION HOSPITAL OF SEWICKLEY (12066)2014 1, 183 13, 177 0.09 1 1.63 0.61 (0.01 – 3.41)2013 1, 066 12, 829 0.08 0 1.59 0.00 (0.00 – 2.30)2012 892 12, 014 0.07 0 1.18 0.00 (0.00 – 3.10)2011 662 11, 046 0.06 1 0.76 1.32 (0.02 – 7.34)2010 589 9, 586 0.06 2 1.01 1.99 (0.22 – 7.18)
HEALTHSOUTH REHABILITATION HOSPITAL OF YORK (12058)2014 1, 142 20, 604 0.06 4 1.57 2.55 (0.69 – 6.54)2013 1, 240 18, 833 0.07 3 1.84 1.63 (0.33 – 4.75)2012 1, 191 19, 635 0.06 4 1.56 2.56 (0.69 – 6.55)2011 1, 467 20, 041 0.07 11 1.73 6.38 (3.18 – 11.41)2010 1, 936 19, 468 0.10 6 3.25 1.85 (0.67 – 4.02)
HEART OF LANCASTER REGIONAL MEDICAL CENTER (12571)2014 1, 680 8, 575 0.20 2 3.39 0.59 (0.07 – 2.13)2013 1, 898 11, 015 0.17 3 3.96 0.76 (0.15 – 2.21)2012 1, 810 11, 050 0.16 5 3.35 1.49 (0.48 – 3.49)2011 2, 303 10, 692 0.22 5 3.78 1.32 (0.43 – 3.09)2010 2, 076 10, 276 0.20 1 3.66 0.27 (0.00 – 1.52)
HERITAGE VALLEY BEAVER (11831)2014 15, 890 77, 485 0.21 25 32.11 0.78 (0.50 – 1.15)2013 17, 004 72, 271 0.24 25 35.77 0.70 (0.45 – 1.03)2012 18, 302 79, 459 0.23 57 34.40 1.66 (1.25 – 2.15)2011 19, 749 83, 343 0.24 46 32.85 1.40 (1.03 – 1.87)2010 19, 447 86, 652 0.22 30 34.17 0.88 (0.59 – 1.25)
HERITAGE VALLEY SEWICKLEY (10375)2014 10, 157 41, 063 0.25 3 14.16 0.21 (0.04 – 0.62)2013 9, 682 41, 548 0.23 7 14.81 0.47 (0.19 – 0.97)2012 12, 154 44, 927 0.27 19 17.12 1.11 (0.67 – 1.73)2011 12, 669 46, 555 0.27 11 17.78 0.62 (0.31 – 1.11)2010 12, 829 45, 426 0.28 8 20.75 0.39 (0.17 – 0.76)
HIGHLANDS HOSPITAL (11902)2014 588 11, 762 0.05 0 0.81 0.00 (0.00 – 4.55)2013 1, 181 11, 255 0.10 0 1.78 0.00 (0.00 – 2.07)2012 939 11, 661 0.08 0 1.25 0.00 (0.00 – 2.94)2011 995 12, 457 0.08 1 1.18 0.84 (0.01 – 4.70)2010 716 12, 273 0.06 1 1.22 0.82 (0.01 – 4.55)
HOLY REDEEMER HOSPITAL (11973)2014 8, 224 56, 273 0.15 5 11.40 0.44 (0.14 – 1.02)2013 8, 119 58, 369 0.14 5 12.28 0.41 (0.13 – 0.95)2012 8, 736 60, 087 0.15 4 11.95 0.33 (0.09 – 0.86)2011 10, 123 64, 189 0.16 2 13.20 0.15 (0.02 – 0.55)2010 11, 424 64, 672 0.18 11 18.78 0.59 (0.29 – 1.05)
HOLY SPIRIT HOSPITAL (12387)2014 12, 186 61, 705 0.20 25 16.95 1.48 (0.95 – 2.18)2013 14, 769 73, 479 0.20 26 22.52 1.15 (0.75 – 1.69)2012 14, 663 72, 802 0.20 23 20.37 1.13 (0.72 – 1.69)2011 16, 655 73, 682 0.23 24 22.80 1.05 (0.67 – 1.57)2010 16, 594 71, 373 0.23 31 27.02 1.15 (0.78 – 1.63)
HOSPITAL OF FOX CHASE CANCER CENTER (12134)2014 5, 845 21, 885 0.27 11 11.85 0.93 (0.46 – 1.66)2013 5, 685 21, 559 0.26 14 11.99 1.17 (0.64 – 1.96)2012 6, 542 22, 764 0.29 23 12.43 1.85 (1.17 – 2.78)2011 6, 370 22, 367 0.28 21 10.86 1.93 (1.20 – 2.96)2010 7, 220 22, 646 0.32 13 12.53 1.04 (0.55 – 1.77)
Continued on next page . . .
59
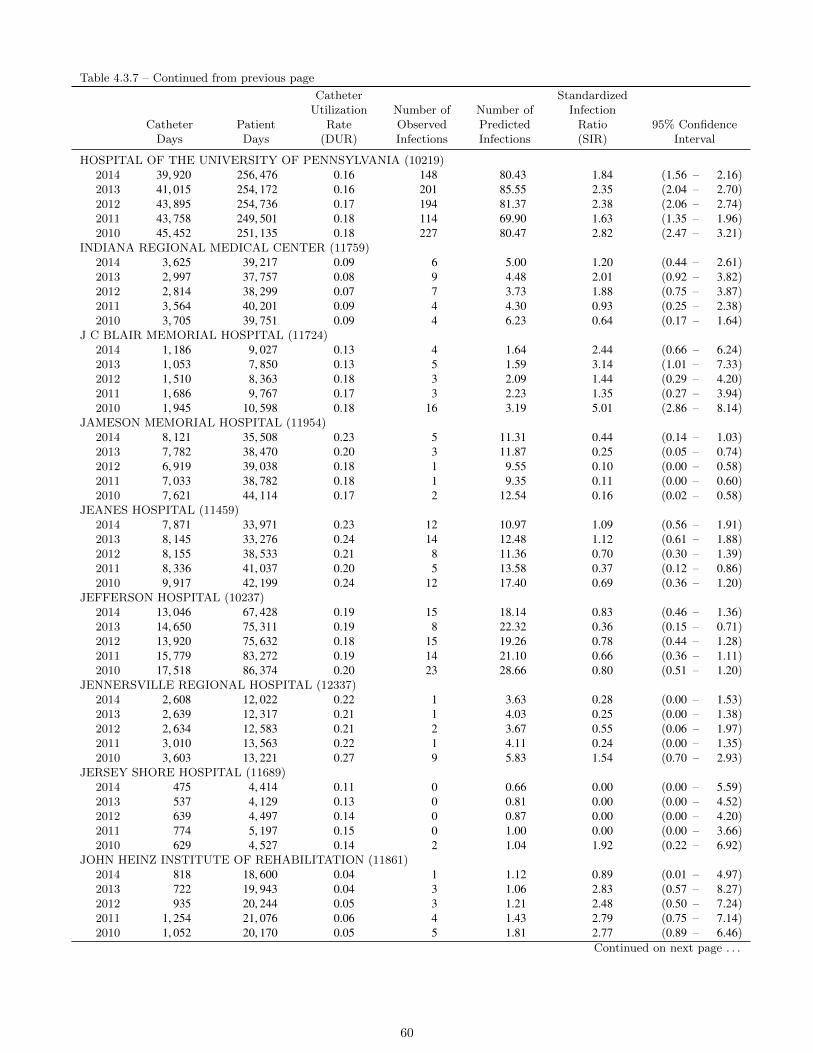
Table 4.3.7 – Continued from previous page
CatheterDays
PatientDays
CatheterUtilization
Rate(DUR)
Number ofObservedInfections
Number ofPredictedInfections
StandardizedInfection
Ratio(SIR)
95% ConfidenceInterval
HOSPITAL OF THE UNIVERSITY OF PENNSYLVANIA (10219)2014 39, 920 256, 476 0.16 148 80.43 1.84 (1.56 – 2.16)2013 41, 015 254, 172 0.16 201 85.55 2.35 (2.04 – 2.70)2012 43, 895 254, 736 0.17 194 81.37 2.38 (2.06 – 2.74)2011 43, 758 249, 501 0.18 114 69.90 1.63 (1.35 – 1.96)2010 45, 452 251, 135 0.18 227 80.47 2.82 (2.47 – 3.21)
INDIANA REGIONAL MEDICAL CENTER (11759)2014 3, 625 39, 217 0.09 6 5.00 1.20 (0.44 – 2.61)2013 2, 997 37, 757 0.08 9 4.48 2.01 (0.92 – 3.82)2012 2, 814 38, 299 0.07 7 3.73 1.88 (0.75 – 3.87)2011 3, 564 40, 201 0.09 4 4.30 0.93 (0.25 – 2.38)2010 3, 705 39, 751 0.09 4 6.23 0.64 (0.17 – 1.64)
J C BLAIR MEMORIAL HOSPITAL (11724)2014 1, 186 9, 027 0.13 4 1.64 2.44 (0.66 – 6.24)2013 1, 053 7, 850 0.13 5 1.59 3.14 (1.01 – 7.33)2012 1, 510 8, 363 0.18 3 2.09 1.44 (0.29 – 4.20)2011 1, 686 9, 767 0.17 3 2.23 1.35 (0.27 – 3.94)2010 1, 945 10, 598 0.18 16 3.19 5.01 (2.86 – 8.14)
JAMESON MEMORIAL HOSPITAL (11954)2014 8, 121 35, 508 0.23 5 11.31 0.44 (0.14 – 1.03)2013 7, 782 38, 470 0.20 3 11.87 0.25 (0.05 – 0.74)2012 6, 919 39, 038 0.18 1 9.55 0.10 (0.00 – 0.58)2011 7, 033 38, 782 0.18 1 9.35 0.11 (0.00 – 0.60)2010 7, 621 44, 114 0.17 2 12.54 0.16 (0.02 – 0.58)
JEANES HOSPITAL (11459)2014 7, 871 33, 971 0.23 12 10.97 1.09 (0.56 – 1.91)2013 8, 145 33, 276 0.24 14 12.48 1.12 (0.61 – 1.88)2012 8, 155 38, 533 0.21 8 11.36 0.70 (0.30 – 1.39)2011 8, 336 41, 037 0.20 5 13.58 0.37 (0.12 – 0.86)2010 9, 917 42, 199 0.24 12 17.40 0.69 (0.36 – 1.20)
JEFFERSON HOSPITAL (10237)2014 13, 046 67, 428 0.19 15 18.14 0.83 (0.46 – 1.36)2013 14, 650 75, 311 0.19 8 22.32 0.36 (0.15 – 0.71)2012 13, 920 75, 632 0.18 15 19.26 0.78 (0.44 – 1.28)2011 15, 779 83, 272 0.19 14 21.10 0.66 (0.36 – 1.11)2010 17, 518 86, 374 0.20 23 28.66 0.80 (0.51 – 1.20)
JENNERSVILLE REGIONAL HOSPITAL (12337)2014 2, 608 12, 022 0.22 1 3.63 0.28 (0.00 – 1.53)2013 2, 639 12, 317 0.21 1 4.03 0.25 (0.00 – 1.38)2012 2, 634 12, 583 0.21 2 3.67 0.55 (0.06 – 1.97)2011 3, 010 13, 563 0.22 1 4.11 0.24 (0.00 – 1.35)2010 3, 603 13, 221 0.27 9 5.83 1.54 (0.70 – 2.93)
JERSEY SHORE HOSPITAL (11689)2014 475 4, 414 0.11 0 0.66 0.00 (0.00 – 5.59)2013 537 4, 129 0.13 0 0.81 0.00 (0.00 – 4.52)2012 639 4, 497 0.14 0 0.87 0.00 (0.00 – 4.20)2011 774 5, 197 0.15 0 1.00 0.00 (0.00 – 3.66)2010 629 4, 527 0.14 2 1.04 1.92 (0.22 – 6.92)
JOHN HEINZ INSTITUTE OF REHABILITATION (11861)2014 818 18, 600 0.04 1 1.12 0.89 (0.01 – 4.97)2013 722 19, 943 0.04 3 1.06 2.83 (0.57 – 8.27)2012 935 20, 244 0.05 3 1.21 2.48 (0.50 – 7.24)2011 1, 254 21, 076 0.06 4 1.43 2.79 (0.75 – 7.14)2010 1, 052 20, 170 0.05 5 1.81 2.77 (0.89 – 6.46)
Continued on next page . . .
60

Table 4.3.7 – Continued from previous page
CatheterDays
PatientDays
CatheterUtilization
Rate(DUR)
Number ofObservedInfections
Number ofPredictedInfections
StandardizedInfection
Ratio(SIR)
95% ConfidenceInterval
KANE COMMUNITY HOSPITAL (12111)2014 297 3, 806 0.08 0 0.41 0.00 (0.00 – 8.97)2013 348 4, 230 0.08 0 0.52 0.00 (0.00 – 7.05)2012 462 4, 769 0.10 0 0.62 0.00 (0.00 – 5.92)2011 595 5, 398 0.11 1 0.74 1.35 (0.02 – 7.52)2010 412 4, 608 0.09 2 0.69 2.88 (0.32 – 10.41)
KENSINGTON HOSPITAL (12609)2014 163 2, 536 0.06 0 0.22 0.00 (0.00 – 16.38)2013 110 2, 421 0.05 0 0.16 0.00 (0.00 – 22.60)2012 22 2, 885 0.01 0 0.03 0.00 (0.00 – 140.21)2011 164 2, 751 0.06 0 0.19 0.00 (0.00 – 19.55)2010 256 2, 732 0.09 0 0.43 0.00 (0.00 – 8.52)
KINDRED HOSPITAL - PHILADELPHIA (11832)2014 3, 604 11, 947 0.30 17 5.04 3.38 (1.97 – 5.41)2013 4, 513 11, 096 0.41 18 6.99 2.57 (1.53 – 4.07)2012 5, 380 11, 725 0.46 31 7.77 3.99 (2.71 – 5.66)2011 7, 996 13, 457 0.59 53 12.47 4.25 (3.18 – 5.56)2010 10, 458 14, 138 0.74 54 16.35 3.30 (2.48 – 4.31)
KINDRED HOSPITAL - PITTSBURGH (12358)2014 2, 716 10, 161 0.27 5 3.79 1.32 (0.43 – 3.08)2013 3, 706 10, 270 0.36 8 5.73 1.40 (0.60 – 2.75)2012 4, 376 10, 309 0.42 15 6.30 2.38 (1.33 – 3.93)2011 5, 736 10, 214 0.56 9 8.88 1.01 (0.46 – 1.92)2010 7, 144 12, 513 0.57 9 11.27 0.80 (0.36 – 1.52)
KINDRED HOSPITAL AT HERITAGE VALLEY (12268)2014 4, 281 7, 953 0.54 8 6.02 1.33 (0.57 – 2.62)2013 5, 823 8, 223 0.71 10 9.13 1.10 (0.52 – 2.01)2012 6, 324 8, 898 0.71 5 9.33 0.54 (0.17 – 1.25)2011 6, 067 8, 765 0.69 14 9.66 1.45 (0.79 – 2.43)2010 6, 403 8, 815 0.73 7 10.02 0.70 (0.28 – 1.44)
KINDRED HOSPITAL PHILADELPHIA-HAVERTOWN (12908)2014 4, 929 13, 913 0.35 4 6.90 0.58 (0.16 – 1.48)2013 5, 735 14, 732 0.39 6 8.87 0.68 (0.25 – 1.47)2012 5, 393 15, 040 0.36 16 7.70 2.08 (1.19 – 3.37)2011 5, 350 12, 225 0.44 10 8.01 1.25 (0.60 – 2.30)2010 7, 456 12, 095 0.62 13 11.73 1.11 (0.59 – 1.89)
KINDRED HOSPITAL SOUTH PHILADELPHIA (11940)2014 3, 607 12, 158 0.30 3 5.04 0.60 (0.12 – 1.74)2013 3, 481 10, 174 0.34 10 5.37 1.86 (0.89 – 3.42)2012 3, 206 9, 100 0.35 5 4.57 1.09 (0.35 – 2.55)2011 2, 544 6, 625 0.38 9 3.74 2.41 (1.10 – 4.57)2010 3, 827 7, 458 0.51 19 6.06 3.13 (1.89 – 4.90)
LANCASTER GENERAL HOSPITAL (10183)2014 21, 985 151, 559 0.15 26 30.47 0.85 (0.56 – 1.25)2013 22, 958 144, 167 0.16 18 34.83 0.52 (0.31 – 0.82)2012 25, 382 153, 050 0.17 18 34.94 0.52 (0.31 – 0.81)2011 30, 406 161, 796 0.19 33 40.61 0.81 (0.56 – 1.14)2010 28, 830 153, 609 0.19 25 47.30 0.53 (0.34 – 0.78)
LANCASTER REGIONAL MEDICAL CENTER (12335)2014 4, 327 25, 054 0.17 0 6.01 0.00 (0.00 – 0.61)2013 4, 287 26, 814 0.16 5 6.50 0.77 (0.25 – 1.79)2012 4, 674 28, 382 0.16 7 6.43 1.09 (0.44 – 2.24)2011 4, 262 28, 792 0.15 13 5.51 2.36 (1.25 – 4.03)2010 3, 743 28, 064 0.13 2 6.22 0.32 (0.04 – 1.16)
Continued on next page . . .
61
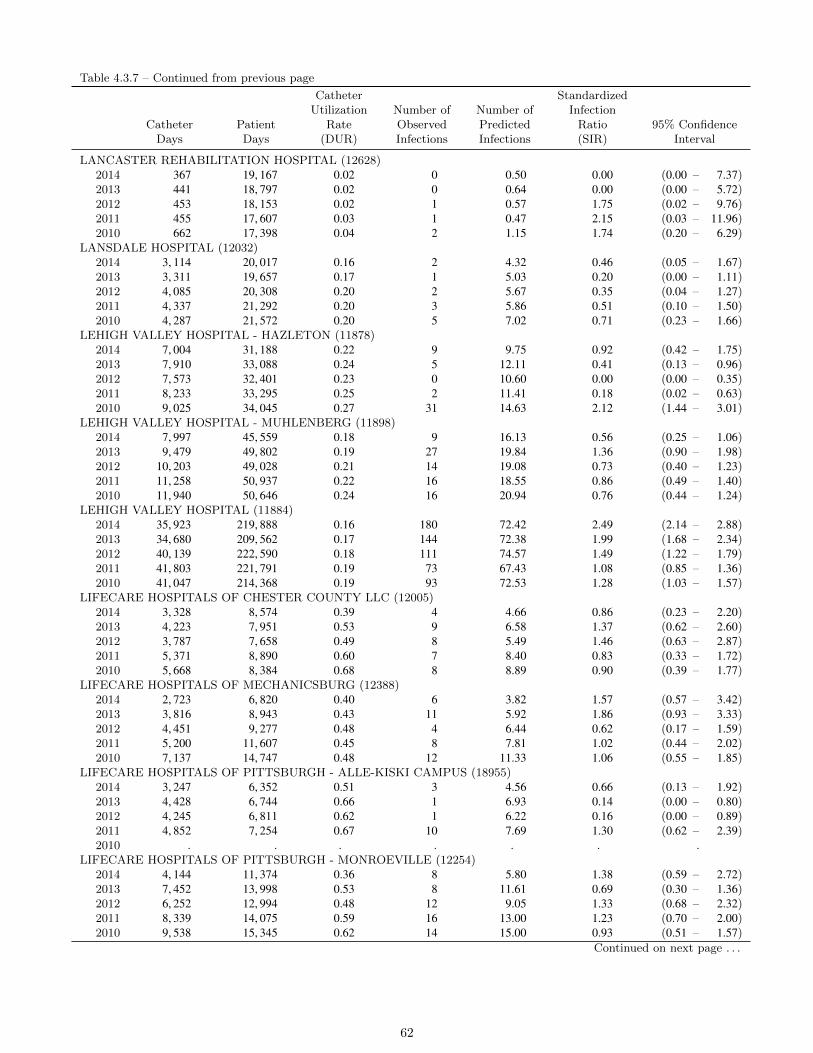
Table 4.3.7 – Continued from previous page
CatheterDays
PatientDays
CatheterUtilization
Rate(DUR)
Number ofObservedInfections
Number ofPredictedInfections
StandardizedInfection
Ratio(SIR)
95% ConfidenceInterval
LANCASTER REHABILITATION HOSPITAL (12628)2014 367 19, 167 0.02 0 0.50 0.00 (0.00 – 7.37)2013 441 18, 797 0.02 0 0.64 0.00 (0.00 – 5.72)2012 453 18, 153 0.02 1 0.57 1.75 (0.02 – 9.76)2011 455 17, 607 0.03 1 0.47 2.15 (0.03 – 11.96)2010 662 17, 398 0.04 2 1.15 1.74 (0.20 – 6.29)
LANSDALE HOSPITAL (12032)2014 3, 114 20, 017 0.16 2 4.32 0.46 (0.05 – 1.67)2013 3, 311 19, 657 0.17 1 5.03 0.20 (0.00 – 1.11)2012 4, 085 20, 308 0.20 2 5.67 0.35 (0.04 – 1.27)2011 4, 337 21, 292 0.20 3 5.86 0.51 (0.10 – 1.50)2010 4, 287 21, 572 0.20 5 7.02 0.71 (0.23 – 1.66)
LEHIGH VALLEY HOSPITAL - HAZLETON (11878)2014 7, 004 31, 188 0.22 9 9.75 0.92 (0.42 – 1.75)2013 7, 910 33, 088 0.24 5 12.11 0.41 (0.13 – 0.96)2012 7, 573 32, 401 0.23 0 10.60 0.00 (0.00 – 0.35)2011 8, 233 33, 295 0.25 2 11.41 0.18 (0.02 – 0.63)2010 9, 025 34, 045 0.27 31 14.63 2.12 (1.44 – 3.01)
LEHIGH VALLEY HOSPITAL - MUHLENBERG (11898)2014 7, 997 45, 559 0.18 9 16.13 0.56 (0.25 – 1.06)2013 9, 479 49, 802 0.19 27 19.84 1.36 (0.90 – 1.98)2012 10, 203 49, 028 0.21 14 19.08 0.73 (0.40 – 1.23)2011 11, 258 50, 937 0.22 16 18.55 0.86 (0.49 – 1.40)2010 11, 940 50, 646 0.24 16 20.94 0.76 (0.44 – 1.24)
LEHIGH VALLEY HOSPITAL (11884)2014 35, 923 219, 888 0.16 180 72.42 2.49 (2.14 – 2.88)2013 34, 680 209, 562 0.17 144 72.38 1.99 (1.68 – 2.34)2012 40, 139 222, 590 0.18 111 74.57 1.49 (1.22 – 1.79)2011 41, 803 221, 791 0.19 73 67.43 1.08 (0.85 – 1.36)2010 41, 047 214, 368 0.19 93 72.53 1.28 (1.03 – 1.57)
LIFECARE HOSPITALS OF CHESTER COUNTY LLC (12005)2014 3, 328 8, 574 0.39 4 4.66 0.86 (0.23 – 2.20)2013 4, 223 7, 951 0.53 9 6.58 1.37 (0.62 – 2.60)2012 3, 787 7, 658 0.49 8 5.49 1.46 (0.63 – 2.87)2011 5, 371 8, 890 0.60 7 8.40 0.83 (0.33 – 1.72)2010 5, 668 8, 384 0.68 8 8.89 0.90 (0.39 – 1.77)
LIFECARE HOSPITALS OF MECHANICSBURG (12388)2014 2, 723 6, 820 0.40 6 3.82 1.57 (0.57 – 3.42)2013 3, 816 8, 943 0.43 11 5.92 1.86 (0.93 – 3.33)2012 4, 451 9, 277 0.48 4 6.44 0.62 (0.17 – 1.59)2011 5, 200 11, 607 0.45 8 7.81 1.02 (0.44 – 2.02)2010 7, 137 14, 747 0.48 12 11.33 1.06 (0.55 – 1.85)
LIFECARE HOSPITALS OF PITTSBURGH - ALLE-KISKI CAMPUS (18955)2014 3, 247 6, 352 0.51 3 4.56 0.66 (0.13 – 1.92)2013 4, 428 6, 744 0.66 1 6.93 0.14 (0.00 – 0.80)2012 4, 245 6, 811 0.62 1 6.22 0.16 (0.00 – 0.89)2011 4, 852 7, 254 0.67 10 7.69 1.30 (0.62 – 2.39)2010 . . . . . . .
LIFECARE HOSPITALS OF PITTSBURGH - MONROEVILLE (12254)2014 4, 144 11, 374 0.36 8 5.80 1.38 (0.59 – 2.72)2013 7, 452 13, 998 0.53 8 11.61 0.69 (0.30 – 1.36)2012 6, 252 12, 994 0.48 12 9.05 1.33 (0.68 – 2.32)2011 8, 339 14, 075 0.59 16 13.00 1.23 (0.70 – 2.00)2010 9, 538 15, 345 0.62 14 15.00 0.93 (0.51 – 1.57)
Continued on next page . . .
62
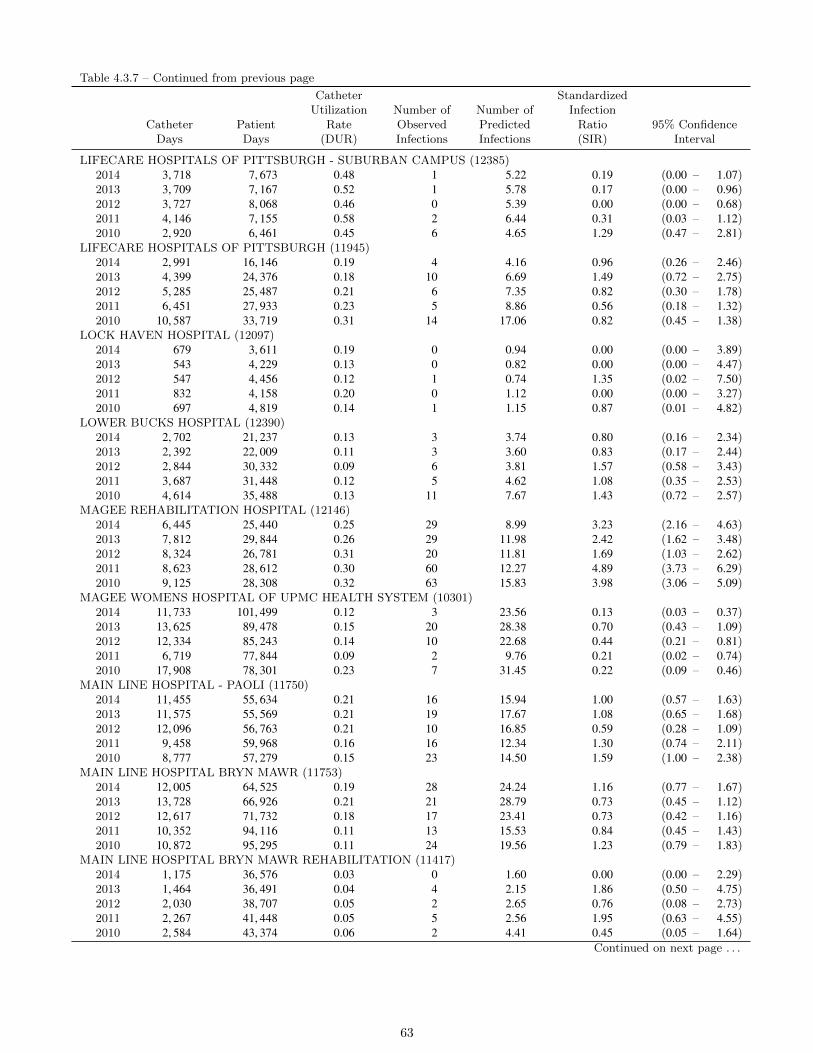
Table 4.3.7 – Continued from previous page
CatheterDays
PatientDays
CatheterUtilization
Rate(DUR)
Number ofObservedInfections
Number ofPredictedInfections
StandardizedInfection
Ratio(SIR)
95% ConfidenceInterval
LIFECARE HOSPITALS OF PITTSBURGH - SUBURBAN CAMPUS (12385)2014 3, 718 7, 673 0.48 1 5.22 0.19 (0.00 – 1.07)2013 3, 709 7, 167 0.52 1 5.78 0.17 (0.00 – 0.96)2012 3, 727 8, 068 0.46 0 5.39 0.00 (0.00 – 0.68)2011 4, 146 7, 155 0.58 2 6.44 0.31 (0.03 – 1.12)2010 2, 920 6, 461 0.45 6 4.65 1.29 (0.47 – 2.81)
LIFECARE HOSPITALS OF PITTSBURGH (11945)2014 2, 991 16, 146 0.19 4 4.16 0.96 (0.26 – 2.46)2013 4, 399 24, 376 0.18 10 6.69 1.49 (0.72 – 2.75)2012 5, 285 25, 487 0.21 6 7.35 0.82 (0.30 – 1.78)2011 6, 451 27, 933 0.23 5 8.86 0.56 (0.18 – 1.32)2010 10, 587 33, 719 0.31 14 17.06 0.82 (0.45 – 1.38)
LOCK HAVEN HOSPITAL (12097)2014 679 3, 611 0.19 0 0.94 0.00 (0.00 – 3.89)2013 543 4, 229 0.13 0 0.82 0.00 (0.00 – 4.47)2012 547 4, 456 0.12 1 0.74 1.35 (0.02 – 7.50)2011 832 4, 158 0.20 0 1.12 0.00 (0.00 – 3.27)2010 697 4, 819 0.14 1 1.15 0.87 (0.01 – 4.82)
LOWER BUCKS HOSPITAL (12390)2014 2, 702 21, 237 0.13 3 3.74 0.80 (0.16 – 2.34)2013 2, 392 22, 009 0.11 3 3.60 0.83 (0.17 – 2.44)2012 2, 844 30, 332 0.09 6 3.81 1.57 (0.58 – 3.43)2011 3, 687 31, 448 0.12 5 4.62 1.08 (0.35 – 2.53)2010 4, 614 35, 488 0.13 11 7.67 1.43 (0.72 – 2.57)
MAGEE REHABILITATION HOSPITAL (12146)2014 6, 445 25, 440 0.25 29 8.99 3.23 (2.16 – 4.63)2013 7, 812 29, 844 0.26 29 11.98 2.42 (1.62 – 3.48)2012 8, 324 26, 781 0.31 20 11.81 1.69 (1.03 – 2.62)2011 8, 623 28, 612 0.30 60 12.27 4.89 (3.73 – 6.29)2010 9, 125 28, 308 0.32 63 15.83 3.98 (3.06 – 5.09)
MAGEE WOMENS HOSPITAL OF UPMC HEALTH SYSTEM (10301)2014 11, 733 101, 499 0.12 3 23.56 0.13 (0.03 – 0.37)2013 13, 625 89, 478 0.15 20 28.38 0.70 (0.43 – 1.09)2012 12, 334 85, 243 0.14 10 22.68 0.44 (0.21 – 0.81)2011 6, 719 77, 844 0.09 2 9.76 0.21 (0.02 – 0.74)2010 17, 908 78, 301 0.23 7 31.45 0.22 (0.09 – 0.46)
MAIN LINE HOSPITAL - PAOLI (11750)2014 11, 455 55, 634 0.21 16 15.94 1.00 (0.57 – 1.63)2013 11, 575 55, 569 0.21 19 17.67 1.08 (0.65 – 1.68)2012 12, 096 56, 763 0.21 10 16.85 0.59 (0.28 – 1.09)2011 9, 458 59, 968 0.16 16 12.34 1.30 (0.74 – 2.11)2010 8, 777 57, 279 0.15 23 14.50 1.59 (1.00 – 2.38)
MAIN LINE HOSPITAL BRYN MAWR (11753)2014 12, 005 64, 525 0.19 28 24.24 1.16 (0.77 – 1.67)2013 13, 728 66, 926 0.21 21 28.79 0.73 (0.45 – 1.12)2012 12, 617 71, 732 0.18 17 23.41 0.73 (0.42 – 1.16)2011 10, 352 94, 116 0.11 13 15.53 0.84 (0.45 – 1.43)2010 10, 872 95, 295 0.11 24 19.56 1.23 (0.79 – 1.83)
MAIN LINE HOSPITAL BRYN MAWR REHABILITATION (11417)2014 1, 175 36, 576 0.03 0 1.60 0.00 (0.00 – 2.29)2013 1, 464 36, 491 0.04 4 2.15 1.86 (0.50 – 4.75)2012 2, 030 38, 707 0.05 2 2.65 0.76 (0.08 – 2.73)2011 2, 267 41, 448 0.05 5 2.56 1.95 (0.63 – 4.55)2010 2, 584 43, 374 0.06 2 4.41 0.45 (0.05 – 1.64)
Continued on next page . . .
63

Table 4.3.7 – Continued from previous page
CatheterDays
PatientDays
CatheterUtilization
Rate(DUR)
Number ofObservedInfections
Number ofPredictedInfections
StandardizedInfection
Ratio(SIR)
95% ConfidenceInterval
MAIN LINE HOSPITAL LANKENAU MEDICAL CENTER (11770)2014 18, 194 82, 286 0.22 24 36.80 0.65 (0.42 – 0.97)2013 18, 203 79, 001 0.23 17 38.27 0.44 (0.26 – 0.71)2012 17, 383 76, 127 0.23 32 32.66 0.98 (0.67 – 1.38)2011 15, 890 85, 861 0.19 23 25.57 0.90 (0.57 – 1.35)2010 16, 369 90, 598 0.18 29 28.98 1.00 (0.67 – 1.44)
MEADVILLE MEDICAL CENTER (11583)2014 5, 820 36, 576 0.16 11 11.73 0.94 (0.47 – 1.68)2013 5, 697 36, 306 0.16 10 11.88 0.84 (0.40 – 1.55)2012 5, 391 35, 113 0.15 6 9.94 0.60 (0.22 – 1.31)2011 6, 276 36, 634 0.17 6 9.99 0.60 (0.22 – 1.31)2010 5, 475 36, 711 0.15 9 9.76 0.92 (0.42 – 1.75)
MEMORIAL HOSPITAL (11633)2014 2, 321 18, 203 0.13 4 4.67 0.86 (0.23 – 2.19)2013 3, 504 25, 113 0.14 11 7.29 1.51 (0.75 – 2.70)2012 5, 260 22, 194 0.24 22 9.90 2.22 (1.39 – 3.36)2011 5, 986 23, 341 0.26 17 10.06 1.69 (0.98 – 2.70)2010 5, 968 22, 073 0.27 16 10.42 1.54 (0.88 – 2.49)
MERCY FITZGERALD HOSPITAL (11683)2014 3, 798 40, 953 0.09 16 7.61 2.10 (1.20 – 3.42)2013 5, 281 42, 258 0.12 14 10.95 1.28 (0.70 – 2.14)2012 5, 801 45, 719 0.13 8 10.60 0.75 (0.33 – 1.49)2011 8, 307 47, 715 0.17 10 13.26 0.75 (0.36 – 1.39)2010 9, 510 50, 205 0.19 17 16.81 1.01 (0.59 – 1.62)
MERCY PHILADELPHIA HOSPITAL (11946)2014 3, 938 37, 345 0.11 2 7.90 0.25 (0.03 – 0.91)2013 4, 889 38, 617 0.13 1 10.14 0.10 (0.00 – 0.55)2012 5, 405 40, 012 0.14 2 9.90 0.20 (0.02 – 0.73)2011 7, 119 43, 434 0.16 0 11.27 0.00 (0.00 – 0.33)2010 7, 664 47, 304 0.16 1 13.62 0.07 (0.00 – 0.41)
MERCY SUBURBAN HOSPITAL (11952)2014 6, 941 20, 009 0.35 2 14.11 0.14 (0.02 – 0.51)2013 6, 106 23, 128 0.26 1 12.88 0.08 (0.00 – 0.43)2012 5, 920 26, 003 0.23 6 11.12 0.54 (0.20 – 1.17)2011 7, 552 28, 748 0.26 7 12.74 0.55 (0.22 – 1.13)2010 7, 919 30, 578 0.26 5 13.85 0.36 (0.12 – 0.84)
MILLCREEK COMMUNITY HOSPITAL (12253)2014 2, 268 28, 656 0.08 3 4.54 0.66 (0.13 – 1.93)2013 2, 003 24, 378 0.08 2 4.12 0.49 (0.05 – 1.75)2012 1, 906 22, 098 0.09 3 3.42 0.88 (0.18 – 2.56)2011 1, 861 20, 062 0.09 2 2.73 0.73 (0.08 – 2.65)2010 1, 860 21, 824 0.09 2 3.38 0.59 (0.07 – 2.14)
MILTON S HERSHEY MEDICAL CENTER (11747)2014 22, 933 155, 105 0.15 32 46.18 0.69 (0.47 – 0.98)2013 27, 073 149, 054 0.18 60 56.62 1.06 (0.81 – 1.36)2012 29, 492 143, 148 0.21 104 55.14 1.89 (1.54 – 2.29)2011 32, 053 144, 466 0.22 96 52.85 1.82 (1.47 – 2.22)2010 32, 819 144, 877 0.23 93 57.65 1.61 (1.30 – 1.98)
MONONGAHELA VALLEY HOSPITAL (11069)2014 5, 060 48, 793 0.10 11 6.99 1.57 (0.78 – 2.82)2013 5, 005 49, 805 0.10 7 7.52 0.93 (0.37 – 1.92)2012 4, 814 48, 871 0.10 6 6.46 0.93 (0.34 – 2.02)2011 5, 503 51, 094 0.11 11 6.82 1.61 (0.80 – 2.89)2010 6, 161 53, 137 0.12 13 10.28 1.26 (0.67 – 2.16)
Continued on next page . . .
64
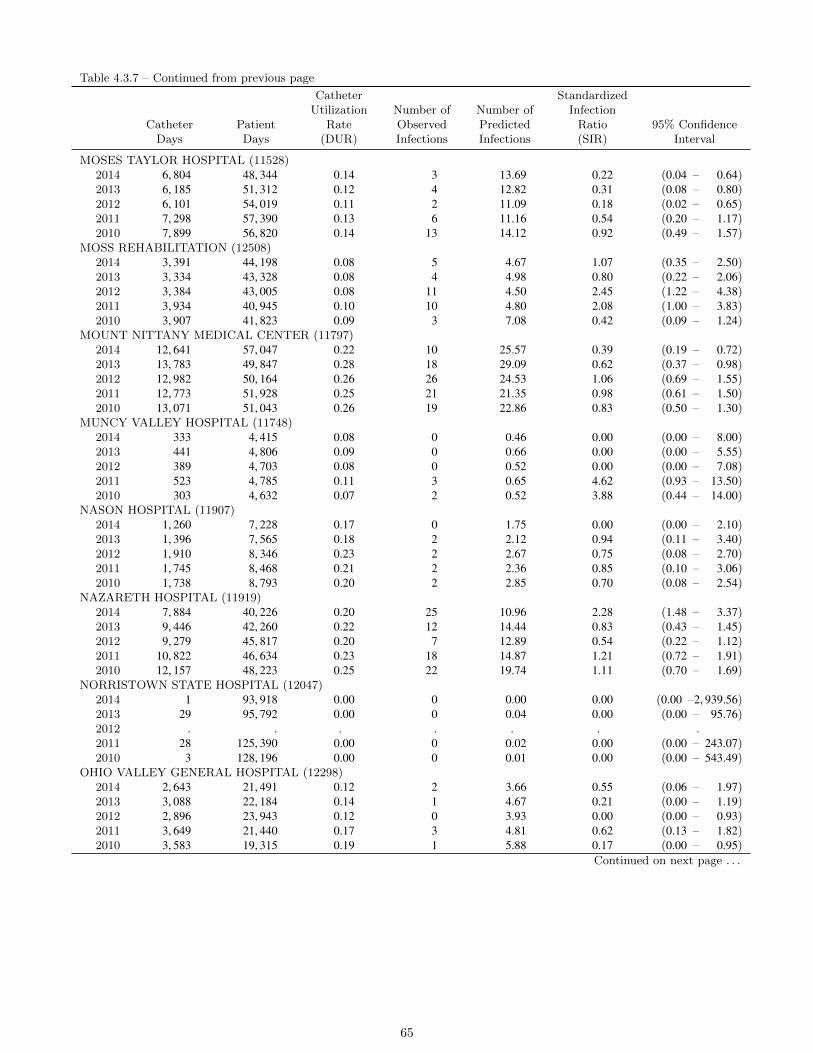
Table 4.3.7 – Continued from previous page
CatheterDays
PatientDays
CatheterUtilization
Rate(DUR)
Number ofObservedInfections
Number ofPredictedInfections
StandardizedInfection
Ratio(SIR)
95% ConfidenceInterval
MOSES TAYLOR HOSPITAL (11528)2014 6, 804 48, 344 0.14 3 13.69 0.22 (0.04 – 0.64)2013 6, 185 51, 312 0.12 4 12.82 0.31 (0.08 – 0.80)2012 6, 101 54, 019 0.11 2 11.09 0.18 (0.02 – 0.65)2011 7, 298 57, 390 0.13 6 11.16 0.54 (0.20 – 1.17)2010 7, 899 56, 820 0.14 13 14.12 0.92 (0.49 – 1.57)
MOSS REHABILITATION (12508)2014 3, 391 44, 198 0.08 5 4.67 1.07 (0.35 – 2.50)2013 3, 334 43, 328 0.08 4 4.98 0.80 (0.22 – 2.06)2012 3, 384 43, 005 0.08 11 4.50 2.45 (1.22 – 4.38)2011 3, 934 40, 945 0.10 10 4.80 2.08 (1.00 – 3.83)2010 3, 907 41, 823 0.09 3 7.08 0.42 (0.09 – 1.24)
MOUNT NITTANY MEDICAL CENTER (11797)2014 12, 641 57, 047 0.22 10 25.57 0.39 (0.19 – 0.72)2013 13, 783 49, 847 0.28 18 29.09 0.62 (0.37 – 0.98)2012 12, 982 50, 164 0.26 26 24.53 1.06 (0.69 – 1.55)2011 12, 773 51, 928 0.25 21 21.35 0.98 (0.61 – 1.50)2010 13, 071 51, 043 0.26 19 22.86 0.83 (0.50 – 1.30)
MUNCY VALLEY HOSPITAL (11748)2014 333 4, 415 0.08 0 0.46 0.00 (0.00 – 8.00)2013 441 4, 806 0.09 0 0.66 0.00 (0.00 – 5.55)2012 389 4, 703 0.08 0 0.52 0.00 (0.00 – 7.08)2011 523 4, 785 0.11 3 0.65 4.62 (0.93 – 13.50)2010 303 4, 632 0.07 2 0.52 3.88 (0.44 – 14.00)
NASON HOSPITAL (11907)2014 1, 260 7, 228 0.17 0 1.75 0.00 (0.00 – 2.10)2013 1, 396 7, 565 0.18 2 2.12 0.94 (0.11 – 3.40)2012 1, 910 8, 346 0.23 2 2.67 0.75 (0.08 – 2.70)2011 1, 745 8, 468 0.21 2 2.36 0.85 (0.10 – 3.06)2010 1, 738 8, 793 0.20 2 2.85 0.70 (0.08 – 2.54)
NAZARETH HOSPITAL (11919)2014 7, 884 40, 226 0.20 25 10.96 2.28 (1.48 – 3.37)2013 9, 446 42, 260 0.22 12 14.44 0.83 (0.43 – 1.45)2012 9, 279 45, 817 0.20 7 12.89 0.54 (0.22 – 1.12)2011 10, 822 46, 634 0.23 18 14.87 1.21 (0.72 – 1.91)2010 12, 157 48, 223 0.25 22 19.74 1.11 (0.70 – 1.69)
NORRISTOWN STATE HOSPITAL (12047)2014 1 93, 918 0.00 0 0.00 0.00 (0.00 –2, 939.56)2013 29 95, 792 0.00 0 0.04 0.00 (0.00 – 95.76)2012 . . . . . . .2011 28 125, 390 0.00 0 0.02 0.00 (0.00 – 243.07)2010 3 128, 196 0.00 0 0.01 0.00 (0.00 – 543.49)
OHIO VALLEY GENERAL HOSPITAL (12298)2014 2, 643 21, 491 0.12 2 3.66 0.55 (0.06 – 1.97)2013 3, 088 22, 184 0.14 1 4.67 0.21 (0.00 – 1.19)2012 2, 896 23, 943 0.12 0 3.93 0.00 (0.00 – 0.93)2011 3, 649 21, 440 0.17 3 4.81 0.62 (0.13 – 1.82)2010 3, 583 19, 315 0.19 1 5.88 0.17 (0.00 – 0.95)
Continued on next page . . .
65
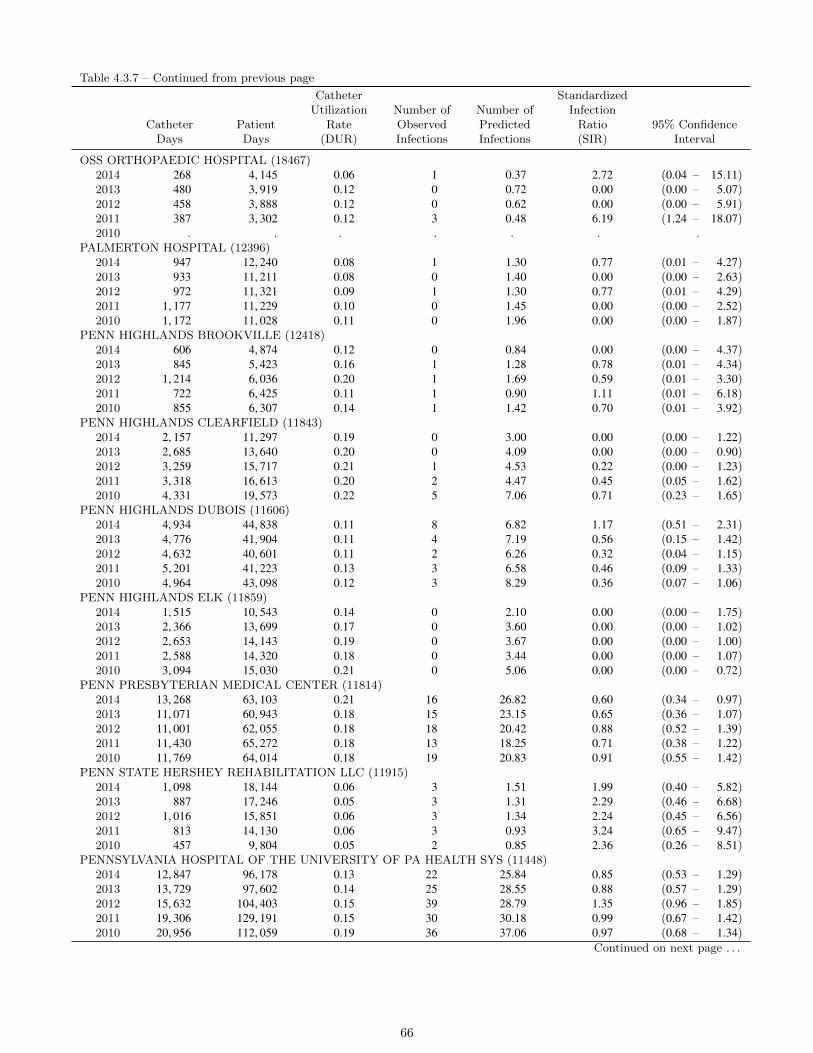
Table 4.3.7 – Continued from previous page
CatheterDays
PatientDays
CatheterUtilization
Rate(DUR)
Number ofObservedInfections
Number ofPredictedInfections
StandardizedInfection
Ratio(SIR)
95% ConfidenceInterval
OSS ORTHOPAEDIC HOSPITAL (18467)2014 268 4, 145 0.06 1 0.37 2.72 (0.04 – 15.11)2013 480 3, 919 0.12 0 0.72 0.00 (0.00 – 5.07)2012 458 3, 888 0.12 0 0.62 0.00 (0.00 – 5.91)2011 387 3, 302 0.12 3 0.48 6.19 (1.24 – 18.07)2010 . . . . . . .
PALMERTON HOSPITAL (12396)2014 947 12, 240 0.08 1 1.30 0.77 (0.01 – 4.27)2013 933 11, 211 0.08 0 1.40 0.00 (0.00 – 2.63)2012 972 11, 321 0.09 1 1.30 0.77 (0.01 – 4.29)2011 1, 177 11, 229 0.10 0 1.45 0.00 (0.00 – 2.52)2010 1, 172 11, 028 0.11 0 1.96 0.00 (0.00 – 1.87)
PENN HIGHLANDS BROOKVILLE (12418)2014 606 4, 874 0.12 0 0.84 0.00 (0.00 – 4.37)2013 845 5, 423 0.16 1 1.28 0.78 (0.01 – 4.34)2012 1, 214 6, 036 0.20 1 1.69 0.59 (0.01 – 3.30)2011 722 6, 425 0.11 1 0.90 1.11 (0.01 – 6.18)2010 855 6, 307 0.14 1 1.42 0.70 (0.01 – 3.92)
PENN HIGHLANDS CLEARFIELD (11843)2014 2, 157 11, 297 0.19 0 3.00 0.00 (0.00 – 1.22)2013 2, 685 13, 640 0.20 0 4.09 0.00 (0.00 – 0.90)2012 3, 259 15, 717 0.21 1 4.53 0.22 (0.00 – 1.23)2011 3, 318 16, 613 0.20 2 4.47 0.45 (0.05 – 1.62)2010 4, 331 19, 573 0.22 5 7.06 0.71 (0.23 – 1.65)
PENN HIGHLANDS DUBOIS (11606)2014 4, 934 44, 838 0.11 8 6.82 1.17 (0.51 – 2.31)2013 4, 776 41, 904 0.11 4 7.19 0.56 (0.15 – 1.42)2012 4, 632 40, 601 0.11 2 6.26 0.32 (0.04 – 1.15)2011 5, 201 41, 223 0.13 3 6.58 0.46 (0.09 – 1.33)2010 4, 964 43, 098 0.12 3 8.29 0.36 (0.07 – 1.06)
PENN HIGHLANDS ELK (11859)2014 1, 515 10, 543 0.14 0 2.10 0.00 (0.00 – 1.75)2013 2, 366 13, 699 0.17 0 3.60 0.00 (0.00 – 1.02)2012 2, 653 14, 143 0.19 0 3.67 0.00 (0.00 – 1.00)2011 2, 588 14, 320 0.18 0 3.44 0.00 (0.00 – 1.07)2010 3, 094 15, 030 0.21 0 5.06 0.00 (0.00 – 0.72)
PENN PRESBYTERIAN MEDICAL CENTER (11814)2014 13, 268 63, 103 0.21 16 26.82 0.60 (0.34 – 0.97)2013 11, 071 60, 943 0.18 15 23.15 0.65 (0.36 – 1.07)2012 11, 001 62, 055 0.18 18 20.42 0.88 (0.52 – 1.39)2011 11, 430 65, 272 0.18 13 18.25 0.71 (0.38 – 1.22)2010 11, 769 64, 014 0.18 19 20.83 0.91 (0.55 – 1.42)
PENN STATE HERSHEY REHABILITATION LLC (11915)2014 1, 098 18, 144 0.06 3 1.51 1.99 (0.40 – 5.82)2013 887 17, 246 0.05 3 1.31 2.29 (0.46 – 6.68)2012 1, 016 15, 851 0.06 3 1.34 2.24 (0.45 – 6.56)2011 813 14, 130 0.06 3 0.93 3.24 (0.65 – 9.47)2010 457 9, 804 0.05 2 0.85 2.36 (0.26 – 8.51)
PENNSYLVANIA HOSPITAL OF THE UNIVERSITY OF PA HEALTH SYS (11448)2014 12, 847 96, 178 0.13 22 25.84 0.85 (0.53 – 1.29)2013 13, 729 97, 602 0.14 25 28.55 0.88 (0.57 – 1.29)2012 15, 632 104, 403 0.15 39 28.79 1.35 (0.96 – 1.85)2011 19, 306 129, 191 0.15 30 30.18 0.99 (0.67 – 1.42)2010 20, 956 112, 059 0.19 36 37.06 0.97 (0.68 – 1.34)
Continued on next page . . .
66
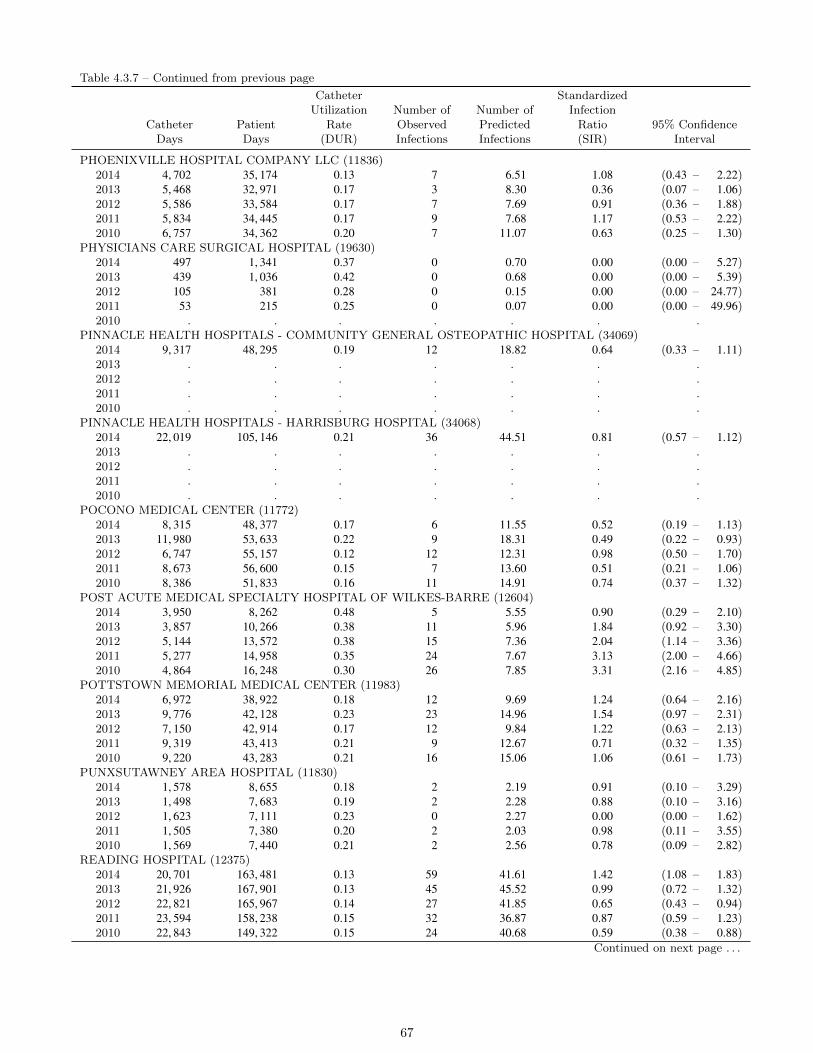
Table 4.3.7 – Continued from previous page
CatheterDays
PatientDays
CatheterUtilization
Rate(DUR)
Number ofObservedInfections
Number ofPredictedInfections
StandardizedInfection
Ratio(SIR)
95% ConfidenceInterval
PHOENIXVILLE HOSPITAL COMPANY LLC (11836)2014 4, 702 35, 174 0.13 7 6.51 1.08 (0.43 – 2.22)2013 5, 468 32, 971 0.17 3 8.30 0.36 (0.07 – 1.06)2012 5, 586 33, 584 0.17 7 7.69 0.91 (0.36 – 1.88)2011 5, 834 34, 445 0.17 9 7.68 1.17 (0.53 – 2.22)2010 6, 757 34, 362 0.20 7 11.07 0.63 (0.25 – 1.30)
PHYSICIANS CARE SURGICAL HOSPITAL (19630)2014 497 1, 341 0.37 0 0.70 0.00 (0.00 – 5.27)2013 439 1, 036 0.42 0 0.68 0.00 (0.00 – 5.39)2012 105 381 0.28 0 0.15 0.00 (0.00 – 24.77)2011 53 215 0.25 0 0.07 0.00 (0.00 – 49.96)2010 . . . . . . .
PINNACLE HEALTH HOSPITALS - COMMUNITY GENERAL OSTEOPATHIC HOSPITAL (34069)2014 9, 317 48, 295 0.19 12 18.82 0.64 (0.33 – 1.11)2013 . . . . . . .2012 . . . . . . .2011 . . . . . . .2010 . . . . . . .
PINNACLE HEALTH HOSPITALS - HARRISBURG HOSPITAL (34068)2014 22, 019 105, 146 0.21 36 44.51 0.81 (0.57 – 1.12)2013 . . . . . . .2012 . . . . . . .2011 . . . . . . .2010 . . . . . . .
POCONO MEDICAL CENTER (11772)2014 8, 315 48, 377 0.17 6 11.55 0.52 (0.19 – 1.13)2013 11, 980 53, 633 0.22 9 18.31 0.49 (0.22 – 0.93)2012 6, 747 55, 157 0.12 12 12.31 0.98 (0.50 – 1.70)2011 8, 673 56, 600 0.15 7 13.60 0.51 (0.21 – 1.06)2010 8, 386 51, 833 0.16 11 14.91 0.74 (0.37 – 1.32)
POST ACUTE MEDICAL SPECIALTY HOSPITAL OF WILKES-BARRE (12604)2014 3, 950 8, 262 0.48 5 5.55 0.90 (0.29 – 2.10)2013 3, 857 10, 266 0.38 11 5.96 1.84 (0.92 – 3.30)2012 5, 144 13, 572 0.38 15 7.36 2.04 (1.14 – 3.36)2011 5, 277 14, 958 0.35 24 7.67 3.13 (2.00 – 4.66)2010 4, 864 16, 248 0.30 26 7.85 3.31 (2.16 – 4.85)
POTTSTOWN MEMORIAL MEDICAL CENTER (11983)2014 6, 972 38, 922 0.18 12 9.69 1.24 (0.64 – 2.16)2013 9, 776 42, 128 0.23 23 14.96 1.54 (0.97 – 2.31)2012 7, 150 42, 914 0.17 12 9.84 1.22 (0.63 – 2.13)2011 9, 319 43, 413 0.21 9 12.67 0.71 (0.32 – 1.35)2010 9, 220 43, 283 0.21 16 15.06 1.06 (0.61 – 1.73)
PUNXSUTAWNEY AREA HOSPITAL (11830)2014 1, 578 8, 655 0.18 2 2.19 0.91 (0.10 – 3.29)2013 1, 498 7, 683 0.19 2 2.28 0.88 (0.10 – 3.16)2012 1, 623 7, 111 0.23 0 2.27 0.00 (0.00 – 1.62)2011 1, 505 7, 380 0.20 2 2.03 0.98 (0.11 – 3.55)2010 1, 569 7, 440 0.21 2 2.56 0.78 (0.09 – 2.82)
READING HOSPITAL (12375)2014 20, 701 163, 481 0.13 59 41.61 1.42 (1.08 – 1.83)2013 21, 926 167, 901 0.13 45 45.52 0.99 (0.72 – 1.32)2012 22, 821 165, 967 0.14 27 41.85 0.65 (0.43 – 0.94)2011 23, 594 158, 238 0.15 32 36.87 0.87 (0.59 – 1.23)2010 22, 843 149, 322 0.15 24 40.68 0.59 (0.38 – 0.88)
Continued on next page . . .
67
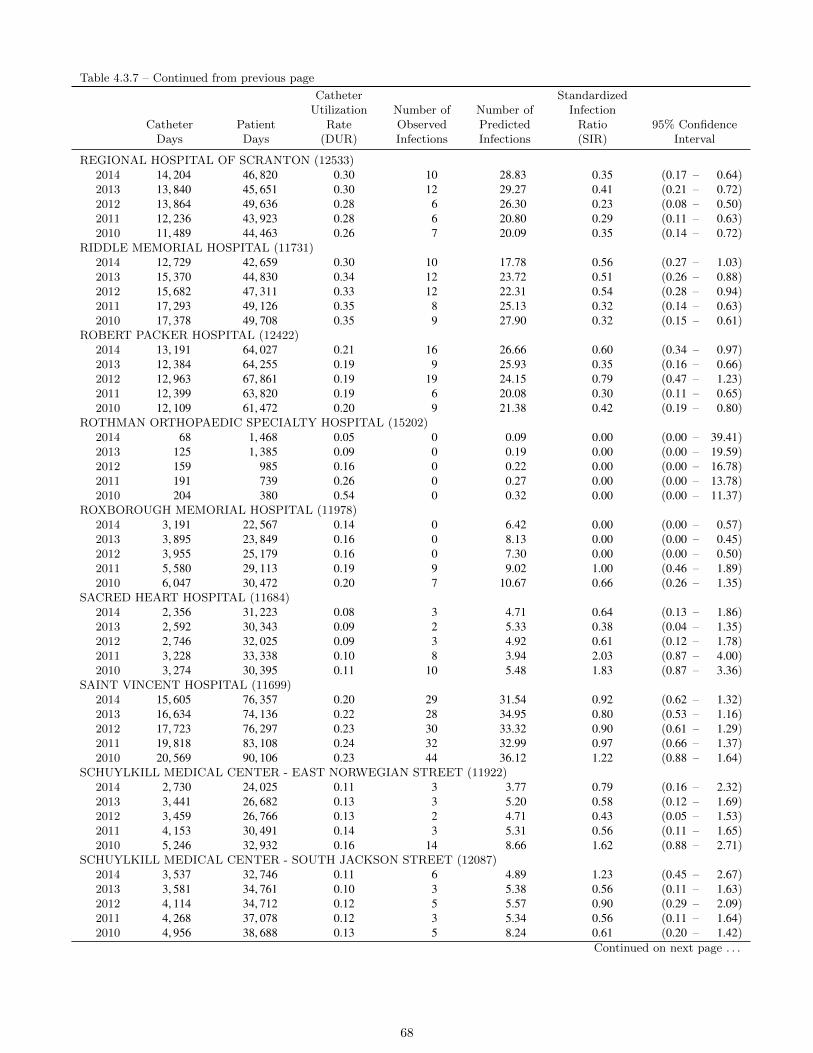
Table 4.3.7 – Continued from previous page
CatheterDays
PatientDays
CatheterUtilization
Rate(DUR)
Number ofObservedInfections
Number ofPredictedInfections
StandardizedInfection
Ratio(SIR)
95% ConfidenceInterval
REGIONAL HOSPITAL OF SCRANTON (12533)2014 14, 204 46, 820 0.30 10 28.83 0.35 (0.17 – 0.64)2013 13, 840 45, 651 0.30 12 29.27 0.41 (0.21 – 0.72)2012 13, 864 49, 636 0.28 6 26.30 0.23 (0.08 – 0.50)2011 12, 236 43, 923 0.28 6 20.80 0.29 (0.11 – 0.63)2010 11, 489 44, 463 0.26 7 20.09 0.35 (0.14 – 0.72)
RIDDLE MEMORIAL HOSPITAL (11731)2014 12, 729 42, 659 0.30 10 17.78 0.56 (0.27 – 1.03)2013 15, 370 44, 830 0.34 12 23.72 0.51 (0.26 – 0.88)2012 15, 682 47, 311 0.33 12 22.31 0.54 (0.28 – 0.94)2011 17, 293 49, 126 0.35 8 25.13 0.32 (0.14 – 0.63)2010 17, 378 49, 708 0.35 9 27.90 0.32 (0.15 – 0.61)
ROBERT PACKER HOSPITAL (12422)2014 13, 191 64, 027 0.21 16 26.66 0.60 (0.34 – 0.97)2013 12, 384 64, 255 0.19 9 25.93 0.35 (0.16 – 0.66)2012 12, 963 67, 861 0.19 19 24.15 0.79 (0.47 – 1.23)2011 12, 399 63, 820 0.19 6 20.08 0.30 (0.11 – 0.65)2010 12, 109 61, 472 0.20 9 21.38 0.42 (0.19 – 0.80)
ROTHMAN ORTHOPAEDIC SPECIALTY HOSPITAL (15202)2014 68 1, 468 0.05 0 0.09 0.00 (0.00 – 39.41)2013 125 1, 385 0.09 0 0.19 0.00 (0.00 – 19.59)2012 159 985 0.16 0 0.22 0.00 (0.00 – 16.78)2011 191 739 0.26 0 0.27 0.00 (0.00 – 13.78)2010 204 380 0.54 0 0.32 0.00 (0.00 – 11.37)
ROXBOROUGH MEMORIAL HOSPITAL (11978)2014 3, 191 22, 567 0.14 0 6.42 0.00 (0.00 – 0.57)2013 3, 895 23, 849 0.16 0 8.13 0.00 (0.00 – 0.45)2012 3, 955 25, 179 0.16 0 7.30 0.00 (0.00 – 0.50)2011 5, 580 29, 113 0.19 9 9.02 1.00 (0.46 – 1.89)2010 6, 047 30, 472 0.20 7 10.67 0.66 (0.26 – 1.35)
SACRED HEART HOSPITAL (11684)2014 2, 356 31, 223 0.08 3 4.71 0.64 (0.13 – 1.86)2013 2, 592 30, 343 0.09 2 5.33 0.38 (0.04 – 1.35)2012 2, 746 32, 025 0.09 3 4.92 0.61 (0.12 – 1.78)2011 3, 228 33, 338 0.10 8 3.94 2.03 (0.87 – 4.00)2010 3, 274 30, 395 0.11 10 5.48 1.83 (0.87 – 3.36)
SAINT VINCENT HOSPITAL (11699)2014 15, 605 76, 357 0.20 29 31.54 0.92 (0.62 – 1.32)2013 16, 634 74, 136 0.22 28 34.95 0.80 (0.53 – 1.16)2012 17, 723 76, 297 0.23 30 33.32 0.90 (0.61 – 1.29)2011 19, 818 83, 108 0.24 32 32.99 0.97 (0.66 – 1.37)2010 20, 569 90, 106 0.23 44 36.12 1.22 (0.88 – 1.64)
SCHUYLKILL MEDICAL CENTER - EAST NORWEGIAN STREET (11922)2014 2, 730 24, 025 0.11 3 3.77 0.79 (0.16 – 2.32)2013 3, 441 26, 682 0.13 3 5.20 0.58 (0.12 – 1.69)2012 3, 459 26, 766 0.13 2 4.71 0.43 (0.05 – 1.53)2011 4, 153 30, 491 0.14 3 5.31 0.56 (0.11 – 1.65)2010 5, 246 32, 932 0.16 14 8.66 1.62 (0.88 – 2.71)
SCHUYLKILL MEDICAL CENTER - SOUTH JACKSON STREET (12087)2014 3, 537 32, 746 0.11 6 4.89 1.23 (0.45 – 2.67)2013 3, 581 34, 761 0.10 3 5.38 0.56 (0.11 – 1.63)2012 4, 114 34, 712 0.12 5 5.57 0.90 (0.29 – 2.09)2011 4, 268 37, 078 0.12 3 5.34 0.56 (0.11 – 1.64)2010 4, 956 38, 688 0.13 5 8.24 0.61 (0.20 – 1.42)
Continued on next page . . .
68
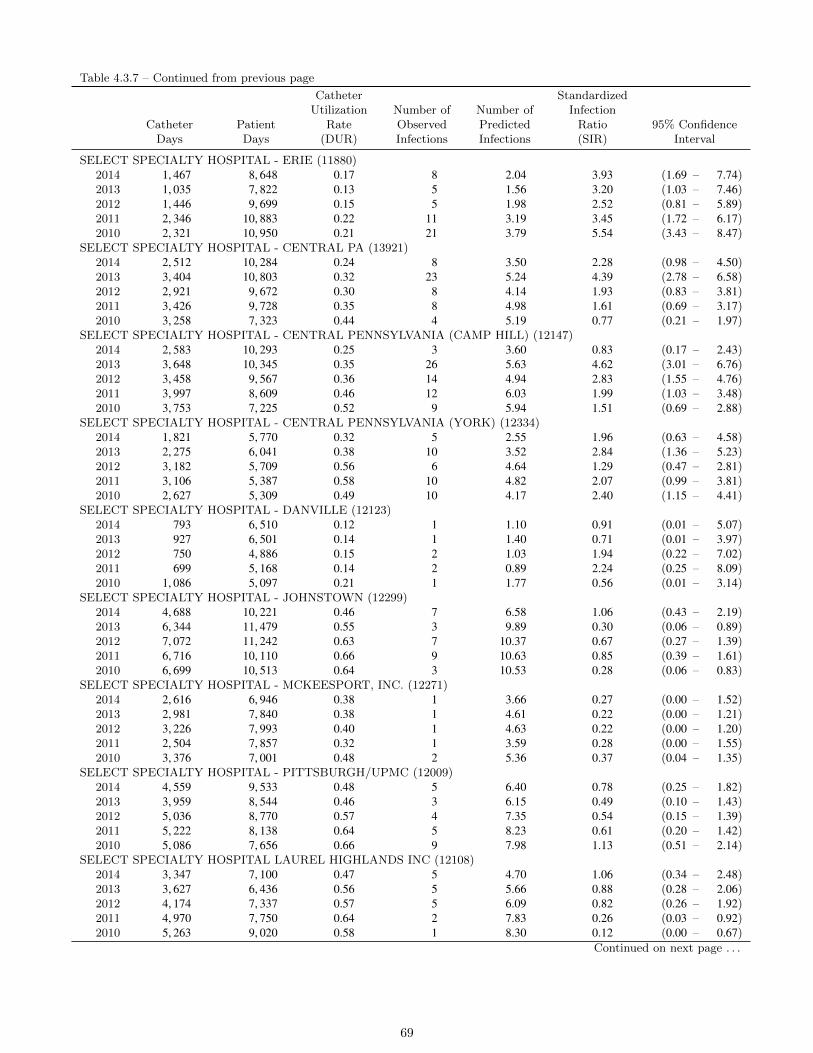
Table 4.3.7 – Continued from previous page
CatheterDays
PatientDays
CatheterUtilization
Rate(DUR)
Number ofObservedInfections
Number ofPredictedInfections
StandardizedInfection
Ratio(SIR)
95% ConfidenceInterval
SELECT SPECIALTY HOSPITAL - ERIE (11880)2014 1, 467 8, 648 0.17 8 2.04 3.93 (1.69 – 7.74)2013 1, 035 7, 822 0.13 5 1.56 3.20 (1.03 – 7.46)2012 1, 446 9, 699 0.15 5 1.98 2.52 (0.81 – 5.89)2011 2, 346 10, 883 0.22 11 3.19 3.45 (1.72 – 6.17)2010 2, 321 10, 950 0.21 21 3.79 5.54 (3.43 – 8.47)
SELECT SPECIALTY HOSPITAL - CENTRAL PA (13921)2014 2, 512 10, 284 0.24 8 3.50 2.28 (0.98 – 4.50)2013 3, 404 10, 803 0.32 23 5.24 4.39 (2.78 – 6.58)2012 2, 921 9, 672 0.30 8 4.14 1.93 (0.83 – 3.81)2011 3, 426 9, 728 0.35 8 4.98 1.61 (0.69 – 3.17)2010 3, 258 7, 323 0.44 4 5.19 0.77 (0.21 – 1.97)
SELECT SPECIALTY HOSPITAL - CENTRAL PENNSYLVANIA (CAMP HILL) (12147)2014 2, 583 10, 293 0.25 3 3.60 0.83 (0.17 – 2.43)2013 3, 648 10, 345 0.35 26 5.63 4.62 (3.01 – 6.76)2012 3, 458 9, 567 0.36 14 4.94 2.83 (1.55 – 4.76)2011 3, 997 8, 609 0.46 12 6.03 1.99 (1.03 – 3.48)2010 3, 753 7, 225 0.52 9 5.94 1.51 (0.69 – 2.88)
SELECT SPECIALTY HOSPITAL - CENTRAL PENNSYLVANIA (YORK) (12334)2014 1, 821 5, 770 0.32 5 2.55 1.96 (0.63 – 4.58)2013 2, 275 6, 041 0.38 10 3.52 2.84 (1.36 – 5.23)2012 3, 182 5, 709 0.56 6 4.64 1.29 (0.47 – 2.81)2011 3, 106 5, 387 0.58 10 4.82 2.07 (0.99 – 3.81)2010 2, 627 5, 309 0.49 10 4.17 2.40 (1.15 – 4.41)
SELECT SPECIALTY HOSPITAL - DANVILLE (12123)2014 793 6, 510 0.12 1 1.10 0.91 (0.01 – 5.07)2013 927 6, 501 0.14 1 1.40 0.71 (0.01 – 3.97)2012 750 4, 886 0.15 2 1.03 1.94 (0.22 – 7.02)2011 699 5, 168 0.14 2 0.89 2.24 (0.25 – 8.09)2010 1, 086 5, 097 0.21 1 1.77 0.56 (0.01 – 3.14)
SELECT SPECIALTY HOSPITAL - JOHNSTOWN (12299)2014 4, 688 10, 221 0.46 7 6.58 1.06 (0.43 – 2.19)2013 6, 344 11, 479 0.55 3 9.89 0.30 (0.06 – 0.89)2012 7, 072 11, 242 0.63 7 10.37 0.67 (0.27 – 1.39)2011 6, 716 10, 110 0.66 9 10.63 0.85 (0.39 – 1.61)2010 6, 699 10, 513 0.64 3 10.53 0.28 (0.06 – 0.83)
SELECT SPECIALTY HOSPITAL - MCKEESPORT, INC. (12271)2014 2, 616 6, 946 0.38 1 3.66 0.27 (0.00 – 1.52)2013 2, 981 7, 840 0.38 1 4.61 0.22 (0.00 – 1.21)2012 3, 226 7, 993 0.40 1 4.63 0.22 (0.00 – 1.20)2011 2, 504 7, 857 0.32 1 3.59 0.28 (0.00 – 1.55)2010 3, 376 7, 001 0.48 2 5.36 0.37 (0.04 – 1.35)
SELECT SPECIALTY HOSPITAL - PITTSBURGH/UPMC (12009)2014 4, 559 9, 533 0.48 5 6.40 0.78 (0.25 – 1.82)2013 3, 959 8, 544 0.46 3 6.15 0.49 (0.10 – 1.43)2012 5, 036 8, 770 0.57 4 7.35 0.54 (0.15 – 1.39)2011 5, 222 8, 138 0.64 5 8.23 0.61 (0.20 – 1.42)2010 5, 086 7, 656 0.66 9 7.98 1.13 (0.51 – 2.14)
SELECT SPECIALTY HOSPITAL LAUREL HIGHLANDS INC (12108)2014 3, 347 7, 100 0.47 5 4.70 1.06 (0.34 – 2.48)2013 3, 627 6, 436 0.56 5 5.66 0.88 (0.28 – 2.06)2012 4, 174 7, 337 0.57 5 6.09 0.82 (0.26 – 1.92)2011 4, 970 7, 750 0.64 2 7.83 0.26 (0.03 – 0.92)2010 5, 263 9, 020 0.58 1 8.30 0.12 (0.00 – 0.67)
Continued on next page . . .
69
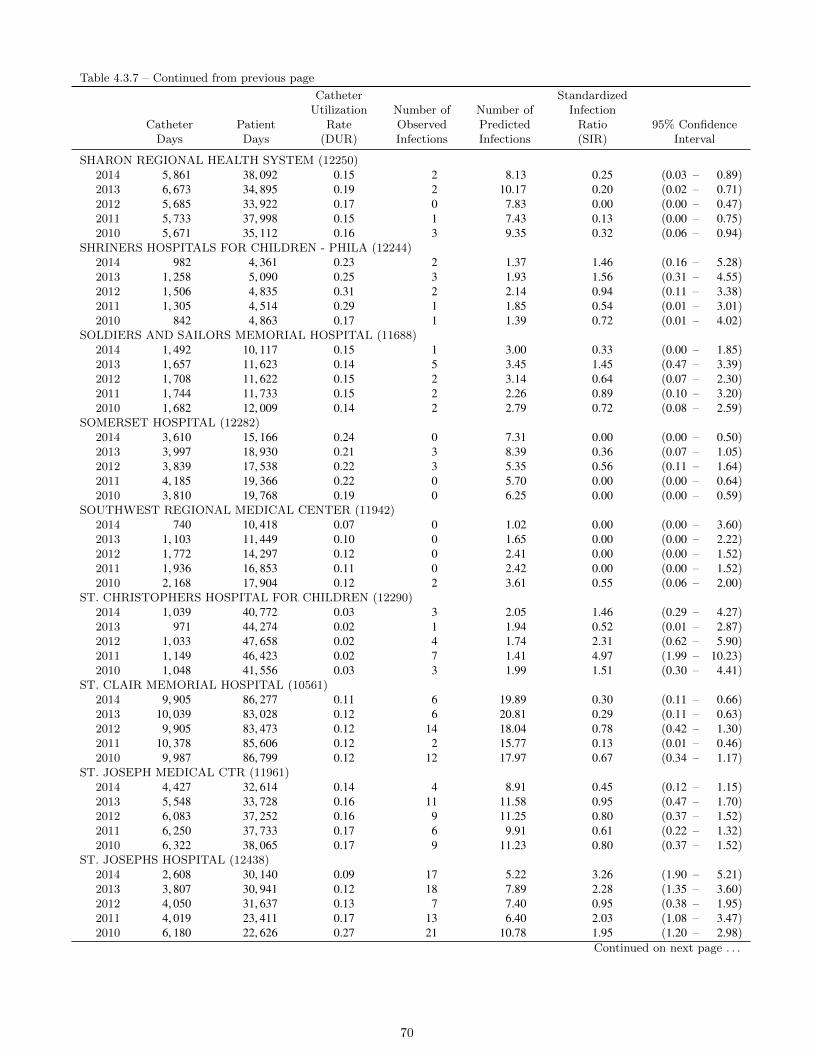
Table 4.3.7 – Continued from previous page
CatheterDays
PatientDays
CatheterUtilization
Rate(DUR)
Number ofObservedInfections
Number ofPredictedInfections
StandardizedInfection
Ratio(SIR)
95% ConfidenceInterval
SHARON REGIONAL HEALTH SYSTEM (12250)2014 5, 861 38, 092 0.15 2 8.13 0.25 (0.03 – 0.89)2013 6, 673 34, 895 0.19 2 10.17 0.20 (0.02 – 0.71)2012 5, 685 33, 922 0.17 0 7.83 0.00 (0.00 – 0.47)2011 5, 733 37, 998 0.15 1 7.43 0.13 (0.00 – 0.75)2010 5, 671 35, 112 0.16 3 9.35 0.32 (0.06 – 0.94)
SHRINERS HOSPITALS FOR CHILDREN - PHILA (12244)2014 982 4, 361 0.23 2 1.37 1.46 (0.16 – 5.28)2013 1, 258 5, 090 0.25 3 1.93 1.56 (0.31 – 4.55)2012 1, 506 4, 835 0.31 2 2.14 0.94 (0.11 – 3.38)2011 1, 305 4, 514 0.29 1 1.85 0.54 (0.01 – 3.01)2010 842 4, 863 0.17 1 1.39 0.72 (0.01 – 4.02)
SOLDIERS AND SAILORS MEMORIAL HOSPITAL (11688)2014 1, 492 10, 117 0.15 1 3.00 0.33 (0.00 – 1.85)2013 1, 657 11, 623 0.14 5 3.45 1.45 (0.47 – 3.39)2012 1, 708 11, 622 0.15 2 3.14 0.64 (0.07 – 2.30)2011 1, 744 11, 733 0.15 2 2.26 0.89 (0.10 – 3.20)2010 1, 682 12, 009 0.14 2 2.79 0.72 (0.08 – 2.59)
SOMERSET HOSPITAL (12282)2014 3, 610 15, 166 0.24 0 7.31 0.00 (0.00 – 0.50)2013 3, 997 18, 930 0.21 3 8.39 0.36 (0.07 – 1.05)2012 3, 839 17, 538 0.22 3 5.35 0.56 (0.11 – 1.64)2011 4, 185 19, 366 0.22 0 5.70 0.00 (0.00 – 0.64)2010 3, 810 19, 768 0.19 0 6.25 0.00 (0.00 – 0.59)
SOUTHWEST REGIONAL MEDICAL CENTER (11942)2014 740 10, 418 0.07 0 1.02 0.00 (0.00 – 3.60)2013 1, 103 11, 449 0.10 0 1.65 0.00 (0.00 – 2.22)2012 1, 772 14, 297 0.12 0 2.41 0.00 (0.00 – 1.52)2011 1, 936 16, 853 0.11 0 2.42 0.00 (0.00 – 1.52)2010 2, 168 17, 904 0.12 2 3.61 0.55 (0.06 – 2.00)
ST. CHRISTOPHERS HOSPITAL FOR CHILDREN (12290)2014 1, 039 40, 772 0.03 3 2.05 1.46 (0.29 – 4.27)2013 971 44, 274 0.02 1 1.94 0.52 (0.01 – 2.87)2012 1, 033 47, 658 0.02 4 1.74 2.31 (0.62 – 5.90)2011 1, 149 46, 423 0.02 7 1.41 4.97 (1.99 – 10.23)2010 1, 048 41, 556 0.03 3 1.99 1.51 (0.30 – 4.41)
ST. CLAIR MEMORIAL HOSPITAL (10561)2014 9, 905 86, 277 0.11 6 19.89 0.30 (0.11 – 0.66)2013 10, 039 83, 028 0.12 6 20.81 0.29 (0.11 – 0.63)2012 9, 905 83, 473 0.12 14 18.04 0.78 (0.42 – 1.30)2011 10, 378 85, 606 0.12 2 15.77 0.13 (0.01 – 0.46)2010 9, 987 86, 799 0.12 12 17.97 0.67 (0.34 – 1.17)
ST. JOSEPH MEDICAL CTR (11961)2014 4, 427 32, 614 0.14 4 8.91 0.45 (0.12 – 1.15)2013 5, 548 33, 728 0.16 11 11.58 0.95 (0.47 – 1.70)2012 6, 083 37, 252 0.16 9 11.25 0.80 (0.37 – 1.52)2011 6, 250 37, 733 0.17 6 9.91 0.61 (0.22 – 1.32)2010 6, 322 38, 065 0.17 9 11.23 0.80 (0.37 – 1.52)
ST. JOSEPHS HOSPITAL (12438)2014 2, 608 30, 140 0.09 17 5.22 3.26 (1.90 – 5.21)2013 3, 807 30, 941 0.12 18 7.89 2.28 (1.35 – 3.60)2012 4, 050 31, 637 0.13 7 7.40 0.95 (0.38 – 1.95)2011 4, 019 23, 411 0.17 13 6.40 2.03 (1.08 – 3.47)2010 6, 180 22, 626 0.27 21 10.78 1.95 (1.20 – 2.98)
Continued on next page . . .
70

Table 4.3.7 – Continued from previous page
CatheterDays
PatientDays
CatheterUtilization
Rate(DUR)
Number ofObservedInfections
Number ofPredictedInfections
StandardizedInfection
Ratio(SIR)
95% ConfidenceInterval
ST. LUKES HOSPITAL BETHLEHEM (11718)2014 18, 378 150, 512 0.12 35 36.93 0.95 (0.66 – 1.32)2013 20, 055 137, 377 0.15 37 41.74 0.89 (0.62 – 1.22)2012 22, 652 134, 196 0.17 42 41.95 1.00 (0.72 – 1.35)2011 29, 714 142, 433 0.21 62 48.59 1.28 (0.98 – 1.64)2010 34, 009 146, 029 0.23 56 59.68 0.94 (0.71 – 1.22)
ST. LUKES HOSPITAL- ANDERSON CAMPUS (21487)2014 2, 285 22, 218 0.10 3 4.58 0.65 (0.13 – 1.91)2013 2, 541 20, 370 0.12 0 5.27 0.00 (0.00 – 0.70)2012 2, 145 16, 294 0.13 4 3.93 1.02 (0.27 – 2.61)2011 . . . . . . .2010 . . . . . . .
ST. LUKES MINERS MEMORIAL HOSPITAL (11784)2014 1, 341 7, 403 0.18 2 1.86 1.07 (0.12 – 3.88)2013 1, 481 7, 001 0.21 1 2.26 0.44 (0.01 – 2.46)2012 1, 592 7, 014 0.23 1 2.22 0.45 (0.01 – 2.50)2011 1, 714 6, 390 0.27 3 2.40 1.25 (0.25 – 3.65)2010 1, 991 6, 549 0.30 1 3.21 0.31 (0.00 – 1.73)
ST. LUKES QUAKERTOWN HOSPITAL (11711)2014 1, 036 13, 846 0.07 0 1.43 0.00 (0.00 – 2.57)2013 1, 151 14, 419 0.08 1 1.72 0.58 (0.01 – 3.24)2012 1, 163 14, 938 0.08 1 1.54 0.65 (0.01 – 3.60)2011 1, 478 15, 057 0.10 3 1.81 1.66 (0.33 – 4.85)2010 1, 592 14, 903 0.11 2 2.66 0.75 (0.08 – 2.71)
ST. MARY MEDICAL CENTER (11885)2014 11, 598 98, 939 0.12 28 16.04 1.75 (1.16 – 2.52)2013 12, 371 100, 245 0.12 37 18.66 1.98 (1.40 – 2.73)2012 12, 939 94, 985 0.14 38 17.64 2.15 (1.52 – 2.96)2011 14, 511 99, 643 0.15 31 18.72 1.66 (1.12 – 2.35)2010 13, 987 99, 895 0.14 50 23.19 2.16 (1.60 – 2.84)
SUNBURY COMMUNITY HOSP (12105)2014 1, 000 6, 350 0.16 0 1.39 0.00 (0.00 – 2.64)2013 849 6, 541 0.13 1 1.28 0.78 (0.01 – 4.34)2012 1, 028 6, 518 0.16 0 1.41 0.00 (0.00 – 2.60)2011 1, 262 7, 897 0.16 0 1.65 0.00 (0.00 – 2.22)2010 1, 397 7, 978 0.18 0 2.30 0.00 (0.00 – 1.60)
SURGICAL INSTITUTE OF READING (12535)2014 643 1, 693 0.38 0 0.90 0.00 (0.00 – 4.07)2013 583 2, 015 0.29 1 0.90 1.12 (0.01 – 6.21)2012 605 2, 585 0.23 4 0.85 4.73 (1.27 – 12.10)2011 574 2, 646 0.22 1 0.78 1.28 (0.02 – 7.12)2010 657 2, 962 0.22 1 1.07 0.93 (0.01 – 5.19)
SURGICAL SPECIALTY CENTER AT COORDINATED HEALTH, THE (15259)2014 552 1, 955 0.28 0 0.77 0.00 (0.00 – 4.76)2013 767 1, 941 0.40 0 1.19 0.00 (0.00 – 3.09)2012 871 2, 052 0.42 0 1.25 0.00 (0.00 – 2.93)2011 787 1, 913 0.41 0 1.17 0.00 (0.00 – 3.14)2010 643 1, 611 0.40 0 1.03 0.00 (0.00 – 3.57)
TEMPLE UNIVERSITY HOSPITAL (12382)2014 28, 357 146, 564 0.19 53 57.27 0.93 (0.69 – 1.21)2013 30, 454 143, 434 0.21 79 63.91 1.24 (0.98 – 1.54)2012 31, 094 152, 814 0.20 45 58.10 0.77 (0.56 – 1.04)2011 32, 226 145, 364 0.22 48 53.13 0.90 (0.67 – 1.20)2010 33, 608 141, 832 0.24 50 58.94 0.85 (0.63 – 1.12)
Continued on next page . . .
71
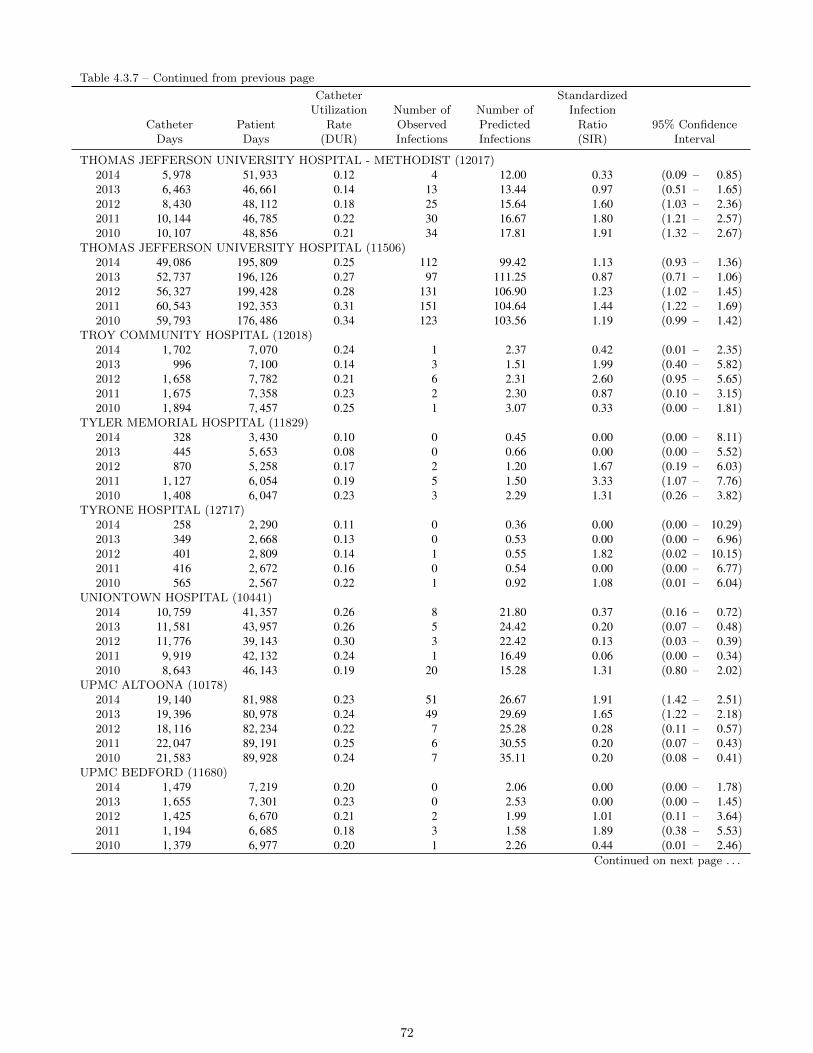
Table 4.3.7 – Continued from previous page
CatheterDays
PatientDays
CatheterUtilization
Rate(DUR)
Number ofObservedInfections
Number ofPredictedInfections
StandardizedInfection
Ratio(SIR)
95% ConfidenceInterval
THOMAS JEFFERSON UNIVERSITY HOSPITAL - METHODIST (12017)2014 5, 978 51, 933 0.12 4 12.00 0.33 (0.09 – 0.85)2013 6, 463 46, 661 0.14 13 13.44 0.97 (0.51 – 1.65)2012 8, 430 48, 112 0.18 25 15.64 1.60 (1.03 – 2.36)2011 10, 144 46, 785 0.22 30 16.67 1.80 (1.21 – 2.57)2010 10, 107 48, 856 0.21 34 17.81 1.91 (1.32 – 2.67)
THOMAS JEFFERSON UNIVERSITY HOSPITAL (11506)2014 49, 086 195, 809 0.25 112 99.42 1.13 (0.93 – 1.36)2013 52, 737 196, 126 0.27 97 111.25 0.87 (0.71 – 1.06)2012 56, 327 199, 428 0.28 131 106.90 1.23 (1.02 – 1.45)2011 60, 543 192, 353 0.31 151 104.64 1.44 (1.22 – 1.69)2010 59, 793 176, 486 0.34 123 103.56 1.19 (0.99 – 1.42)
TROY COMMUNITY HOSPITAL (12018)2014 1, 702 7, 070 0.24 1 2.37 0.42 (0.01 – 2.35)2013 996 7, 100 0.14 3 1.51 1.99 (0.40 – 5.82)2012 1, 658 7, 782 0.21 6 2.31 2.60 (0.95 – 5.65)2011 1, 675 7, 358 0.23 2 2.30 0.87 (0.10 – 3.15)2010 1, 894 7, 457 0.25 1 3.07 0.33 (0.00 – 1.81)
TYLER MEMORIAL HOSPITAL (11829)2014 328 3, 430 0.10 0 0.45 0.00 (0.00 – 8.11)2013 445 5, 653 0.08 0 0.66 0.00 (0.00 – 5.52)2012 870 5, 258 0.17 2 1.20 1.67 (0.19 – 6.03)2011 1, 127 6, 054 0.19 5 1.50 3.33 (1.07 – 7.76)2010 1, 408 6, 047 0.23 3 2.29 1.31 (0.26 – 3.82)
TYRONE HOSPITAL (12717)2014 258 2, 290 0.11 0 0.36 0.00 (0.00 – 10.29)2013 349 2, 668 0.13 0 0.53 0.00 (0.00 – 6.96)2012 401 2, 809 0.14 1 0.55 1.82 (0.02 – 10.15)2011 416 2, 672 0.16 0 0.54 0.00 (0.00 – 6.77)2010 565 2, 567 0.22 1 0.92 1.08 (0.01 – 6.04)
UNIONTOWN HOSPITAL (10441)2014 10, 759 41, 357 0.26 8 21.80 0.37 (0.16 – 0.72)2013 11, 581 43, 957 0.26 5 24.42 0.20 (0.07 – 0.48)2012 11, 776 39, 143 0.30 3 22.42 0.13 (0.03 – 0.39)2011 9, 919 42, 132 0.24 1 16.49 0.06 (0.00 – 0.34)2010 8, 643 46, 143 0.19 20 15.28 1.31 (0.80 – 2.02)
UPMC ALTOONA (10178)2014 19, 140 81, 988 0.23 51 26.67 1.91 (1.42 – 2.51)2013 19, 396 80, 978 0.24 49 29.69 1.65 (1.22 – 2.18)2012 18, 116 82, 234 0.22 7 25.28 0.28 (0.11 – 0.57)2011 22, 047 89, 191 0.25 6 30.55 0.20 (0.07 – 0.43)2010 21, 583 89, 928 0.24 7 35.11 0.20 (0.08 – 0.41)
UPMC BEDFORD (11680)2014 1, 479 7, 219 0.20 0 2.06 0.00 (0.00 – 1.78)2013 1, 655 7, 301 0.23 0 2.53 0.00 (0.00 – 1.45)2012 1, 425 6, 670 0.21 2 1.99 1.01 (0.11 – 3.64)2011 1, 194 6, 685 0.18 3 1.58 1.89 (0.38 – 5.53)2010 1, 379 6, 977 0.20 1 2.26 0.44 (0.01 – 2.46)
Continued on next page . . .
72
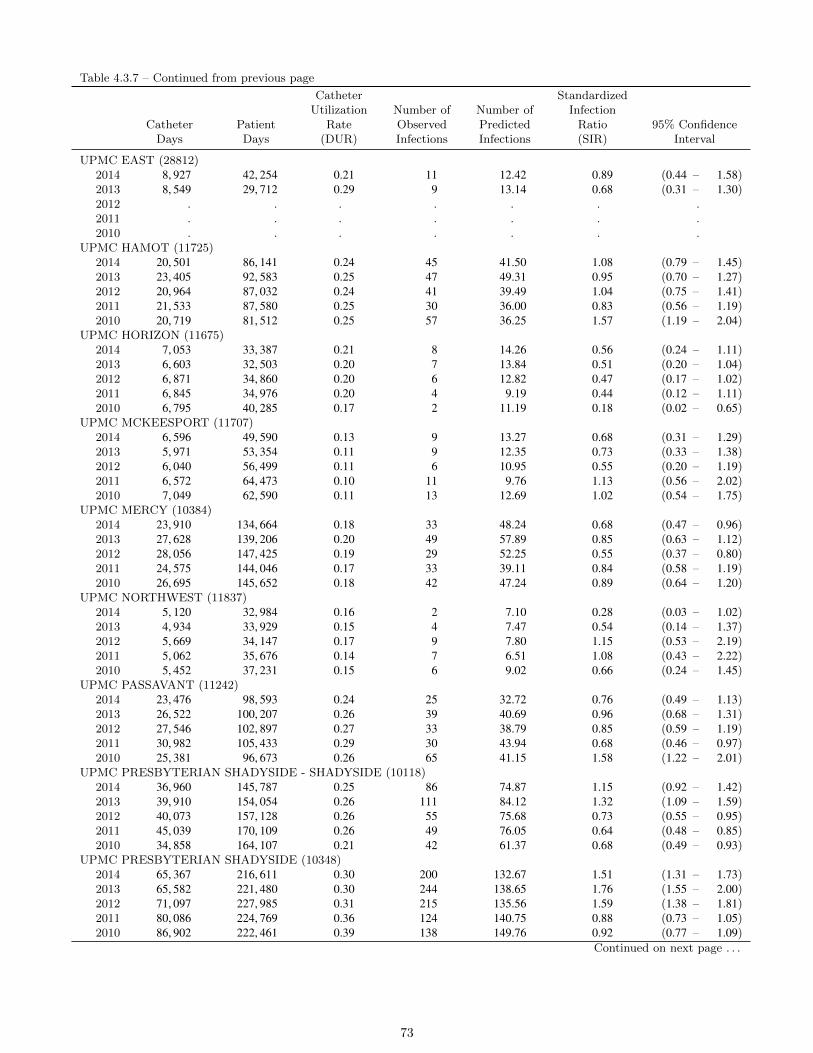
Table 4.3.7 – Continued from previous page
CatheterDays
PatientDays
CatheterUtilization
Rate(DUR)
Number ofObservedInfections
Number ofPredictedInfections
StandardizedInfection
Ratio(SIR)
95% ConfidenceInterval
UPMC EAST (28812)2014 8, 927 42, 254 0.21 11 12.42 0.89 (0.44 – 1.58)2013 8, 549 29, 712 0.29 9 13.14 0.68 (0.31 – 1.30)2012 . . . . . . .2011 . . . . . . .2010 . . . . . . .
UPMC HAMOT (11725)2014 20, 501 86, 141 0.24 45 41.50 1.08 (0.79 – 1.45)2013 23, 405 92, 583 0.25 47 49.31 0.95 (0.70 – 1.27)2012 20, 964 87, 032 0.24 41 39.49 1.04 (0.75 – 1.41)2011 21, 533 87, 580 0.25 30 36.00 0.83 (0.56 – 1.19)2010 20, 719 81, 512 0.25 57 36.25 1.57 (1.19 – 2.04)
UPMC HORIZON (11675)2014 7, 053 33, 387 0.21 8 14.26 0.56 (0.24 – 1.11)2013 6, 603 32, 503 0.20 7 13.84 0.51 (0.20 – 1.04)2012 6, 871 34, 860 0.20 6 12.82 0.47 (0.17 – 1.02)2011 6, 845 34, 976 0.20 4 9.19 0.44 (0.12 – 1.11)2010 6, 795 40, 285 0.17 2 11.19 0.18 (0.02 – 0.65)
UPMC MCKEESPORT (11707)2014 6, 596 49, 590 0.13 9 13.27 0.68 (0.31 – 1.29)2013 5, 971 53, 354 0.11 9 12.35 0.73 (0.33 – 1.38)2012 6, 040 56, 499 0.11 6 10.95 0.55 (0.20 – 1.19)2011 6, 572 64, 473 0.10 11 9.76 1.13 (0.56 – 2.02)2010 7, 049 62, 590 0.11 13 12.69 1.02 (0.54 – 1.75)
UPMC MERCY (10384)2014 23, 910 134, 664 0.18 33 48.24 0.68 (0.47 – 0.96)2013 27, 628 139, 206 0.20 49 57.89 0.85 (0.63 – 1.12)2012 28, 056 147, 425 0.19 29 52.25 0.55 (0.37 – 0.80)2011 24, 575 144, 046 0.17 33 39.11 0.84 (0.58 – 1.19)2010 26, 695 145, 652 0.18 42 47.24 0.89 (0.64 – 1.20)
UPMC NORTHWEST (11837)2014 5, 120 32, 984 0.16 2 7.10 0.28 (0.03 – 1.02)2013 4, 934 33, 929 0.15 4 7.47 0.54 (0.14 – 1.37)2012 5, 669 34, 147 0.17 9 7.80 1.15 (0.53 – 2.19)2011 5, 062 35, 676 0.14 7 6.51 1.08 (0.43 – 2.22)2010 5, 452 37, 231 0.15 6 9.02 0.66 (0.24 – 1.45)
UPMC PASSAVANT (11242)2014 23, 476 98, 593 0.24 25 32.72 0.76 (0.49 – 1.13)2013 26, 522 100, 207 0.26 39 40.69 0.96 (0.68 – 1.31)2012 27, 546 102, 897 0.27 33 38.79 0.85 (0.59 – 1.19)2011 30, 982 105, 433 0.29 30 43.94 0.68 (0.46 – 0.97)2010 25, 381 96, 673 0.26 65 41.15 1.58 (1.22 – 2.01)
UPMC PRESBYTERIAN SHADYSIDE - SHADYSIDE (10118)2014 36, 960 145, 787 0.25 86 74.87 1.15 (0.92 – 1.42)2013 39, 910 154, 054 0.26 111 84.12 1.32 (1.09 – 1.59)2012 40, 073 157, 128 0.26 55 75.68 0.73 (0.55 – 0.95)2011 45, 039 170, 109 0.26 49 76.05 0.64 (0.48 – 0.85)2010 34, 858 164, 107 0.21 42 61.37 0.68 (0.49 – 0.93)
UPMC PRESBYTERIAN SHADYSIDE (10348)2014 65, 367 216, 611 0.30 200 132.67 1.51 (1.31 – 1.73)2013 65, 582 221, 480 0.30 244 138.65 1.76 (1.55 – 2.00)2012 71, 097 227, 985 0.31 215 135.56 1.59 (1.38 – 1.81)2011 80, 086 224, 769 0.36 124 140.75 0.88 (0.73 – 1.05)2010 86, 902 222, 461 0.39 138 149.76 0.92 (0.77 – 1.09)
Continued on next page . . .
73

Table 4.3.7 – Continued from previous page
CatheterDays
PatientDays
CatheterUtilization
Rate(DUR)
Number ofObservedInfections
Number ofPredictedInfections
StandardizedInfection
Ratio(SIR)
95% ConfidenceInterval
UPMC ST. MARGARET (11561)2014 17, 030 70, 654 0.24 30 34.48 0.87 (0.59 – 1.24)2013 17, 286 69, 846 0.25 25 36.40 0.69 (0.44 – 1.01)2012 18, 429 75, 976 0.24 24 34.72 0.69 (0.44 – 1.03)2011 18, 141 79, 022 0.23 15 30.05 0.50 (0.28 – 0.82)2010 18, 982 76, 041 0.25 30 33.23 0.90 (0.61 – 1.29)
WARREN GENERAL HOSPITAL (12216)2014 1, 908 14, 525 0.13 1 2.64 0.38 (0.00 – 2.11)2013 2, 022 15, 355 0.13 2 3.05 0.65 (0.07 – 2.36)2012 1, 609 13, 257 0.12 1 2.18 0.46 (0.01 – 2.55)2011 1, 965 13, 033 0.15 2 2.55 0.79 (0.09 – 2.83)2010 2, 357 11, 870 0.20 4 3.86 1.04 (0.28 – 2.65)
WASHINGTON HOSPITAL, THE (11460)2014 9, 856 52, 992 0.19 12 19.90 0.60 (0.31 – 1.05)2013 8, 495 54, 165 0.16 11 17.71 0.62 (0.31 – 1.11)2012 8, 575 54, 486 0.16 9 11.77 0.76 (0.35 – 1.45)2011 9, 417 62, 228 0.15 12 12.21 0.98 (0.51 – 1.72)2010 9, 718 65, 063 0.15 9 16.07 0.56 (0.26 – 1.06)
WAYNE MEMORIAL HOSPITAL (12004)2014 1, 975 16, 887 0.12 2 2.73 0.73 (0.08 – 2.64)2013 2, 293 16, 857 0.14 3 3.47 0.87 (0.17 – 2.53)2012 2, 594 18, 519 0.14 2 3.54 0.56 (0.06 – 2.04)2011 2, 734 15, 942 0.17 5 3.61 1.39 (0.45 – 3.24)2010 2, 637 18, 141 0.15 2 4.37 0.46 (0.05 – 1.65)
WAYNESBORO HOSPITAL (11642)2014 1, 227 8, 868 0.14 0 1.70 0.00 (0.00 – 2.16)2013 1, 554 9, 414 0.17 0 2.36 0.00 (0.00 – 1.55)2012 1, 595 9, 841 0.16 2 2.19 0.91 (0.10 – 3.29)2011 1, 727 9, 729 0.18 1 2.29 0.44 (0.01 – 2.43)2010 1, 820 9, 970 0.18 2 2.99 0.67 (0.08 – 2.42)
WELLSPAN SURGERY AND REHABILITATION HOSPITAL (27430)2014 968 16, 960 0.06 1 1.33 0.75 (0.01 – 4.19)2013 975 15, 195 0.06 4 1.45 2.76 (0.74 – 7.06)2012 . . . . . . .2011 . . . . . . .2010 . . . . . . .
WEST PENN HOSPITAL (11864)2014 5, 198 62, 189 0.08 6 10.40 0.58 (0.21 – 1.26)2013 6, 393 57, 409 0.11 8 13.23 0.60 (0.26 – 1.19)2012 5, 002 53, 366 0.09 8 9.01 0.89 (0.38 – 1.75)2011 5, 243 41, 736 0.13 1 8.01 0.12 (0.00 – 0.69)2010 19, 759 88, 109 0.22 23 34.72 0.66 (0.42 – 0.99)
WESTERN PSYCHIATRIC INSTITUTE AND CLINIC (13702)2014 94 97, 915 0.00 3 0.18 16.75 (3.37 – 48.96)2013 78 103, 422 0.00 1 0.14 6.92 (0.09 – 38.51)2012 193 104, 169 0.00 0 0.29 0.00 (0.00 – 12.72)2011 314 102, 650 0.00 2 0.29 6.88 (0.77 – 24.84)2010 378 102, 693 0.00 1 0.77 1.30 (0.02 – 7.25)
WILKES-BARRE GENERAL HOSPITAL (11916)2014 20, 132 82, 084 0.25 25 40.77 0.61 (0.40 – 0.91)2013 21, 708 83, 844 0.26 62 45.76 1.35 (1.04 – 1.74)2012 22, 525 88, 283 0.26 45 42.54 1.06 (0.77 – 1.42)2011 21, 908 84, 294 0.26 52 36.90 1.41 (1.05 – 1.85)2010 22, 606 82, 205 0.27 51 36.60 1.39 (1.04 – 1.83)
Continued on next page . . .
74
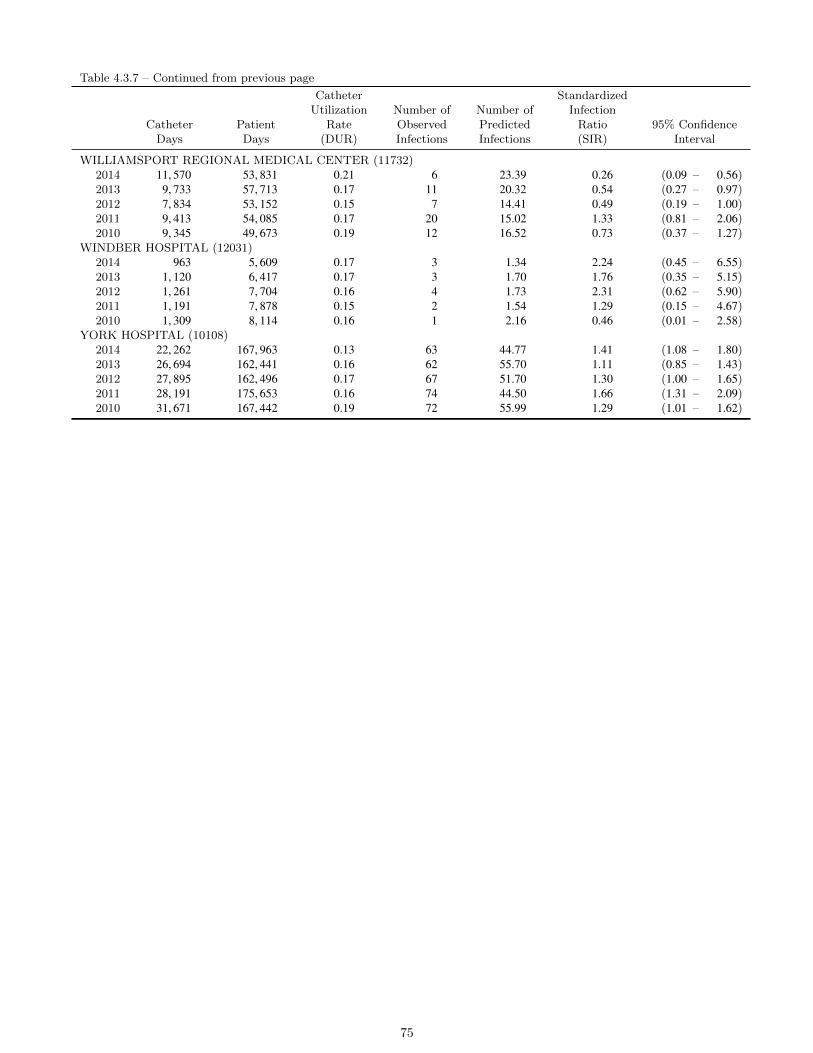
Table 4.3.7 – Continued from previous page
CatheterDays
PatientDays
CatheterUtilization
Rate(DUR)
Number ofObservedInfections
Number ofPredictedInfections
StandardizedInfection
Ratio(SIR)
95% ConfidenceInterval
WILLIAMSPORT REGIONAL MEDICAL CENTER (11732)2014 11, 570 53, 831 0.21 6 23.39 0.26 (0.09 – 0.56)2013 9, 733 57, 713 0.17 11 20.32 0.54 (0.27 – 0.97)2012 7, 834 53, 152 0.15 7 14.41 0.49 (0.19 – 1.00)2011 9, 413 54, 085 0.17 20 15.02 1.33 (0.81 – 2.06)2010 9, 345 49, 673 0.19 12 16.52 0.73 (0.37 – 1.27)
WINDBER HOSPITAL (12031)2014 963 5, 609 0.17 3 1.34 2.24 (0.45 – 6.55)2013 1, 120 6, 417 0.17 3 1.70 1.76 (0.35 – 5.15)2012 1, 261 7, 704 0.16 4 1.73 2.31 (0.62 – 5.90)2011 1, 191 7, 878 0.15 2 1.54 1.29 (0.15 – 4.67)2010 1, 309 8, 114 0.16 1 2.16 0.46 (0.01 – 2.58)
YORK HOSPITAL (10108)2014 22, 262 167, 963 0.13 63 44.77 1.41 (1.08 – 1.80)2013 26, 694 162, 441 0.16 62 55.70 1.11 (0.85 – 1.43)2012 27, 895 162, 496 0.17 67 51.70 1.30 (1.00 – 1.65)2011 28, 191 175, 653 0.16 74 44.50 1.66 (1.31 – 2.09)2010 31, 671 167, 442 0.19 72 55.99 1.29 (1.01 – 1.62)
75

Figure 4.3.1: Number of Observed (Obs.) Catheter-Associated Urinary Tract Infections (CAUTI) andRelative Ranking of Facilities by Standardized Infection Ratio (SIR) — Pennsylvania, 2014
Grouped by Number of Predicted (Pred.) Infections: <1
0 1 5 10 15
SIR and 95% CI
Obs.
0
Pred.
0
SIR
0
Facility and NHSN ID
0
0
0
0
0
3
0
0
0
1
1
0
1
0
0
0
0
1
0
0
0
0
0
0
0
0
0
0
0
0
0
0
0
0.00
0.01
0.02
0.02
0.05
0.06
0.09
0.17
0.18
0.20
0.20
0.22
0.32
0.34
0.36
0.37
0.41
0.43
0.45
0.46
0.46
0.50
0.60
0.65
0.66
0.70
0.72
0.77
0.81
0.84
0.85
0.87
0.87
0.90
0.90
0.94
0.0
0.0
0.0
0.0
0.0
0.0
0.0
0.0
16.8
0.0
0.0
0.0
3.1
2.9
0.0
2.7
0.0
0.0
0.0
0.0
2.2
0.0
0.0
0.0
0.0
0.0
0.0
0.0
0.0
0.0
0.0
0.0
0.0
0.0
0.0
0.0
NORRISTOWN STATE HOSPITAL (12047)
DANVILLE STATE HOSPITAL (11848)
FIRST HOSPITAL OF WYOMING VALLEY (12050)
EDGEWOOD SURGICAL HOSPITAL (12552)
DIVINE PROVIDENCE HOSPITAL (11743)
BUCKTAIL MEDICAL CENTER (12461)
ROTHMAN ORTHOPAEDIC SPECIALTY HOSPITAL (15202)
EAGLEVILLE HOSPITAL (12965)
WESTERN PSYCHIATRIC INSTITUTE AND CLINIC (13702)
CHILDRENS INSTITUTE OF PITTSBURGH, THE (12266)
BARIX CLINICS OF PENNSYLVANIA (12037)
KENSINGTON HOSPITAL (12609)
CONEMAUGH MINERS MEDICAL CENTER (12295)
CONEMAUGH MEYERSDALE MEDICAL CENTER (11968)
TYRONE HOSPITAL (12717)
OSS ORTHOPAEDIC HOSPITAL (18467)
KANE COMMUNITY HOSPITAL (12111)
BARNES−KASSON COUNTY HOSPITAL (12404)
TYLER MEMORIAL HOSPITAL (11829)
MUNCY VALLEY HOSPITAL (11748)
FULTON COUNTY MEDICAL CENTER (11939)
LANCASTER REHABILITATION HOSPITAL (12628)
GEISINGER HEALTHSOUTH REHABILITATION HOSPITAL (11993)
CORRY MEMORIAL HOSPITAL (12283)
JERSEY SHORE HOSPITAL (11689)
PHYSICIANS CARE SURGICAL HOSPITAL (19630)
ADVANCED SURGICAL HOSPITAL (16317)
SURGICAL SPECIALTY CENTER AT COORDINATED HEALTH, THE (15259)
HIGHLANDS HOSPITAL (11902)
PENN HIGHLANDS BROOKVILLE (12418)
GEISINGER−BLOOMSBURG HOSPITAL (12008)
HEALTHSOUTH REHABILITATION HOSPITAL OF ERIE (11810)
ENDLESS MOUNTAINS HEALTH SYSTEMS (11817)
SURGICAL INSTITUTE OF READING (12535)
HEALTHSOUTH READING REHABILITATION HOSPITAL (12139)
LOCK HAVEN HOSPITAL (12097)
Better than predicted Not different than predicted Worse than predicted
76

Figure 4.3.2: Number of Observed (Obs.) Catheter-Associated Urinary Tract Infections (CAUTI) andRelative Ranking of Facilities by Standardized Infection Ratio (SIR) — Pennsylvania, 2014
Grouped by Number of Predicted (Pred.) Infections: 1–2.99
0 1 5 10 15
SIR and 95% CI
Obs.
0
Pred.
1
SIR
1
Facility and NHSN ID
0
0
1
1
0
3
2
0
0
0
3
3
0
1
4
0
0
1
0
4
0
0
2
2
0
2
8
1
3
0
0
2
18
1
3
5
8
1
2
4
0
1.02
1.10
1.12
1.15
1.27
1.30
1.33
1.34
1.34
1.37
1.39
1.43
1.49
1.51
1.52
1.55
1.56
1.57
1.60
1.62
1.63
1.63
1.64
1.70
1.75
1.86
1.88
1.88
2.01
2.04
2.05
2.05
2.06
2.10
2.19
2.34
2.37
2.46
2.55
2.63
2.64
2.73
2.95
3.00
0.0
0.9
0.9
0.0
0.0
0.8
0.8
0.0
2.2
1.5
0.0
0.0
0.0
2.0
2.0
0.0
0.6
2.6
0.0
0.0
0.6
0.0
2.4
0.0
0.0
1.1
1.1
0.0
1.0
3.9
0.5
1.5
0.0
0.0
0.9
7.7
0.4
1.2
2.0
3.0
0.4
0.7
1.4
0.0
SOUTHWEST REGIONAL MEDICAL CENTER (11942)
SELECT SPECIALTY HOSPITAL − DANVILLE (12123)
JOHN HEINZ INSTITUTE OF REHABILITATION (11861)
HEALTHSOUTH NITTANY VALLEY REHABILITATION HOSPITAL (11667)
CRICHTON REHABILITATION CENTER (12273)
PALMERTON HOSPITAL (12396)
WELLSPAN SURGERY AND REHABILITATION HOSPITAL (27430)
COORDINATED HEALTH ORTHOPEDIC HOSPITAL LLC (11872)
WINDBER HOSPITAL (12031)
SHRINERS HOSPITALS FOR CHILDREN − PHILA (12244)
SUNBURY COMMUNITY HOSP (12105)
ST. LUKES QUAKERTOWN HOSPITAL (11711)
GUTHRIE TOWANDA MEMORIAL HOSPITAL (12549)
PENN STATE HERSHEY REHABILITATION LLC (11915)
ELLWOOD CITY HOSPITAL (11779)
CROZER CHESTER MEDICAL CENTER − SPRINGFIELD (11851)
BRADFORD REGIONAL MEDICAL CENTER (12361)
HEALTHSOUTH REHABILITATION HOSPITAL OF YORK (12058)
MAIN LINE HOSPITAL BRYN MAWR REHABILITATION (11417)
CHARLES COLE MEMORIAL HOSPITAL (11956)
HEALTHSOUTH REHABILITATION HOSPITAL OF SEWICKLEY (12066)
HEALTHSOUTH REHABILITATION HOSPITAL OF ALTOONA (11903)
J C BLAIR MEMORIAL HOSPITAL (11724)
WAYNESBORO HOSPITAL (11642)
NASON HOSPITAL (11907)
ST. LUKES MINERS MEMORIAL HOSPITAL (11784)
ALLIED SERVICES INSTITUTE OF REHABILITATION (12591)
GROVE CITY MEDICAL CENTER (11722)
HEALTHSOUTH REHABILITATION HOSPITAL OF MECHANICSBURG (12402)
SELECT SPECIALTY HOSPITAL − ERIE (11880)
BERWICK HOSPITAL CENTER (11442)
ST. CHRISTOPHERS HOSPITAL FOR CHILDREN (12290)
UPMC BEDFORD (11680)
PENN HIGHLANDS ELK (11859)
PUNXSUTAWNEY AREA HOSPITAL (11830)
GOOD SHEPHERD PENN PARTNERS AT RITTENHOUSE (13929)
TROY COMMUNITY HOSPITAL (12018)
CLARION HOSPITAL (11654)
SELECT SPECIALTY HOSPITAL − CENTRAL PENNSYLVANIA (YORK) (12334)
GOOD SHEPHERD REHABILITATION HOSPITAL, THE (11896)
WARREN GENERAL HOSPITAL (12216)
WAYNE MEMORIAL HOSPITAL (12004)
EASTERN REGIONAL MEDICAL CENTER (12348)
PENN HIGHLANDS CLEARFIELD (11843)
Better than predicted Not different than predicted Worse than predicted
77

Figure 4.3.3: Number of Observed (Obs.) Catheter-Associated Urinary Tract Infections (CAUTI) andRelative Ranking of Facilities by Standardized Infection Ratio (SIR) — Pennsylvania, 2014
Grouped by Number of Predicted (Pred.) Infections: 3–7.49
0 1 5 10 15
SIR and 95% CI
Obs. 1
Pred.
3
SIR
2
Facility and NHSN ID
1
8
3
1
1
2
1
3
3
5
6
4
4
7
2
0
7
3
3
3
4
4
5
5
3
26
6
6
0
17
3
17
1
5
5
8
4
0
8
2
5
0
7
7
5
8
4
11
2
0
3.00
3.18
3.39
3.41
3.50
3.60
3.62
3.63
3.66
3.66
3.74
3.77
3.79
3.82
3.91
4.16
4.18
4.32
4.34
4.47
4.54
4.56
4.58
4.66
4.67
4.67
4.70
4.71
4.73
4.89
5.00
5.01
5.04
5.04
5.22
5.22
5.38
5.55
5.80
5.85
6.01
6.02
6.19
6.40
6.42
6.51
6.58
6.72
6.82
6.90
6.99
7.10
7.31
0.3
0.9
0.6
0.3
2.3
0.8
0.3
0.3
0.5
0.3
0.8
0.8
1.3
1.6
1.0
1.0
1.7
0.5
0.0
1.6
0.7
0.7
0.7
0.9
0.9
1.1
1.1
0.6
5.5
1.2
1.2
0.0
3.4
0.6
3.3
0.2
0.9
0.9
1.4
0.7
0.0
1.3
0.3
0.8
0.0
1.1
1.1
0.7
1.2
0.6
1.6
0.3
0.0
SOLDIERS AND SAILORS MEMORIAL HOSPITAL (11688)
GNADEN HUETTEN MEMORIAL HOSPITAL (12241)
HEART OF LANCASTER REGIONAL MEDICAL CENTER (12571)
EXCELA HEALTH FRICK HOSPITAL (11639)
SELECT SPECIALTY HOSPITAL − CENTRAL PA (13921)
SELECT SPECIALTY HOSPITAL − CENTRAL PENNSYLVANIA (CAMP HILL) (12147)
CANONSBURG HOSPITAL (11586)
JENNERSVILLE REGIONAL HOSPITAL (12337)
OHIO VALLEY GENERAL HOSPITAL (12298)
SELECT SPECIALTY HOSPITAL − MCKEESPORT, INC. (12271)
LOWER BUCKS HOSPITAL (12390)
SCHUYLKILL MEDICAL CENTER − EAST NORWEGIAN STREET (11922)
KINDRED HOSPITAL − PITTSBURGH (12358)
LIFECARE HOSPITALS OF MECHANICSBURG (12388)
GETTYSBURG HOSPITAL (11531)
LIFECARE HOSPITALS OF PITTSBURGH (11945)
BRANDYWINE HOSPITAL (11979)
LANSDALE HOSPITAL (12032)
EINSTEIN AT ELKINS PARK (12500)
HEALTHSOUTH HARMARVILLE REHABILITATION HOSPITAL (11727)
MILLCREEK COMMUNITY HOSPITAL (12253)
LIFECARE HOSPITALS OF PITTSBURGH − ALLE−KISKI CAMPUS (18955)
ST. LUKES HOSPITAL− ANDERSON CAMPUS (21487)
LIFECARE HOSPITALS OF CHESTER COUNTY LLC (12005)
MEMORIAL HOSPITAL (11633)
MOSS REHABILITATION (12508)
SELECT SPECIALTY HOSPITAL LAUREL HIGHLANDS INC (12108)
SACRED HEART HOSPITAL (11684)
GOOD SHEPHERD SPECIALTY HOSPITAL (11887)
SCHUYLKILL MEDICAL CENTER − SOUTH JACKSON STREET (12087)
INDIANA REGIONAL MEDICAL CENTER (11759)
CARLISLE REGIONAL MEDICAL CENTER (11997)
KINDRED HOSPITAL − PHILADELPHIA (11832)
KINDRED HOSPITAL SOUTH PHILADELPHIA (11940)
ST. JOSEPHS HOSPITAL (12438)
LIFECARE HOSPITALS OF PITTSBURGH − SUBURBAN CAMPUS (12385)
HANOVER HOSPITAL (11899)
POST ACUTE MEDICAL SPECIALTY HOSPITAL OF WILKES−BARRE (12604)
LIFECARE HOSPITALS OF PITTSBURGH − MONROEVILLE (12254)
ALLEGHENY VALLEY HOSPITAL (11842)
LANCASTER REGIONAL MEDICAL CENTER (12335)
KINDRED HOSPITAL AT HERITAGE VALLEY (12268)
ARMSTRONG COUNTY MEMORIAL HOSPITAL (12057)
SELECT SPECIALTY HOSPITAL − PITTSBURGH/UPMC (12009)
ROXBOROUGH MEMORIAL HOSPITAL (11978)
PHOENIXVILLE HOSPITAL COMPANY LLC (11836)
SELECT SPECIALTY HOSPITAL − JOHNSTOWN (12299)
EVANGELICAL COMMUNITY HOSPITAL (11701)
PENN HIGHLANDS DUBOIS (11606)
KINDRED HOSPITAL PHILADELPHIA−HAVERTOWN (12908)
MONONGAHELA VALLEY HOSPITAL (11069)
UPMC NORTHWEST (11837)
SOMERSET HOSPITAL (12282)
Better than predicted Not different than predicted Worse than predicted
78
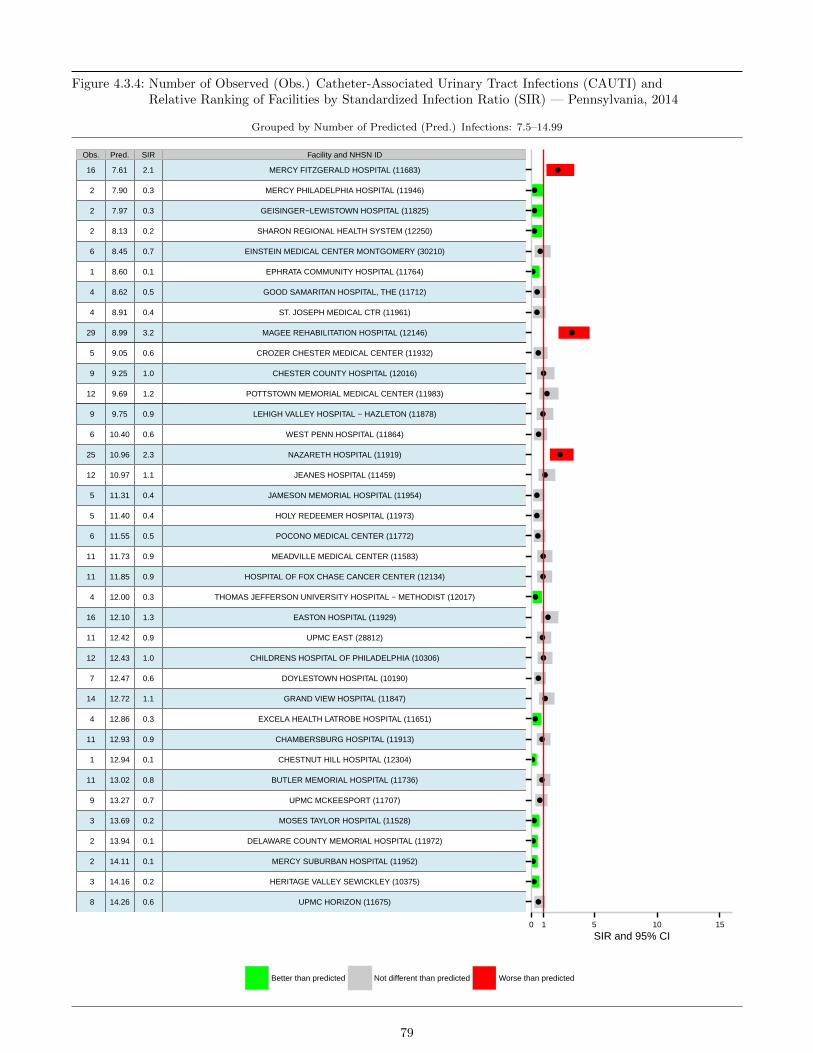
Figure 4.3.4: Number of Observed (Obs.) Catheter-Associated Urinary Tract Infections (CAUTI) andRelative Ranking of Facilities by Standardized Infection Ratio (SIR) — Pennsylvania, 2014
Grouped by Number of Predicted (Pred.) Infections: 7.5–14.99
0 1 5 10 15
SIR and 95% CI
Obs.
16
Pred.
2
SIR
2
Facility and NHSN ID
2
6
1
4
4
29
5
9
12
9
6
25
12
5
5
6
11
11
4
16
11
12
7
14
4
11
1
11
9
3
2
2
3
8
7.61
7.90
7.97
8.13
8.45
8.60
8.62
8.91
8.99
9.05
9.25
9.69
9.75
10.40
10.96
10.97
11.31
11.40
11.55
11.73
11.85
12.00
12.10
12.42
12.43
12.47
12.72
12.86
12.93
12.94
13.02
13.27
13.69
13.94
14.11
14.16
14.26
2.1
0.3
0.3
0.2
0.7
0.1
0.5
0.4
3.2
0.6
1.0
1.2
0.9
0.6
2.3
1.1
0.4
0.4
0.5
0.9
0.9
0.3
1.3
0.9
1.0
0.6
1.1
0.3
0.9
0.1
0.8
0.7
0.2
0.1
0.1
0.2
0.6
MERCY FITZGERALD HOSPITAL (11683)
MERCY PHILADELPHIA HOSPITAL (11946)
GEISINGER−LEWISTOWN HOSPITAL (11825)
SHARON REGIONAL HEALTH SYSTEM (12250)
EINSTEIN MEDICAL CENTER MONTGOMERY (30210)
EPHRATA COMMUNITY HOSPITAL (11764)
GOOD SAMARITAN HOSPITAL, THE (11712)
ST. JOSEPH MEDICAL CTR (11961)
MAGEE REHABILITATION HOSPITAL (12146)
CROZER CHESTER MEDICAL CENTER (11932)
CHESTER COUNTY HOSPITAL (12016)
POTTSTOWN MEMORIAL MEDICAL CENTER (11983)
LEHIGH VALLEY HOSPITAL − HAZLETON (11878)
WEST PENN HOSPITAL (11864)
NAZARETH HOSPITAL (11919)
JEANES HOSPITAL (11459)
JAMESON MEMORIAL HOSPITAL (11954)
HOLY REDEEMER HOSPITAL (11973)
POCONO MEDICAL CENTER (11772)
MEADVILLE MEDICAL CENTER (11583)
HOSPITAL OF FOX CHASE CANCER CENTER (12134)
THOMAS JEFFERSON UNIVERSITY HOSPITAL − METHODIST (12017)
EASTON HOSPITAL (11929)
UPMC EAST (28812)
CHILDRENS HOSPITAL OF PHILADELPHIA (10306)
DOYLESTOWN HOSPITAL (10190)
GRAND VIEW HOSPITAL (11847)
EXCELA HEALTH LATROBE HOSPITAL (11651)
CHAMBERSBURG HOSPITAL (11913)
CHESTNUT HILL HOSPITAL (12304)
BUTLER MEMORIAL HOSPITAL (11736)
UPMC MCKEESPORT (11707)
MOSES TAYLOR HOSPITAL (11528)
DELAWARE COUNTY MEMORIAL HOSPITAL (11972)
MERCY SUBURBAN HOSPITAL (11952)
HERITAGE VALLEY SEWICKLEY (10375)
UPMC HORIZON (11675)
Better than predicted Not different than predicted Worse than predicted
79
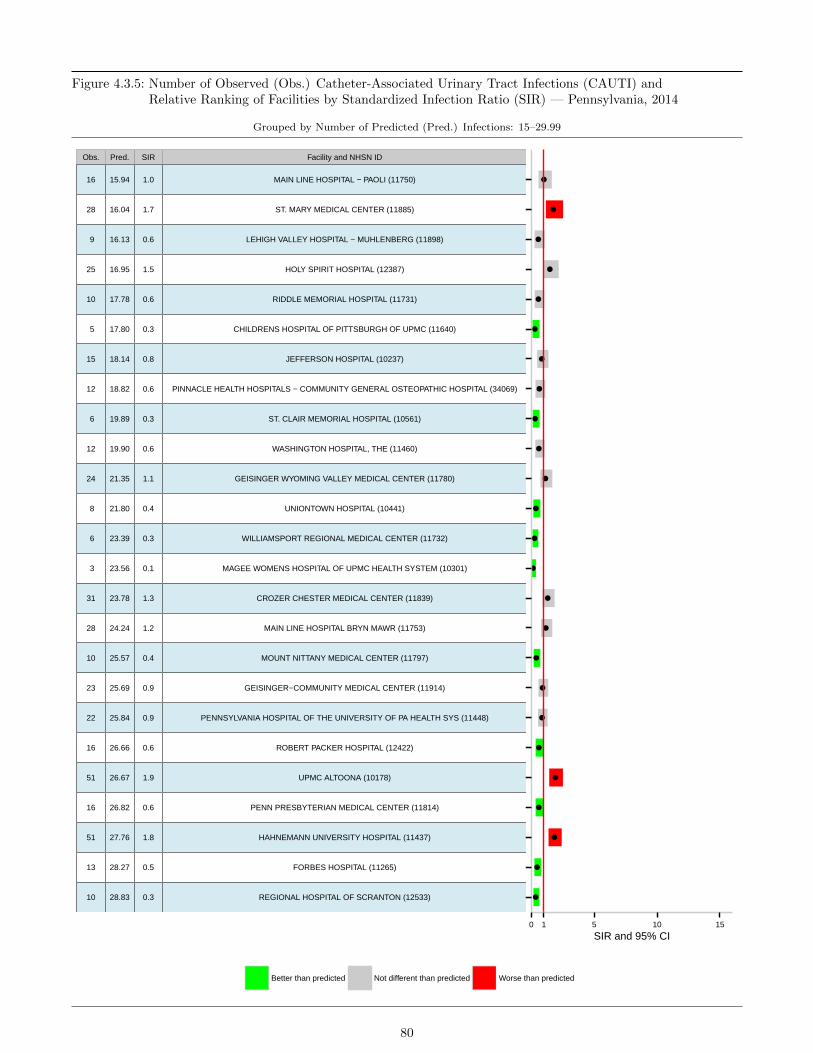
Figure 4.3.5: Number of Observed (Obs.) Catheter-Associated Urinary Tract Infections (CAUTI) andRelative Ranking of Facilities by Standardized Infection Ratio (SIR) — Pennsylvania, 2014
Grouped by Number of Predicted (Pred.) Infections: 15–29.99
0 1 5 10 15
SIR and 95% CI
Obs.
16
Pred.
28
SIR
9
Facility and NHSN ID
25
10
5
15
12
6
12
24
8
6
3
31
28
10
23
22
16
51
16
51
13
10
15.94
16.04
16.13
16.95
17.78
17.80
18.14
18.82
19.89
19.90
21.35
21.80
23.39
23.56
23.78
24.24
25.57
25.69
25.84
26.66
26.67
26.82
27.76
28.27
28.83
1.0
1.7
0.6
1.5
0.6
0.3
0.8
0.6
0.3
0.6
1.1
0.4
0.3
0.1
1.3
1.2
0.4
0.9
0.9
0.6
1.9
0.6
1.8
0.5
0.3
MAIN LINE HOSPITAL − PAOLI (11750)
ST. MARY MEDICAL CENTER (11885)
LEHIGH VALLEY HOSPITAL − MUHLENBERG (11898)
HOLY SPIRIT HOSPITAL (12387)
RIDDLE MEMORIAL HOSPITAL (11731)
CHILDRENS HOSPITAL OF PITTSBURGH OF UPMC (11640)
JEFFERSON HOSPITAL (10237)
PINNACLE HEALTH HOSPITALS − COMMUNITY GENERAL OSTEOPATHIC HOSPITAL (34069)
ST. CLAIR MEMORIAL HOSPITAL (10561)
WASHINGTON HOSPITAL, THE (11460)
GEISINGER WYOMING VALLEY MEDICAL CENTER (11780)
UNIONTOWN HOSPITAL (10441)
WILLIAMSPORT REGIONAL MEDICAL CENTER (11732)
MAGEE WOMENS HOSPITAL OF UPMC HEALTH SYSTEM (10301)
CROZER CHESTER MEDICAL CENTER (11839)
MAIN LINE HOSPITAL BRYN MAWR (11753)
MOUNT NITTANY MEDICAL CENTER (11797)
GEISINGER−COMMUNITY MEDICAL CENTER (11914)
PENNSYLVANIA HOSPITAL OF THE UNIVERSITY OF PA HEALTH SYS (11448)
ROBERT PACKER HOSPITAL (12422)
UPMC ALTOONA (10178)
PENN PRESBYTERIAN MEDICAL CENTER (11814)
HAHNEMANN UNIVERSITY HOSPITAL (11437)
FORBES HOSPITAL (11265)
REGIONAL HOSPITAL OF SCRANTON (12533)
Better than predicted Not different than predicted Worse than predicted
80

Figure 4.3.6: Number of Observed (Obs.) Catheter-Associated Urinary Tract Infections (CAUTI) andRelative Ranking of Facilities by Standardized Infection Ratio (SIR) — Pennsylvania, 2014
Grouped by Number of Predicted (Pred.) Infections: > 30
0 1 5 10 15
SIR and 95% CI
Obs.
26
Pred.
29
SIR
25
Facility and NHSN ID
25
21
30
24
35
54
34
25
45
59
38
66
36
63
32
33
14
53
180
86
148
137
112
200
30.47
31.54
32.11
32.72
33.41
34.48
36.80
36.93
38.32
40.24
40.77
41.50
41.61
41.87
41.95
44.51
44.77
46.18
48.24
55.14
57.27
72.42
74.87
80.43
87.27
99.42
132.67
0.9
0.9
0.8
0.8
0.6
0.9
0.7
0.9
1.4
0.8
0.6
1.1
1.4
0.9
1.6
0.8
1.4
0.7
0.7
0.3
0.9
2.5
1.1
1.8
1.6
1.1
1.5
LANCASTER GENERAL HOSPITAL (10183)
SAINT VINCENT HOSPITAL (11699)
HERITAGE VALLEY BEAVER (11831)
UPMC PASSAVANT (11242)
EXCELA HEALTH WESTMORELAND REGIONAL HOSPITAL (11637)
UPMC ST. MARGARET (11561)
MAIN LINE HOSPITAL LANKENAU MEDICAL CENTER (11770)
ST. LUKES HOSPITAL BETHLEHEM (11718)
ABINGTON MEMORIAL HOSPITAL (11838)
GEISINGER MEDICAL CENTER (11775)
WILKES−BARRE GENERAL HOSPITAL (11916)
UPMC HAMOT (11725)
READING HOSPITAL (12375)
ALBERT EINSTEIN MEDICAL CENTER (10585)
ARIA HEALTH (11388)
PINNACLE HEALTH HOSPITALS − HARRISBURG HOSPITAL (34068)
YORK HOSPITAL (10108)
MILTON S HERSHEY MEDICAL CENTER (11747)
UPMC MERCY (10384)
CONEMAUGH MEMORIAL MEDICAL CENTER (10280)
TEMPLE UNIVERSITY HOSPITAL (12382)
LEHIGH VALLEY HOSPITAL (11884)
UPMC PRESBYTERIAN SHADYSIDE − SHADYSIDE (10118)
HOSPITAL OF THE UNIVERSITY OF PENNSYLVANIA (10219)
ALLEGHENY GENERAL HOSPITAL (10648)
THOMAS JEFFERSON UNIVERSITY HOSPITAL (11506)
UPMC PRESBYTERIAN SHADYSIDE (10348)
Better than predicted Not different than predicted Worse than predicted
81
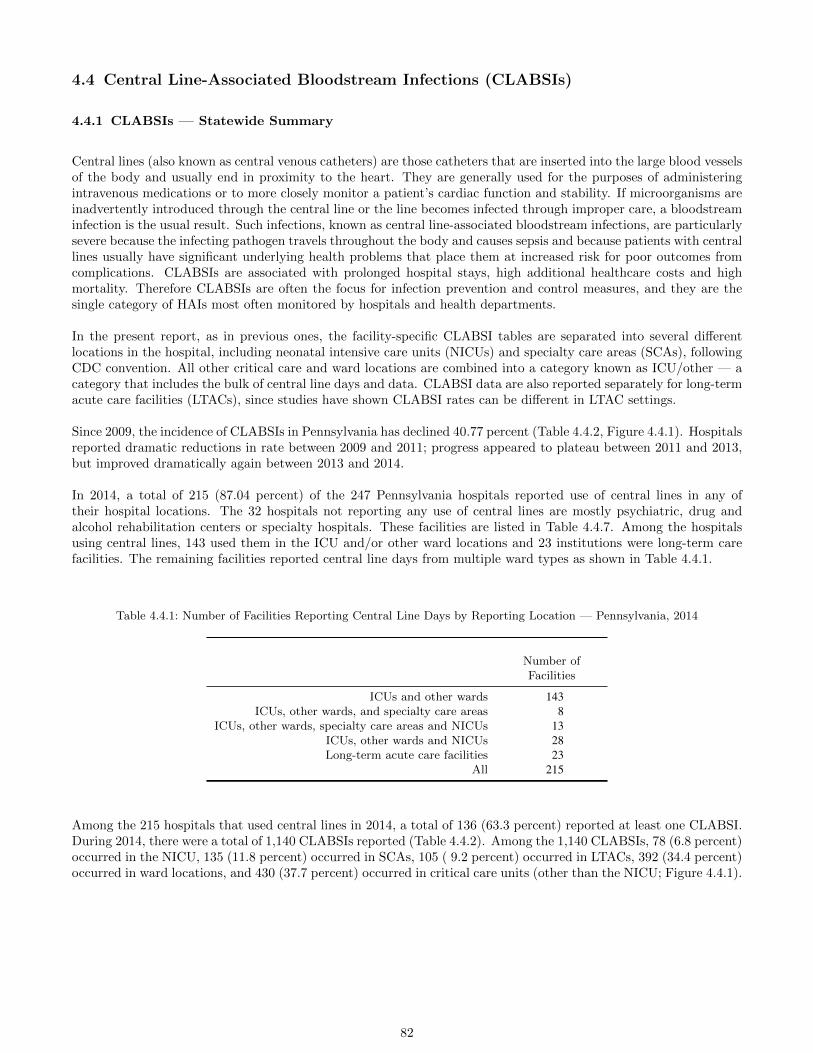
4.4 Central Line-Associated Bloodstream Infections (CLABSIs)
4.4.1 CLABSIs — Statewide Summary
Central lines (also known as central venous catheters) are those catheters that are inserted into the large blood vesselsof the body and usually end in proximity to the heart. They are generally used for the purposes of administeringintravenous medications or to more closely monitor a patient’s cardiac function and stability. If microorganisms areinadvertently introduced through the central line or the line becomes infected through improper care, a bloodstreaminfection is the usual result. Such infections, known as central line-associated bloodstream infections, are particularlysevere because the infecting pathogen travels throughout the body and causes sepsis and because patients with centrallines usually have significant underlying health problems that place them at increased risk for poor outcomes fromcomplications. CLABSIs are associated with prolonged hospital stays, high additional healthcare costs and highmortality. Therefore CLABSIs are often the focus for infection prevention and control measures, and they are thesingle category of HAIs most often monitored by hospitals and health departments.
In the present report, as in previous ones, the facility-specific CLABSI tables are separated into several differentlocations in the hospital, including neonatal intensive care units (NICUs) and specialty care areas (SCAs), followingCDC convention. All other critical care and ward locations are combined into a category known as ICU/other — acategory that includes the bulk of central line days and data. CLABSI data are also reported separately for long-termacute care facilities (LTACs), since studies have shown CLABSI rates can be different in LTAC settings.
Since 2009, the incidence of CLABSIs in Pennsylvania has declined 40.77 percent (Table 4.4.2, Figure 4.4.1). Hospitalsreported dramatic reductions in rate between 2009 and 2011; progress appeared to plateau between 2011 and 2013,but improved dramatically again between 2013 and 2014.
In 2014, a total of 215 (87.04 percent) of the 247 Pennsylvania hospitals reported use of central lines in any oftheir hospital locations. The 32 hospitals not reporting any use of central lines are mostly psychiatric, drug andalcohol rehabilitation centers or specialty hospitals. These facilities are listed in Table 4.4.7. Among the hospitalsusing central lines, 143 used them in the ICU and/or other ward locations and 23 institutions were long-term carefacilities. The remaining facilities reported central line days from multiple ward types as shown in Table 4.4.1.
Table 4.4.1: Number of Facilities Reporting Central Line Days by Reporting Location — Pennsylvania, 2014
Number ofFacilities
ICUs and other wards 143ICUs, other wards, and specialty care areas 8
ICUs, other wards, specialty care areas and NICUs 13ICUs, other wards and NICUs 28Long-term acute care facilities 23
All 215
Among the 215 hospitals that used central lines in 2014, a total of 136 (63.3 percent) reported at least one CLABSI.During 2014, there were a total of 1,140 CLABSIs reported (Table 4.4.2). Among the 1,140 CLABSIs, 78 (6.8 percent)occurred in the NICU, 135 (11.8 percent) occurred in SCAs, 105 ( 9.2 percent) occurred in LTACs, 392 (34.4 percent)occurred in ward locations, and 430 (37.7 percent) occurred in critical care units (other than the NICU; Figure 4.4.1).
82
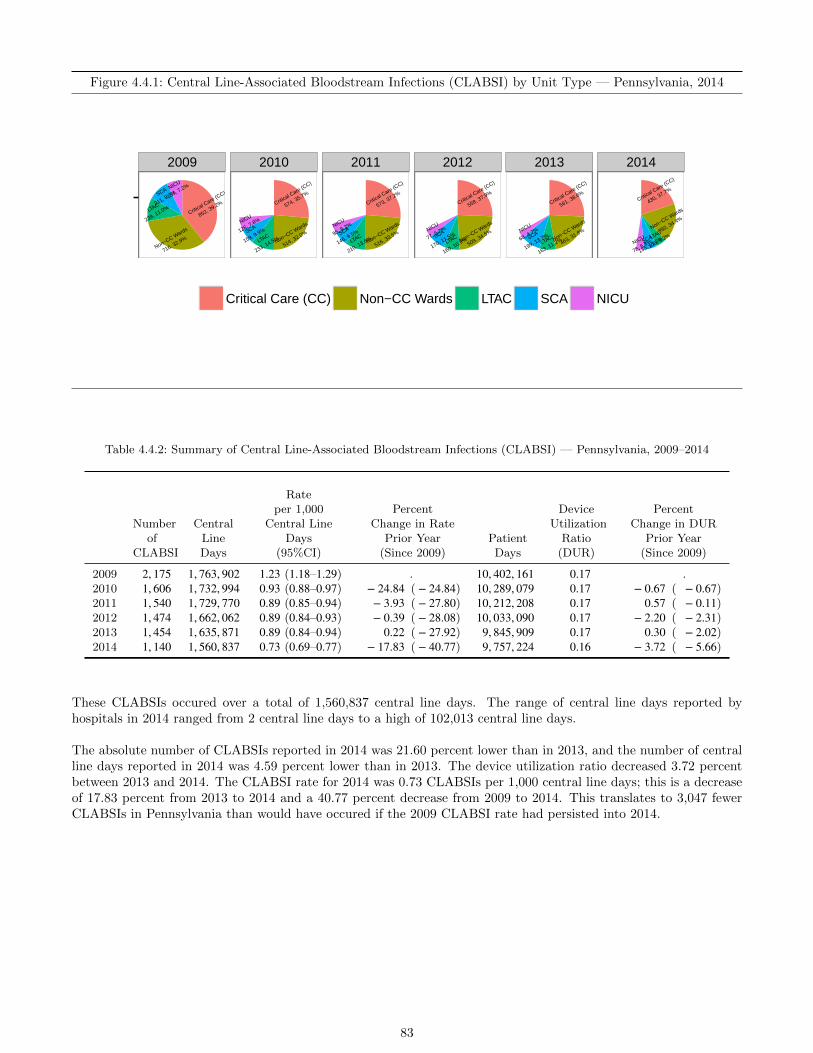
Figure 4.4.1: Central Line-Associated Bloodstream Infections (CLABSI) by Unit Type — Pennsylvania, 2014
2009 2010 2011 2012 2013 2014
Critical C
are (CC)
852, 39.2%
Non−CC Wards
716, 32.9%
LTAC
239, 11.0%
SCA
211, 9.7%NICU
157, 7.2%
Critical C
are (CC)
574, 35.7%
Non−CC Wards
514, 32.0%LTAC
233, 14.5%
SCA
159, 9.9%
NICU
126, 7.8%
Critical C
are (CC)
573, 37.2%
Non−CC Wards
516, 33.5%LTAC
210, 13.6%SCA
146, 9.5%NICU
95, 6.2%
Critical C
are (CC)
558, 37.9%
Non−CC Wards
509, 34.5%
LTAC
160, 10.9%SCA
170, 11.5%NICU
77, 5.2%
Critical C
are (CC)
561, 38.6%
Non−CC Wards
463, 31.8%
LTAC
163, 11.2%SCA
199, 13.7%NICU
68, 4.7%
Critical C
are (CC)
430, 37.7%
Non−CC Wards
392, 34.4%
LTAC
105, 9.2%SCA
135, 11.8%NICU
78, 6.8%
Critical Care (CC) Non−CC Wards LTAC SCA NICU
Table 4.4.2: Summary of Central Line-Associated Bloodstream Infections (CLABSI) — Pennsylvania, 2009–2014
Numberof
CLABSI
CentralLineDays
Rateper 1,000
Central LineDays
(95%CI)
PercentChange in Rate
Prior Year(Since 2009)
PatientDays
DeviceUtilization
Ratio(DUR)
PercentChange in DUR
Prior Year(Since 2009)
2009 2, 175 1, 763, 902 1.23 (1.18–1.29) . 10, 402, 161 0.17 .2010 1, 606 1, 732, 994 0.93 (0.88–0.97) − 24.84 ( − 24.84) 10, 289, 079 0.17 − 0.67 ( − 0.67)2011 1, 540 1, 729, 770 0.89 (0.85–0.94) − 3.93 ( − 27.80) 10, 212, 208 0.17 0.57 ( − 0.11)2012 1, 474 1, 662, 062 0.89 (0.84–0.93) − 0.39 ( − 28.08) 10, 033, 090 0.17 − 2.20 ( − 2.31)2013 1, 454 1, 635, 871 0.89 (0.84–0.94) 0.22 ( − 27.92) 9, 845, 909 0.17 0.30 ( − 2.02)2014 1, 140 1, 560, 837 0.73 (0.69–0.77) − 17.83 ( − 40.77) 9, 757, 224 0.16 − 3.72 ( − 5.66)
These CLABSIs occured over a total of 1,560,837 central line days. The range of central line days reported byhospitals in 2014 ranged from 2 central line days to a high of 102,013 central line days.
The absolute number of CLABSIs reported in 2014 was 21.60 percent lower than in 2013, and the number of centralline days reported in 2014 was 4.59 percent lower than in 2013. The device utilization ratio decreased 3.72 percentbetween 2013 and 2014. The CLABSI rate for 2014 was 0.73 CLABSIs per 1,000 central line days; this is a decreaseof 17.83 percent from 2013 to 2014 and a 40.77 percent decrease from 2009 to 2014. This translates to 3,047 fewerCLABSIs in Pennsylvania than would have occured if the 2009 CLABSI rate had persisted into 2014.
83

4.4.2 CLABSIs — By Unit Type
Table 4.4.3: Central Line-Associated Bloodstream Infections (CLABSI), Infection Rates per 1,000 Patient Days and DeviceUtilization Rates (DUR) by Location within Facility—Pennsylvania, 2009–2014
Number ofCLABSI
CentralLine Days
Rateper 1,000
Central LineDays Patient Days
Device UtilizationRatio — DUR
(Line Days / Pt. Days)
NICU2014 78 53, 928 1.45 275, 572 0.202013 68 54, 182 1.26 268, 868 0.202012 77 57, 800 1.33 270, 917 0.212011 95 62, 271 1.53 271, 973 0.232010 126 61, 923 2.03 269, 940 0.232009 157 63, 465 2.47 269, 141 0.24
SCA2014 135 121, 881 1.11 206, 506 0.592013 199 125, 719 1.58 207, 810 0.602012 170 125, 977 1.35 214, 677 0.592011 146 121, 378 1.20 213, 907 0.572010 159 120, 488 1.32 211, 508 0.572009 211 109, 429 1.93 193, 468 0.57
Step2014 57 91, 714 0.62 612, 059 0.152013 88 98, 647 0.89 613, 261 0.162012 52 87, 412 0.59 568, 933 0.152011 90 95, 516 0.94 598, 034 0.162010 80 101, 460 0.79 634, 482 0.162009 116 91, 932 1.26 616, 096 0.15
LTAC2014 105 118, 757 0.88 216, 711 0.552013 163 137, 716 1.18 251, 711 0.552012 160 143, 525 1.11 256, 287 0.562011 210 158, 640 1.32 271, 324 0.582010 233 165, 095 1.41 291, 486 0.572009 239 169, 404 1.41 299, 105 0.57
cc:Burn2014 7 4, 492 1.56 12, 671 0.352013 10 5, 316 1.88 13, 088 0.412012 11 4, 788 2.30 12, 251 0.392011 12 4, 651 2.58 11, 135 0.422010 10 5, 029 1.99 12, 225 0.412009 22 5, 872 3.75 12, 389 0.47
cc:CT2014 45 66, 505 0.68 94, 088 0.712013 48 64, 956 0.74 91, 830 0.712012 47 61, 811 0.76 88, 143 0.702011 41 68, 598 0.60 97, 189 0.712010 54 70, 542 0.77 100, 018 0.712009 59 70, 493 0.84 102, 092 0.69
cc:MS2014 156 200, 923 0.78 440, 304 0.462013 172 209, 603 0.82 463, 063 0.452012 214 201, 280 1.06 444, 683 0.452011 203 207, 709 0.98 447, 121 0.462010 184 202, 790 0.91 439, 955 0.462009 295 199, 959 1.48 435, 264 0.46
Continued on next page . . .
84

Table 4.4.3 – Continued from previous page
Number ofCLABSI
CentralLine Days
Rateper 1,000
Central LineDays Patient Days
Device UtilizationRatio
(Line Days / Pt. Days)
cc:Med2014 61 67, 257 0.91 124, 738 0.542013 87 71, 263 1.22 125, 925 0.572012 61 71, 161 0.86 127, 491 0.562011 60 77, 049 0.78 144, 364 0.532010 78 74, 232 1.05 140, 201 0.532009 101 77, 760 1.30 143, 532 0.54
cc:Peds2014 31 33, 832 0.92 61, 738 0.552013 47 34, 482 1.36 62, 108 0.562012 42 30, 869 1.36 58, 071 0.532011 43 28, 318 1.52 57, 395 0.492010 54 29, 342 1.84 55, 559 0.532009 72 30, 325 2.37 55, 775 0.54
cc:SpecMed2014 18 28, 799 0.63 76, 244 0.382013 25 29, 487 0.85 74, 545 0.402012 44 36, 532 1.20 101, 137 0.362011 26 36, 536 0.71 106, 767 0.342010 28 47, 105 0.59 126, 836 0.372009 59 50, 182 1.18 134, 101 0.37
cc:Surgery2014 37 55, 618 0.67 99, 475 0.562013 63 59, 069 1.07 102, 849 0.572012 69 63, 870 1.08 118, 824 0.542011 61 67, 819 0.90 123, 348 0.552010 41 66, 635 0.62 113, 392 0.592009 78 69, 728 1.12 114, 173 0.61
cc:Trauma2014 18 29, 111 0.62 51, 018 0.572013 21 29, 722 0.71 50, 959 0.582012 18 31, 937 0.56 53, 226 0.602011 37 34, 070 1.09 54, 962 0.622010 45 35, 379 1.27 54, 220 0.652009 50 35, 675 1.40 51, 572 0.69
w:Behavior2014 5 2, 721 1.84 1, 694, 136 0.002013 1 2, 378 0.42 1, 626, 139 0.002012 4 2, 214 1.81 1, 735, 712 0.002011 6 3, 626 1.65 1, 614, 797 0.002010 4 2, 911 1.37 1, 678, 564 0.002009 0 2, 314 0.00 1, 579, 712 0.00
w:LD pp2014 1 1, 089 0.92 374, 919 0.002013 0 1, 243 0.00 372, 699 0.002012 0 1, 100 0.00 372, 423 0.002011 0 630 0.00 382, 131 0.002010 0 884 0.00 382, 546 0.002009 0 1, 300 0.00 399, 601 0.00
Continued on next page . . .
85

Table 4.4.3 – Continued from previous page
Number ofCLABSI
CentralLine Days
Rateper 1,000
Central LineDays Patient Days
Device UtilizationRatio
(Line Days / Pt. Days)
w:MS2014 150 284, 842 0.53 2, 305, 133 0.122013 205 321, 803 0.64 2, 449, 401 0.132012 224 351, 145 0.64 2, 587, 551 0.142011 260 363, 669 0.71 2, 711, 996 0.132010 242 358, 963 0.67 2, 753, 456 0.132009 350 369, 713 0.95 2, 867, 926 0.13
w:Med2014 134 203, 047 0.66 1, 261, 364 0.162013 152 210, 273 0.72 1, 242, 237 0.172012 147 203, 620 0.72 1, 175, 387 0.172011 120 207, 931 0.58 1, 210, 801 0.172010 130 202, 382 0.64 1, 166, 026 0.172009 181 213, 384 0.85 1, 188, 519 0.18
w:Newborn2014 0 106 0.00 173, 218 0.002013 0 131 0.00 151, 918 0.002012 3 317 9.46 154, 922 0.002011 0 275 0.00 170, 453 0.002010 0 224 0.00 168, 353 0.002009 0 154 0.00 181, 102 0.00
w:Ped ms2014 35 36, 109 0.97 224, 727 0.162013 48 34, 068 1.41 229, 380 0.152012 41 31, 905 1.29 232, 760 0.142011 44 33, 124 1.33 235, 930 0.142010 45 30, 948 1.45 219, 810 0.142009 67 36, 436 1.84 235, 280 0.15
w:Rehab2014 21 46, 928 0.45 689, 599 0.072013 14 45, 291 0.31 701, 821 0.062012 31 45, 787 0.68 674, 745 0.072011 22 45, 373 0.48 663, 495 0.072010 18 43, 171 0.42 646, 213 0.072009 29 44, 286 0.65 648, 117 0.07
w:Surgery2014 46 113, 178 0.41 763, 004 0.152013 43 100, 522 0.43 746, 297 0.132012 59 109, 012 0.54 784, 950 0.142011 64 112, 587 0.57 825, 086 0.142010 75 113, 491 0.66 824, 289 0.142009 89 122, 091 0.73 875, 196 0.14
86
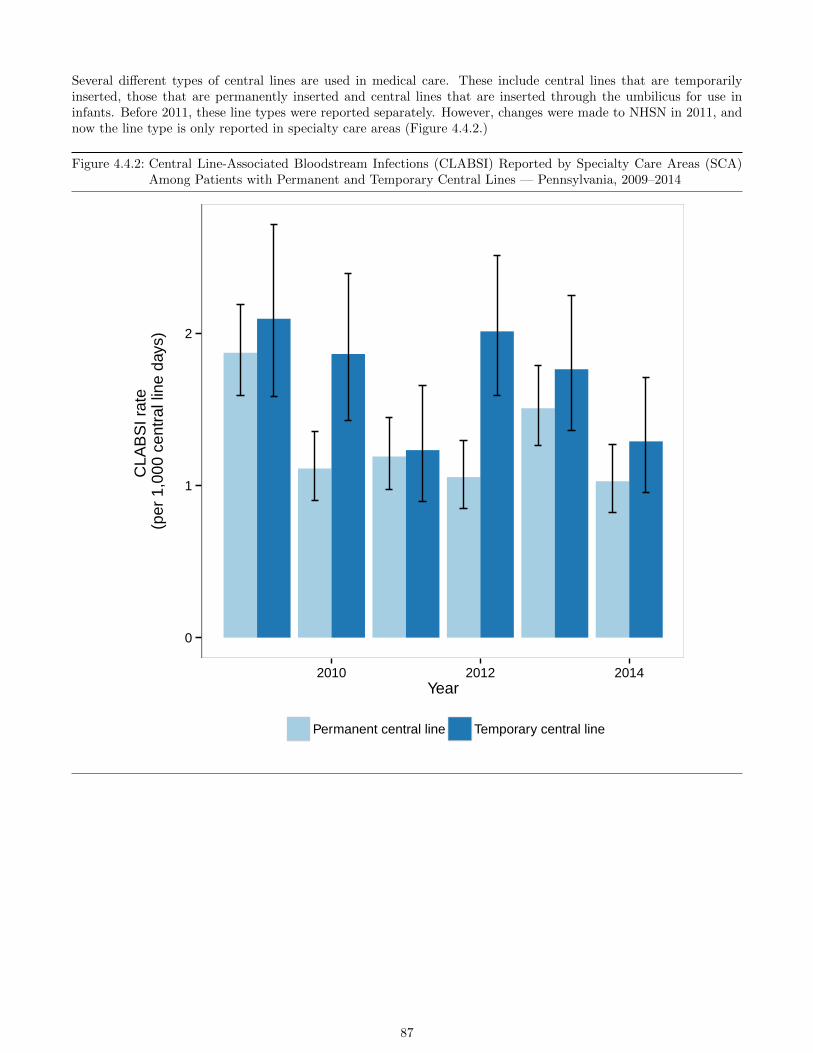
Several different types of central lines are used in medical care. These include central lines that are temporarilyinserted, those that are permanently inserted and central lines that are inserted through the umbilicus for use ininfants. Before 2011, these line types were reported separately. However, changes were made to NHSN in 2011, andnow the line type is only reported in specialty care areas (Figure 4.4.2.)
Figure 4.4.2: Central Line-Associated Bloodstream Infections (CLABSI) Reported by Specialty Care Areas (SCA)Among Patients with Permanent and Temporary Central Lines — Pennsylvania, 2009–2014
0
1
2
2010 2012 2014Year
CLA
BS
I rat
e (p
er 1
,000
cen
tral
line
day
s)
Permanent central line Temporary central line
87
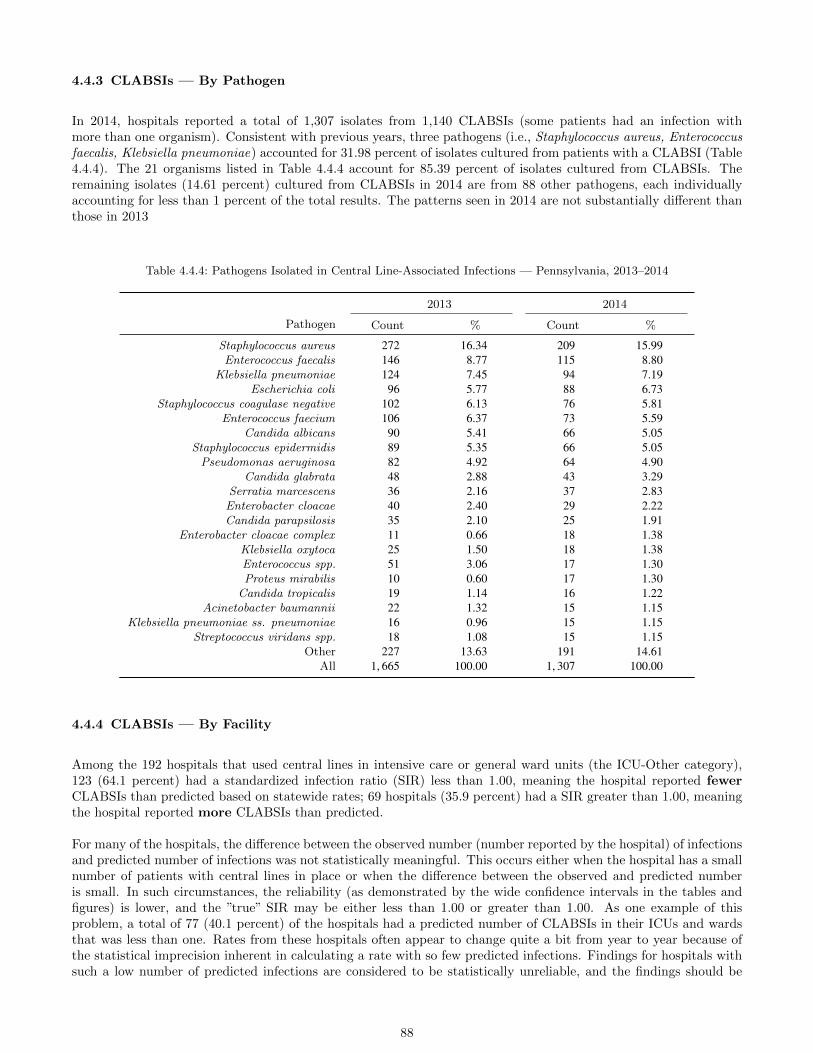
4.4.3 CLABSIs — By Pathogen
In 2014, hospitals reported a total of 1,307 isolates from 1,140 CLABSIs (some patients had an infection withmore than one organism). Consistent with previous years, three pathogens (i.e., Staphylococcus aureus, Enterococcusfaecalis, Klebsiella pneumoniae) accounted for 31.98 percent of isolates cultured from patients with a CLABSI (Table4.4.4). The 21 organisms listed in Table 4.4.4 account for 85.39 percent of isolates cultured from CLABSIs. Theremaining isolates (14.61 percent) cultured from CLABSIs in 2014 are from 88 other pathogens, each individuallyaccounting for less than 1 percent of the total results. The patterns seen in 2014 are not substantially different thanthose in 2013
Table 4.4.4: Pathogens Isolated in Central Line-Associated Infections — Pennsylvania, 2013–2014
2013 2014
Pathogen Count % Count %
Staphylococcus aureus 272 16.34 209 15.99Enterococcus faecalis 146 8.77 115 8.80
Klebsiella pneumoniae 124 7.45 94 7.19Escherichia coli 96 5.77 88 6.73
Staphylococcus coagulase negative 102 6.13 76 5.81Enterococcus faecium 106 6.37 73 5.59
Candida albicans 90 5.41 66 5.05Staphylococcus epidermidis 89 5.35 66 5.05Pseudomonas aeruginosa 82 4.92 64 4.90
Candida glabrata 48 2.88 43 3.29Serratia marcescens 36 2.16 37 2.83Enterobacter cloacae 40 2.40 29 2.22Candida parapsilosis 35 2.10 25 1.91
Enterobacter cloacae complex 11 0.66 18 1.38Klebsiella oxytoca 25 1.50 18 1.38Enterococcus spp. 51 3.06 17 1.30Proteus mirabilis 10 0.60 17 1.30
Candida tropicalis 19 1.14 16 1.22Acinetobacter baumannii 22 1.32 15 1.15
Klebsiella pneumoniae ss. pneumoniae 16 0.96 15 1.15Streptococcus viridans spp. 18 1.08 15 1.15
Other 227 13.63 191 14.61All 1, 665 100.00 1, 307 100.00
4.4.4 CLABSIs — By Facility
Among the 192 hospitals that used central lines in intensive care or general ward units (the ICU-Other category),123 (64.1 percent) had a standardized infection ratio (SIR) less than 1.00, meaning the hospital reported fewerCLABSIs than predicted based on statewide rates; 69 hospitals (35.9 percent) had a SIR greater than 1.00, meaningthe hospital reported more CLABSIs than predicted.
For many of the hospitals, the difference between the observed number (number reported by the hospital) of infectionsand predicted number of infections was not statistically meaningful. This occurs either when the hospital has a smallnumber of patients with central lines in place or when the difference between the observed and predicted numberis small. In such circumstances, the reliability (as demonstrated by the wide confidence intervals in the tables andfigures) is lower, and the ”true” SIR may be either less than 1.00 or greater than 1.00. As one example of thisproblem, a total of 77 (40.1 percent) of the hospitals had a predicted number of CLABSIs in their ICUs and wardsthat was less than one. Rates from these hospitals often appear to change quite a bit from year to year because ofthe statistical imprecision inherent in calculating a rate with so few predicted infections. Findings for hospitals withsuch a low number of predicted infections are considered to be statistically unreliable, and the findings should be
88
very cautiously interpreted and used.
Among the 192 hospitals in the ICU-other category, 10 hospitals (5.2 percent) had a reported number of CLABSIsthat was significantly better than predicted. These hospitals are listed below in Table 4.4.5 in alphabetical orderand are designated in green in Figures 4.4.3 – 4.4.7. In contrast, 10 hospitals (5.2 percent) had a reported number ofCLABSIs that was significantly worse than predicted. These hospitals are listed below in Table 4.4.6 in alphabeticalorder and are designated in red in Figures 4.4.3 – 4.4.7. All other hospitals are considered to have an incidence ofCLABSIs in their critical care units and ward locations that are within (or no different from) the number of predictedbased on statewide rates of CLABSIs.
Among the other CLABSI-related locations (NICU, SCA and LTAC), 4 facilities with specialty care areas and 1facility with a long-term acute care facility reported more CLABSIs than predicted. No NICUs had an observednumber of infections that was significantly worse than predicted. Among 21 specialty care areas, the observed numberof infections was significantly better than predicted in three hospitals (14.3 percent) and significantly worse thanpredicted in four hospitals (19.0 percent). Among 23 long term-acute care hospitals, there was three (13.0 percent)facilities that had an observed number of infections that was significantly better than predicted and one (4.3 percent)that was significantly worse than predicted.
Tables 4.4.8–4.4.11 list CLABSI rates and the predicted number of infections for ICUs and other wards, NICUs,SCAs and LTACs in alphabetical order by facility. In order to categorize and compare hospitals that are similar,Figures 4.4.3–4.4.12 divide the hospitals based on the reporting location (e.g., ICUs and other wards) and the numberof predicted infections. Within each tier, hospitals are listed in order by SIR from best to worst.
89
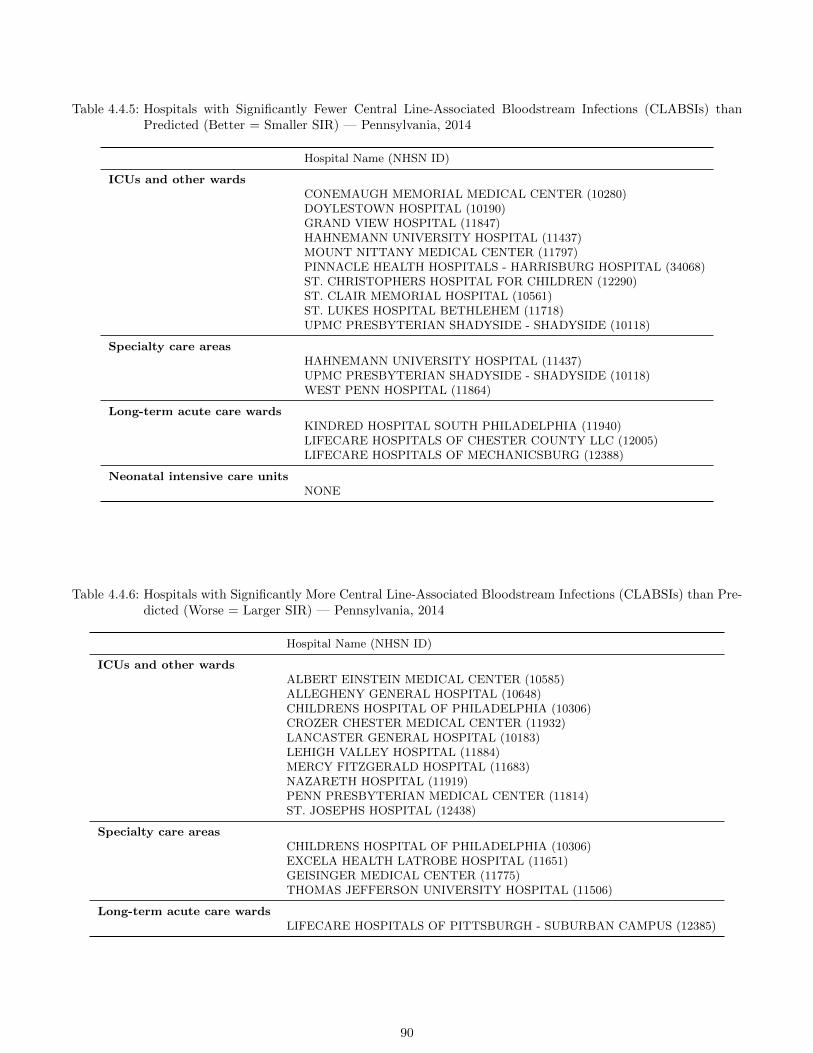
Table 4.4.5: Hospitals with Significantly Fewer Central Line-Associated Bloodstream Infections (CLABSIs) thanPredicted (Better = Smaller SIR) — Pennsylvania, 2014
Hospital Name (NHSN ID)
ICUs and other wardsCONEMAUGH MEMORIAL MEDICAL CENTER (10280)DOYLESTOWN HOSPITAL (10190)GRAND VIEW HOSPITAL (11847)HAHNEMANN UNIVERSITY HOSPITAL (11437)MOUNT NITTANY MEDICAL CENTER (11797)PINNACLE HEALTH HOSPITALS - HARRISBURG HOSPITAL (34068)ST. CHRISTOPHERS HOSPITAL FOR CHILDREN (12290)ST. CLAIR MEMORIAL HOSPITAL (10561)ST. LUKES HOSPITAL BETHLEHEM (11718)UPMC PRESBYTERIAN SHADYSIDE - SHADYSIDE (10118)
Specialty care areasHAHNEMANN UNIVERSITY HOSPITAL (11437)UPMC PRESBYTERIAN SHADYSIDE - SHADYSIDE (10118)WEST PENN HOSPITAL (11864)
Long-term acute care wardsKINDRED HOSPITAL SOUTH PHILADELPHIA (11940)LIFECARE HOSPITALS OF CHESTER COUNTY LLC (12005)LIFECARE HOSPITALS OF MECHANICSBURG (12388)
Neonatal intensive care unitsNONE
Table 4.4.6: Hospitals with Significantly More Central Line-Associated Bloodstream Infections (CLABSIs) than Pre-dicted (Worse = Larger SIR) — Pennsylvania, 2014
Hospital Name (NHSN ID)
ICUs and other wardsALBERT EINSTEIN MEDICAL CENTER (10585)ALLEGHENY GENERAL HOSPITAL (10648)CHILDRENS HOSPITAL OF PHILADELPHIA (10306)CROZER CHESTER MEDICAL CENTER (11932)LANCASTER GENERAL HOSPITAL (10183)LEHIGH VALLEY HOSPITAL (11884)MERCY FITZGERALD HOSPITAL (11683)NAZARETH HOSPITAL (11919)PENN PRESBYTERIAN MEDICAL CENTER (11814)ST. JOSEPHS HOSPITAL (12438)
Specialty care areasCHILDRENS HOSPITAL OF PHILADELPHIA (10306)EXCELA HEALTH LATROBE HOSPITAL (11651)GEISINGER MEDICAL CENTER (11775)THOMAS JEFFERSON UNIVERSITY HOSPITAL (11506)
Long-term acute care wardsLIFECARE HOSPITALS OF PITTSBURGH - SUBURBAN CAMPUS (12385)
90

Table 4.4.7: Hospitals Omitted from CLABSI SIR Analysis Due to No Reported Central-Line Use — Pennsylvania, 2014
Facility Name and NHSN ID
TITUSVILLE AREA HOSPITAL (11738)PHILHAVEN HOSPITAL (11740)DIVINE PROVIDENCE HOSPITAL (11743)DANVILLE STATE HOSPITAL (11848)NORRISTOWN STATE HOSPITAL (12047)FIRST HOSPITAL OF WYOMING VALLEY (12050)CLARKS SUMMIT STATE HOSPITAL (12051)WARREN STATE HOSPITAL (12081)TORRANCE STATE HOSPITAL (12091)MEADOWS PSYCHIATRIC CENTER, THE (12156)MONTGOMERY COUNTY MH/MR EMERGENCY SERVICES, INC. (12287)WERNERSVILLE STATE HOSPITAL (12368)KIDSPEACE ORCHARD HILLS CAMPUS (12430)SOUTHWOOD PSYCHIATRIC HOSPITAL (12453)CLARION PSYCHIATRIC CENTER (12454)FRIENDS HOSPITAL (12488)BELMONT CENTER FOR COMPREHENSIVE TREATMENT (12505)SURGICAL INSTITUTE OF READING (12535)HORSHAM CLINIC (12543)ST. JOHN VIANNEY HOSPITAL (12548)EDGEWOOD SURGICAL HOSPITAL (12552)FAIRMOUNT BEHAVIORAL HEALTH SYSTEM (12565)BROOKE GLEN BEHAVIORAL HOSPITAL (12623)KIRKBRIDE CENTER (12624)ROXBURY TREATMENT CENTER (12723)DEVEREUX CHILDRENS BEHAVIORAL HEALTH INSTITUTE (12738)FOUNDATIONS BEHAVIORAL HEALTH (12832)PENNSYLVANIA PSYCHIATRIC INSTITUTE (14190)HAVEN BEHAVIORAL HOSPITAL OF EASTERN PENNSYLVANIA (14471)ROTHMAN ORTHOPAEDIC SPECIALTY HOSPITAL (15202)ADVANCED SURGICAL HOSPITAL (16317)PHYSICIANS CARE SURGICAL HOSPITAL (19630)WILLS EYE HOSPITAL (34846)PINNACLE HEALTH HOSPITALS - WEST SHORE HOSPITAL (35123)ST. MARY REHABILITATION HOSPITAL LLP (36959)HAVEN BEHAVIORAL HOSPITAL OF PHILADELPHIA (37622)HELEN M. SIMPSON REHABILITATION HOSPITAL (40371)
91

Table 4.4.8: Critical Care Units and Wards: Central Line-Associated Bloodstream Infections, Central Line UtilizationRates and Standardized Infection Ratios by Facility in Alphabetical Order — Pennsylvania, 2010–2014
Central LineDays
PatientDays
Central LineUtilization
Rate(DUR)
Number ofObservedInfections
Number ofPredictedInfections
StandardizedInfection
Ratio(SIR)
95% ConfidenceInterval
ABINGTON MEMORIAL HOSPITAL (11838)2014 13, 319 111, 800 0.12 14 9.34 1.50 (0.82 – 2.52)2013 15, 882 118, 540 0.13 10 12.84 0.78 (0.37 – 1.43)2012 18, 042 122, 831 0.15 9 14.07 0.64 (0.29 – 1.21)2011 19, 824 133, 171 0.15 16 17.85 0.90 (0.51 – 1.46)2010 18, 113 144, 232 0.13 18 15.69 1.15 (0.68 – 1.81)
ALBERT EINSTEIN MEDICAL CENTER (10585)2014 14, 520 95, 712 0.15 19 9.99 1.90 (1.14 – 2.97)2013 15, 590 95, 187 0.16 21 12.60 1.67 (1.03 – 2.55)2012 16, 578 97, 332 0.17 13 13.23 0.98 (0.52 – 1.68)2011 18, 881 104, 715 0.18 34 16.42 2.07 (1.43 – 2.89)2010 18, 854 113, 743 0.17 34 15.75 2.16 (1.49 – 3.02)
ALLEGHENY GENERAL HOSPITAL (10648)2014 43, 434 126, 164 0.34 44 28.07 1.57 (1.14 – 2.10)2013 45, 312 130, 089 0.35 39 36.57 1.07 (0.76 – 1.46)2012 45, 148 131, 537 0.34 50 40.18 1.24 (0.92 – 1.64)2011 44, 828 133, 596 0.34 36 34.78 1.03 (0.72 – 1.43)2010 46, 038 135, 613 0.34 27 34.98 0.77 (0.51 – 1.12)
ALLEGHENY VALLEY HOSPITAL (11842)2014 3, 404 29, 738 0.11 4 1.94 2.06 (0.55 – 5.27)2013 4, 265 35, 566 0.12 5 2.87 1.74 (0.56 – 4.07)2012 4, 729 42, 082 0.11 6 3.25 1.85 (0.68 – 4.02)2011 4, 872 46, 228 0.11 5 2.91 1.72 (0.55 – 4.00)2010 4, 873 50, 338 0.10 1 3.54 0.28 (0.00 – 1.57)
ALLIED SERVICES INSTITUTE OF REHABILITATION (12591)2014 520 20, 722 0.03 0 0.33 0.00 (0.00 – 10.99)2013 324 21, 252 0.02 0 0.22 0.00 (0.00 – 16.77)2012 368 22, 151 0.02 0 0.19 0.00 (0.00 – 19.57)2011 364 20, 817 0.02 0 0.30 0.00 (0.00 – 12.12)2010 460 21, 464 0.02 0 0.41 0.00 (0.00 – 8.99)
ARIA HEALTH (11388)2014 14, 705 103, 349 0.14 11 10.17 1.08 (0.54 – 1.94)2013 15, 785 103, 768 0.15 8 12.76 0.63 (0.27 – 1.24)2012 15, 370 108, 401 0.14 13 11.92 1.09 (0.58 – 1.87)2011 17, 459 115, 743 0.15 22 15.69 1.40 (0.88 – 2.12)2010 20, 404 131, 905 0.15 25 17.20 1.45 (0.94 – 2.15)
ARMSTRONG COUNTY MEMORIAL HOSPITAL (12057)2014 4, 174 27, 297 0.15 0 2.33 0.00 (0.00 – 1.57)2013 4, 966 30, 446 0.16 2 3.34 0.60 (0.07 – 2.16)2012 5, 612 32, 277 0.17 2 4.12 0.49 (0.05 – 1.75)2011 5, 159 34, 165 0.15 2 2.89 0.69 (0.08 – 2.50)2010 4, 937 33, 954 0.15 2 3.40 0.59 (0.07 – 2.12)
Continued on next page . . .
92
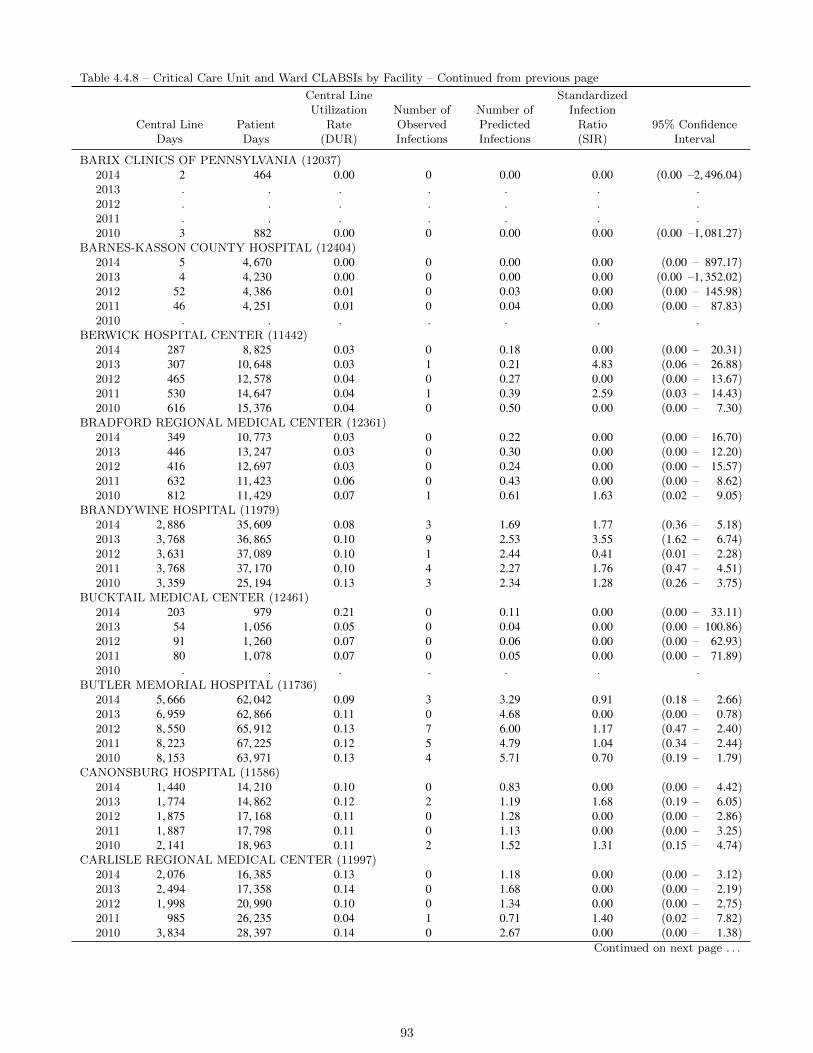
Table 4.4.8 – Critical Care Unit and Ward CLABSIs by Facility – Continued from previous page
Central LineDays
PatientDays
Central LineUtilization
Rate(DUR)
Number ofObservedInfections
Number ofPredictedInfections
StandardizedInfection
Ratio(SIR)
95% ConfidenceInterval
BARIX CLINICS OF PENNSYLVANIA (12037)2014 2 464 0.00 0 0.00 0.00 (0.00 –2, 496.04)2013 . . . . . . .2012 . . . . . . .2011 . . . . . . .2010 3 882 0.00 0 0.00 0.00 (0.00 –1, 081.27)
BARNES-KASSON COUNTY HOSPITAL (12404)2014 5 4, 670 0.00 0 0.00 0.00 (0.00 – 897.17)2013 4 4, 230 0.00 0 0.00 0.00 (0.00 –1, 352.02)2012 52 4, 386 0.01 0 0.03 0.00 (0.00 – 145.98)2011 46 4, 251 0.01 0 0.04 0.00 (0.00 – 87.83)2010 . . . . . . .
BERWICK HOSPITAL CENTER (11442)2014 287 8, 825 0.03 0 0.18 0.00 (0.00 – 20.31)2013 307 10, 648 0.03 1 0.21 4.83 (0.06 – 26.88)2012 465 12, 578 0.04 0 0.27 0.00 (0.00 – 13.67)2011 530 14, 647 0.04 1 0.39 2.59 (0.03 – 14.43)2010 616 15, 376 0.04 0 0.50 0.00 (0.00 – 7.30)
BRADFORD REGIONAL MEDICAL CENTER (12361)2014 349 10, 773 0.03 0 0.22 0.00 (0.00 – 16.70)2013 446 13, 247 0.03 0 0.30 0.00 (0.00 – 12.20)2012 416 12, 697 0.03 0 0.24 0.00 (0.00 – 15.57)2011 632 11, 423 0.06 0 0.43 0.00 (0.00 – 8.62)2010 812 11, 429 0.07 1 0.61 1.63 (0.02 – 9.05)
BRANDYWINE HOSPITAL (11979)2014 2, 886 35, 609 0.08 3 1.69 1.77 (0.36 – 5.18)2013 3, 768 36, 865 0.10 9 2.53 3.55 (1.62 – 6.74)2012 3, 631 37, 089 0.10 1 2.44 0.41 (0.01 – 2.28)2011 3, 768 37, 170 0.10 4 2.27 1.76 (0.47 – 4.51)2010 3, 359 25, 194 0.13 3 2.34 1.28 (0.26 – 3.75)
BUCKTAIL MEDICAL CENTER (12461)2014 203 979 0.21 0 0.11 0.00 (0.00 – 33.11)2013 54 1, 056 0.05 0 0.04 0.00 (0.00 – 100.86)2012 91 1, 260 0.07 0 0.06 0.00 (0.00 – 62.93)2011 80 1, 078 0.07 0 0.05 0.00 (0.00 – 71.89)2010 . . . . . . .
BUTLER MEMORIAL HOSPITAL (11736)2014 5, 666 62, 042 0.09 3 3.29 0.91 (0.18 – 2.66)2013 6, 959 62, 866 0.11 0 4.68 0.00 (0.00 – 0.78)2012 8, 550 65, 912 0.13 7 6.00 1.17 (0.47 – 2.40)2011 8, 223 67, 225 0.12 5 4.79 1.04 (0.34 – 2.44)2010 8, 153 63, 971 0.13 4 5.71 0.70 (0.19 – 1.79)
CANONSBURG HOSPITAL (11586)2014 1, 440 14, 210 0.10 0 0.83 0.00 (0.00 – 4.42)2013 1, 774 14, 862 0.12 2 1.19 1.68 (0.19 – 6.05)2012 1, 875 17, 168 0.11 0 1.28 0.00 (0.00 – 2.86)2011 1, 887 17, 798 0.11 0 1.13 0.00 (0.00 – 3.25)2010 2, 141 18, 963 0.11 2 1.52 1.31 (0.15 – 4.74)
CARLISLE REGIONAL MEDICAL CENTER (11997)2014 2, 076 16, 385 0.13 0 1.18 0.00 (0.00 – 3.12)2013 2, 494 17, 358 0.14 0 1.68 0.00 (0.00 – 2.19)2012 1, 998 20, 990 0.10 0 1.34 0.00 (0.00 – 2.75)2011 985 26, 235 0.04 1 0.71 1.40 (0.02 – 7.82)2010 3, 834 28, 397 0.14 0 2.67 0.00 (0.00 – 1.38)
Continued on next page . . .
93
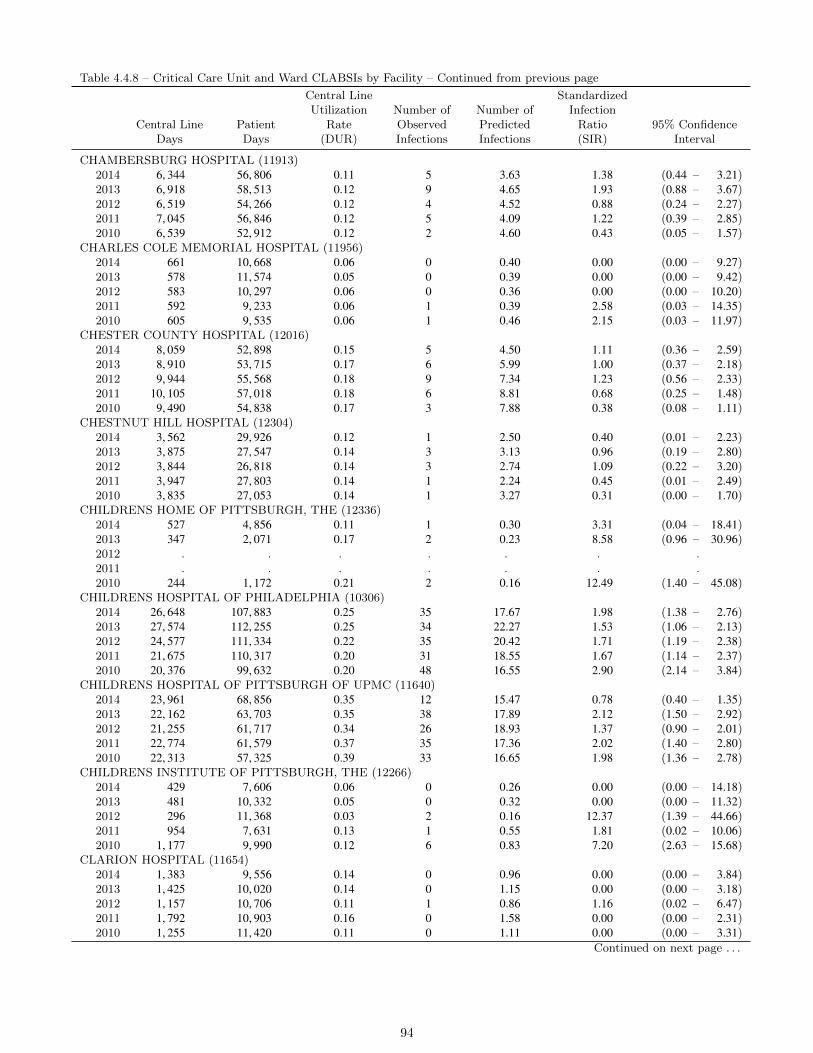
Table 4.4.8 – Critical Care Unit and Ward CLABSIs by Facility – Continued from previous page
Central LineDays
PatientDays
Central LineUtilization
Rate(DUR)
Number ofObservedInfections
Number ofPredictedInfections
StandardizedInfection
Ratio(SIR)
95% ConfidenceInterval
CHAMBERSBURG HOSPITAL (11913)2014 6, 344 56, 806 0.11 5 3.63 1.38 (0.44 – 3.21)2013 6, 918 58, 513 0.12 9 4.65 1.93 (0.88 – 3.67)2012 6, 519 54, 266 0.12 4 4.52 0.88 (0.24 – 2.27)2011 7, 045 56, 846 0.12 5 4.09 1.22 (0.39 – 2.85)2010 6, 539 52, 912 0.12 2 4.60 0.43 (0.05 – 1.57)
CHARLES COLE MEMORIAL HOSPITAL (11956)2014 661 10, 668 0.06 0 0.40 0.00 (0.00 – 9.27)2013 578 11, 574 0.05 0 0.39 0.00 (0.00 – 9.42)2012 583 10, 297 0.06 0 0.36 0.00 (0.00 – 10.20)2011 592 9, 233 0.06 1 0.39 2.58 (0.03 – 14.35)2010 605 9, 535 0.06 1 0.46 2.15 (0.03 – 11.97)
CHESTER COUNTY HOSPITAL (12016)2014 8, 059 52, 898 0.15 5 4.50 1.11 (0.36 – 2.59)2013 8, 910 53, 715 0.17 6 5.99 1.00 (0.37 – 2.18)2012 9, 944 55, 568 0.18 9 7.34 1.23 (0.56 – 2.33)2011 10, 105 57, 018 0.18 6 8.81 0.68 (0.25 – 1.48)2010 9, 490 54, 838 0.17 3 7.88 0.38 (0.08 – 1.11)
CHESTNUT HILL HOSPITAL (12304)2014 3, 562 29, 926 0.12 1 2.50 0.40 (0.01 – 2.23)2013 3, 875 27, 547 0.14 3 3.13 0.96 (0.19 – 2.80)2012 3, 844 26, 818 0.14 3 2.74 1.09 (0.22 – 3.20)2011 3, 947 27, 803 0.14 1 2.24 0.45 (0.01 – 2.49)2010 3, 835 27, 053 0.14 1 3.27 0.31 (0.00 – 1.70)
CHILDRENS HOME OF PITTSBURGH, THE (12336)2014 527 4, 856 0.11 1 0.30 3.31 (0.04 – 18.41)2013 347 2, 071 0.17 2 0.23 8.58 (0.96 – 30.96)2012 . . . . . . .2011 . . . . . . .2010 244 1, 172 0.21 2 0.16 12.49 (1.40 – 45.08)
CHILDRENS HOSPITAL OF PHILADELPHIA (10306)2014 26, 648 107, 883 0.25 35 17.67 1.98 (1.38 – 2.76)2013 27, 574 112, 255 0.25 34 22.27 1.53 (1.06 – 2.13)2012 24, 577 111, 334 0.22 35 20.42 1.71 (1.19 – 2.38)2011 21, 675 110, 317 0.20 31 18.55 1.67 (1.14 – 2.37)2010 20, 376 99, 632 0.20 48 16.55 2.90 (2.14 – 3.84)
CHILDRENS HOSPITAL OF PITTSBURGH OF UPMC (11640)2014 23, 961 68, 856 0.35 12 15.47 0.78 (0.40 – 1.35)2013 22, 162 63, 703 0.35 38 17.89 2.12 (1.50 – 2.92)2012 21, 255 61, 717 0.34 26 18.93 1.37 (0.90 – 2.01)2011 22, 774 61, 579 0.37 35 17.36 2.02 (1.40 – 2.80)2010 22, 313 57, 325 0.39 33 16.65 1.98 (1.36 – 2.78)
CHILDRENS INSTITUTE OF PITTSBURGH, THE (12266)2014 429 7, 606 0.06 0 0.26 0.00 (0.00 – 14.18)2013 481 10, 332 0.05 0 0.32 0.00 (0.00 – 11.32)2012 296 11, 368 0.03 2 0.16 12.37 (1.39 – 44.66)2011 954 7, 631 0.13 1 0.55 1.81 (0.02 – 10.06)2010 1, 177 9, 990 0.12 6 0.83 7.20 (2.63 – 15.68)
CLARION HOSPITAL (11654)2014 1, 383 9, 556 0.14 0 0.96 0.00 (0.00 – 3.84)2013 1, 425 10, 020 0.14 0 1.15 0.00 (0.00 – 3.18)2012 1, 157 10, 706 0.11 1 0.86 1.16 (0.02 – 6.47)2011 1, 792 10, 903 0.16 0 1.58 0.00 (0.00 – 2.31)2010 1, 255 11, 420 0.11 0 1.11 0.00 (0.00 – 3.31)
Continued on next page . . .
94

Table 4.4.8 – Critical Care Unit and Ward CLABSIs by Facility – Continued from previous page
Central LineDays
PatientDays
Central LineUtilization
Rate(DUR)
Number ofObservedInfections
Number ofPredictedInfections
StandardizedInfection
Ratio(SIR)
95% ConfidenceInterval
CONEMAUGH MEMORIAL MEDICAL CENTER (10280)2014 14, 079 108, 472 0.13 1 9.81 0.10 (0.00 – 0.57)2013 13, 309 112, 371 0.12 10 10.76 0.93 (0.44 – 1.71)2012 15, 230 116, 423 0.13 12 11.66 1.03 (0.53 – 1.80)2011 17, 082 118, 549 0.14 18 15.48 1.16 (0.69 – 1.84)2010 19, 275 129, 768 0.15 16 16.33 0.98 (0.56 – 1.59)
CONEMAUGH MEYERSDALE MEDICAL CENTER (11968)2014 146 1, 992 0.07 0 0.09 0.00 (0.00 – 42.50)2013 66 1, 662 0.04 0 0.04 0.00 (0.00 – 82.48)2012 13 1, 877 0.01 0 0.01 0.00 (0.00 – 635.01)2011 . . . . . . .2010 24 1, 735 0.01 0 0.02 0.00 (0.00 – 162.69)
CONEMAUGH MINERS MEDICAL CENTER (12295)2014 98 2, 640 0.04 0 0.06 0.00 (0.00 – 60.10)2013 129 2, 985 0.04 0 0.09 0.00 (0.00 – 42.21)2012 102 3, 839 0.03 0 0.06 0.00 (0.00 – 65.62)2011 81 4, 420 0.02 0 0.07 0.00 (0.00 – 54.94)2010 172 4, 521 0.04 0 0.14 0.00 (0.00 – 25.95)
COORDINATED HEALTH ORTHOPEDIC HOSPITAL LLC (11872)2014 63 2, 886 0.02 0 0.04 0.00 (0.00 – 89.75)2013 124 3, 112 0.04 0 0.08 0.00 (0.00 – 43.90)2012 66 3, 085 0.02 0 0.03 0.00 (0.00 – 104.90)2011 131 3, 107 0.04 0 0.09 0.00 (0.00 – 39.58)2010 157 2, 994 0.05 0 0.12 0.00 (0.00 – 29.66)
CORRY MEMORIAL HOSPITAL (12283)2014 13 2, 572 0.01 0 0.01 0.00 (0.00 – 388.73)2013 . . . . . . .2012 39 3, 598 0.01 0 0.02 0.00 (0.00 – 197.38)2011 9 5, 107 0.00 0 0.01 0.00 (0.00 – 321.85)2010 8 5, 177 0.00 0 0.01 0.00 (0.00 – 365.33)
CRICHTON REHABILITATION CENTER (12273)2014 681 9, 690 0.07 0 0.40 0.00 (0.00 – 9.08)2013 758 10, 308 0.07 1 0.51 1.96 (0.03 – 10.91)2012 412 9, 732 0.04 0 0.24 0.00 (0.00 – 15.11)2011 310 9, 740 0.03 0 0.23 0.00 (0.00 – 15.88)2010 237 9, 026 0.03 0 0.25 0.00 (0.00 – 14.53)
CROZER CHESTER MEDICAL CENTER - SPRINGFIELD (11851)2014 136 3, 694 0.04 0 0.10 0.00 (0.00 – 35.15)2013 352 4, 142 0.08 0 0.28 0.00 (0.00 – 12.88)2012 379 4, 316 0.09 0 0.27 0.00 (0.00 – 13.45)2011 416 5, 467 0.08 0 0.42 0.00 (0.00 – 8.66)2010 659 6, 843 0.10 1 0.59 1.69 (0.02 – 9.41)
CROZER CHESTER MEDICAL CENTER (11839)2014 10, 430 64, 867 0.16 7 7.15 0.98 (0.39 – 2.02)2013 11, 813 72, 096 0.16 15 9.55 1.57 (0.88 – 2.59)2012 12, 274 70, 823 0.17 8 9.82 0.81 (0.35 – 1.61)2011 15, 204 84, 400 0.18 12 13.22 0.91 (0.47 – 1.59)2010 19, 017 96, 057 0.20 26 15.51 1.68 (1.09 – 2.46)
CROZER CHESTER MEDICAL CENTER (11932)2014 2, 994 25, 842 0.12 6 2.10 2.85 (1.04 – 6.21)2013 3, 155 26, 773 0.12 2 2.55 0.78 (0.09 – 2.83)2012 3, 660 28, 514 0.13 3 2.79 1.07 (0.22 – 3.14)2011 5, 898 35, 178 0.17 7 5.20 1.35 (0.54 – 2.78)2010 5, 895 38, 591 0.15 6 4.98 1.21 (0.44 – 2.62)
Continued on next page . . .
95
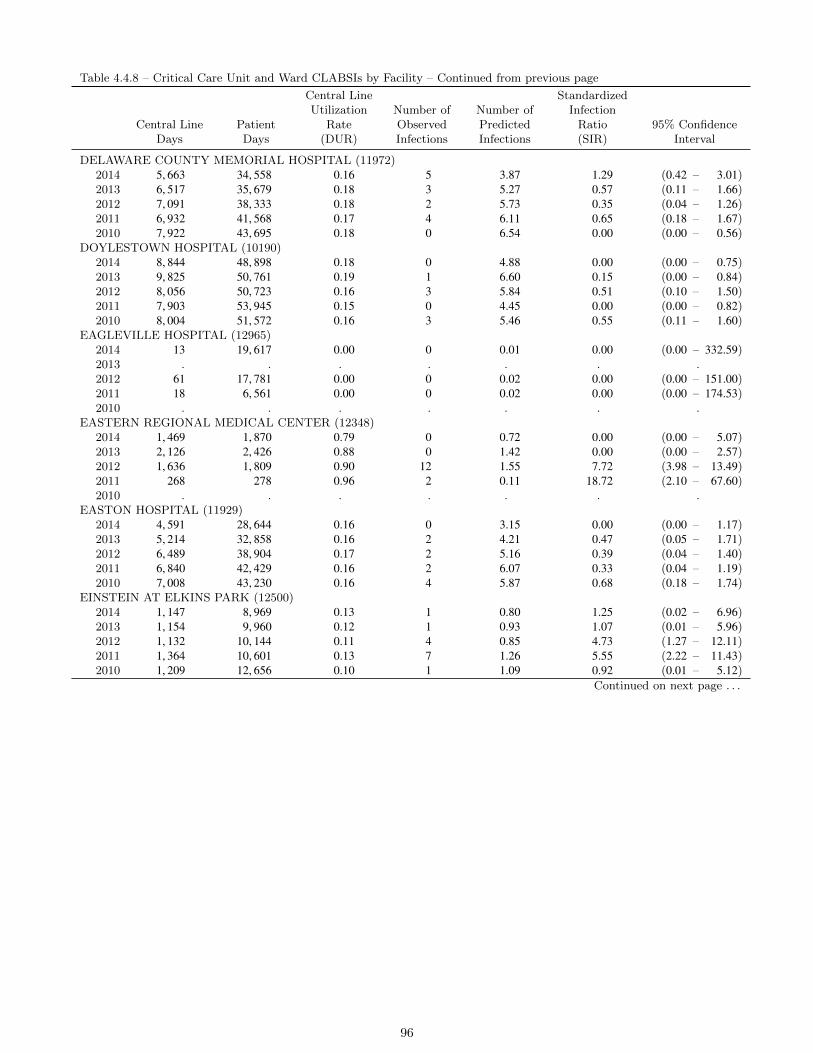
Table 4.4.8 – Critical Care Unit and Ward CLABSIs by Facility – Continued from previous page
Central LineDays
PatientDays
Central LineUtilization
Rate(DUR)
Number ofObservedInfections
Number ofPredictedInfections
StandardizedInfection
Ratio(SIR)
95% ConfidenceInterval
DELAWARE COUNTY MEMORIAL HOSPITAL (11972)2014 5, 663 34, 558 0.16 5 3.87 1.29 (0.42 – 3.01)2013 6, 517 35, 679 0.18 3 5.27 0.57 (0.11 – 1.66)2012 7, 091 38, 333 0.18 2 5.73 0.35 (0.04 – 1.26)2011 6, 932 41, 568 0.17 4 6.11 0.65 (0.18 – 1.67)2010 7, 922 43, 695 0.18 0 6.54 0.00 (0.00 – 0.56)
DOYLESTOWN HOSPITAL (10190)2014 8, 844 48, 898 0.18 0 4.88 0.00 (0.00 – 0.75)2013 9, 825 50, 761 0.19 1 6.60 0.15 (0.00 – 0.84)2012 8, 056 50, 723 0.16 3 5.84 0.51 (0.10 – 1.50)2011 7, 903 53, 945 0.15 0 4.45 0.00 (0.00 – 0.82)2010 8, 004 51, 572 0.16 3 5.46 0.55 (0.11 – 1.60)
EAGLEVILLE HOSPITAL (12965)2014 13 19, 617 0.00 0 0.01 0.00 (0.00 – 332.59)2013 . . . . . . .2012 61 17, 781 0.00 0 0.02 0.00 (0.00 – 151.00)2011 18 6, 561 0.00 0 0.02 0.00 (0.00 – 174.53)2010 . . . . . . .
EASTERN REGIONAL MEDICAL CENTER (12348)2014 1, 469 1, 870 0.79 0 0.72 0.00 (0.00 – 5.07)2013 2, 126 2, 426 0.88 0 1.42 0.00 (0.00 – 2.57)2012 1, 636 1, 809 0.90 12 1.55 7.72 (3.98 – 13.49)2011 268 278 0.96 2 0.11 18.72 (2.10 – 67.60)2010 . . . . . . .
EASTON HOSPITAL (11929)2014 4, 591 28, 644 0.16 0 3.15 0.00 (0.00 – 1.17)2013 5, 214 32, 858 0.16 2 4.21 0.47 (0.05 – 1.71)2012 6, 489 38, 904 0.17 2 5.16 0.39 (0.04 – 1.40)2011 6, 840 42, 429 0.16 2 6.07 0.33 (0.04 – 1.19)2010 7, 008 43, 230 0.16 4 5.87 0.68 (0.18 – 1.74)
EINSTEIN AT ELKINS PARK (12500)2014 1, 147 8, 969 0.13 1 0.80 1.25 (0.02 – 6.96)2013 1, 154 9, 960 0.12 1 0.93 1.07 (0.01 – 5.96)2012 1, 132 10, 144 0.11 4 0.85 4.73 (1.27 – 12.11)2011 1, 364 10, 601 0.13 7 1.26 5.55 (2.22 – 11.43)2010 1, 209 12, 656 0.10 1 1.09 0.92 (0.01 – 5.12)
Continued on next page . . .
96
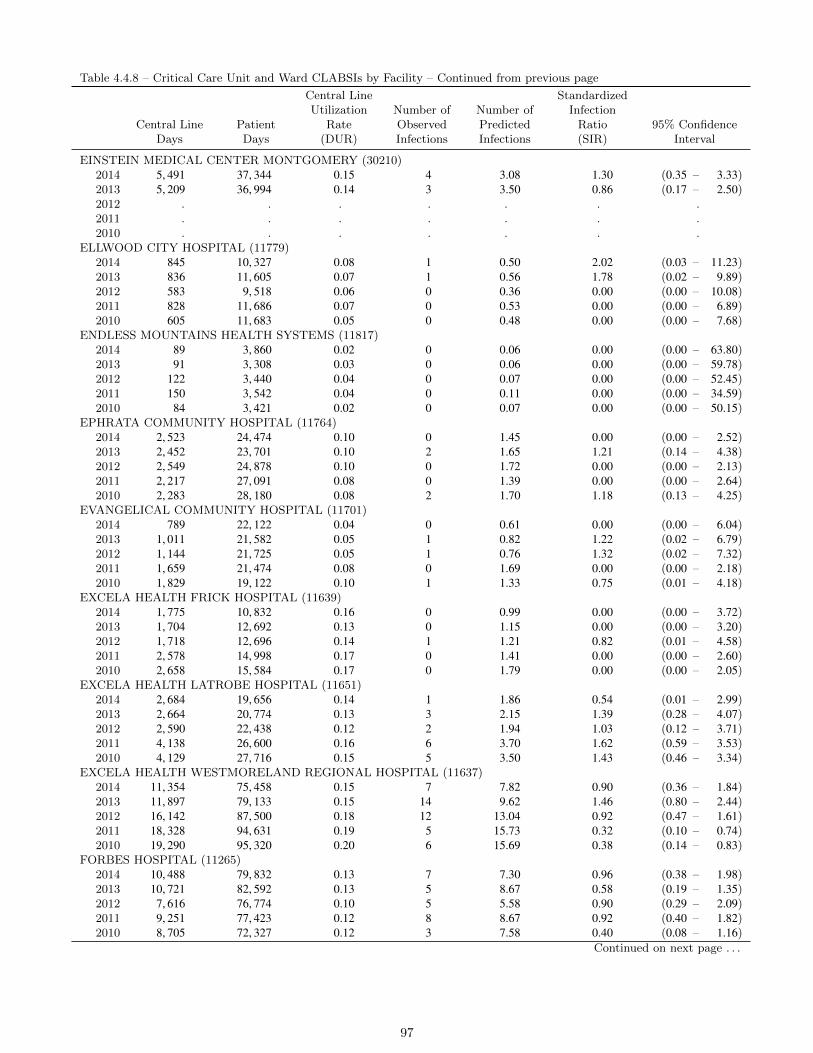
Table 4.4.8 – Critical Care Unit and Ward CLABSIs by Facility – Continued from previous page
Central LineDays
PatientDays
Central LineUtilization
Rate(DUR)
Number ofObservedInfections
Number ofPredictedInfections
StandardizedInfection
Ratio(SIR)
95% ConfidenceInterval
EINSTEIN MEDICAL CENTER MONTGOMERY (30210)2014 5, 491 37, 344 0.15 4 3.08 1.30 (0.35 – 3.33)2013 5, 209 36, 994 0.14 3 3.50 0.86 (0.17 – 2.50)2012 . . . . . . .2011 . . . . . . .2010 . . . . . . .
ELLWOOD CITY HOSPITAL (11779)2014 845 10, 327 0.08 1 0.50 2.02 (0.03 – 11.23)2013 836 11, 605 0.07 1 0.56 1.78 (0.02 – 9.89)2012 583 9, 518 0.06 0 0.36 0.00 (0.00 – 10.08)2011 828 11, 686 0.07 0 0.53 0.00 (0.00 – 6.89)2010 605 11, 683 0.05 0 0.48 0.00 (0.00 – 7.68)
ENDLESS MOUNTAINS HEALTH SYSTEMS (11817)2014 89 3, 860 0.02 0 0.06 0.00 (0.00 – 63.80)2013 91 3, 308 0.03 0 0.06 0.00 (0.00 – 59.78)2012 122 3, 440 0.04 0 0.07 0.00 (0.00 – 52.45)2011 150 3, 542 0.04 0 0.11 0.00 (0.00 – 34.59)2010 84 3, 421 0.02 0 0.07 0.00 (0.00 – 50.15)
EPHRATA COMMUNITY HOSPITAL (11764)2014 2, 523 24, 474 0.10 0 1.45 0.00 (0.00 – 2.52)2013 2, 452 23, 701 0.10 2 1.65 1.21 (0.14 – 4.38)2012 2, 549 24, 878 0.10 0 1.72 0.00 (0.00 – 2.13)2011 2, 217 27, 091 0.08 0 1.39 0.00 (0.00 – 2.64)2010 2, 283 28, 180 0.08 2 1.70 1.18 (0.13 – 4.25)
EVANGELICAL COMMUNITY HOSPITAL (11701)2014 789 22, 122 0.04 0 0.61 0.00 (0.00 – 6.04)2013 1, 011 21, 582 0.05 1 0.82 1.22 (0.02 – 6.79)2012 1, 144 21, 725 0.05 1 0.76 1.32 (0.02 – 7.32)2011 1, 659 21, 474 0.08 0 1.69 0.00 (0.00 – 2.18)2010 1, 829 19, 122 0.10 1 1.33 0.75 (0.01 – 4.18)
EXCELA HEALTH FRICK HOSPITAL (11639)2014 1, 775 10, 832 0.16 0 0.99 0.00 (0.00 – 3.72)2013 1, 704 12, 692 0.13 0 1.15 0.00 (0.00 – 3.20)2012 1, 718 12, 696 0.14 1 1.21 0.82 (0.01 – 4.58)2011 2, 578 14, 998 0.17 0 1.41 0.00 (0.00 – 2.60)2010 2, 658 15, 584 0.17 0 1.79 0.00 (0.00 – 2.05)
EXCELA HEALTH LATROBE HOSPITAL (11651)2014 2, 684 19, 656 0.14 1 1.86 0.54 (0.01 – 2.99)2013 2, 664 20, 774 0.13 3 2.15 1.39 (0.28 – 4.07)2012 2, 590 22, 438 0.12 2 1.94 1.03 (0.12 – 3.71)2011 4, 138 26, 600 0.16 6 3.70 1.62 (0.59 – 3.53)2010 4, 129 27, 716 0.15 5 3.50 1.43 (0.46 – 3.34)
EXCELA HEALTH WESTMORELAND REGIONAL HOSPITAL (11637)2014 11, 354 75, 458 0.15 7 7.82 0.90 (0.36 – 1.84)2013 11, 897 79, 133 0.15 14 9.62 1.46 (0.80 – 2.44)2012 16, 142 87, 500 0.18 12 13.04 0.92 (0.47 – 1.61)2011 18, 328 94, 631 0.19 5 15.73 0.32 (0.10 – 0.74)2010 19, 290 95, 320 0.20 6 15.69 0.38 (0.14 – 0.83)
FORBES HOSPITAL (11265)2014 10, 488 79, 832 0.13 7 7.30 0.96 (0.38 – 1.98)2013 10, 721 82, 592 0.13 5 8.67 0.58 (0.19 – 1.35)2012 7, 616 76, 774 0.10 5 5.58 0.90 (0.29 – 2.09)2011 9, 251 77, 423 0.12 8 8.67 0.92 (0.40 – 1.82)2010 8, 705 72, 327 0.12 3 7.58 0.40 (0.08 – 1.16)
Continued on next page . . .
97

Table 4.4.8 – Critical Care Unit and Ward CLABSIs by Facility – Continued from previous page
Central LineDays
PatientDays
Central LineUtilization
Rate(DUR)
Number ofObservedInfections
Number ofPredictedInfections
StandardizedInfection
Ratio(SIR)
95% ConfidenceInterval
FULTON COUNTY MEDICAL CENTER (11939)2014 328 3, 761 0.09 0 0.19 0.00 (0.00 – 19.17)2013 290 4, 192 0.07 0 0.20 0.00 (0.00 – 18.79)2012 99 4, 625 0.02 0 0.05 0.00 (0.00 – 69.93)2011 208 4, 065 0.05 0 0.14 0.00 (0.00 – 25.83)2010 81 4, 574 0.02 0 0.07 0.00 (0.00 – 49.80)
GEISINGER HEALTHSOUTH REHABILITATION HOSPITAL (11993)2014 541 11, 122 0.05 1 0.33 3.03 (0.04 – 16.86)2013 335 11, 322 0.03 0 0.23 0.00 (0.00 – 16.24)2012 200 11, 741 0.02 0 0.10 0.00 (0.00 – 35.87)2011 544 10, 978 0.05 0 0.37 0.00 (0.00 – 9.82)2010 268 10, 867 0.02 0 0.23 0.00 (0.00 – 15.73)
GEISINGER MEDICAL CENTER (11775)2014 21, 756 126, 012 0.17 21 14.82 1.42 (0.88 – 2.17)2013 21, 582 131, 035 0.16 13 17.44 0.75 (0.40 – 1.27)2012 24, 018 131, 472 0.18 41 19.37 2.12 (1.52 – 2.87)2011 24, 941 126, 241 0.20 58 21.33 2.72 (2.07 – 3.52)2010 22, 309 118, 395 0.19 25 18.32 1.36 (0.88 – 2.01)
GEISINGER WYOMING VALLEY MEDICAL CENTER (11780)2014 10, 559 70, 902 0.15 5 7.28 0.69 (0.22 – 1.60)2013 10, 670 72, 120 0.15 3 8.62 0.35 (0.07 – 1.02)2012 10, 919 66, 248 0.16 5 8.67 0.58 (0.19 – 1.35)2011 9, 874 64, 510 0.15 6 8.85 0.68 (0.25 – 1.48)2010 8, 409 58, 226 0.14 9 7.15 1.26 (0.57 – 2.39)
GEISINGER-BLOOMSBURG HOSPITAL (12008)2014 100 9, 313 0.01 0 0.07 0.00 (0.00 – 53.54)2013 197 11, 701 0.02 0 0.13 0.00 (0.00 – 27.59)2012 652 12, 590 0.05 0 0.40 0.00 (0.00 – 9.25)2011 393 13, 619 0.03 2 0.30 6.71 (0.75 – 24.23)2010 419 14, 502 0.03 0 0.36 0.00 (0.00 – 10.27)
GEISINGER-COMMUNITY MEDICAL CENTER (11914)2014 7, 670 55, 497 0.14 4 5.32 0.75 (0.20 – 1.93)2013 5, 166 53, 698 0.10 4 4.18 0.96 (0.26 – 2.45)2012 5, 674 54, 768 0.10 1 4.19 0.24 (0.00 – 1.33)2011 4, 917 52, 727 0.09 1 4.82 0.21 (0.00 – 1.15)2010 4, 613 51, 169 0.09 1 4.18 0.24 (0.00 – 1.33)
GEISINGER-LEWISTOWN HOSPITAL (11825)2014 3, 027 24, 948 0.12 1 2.12 0.47 (0.01 – 2.63)2013 2, 498 25, 830 0.10 3 1.68 1.79 (0.36 – 5.22)2012 2, 108 25, 305 0.08 0 1.38 0.00 (0.00 – 2.66)2011 1, 637 24, 902 0.07 0 1.07 0.00 (0.00 – 3.44)2010 1, 681 23, 437 0.07 0 1.27 0.00 (0.00 – 2.89)
GETTYSBURG HOSPITAL (11531)2014 1, 453 19, 313 0.08 1 0.86 1.17 (0.02 – 6.49)2013 1, 435 19, 474 0.07 1 0.97 1.04 (0.01 – 5.76)2012 1, 551 18, 278 0.08 2 1.02 1.96 (0.22 – 7.09)2011 1, 576 18, 089 0.09 0 0.98 0.00 (0.00 – 3.76)2010 1, 629 17, 456 0.09 0 1.19 0.00 (0.00 – 3.08)
GNADEN HUETTEN MEMORIAL HOSPITAL (12241)2014 893 18, 770 0.05 2 0.55 3.67 (0.41 – 13.23)2013 917 17, 291 0.05 1 0.62 1.62 (0.02 – 9.01)2012 835 18, 176 0.05 2 0.50 4.01 (0.45 – 14.49)2011 1, 044 16, 886 0.06 0 0.69 0.00 (0.00 – 5.33)2010 1, 167 16, 243 0.07 1 0.88 1.13 (0.01 – 6.31)
Continued on next page . . .
98

Table 4.4.8 – Critical Care Unit and Ward CLABSIs by Facility – Continued from previous page
Central LineDays
PatientDays
Central LineUtilization
Rate(DUR)
Number ofObservedInfections
Number ofPredictedInfections
StandardizedInfection
Ratio(SIR)
95% ConfidenceInterval
GOOD SAMARITAN HOSPITAL, THE (11712)2014 4, 499 38, 800 0.12 0 2.57 0.00 (0.00 – 1.43)2013 4, 880 38, 759 0.13 4 3.28 1.22 (0.33 – 3.12)2012 4, 409 39, 790 0.11 3 3.02 0.99 (0.20 – 2.90)2011 5, 370 42, 849 0.13 4 3.11 1.29 (0.35 – 3.29)2010 4, 965 41, 180 0.12 11 3.50 3.14 (1.57 – 5.62)
GOOD SHEPHERD REHABILITATION HOSPITAL, THE (11896)2014 1, 057 28, 742 0.04 1 0.66 1.52 (0.02 – 8.45)2013 1, 070 28, 995 0.04 1 0.72 1.39 (0.02 – 7.72)2012 1, 305 28, 461 0.05 3 0.78 3.85 (0.77 – 11.26)2011 1, 659 29, 920 0.06 4 1.12 3.58 (0.96 – 9.17)2010 1, 643 24, 553 0.07 1 1.25 0.80 (0.01 – 4.44)
GRAND VIEW HOSPITAL (11847)2014 7, 084 40, 456 0.18 0 3.92 0.00 (0.00 – 0.94)2013 7, 932 41, 380 0.19 5 5.33 0.94 (0.30 – 2.19)2012 7, 517 40, 826 0.18 4 5.57 0.72 (0.19 – 1.84)2011 8, 690 42, 899 0.20 2 4.61 0.43 (0.05 – 1.57)2010 7, 968 41, 631 0.19 2 5.29 0.38 (0.04 – 1.37)
GROVE CITY MEDICAL CENTER (11722)2014 600 7, 752 0.08 0 0.35 0.00 (0.00 – 10.39)2013 487 7, 717 0.06 0 0.33 0.00 (0.00 – 11.19)2012 437 8, 181 0.05 0 0.27 0.00 (0.00 – 13.74)2011 513 7, 906 0.06 0 0.34 0.00 (0.00 – 10.94)2010 531 7, 396 0.07 1 0.40 2.49 (0.03 – 13.87)
GUTHRIE TOWANDA MEMORIAL HOSPITAL (12549)2014 192 4, 790 0.04 0 0.12 0.00 (0.00 – 30.86)2013 172 4, 867 0.04 0 0.12 0.00 (0.00 – 31.64)2012 314 6, 544 0.05 0 0.19 0.00 (0.00 – 19.44)2011 140 4, 432 0.03 0 0.10 0.00 (0.00 – 35.12)2010 285 4, 659 0.06 0 0.22 0.00 (0.00 – 16.67)
HAHNEMANN UNIVERSITY HOSPITAL (11437)2014 15, 432 91, 756 0.17 4 10.54 0.38 (0.10 – 0.97)2013 17, 253 92, 913 0.19 6 13.94 0.43 (0.16 – 0.94)2012 18, 334 95, 805 0.19 9 14.90 0.60 (0.28 – 1.15)2011 19, 702 106, 200 0.19 20 17.04 1.17 (0.72 – 1.81)2010 20, 674 104, 749 0.20 25 16.87 1.48 (0.96 – 2.19)
HANOVER HOSPITAL (11899)2014 1, 918 26, 431 0.07 0 1.13 0.00 (0.00 – 3.23)2013 2, 641 26, 879 0.10 2 1.78 1.13 (0.13 – 4.06)2012 2, 669 24, 815 0.11 3 1.82 1.65 (0.33 – 4.82)2011 3, 182 25, 152 0.13 0 1.84 0.00 (0.00 – 1.99)2010 3, 646 26, 527 0.14 4 2.53 1.58 (0.43 – 4.05)
HEALTHSOUTH HARMARVILLE REHABILITATION HOSPITAL (11727)2014 2, 273 29, 465 0.08 4 1.34 2.99 (0.80 – 7.65)2013 1, 926 33, 138 0.06 2 1.30 1.54 (0.17 – 5.57)2012 2, 777 34, 709 0.08 1 1.81 0.55 (0.01 – 3.08)2011 2, 630 31, 608 0.08 0 1.64 0.00 (0.00 – 2.23)2010 2, 227 30, 991 0.07 0 1.68 0.00 (0.00 – 2.18)
Continued on next page . . .
99

Table 4.4.8 – Critical Care Unit and Ward CLABSIs by Facility – Continued from previous page
Central LineDays
PatientDays
Central LineUtilization
Rate(DUR)
Number ofObservedInfections
Number ofPredictedInfections
StandardizedInfection
Ratio(SIR)
95% ConfidenceInterval
HEALTHSOUTH NITTANY VALLEY REHABILITATION HOSPITAL (11667)2014 800 15, 946 0.05 1 0.49 2.05 (0.03 – 11.43)2013 830 15, 733 0.05 0 0.56 0.00 (0.00 – 6.56)2012 633 13, 305 0.05 0 0.38 0.00 (0.00 – 9.66)2011 458 11, 594 0.04 0 0.33 0.00 (0.00 – 11.19)2010 451 12, 452 0.04 0 0.37 0.00 (0.00 – 9.83)
HEALTHSOUTH READING REHABILITATION HOSPITAL (12139)2014 747 15, 305 0.05 1 0.46 2.20 (0.03 – 12.21)2013 1, 003 16, 445 0.06 1 0.68 1.48 (0.02 – 8.24)2012 1, 104 15, 333 0.07 0 0.71 0.00 (0.00 – 5.19)2011 1, 138 15, 204 0.07 1 0.72 1.38 (0.02 – 7.68)2010 1, 205 14, 813 0.08 0 0.90 0.00 (0.00 – 4.10)
HEALTHSOUTH REHABILITATION HOSPITAL OF ALTOONA (11903)2014 1, 631 25, 435 0.06 0 0.97 0.00 (0.00 – 3.77)2013 1, 052 25, 915 0.04 0 0.71 0.00 (0.00 – 5.18)2012 1, 334 25, 280 0.05 0 0.81 0.00 (0.00 – 4.51)2011 1, 141 23, 971 0.05 0 0.79 0.00 (0.00 – 4.65)2010 855 22, 173 0.04 0 0.70 0.00 (0.00 – 5.23)
HEALTHSOUTH REHABILITATION HOSPITAL OF ERIE (11810)2014 745 17, 077 0.04 0 0.46 0.00 (0.00 – 8.00)2013 1, 248 21, 661 0.06 0 0.84 0.00 (0.00 – 4.36)2012 1, 350 22, 729 0.06 1 0.84 1.19 (0.02 – 6.63)2011 1, 598 25, 219 0.06 1 1.05 0.95 (0.01 – 5.30)2010 1, 375 26, 319 0.05 1 1.08 0.92 (0.01 – 5.13)
HEALTHSOUTH REHABILITATION HOSPITAL OF MECHANICSBURG (12402)2014 1, 469 18, 129 0.08 0 0.86 0.00 (0.00 – 4.26)2013 1, 401 18, 703 0.07 2 0.94 2.12 (0.24 – 7.66)2012 1, 984 18, 430 0.11 1 1.35 0.74 (0.01 – 4.11)2011 2, 176 16, 976 0.13 0 1.26 0.00 (0.00 – 2.92)2010 2, 175 17, 596 0.12 1 1.53 0.65 (0.01 – 3.64)
HEALTHSOUTH REHABILITATION HOSPITAL OF SEWICKLEY (12066)2014 929 13, 177 0.07 0 0.55 0.00 (0.00 – 6.66)2013 693 12, 829 0.05 0 0.47 0.00 (0.00 – 7.86)2012 868 12, 014 0.07 0 0.56 0.00 (0.00 – 6.60)2011 841 11, 046 0.08 0 0.53 0.00 (0.00 – 6.87)2010 526 9, 586 0.05 0 0.41 0.00 (0.00 – 8.91)
HEALTHSOUTH REHABILITATION HOSPITAL OF YORK (12058)2014 1, 735 20, 604 0.08 1 1.01 0.99 (0.01 – 5.48)2013 1, 205 18, 833 0.06 2 0.81 2.47 (0.28 – 8.90)2012 1, 077 19, 635 0.05 1 0.66 1.51 (0.02 – 8.42)2011 749 20, 041 0.04 0 0.54 0.00 (0.00 – 6.77)2010 699 19, 468 0.04 0 0.58 0.00 (0.00 – 6.34)
HEART OF LANCASTER REGIONAL MEDICAL CENTER (12571)2014 792 7, 057 0.11 1 0.56 1.79 (0.02 – 9.97)2013 722 9, 579 0.08 0 0.58 0.00 (0.00 – 6.28)2012 730 10, 008 0.07 0 0.51 0.00 (0.00 – 7.19)2011 627 10, 363 0.06 0 0.67 0.00 (0.00 – 5.51)2010 849 9, 744 0.09 0 0.77 0.00 (0.00 – 4.75)
HERITAGE VALLEY BEAVER (11831)2014 6, 537 77, 485 0.08 7 4.71 1.49 (0.60 – 3.06)2013 7, 105 72, 271 0.10 4 5.75 0.70 (0.19 – 1.78)2012 8, 539 79, 459 0.11 1 6.34 0.16 (0.00 – 0.88)2011 9, 171 83, 343 0.11 11 8.73 1.26 (0.63 – 2.25)2010 9, 449 86, 652 0.11 4 8.34 0.48 (0.13 – 1.23)
Continued on next page . . .
100
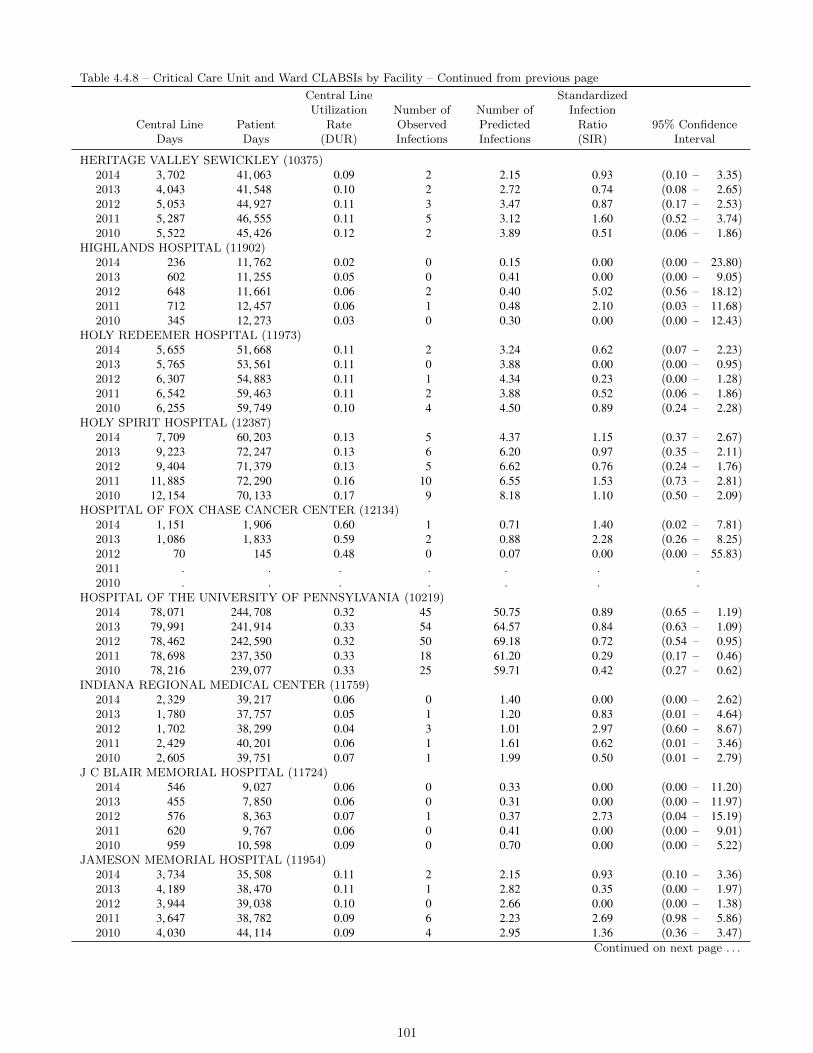
Table 4.4.8 – Critical Care Unit and Ward CLABSIs by Facility – Continued from previous page
Central LineDays
PatientDays
Central LineUtilization
Rate(DUR)
Number ofObservedInfections
Number ofPredictedInfections
StandardizedInfection
Ratio(SIR)
95% ConfidenceInterval
HERITAGE VALLEY SEWICKLEY (10375)2014 3, 702 41, 063 0.09 2 2.15 0.93 (0.10 – 3.35)2013 4, 043 41, 548 0.10 2 2.72 0.74 (0.08 – 2.65)2012 5, 053 44, 927 0.11 3 3.47 0.87 (0.17 – 2.53)2011 5, 287 46, 555 0.11 5 3.12 1.60 (0.52 – 3.74)2010 5, 522 45, 426 0.12 2 3.89 0.51 (0.06 – 1.86)
HIGHLANDS HOSPITAL (11902)2014 236 11, 762 0.02 0 0.15 0.00 (0.00 – 23.80)2013 602 11, 255 0.05 0 0.41 0.00 (0.00 – 9.05)2012 648 11, 661 0.06 2 0.40 5.02 (0.56 – 18.12)2011 712 12, 457 0.06 1 0.48 2.10 (0.03 – 11.68)2010 345 12, 273 0.03 0 0.30 0.00 (0.00 – 12.43)
HOLY REDEEMER HOSPITAL (11973)2014 5, 655 51, 668 0.11 2 3.24 0.62 (0.07 – 2.23)2013 5, 765 53, 561 0.11 0 3.88 0.00 (0.00 – 0.95)2012 6, 307 54, 883 0.11 1 4.34 0.23 (0.00 – 1.28)2011 6, 542 59, 463 0.11 2 3.88 0.52 (0.06 – 1.86)2010 6, 255 59, 749 0.10 4 4.50 0.89 (0.24 – 2.28)
HOLY SPIRIT HOSPITAL (12387)2014 7, 709 60, 203 0.13 5 4.37 1.15 (0.37 – 2.67)2013 9, 223 72, 247 0.13 6 6.20 0.97 (0.35 – 2.11)2012 9, 404 71, 379 0.13 5 6.62 0.76 (0.24 – 1.76)2011 11, 885 72, 290 0.16 10 6.55 1.53 (0.73 – 2.81)2010 12, 154 70, 133 0.17 9 8.18 1.10 (0.50 – 2.09)
HOSPITAL OF FOX CHASE CANCER CENTER (12134)2014 1, 151 1, 906 0.60 1 0.71 1.40 (0.02 – 7.81)2013 1, 086 1, 833 0.59 2 0.88 2.28 (0.26 – 8.25)2012 70 145 0.48 0 0.07 0.00 (0.00 – 55.83)2011 . . . . . . .2010 . . . . . . .
HOSPITAL OF THE UNIVERSITY OF PENNSYLVANIA (10219)2014 78, 071 244, 708 0.32 45 50.75 0.89 (0.65 – 1.19)2013 79, 991 241, 914 0.33 54 64.57 0.84 (0.63 – 1.09)2012 78, 462 242, 590 0.32 50 69.18 0.72 (0.54 – 0.95)2011 78, 698 237, 350 0.33 18 61.20 0.29 (0.17 – 0.46)2010 78, 216 239, 077 0.33 25 59.71 0.42 (0.27 – 0.62)
INDIANA REGIONAL MEDICAL CENTER (11759)2014 2, 329 39, 217 0.06 0 1.40 0.00 (0.00 – 2.62)2013 1, 780 37, 757 0.05 1 1.20 0.83 (0.01 – 4.64)2012 1, 702 38, 299 0.04 3 1.01 2.97 (0.60 – 8.67)2011 2, 429 40, 201 0.06 1 1.61 0.62 (0.01 – 3.46)2010 2, 605 39, 751 0.07 1 1.99 0.50 (0.01 – 2.79)
J C BLAIR MEMORIAL HOSPITAL (11724)2014 546 9, 027 0.06 0 0.33 0.00 (0.00 – 11.20)2013 455 7, 850 0.06 0 0.31 0.00 (0.00 – 11.97)2012 576 8, 363 0.07 1 0.37 2.73 (0.04 – 15.19)2011 620 9, 767 0.06 0 0.41 0.00 (0.00 – 9.01)2010 959 10, 598 0.09 0 0.70 0.00 (0.00 – 5.22)
JAMESON MEMORIAL HOSPITAL (11954)2014 3, 734 35, 508 0.11 2 2.15 0.93 (0.10 – 3.36)2013 4, 189 38, 470 0.11 1 2.82 0.35 (0.00 – 1.97)2012 3, 944 39, 038 0.10 0 2.66 0.00 (0.00 – 1.38)2011 3, 647 38, 782 0.09 6 2.23 2.69 (0.98 – 5.86)2010 4, 030 44, 114 0.09 4 2.95 1.36 (0.36 – 3.47)
Continued on next page . . .
101

Table 4.4.8 – Critical Care Unit and Ward CLABSIs by Facility – Continued from previous page
Central LineDays
PatientDays
Central LineUtilization
Rate(DUR)
Number ofObservedInfections
Number ofPredictedInfections
StandardizedInfection
Ratio(SIR)
95% ConfidenceInterval
JEANES HOSPITAL (11459)2014 6, 121 33, 971 0.18 4 3.38 1.18 (0.32 – 3.03)2013 5, 714 33, 276 0.17 8 3.84 2.08 (0.90 – 4.11)2012 6, 160 38, 533 0.16 1 4.47 0.22 (0.00 – 1.25)2011 6, 732 41, 037 0.16 0 5.96 0.00 (0.00 – 0.62)2010 7, 326 42, 199 0.17 3 6.08 0.49 (0.10 – 1.44)
JEFFERSON HOSPITAL (10237)2014 7, 785 67, 428 0.12 1 4.44 0.23 (0.00 – 1.25)2013 9, 168 71, 956 0.13 4 6.16 0.65 (0.17 – 1.66)2012 9, 426 69, 479 0.14 3 6.66 0.45 (0.09 – 1.32)2011 10, 399 75, 268 0.14 8 5.92 1.35 (0.58 – 2.66)2010 11, 656 78, 981 0.15 9 8.01 1.12 (0.51 – 2.13)
JENNERSVILLE REGIONAL HOSPITAL (12337)2014 813 12, 022 0.07 0 0.48 0.00 (0.00 – 7.59)2013 1, 019 12, 317 0.08 2 0.69 2.92 (0.33 – 10.53)2012 1, 127 12, 583 0.09 1 0.75 1.34 (0.02 – 7.45)2011 1, 144 13, 563 0.08 1 0.71 1.40 (0.02 – 7.81)2010 1, 002 13, 221 0.08 6 0.75 7.98 (2.91 – 17.37)
JERSEY SHORE HOSPITAL (11689)2014 155 4, 414 0.04 0 0.10 0.00 (0.00 – 37.83)2013 206 4, 129 0.05 0 0.14 0.00 (0.00 – 26.44)2012 263 4, 497 0.06 0 0.16 0.00 (0.00 – 22.50)2011 443 5, 197 0.09 0 0.28 0.00 (0.00 – 13.32)2010 188 4, 527 0.04 0 0.15 0.00 (0.00 – 24.02)
JOHN HEINZ INSTITUTE OF REHABILITATION (11861)2014 413 18, 600 0.02 0 0.27 0.00 (0.00 – 13.71)2013 322 19, 943 0.02 0 0.22 0.00 (0.00 – 16.88)2012 471 20, 244 0.02 0 0.25 0.00 (0.00 – 14.51)2011 399 21, 076 0.02 0 0.33 0.00 (0.00 – 11.22)2010 451 20, 170 0.02 0 0.40 0.00 (0.00 – 9.22)
KANE COMMUNITY HOSPITAL (12111)2014 152 3, 806 0.04 0 0.09 0.00 (0.00 – 38.96)2013 147 4, 230 0.03 0 0.10 0.00 (0.00 – 37.02)2012 311 4, 769 0.07 2 0.20 10.20 (1.15 – 36.83)2011 298 5, 398 0.06 0 0.20 0.00 (0.00 – 18.28)2010 158 4, 608 0.03 0 0.13 0.00 (0.00 – 27.86)
KENSINGTON HOSPITAL (12609)2014 1, 596 2, 536 0.63 1 0.80 1.25 (0.02 – 6.96)2013 1, 385 2, 421 0.57 0 0.93 0.00 (0.00 – 3.95)2012 2, 042 2, 885 0.71 0 1.87 0.00 (0.00 – 1.96)2011 1, 478 2, 751 0.54 1 0.66 1.52 (0.02 – 8.48)2010 1, 667 2, 732 0.61 1 0.95 1.05 (0.01 – 5.86)
LANCASTER GENERAL HOSPITAL (10183)2014 17, 369 143, 974 0.12 18 9.88 1.82 (1.08 – 2.88)2013 16, 058 137, 114 0.12 10 10.80 0.93 (0.44 – 1.70)2012 18, 634 146, 705 0.13 8 13.03 0.61 (0.26 – 1.21)2011 22, 739 154, 617 0.15 8 12.79 0.63 (0.27 – 1.23)2010 21, 983 145, 807 0.15 5 15.06 0.33 (0.11 – 0.77)
LANCASTER REGIONAL MEDICAL CENTER (12335)2014 2, 893 25, 054 0.12 2 1.65 1.21 (0.14 – 4.37)2013 2, 923 26, 814 0.11 1 1.97 0.51 (0.01 – 2.83)2012 3, 048 28, 382 0.11 2 2.08 0.96 (0.11 – 3.48)2011 3, 247 28, 792 0.11 8 1.92 4.17 (1.80 – 8.22)2010 2, 890 28, 064 0.10 3 2.08 1.44 (0.29 – 4.21)
Continued on next page . . .
102
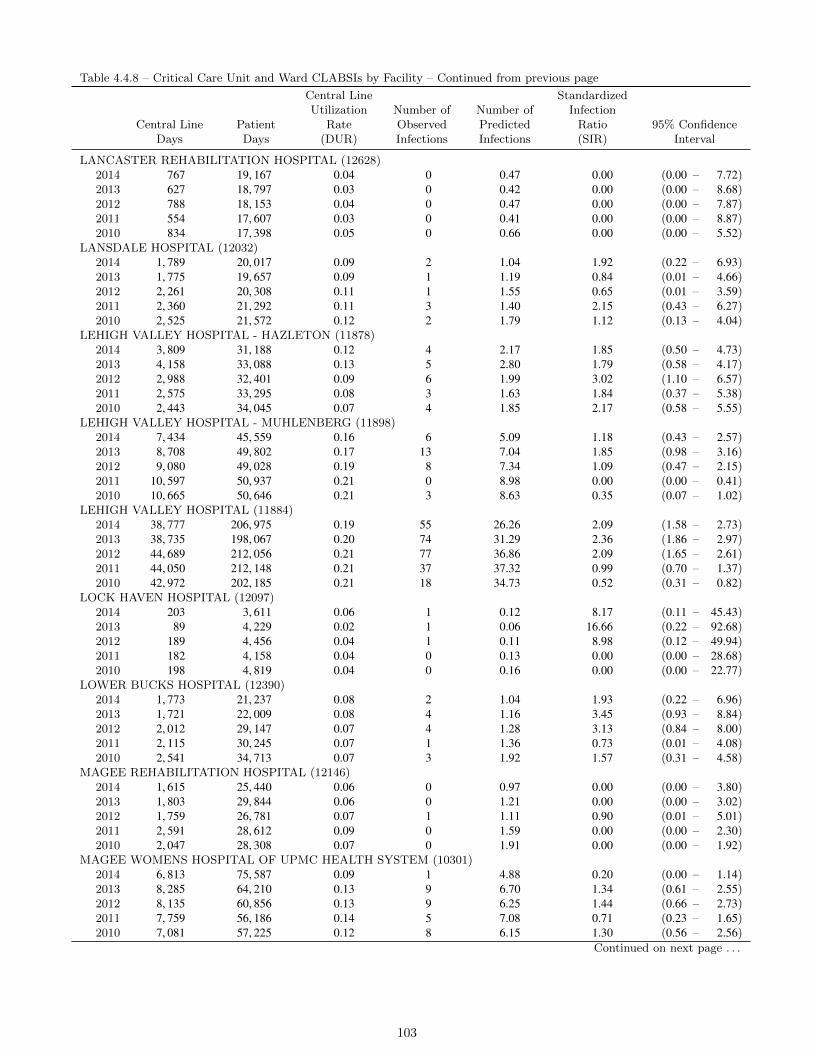
Table 4.4.8 – Critical Care Unit and Ward CLABSIs by Facility – Continued from previous page
Central LineDays
PatientDays
Central LineUtilization
Rate(DUR)
Number ofObservedInfections
Number ofPredictedInfections
StandardizedInfection
Ratio(SIR)
95% ConfidenceInterval
LANCASTER REHABILITATION HOSPITAL (12628)2014 767 19, 167 0.04 0 0.47 0.00 (0.00 – 7.72)2013 627 18, 797 0.03 0 0.42 0.00 (0.00 – 8.68)2012 788 18, 153 0.04 0 0.47 0.00 (0.00 – 7.87)2011 554 17, 607 0.03 0 0.41 0.00 (0.00 – 8.87)2010 834 17, 398 0.05 0 0.66 0.00 (0.00 – 5.52)
LANSDALE HOSPITAL (12032)2014 1, 789 20, 017 0.09 2 1.04 1.92 (0.22 – 6.93)2013 1, 775 19, 657 0.09 1 1.19 0.84 (0.01 – 4.66)2012 2, 261 20, 308 0.11 1 1.55 0.65 (0.01 – 3.59)2011 2, 360 21, 292 0.11 3 1.40 2.15 (0.43 – 6.27)2010 2, 525 21, 572 0.12 2 1.79 1.12 (0.13 – 4.04)
LEHIGH VALLEY HOSPITAL - HAZLETON (11878)2014 3, 809 31, 188 0.12 4 2.17 1.85 (0.50 – 4.73)2013 4, 158 33, 088 0.13 5 2.80 1.79 (0.58 – 4.17)2012 2, 988 32, 401 0.09 6 1.99 3.02 (1.10 – 6.57)2011 2, 575 33, 295 0.08 3 1.63 1.84 (0.37 – 5.38)2010 2, 443 34, 045 0.07 4 1.85 2.17 (0.58 – 5.55)
LEHIGH VALLEY HOSPITAL - MUHLENBERG (11898)2014 7, 434 45, 559 0.16 6 5.09 1.18 (0.43 – 2.57)2013 8, 708 49, 802 0.17 13 7.04 1.85 (0.98 – 3.16)2012 9, 080 49, 028 0.19 8 7.34 1.09 (0.47 – 2.15)2011 10, 597 50, 937 0.21 0 8.98 0.00 (0.00 – 0.41)2010 10, 665 50, 646 0.21 3 8.63 0.35 (0.07 – 1.02)
LEHIGH VALLEY HOSPITAL (11884)2014 38, 777 206, 975 0.19 55 26.26 2.09 (1.58 – 2.73)2013 38, 735 198, 067 0.20 74 31.29 2.36 (1.86 – 2.97)2012 44, 689 212, 056 0.21 77 36.86 2.09 (1.65 – 2.61)2011 44, 050 212, 148 0.21 37 37.32 0.99 (0.70 – 1.37)2010 42, 972 202, 185 0.21 18 34.73 0.52 (0.31 – 0.82)
LOCK HAVEN HOSPITAL (12097)2014 203 3, 611 0.06 1 0.12 8.17 (0.11 – 45.43)2013 89 4, 229 0.02 1 0.06 16.66 (0.22 – 92.68)2012 189 4, 456 0.04 1 0.11 8.98 (0.12 – 49.94)2011 182 4, 158 0.04 0 0.13 0.00 (0.00 – 28.68)2010 198 4, 819 0.04 0 0.16 0.00 (0.00 – 22.77)
LOWER BUCKS HOSPITAL (12390)2014 1, 773 21, 237 0.08 2 1.04 1.93 (0.22 – 6.96)2013 1, 721 22, 009 0.08 4 1.16 3.45 (0.93 – 8.84)2012 2, 012 29, 147 0.07 4 1.28 3.13 (0.84 – 8.00)2011 2, 115 30, 245 0.07 1 1.36 0.73 (0.01 – 4.08)2010 2, 541 34, 713 0.07 3 1.92 1.57 (0.31 – 4.58)
MAGEE REHABILITATION HOSPITAL (12146)2014 1, 615 25, 440 0.06 0 0.97 0.00 (0.00 – 3.80)2013 1, 803 29, 844 0.06 0 1.21 0.00 (0.00 – 3.02)2012 1, 759 26, 781 0.07 1 1.11 0.90 (0.01 – 5.01)2011 2, 591 28, 612 0.09 0 1.59 0.00 (0.00 – 2.30)2010 2, 047 28, 308 0.07 0 1.91 0.00 (0.00 – 1.92)
MAGEE WOMENS HOSPITAL OF UPMC HEALTH SYSTEM (10301)2014 6, 813 75, 587 0.09 1 4.88 0.20 (0.00 – 1.14)2013 8, 285 64, 210 0.13 9 6.70 1.34 (0.61 – 2.55)2012 8, 135 60, 856 0.13 9 6.25 1.44 (0.66 – 2.73)2011 7, 759 56, 186 0.14 5 7.08 0.71 (0.23 – 1.65)2010 7, 081 57, 225 0.12 8 6.15 1.30 (0.56 – 2.56)
Continued on next page . . .
103

Table 4.4.8 – Critical Care Unit and Ward CLABSIs by Facility – Continued from previous page
Central LineDays
PatientDays
Central LineUtilization
Rate(DUR)
Number ofObservedInfections
Number ofPredictedInfections
StandardizedInfection
Ratio(SIR)
95% ConfidenceInterval
MAIN LINE HOSPITAL - PAOLI (11750)2014 5, 940 54, 574 0.11 5 3.41 1.47 (0.47 – 3.43)2013 6, 214 54, 045 0.11 4 4.18 0.96 (0.26 – 2.45)2012 6, 323 55, 386 0.11 10 4.35 2.30 (1.10 – 4.23)2011 6, 328 58, 816 0.11 3 3.77 0.80 (0.16 – 2.32)2010 6, 565 55, 763 0.12 6 4.65 1.29 (0.47 – 2.81)
MAIN LINE HOSPITAL BRYN MAWR (11753)2014 9, 830 62, 332 0.16 6 6.75 0.89 (0.32 – 1.94)2013 11, 638 64, 588 0.18 5 9.40 0.53 (0.17 – 1.24)2012 11, 111 69, 069 0.16 8 8.79 0.91 (0.39 – 1.79)2011 9, 673 76, 281 0.13 11 8.97 1.23 (0.61 – 2.19)2010 10, 146 77, 800 0.13 12 8.75 1.37 (0.71 – 2.40)
MAIN LINE HOSPITAL BRYN MAWR REHABILITATION (11417)2014 1, 203 36, 576 0.03 0 0.76 0.00 (0.00 – 4.85)2013 1, 417 36, 491 0.04 0 0.95 0.00 (0.00 – 3.84)2012 1, 915 38, 707 0.05 0 1.16 0.00 (0.00 – 3.17)2011 1, 913 41, 448 0.05 1 1.33 0.75 (0.01 – 4.18)2010 2, 229 43, 374 0.05 0 1.76 0.00 (0.00 – 2.08)
MAIN LINE HOSPITAL LANKENAU MEDICAL CENTER (11770)2014 15, 500 76, 756 0.20 6 10.44 0.57 (0.21 – 1.25)2013 14, 330 72, 843 0.20 8 11.58 0.69 (0.30 – 1.36)2012 13, 853 70, 862 0.20 5 11.29 0.44 (0.14 – 1.03)2011 13, 737 79, 864 0.17 14 12.05 1.16 (0.63 – 1.95)2010 15, 007 85, 093 0.18 14 12.43 1.13 (0.62 – 1.89)
MEADVILLE MEDICAL CENTER (11583)2014 2, 436 36, 576 0.07 3 1.79 1.68 (0.34 – 4.91)2013 3, 094 36, 306 0.09 7 2.50 2.80 (1.12 – 5.76)2012 2, 577 35, 113 0.07 1 1.80 0.55 (0.01 – 3.09)2011 3, 250 36, 634 0.09 1 3.22 0.31 (0.00 – 1.73)2010 3, 389 36, 711 0.09 0 3.06 0.00 (0.00 – 1.20)
MEMORIAL HOSPITAL (11633)2014 1, 447 18, 203 0.08 3 1.05 2.87 (0.58 – 8.38)2013 3, 064 25, 113 0.12 1 2.48 0.40 (0.01 – 2.25)2012 2, 474 22, 194 0.11 2 1.85 1.08 (0.12 – 3.91)2011 2, 701 23, 341 0.12 3 2.55 1.18 (0.24 – 3.44)2010 2, 345 22, 073 0.11 4 2.08 1.93 (0.52 – 4.93)
MERCY FITZGERALD HOSPITAL (11683)2014 5, 186 40, 953 0.13 9 3.62 2.49 (1.13 – 4.72)2013 6, 046 42, 258 0.14 8 4.89 1.64 (0.70 – 3.23)2012 5, 396 45, 719 0.12 5 4.07 1.23 (0.40 – 2.87)2011 7, 094 47, 715 0.15 13 6.39 2.03 (1.08 – 3.48)2010 8, 001 50, 205 0.16 16 6.72 2.38 (1.36 – 3.87)
MERCY PHILADELPHIA HOSPITAL (11946)2014 3, 433 37, 345 0.09 2 2.46 0.81 (0.09 – 2.94)2013 4, 249 38, 617 0.11 4 3.44 1.16 (0.31 – 2.98)2012 4, 578 40, 012 0.11 4 3.43 1.17 (0.31 – 2.98)2011 5, 664 43, 434 0.13 1 5.23 0.19 (0.00 – 1.06)2010 6, 314 47, 304 0.13 2 5.43 0.37 (0.04 – 1.33)
MERCY SUBURBAN HOSPITAL (11952)2014 4, 006 20, 009 0.20 1 2.70 0.37 (0.00 – 2.06)2013 4, 097 23, 128 0.18 3 3.31 0.91 (0.18 – 2.65)2012 3, 631 26, 003 0.14 1 2.81 0.36 (0.00 – 1.98)2011 4, 866 28, 748 0.17 6 4.28 1.40 (0.51 – 3.05)2010 5, 299 30, 578 0.17 5 4.40 1.14 (0.37 – 2.65)
Continued on next page . . .
104
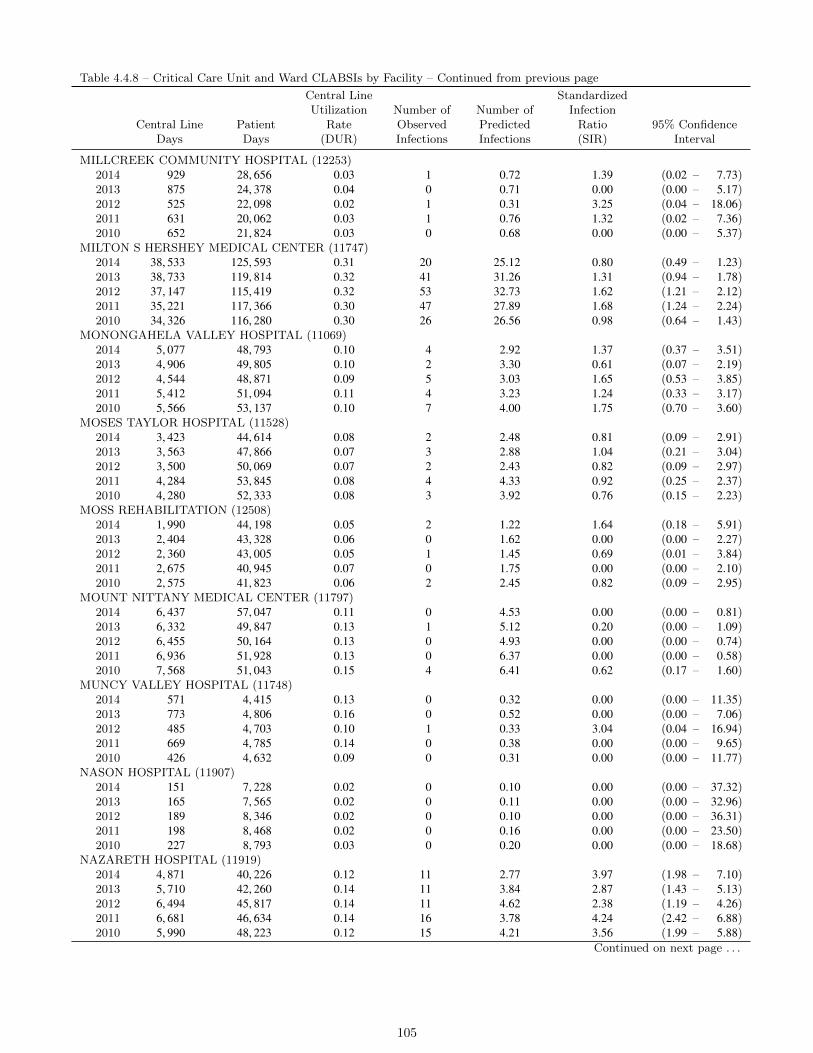
Table 4.4.8 – Critical Care Unit and Ward CLABSIs by Facility – Continued from previous page
Central LineDays
PatientDays
Central LineUtilization
Rate(DUR)
Number ofObservedInfections
Number ofPredictedInfections
StandardizedInfection
Ratio(SIR)
95% ConfidenceInterval
MILLCREEK COMMUNITY HOSPITAL (12253)2014 929 28, 656 0.03 1 0.72 1.39 (0.02 – 7.73)2013 875 24, 378 0.04 0 0.71 0.00 (0.00 – 5.17)2012 525 22, 098 0.02 1 0.31 3.25 (0.04 – 18.06)2011 631 20, 062 0.03 1 0.76 1.32 (0.02 – 7.36)2010 652 21, 824 0.03 0 0.68 0.00 (0.00 – 5.37)
MILTON S HERSHEY MEDICAL CENTER (11747)2014 38, 533 125, 593 0.31 20 25.12 0.80 (0.49 – 1.23)2013 38, 733 119, 814 0.32 41 31.26 1.31 (0.94 – 1.78)2012 37, 147 115, 419 0.32 53 32.73 1.62 (1.21 – 2.12)2011 35, 221 117, 366 0.30 47 27.89 1.68 (1.24 – 2.24)2010 34, 326 116, 280 0.30 26 26.56 0.98 (0.64 – 1.43)
MONONGAHELA VALLEY HOSPITAL (11069)2014 5, 077 48, 793 0.10 4 2.92 1.37 (0.37 – 3.51)2013 4, 906 49, 805 0.10 2 3.30 0.61 (0.07 – 2.19)2012 4, 544 48, 871 0.09 5 3.03 1.65 (0.53 – 3.85)2011 5, 412 51, 094 0.11 4 3.23 1.24 (0.33 – 3.17)2010 5, 566 53, 137 0.10 7 4.00 1.75 (0.70 – 3.60)
MOSES TAYLOR HOSPITAL (11528)2014 3, 423 44, 614 0.08 2 2.48 0.81 (0.09 – 2.91)2013 3, 563 47, 866 0.07 3 2.88 1.04 (0.21 – 3.04)2012 3, 500 50, 069 0.07 2 2.43 0.82 (0.09 – 2.97)2011 4, 284 53, 845 0.08 4 4.33 0.92 (0.25 – 2.37)2010 4, 280 52, 333 0.08 3 3.92 0.76 (0.15 – 2.23)
MOSS REHABILITATION (12508)2014 1, 990 44, 198 0.05 2 1.22 1.64 (0.18 – 5.91)2013 2, 404 43, 328 0.06 0 1.62 0.00 (0.00 – 2.27)2012 2, 360 43, 005 0.05 1 1.45 0.69 (0.01 – 3.84)2011 2, 675 40, 945 0.07 0 1.75 0.00 (0.00 – 2.10)2010 2, 575 41, 823 0.06 2 2.45 0.82 (0.09 – 2.95)
MOUNT NITTANY MEDICAL CENTER (11797)2014 6, 437 57, 047 0.11 0 4.53 0.00 (0.00 – 0.81)2013 6, 332 49, 847 0.13 1 5.12 0.20 (0.00 – 1.09)2012 6, 455 50, 164 0.13 0 4.93 0.00 (0.00 – 0.74)2011 6, 936 51, 928 0.13 0 6.37 0.00 (0.00 – 0.58)2010 7, 568 51, 043 0.15 4 6.41 0.62 (0.17 – 1.60)
MUNCY VALLEY HOSPITAL (11748)2014 571 4, 415 0.13 0 0.32 0.00 (0.00 – 11.35)2013 773 4, 806 0.16 0 0.52 0.00 (0.00 – 7.06)2012 485 4, 703 0.10 1 0.33 3.04 (0.04 – 16.94)2011 669 4, 785 0.14 0 0.38 0.00 (0.00 – 9.65)2010 426 4, 632 0.09 0 0.31 0.00 (0.00 – 11.77)
NASON HOSPITAL (11907)2014 151 7, 228 0.02 0 0.10 0.00 (0.00 – 37.32)2013 165 7, 565 0.02 0 0.11 0.00 (0.00 – 32.96)2012 189 8, 346 0.02 0 0.10 0.00 (0.00 – 36.31)2011 198 8, 468 0.02 0 0.16 0.00 (0.00 – 23.50)2010 227 8, 793 0.03 0 0.20 0.00 (0.00 – 18.68)
NAZARETH HOSPITAL (11919)2014 4, 871 40, 226 0.12 11 2.77 3.97 (1.98 – 7.10)2013 5, 710 42, 260 0.14 11 3.84 2.87 (1.43 – 5.13)2012 6, 494 45, 817 0.14 11 4.62 2.38 (1.19 – 4.26)2011 6, 681 46, 634 0.14 16 3.78 4.24 (2.42 – 6.88)2010 5, 990 48, 223 0.12 15 4.21 3.56 (1.99 – 5.88)
Continued on next page . . .
105
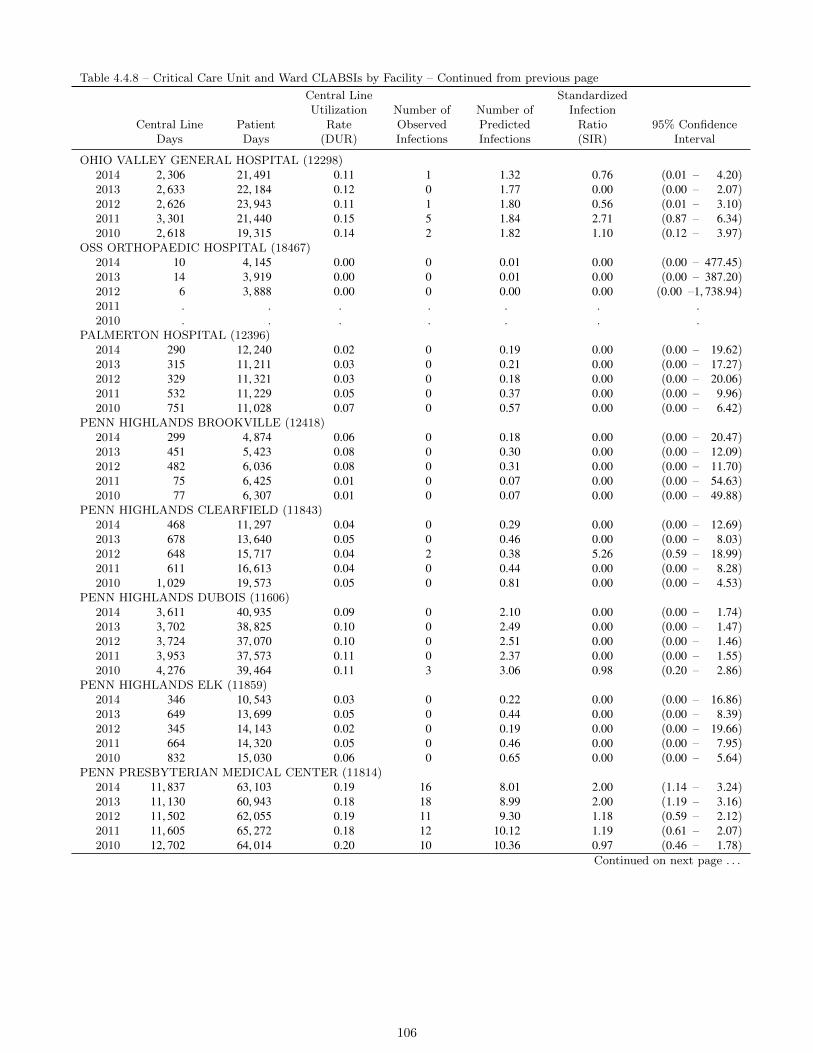
Table 4.4.8 – Critical Care Unit and Ward CLABSIs by Facility – Continued from previous page
Central LineDays
PatientDays
Central LineUtilization
Rate(DUR)
Number ofObservedInfections
Number ofPredictedInfections
StandardizedInfection
Ratio(SIR)
95% ConfidenceInterval
OHIO VALLEY GENERAL HOSPITAL (12298)2014 2, 306 21, 491 0.11 1 1.32 0.76 (0.01 – 4.20)2013 2, 633 22, 184 0.12 0 1.77 0.00 (0.00 – 2.07)2012 2, 626 23, 943 0.11 1 1.80 0.56 (0.01 – 3.10)2011 3, 301 21, 440 0.15 5 1.84 2.71 (0.87 – 6.34)2010 2, 618 19, 315 0.14 2 1.82 1.10 (0.12 – 3.97)
OSS ORTHOPAEDIC HOSPITAL (18467)2014 10 4, 145 0.00 0 0.01 0.00 (0.00 – 477.45)2013 14 3, 919 0.00 0 0.01 0.00 (0.00 – 387.20)2012 6 3, 888 0.00 0 0.00 0.00 (0.00 –1, 738.94)2011 . . . . . . .2010 . . . . . . .
PALMERTON HOSPITAL (12396)2014 290 12, 240 0.02 0 0.19 0.00 (0.00 – 19.62)2013 315 11, 211 0.03 0 0.21 0.00 (0.00 – 17.27)2012 329 11, 321 0.03 0 0.18 0.00 (0.00 – 20.06)2011 532 11, 229 0.05 0 0.37 0.00 (0.00 – 9.96)2010 751 11, 028 0.07 0 0.57 0.00 (0.00 – 6.42)
PENN HIGHLANDS BROOKVILLE (12418)2014 299 4, 874 0.06 0 0.18 0.00 (0.00 – 20.47)2013 451 5, 423 0.08 0 0.30 0.00 (0.00 – 12.09)2012 482 6, 036 0.08 0 0.31 0.00 (0.00 – 11.70)2011 75 6, 425 0.01 0 0.07 0.00 (0.00 – 54.63)2010 77 6, 307 0.01 0 0.07 0.00 (0.00 – 49.88)
PENN HIGHLANDS CLEARFIELD (11843)2014 468 11, 297 0.04 0 0.29 0.00 (0.00 – 12.69)2013 678 13, 640 0.05 0 0.46 0.00 (0.00 – 8.03)2012 648 15, 717 0.04 2 0.38 5.26 (0.59 – 18.99)2011 611 16, 613 0.04 0 0.44 0.00 (0.00 – 8.28)2010 1, 029 19, 573 0.05 0 0.81 0.00 (0.00 – 4.53)
PENN HIGHLANDS DUBOIS (11606)2014 3, 611 40, 935 0.09 0 2.10 0.00 (0.00 – 1.74)2013 3, 702 38, 825 0.10 0 2.49 0.00 (0.00 – 1.47)2012 3, 724 37, 070 0.10 0 2.51 0.00 (0.00 – 1.46)2011 3, 953 37, 573 0.11 0 2.37 0.00 (0.00 – 1.55)2010 4, 276 39, 464 0.11 3 3.06 0.98 (0.20 – 2.86)
PENN HIGHLANDS ELK (11859)2014 346 10, 543 0.03 0 0.22 0.00 (0.00 – 16.86)2013 649 13, 699 0.05 0 0.44 0.00 (0.00 – 8.39)2012 345 14, 143 0.02 0 0.19 0.00 (0.00 – 19.66)2011 664 14, 320 0.05 0 0.46 0.00 (0.00 – 7.95)2010 832 15, 030 0.06 0 0.65 0.00 (0.00 – 5.64)
PENN PRESBYTERIAN MEDICAL CENTER (11814)2014 11, 837 63, 103 0.19 16 8.01 2.00 (1.14 – 3.24)2013 11, 130 60, 943 0.18 18 8.99 2.00 (1.19 – 3.16)2012 11, 502 62, 055 0.19 11 9.30 1.18 (0.59 – 2.12)2011 11, 605 65, 272 0.18 12 10.12 1.19 (0.61 – 2.07)2010 12, 702 64, 014 0.20 10 10.36 0.97 (0.46 – 1.78)
Continued on next page . . .
106

Table 4.4.8 – Critical Care Unit and Ward CLABSIs by Facility – Continued from previous page
Central LineDays
PatientDays
Central LineUtilization
Rate(DUR)
Number ofObservedInfections
Number ofPredictedInfections
StandardizedInfection
Ratio(SIR)
95% ConfidenceInterval
PENN STATE HERSHEY REHABILITATION LLC (11915)2014 1, 760 18, 144 0.10 0 1.02 0.00 (0.00 – 3.60)2013 1, 607 17, 246 0.09 1 1.08 0.92 (0.01 – 5.15)2012 1, 696 15, 851 0.11 1 1.16 0.87 (0.01 – 4.82)2011 1, 397 14, 130 0.10 1 0.85 1.18 (0.02 – 6.58)2010 800 9, 804 0.08 0 0.73 0.00 (0.00 – 5.00)
PENNSYLVANIA HOSPITAL OF THE UNIVERSITY OF PA HEALTH SYS (11448)2014 13, 868 85, 079 0.16 16 9.49 1.69 (0.96 – 2.74)2013 13, 426 86, 113 0.16 14 10.85 1.29 (0.70 – 2.16)2012 13, 443 92, 287 0.15 15 10.47 1.43 (0.80 – 2.36)2011 13, 008 116, 528 0.11 14 12.35 1.13 (0.62 – 1.90)2010 14, 244 100, 297 0.14 19 12.14 1.56 (0.94 – 2.44)
PHOENIXVILLE HOSPITAL COMPANY LLC (11836)2014 5, 426 35, 174 0.15 1 3.03 0.33 (0.00 – 1.84)2013 5, 620 32, 971 0.17 4 3.78 1.06 (0.28 – 2.71)2012 5, 425 33, 584 0.16 2 3.94 0.51 (0.06 – 1.83)2011 5, 118 34, 445 0.15 1 2.87 0.35 (0.00 – 1.94)2010 4, 971 34, 362 0.14 3 3.42 0.88 (0.18 – 2.56)
PINNACLE HEALTH HOSPITALS - COMMUNITY GENERAL OSTEOPATHIC HOSPITAL (34069)2014 8, 585 48, 295 0.18 2 5.84 0.34 (0.04 – 1.24)2013 . . . . . . .2012 . . . . . . .2011 . . . . . . .2010 . . . . . . .
PINNACLE HEALTH HOSPITALS - HARRISBURG HOSPITAL (34068)2014 21, 454 96, 660 0.22 2 14.34 0.14 (0.02 – 0.50)2013 . . . . . . .2012 . . . . . . .2011 . . . . . . .2010 . . . . . . .
POCONO MEDICAL CENTER (11772)2014 3, 990 47, 169 0.08 4 2.33 1.71 (0.46 – 4.39)2013 6, 010 52, 051 0.12 8 4.04 1.98 (0.85 – 3.90)2012 6, 282 53, 715 0.12 5 4.73 1.06 (0.34 – 2.47)2011 5, 205 55, 415 0.09 6 5.10 1.18 (0.43 – 2.56)2010 4, 646 51, 368 0.09 3 4.20 0.71 (0.14 – 2.09)
POTTSTOWN MEMORIAL MEDICAL CENTER (11983)2014 4, 339 38, 922 0.11 4 2.48 1.61 (0.43 – 4.12)2013 5, 668 42, 128 0.13 4 3.81 1.05 (0.28 – 2.69)2012 4, 752 42, 914 0.11 3 3.25 0.92 (0.19 – 2.69)2011 5, 890 43, 413 0.14 2 3.36 0.59 (0.07 – 2.15)2010 5, 683 43, 283 0.13 1 3.97 0.25 (0.00 – 1.40)
PUNXSUTAWNEY AREA HOSPITAL (11830)2014 359 8, 655 0.04 0 0.22 0.00 (0.00 – 16.55)2013 339 7, 683 0.04 0 0.23 0.00 (0.00 – 16.06)2012 439 7, 111 0.06 1 0.27 3.64 (0.05 – 20.28)2011 495 7, 380 0.07 0 0.32 0.00 (0.00 – 11.40)2010 445 7, 440 0.06 0 0.34 0.00 (0.00 – 10.65)
READING HOSPITAL (12375)2014 24, 159 149, 687 0.16 14 16.55 0.85 (0.46 – 1.42)2013 25, 436 154, 968 0.16 14 20.56 0.68 (0.37 – 1.14)2012 25, 448 152, 935 0.17 13 20.23 0.64 (0.34 – 1.10)2011 25, 747 145, 790 0.18 15 22.47 0.67 (0.37 – 1.10)2010 24, 408 137, 380 0.18 22 20.20 1.09 (0.68 – 1.65)
Continued on next page . . .
107

Table 4.4.8 – Critical Care Unit and Ward CLABSIs by Facility – Continued from previous page
Central LineDays
PatientDays
Central LineUtilization
Rate(DUR)
Number ofObservedInfections
Number ofPredictedInfections
StandardizedInfection
Ratio(SIR)
95% ConfidenceInterval
REGIONAL HOSPITAL OF SCRANTON (12533)2014 5, 180 46, 820 0.11 2 3.65 0.55 (0.06 – 1.98)2013 5, 330 45, 651 0.12 5 4.31 1.16 (0.37 – 2.71)2012 5, 598 49, 636 0.11 2 4.19 0.48 (0.05 – 1.72)2011 5, 770 43, 923 0.13 6 5.32 1.13 (0.41 – 2.46)2010 6, 015 44, 463 0.14 5 5.16 0.97 (0.31 – 2.26)
RIDDLE MEMORIAL HOSPITAL (11731)2014 6, 371 42, 659 0.15 6 3.57 1.68 (0.61 – 3.66)2013 6, 977 44, 830 0.16 5 4.69 1.07 (0.34 – 2.49)2012 7, 505 47, 311 0.16 6 5.44 1.10 (0.40 – 2.40)2011 8, 274 49, 126 0.17 4 4.54 0.88 (0.24 – 2.26)2010 8, 478 49, 708 0.17 5 5.71 0.87 (0.28 – 2.04)
ROBERT PACKER HOSPITAL (12422)2014 7, 983 57, 975 0.14 4 5.54 0.72 (0.19 – 1.85)2013 9, 199 57, 896 0.16 6 7.43 0.81 (0.29 – 1.76)2012 9, 832 60, 870 0.16 10 7.78 1.29 (0.62 – 2.36)2011 9, 346 56, 802 0.16 13 8.26 1.57 (0.84 – 2.69)2010 7, 662 54, 475 0.14 5 6.54 0.76 (0.25 – 1.78)
ROXBOROUGH MEMORIAL HOSPITAL (11978)2014 1, 556 22, 567 0.07 1 1.14 0.88 (0.01 – 4.89)2013 1, 701 23, 849 0.07 1 1.38 0.73 (0.01 – 4.04)2012 1, 934 25, 179 0.08 0 1.36 0.00 (0.00 – 2.69)2011 2, 477 29, 113 0.09 10 2.47 4.05 (1.94 – 7.44)2010 3, 050 30, 472 0.10 8 2.72 2.94 (1.26 – 5.79)
SACRED HEART HOSPITAL (11684)2014 1, 634 31, 152 0.05 4 1.22 3.28 (0.88 – 8.39)2013 1, 982 30, 229 0.07 0 1.60 0.00 (0.00 – 2.29)2012 2, 253 31, 930 0.07 1 1.57 0.64 (0.01 – 3.55)2011 2, 286 33, 195 0.07 3 1.48 2.03 (0.41 – 5.93)2010 2, 377 30, 323 0.08 4 1.78 2.25 (0.61 – 5.77)
SAINT VINCENT HOSPITAL (11699)2014 8, 881 73, 871 0.12 5 6.22 0.80 (0.26 – 1.88)2013 8, 318 71, 791 0.12 4 6.73 0.59 (0.16 – 1.52)2012 8, 595 73, 132 0.12 14 6.47 2.16 (1.18 – 3.63)2011 11, 064 78, 775 0.14 8 10.07 0.79 (0.34 – 1.57)2010 13, 171 83, 867 0.16 10 11.08 0.90 (0.43 – 1.66)
SCHUYLKILL MEDICAL CENTER - EAST NORWEGIAN STREET (11922)2014 1, 988 24, 025 0.08 2 1.16 1.72 (0.19 – 6.20)2013 2, 012 26, 682 0.08 3 1.35 2.22 (0.45 – 6.47)2012 2, 579 26, 766 0.10 2 1.73 1.16 (0.13 – 4.18)2011 2, 612 30, 491 0.09 3 1.62 1.85 (0.37 – 5.40)2010 2, 677 32, 932 0.08 5 1.99 2.51 (0.81 – 5.86)
SCHUYLKILL MEDICAL CENTER - SOUTH JACKSON STREET (12087)2014 1, 735 32, 746 0.05 2 1.05 1.90 (0.21 – 6.87)2013 2, 086 34, 761 0.06 3 1.40 2.14 (0.43 – 6.24)2012 2, 363 34, 712 0.07 2 1.50 1.33 (0.15 – 4.81)2011 1, 447 37, 078 0.04 3 1.04 2.89 (0.58 – 8.44)2010 2, 042 38, 688 0.05 3 1.61 1.87 (0.38 – 5.45)
SHARON REGIONAL HEALTH SYSTEM (12250)2014 3, 653 38, 092 0.10 0 2.12 0.00 (0.00 – 1.73)2013 3, 559 34, 895 0.10 0 2.39 0.00 (0.00 – 1.53)2012 3, 296 33, 922 0.10 2 2.21 0.90 (0.10 – 3.27)2011 3, 281 37, 998 0.09 0 2.04 0.00 (0.00 – 1.80)2010 3, 578 35, 112 0.10 5 2.58 1.94 (0.62 – 4.52)
Continued on next page . . .
108

Table 4.4.8 – Critical Care Unit and Ward CLABSIs by Facility – Continued from previous page
Central LineDays
PatientDays
Central LineUtilization
Rate(DUR)
Number ofObservedInfections
Number ofPredictedInfections
StandardizedInfection
Ratio(SIR)
95% ConfidenceInterval
SHRINERS HOSPITALS FOR CHILDREN - PHILA (12244)2014 844 4, 361 0.19 0 0.46 0.00 (0.00 – 7.92)2013 855 5, 090 0.17 1 0.57 1.74 (0.02 – 9.68)2012 707 4, 835 0.15 1 0.51 1.98 (0.03 – 11.01)2011 832 4, 514 0.18 0 0.45 0.00 (0.00 – 8.17)2010 662 4, 863 0.14 0 0.46 0.00 (0.00 – 7.98)
SOLDIERS AND SAILORS MEMORIAL HOSPITAL (11688)2014 460 10, 117 0.05 1 0.35 2.88 (0.04 – 16.02)2013 582 11, 623 0.05 2 0.47 4.24 (0.48 – 15.32)2012 488 11, 622 0.04 0 0.31 0.00 (0.00 – 11.72)2011 647 11, 733 0.06 1 0.44 2.29 (0.03 – 12.77)2010 643 12, 009 0.05 0 0.51 0.00 (0.00 – 7.26)
SOMERSET HOSPITAL (12282)2014 2, 803 15, 166 0.18 0 1.90 0.00 (0.00 – 1.93)2013 2, 993 18, 930 0.16 2 2.42 0.83 (0.09 – 2.99)2012 2, 454 17, 538 0.14 0 1.74 0.00 (0.00 – 2.10)2011 2, 322 19, 366 0.12 2 1.36 1.47 (0.17 – 5.32)2010 2, 276 19, 768 0.12 0 1.62 0.00 (0.00 – 2.27)
SOUTHWEST REGIONAL MEDICAL CENTER (11942)2014 360 10, 418 0.03 0 0.23 0.00 (0.00 – 16.27)2013 460 11, 449 0.04 0 0.31 0.00 (0.00 – 11.83)2012 825 14, 297 0.06 0 0.51 0.00 (0.00 – 7.19)2011 1, 077 16, 853 0.06 1 0.71 1.42 (0.02 – 7.88)2010 1, 289 17, 904 0.07 1 0.97 1.03 (0.01 – 5.71)
ST. CHRISTOPHERS HOSPITAL FOR CHILDREN (12290)2014 5, 919 28, 298 0.21 0 3.97 0.00 (0.00 – 0.92)2013 5, 894 31, 935 0.18 2 4.76 0.42 (0.05 – 1.52)2012 5, 353 34, 050 0.16 1 4.22 0.24 (0.00 – 1.32)2011 4, 701 32, 754 0.14 7 4.26 1.64 (0.66 – 3.38)2010 4, 895 29, 714 0.16 1 4.09 0.24 (0.00 – 1.36)
ST. CLAIR MEMORIAL HOSPITAL (10561)2014 7, 987 86, 277 0.09 0 5.71 0.00 (0.00 – 0.64)2013 8, 384 83, 028 0.10 1 6.78 0.15 (0.00 – 0.82)2012 8, 379 83, 473 0.10 3 6.16 0.49 (0.10 – 1.42)2011 9, 873 85, 606 0.12 1 9.32 0.11 (0.00 – 0.60)2010 9, 756 86, 799 0.11 5 8.58 0.58 (0.19 – 1.36)
ST. JOSEPH MEDICAL CTR (11961)2014 7, 329 31, 625 0.23 3 4.88 0.61 (0.12 – 1.80)2013 8, 025 32, 542 0.25 4 6.48 0.62 (0.17 – 1.58)2012 8, 696 36, 148 0.24 7 7.32 0.96 (0.38 – 1.97)2011 9, 493 36, 742 0.26 9 7.73 1.16 (0.53 – 2.21)2010 9, 420 36, 866 0.26 6 7.43 0.81 (0.29 – 1.76)
ST. JOSEPHS HOSPITAL (12438)2014 3, 035 30, 140 0.10 9 2.16 4.18 (1.91 – 7.93)2013 4, 265 30, 941 0.14 21 3.45 6.09 (3.77 – 9.31)2012 4, 483 31, 637 0.14 6 3.48 1.73 (0.63 – 3.76)2011 6, 080 23, 411 0.26 16 4.94 3.24 (1.85 – 5.26)2010 5, 337 22, 626 0.24 26 4.25 6.11 (3.99 – 8.95)
ST. LUKES HOSPITAL BETHLEHEM (11718)2014 16, 771 130, 484 0.13 3 11.69 0.26 (0.05 – 0.75)2013 18, 754 125, 720 0.15 15 15.16 0.99 (0.55 – 1.63)2012 21, 292 127, 448 0.17 16 16.94 0.94 (0.54 – 1.53)2011 30, 097 139, 179 0.22 20 25.31 0.79 (0.48 – 1.22)2010 32, 060 145, 123 0.22 24 25.78 0.93 (0.60 – 1.39)
Continued on next page . . .
109

Table 4.4.8 – Critical Care Unit and Ward CLABSIs by Facility – Continued from previous page
Central LineDays
PatientDays
Central LineUtilization
Rate(DUR)
Number ofObservedInfections
Number ofPredictedInfections
StandardizedInfection
Ratio(SIR)
95% ConfidenceInterval
ST. LUKES HOSPITAL- ANDERSON CAMPUS (21487)2014 1, 557 16, 331 0.10 0 1.11 0.00 (0.00 – 3.30)2013 1, 753 19, 105 0.09 0 1.42 0.00 (0.00 – 2.59)2012 1, 528 16, 294 0.09 2 1.11 1.80 (0.20 – 6.50)2011 . . . . . . .2010 . . . . . . .
ST. LUKES MINERS MEMORIAL HOSPITAL (11784)2014 350 7, 403 0.05 0 0.21 0.00 (0.00 – 17.14)2013 322 7, 001 0.05 0 0.22 0.00 (0.00 – 16.91)2012 291 7, 014 0.04 0 0.17 0.00 (0.00 – 21.46)2011 251 6, 390 0.04 0 0.18 0.00 (0.00 – 20.39)2010 175 6, 549 0.03 0 0.15 0.00 (0.00 – 24.34)
ST. LUKES QUAKERTOWN HOSPITAL (11711)2014 650 13, 846 0.05 0 0.40 0.00 (0.00 – 9.23)2013 729 14, 419 0.05 0 0.49 0.00 (0.00 – 7.47)2012 767 14, 938 0.05 2 0.47 4.29 (0.48 – 15.50)2011 999 15, 057 0.07 0 0.65 0.00 (0.00 – 5.64)2010 1, 090 14, 903 0.07 0 0.82 0.00 (0.00 – 4.46)
ST. MARY MEDICAL CENTER (11885)2014 11, 651 97, 183 0.12 10 6.63 1.51 (0.72 – 2.77)2013 12, 148 98, 714 0.12 10 8.17 1.22 (0.59 – 2.25)2012 13, 391 93, 836 0.14 13 9.54 1.36 (0.72 – 2.33)2011 14, 395 98, 307 0.15 12 8.11 1.48 (0.76 – 2.59)2010 14, 442 98, 676 0.15 14 9.93 1.41 (0.77 – 2.36)
SUNBURY COMMUNITY HOSP (12105)2014 186 6, 350 0.03 0 0.12 0.00 (0.00 – 31.09)2013 123 6, 541 0.02 0 0.08 0.00 (0.00 – 44.20)2012 175 6, 518 0.03 1 0.10 10.41 (0.14 – 57.92)2011 180 7, 897 0.02 0 0.14 0.00 (0.00 – 25.73)2010 313 7, 978 0.04 0 0.26 0.00 (0.00 – 14.32)
SURGICAL SPECIALTY CENTER AT COORDINATED HEALTH, THE (15259)2014 113 1, 955 0.06 0 0.07 0.00 (0.00 – 53.92)2013 25 1, 941 0.01 0 0.02 0.00 (0.00 – 217.32)2012 14 2, 052 0.01 0 0.01 0.00 (0.00 – 591.03)2011 24 1, 913 0.01 0 0.02 0.00 (0.00 – 172.97)2010 1 1, 611 0.00 0 0.00 0.00 (0.00 –2, 590.75)
TEMPLE UNIVERSITY HOSPITAL (12382)2014 24, 853 138, 877 0.18 17 16.89 1.01 (0.59 – 1.61)2013 24, 604 135, 180 0.18 24 19.88 1.21 (0.77 – 1.80)2012 25, 575 145, 021 0.18 18 20.51 0.88 (0.52 – 1.39)2011 25, 987 137, 371 0.19 45 22.40 2.01 (1.47 – 2.69)2010 26, 846 133, 595 0.20 79 21.86 3.61 (2.86 – 4.50)
THOMAS JEFFERSON UNIVERSITY HOSPITAL - METHODIST (12017)2014 5, 695 51, 933 0.11 5 4.02 1.24 (0.40 – 2.90)2013 6, 823 46, 661 0.15 8 5.52 1.45 (0.62 – 2.86)2012 7, 606 48, 112 0.16 6 6.00 1.00 (0.37 – 2.18)2011 8, 858 46, 785 0.19 16 7.63 2.10 (1.20 – 3.40)2010 8, 042 48, 856 0.16 9 6.72 1.34 (0.61 – 2.54)
THOMAS JEFFERSON UNIVERSITY HOSPITAL (11506)2014 42, 789 174, 861 0.24 34 28.39 1.20 (0.83 – 1.67)2013 43, 942 174, 323 0.25 44 35.49 1.24 (0.90 – 1.66)2012 45, 594 173, 621 0.26 55 38.92 1.41 (1.06 – 1.84)2011 45, 577 168, 751 0.27 35 36.80 0.95 (0.66 – 1.32)2010 41, 188 151, 739 0.27 8 32.23 0.25 (0.11 – 0.49)
Continued on next page . . .
110

Table 4.4.8 – Critical Care Unit and Ward CLABSIs by Facility – Continued from previous page
Central LineDays
PatientDays
Central LineUtilization
Rate(DUR)
Number ofObservedInfections
Number ofPredictedInfections
StandardizedInfection
Ratio(SIR)
95% ConfidenceInterval
TROY COMMUNITY HOSPITAL (12018)2014 2, 039 7, 070 0.29 0 1.08 0.00 (0.00 – 3.38)2013 1, 747 7, 100 0.25 3 1.17 2.56 (0.51 – 7.47)2012 1, 658 7, 782 0.21 2 1.26 1.59 (0.18 – 5.74)2011 2, 289 7, 358 0.31 1 1.12 0.89 (0.01 – 4.96)2010 1, 818 7, 457 0.24 0 1.17 0.00 (0.00 – 3.14)
TYLER MEMORIAL HOSPITAL (11829)2014 122 3, 430 0.04 0 0.08 0.00 (0.00 – 48.12)2013 209 5, 653 0.04 0 0.14 0.00 (0.00 – 26.04)2012 226 5, 258 0.04 0 0.13 0.00 (0.00 – 27.48)2011 40 6, 054 0.01 0 0.04 0.00 (0.00 – 92.27)2010 83 6, 047 0.01 0 0.08 0.00 (0.00 – 46.99)
TYRONE HOSPITAL (12717)2014 23 2, 290 0.01 0 0.02 0.00 (0.00 – 231.61)2013 143 2, 668 0.05 0 0.10 0.00 (0.00 – 38.09)2012 55 2, 809 0.02 0 0.03 0.00 (0.00 – 127.63)2011 123 2, 672 0.05 0 0.09 0.00 (0.00 – 42.84)2010 125 2, 567 0.05 0 0.10 0.00 (0.00 – 36.89)
UNIONTOWN HOSPITAL (10441)2014 4, 071 41, 357 0.10 1 2.90 0.35 (0.00 – 1.92)2013 4, 133 43, 957 0.09 1 3.34 0.30 (0.00 – 1.66)2012 4, 199 39, 143 0.11 2 3.12 0.64 (0.07 – 2.32)2011 4, 408 42, 132 0.10 3 4.24 0.71 (0.14 – 2.07)2010 4, 172 46, 143 0.09 0 3.78 0.00 (0.00 – 0.97)
UPMC ALTOONA (10178)2014 12, 391 81, 988 0.15 9 6.93 1.30 (0.59 – 2.47)2013 11, 276 80, 978 0.14 16 7.58 2.11 (1.21 – 3.43)2012 10, 388 82, 234 0.13 2 7.26 0.28 (0.03 – 0.99)2011 12, 277 89, 191 0.14 1 6.99 0.14 (0.00 – 0.80)2010 11, 115 89, 928 0.12 6 7.82 0.77 (0.28 – 1.67)
UPMC BEDFORD (11680)2014 384 7, 219 0.05 0 0.23 0.00 (0.00 – 15.77)2013 390 7, 301 0.05 0 0.26 0.00 (0.00 – 13.97)2012 287 6, 670 0.04 0 0.17 0.00 (0.00 – 21.63)2011 214 6, 685 0.03 0 0.16 0.00 (0.00 – 23.03)2010 356 6, 977 0.05 0 0.28 0.00 (0.00 – 13.03)
UPMC EAST (28812)2014 7, 501 42, 254 0.18 5 4.14 1.21 (0.39 – 2.82)2013 7, 436 29, 712 0.25 4 4.99 0.80 (0.22 – 2.05)2012 . . . . . . .2011 . . . . . . .2010 . . . . . . .
UPMC HAMOT (11725)2014 18, 939 81, 099 0.23 16 12.61 1.27 (0.72 – 2.06)2013 23, 270 86, 702 0.27 24 18.79 1.28 (0.82 – 1.90)2012 24, 608 83, 500 0.29 13 21.39 0.61 (0.32 – 1.04)2011 26, 692 83, 515 0.32 7 20.90 0.33 (0.13 – 0.69)2010 23, 342 79, 770 0.29 7 18.09 0.39 (0.16 – 0.80)
UPMC HORIZON (11675)2014 3, 967 33, 387 0.12 3 2.78 1.08 (0.22 – 3.15)2013 3, 895 32, 503 0.12 3 3.15 0.95 (0.19 – 2.78)2012 3, 971 34, 860 0.11 0 2.98 0.00 (0.00 – 1.23)2011 4, 325 34, 976 0.12 2 2.51 0.80 (0.09 – 2.87)2010 4, 518 40, 285 0.11 2 3.22 0.62 (0.07 – 2.24)
Continued on next page . . .
111

Table 4.4.8 – Critical Care Unit and Ward CLABSIs by Facility – Continued from previous page
Central LineDays
PatientDays
Central LineUtilization
Rate(DUR)
Number ofObservedInfections
Number ofPredictedInfections
StandardizedInfection
Ratio(SIR)
95% ConfidenceInterval
UPMC MCKEESPORT (11707)2014 6, 319 49, 590 0.13 2 4.41 0.45 (0.05 – 1.64)2013 5, 839 53, 354 0.11 4 4.72 0.85 (0.23 – 2.17)2012 7, 103 56, 499 0.13 6 5.40 1.11 (0.41 – 2.42)2011 7, 184 64, 473 0.11 4 6.82 0.59 (0.16 – 1.50)2010 6, 687 62, 590 0.11 2 5.92 0.34 (0.04 – 1.22)
UPMC MERCY (10384)2014 23, 625 133, 030 0.18 11 16.06 0.68 (0.34 – 1.23)2013 24, 489 137, 491 0.18 11 19.79 0.56 (0.28 – 0.99)2012 28, 868 145, 278 0.20 26 23.59 1.10 (0.72 – 1.61)2011 22, 470 141, 723 0.16 6 20.00 0.30 (0.11 – 0.65)2010 23, 469 143, 866 0.16 15 19.64 0.76 (0.43 – 1.26)
UPMC NORTHWEST (11837)2014 3, 005 27, 824 0.11 1 1.72 0.58 (0.01 – 3.23)2013 3, 491 28, 814 0.12 1 2.35 0.43 (0.01 – 2.37)2012 3, 537 28, 315 0.12 1 2.47 0.41 (0.01 – 2.25)2011 3, 232 29, 476 0.11 1 1.92 0.52 (0.01 – 2.90)2010 3, 175 30, 786 0.10 0 2.29 0.00 (0.00 – 1.60)
UPMC PASSAVANT (11242)2014 21, 024 98, 593 0.21 8 11.45 0.70 (0.30 – 1.38)2013 22, 070 100, 207 0.22 8 14.83 0.54 (0.23 – 1.06)2012 21, 420 102, 897 0.21 13 16.18 0.80 (0.43 – 1.37)2011 21, 204 105, 433 0.20 7 11.27 0.62 (0.25 – 1.28)2010 20, 910 96, 673 0.22 25 13.66 1.83 (1.18 – 2.70)
UPMC PRESBYTERIAN SHADYSIDE - SHADYSIDE (10118)2014 42, 642 117, 928 0.36 11 27.45 0.40 (0.20 – 0.72)2013 42, 650 126, 296 0.34 14 34.42 0.41 (0.22 – 0.68)2012 43, 185 131, 289 0.33 17 38.18 0.45 (0.26 – 0.71)2011 42, 730 142, 753 0.30 21 33.86 0.62 (0.38 – 0.95)2010 34, 543 138, 159 0.25 12 27.33 0.44 (0.23 – 0.77)
UPMC PRESBYTERIAN SHADYSIDE (10348)2014 102, 013 216, 611 0.47 66 64.36 1.03 (0.79 – 1.30)2013 103, 460 221, 480 0.47 64 83.46 0.77 (0.59 – 0.98)2012 106, 039 227, 985 0.47 84 98.95 0.85 (0.68 – 1.05)2011 103, 214 224, 769 0.46 79 75.61 1.04 (0.83 – 1.30)2010 100, 818 222, 461 0.45 76 73.72 1.03 (0.81 – 1.29)
UPMC ST. MARGARET (11561)2014 10, 624 70, 654 0.15 8 7.32 1.09 (0.47 – 2.15)2013 11, 706 69, 846 0.17 6 9.46 0.63 (0.23 – 1.38)2012 13, 240 75, 976 0.17 3 10.60 0.28 (0.06 – 0.83)2011 12, 071 79, 022 0.15 4 10.82 0.37 (0.10 – 0.95)2010 11, 165 76, 041 0.15 8 9.48 0.84 (0.36 – 1.66)
Continued on next page . . .
112
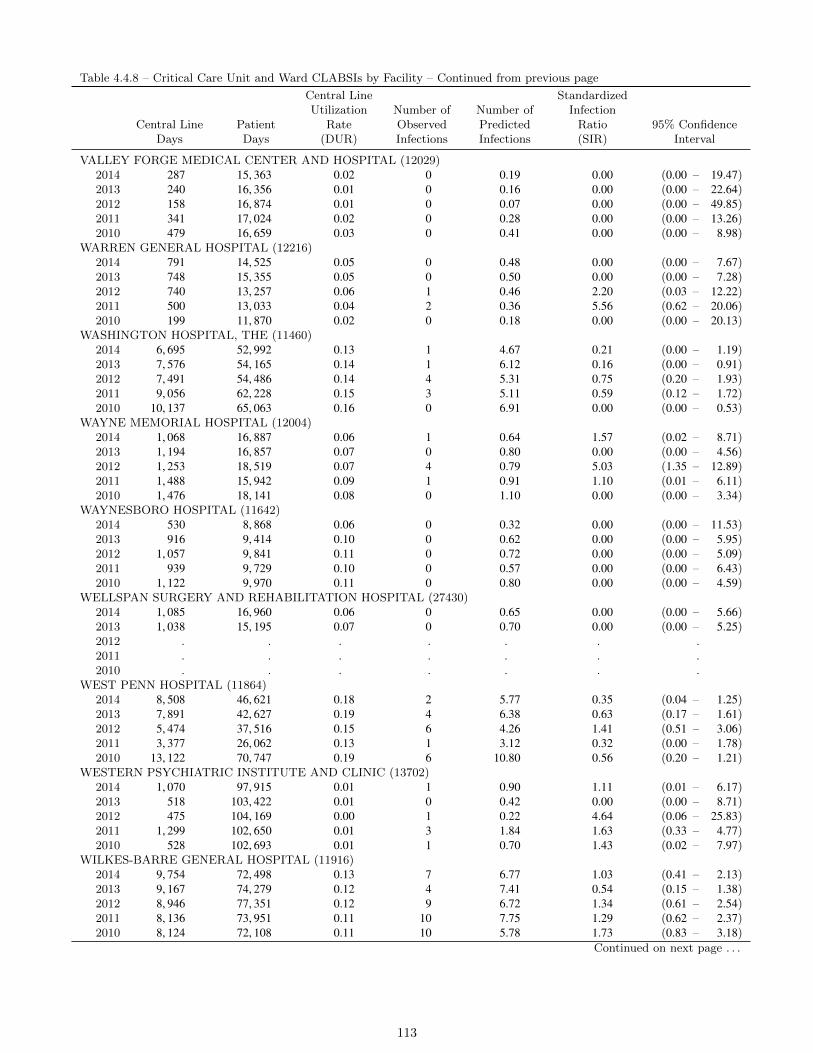
Table 4.4.8 – Critical Care Unit and Ward CLABSIs by Facility – Continued from previous page
Central LineDays
PatientDays
Central LineUtilization
Rate(DUR)
Number ofObservedInfections
Number ofPredictedInfections
StandardizedInfection
Ratio(SIR)
95% ConfidenceInterval
VALLEY FORGE MEDICAL CENTER AND HOSPITAL (12029)2014 287 15, 363 0.02 0 0.19 0.00 (0.00 – 19.47)2013 240 16, 356 0.01 0 0.16 0.00 (0.00 – 22.64)2012 158 16, 874 0.01 0 0.07 0.00 (0.00 – 49.85)2011 341 17, 024 0.02 0 0.28 0.00 (0.00 – 13.26)2010 479 16, 659 0.03 0 0.41 0.00 (0.00 – 8.98)
WARREN GENERAL HOSPITAL (12216)2014 791 14, 525 0.05 0 0.48 0.00 (0.00 – 7.67)2013 748 15, 355 0.05 0 0.50 0.00 (0.00 – 7.28)2012 740 13, 257 0.06 1 0.46 2.20 (0.03 – 12.22)2011 500 13, 033 0.04 2 0.36 5.56 (0.62 – 20.06)2010 199 11, 870 0.02 0 0.18 0.00 (0.00 – 20.13)
WASHINGTON HOSPITAL, THE (11460)2014 6, 695 52, 992 0.13 1 4.67 0.21 (0.00 – 1.19)2013 7, 576 54, 165 0.14 1 6.12 0.16 (0.00 – 0.91)2012 7, 491 54, 486 0.14 4 5.31 0.75 (0.20 – 1.93)2011 9, 056 62, 228 0.15 3 5.11 0.59 (0.12 – 1.72)2010 10, 137 65, 063 0.16 0 6.91 0.00 (0.00 – 0.53)
WAYNE MEMORIAL HOSPITAL (12004)2014 1, 068 16, 887 0.06 1 0.64 1.57 (0.02 – 8.71)2013 1, 194 16, 857 0.07 0 0.80 0.00 (0.00 – 4.56)2012 1, 253 18, 519 0.07 4 0.79 5.03 (1.35 – 12.89)2011 1, 488 15, 942 0.09 1 0.91 1.10 (0.01 – 6.11)2010 1, 476 18, 141 0.08 0 1.10 0.00 (0.00 – 3.34)
WAYNESBORO HOSPITAL (11642)2014 530 8, 868 0.06 0 0.32 0.00 (0.00 – 11.53)2013 916 9, 414 0.10 0 0.62 0.00 (0.00 – 5.95)2012 1, 057 9, 841 0.11 0 0.72 0.00 (0.00 – 5.09)2011 939 9, 729 0.10 0 0.57 0.00 (0.00 – 6.43)2010 1, 122 9, 970 0.11 0 0.80 0.00 (0.00 – 4.59)
WELLSPAN SURGERY AND REHABILITATION HOSPITAL (27430)2014 1, 085 16, 960 0.06 0 0.65 0.00 (0.00 – 5.66)2013 1, 038 15, 195 0.07 0 0.70 0.00 (0.00 – 5.25)2012 . . . . . . .2011 . . . . . . .2010 . . . . . . .
WEST PENN HOSPITAL (11864)2014 8, 508 46, 621 0.18 2 5.77 0.35 (0.04 – 1.25)2013 7, 891 42, 627 0.19 4 6.38 0.63 (0.17 – 1.61)2012 5, 474 37, 516 0.15 6 4.26 1.41 (0.51 – 3.06)2011 3, 377 26, 062 0.13 1 3.12 0.32 (0.00 – 1.78)2010 13, 122 70, 747 0.19 6 10.80 0.56 (0.20 – 1.21)
WESTERN PSYCHIATRIC INSTITUTE AND CLINIC (13702)2014 1, 070 97, 915 0.01 1 0.90 1.11 (0.01 – 6.17)2013 518 103, 422 0.01 0 0.42 0.00 (0.00 – 8.71)2012 475 104, 169 0.00 1 0.22 4.64 (0.06 – 25.83)2011 1, 299 102, 650 0.01 3 1.84 1.63 (0.33 – 4.77)2010 528 102, 693 0.01 1 0.70 1.43 (0.02 – 7.97)
WILKES-BARRE GENERAL HOSPITAL (11916)2014 9, 754 72, 498 0.13 7 6.77 1.03 (0.41 – 2.13)2013 9, 167 74, 279 0.12 4 7.41 0.54 (0.15 – 1.38)2012 8, 946 77, 351 0.12 9 6.72 1.34 (0.61 – 2.54)2011 8, 136 73, 951 0.11 10 7.75 1.29 (0.62 – 2.37)2010 8, 124 72, 108 0.11 10 5.78 1.73 (0.83 – 3.18)
Continued on next page . . .
113

Table 4.4.8 – Critical Care Unit and Ward CLABSIs by Facility – Continued from previous page
Central LineDays
PatientDays
Central LineUtilization
Rate(DUR)
Number ofObservedInfections
Number ofPredictedInfections
StandardizedInfection
Ratio(SIR)
95% ConfidenceInterval
WILLIAMSPORT REGIONAL MEDICAL CENTER (11732)2014 8, 713 53, 831 0.16 8 5.97 1.34 (0.58 – 2.64)2013 8, 174 57, 713 0.14 6 6.61 0.91 (0.33 – 1.98)2012 6, 560 53, 152 0.12 5 4.98 1.00 (0.32 – 2.34)2011 7, 409 54, 085 0.14 3 6.78 0.44 (0.09 – 1.29)2010 6, 580 49, 673 0.13 4 5.66 0.71 (0.19 – 1.81)
WINDBER HOSPITAL (12031)2014 151 5, 609 0.03 0 0.10 0.00 (0.00 – 38.05)2013 109 6, 417 0.02 0 0.07 0.00 (0.00 – 49.87)2012 76 7, 704 0.01 0 0.04 0.00 (0.00 – 102.79)2011 125 7, 878 0.02 0 0.11 0.00 (0.00 – 34.67)2010 97 8, 114 0.01 0 0.09 0.00 (0.00 – 39.48)
YORK HOSPITAL (10108)2014 19, 381 159, 769 0.12 12 13.57 0.88 (0.46 – 1.54)2013 19, 326 153, 471 0.13 18 15.63 1.15 (0.68 – 1.82)2012 17, 847 153, 749 0.12 9 13.41 0.67 (0.31 – 1.27)2011 17, 565 167, 565 0.10 10 16.87 0.59 (0.28 – 1.09)2010 18, 559 159, 288 0.12 16 16.24 0.99 (0.56 – 1.60)
114
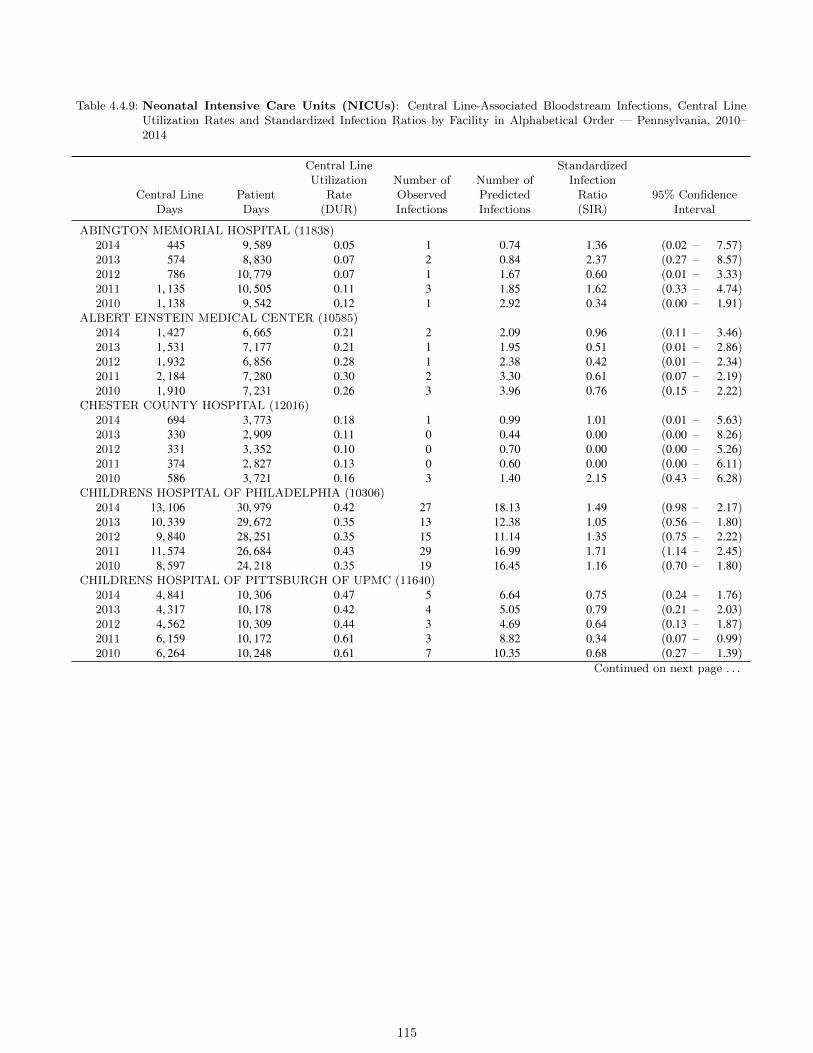
Table 4.4.9: Neonatal Intensive Care Units (NICUs): Central Line-Associated Bloodstream Infections, Central LineUtilization Rates and Standardized Infection Ratios by Facility in Alphabetical Order — Pennsylvania, 2010–2014
Central LineDays
PatientDays
Central LineUtilization
Rate(DUR)
Number ofObservedInfections
Number ofPredictedInfections
StandardizedInfection
Ratio(SIR)
95% ConfidenceInterval
ABINGTON MEMORIAL HOSPITAL (11838)2014 445 9, 589 0.05 1 0.74 1.36 (0.02 – 7.57)2013 574 8, 830 0.07 2 0.84 2.37 (0.27 – 8.57)2012 786 10, 779 0.07 1 1.67 0.60 (0.01 – 3.33)2011 1, 135 10, 505 0.11 3 1.85 1.62 (0.33 – 4.74)2010 1, 138 9, 542 0.12 1 2.92 0.34 (0.00 – 1.91)
ALBERT EINSTEIN MEDICAL CENTER (10585)2014 1, 427 6, 665 0.21 2 2.09 0.96 (0.11 – 3.46)2013 1, 531 7, 177 0.21 1 1.95 0.51 (0.01 – 2.86)2012 1, 932 6, 856 0.28 1 2.38 0.42 (0.01 – 2.34)2011 2, 184 7, 280 0.30 2 3.30 0.61 (0.07 – 2.19)2010 1, 910 7, 231 0.26 3 3.96 0.76 (0.15 – 2.22)
CHESTER COUNTY HOSPITAL (12016)2014 694 3, 773 0.18 1 0.99 1.01 (0.01 – 5.63)2013 330 2, 909 0.11 0 0.44 0.00 (0.00 – 8.26)2012 331 3, 352 0.10 0 0.70 0.00 (0.00 – 5.26)2011 374 2, 827 0.13 0 0.60 0.00 (0.00 – 6.11)2010 586 3, 721 0.16 3 1.40 2.15 (0.43 – 6.28)
CHILDRENS HOSPITAL OF PHILADELPHIA (10306)2014 13, 106 30, 979 0.42 27 18.13 1.49 (0.98 – 2.17)2013 10, 339 29, 672 0.35 13 12.38 1.05 (0.56 – 1.80)2012 9, 840 28, 251 0.35 15 11.14 1.35 (0.75 – 2.22)2011 11, 574 26, 684 0.43 29 16.99 1.71 (1.14 – 2.45)2010 8, 597 24, 218 0.35 19 16.45 1.16 (0.70 – 1.80)
CHILDRENS HOSPITAL OF PITTSBURGH OF UPMC (11640)2014 4, 841 10, 306 0.47 5 6.64 0.75 (0.24 – 1.76)2013 4, 317 10, 178 0.42 4 5.05 0.79 (0.21 – 2.03)2012 4, 562 10, 309 0.44 3 4.69 0.64 (0.13 – 1.87)2011 6, 159 10, 172 0.61 3 8.82 0.34 (0.07 – 0.99)2010 6, 264 10, 248 0.61 7 10.35 0.68 (0.27 – 1.39)
Continued on next page . . .
115

Table 4.4.9 – NICU CLABSIs by Facility – Continued from previous page
Central LineDays
PatientDays
Central LineUtilization
Rate(DUR)
Number ofObservedInfections
Number ofPredictedInfections
StandardizedInfection
Ratio(SIR)
95% ConfidenceInterval
CONEMAUGH MEMORIAL MEDICAL CENTER (10280)2014 646 3, 589 0.18 0 0.96 0.00 (0.00 – 3.83)2013 589 3, 425 0.17 1 0.77 1.30 (0.02 – 7.24)2012 501 3, 807 0.13 1 0.84 1.19 (0.02 – 6.63)2011 567 3, 188 0.18 0 0.89 0.00 (0.00 – 4.12)2010 294 3, 380 0.09 4 0.82 4.87 (1.31 – 12.47)
CROZER CHESTER MEDICAL CENTER (11839)2014 583 3, 146 0.19 1 0.86 1.16 (0.02 – 6.46)2013 719 3, 591 0.20 1 0.92 1.09 (0.01 – 6.04)2012 575 3, 321 0.17 1 0.86 1.16 (0.02 – 6.45)2011 767 3, 776 0.20 1 1.19 0.84 (0.01 – 4.67)2010 618 3, 533 0.17 4 1.43 2.80 (0.75 – 7.16)
DELAWARE COUNTY MEMORIAL HOSPITAL (11972)2014 54 1, 515 0.04 0 0.09 0.00 (0.00 – 40.26)2013 131 1, 596 0.08 0 0.19 0.00 (0.00 – 19.63)2012 93 1, 468 0.06 0 0.21 0.00 (0.00 – 17.54)2011 80 1, 472 0.05 0 0.14 0.00 (0.00 – 26.73)2010 126 1, 417 0.09 0 0.35 0.00 (0.00 – 10.48)
EASTON HOSPITAL (11929)2014 12 665 0.02 0 0.02 0.00 (0.00 – 171.54)2013 3 418 0.01 0 0.01 0.00 (0.00 – 638.51)2012 1 481 0.00 0 0.01 0.00 (0.00 – 412.26)2011 10 358 0.03 0 0.02 0.00 (0.00 – 203.46)2010 10 774 0.01 0 0.05 0.00 (0.00 – 78.60)
EINSTEIN MEDICAL CENTER MONTGOMERY (30210)2014 300 3, 339 0.09 0 0.45 0.00 (0.00 – 8.10)2013 271 2, 975 0.09 0 0.37 0.00 (0.00 – 9.79)2012 . . . . . . .2011 . . . . . . .2010 . . . . . . .
EPHRATA COMMUNITY HOSPITAL (11764)2014 47 992 0.05 0 0.07 0.00 (0.00 – 49.14)2013 68 1, 170 0.06 0 0.10 0.00 (0.00 – 36.96)2012 41 974 0.04 0 0.12 0.00 (0.00 – 30.11)2011 177 1, 013 0.17 0 0.33 0.00 (0.00 – 11.12)2010 205 1, 018 0.20 0 0.25 0.00 (0.00 – 14.50)
GEISINGER MEDICAL CENTER (11775)2014 1, 330 10, 369 0.13 3 2.02 1.48 (0.30 – 4.33)2013 1, 809 10, 078 0.18 4 2.35 1.70 (0.46 – 4.36)2012 1, 758 10, 677 0.16 4 2.69 1.49 (0.40 – 3.81)2011 2, 565 9, 934 0.26 3 3.92 0.77 (0.15 – 2.24)2010 2, 954 11, 589 0.25 11 6.18 1.78 (0.89 – 3.19)
Continued on next page . . .
116

Table 4.4.9 – NICU CLABSIs by Facility – Continued from previous page
Central LineDays
PatientDays
Central LineUtilization
Rate(DUR)
Number ofObservedInfections
Number ofPredictedInfections
StandardizedInfection
Ratio(SIR)
95% ConfidenceInterval
GEISINGER WYOMING VALLEY MEDICAL CENTER (11780)2014 . . . . . . .2013 16 1, 995 0.01 0 0.03 0.00 (0.00 – 121.34)2012 65 1, 674 0.04 0 0.18 0.00 (0.00 – 20.61)2011 29 239 0.12 0 0.05 0.00 (0.00 – 78.31)2010 . . . . . . .
GEISINGER-COMMUNITY MEDICAL CENTER (11914)2014 . . . . . . .2013 . . . . . . .2012 . . . . . . .2011 . . . . . . .2010 17 598 0.03 0 0.06 0.00 (0.00 – 57.17)
HAHNEMANN UNIVERSITY HOSPITAL (11437)2014 584 4, 084 0.14 0 0.88 0.00 (0.00 – 4.16)2013 1, 328 4, 323 0.31 3 1.62 1.86 (0.37 – 5.43)2012 1, 350 4, 776 0.28 2 1.66 1.20 (0.14 – 4.34)2011 1, 070 5, 455 0.20 2 1.67 1.20 (0.13 – 4.33)2010 663 4, 415 0.15 1 1.60 0.63 (0.01 – 3.48)
HEART OF LANCASTER REGIONAL MEDICAL CENTER (12571)2014 207 1, 518 0.14 0 0.31 0.00 (0.00 – 11.70)2013 195 1, 436 0.14 0 0.26 0.00 (0.00 – 14.01)2012 97 1, 042 0.09 0 0.19 0.00 (0.00 – 19.63)2011 150 329 0.46 1 0.22 4.56 (0.06 – 25.36)2010 63 532 0.12 0 0.16 0.00 (0.00 – 22.65)
HOLY REDEEMER HOSPITAL (11973)2014 312 4, 605 0.07 1 0.48 2.08 (0.03 – 11.55)2013 388 4, 808 0.08 1 0.54 1.84 (0.02 – 10.22)2012 354 5, 204 0.07 2 0.87 2.31 (0.26 – 8.33)2011 467 4, 726 0.10 1 0.91 1.10 (0.01 – 6.13)2010 447 4, 923 0.09 1 0.68 1.46 (0.02 – 8.14)
HOLY SPIRIT HOSPITAL (12387)2014 55 1, 502 0.04 0 0.09 0.00 (0.00 – 41.13)2013 45 1, 232 0.04 0 0.07 0.00 (0.00 – 52.80)2012 88 1, 423 0.06 0 0.22 0.00 (0.00 – 16.38)2011 158 1, 392 0.11 0 0.30 0.00 (0.00 – 12.06)2010 20 1, 240 0.02 0 0.05 0.00 (0.00 – 75.32)
HOSPITAL OF THE UNIVERSITY OF PENNSYLVANIA (10219)2014 2, 265 11, 768 0.19 7 3.34 2.10 (0.84 – 4.32)2013 2, 125 12, 258 0.17 5 2.77 1.81 (0.58 – 4.21)2012 2, 299 12, 146 0.19 1 3.33 0.30 (0.00 – 1.67)2011 2, 264 12, 151 0.19 6 3.54 1.69 (0.62 – 3.69)2010 2, 516 12, 058 0.21 4 5.55 0.72 (0.19 – 1.84)
LANCASTER GENERAL HOSPITAL (10183)2014 1, 014 7, 585 0.13 2 1.48 1.35 (0.15 – 4.87)2013 724 7, 053 0.10 1 0.99 1.01 (0.01 – 5.64)2012 749 6, 345 0.12 2 1.47 1.36 (0.15 – 4.91)2011 518 7, 179 0.07 2 1.03 1.94 (0.22 – 7.00)2010 904 7, 802 0.12 2 1.29 1.54 (0.17 – 5.58)
LEHIGH VALLEY HOSPITAL (11884)2014 2, 059 12, 913 0.16 2 3.08 0.65 (0.07 – 2.34)2013 1, 973 11, 495 0.17 3 2.57 1.17 (0.23 – 3.40)2012 2, 082 10, 534 0.20 4 2.96 1.35 (0.36 – 3.46)2011 1, 556 9, 643 0.16 0 2.46 0.00 (0.00 – 1.49)2010 1, 898 12, 183 0.16 4 4.53 0.88 (0.24 – 2.26)
Continued on next page . . .
117

Table 4.4.9 – NICU CLABSIs by Facility – Continued from previous page
Central LineDays
PatientDays
Central LineUtilization
Rate(DUR)
Number ofObservedInfections
Number ofPredictedInfections
StandardizedInfection
Ratio(SIR)
95% ConfidenceInterval
LOWER BUCKS HOSPITAL (12390)2014 . . . . . . .2013 . . . . . . .2012 1 1, 185 0.00 0 0.01 0.00 (0.00 – 255.89)2011 25 1, 203 0.02 0 0.05 0.00 (0.00 – 67.14)2010 56 775 0.07 0 0.09 0.00 (0.00 – 40.28)
MAGEE WOMENS HOSPITAL OF UPMC HEALTH SYSTEM (10301)2014 3, 216 25, 912 0.12 3 4.91 0.61 (0.12 – 1.79)2013 3, 158 25, 268 0.12 3 4.28 0.70 (0.14 – 2.05)2012 3, 779 24, 387 0.15 6 5.93 1.01 (0.37 – 2.20)2011 3, 228 21, 658 0.15 4 5.13 0.78 (0.21 – 1.99)2010 4, 026 21, 076 0.19 2 9.10 0.22 (0.02 – 0.79)
MAIN LINE HOSPITAL - PAOLI (11750)2014 24 1, 060 0.02 0 0.04 0.00 (0.00 – 90.69)2013 112 1, 524 0.07 1 0.16 6.29 (0.08 – 35.02)2012 45 1, 377 0.03 0 0.15 0.00 (0.00 – 24.78)2011 54 1, 152 0.05 0 0.11 0.00 (0.00 – 33.03)2010 84 1, 516 0.06 0 0.15 0.00 (0.00 – 25.00)
MAIN LINE HOSPITAL BRYN MAWR (11753)2014 201 2, 193 0.09 0 0.31 0.00 (0.00 – 11.67)2013 175 2, 338 0.07 0 0.25 0.00 (0.00 – 14.53)2012 506 2, 663 0.19 1 0.73 1.37 (0.02 – 7.61)2011 618 17, 835 0.03 0 1.10 0.00 (0.00 – 3.35)2010 440 17, 495 0.03 1 1.72 0.58 (0.01 – 3.24)
MAIN LINE HOSPITAL LANKENAU MEDICAL CENTER (11770)2014 733 5, 530 0.13 0 1.11 0.00 (0.00 – 3.30)2013 805 6, 158 0.13 0 1.09 0.00 (0.00 – 3.38)2012 656 5, 265 0.12 0 1.12 0.00 (0.00 – 3.26)2011 819 5, 997 0.14 0 1.31 0.00 (0.00 – 2.80)2010 956 5, 505 0.17 0 2.22 0.00 (0.00 – 1.65)
MILTON S HERSHEY MEDICAL CENTER (11747)2014 3, 489 10, 917 0.32 3 4.94 0.61 (0.12 – 1.78)2013 3, 869 11, 160 0.35 5 4.64 1.08 (0.35 – 2.52)2012 3, 897 10, 604 0.37 6 4.32 1.39 (0.51 – 3.02)2011 3, 864 10, 320 0.37 5 5.74 0.87 (0.28 – 2.03)2010 3, 436 10, 410 0.33 8 6.70 1.19 (0.51 – 2.35)
MOSES TAYLOR HOSPITAL (11528)2014 223 3, 730 0.06 0 0.36 0.00 (0.00 – 10.16)2013 250 3, 446 0.07 0 0.36 0.00 (0.00 – 10.13)2012 300 3, 950 0.08 0 0.63 0.00 (0.00 – 5.85)2011 225 3, 545 0.06 0 0.38 0.00 (0.00 – 9.62)2010 472 4, 487 0.11 0 1.25 0.00 (0.00 – 2.93)
PENN HIGHLANDS DUBOIS (11606)2014 114 3, 903 0.03 0 0.19 0.00 (0.00 – 19.49)2013 75 3, 079 0.02 0 0.12 0.00 (0.00 – 30.17)2012 119 3, 531 0.03 0 0.39 0.00 (0.00 – 9.49)2011 103 3, 650 0.03 0 0.22 0.00 (0.00 – 16.67)2010 247 3, 634 0.07 0 0.41 0.00 (0.00 – 8.98)
PENNSYLVANIA HOSPITAL OF THE UNIVERSITY OF PA HEALTH SYS (11448)2014 1, 438 11, 099 0.13 4 2.19 1.83 (0.49 – 4.68)2013 1, 574 11, 489 0.14 4 2.11 1.90 (0.51 – 4.85)2012 1, 943 12, 116 0.16 8 3.01 2.66 (1.15 – 5.24)2011 1, 842 12, 663 0.15 6 2.94 2.04 (0.75 – 4.45)2010 2, 264 11, 762 0.19 9 5.11 1.76 (0.80 – 3.35)
Continued on next page . . .
118
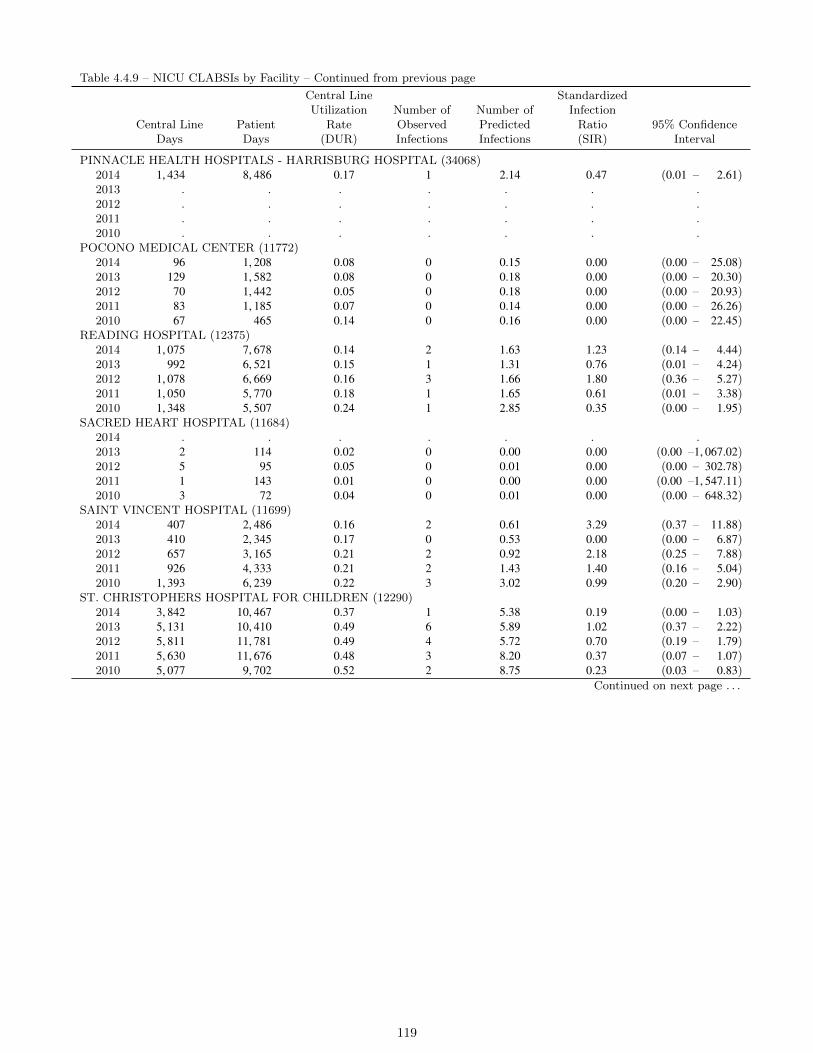
Table 4.4.9 – NICU CLABSIs by Facility – Continued from previous page
Central LineDays
PatientDays
Central LineUtilization
Rate(DUR)
Number ofObservedInfections
Number ofPredictedInfections
StandardizedInfection
Ratio(SIR)
95% ConfidenceInterval
PINNACLE HEALTH HOSPITALS - HARRISBURG HOSPITAL (34068)2014 1, 434 8, 486 0.17 1 2.14 0.47 (0.01 – 2.61)2013 . . . . . . .2012 . . . . . . .2011 . . . . . . .2010 . . . . . . .
POCONO MEDICAL CENTER (11772)2014 96 1, 208 0.08 0 0.15 0.00 (0.00 – 25.08)2013 129 1, 582 0.08 0 0.18 0.00 (0.00 – 20.30)2012 70 1, 442 0.05 0 0.18 0.00 (0.00 – 20.93)2011 83 1, 185 0.07 0 0.14 0.00 (0.00 – 26.26)2010 67 465 0.14 0 0.16 0.00 (0.00 – 22.45)
READING HOSPITAL (12375)2014 1, 075 7, 678 0.14 2 1.63 1.23 (0.14 – 4.44)2013 992 6, 521 0.15 1 1.31 0.76 (0.01 – 4.24)2012 1, 078 6, 669 0.16 3 1.66 1.80 (0.36 – 5.27)2011 1, 050 5, 770 0.18 1 1.65 0.61 (0.01 – 3.38)2010 1, 348 5, 507 0.24 1 2.85 0.35 (0.00 – 1.95)
SACRED HEART HOSPITAL (11684)2014 . . . . . . .2013 2 114 0.02 0 0.00 0.00 (0.00 –1, 067.02)2012 5 95 0.05 0 0.01 0.00 (0.00 – 302.78)2011 1 143 0.01 0 0.00 0.00 (0.00 –1, 547.11)2010 3 72 0.04 0 0.01 0.00 (0.00 – 648.32)
SAINT VINCENT HOSPITAL (11699)2014 407 2, 486 0.16 2 0.61 3.29 (0.37 – 11.88)2013 410 2, 345 0.17 0 0.53 0.00 (0.00 – 6.87)2012 657 3, 165 0.21 2 0.92 2.18 (0.25 – 7.88)2011 926 4, 333 0.21 2 1.43 1.40 (0.16 – 5.04)2010 1, 393 6, 239 0.22 3 3.02 0.99 (0.20 – 2.90)
ST. CHRISTOPHERS HOSPITAL FOR CHILDREN (12290)2014 3, 842 10, 467 0.37 1 5.38 0.19 (0.00 – 1.03)2013 5, 131 10, 410 0.49 6 5.89 1.02 (0.37 – 2.22)2012 5, 811 11, 781 0.49 4 5.72 0.70 (0.19 – 1.79)2011 5, 630 11, 676 0.48 3 8.20 0.37 (0.07 – 1.07)2010 5, 077 9, 702 0.52 2 8.75 0.23 (0.03 – 0.83)
Continued on next page . . .
119
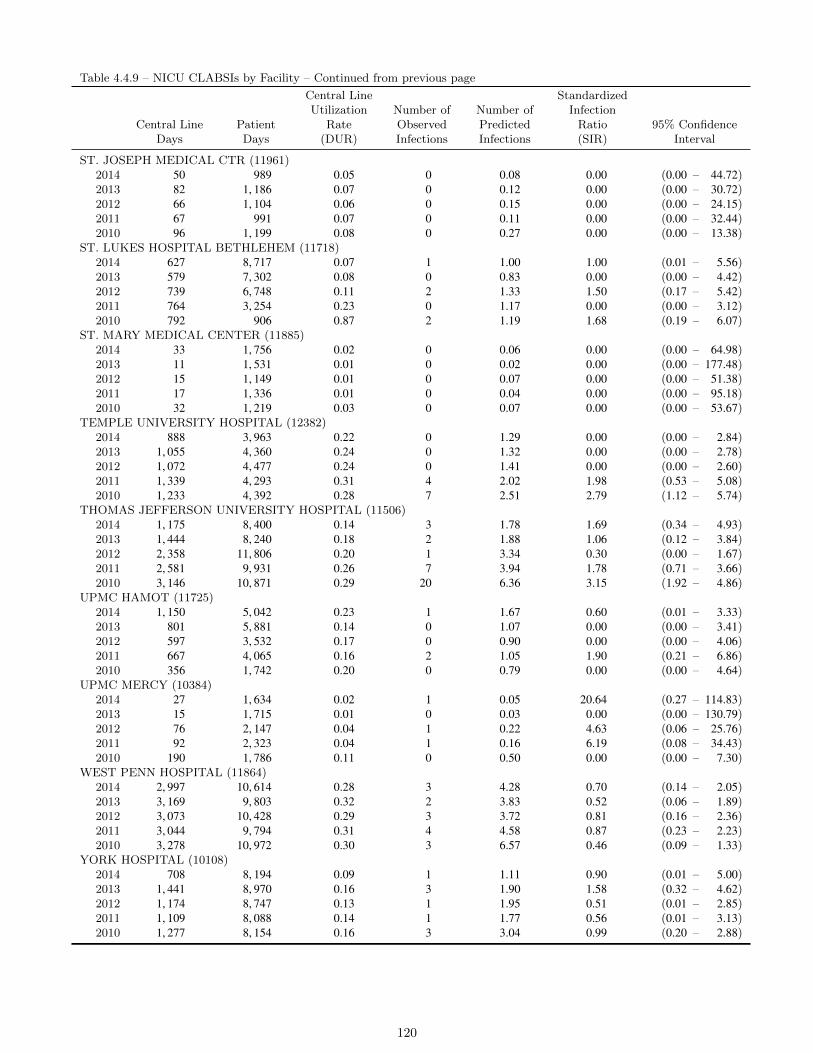
Table 4.4.9 – NICU CLABSIs by Facility – Continued from previous page
Central LineDays
PatientDays
Central LineUtilization
Rate(DUR)
Number ofObservedInfections
Number ofPredictedInfections
StandardizedInfection
Ratio(SIR)
95% ConfidenceInterval
ST. JOSEPH MEDICAL CTR (11961)2014 50 989 0.05 0 0.08 0.00 (0.00 – 44.72)2013 82 1, 186 0.07 0 0.12 0.00 (0.00 – 30.72)2012 66 1, 104 0.06 0 0.15 0.00 (0.00 – 24.15)2011 67 991 0.07 0 0.11 0.00 (0.00 – 32.44)2010 96 1, 199 0.08 0 0.27 0.00 (0.00 – 13.38)
ST. LUKES HOSPITAL BETHLEHEM (11718)2014 627 8, 717 0.07 1 1.00 1.00 (0.01 – 5.56)2013 579 7, 302 0.08 0 0.83 0.00 (0.00 – 4.42)2012 739 6, 748 0.11 2 1.33 1.50 (0.17 – 5.42)2011 764 3, 254 0.23 0 1.17 0.00 (0.00 – 3.12)2010 792 906 0.87 2 1.19 1.68 (0.19 – 6.07)
ST. MARY MEDICAL CENTER (11885)2014 33 1, 756 0.02 0 0.06 0.00 (0.00 – 64.98)2013 11 1, 531 0.01 0 0.02 0.00 (0.00 – 177.48)2012 15 1, 149 0.01 0 0.07 0.00 (0.00 – 51.38)2011 17 1, 336 0.01 0 0.04 0.00 (0.00 – 95.18)2010 32 1, 219 0.03 0 0.07 0.00 (0.00 – 53.67)
TEMPLE UNIVERSITY HOSPITAL (12382)2014 888 3, 963 0.22 0 1.29 0.00 (0.00 – 2.84)2013 1, 055 4, 360 0.24 0 1.32 0.00 (0.00 – 2.78)2012 1, 072 4, 477 0.24 0 1.41 0.00 (0.00 – 2.60)2011 1, 339 4, 293 0.31 4 2.02 1.98 (0.53 – 5.08)2010 1, 233 4, 392 0.28 7 2.51 2.79 (1.12 – 5.74)
THOMAS JEFFERSON UNIVERSITY HOSPITAL (11506)2014 1, 175 8, 400 0.14 3 1.78 1.69 (0.34 – 4.93)2013 1, 444 8, 240 0.18 2 1.88 1.06 (0.12 – 3.84)2012 2, 358 11, 806 0.20 1 3.34 0.30 (0.00 – 1.67)2011 2, 581 9, 931 0.26 7 3.94 1.78 (0.71 – 3.66)2010 3, 146 10, 871 0.29 20 6.36 3.15 (1.92 – 4.86)
UPMC HAMOT (11725)2014 1, 150 5, 042 0.23 1 1.67 0.60 (0.01 – 3.33)2013 801 5, 881 0.14 0 1.07 0.00 (0.00 – 3.41)2012 597 3, 532 0.17 0 0.90 0.00 (0.00 – 4.06)2011 667 4, 065 0.16 2 1.05 1.90 (0.21 – 6.86)2010 356 1, 742 0.20 0 0.79 0.00 (0.00 – 4.64)
UPMC MERCY (10384)2014 27 1, 634 0.02 1 0.05 20.64 (0.27 – 114.83)2013 15 1, 715 0.01 0 0.03 0.00 (0.00 – 130.79)2012 76 2, 147 0.04 1 0.22 4.63 (0.06 – 25.76)2011 92 2, 323 0.04 1 0.16 6.19 (0.08 – 34.43)2010 190 1, 786 0.11 0 0.50 0.00 (0.00 – 7.30)
WEST PENN HOSPITAL (11864)2014 2, 997 10, 614 0.28 3 4.28 0.70 (0.14 – 2.05)2013 3, 169 9, 803 0.32 2 3.83 0.52 (0.06 – 1.89)2012 3, 073 10, 428 0.29 3 3.72 0.81 (0.16 – 2.36)2011 3, 044 9, 794 0.31 4 4.58 0.87 (0.23 – 2.23)2010 3, 278 10, 972 0.30 3 6.57 0.46 (0.09 – 1.33)
YORK HOSPITAL (10108)2014 708 8, 194 0.09 1 1.11 0.90 (0.01 – 5.00)2013 1, 441 8, 970 0.16 3 1.90 1.58 (0.32 – 4.62)2012 1, 174 8, 747 0.13 1 1.95 0.51 (0.01 – 2.85)2011 1, 109 8, 088 0.14 1 1.77 0.56 (0.01 – 3.13)2010 1, 277 8, 154 0.16 3 3.04 0.99 (0.20 – 2.88)
120

Table 4.4.10: Specialty Care Areas (SCAs): Central Line-Associated Bloodstream Infections, Central Line UtilizationRates and Standardized Infection Ratios by Facility in Alphabetical Order — Pennsylvania, 2010–2014
Central LineDays
PatientDays
Central LineUtilization
Rate(DUR)
Number ofObservedInfections
Number ofPredictedInfections
StandardizedInfection
Ratio(SIR)
95% ConfidenceInterval
ABINGTON MEMORIAL HOSPITAL (11838)2014 3, 216 6, 626 0.49 5 3.10 1.61 (0.52 – 3.76)2013 3, 740 7, 216 0.52 6 5.65 1.06 (0.39 – 2.31)2012 3, 936 7, 429 0.53 5 4.39 1.14 (0.37 – 2.66)2011 4, 480 7, 863 0.57 6 5.13 1.17 (0.43 – 2.54)2010 4, 885 8, 311 0.59 9 5.72 1.57 (0.72 – 2.99)
CHILDRENS HOME OF PITTSBURGH, THE (12336)2014 . . . . . . .2013 561 3, 810 0.15 3 0.46 6.55 (1.32 – 19.14)2012 991 5, 923 0.17 3 1.51 1.98 (0.40 – 5.80)2011 . . . . . . .2010 . . . . . . .
CHILDRENS HOSPITAL OF PHILADELPHIA (10306)2014 13, 581 15, 942 0.85 29 18.34 1.58 (1.06 – 2.27)2013 12, 755 16, 252 0.78 41 21.47 1.91 (1.37 – 2.59)2012 12, 551 15, 285 0.82 35 16.39 2.14 (1.49 – 2.97)2011 11, 993 13, 454 0.89 20 14.05 1.42 (0.87 – 2.20)2010 10, 188 13, 203 0.77 22 14.32 1.54 (0.96 – 2.33)
CHILDRENS HOSPITAL OF PITTSBURGH OF UPMC (11640)2014 10, 412 12, 156 0.86 21 14.11 1.49 (0.92 – 2.28)2013 10, 021 12, 152 0.82 31 17.09 1.81 (1.23 – 2.57)2012 10, 612 12, 360 0.86 17 14.08 1.21 (0.70 – 1.93)2011 10, 967 12, 382 0.89 22 12.84 1.71 (1.07 – 2.59)2010 11, 312 12, 088 0.94 29 18.11 1.60 (1.07 – 2.30)
DELAWARE COUNTY MEMORIAL HOSPITAL (11972)2014 . . . . . . .2013 . . . . . . .2012 814 2, 166 0.38 1 0.80 1.25 (0.02 – 6.93)2011 2, 201 5, 157 0.43 3 2.49 1.21 (0.24 – 3.52)2010 2, 686 6, 114 0.44 5 2.59 1.93 (0.62 – 4.51)
EASTERN REGIONAL MEDICAL CENTER (12348)2014 8, 259 11, 523 0.72 1 0.95 1.05 (0.01 – 5.86)2013 9, 990 13, 312 0.75 11 12.51 0.88 (0.44 – 1.57)2012 11, 079 14, 608 0.76 28 29.08 0.96 (0.64 – 1.39)2011 9, 149 12, 729 0.72 18 15.79 1.14 (0.68 – 1.80)2010 8, 420 11, 255 0.75 18 18.56 0.97 (0.57 – 1.53)
EASTON HOSPITAL (11929)2014 1, 432 4, 341 0.33 0 1.10 0.00 (0.00 – 3.35)2013 1, 755 4, 745 0.37 2 2.42 0.82 (0.09 – 2.98)2012 2, 284 5, 820 0.39 1 2.29 0.44 (0.01 – 2.43)2011 2, 095 6, 077 0.34 1 2.34 0.43 (0.01 – 2.37)2010 2, 549 6, 265 0.41 3 2.33 1.29 (0.26 – 3.76)
Continued on next page . . .
121
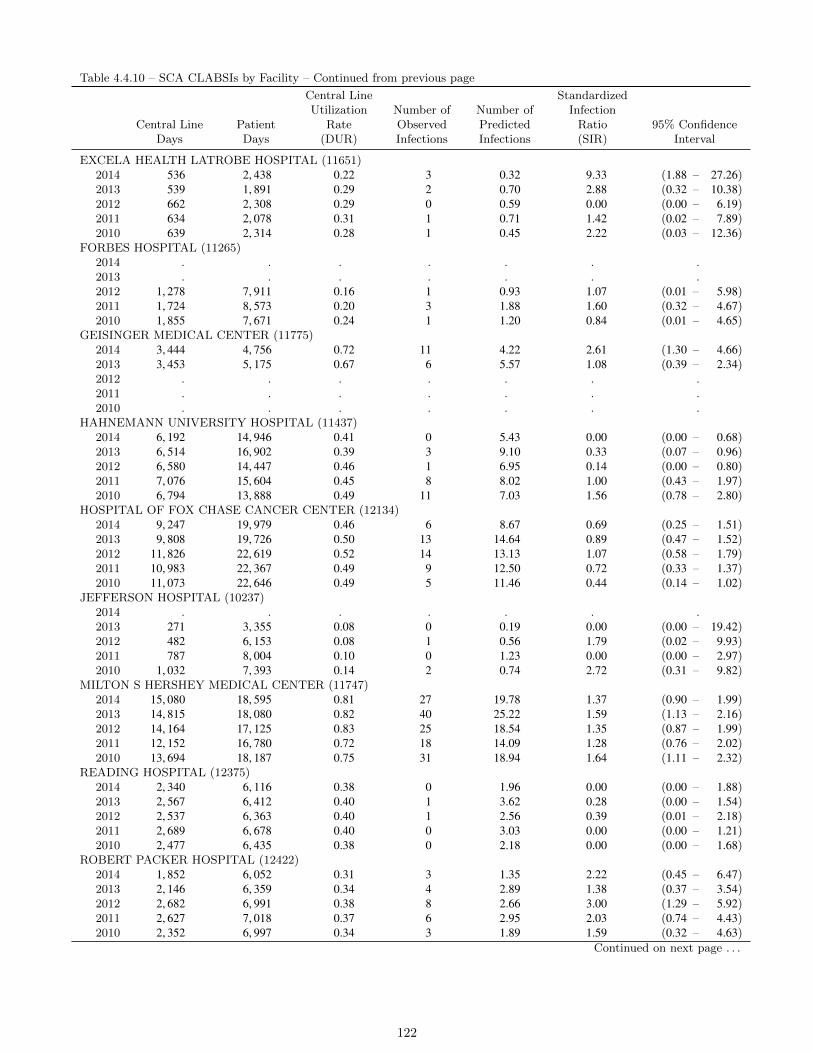
Table 4.4.10 – SCA CLABSIs by Facility – Continued from previous page
Central LineDays
PatientDays
Central LineUtilization
Rate(DUR)
Number ofObservedInfections
Number ofPredictedInfections
StandardizedInfection
Ratio(SIR)
95% ConfidenceInterval
EXCELA HEALTH LATROBE HOSPITAL (11651)2014 536 2, 438 0.22 3 0.32 9.33 (1.88 – 27.26)2013 539 1, 891 0.29 2 0.70 2.88 (0.32 – 10.38)2012 662 2, 308 0.29 0 0.59 0.00 (0.00 – 6.19)2011 634 2, 078 0.31 1 0.71 1.42 (0.02 – 7.89)2010 639 2, 314 0.28 1 0.45 2.22 (0.03 – 12.36)
FORBES HOSPITAL (11265)2014 . . . . . . .2013 . . . . . . .2012 1, 278 7, 911 0.16 1 0.93 1.07 (0.01 – 5.98)2011 1, 724 8, 573 0.20 3 1.88 1.60 (0.32 – 4.67)2010 1, 855 7, 671 0.24 1 1.20 0.84 (0.01 – 4.65)
GEISINGER MEDICAL CENTER (11775)2014 3, 444 4, 756 0.72 11 4.22 2.61 (1.30 – 4.66)2013 3, 453 5, 175 0.67 6 5.57 1.08 (0.39 – 2.34)2012 . . . . . . .2011 . . . . . . .2010 . . . . . . .
HAHNEMANN UNIVERSITY HOSPITAL (11437)2014 6, 192 14, 946 0.41 0 5.43 0.00 (0.00 – 0.68)2013 6, 514 16, 902 0.39 3 9.10 0.33 (0.07 – 0.96)2012 6, 580 14, 447 0.46 1 6.95 0.14 (0.00 – 0.80)2011 7, 076 15, 604 0.45 8 8.02 1.00 (0.43 – 1.97)2010 6, 794 13, 888 0.49 11 7.03 1.56 (0.78 – 2.80)
HOSPITAL OF FOX CHASE CANCER CENTER (12134)2014 9, 247 19, 979 0.46 6 8.67 0.69 (0.25 – 1.51)2013 9, 808 19, 726 0.50 13 14.64 0.89 (0.47 – 1.52)2012 11, 826 22, 619 0.52 14 13.13 1.07 (0.58 – 1.79)2011 10, 983 22, 367 0.49 9 12.50 0.72 (0.33 – 1.37)2010 11, 073 22, 646 0.49 5 11.46 0.44 (0.14 – 1.02)
JEFFERSON HOSPITAL (10237)2014 . . . . . . .2013 271 3, 355 0.08 0 0.19 0.00 (0.00 – 19.42)2012 482 6, 153 0.08 1 0.56 1.79 (0.02 – 9.93)2011 787 8, 004 0.10 0 1.23 0.00 (0.00 – 2.97)2010 1, 032 7, 393 0.14 2 0.74 2.72 (0.31 – 9.82)
MILTON S HERSHEY MEDICAL CENTER (11747)2014 15, 080 18, 595 0.81 27 19.78 1.37 (0.90 – 1.99)2013 14, 815 18, 080 0.82 40 25.22 1.59 (1.13 – 2.16)2012 14, 164 17, 125 0.83 25 18.54 1.35 (0.87 – 1.99)2011 12, 152 16, 780 0.72 18 14.09 1.28 (0.76 – 2.02)2010 13, 694 18, 187 0.75 31 18.94 1.64 (1.11 – 2.32)
READING HOSPITAL (12375)2014 2, 340 6, 116 0.38 0 1.96 0.00 (0.00 – 1.88)2013 2, 567 6, 412 0.40 1 3.62 0.28 (0.00 – 1.54)2012 2, 537 6, 363 0.40 1 2.56 0.39 (0.01 – 2.18)2011 2, 689 6, 678 0.40 0 3.03 0.00 (0.00 – 1.21)2010 2, 477 6, 435 0.38 0 2.18 0.00 (0.00 – 1.68)
ROBERT PACKER HOSPITAL (12422)2014 1, 852 6, 052 0.31 3 1.35 2.22 (0.45 – 6.47)2013 2, 146 6, 359 0.34 4 2.89 1.38 (0.37 – 3.54)2012 2, 682 6, 991 0.38 8 2.66 3.00 (1.29 – 5.92)2011 2, 627 7, 018 0.37 6 2.95 2.03 (0.74 – 4.43)2010 2, 352 6, 997 0.34 3 1.89 1.59 (0.32 – 4.63)
Continued on next page . . .
122

Table 4.4.10 – SCA CLABSIs by Facility – Continued from previous page
Central LineDays
PatientDays
Central LineUtilization
Rate(DUR)
Number ofObservedInfections
Number ofPredictedInfections
StandardizedInfection
Ratio(SIR)
95% ConfidenceInterval
ST. CHRISTOPHERS HOSPITAL FOR CHILDREN (12290)2014 1, 917 2, 007 0.96 1 2.77 0.36 (0.00 – 2.01)2013 1, 783 1, 929 0.92 1 3.13 0.32 (0.00 – 1.78)2012 1, 625 1, 827 0.89 1 2.18 0.46 (0.01 – 2.55)2011 1, 755 1, 993 0.88 0 2.05 0.00 (0.00 – 1.79)2010 2, 019 2, 140 0.94 2 3.25 0.62 (0.07 – 2.22)
ST. LUKES HOSPITAL BETHLEHEM (11718)2014 2, 183 11, 311 0.19 1 1.21 0.83 (0.01 – 4.59)2013 819 4, 355 0.19 0 0.95 0.00 (0.00 – 3.87)2012 . . . . . . .2011 . . . . . . .2010 . . . . . . .
ST. LUKES HOSPITAL- ANDERSON CAMPUS (21487)2014 677 5, 887 0.11 0 0.28 0.00 (0.00 – 13.32)2013 223 1, 265 0.18 0 0.25 0.00 (0.00 – 14.47)2012 . . . . . . .2011 . . . . . . .2010 . . . . . . .
TEMPLE UNIVERSITY HOSPITAL (12382)2014 3, 607 3, 724 0.97 1 5.26 0.19 (0.00 – 1.06)2013 3, 577 3, 894 0.92 2 6.28 0.32 (0.04 – 1.15)2012 3, 267 3, 316 0.99 0 4.55 0.00 (0.00 – 0.81)2011 3, 451 3, 700 0.93 3 4.05 0.74 (0.15 – 2.16)2010 3, 486 3, 845 0.91 1 5.46 0.18 (0.00 – 1.02)
THOMAS JEFFERSON UNIVERSITY HOSPITAL (11506)2014 7, 899 12, 548 0.63 18 8.90 2.02 (1.20 – 3.20)2013 9, 712 13, 563 0.72 17 15.96 1.07 (0.62 – 1.71)2012 10, 241 14, 001 0.73 11 12.83 0.86 (0.43 – 1.53)2011 10, 068 13, 671 0.74 4 11.68 0.34 (0.09 – 0.88)2010 10, 052 13, 876 0.72 5 13.55 0.37 (0.12 – 0.86)
UPMC NORTHWEST (11837)2014 971 5, 160 0.19 0 0.05 0.00 (0.00 – 73.21)2013 970 5, 115 0.19 0 0.85 0.00 (0.00 – 4.34)2012 1, 146 5, 832 0.20 1 1.85 0.54 (0.01 – 3.00)2011 1, 221 6, 200 0.20 1 1.98 0.51 (0.01 – 2.81)2010 1, 142 6, 445 0.18 0 0.96 0.00 (0.00 – 3.84)
UPMC PRESBYTERIAN SHADYSIDE - SHADYSIDE (10118)2014 23, 174 27, 859 0.83 8 30.86 0.26 (0.11 – 0.51)2013 23, 262 27, 758 0.84 11 39.84 0.28 (0.14 – 0.49)2012 20, 250 25, 839 0.78 12 26.00 0.46 (0.24 – 0.81)2011 18, 405 27, 356 0.67 12 21.26 0.56 (0.29 – 0.99)2010 16, 158 25, 948 0.62 9 19.67 0.46 (0.21 – 0.87)
WEST PENN HOSPITAL (11864)2014 4, 066 4, 954 0.82 0 5.37 0.00 (0.00 – 0.68)2013 4, 597 4, 979 0.92 2 8.08 0.25 (0.03 – 0.89)2012 4, 789 5, 422 0.88 3 6.42 0.47 (0.09 – 1.37)2011 4, 927 5, 880 0.84 4 5.75 0.70 (0.19 – 1.78)2010 5, 709 6, 390 0.89 0 8.86 0.00 (0.00 – 0.41)
WILKES-BARRE GENERAL HOSPITAL (11916)2014 1, 796 9, 586 0.19 0 0.98 0.00 (0.00 – 3.75)2013 1, 841 9, 565 0.19 3 2.14 1.40 (0.28 – 4.09)2012 2, 181 10, 932 0.20 1 1.71 0.58 (0.01 – 3.25)2011 1, 994 10, 343 0.19 7 2.17 3.23 (1.29 – 6.65)2010 1, 966 10, 097 0.19 2 1.75 1.14 (0.13 – 4.12)
123

Table 4.4.11: Long Term Acute Care (LTACs): Central Line-Associated Bloodstream Infections, Central Line UtilizationRates and Standardized Infection Ratios by Facility in Alphabetical Order — Pennsylvania, 2010–2014
Central LineDays
PatientDays
Central LineUtilization
Rate(DUR)
Number ofObservedInfections
Number ofPredictedInfections
StandardizedInfection
Ratio(SIR)
95% ConfidenceInterval
CHILDRENS HOME OF PITTSBURGH, THE (12336)2014 . . . . . . .2013 . . . . . . .2012 . . . . . . .2011 1, 236 4, 665 0.26 5 3.21 1.56 (0.50 – 3.64)2010 823 3, 409 0.24 0 1.80 0.00 (0.00 – 2.04)
GOOD SHEPHERD PENN PARTNERS AT RITTENHOUSE (13929)2014 3, 870 9, 423 0.41 7 3.15 2.22 (0.89 – 4.58)2013 4, 351 10, 506 0.41 10 5.58 1.79 (0.86 – 3.30)2012 4, 218 9, 813 0.43 19 5.34 3.56 (2.14 – 5.56)2011 3, 193 8, 537 0.37 14 6.20 2.26 (1.23 – 3.79)2010 3, 459 8, 874 0.39 7 6.02 1.16 (0.47 – 2.40)
GOOD SHEPHERD SPECIALTY HOSPITAL (11887)2014 7, 521 10, 650 0.71 13 7.03 1.85 (0.98 – 3.16)2013 6, 102 9, 365 0.65 7 6.97 1.00 (0.40 – 2.07)2012 7, 337 9, 982 0.74 8 7.40 1.08 (0.47 – 2.13)2011 7, 975 10, 551 0.76 9 8.58 1.05 (0.48 – 1.99)2010 8, 998 10, 503 0.86 15 10.72 1.40 (0.78 – 2.31)
KINDRED HOSPITAL - PHILADELPHIA (11832)2014 4, 818 11, 947 0.40 7 3.91 1.79 (0.72 – 3.69)2013 4, 468 11, 096 0.40 11 5.77 1.91 (0.95 – 3.41)2012 4, 884 11, 725 0.42 10 6.26 1.60 (0.76 – 2.94)2011 7, 034 13, 457 0.52 21 10.31 2.04 (1.26 – 3.11)2010 8, 836 14, 138 0.62 34 12.25 2.78 (1.92 – 3.88)
KINDRED HOSPITAL - PITTSBURGH (12358)2014 5, 891 10, 161 0.58 9 5.24 1.72 (0.78 – 3.26)2013 6, 678 10, 270 0.65 12 7.64 1.57 (0.81 – 2.74)2012 7, 237 10, 309 0.70 10 7.44 1.34 (0.64 – 2.47)2011 8, 010 10, 214 0.78 10 8.35 1.20 (0.57 – 2.20)2010 9, 820 12, 513 0.78 2 12.21 0.16 (0.02 – 0.59)
KINDRED HOSPITAL AT HERITAGE VALLEY (12268)2014 5, 167 7, 953 0.65 3 4.73 0.63 (0.13 – 1.85)2013 6, 262 8, 223 0.76 7 6.88 1.02 (0.41 – 2.10)2012 5, 970 8, 898 0.67 1 6.26 0.16 (0.00 – 0.89)2011 7, 547 8, 765 0.86 5 7.28 0.69 (0.22 – 1.60)2010 8, 076 8, 815 0.92 6 9.32 0.64 (0.24 – 1.40)
KINDRED HOSPITAL PHILADELPHIA-HAVERTOWN (12908)2014 5, 859 13, 913 0.42 4 4.80 0.83 (0.22 – 2.13)2013 6, 930 14, 732 0.47 7 8.60 0.81 (0.33 – 1.68)2012 5, 334 15, 040 0.35 5 7.32 0.68 (0.22 – 1.59)2011 5, 694 12, 225 0.47 7 9.20 0.76 (0.30 – 1.57)2010 7, 386 12, 095 0.61 18 10.36 1.74 (1.03 – 2.75)
KINDRED HOSPITAL SOUTH PHILADELPHIA (11940)2014 5, 000 12, 158 0.41 0 4.07 0.00 (0.00 – 0.90)2013 4, 540 10, 174 0.45 2 5.71 0.35 (0.04 – 1.26)2012 3, 492 9, 100 0.38 8 4.64 1.73 (0.74 – 3.40)2011 3, 043 6, 625 0.46 19 4.97 3.82 (2.30 – 5.97)2010 2, 850 7, 458 0.38 17 5.01 3.40 (1.98 – 5.44)
Continued on next page . . .
124

Table 4.4.11 – LTAC CLABSIs by Facility – Continued from previous page
Central LineDays
PatientDays
Central LineUtilization
Rate(DUR)
Number ofObservedInfections
Number ofPredictedInfections
StandardizedInfection
Ratio(SIR)
95% ConfidenceInterval
LIFECARE HOSPITALS OF CHESTER COUNTY LLC (12005)2014 6, 897 8, 574 0.80 1 6.66 0.15 (0.00 – 0.84)2013 6, 762 7, 951 0.85 10 7.23 1.38 (0.66 – 2.54)2012 5, 898 7, 658 0.77 5 5.83 0.86 (0.28 – 2.00)2011 7, 121 8, 890 0.80 12 7.29 1.64 (0.85 – 2.87)2010 6, 683 8, 384 0.80 5 8.24 0.61 (0.20 – 1.42)
LIFECARE HOSPITALS OF MECHANICSBURG (12388)2014 4, 723 6, 820 0.69 0 4.39 0.00 (0.00 – 0.84)2013 6, 288 8, 943 0.70 7 7.05 0.99 (0.40 – 2.05)2012 7, 262 9, 277 0.78 4 7.13 0.56 (0.15 – 1.44)2011 8, 246 11, 607 0.71 5 9.34 0.54 (0.17 – 1.25)2010 9, 976 14, 747 0.68 9 13.32 0.68 (0.31 – 1.28)
LIFECARE HOSPITALS OF PITTSBURGH - ALLE-KISKI CAMPUS (18955)2014 5, 122 6, 352 0.81 5 4.95 1.01 (0.33 – 2.36)2013 4, 604 6, 744 0.68 3 5.20 0.58 (0.12 – 1.69)2012 4, 802 6, 811 0.71 1 4.93 0.20 (0.00 – 1.13)2011 5, 179 7, 254 0.71 1 5.84 0.17 (0.00 – 0.95)2010 . . . . . . .
LIFECARE HOSPITALS OF PITTSBURGH - MONROEVILLE (12254)2014 6, 843 11, 374 0.60 5 6.14 0.81 (0.26 – 1.90)2013 7, 832 13, 998 0.56 7 9.30 0.75 (0.30 – 1.55)2012 6, 776 12, 994 0.52 6 7.90 0.76 (0.28 – 1.65)2011 8, 014 14, 075 0.57 10 10.94 0.91 (0.44 – 1.68)2010 9, 666 15, 345 0.63 9 13.35 0.67 (0.31 – 1.28)
LIFECARE HOSPITALS OF PITTSBURGH - SUBURBAN CAMPUS (12385)2014 5, 368 7, 673 0.70 11 5.00 2.20 (1.10 – 3.93)2013 4, 739 7, 167 0.66 0 5.40 0.00 (0.00 – 0.68)2012 5, 113 8, 068 0.63 7 5.49 1.28 (0.51 – 2.63)2011 5, 202 7, 155 0.73 8 5.78 1.38 (0.60 – 2.73)2010 4, 003 6, 461 0.62 4 5.57 0.72 (0.19 – 1.84)
LIFECARE HOSPITALS OF PITTSBURGH (11945)2014 5, 740 16, 146 0.36 3 4.51 0.67 (0.13 – 1.95)2013 5, 491 24, 376 0.23 10 8.20 1.22 (0.58 – 2.24)2012 6, 214 25, 487 0.24 6 10.00 0.60 (0.22 – 1.31)2011 8, 672 27, 933 0.31 18 19.69 0.91 (0.54 – 1.44)2010 12, 646 33, 719 0.38 21 22.41 0.94 (0.58 – 1.43)
POST ACUTE MEDICAL SPECIALTY HOSPITAL OF WILKES-BARRE (12604)2014 4, 058 8, 262 0.49 4 3.46 1.16 (0.31 – 2.96)2013 4, 215 10, 266 0.41 4 5.41 0.74 (0.20 – 1.89)2012 5, 610 13, 572 0.41 5 7.22 0.69 (0.22 – 1.62)2011 3, 832 14, 958 0.26 1 10.23 0.10 (0.00 – 0.54)2010 3, 658 16, 248 0.23 2 8.28 0.24 (0.03 – 0.87)
SELECT SPECIALTY HOSPITAL - ERIE (11880)2014 3, 716 8, 648 0.43 2 3.06 0.65 (0.07 – 2.36)2013 2, 822 7, 822 0.36 4 3.74 1.07 (0.29 – 2.74)2012 3, 779 9, 699 0.39 4 4.98 0.80 (0.22 – 2.05)2011 4, 618 10, 883 0.42 5 8.07 0.62 (0.20 – 1.45)2010 4, 985 10, 950 0.46 6 8.05 0.75 (0.27 – 1.62)
SELECT SPECIALTY HOSPITAL - CENTRAL PA (13921)2014 6, 187 10, 284 0.60 5 5.55 0.90 (0.29 – 2.10)2013 7, 559 10, 803 0.70 8 8.49 0.94 (0.41 – 1.86)2012 7, 230 9, 672 0.75 4 7.24 0.55 (0.15 – 1.42)2011 7, 091 9, 728 0.73 6 7.86 0.76 (0.28 – 1.66)2010 5, 795 7, 323 0.79 5 7.17 0.70 (0.22 – 1.63)
Continued on next page . . .
125
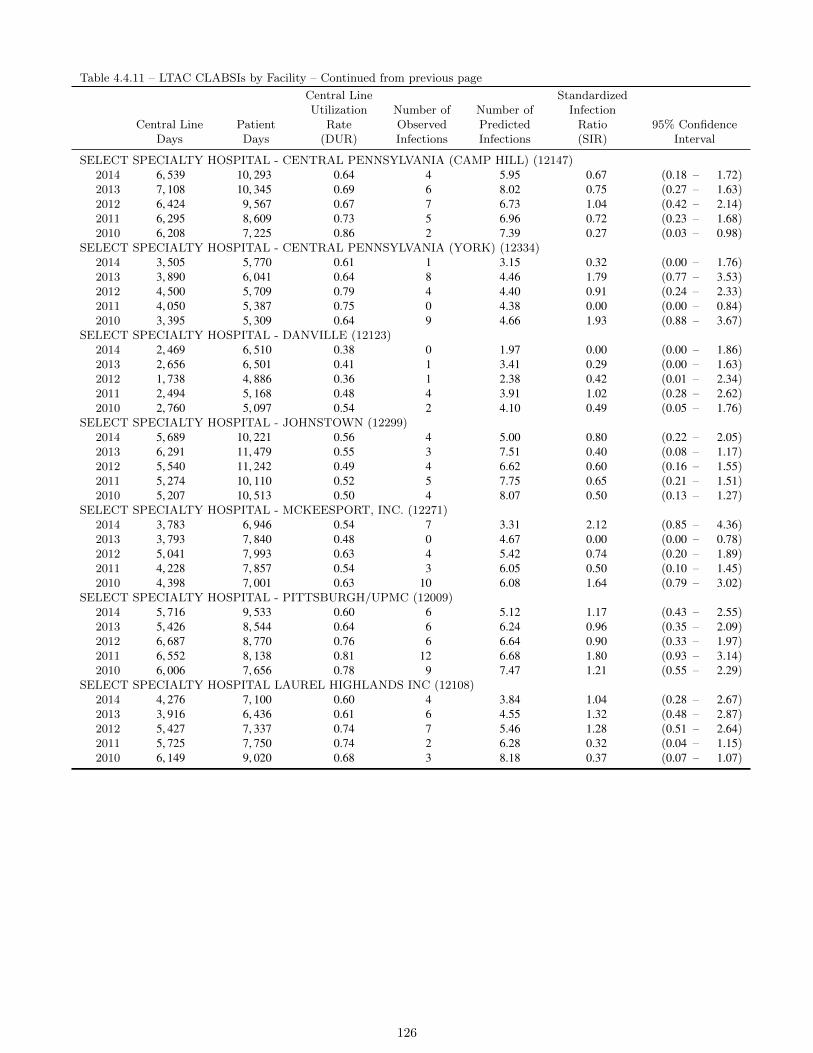
Table 4.4.11 – LTAC CLABSIs by Facility – Continued from previous page
Central LineDays
PatientDays
Central LineUtilization
Rate(DUR)
Number ofObservedInfections
Number ofPredictedInfections
StandardizedInfection
Ratio(SIR)
95% ConfidenceInterval
SELECT SPECIALTY HOSPITAL - CENTRAL PENNSYLVANIA (CAMP HILL) (12147)2014 6, 539 10, 293 0.64 4 5.95 0.67 (0.18 – 1.72)2013 7, 108 10, 345 0.69 6 8.02 0.75 (0.27 – 1.63)2012 6, 424 9, 567 0.67 7 6.73 1.04 (0.42 – 2.14)2011 6, 295 8, 609 0.73 5 6.96 0.72 (0.23 – 1.68)2010 6, 208 7, 225 0.86 2 7.39 0.27 (0.03 – 0.98)
SELECT SPECIALTY HOSPITAL - CENTRAL PENNSYLVANIA (YORK) (12334)2014 3, 505 5, 770 0.61 1 3.15 0.32 (0.00 – 1.76)2013 3, 890 6, 041 0.64 8 4.46 1.79 (0.77 – 3.53)2012 4, 500 5, 709 0.79 4 4.40 0.91 (0.24 – 2.33)2011 4, 050 5, 387 0.75 0 4.38 0.00 (0.00 – 0.84)2010 3, 395 5, 309 0.64 9 4.66 1.93 (0.88 – 3.67)
SELECT SPECIALTY HOSPITAL - DANVILLE (12123)2014 2, 469 6, 510 0.38 0 1.97 0.00 (0.00 – 1.86)2013 2, 656 6, 501 0.41 1 3.41 0.29 (0.00 – 1.63)2012 1, 738 4, 886 0.36 1 2.38 0.42 (0.01 – 2.34)2011 2, 494 5, 168 0.48 4 3.91 1.02 (0.28 – 2.62)2010 2, 760 5, 097 0.54 2 4.10 0.49 (0.05 – 1.76)
SELECT SPECIALTY HOSPITAL - JOHNSTOWN (12299)2014 5, 689 10, 221 0.56 4 5.00 0.80 (0.22 – 2.05)2013 6, 291 11, 479 0.55 3 7.51 0.40 (0.08 – 1.17)2012 5, 540 11, 242 0.49 4 6.62 0.60 (0.16 – 1.55)2011 5, 274 10, 110 0.52 5 7.75 0.65 (0.21 – 1.51)2010 5, 207 10, 513 0.50 4 8.07 0.50 (0.13 – 1.27)
SELECT SPECIALTY HOSPITAL - MCKEESPORT, INC. (12271)2014 3, 783 6, 946 0.54 7 3.31 2.12 (0.85 – 4.36)2013 3, 793 7, 840 0.48 0 4.67 0.00 (0.00 – 0.78)2012 5, 041 7, 993 0.63 4 5.42 0.74 (0.20 – 1.89)2011 4, 228 7, 857 0.54 3 6.05 0.50 (0.10 – 1.45)2010 4, 398 7, 001 0.63 10 6.08 1.64 (0.79 – 3.02)
SELECT SPECIALTY HOSPITAL - PITTSBURGH/UPMC (12009)2014 5, 716 9, 533 0.60 6 5.12 1.17 (0.43 – 2.55)2013 5, 426 8, 544 0.64 6 6.24 0.96 (0.35 – 2.09)2012 6, 687 8, 770 0.76 6 6.64 0.90 (0.33 – 1.97)2011 6, 552 8, 138 0.81 12 6.68 1.80 (0.93 – 3.14)2010 6, 006 7, 656 0.78 9 7.47 1.21 (0.55 – 2.29)
SELECT SPECIALTY HOSPITAL LAUREL HIGHLANDS INC (12108)2014 4, 276 7, 100 0.60 4 3.84 1.04 (0.28 – 2.67)2013 3, 916 6, 436 0.61 6 4.55 1.32 (0.48 – 2.87)2012 5, 427 7, 337 0.74 7 5.46 1.28 (0.51 – 2.64)2011 5, 725 7, 750 0.74 2 6.28 0.32 (0.04 – 1.15)2010 6, 149 9, 020 0.68 3 8.18 0.37 (0.07 – 1.07)
126

Figure 4.4.3: Critical Care Units and Wards: Number of Observed (Obs.) Central Line-Associated BloodstreamInfections (CLABSI) and Relative Ranking of Facilities by Standardized Infection Ratio (SIR) — Penn-sylvania, 2014
Grouped by Number of Predicted (Pred.) Infections: 0–0.29
0 1 5 10 15
SIR and 95% CI
Obs.
0
Pred.
0
SIR
0
Facility and NHSN ID
0
0
0
0
0
0
0
0
0
0
0
0
0
0
0
0
0
0
1
0
0
0
0
0
0
0
0
0
0
0
0
0
0
0
0.00
0.00
0.01
0.01
0.01
0.02
0.04
0.06
0.06
0.07
0.07
0.08
0.09
0.09
0.10
0.10
0.10
0.10
0.11
0.12
0.12
0.12
0.15
0.18
0.18
0.19
0.19
0.19
0.21
0.22
0.22
0.22
0.23
0.23
0.26
0.27
0.29
0.0
0.0
0.0
0.0
0.0
0.0
0.0
0.0
0.0
0.0
0.0
0.0
0.0
0.0
0.0
0.0
0.0
0.0
0.0
0.0
0.0
8.2
0.0
0.0
0.0
0.0
0.0
0.0
0.0
0.0
0.0
0.0
0.0
0.0
0.0
0.0
0.0
BARIX CLINICS OF PENNSYLVANIA (12037)
BARNES−KASSON COUNTY HOSPITAL (12404)
OSS ORTHOPAEDIC HOSPITAL (18467)
CORRY MEMORIAL HOSPITAL (12283)
EAGLEVILLE HOSPITAL (12965)
TYRONE HOSPITAL (12717)
COORDINATED HEALTH ORTHOPEDIC HOSPITAL LLC (11872)
ENDLESS MOUNTAINS HEALTH SYSTEMS (11817)
CONEMAUGH MINERS MEDICAL CENTER (12295)
SURGICAL SPECIALTY CENTER AT COORDINATED HEALTH, THE (15259)
GEISINGER−BLOOMSBURG HOSPITAL (12008)
TYLER MEMORIAL HOSPITAL (11829)
CONEMAUGH MEYERSDALE MEDICAL CENTER (11968)
KANE COMMUNITY HOSPITAL (12111)
WINDBER HOSPITAL (12031)
JERSEY SHORE HOSPITAL (11689)
NASON HOSPITAL (11907)
CROZER CHESTER MEDICAL CENTER − SPRINGFIELD (11851)
BUCKTAIL MEDICAL CENTER (12461)
SUNBURY COMMUNITY HOSP (12105)
GUTHRIE TOWANDA MEMORIAL HOSPITAL (12549)
LOCK HAVEN HOSPITAL (12097)
HIGHLANDS HOSPITAL (11902)
PENN HIGHLANDS BROOKVILLE (12418)
BERWICK HOSPITAL CENTER (11442)
PALMERTON HOSPITAL (12396)
VALLEY FORGE MEDICAL CENTER AND HOSPITAL (12029)
FULTON COUNTY MEDICAL CENTER (11939)
ST. LUKES MINERS MEMORIAL HOSPITAL (11784)
PENN HIGHLANDS ELK (11859)
BRADFORD REGIONAL MEDICAL CENTER (12361)
PUNXSUTAWNEY AREA HOSPITAL (11830)
SOUTHWEST REGIONAL MEDICAL CENTER (11942)
UPMC BEDFORD (11680)
CHILDRENS INSTITUTE OF PITTSBURGH, THE (12266)
JOHN HEINZ INSTITUTE OF REHABILITATION (11861)
PENN HIGHLANDS CLEARFIELD (11843)
Better than predicted Not different than predicted Worse than predicted
127

Figure 4.4.4: Critical Care Units and Wards: Number of Observed (Obs.) Central Line-Associated BloodstreamInfections (CLABSI) and Relative Ranking of Facilities by Standardized Infection Ratio (SIR) — Penn-sylvania, 2014
Grouped by Number of Predicted (Pred.) Infections: 0.5–0.99
0 1 5 10 15
SIR and 95% CI
Obs.1
Pred.
0
SIR
0
Facility and NHSN ID
0101000010000011201010111001101010000
0.300.320.320.330.330.330.350.350.400.400.400.460.460.460.470.480.480.490.500.550.550.560.610.640.650.660.710.720.720.760.800.800.830.860.860.900.960.970.970.99
3.30.00.00.03.00.02.90.00.00.00.02.20.00.00.00.00.02.12.03.70.01.80.01.60.01.51.41.40.00.01.31.30.01.20.01.10.00.00.00.0
CHILDRENS HOME OF PITTSBURGH, THE (12336)WAYNESBORO HOSPITAL (11642)MUNCY VALLEY HOSPITAL (11748)
J C BLAIR MEMORIAL HOSPITAL (11724)GEISINGER HEALTHSOUTH REHABILITATION HOSPITAL (11993)
ALLIED SERVICES INSTITUTE OF REHABILITATION (12591)SOLDIERS AND SAILORS MEMORIAL HOSPITAL (11688)
GROVE CITY MEDICAL CENTER (11722)CHARLES COLE MEMORIAL HOSPITAL (11956)ST. LUKES QUAKERTOWN HOSPITAL (11711)CRICHTON REHABILITATION CENTER (12273)
HEALTHSOUTH READING REHABILITATION HOSPITAL (12139)HEALTHSOUTH REHABILITATION HOSPITAL OF ERIE (11810)
SHRINERS HOSPITALS FOR CHILDREN − PHILA (12244)LANCASTER REHABILITATION HOSPITAL (12628)
WARREN GENERAL HOSPITAL (12216)JENNERSVILLE REGIONAL HOSPITAL (12337)
HEALTHSOUTH NITTANY VALLEY REHABILITATION HOSPITAL (11667)ELLWOOD CITY HOSPITAL (11779)
GNADEN HUETTEN MEMORIAL HOSPITAL (12241)HEALTHSOUTH REHABILITATION HOSPITAL OF SEWICKLEY (12066)
HEART OF LANCASTER REGIONAL MEDICAL CENTER (12571)EVANGELICAL COMMUNITY HOSPITAL (11701)
WAYNE MEMORIAL HOSPITAL (12004)WELLSPAN SURGERY AND REHABILITATION HOSPITAL (27430)
GOOD SHEPHERD REHABILITATION HOSPITAL, THE (11896)HOSPITAL OF FOX CHASE CANCER CENTER (12134)
MILLCREEK COMMUNITY HOSPITAL (12253)EASTERN REGIONAL MEDICAL CENTER (12348)
MAIN LINE HOSPITAL BRYN MAWR REHABILITATION (11417)EINSTEIN AT ELKINS PARK (12500)KENSINGTON HOSPITAL (12609)
CANONSBURG HOSPITAL (11586)GETTYSBURG HOSPITAL (11531)
HEALTHSOUTH REHABILITATION HOSPITAL OF MECHANICSBURG (12402)WESTERN PSYCHIATRIC INSTITUTE AND CLINIC (13702)
CLARION HOSPITAL (11654)MAGEE REHABILITATION HOSPITAL (12146)
HEALTHSOUTH REHABILITATION HOSPITAL OF ALTOONA (11903)EXCELA HEALTH FRICK HOSPITAL (11639)
Better than predicted Not different than predicted Worse than predicted
128

Figure 4.4.5: Critical Care Units and Wards: Number of Observed (Obs.) Central Line-Associated BloodstreamInfections (CLABSI) and Relative Ranking of Facilities by Standardized Infection Ratio (SIR) — Penn-sylvania, 2014
Grouped by Number of Predicted (Pred.) Infections: 1–2.99
0 1 5 10 15
SIR and 95% CI
Obs. 1
Pred.
0
SIR
2
Facility and NHSN ID
2
3
2
0
0
0
1
2
0
4
2
1
4
0
0
2
3
1
3
1
0
4
6
0
0
1
2
2
9
4
0
4
2
2
4
1
0
1
11
3
1
4
1.01
1.02
1.04
1.04
1.05
1.05
1.08
1.11
1.13
1.14
1.16
1.18
1.22
1.22
1.32
1.34
1.40
1.45
1.65
1.69
1.72
1.79
1.86
1.90
1.94
2.10
2.10
2.12
2.12
2.15
2.15
2.16
2.17
2.33
2.33
2.46
2.48
2.48
2.50
2.57
2.70
2.77
2.78
2.90
2.92
1.0
0.0
1.9
1.9
2.9
1.9
0.0
0.0
0.0
0.9
1.7
0.0
3.3
1.6
0.8
3.0
0.0
0.0
1.2
1.8
0.6
1.7
0.5
0.0
2.1
2.9
0.0
0.0
0.5
0.9
0.9
4.2
1.8
0.0
1.7
0.8
0.8
1.6
0.4
0.0
0.4
4.0
1.1
0.3
1.4
HEALTHSOUTH REHABILITATION HOSPITAL OF YORK (12058)
PENN STATE HERSHEY REHABILITATION LLC (11915)
LOWER BUCKS HOSPITAL (12390)
LANSDALE HOSPITAL (12032)
MEMORIAL HOSPITAL (11633)
SCHUYLKILL MEDICAL CENTER − SOUTH JACKSON STREET (12087)
TROY COMMUNITY HOSPITAL (12018)
ST. LUKES HOSPITAL− ANDERSON CAMPUS (21487)
HANOVER HOSPITAL (11899)
ROXBOROUGH MEMORIAL HOSPITAL (11978)
SCHUYLKILL MEDICAL CENTER − EAST NORWEGIAN STREET (11922)
CARLISLE REGIONAL MEDICAL CENTER (11997)
SACRED HEART HOSPITAL (11684)
MOSS REHABILITATION (12508)
OHIO VALLEY GENERAL HOSPITAL (12298)
HEALTHSOUTH HARMARVILLE REHABILITATION HOSPITAL (11727)
INDIANA REGIONAL MEDICAL CENTER (11759)
EPHRATA COMMUNITY HOSPITAL (11764)
LANCASTER REGIONAL MEDICAL CENTER (12335)
BRANDYWINE HOSPITAL (11979)
UPMC NORTHWEST (11837)
MEADVILLE MEDICAL CENTER (11583)
EXCELA HEALTH LATROBE HOSPITAL (11651)
SOMERSET HOSPITAL (12282)
ALLEGHENY VALLEY HOSPITAL (11842)
CROZER CHESTER MEDICAL CENTER (11932)
PENN HIGHLANDS DUBOIS (11606)
SHARON REGIONAL HEALTH SYSTEM (12250)
GEISINGER−LEWISTOWN HOSPITAL (11825)
JAMESON MEMORIAL HOSPITAL (11954)
HERITAGE VALLEY SEWICKLEY (10375)
ST. JOSEPHS HOSPITAL (12438)
LEHIGH VALLEY HOSPITAL − HAZLETON (11878)
ARMSTRONG COUNTY MEMORIAL HOSPITAL (12057)
POCONO MEDICAL CENTER (11772)
MERCY PHILADELPHIA HOSPITAL (11946)
MOSES TAYLOR HOSPITAL (11528)
POTTSTOWN MEMORIAL MEDICAL CENTER (11983)
CHESTNUT HILL HOSPITAL (12304)
GOOD SAMARITAN HOSPITAL, THE (11712)
MERCY SUBURBAN HOSPITAL (11952)
NAZARETH HOSPITAL (11919)
UPMC HORIZON (11675)
UNIONTOWN HOSPITAL (10441)
MONONGAHELA VALLEY HOSPITAL (11069)
Better than predicted Not different than predicted Worse than predicted
129

Figure 4.4.6: Critical Care Units and Wards: Number of Observed (Obs.) Central Line-Associated BloodstreamInfections (CLABSI) and Relative Ranking of Facilities by Standardized Infection Ratio (SIR) — Penn-sylvania, 2014
Grouped by Number of Predicted (Pred.) Infections: 3–7.49
0 1 5 10 15
SIR and 95% CI
Obs. 1
Pred.
4
SIR
0
Facility and NHSN ID
2
3
4
5
6
9
5
2
5
0
0
5
5
5
2
1
5
0
1
7
0
1
3
6
4
4
0
2
2
8
5
10
6
7
9
7
5
7
8
3.03
3.08
3.15
3.24
3.29
3.38
3.41
3.57
3.62
3.63
3.65
3.87
3.92
3.97
4.02
4.14
4.37
4.41
4.44
4.50
4.53
4.67
4.71
4.88
4.88
4.88
5.09
5.32
5.54
5.71
5.77
5.84
5.97
6.22
6.63
6.75
6.77
6.93
7.15
7.28
7.30
7.32
0.3
1.3
0.0
0.6
0.9
1.2
1.5
1.7
2.5
1.4
0.5
1.3
0.0
0.0
1.2
1.2
1.1
0.5
0.2
1.1
0.0
0.2
1.5
0.0
0.2
0.6
1.2
0.8
0.7
0.0
0.3
0.3
1.3
0.8
1.5
0.9
1.0
1.3
1.0
0.7
1.0
1.1
PHOENIXVILLE HOSPITAL COMPANY LLC (11836)
EINSTEIN MEDICAL CENTER MONTGOMERY (30210)
EASTON HOSPITAL (11929)
HOLY REDEEMER HOSPITAL (11973)
BUTLER MEMORIAL HOSPITAL (11736)
JEANES HOSPITAL (11459)
MAIN LINE HOSPITAL − PAOLI (11750)
RIDDLE MEMORIAL HOSPITAL (11731)
MERCY FITZGERALD HOSPITAL (11683)
CHAMBERSBURG HOSPITAL (11913)
REGIONAL HOSPITAL OF SCRANTON (12533)
DELAWARE COUNTY MEMORIAL HOSPITAL (11972)
GRAND VIEW HOSPITAL (11847)
ST. CHRISTOPHERS HOSPITAL FOR CHILDREN (12290)
THOMAS JEFFERSON UNIVERSITY HOSPITAL − METHODIST (12017)
UPMC EAST (28812)
HOLY SPIRIT HOSPITAL (12387)
UPMC MCKEESPORT (11707)
JEFFERSON HOSPITAL (10237)
CHESTER COUNTY HOSPITAL (12016)
MOUNT NITTANY MEDICAL CENTER (11797)
WASHINGTON HOSPITAL, THE (11460)
HERITAGE VALLEY BEAVER (11831)
DOYLESTOWN HOSPITAL (10190)
MAGEE WOMENS HOSPITAL OF UPMC HEALTH SYSTEM (10301)
ST. JOSEPH MEDICAL CTR (11961)
LEHIGH VALLEY HOSPITAL − MUHLENBERG (11898)
GEISINGER−COMMUNITY MEDICAL CENTER (11914)
ROBERT PACKER HOSPITAL (12422)
ST. CLAIR MEMORIAL HOSPITAL (10561)
WEST PENN HOSPITAL (11864)
PINNACLE HEALTH HOSPITALS − COMMUNITY GENERAL OSTEOPATHIC HOSPITAL (34069)
WILLIAMSPORT REGIONAL MEDICAL CENTER (11732)
SAINT VINCENT HOSPITAL (11699)
ST. MARY MEDICAL CENTER (11885)
MAIN LINE HOSPITAL BRYN MAWR (11753)
WILKES−BARRE GENERAL HOSPITAL (11916)
UPMC ALTOONA (10178)
CROZER CHESTER MEDICAL CENTER (11839)
GEISINGER WYOMING VALLEY MEDICAL CENTER (11780)
FORBES HOSPITAL (11265)
UPMC ST. MARGARET (11561)
Better than predicted Not different than predicted Worse than predicted
130
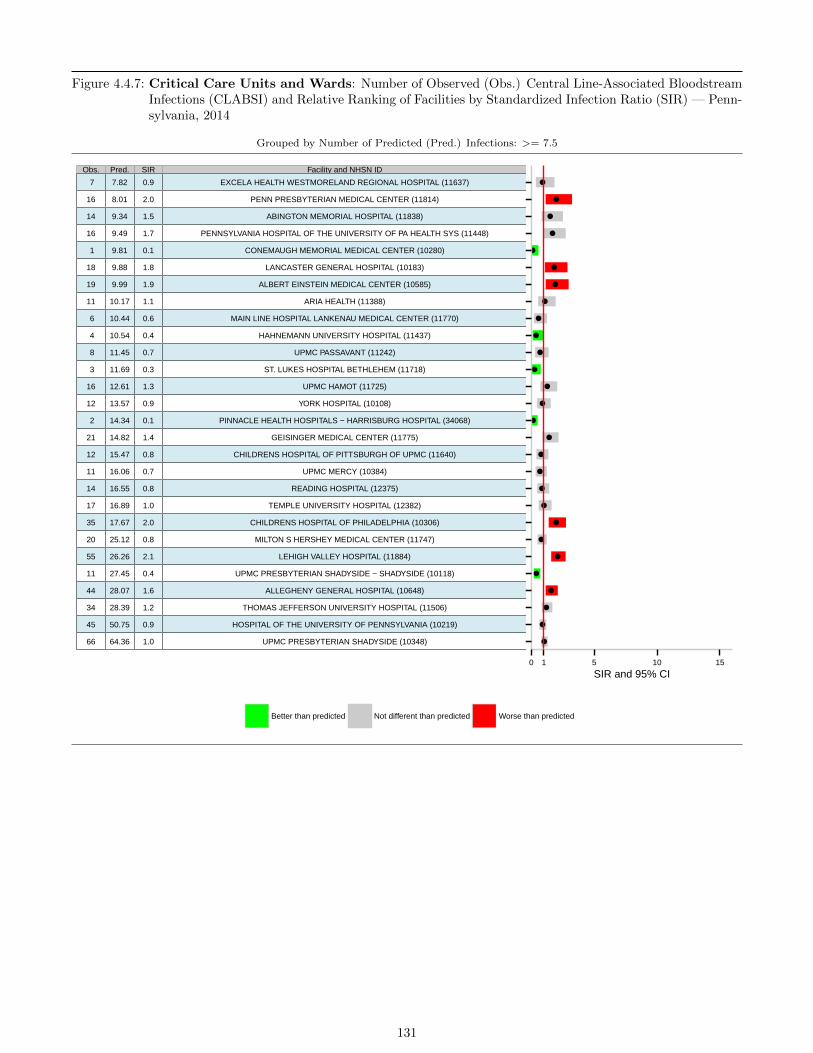
Figure 4.4.7: Critical Care Units and Wards: Number of Observed (Obs.) Central Line-Associated BloodstreamInfections (CLABSI) and Relative Ranking of Facilities by Standardized Infection Ratio (SIR) — Penn-sylvania, 2014
Grouped by Number of Predicted (Pred.) Infections: >= 7.5
0 1 5 10 15
SIR and 95% CI
Obs.
7
Pred.
16
SIR
14
Facility and NHSN ID
16
1
18
19
11
6
4
8
3
16
12
2
21
12
11
14
17
35
20
55
11
44
34
45
66
7.82
8.01
9.34
9.49
9.81
9.88
9.99
10.17
10.44
10.54
11.45
11.69
12.61
13.57
14.34
14.82
15.47
16.06
16.55
16.89
17.67
25.12
26.26
27.45
28.07
28.39
50.75
64.36
0.9
2.0
1.5
1.7
0.1
1.8
1.9
1.1
0.6
0.4
0.7
0.3
1.3
0.9
0.1
1.4
0.8
0.7
0.8
1.0
2.0
0.8
2.1
0.4
1.6
1.2
0.9
1.0
EXCELA HEALTH WESTMORELAND REGIONAL HOSPITAL (11637)
PENN PRESBYTERIAN MEDICAL CENTER (11814)
ABINGTON MEMORIAL HOSPITAL (11838)
PENNSYLVANIA HOSPITAL OF THE UNIVERSITY OF PA HEALTH SYS (11448)
CONEMAUGH MEMORIAL MEDICAL CENTER (10280)
LANCASTER GENERAL HOSPITAL (10183)
ALBERT EINSTEIN MEDICAL CENTER (10585)
ARIA HEALTH (11388)
MAIN LINE HOSPITAL LANKENAU MEDICAL CENTER (11770)
HAHNEMANN UNIVERSITY HOSPITAL (11437)
UPMC PASSAVANT (11242)
ST. LUKES HOSPITAL BETHLEHEM (11718)
UPMC HAMOT (11725)
YORK HOSPITAL (10108)
PINNACLE HEALTH HOSPITALS − HARRISBURG HOSPITAL (34068)
GEISINGER MEDICAL CENTER (11775)
CHILDRENS HOSPITAL OF PITTSBURGH OF UPMC (11640)
UPMC MERCY (10384)
READING HOSPITAL (12375)
TEMPLE UNIVERSITY HOSPITAL (12382)
CHILDRENS HOSPITAL OF PHILADELPHIA (10306)
MILTON S HERSHEY MEDICAL CENTER (11747)
LEHIGH VALLEY HOSPITAL (11884)
UPMC PRESBYTERIAN SHADYSIDE − SHADYSIDE (10118)
ALLEGHENY GENERAL HOSPITAL (10648)
THOMAS JEFFERSON UNIVERSITY HOSPITAL (11506)
HOSPITAL OF THE UNIVERSITY OF PENNSYLVANIA (10219)
UPMC PRESBYTERIAN SHADYSIDE (10348)
Better than predicted Not different than predicted Worse than predicted
131
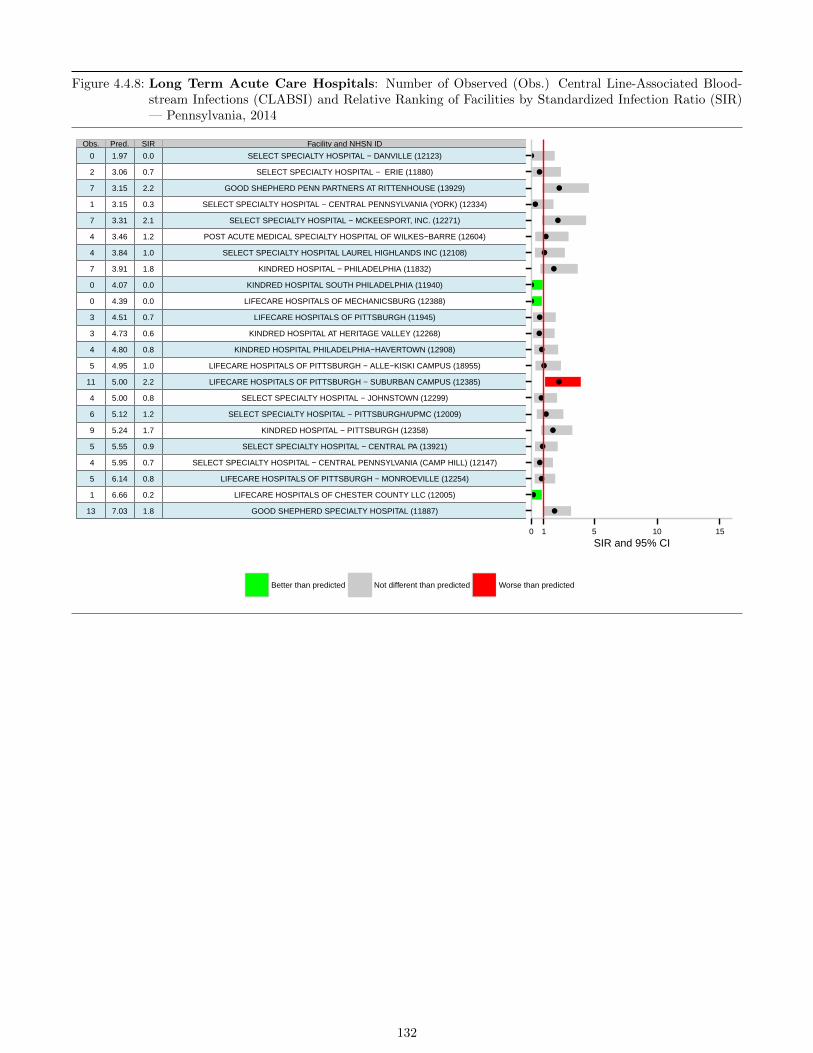
Figure 4.4.8: Long Term Acute Care Hospitals: Number of Observed (Obs.) Central Line-Associated Blood-stream Infections (CLABSI) and Relative Ranking of Facilities by Standardized Infection Ratio (SIR)— Pennsylvania, 2014
0 1 5 10 15
SIR and 95% CI
Obs.
0
Pred.
2
SIR
7
Facility and NHSN ID
1
7
4
4
7
0
0
3
3
4
5
11
4
6
9
5
4
5
1
13
1.97
3.06
3.15
3.15
3.31
3.46
3.84
3.91
4.07
4.39
4.51
4.73
4.80
4.95
5.00
5.00
5.12
5.24
5.55
5.95
6.14
6.66
7.03
0.0
0.7
2.2
0.3
2.1
1.2
1.0
1.8
0.0
0.0
0.7
0.6
0.8
1.0
2.2
0.8
1.2
1.7
0.9
0.7
0.8
0.2
1.8
SELECT SPECIALTY HOSPITAL − DANVILLE (12123)
SELECT SPECIALTY HOSPITAL − ERIE (11880)
GOOD SHEPHERD PENN PARTNERS AT RITTENHOUSE (13929)
SELECT SPECIALTY HOSPITAL − CENTRAL PENNSYLVANIA (YORK) (12334)
SELECT SPECIALTY HOSPITAL − MCKEESPORT, INC. (12271)
POST ACUTE MEDICAL SPECIALTY HOSPITAL OF WILKES−BARRE (12604)
SELECT SPECIALTY HOSPITAL LAUREL HIGHLANDS INC (12108)
KINDRED HOSPITAL − PHILADELPHIA (11832)
KINDRED HOSPITAL SOUTH PHILADELPHIA (11940)
LIFECARE HOSPITALS OF MECHANICSBURG (12388)
LIFECARE HOSPITALS OF PITTSBURGH (11945)
KINDRED HOSPITAL AT HERITAGE VALLEY (12268)
KINDRED HOSPITAL PHILADELPHIA−HAVERTOWN (12908)
LIFECARE HOSPITALS OF PITTSBURGH − ALLE−KISKI CAMPUS (18955)
LIFECARE HOSPITALS OF PITTSBURGH − SUBURBAN CAMPUS (12385)
SELECT SPECIALTY HOSPITAL − JOHNSTOWN (12299)
SELECT SPECIALTY HOSPITAL − PITTSBURGH/UPMC (12009)
KINDRED HOSPITAL − PITTSBURGH (12358)
SELECT SPECIALTY HOSPITAL − CENTRAL PA (13921)
SELECT SPECIALTY HOSPITAL − CENTRAL PENNSYLVANIA (CAMP HILL) (12147)
LIFECARE HOSPITALS OF PITTSBURGH − MONROEVILLE (12254)
LIFECARE HOSPITALS OF CHESTER COUNTY LLC (12005)
GOOD SHEPHERD SPECIALTY HOSPITAL (11887)
Better than predicted Not different than predicted Worse than predicted
132

Figure 4.4.9: Neonatal Intensive Care Units: Number of Observed (Obs.) Central Line-Associated BloodstreamInfections (CLABSI) and Relative Ranking of Facilities by Standardized Infection Ratio (SIR) — Penn-sylvania, 2014
Grouped by Number of Predicted (Pred.) Infections: < 1
0 1 5 10 15
SIR and 95% CI
Obs.0
Pred.
0
SIR
1
Facility and NHSN ID
0
0
0
0
0
0
0
0
0
0
0
1
2
1
1
0
0
1
1
0.02
0.04
0.05
0.06
0.07
0.08
0.09
0.09
0.15
0.19
0.31
0.31
0.36
0.45
0.48
0.61
0.74
0.86
0.88
0.96
0.99
1.00
0.0
0.0
20.6
0.0
0.0
0.0
0.0
0.0
0.0
0.0
0.0
0.0
0.0
0.0
2.1
3.3
1.4
1.2
0.0
0.0
1.0
1.0
EASTON HOSPITAL (11929)
MAIN LINE HOSPITAL − PAOLI (11750)
UPMC MERCY (10384)
ST. MARY MEDICAL CENTER (11885)
EPHRATA COMMUNITY HOSPITAL (11764)
ST. JOSEPH MEDICAL CTR (11961)
HOLY SPIRIT HOSPITAL (12387)
DELAWARE COUNTY MEMORIAL HOSPITAL (11972)
POCONO MEDICAL CENTER (11772)
PENN HIGHLANDS DUBOIS (11606)
HEART OF LANCASTER REGIONAL MEDICAL CENTER (12571)
MAIN LINE HOSPITAL BRYN MAWR (11753)
MOSES TAYLOR HOSPITAL (11528)
EINSTEIN MEDICAL CENTER MONTGOMERY (30210)
HOLY REDEEMER HOSPITAL (11973)
SAINT VINCENT HOSPITAL (11699)
ABINGTON MEMORIAL HOSPITAL (11838)
CROZER CHESTER MEDICAL CENTER (11839)
HAHNEMANN UNIVERSITY HOSPITAL (11437)
CONEMAUGH MEMORIAL MEDICAL CENTER (10280)
CHESTER COUNTY HOSPITAL (12016)
ST. LUKES HOSPITAL BETHLEHEM (11718)
Better than predicted Not different than predicted Worse than predicted
133
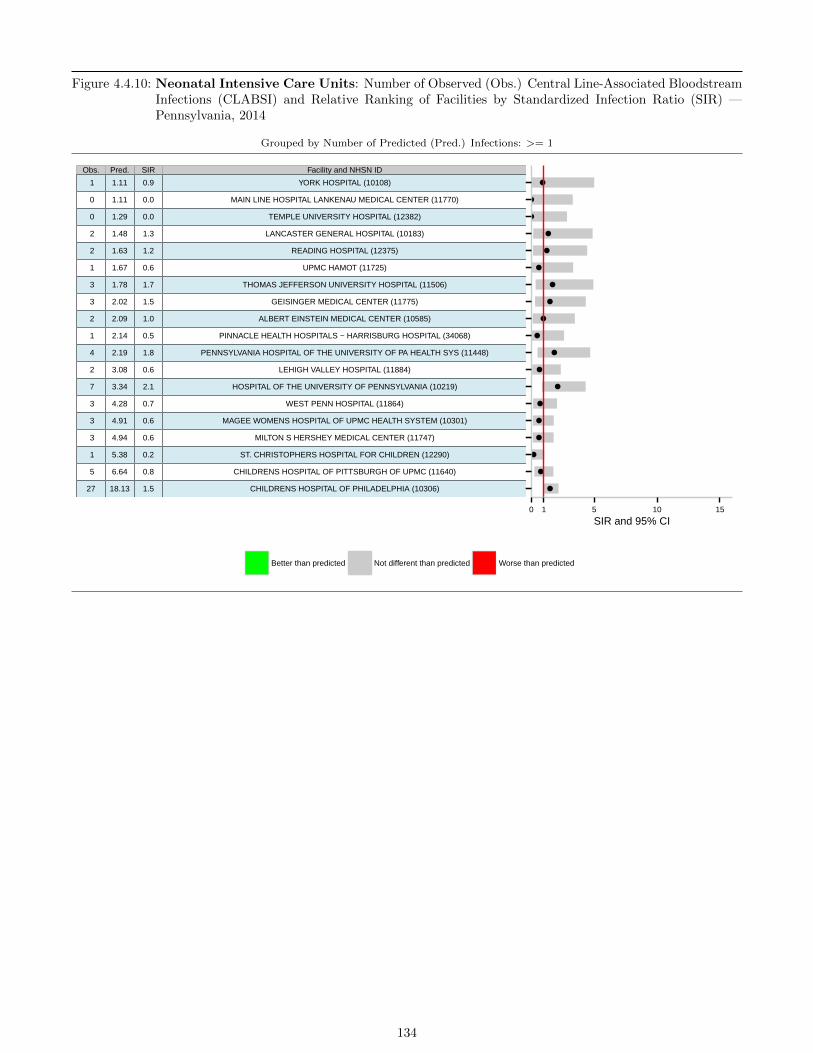
Figure 4.4.10: Neonatal Intensive Care Units: Number of Observed (Obs.) Central Line-Associated BloodstreamInfections (CLABSI) and Relative Ranking of Facilities by Standardized Infection Ratio (SIR) —Pennsylvania, 2014
Grouped by Number of Predicted (Pred.) Infections: >= 1
0 1 5 10 15
SIR and 95% CI
Obs.
1
Pred.
0
SIR
0
Facility and NHSN ID
2
2
1
3
3
2
1
4
2
7
3
3
3
1
5
27
1.11
1.11
1.29
1.48
1.63
1.67
1.78
2.02
2.09
2.14
2.19
3.08
3.34
4.28
4.91
4.94
5.38
6.64
18.13
0.9
0.0
0.0
1.3
1.2
0.6
1.7
1.5
1.0
0.5
1.8
0.6
2.1
0.7
0.6
0.6
0.2
0.8
1.5
YORK HOSPITAL (10108)
MAIN LINE HOSPITAL LANKENAU MEDICAL CENTER (11770)
TEMPLE UNIVERSITY HOSPITAL (12382)
LANCASTER GENERAL HOSPITAL (10183)
READING HOSPITAL (12375)
UPMC HAMOT (11725)
THOMAS JEFFERSON UNIVERSITY HOSPITAL (11506)
GEISINGER MEDICAL CENTER (11775)
ALBERT EINSTEIN MEDICAL CENTER (10585)
PINNACLE HEALTH HOSPITALS − HARRISBURG HOSPITAL (34068)
PENNSYLVANIA HOSPITAL OF THE UNIVERSITY OF PA HEALTH SYS (11448)
LEHIGH VALLEY HOSPITAL (11884)
HOSPITAL OF THE UNIVERSITY OF PENNSYLVANIA (10219)
WEST PENN HOSPITAL (11864)
MAGEE WOMENS HOSPITAL OF UPMC HEALTH SYSTEM (10301)
MILTON S HERSHEY MEDICAL CENTER (11747)
ST. CHRISTOPHERS HOSPITAL FOR CHILDREN (12290)
CHILDRENS HOSPITAL OF PITTSBURGH OF UPMC (11640)
CHILDRENS HOSPITAL OF PHILADELPHIA (10306)
Better than predicted Not different than predicted Worse than predicted
134
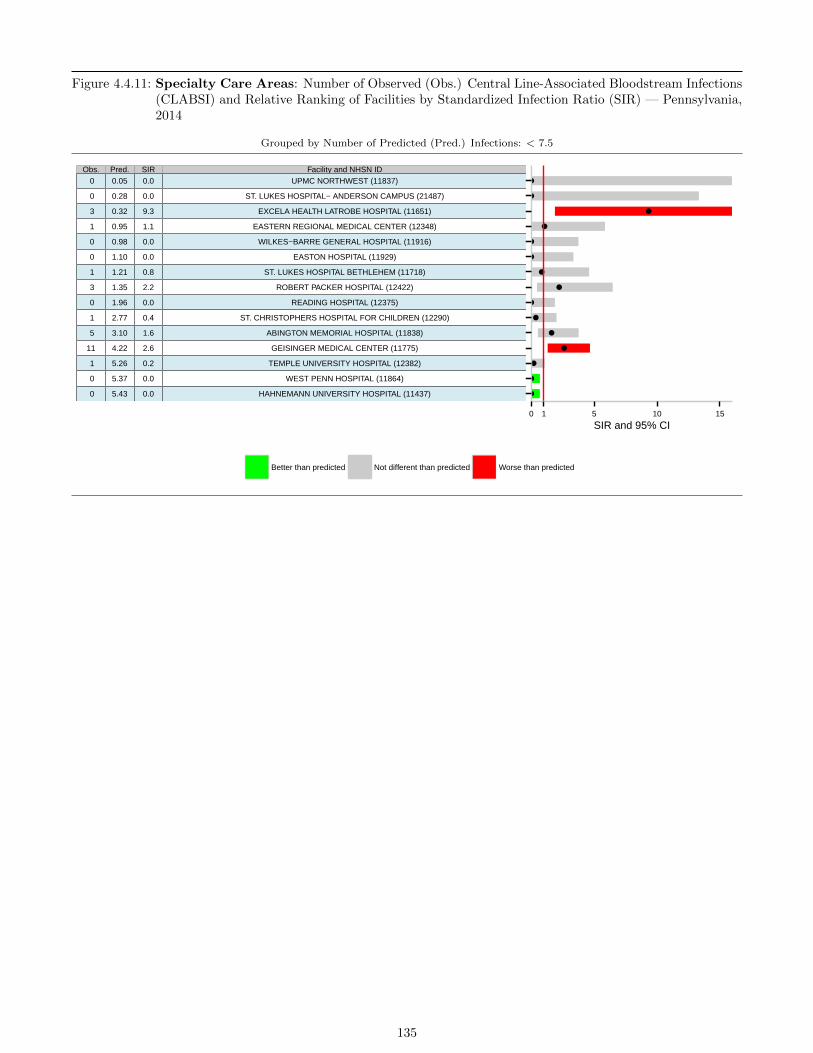
Figure 4.4.11: Specialty Care Areas: Number of Observed (Obs.) Central Line-Associated Bloodstream Infections(CLABSI) and Relative Ranking of Facilities by Standardized Infection Ratio (SIR) — Pennsylvania,2014
Grouped by Number of Predicted (Pred.) Infections: < 7.5
0 1 5 10 15
SIR and 95% CI
Obs. 0
Pred.
0
SIR
3
Facility and NHSN ID
1
0
0
1
3
0
1
5
11
1
0
0
0.05
0.28
0.32
0.95
0.98
1.10
1.21
1.35
1.96
2.77
3.10
4.22
5.26
5.37
5.43
0.0
0.0
9.3
1.1
0.0
0.0
0.8
2.2
0.0
0.4
1.6
2.6
0.2
0.0
0.0
UPMC NORTHWEST (11837)
ST. LUKES HOSPITAL− ANDERSON CAMPUS (21487)
EXCELA HEALTH LATROBE HOSPITAL (11651)
EASTERN REGIONAL MEDICAL CENTER (12348)
WILKES−BARRE GENERAL HOSPITAL (11916)
EASTON HOSPITAL (11929)
ST. LUKES HOSPITAL BETHLEHEM (11718)
ROBERT PACKER HOSPITAL (12422)
READING HOSPITAL (12375)
ST. CHRISTOPHERS HOSPITAL FOR CHILDREN (12290)
ABINGTON MEMORIAL HOSPITAL (11838)
GEISINGER MEDICAL CENTER (11775)
TEMPLE UNIVERSITY HOSPITAL (12382)
WEST PENN HOSPITAL (11864)
HAHNEMANN UNIVERSITY HOSPITAL (11437)
Better than predicted Not different than predicted Worse than predicted
135
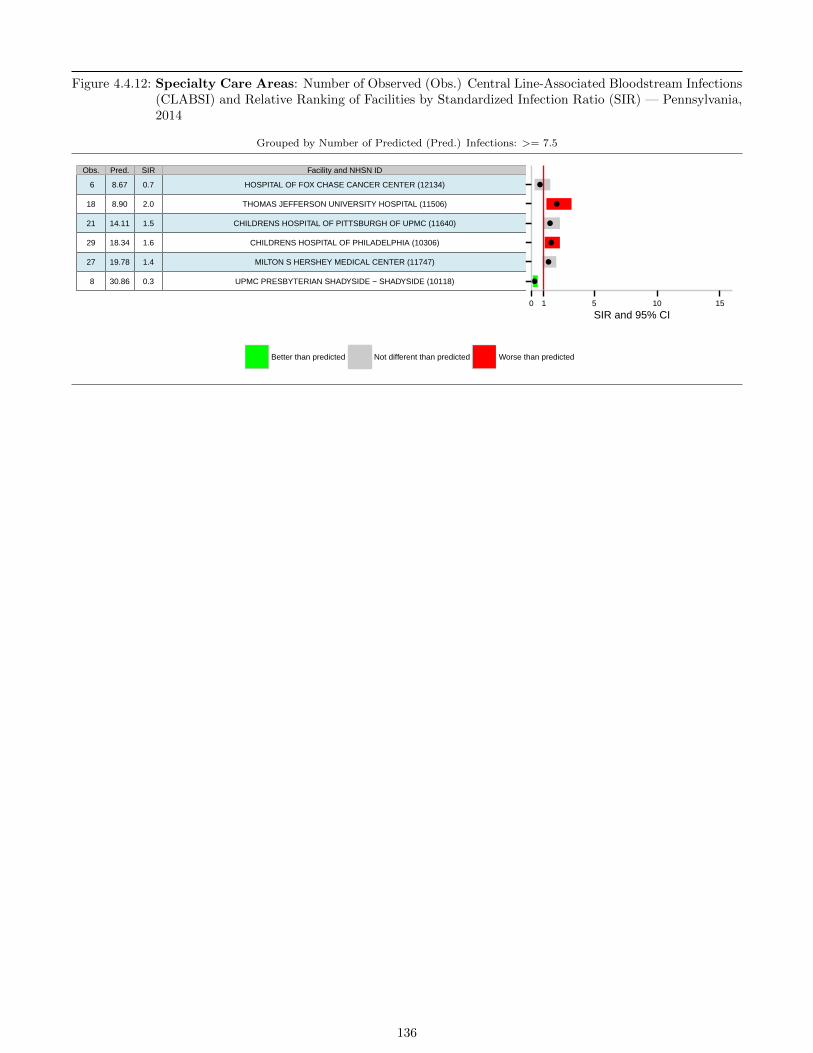
Figure 4.4.12: Specialty Care Areas: Number of Observed (Obs.) Central Line-Associated Bloodstream Infections(CLABSI) and Relative Ranking of Facilities by Standardized Infection Ratio (SIR) — Pennsylvania,2014
Grouped by Number of Predicted (Pred.) Infections: >= 7.5
0 1 5 10 15
SIR and 95% CI
Obs.
6
Pred.
18
SIR
21
Facility and NHSN ID
29
27
8
8.67
8.90
14.11
18.34
19.78
30.86
0.7
2.0
1.5
1.6
1.4
0.3
HOSPITAL OF FOX CHASE CANCER CENTER (12134)
THOMAS JEFFERSON UNIVERSITY HOSPITAL (11506)
CHILDRENS HOSPITAL OF PITTSBURGH OF UPMC (11640)
CHILDRENS HOSPITAL OF PHILADELPHIA (10306)
MILTON S HERSHEY MEDICAL CENTER (11747)
UPMC PRESBYTERIAN SHADYSIDE − SHADYSIDE (10118)
Better than predicted Not different than predicted Worse than predicted
136
4.5 Surgical site infections (SSIs)
Surgical site infections (SSIs) are those HAIs that occur in association with an inpatient operation that involvesat least one skin incision and complete closure of the incision site before the patient leaves the operating theater.Pennsylvania data show that SSIs are the most common category of HAIs in 2014, and as other categories havedeclined in incidence, the proportion of HAIs in the SSI category has grown. SSIs are a substantial problem inthe hospital, as they are very costly, are linked to excess deaths, increase the length of hospitalization, lead tohospital readmissions and produce long-term consequences. There is a growing body of evidence that SSIs can beprevented through the use of science-based measures. These include the use of peri-operative prophylactic antibiotics,preparation of the surgical site (especially hair removal techniques and pre-operative skin disinfection) and post-operative wound care. A number of factors have been associated with the likelihood an SSI will develop. Theseinclude the type of surgical procedure, the underlying health status of the patient, whether the procedure is doneemergently or electively, the condition and circumstances of the operative site (e.g., the cleanliness of the wound),duration of the surgical procedure, and the surgeon who performs the procedure.
4.5.1 SSIs — Statewide Summary
For each procedure type, the total number of hospitals performing that procedure is shown in Table 4.5.1. Asdiscussed in the methods, direct comparison of rates before and after 2012 are complicated by changes in the follow-up surveillance period in 2012 and the inclusion of colon surgeries as a seventh benchmarked procedure in 2013.
Table 4.5.1 shows the SSI rate for each of the seven procedure types performed in 2014, rates for previous years andthe percent change. The rates of infection for procedures performed in 2014 ranged from a low of 0.58 SSIs per 100knee arthroplasties to a high of 5.20 SSIs per 100 colon (COLO) surgeries. When interpreting this table for potentialtrends, one must exercise caution as the change in surveillance period during this time and the addition of colonsurgeries as a benchmarked procedures needs to be accounted for. See previous reports for a detailed discussion ofthese limitations. Nonetheless, the rate of SSIs decreased 4.40 percent between 2013 and 2014 (same benchmarkedprocedures and follow-up period.) Dramatic reductions in infection rates were observed between 2014 and 2013for cardiac bypasss graft surgery with one incision (CBGC: 53.77 percent), cardiac bypass graft surgery with twoincisions (CBGB: 18.54 percent) and other cardiac procedures (CARD: 15.73 percent). Additional rate decreaseswere observed for knee prosthesis and hip prosthesis procedures.
137

Table 4.5.1: Summary of Reporting Hospitals and Surgical Site Infections (SSIs) by Benchmarked Procedure and Year —Pennsylvania, 2009–2014
Number ofReportingHospitals
Number ofSSIs
Number ofProcedures
Unadjusted(Crude)
Rate per 100Procedures
Change inRate SincePrior Year
Change inRate SinceBaseline
Cardiac (CARD)2014 72 59 8, 923 0.66 − 15.73 − 43.872013 70 70 8, 921 0.78 − 21.63 − 33.392012 67 81 8, 090 1.00 − 11.17 − 15.002011 67 88 7, 807 1.13 1.12 − 4.312010 66 83 7, 446 1.11 − 5.37 − 5.372009 64 83 7, 046 1.18 . .
Cardiac Bypass Graft Surgery with One Incision (CBGC)2014 61 8 1, 080 0.74 − 53.77 − 43.402013 59 17 1, 061 1.60 − 17.51 22.422012 58 27 1, 390 1.94 76.49 48.422011 53 14 1, 272 1.10 − 17.80 − 15.902010 57 19 1, 419 1.34 2.31 2.312009 57 27 2, 063 1.31 . .
Cardiac Bypass Graft Surgery with Two Incisions (CBGB)2014 61 121 8, 817 1.37 − 18.54 − 44.662013 63 151 8, 963 1.68 − 23.61 − 32.072012 60 193 8, 751 2.21 4.80 − 11.072011 60 196 9, 314 2.10 4.31 − 15.152010 62 208 10, 310 2.02 − 18.65 − 18.652009 61 276 11, 129 2.48 . .
Knee Prosthesis (KPRO)2014 158 240 41, 405 0.58 − 6.86 − 37.942013 157 252 40, 491 0.62 − 23.95 − 33.372012 157 329 40, 201 0.82 − 1.86 − 12.382011 160 328 39, 333 0.83 − 5.26 − 10.722010 153 350 39, 762 0.88 − 5.76 − 5.762009 151 355 38, 006 0.93 . .
Hip Prosthesis (HPRO)2014 158 313 26, 337 1.19 − 9.82 − 14.502013 160 329 24, 966 1.32 − 5.92 − 5.192012 158 334 23, 846 1.40 − 5.27 0.772011 159 346 23, 400 1.48 − 0.01 6.382010 155 333 22, 519 1.48 6.39 6.392009 152 304 21, 871 1.39 . .
Abdominal Hysterectomy (HYST)2014 141 210 14, 191 1.48 5.04 − 7.092013 146 201 14, 268 1.41 − 11.48 − 11.552012 146 224 14, 076 1.59 0.45 − 0.092011 146 214 13, 508 1.58 0.99 − 0.532010 143 213 13, 578 1.57 − 1.51 − 1.512009 145 224 14, 064 1.59 . .
Colon Surgery (COLO)2014 156 834 16, 028 5.20 3.90 10.942013 159 819 16, 354 5.01 6.77 6.772012 159 733 15, 628 4.69 . .2011 . . . . . .2010 . . . . . .2009 . . . . . .
Continued on next page . . .
138

Table 4.5.1 – Continued from previous page
Number ofReportingHospitals
Number ofSSIs
Number ofProcedures
Unadjusted(Crude)
Rate per 100Procedures
Change inRate SincePrior Year
Change inRate SinceBaseline
Annual Total (All Procedures)2014 167 1, 785 116, 781 1.53 − 4.40 13.442013 168 1, 839 115, 024 1.60 − 6.80 18.652012 168 1, 921 111, 982 1.72 36.88 27.312011 170 1, 186 94, 634 1.25 − 1.24 − 6.992010 164 1, 206 95, 034 1.27 − 5.82 − 5.822009 166 1, 269 94, 179 1.35 . .
4.5.2 SSIs — By Pathogen
Table 4.5.2 shows the pathogen data for surgical site infections resulting from procedures performed in 2012 through2014. Pathogens isolated in 1 percent or more of all SSIs are listed individually. Pathogens isolated in less than 1percent of SSIs have been included in the table as ”Other.”The number of pathogens is not broken down by proceduretype, as the number of SSIs is small for individual procedure categories; however, S. aureus was the most commonlyreported pathogen in each procedure category. The total number of isolated pathogens is greater than the numberof SSIs, as NHSN allows for reporting of more than one pathogen per infection.
Table 4.5.2: Pathogens Isolated from Surgical Site Infections — Pennsylvania, 2012–2014
2012 2013 2014
Pathogen Count % Count % Count %
Staphylococcus aureus 559 23.18 480 20.70 494 20.52Escherichia coli 309 12.81 348 15.01 353 14.67
Enterococcus faecalis 157 6.51 176 7.59 166 6.90Pseudomonas aeruginosa 118 4.89 129 5.56 114 4.74
Enterococcus spp. 109 4.52 88 3.79 105 4.36Klebsiella pneumoniae 94 3.90 79 3.41 95 3.95
Staphylococcus coagulase negative 107 4.44 95 4.10 89 3.70Proteus mirabilis 81 3.36 73 3.15 74 3.07
Enterococcus faecium 56 2.32 60 2.59 73 3.03Staphylococcus epidermidis 65 2.69 59 2.54 68 2.83
Enterobacter cloacae 53 2.20 68 2.93 67 2.78Bacteroides fragilis 71 2.94 60 2.59 58 2.41Candida albicans 35 1.45 35 1.51 55 2.29
Streptococcus group B 30 1.24 21 0.91 42 1.74Serratia marcescens 39 1.62 28 1.21 36 1.50Morganella morganii 19 0.79 21 0.91 30 1.25
Streptococcus viridans spp. 29 1.20 28 1.21 27 1.12Other 481 19.94 471 20.31 461 19.15
All 2, 412 100.00 2, 319 100.00 2, 407 100.00
4.5.3 SSIs — Risk-Adjusted Rates
Since information is collected on all patients undergoing the benchmark operative procedures, it is possible to calculateSSI rates for patient characteristics that are used for SSI risk adjustment purposes. For this report, rates are adjustedby the risk index. The risk index is comprised of:
139
• American Society of Anesthesiology (ASA) score (a measure of the overall health of the patient);
• Wound classification (clean vs. unclean); and
• Operative duration (below or above the median).
Each patient is assigned a risk index (RI) score of 0 to 3, with a possible single point given for each of the threecriteria. For instance, a patient with a low ASA score (meaning they are a low-risk patient for surgical complications— i.e., they are in good health), a clean wound and a short operative duration would have a risk index of 0. A patientwith a high ASA score (a person at high risk of surgical complications due to poor health), a contaminated operativesite and long procedure duration would have a risk index score of 3. Patients can therefore have an assigned riskindex of 0, 1, 2, or 3 based on whether or not a point is assigned for each factor that comprises the risk index.
Table 4.5.3 demonstrates the SSI rate for each benchmark procedure by risk index category for 2014. Studies haveshown that, in general, the SSI rate increases in concert with an increasing risk index. In general, this is true for theseven benchmark procedures in Pennsylvania. However, as shown in Table 4.5.3, this is not always the case. Thisusually results because the number of procedures and/or SSIs in some of the risk index strata is small. For instance,in 2014, only 22 cardiac bypass (two incisions) procedures were done on patients with a risk index of 0, and a similarsmall number (9 procedures) were done on patients with a risk index of 3.
To determine the risk-adjusted standardized infection ratio (SIR) for each hospital, the hospital’s SSI rate for eachrisk index category (e.g., for their patients with a risk index of 0, 1, 2, and 3) is compared to the overall statewiderate for each risk index stratum. The number of predicted SSIs for each hospital is calculated based on the numberof procedures they reported performing within each risk index category and the statewide rate for that stratum. Thepredicted number is then compared to the observed number. This is done for each risk index category to producean overall predicted SSI number, and this is compared to the overall observed number to produce the risk adjustedSIR for each procedure. As with CAUTIs and CLABSIs, the confidence interval (CI) is then calculated to determineif the number of SSIs reported by the hospital is significantly better or worse than predicted, in comparison to thestatewide rate. Hospitals with significantly better or worse than predicted SIRs are found in Tables 4.5.6–4.5.7.
140

Table 4.5.3: Surgical Site Infections and Crude Infection Rate by Benchmarked Procedure and Risk Index — Pennsylvania,2014
RiskIndex
Numberof SSIs
Numberof
Procedures
Crude Rateper 100
Procedures
Cardiac (CARD) 0 0 121 0.001 45 6, 584 0.682 14 2, 003 0.703 0 44 0.00
All 59 8, 752 0.67
Cardiac bypass graft surgery with one incision (CBGC) 0 0 6 0.001 6 875 0.692 2 187 1.073 0 1 0.00
All 8 1, 069 0.75
Cardiac bypass graft surgery with two incisions (CBGB) 0 0 22 0.001 72 6, 716 1.072 48 1, 979 2.433 1 9 11.11
All 121 8, 726 1.39
Knee prosthesis (KPRO) 0 48 16, 501 0.291 128 20, 481 0.622 62 4, 051 1.533 2 87 2.30
All 240 41, 120 0.58
Hip prosthesis (HPRO) 0 59 9, 585 0.621 167 13, 454 1.242 85 3, 044 2.793 2 82 2.44
All 313 26, 165 1.20
Abdominal hysterectomy (HYST) 0 61 6, 087 1.001 94 5, 921 1.592 53 2, 106 2.523 2 35 5.71
All 210 14, 149 1.48
Colon surgery (COLO) 0 96 2, 994 3.211 363 7, 450 4.872 311 4, 624 6.733 64 622 10.29
All 834 15, 690 5.32
4.5.4 SSIs — By Procedure Type and Facility
The SIRs for each of the benchmarked procedures by hospital are presented in Tables 4.5.8–4.5.13. In these tables,the hospitals are listed sequentially from fewest to most predicted SSIs. Table 4.5.15 presents the same informationin alphabetical order by hospital. This enables the reader to review and compare a specific hospital’s SIRs for eachprocedure.
141

Cardiac surgical procedures As shown in Table 4.5.4, among the 72 hospitals that performed cardiac surgeryin 2014, the median number of reported SSIs was 0. In that year, 51 (70.8 percent) of these hospitals reported nocardiac surgery-related SSIs, and 56 ( 78 percent) had a predicted number of infections that was <1.00. Informationregarding hospitals with <1 predicted cardiac surgical site infection is considered statistically unreliable (as evidencedby the extremely wide confidence intervals in the tables for these facilities). During 2014, 56 (77.8 percent) of thehospitals performing cardiac surgery had an adjusted SIR that was <1.00 (meaning the number of reported cardiacsurgery-related SSIs was lower than predicted), while the remaining 16 (22.2 percent) had an SIR ≥ 1.00 (the numberreported was higher than predicted). None of the hospitals had significantly fewer or more cardiac surgery-relatedSSIs than predicted.
Cardiac bypass graft — single incision procedures (CBGC) As shown in Table 4.5.4, among the 61 hospitalsthat reported performing single (chest) incision cardiac bypass grafts (CBGC) in 2014, the median number of post-surgical SSIs was 0, and only 8 (13.1 percent) of the hospitals reported any CBGC-related SSIs. The remaining53 (86.9 percent) reported none. In addition, 53 (86.9 percent) of the hospitals had <1 predicted infection in theCBGC category; for these hospitals, the findings are considered to be statistically unreliable. Among all hospitalsperforming CBGCs in 2014, 53 (86.9 percent) of the hospitals performing CBGCs had a reported number of SSIsthat was less than predicted (an SIR <1.00), and only 8 (13.1 percent) reported more SSIs (an SIR >1.00) thanpredicted; none had significantly better or worse SIRs than predicted (Table 4.5.7).
Cardiac bypass graft — two incision procedures (CBGB) As shown in Table 4.5.4, among the 61 hospitalsthat performed two-incision (chest and donor site) cardiac bypass grafts in 2014, the median number of SSIs was1, and 15 (24.6 percent) reported no CBGB-related SSIs. Among these hospitals, only 12 ( 20 percent) had <1predicted infection. In 2014, there were 34 (55.7 percent) hospitals performing CBGBs that had a lower number ofSSIs than predicted (their adjusted SIR was <1.00), while 27 (44.3 percent) had a greater or equal to number of SSIsthan predicted (SIR ≥ 1.00). Among the 61 hospitals, none reported significantly fewer infections than predicted(listed in Table 4.5.6), while FOUR hospitals (6.6 percent) reported significantly more infections than predicted;these hospitals are listed in Table 4.5.7.
Knee prostheses (KPRO) As shown in Table 4.5.4, among the 158 hospitals performing knee arthroplasties(prostheses) in 2014, the median number of SSIs was 1; a total of 68 (43.0 percent) reported no SSIs in this procedurecategory. Among the 158 hospitals, 76 ( 48 percent) had a predicted number of infections that was <1; for thesehospitals, the findings are considered statistically unreliable. Among hospitals performing knee arthroplasties in2014, there were 104 (65.8 percent) that had a fewer number (SIR <1.00) of knee prosthesis-related SSIs reportedthan predicted; two hospitals (1 percent) had a significantly lower SIR (better) than predicted. The remaining 54(34.2 percent) had a greater or equal number (SIR ≥ 1.00) of SSIs reported than predicted; seven (4.4 percent)hospitals had a significantly higher number of SSIs reported than were predicted in that year. The hospitals with asignificantly lower than, and higher than, predicted number of knee procedure-related surgical site infections can befound in Tables 4.5.6 and 4.5.7.
Hip prostheses (HPRO) As shown in Table 4.5.4, among the 158 hospitals performing hip arthroplasties (pros-theses) in 2014, the median number of SSIs was 1; a total of 54 (34.2 percent) reported no SSIs in this procedurecategory, and 64 ( 41 percent) had a predicted number of infections that was <1 (meaning the findings for these hospi-tals are statistically unreliable). Among hospitals performing hip arthroplasties in 2014, there were 93 (58.9 percent)that had a fewer number (SIR <1.00) of SSIs reported than predicted; among these hospitals, two (1 percent) had asignificantly lower number of infections reported than predicted. The remaining 65 (41.1 percent) had a greater orequal number (SIR ≥ 1.00) of SSIs reported than predicted; among these hospitals, three had a significantly higher(or worse) number of hip prosthesis-related SSIs than predicted. The hospitals with a significantly better or worsenumber of infections than predicted can be found in Tables 4.5.6 and 4.5.7.
Abdominal hysterectomies (HYST) As shown in Table 4.5.4, among the 141 hospitals performing abdominalhysterectomies in 2014, the median number of SSIs was 0, and there were 72 (51.1 percent) that reported no SSIs
142
associated with this procedure and 84 ( 60 percent) with a predicted number of SSIs that was <1 (the findingsfor hospitals with <1 predicted infection are considered statistically unreliable). Among hospitals who perfomedabdominal hysterectomies in 2014, a total of 98 (69.5 percent) hospitals reported fewer SSIs than predicted (SIR<1.00), while the other 43 (30.5 percent) reported more or equal SSIs than predicted (SIR ≥ 1.00). Three hospitals (2percent) had a significantly lower number of SSIs than predicted, and eight (5.7 percent) hospitals had a significantlyhigher number of SSIs than predicted. These hospitals can be found in Tables 4.5.6 and 4.5.7.
Colon surgeries (COLO) As shown in Table 4.5.4, among the 156 hospitals performing colon surgeries in 2014,the median number of SSIs was 3; a total of 30 (19.2 percent) reported no SSIs in this procedure category, and 33 ( 21percent) had a predicted number of infections that was <1 (meaning the findings for these hospitals are statisticallyunreliable). Among hospitals performing colon surgeries in 2014, there were 92 (59.0 percent) that had a fewernumber (SIR <1.00) of SSIs reported than predicted; among these hospitals, seven (4 percent) had a significantlylower number of infections reported than predicted. The remaining 64 (41.0 percent) had a greater or equal number(SIR ≥ 1.00) of SSIs reported than predicted; among these hospitals, 11 had a significantly higher (or worse) numberof SSIs than predicted. The hospitals with a significantly better or worse number of infections than predicted can befound in Tables 4.5.6 and 4.5.7.
143

Table 4.5.4: Summary of Surgical Site Infections (SSIs) and Hospital Performance by Benchmarked Procedure and Year —Pennsylvania, 2009–2014
Hospitalswith 0SSIs
Hospitalswith <1
PredictedSSIs
Hospitalswith
AdjustedSIR < 1
Hospitalswith
AdjustedSIR ≥ 1
HospitalsWith
AdjustedSIR
SignificantlyBetter Than
Predicted
HospitalsWith
AdjustedSIR
SignificantlyWorse Than
Predicted
Median SSIsper Hospital n % n % n % n % n % n %
Cardiac (CARD)2014 0 51 70.8 56 77.8 56 77.8 16 22.2 0 0.0 4 5.62013 0 45 65.2 49 71.0 52 75.4 17 24.6 0 0.0 0 0.02012 1 30 45.5 43 65.2 41 62.1 25 37.9 0 0.0 1 1.52011 0 36 54.5 39 59.1 48 72.7 18 27.3 0 0.0 2 3.02010 0 34 52.3 38 58.5 44 67.7 21 32.3 0 0.0 2 3.12009 0 35 55.6 36 57.1 46 73.0 17 27.0 0 0.0 3 4.8
Cardiac bypass graft surgery with one incision (CBGC)2014 0 53 86.9 61 100.0 53 86.9 8 13.1 0 0.0 0 0.02013 0 48 82.8 56 96.6 48 82.8 10 17.2 0 0.0 1 1.72012 0 39 68.4 52 91.2 41 71.9 16 28.1 0 0.0 0 0.02011 0 42 80.8 49 94.2 43 82.7 9 17.3 0 0.0 1 1.92010 0 41 73.2 52 92.9 44 78.6 12 21.4 0 0.0 1 1.82009 0 40 71.4 49 87.5 43 76.8 13 23.2 0 0.0 2 3.6
Cardiac bypass graft surgery with two incisions (CBGB)2014 1 15 24.6 12 19.7 34 55.7 27 44.3 0 0.0 4 6.62013 2 17 27.4 11 17.7 40 64.5 22 35.5 0 0.0 5 8.12012 3 9 15.3 4 6.8 30 50.8 29 49.2 0 0.0 0 0.02011 2 8 13.6 4 6.8 34 57.6 25 42.4 1 1.7 4 6.82010 3 8 13.1 4 6.6 35 57.4 26 42.6 0 0.0 3 4.92009 4 7 11.7 1 1.7 29 48.3 31 51.7 5 8.3 5 8.3
Knee prosthesis (KPRO)2014 1 68 43.0 76 48.1 104 65.8 54 34.2 2 1.3 7 4.42013 1 63 40.4 77 49.4 99 63.5 57 36.5 1 0.6 6 3.82012 1 67 43.2 70 45.2 102 65.8 53 34.2 0 0.0 7 4.52011 1 60 38.7 70 45.2 98 63.2 57 36.8 1 0.6 6 3.92010 1 54 36.7 61 41.5 93 63.3 54 36.7 1 0.7 6 4.12009 1 51 35.4 54 37.5 88 61.1 56 38.9 2 1.4 6 4.2
Hip prosthesis (HPRO)2014 1 54 34.2 64 40.5 93 58.9 65 41.1 2 1.3 3 1.92013 1 62 39.0 70 44.0 100 62.9 59 37.1 2 1.3 9 5.72012 1 63 40.1 70 44.6 95 60.5 62 39.5 3 1.9 3 1.92011 1 55 35.9 65 42.5 95 62.1 58 37.9 2 1.3 5 3.32010 1 58 38.9 64 43.0 90 60.4 59 39.6 1 0.7 7 4.72009 1 56 38.6 61 42.1 93 64.1 52 35.9 1 0.7 4 2.8
Abdominal hysterectomy (HYST)2014 0 72 51.1 84 59.6 98 69.5 43 30.5 3 2.1 8 5.72013 0 77 53.1 93 64.1 104 71.7 41 28.3 0 0.0 6 4.12012 0 80 55.6 90 62.5 98 68.1 46 31.9 1 0.7 6 4.22011 0 76 53.5 88 62.0 92 64.8 50 35.2 2 1.4 3 2.12010 1 63 45.7 74 53.6 90 65.2 48 34.8 1 0.7 5 3.62009 1 61 43.9 74 53.2 93 66.9 46 33.1 1 0.7 7 5.0
Continued on next page . . .
144

Table 4.5.4 – Continued from previous page
Hospitalswith 0SSIs
Hospitalswith <1
PredictedSSIs
Hospitalswith
AdjustedSIR <1
Hospitalswith
AdjustedSIR ≥ 1
HospitalsWith
AdjustedSIR
SignificantlyBetter Than
Predicted
HospitalsWith
AdjustedSIR
SignificantlyWorse Than
Predicted
Median SSIsper Hospital n % n % n % n % n % n %
Colon surgery (COLO)2014 3 30 19.2 33 21.2 92 59.0 64 41.0 7 4.5 11 7.12013 2 32 20.3 34 21.5 96 60.8 62 39.2 5 3.2 9 5.72012 3 25 15.9 33 21.0 92 58.6 65 41.4 4 2.5 5 3.22011 . . . . . . . . . . . . .2010 . . . . . . . . . . . . .2009 . . . . . . . . . . . . .
145

Table 4.5.5: Hospitals Omitted from SSI SIR Analysis Due to No Reported Procedures — Pennsylvania, 2014
Facility Name and NHSN ID
MAIN LINE HOSPITAL BRYN MAWR REHABILITATION (11417)HEALTHSOUTH NITTANY VALLEY REHABILITATION HOSPITAL (11667)HEALTHSOUTH HARMARVILLE REHABILITATION HOSPITAL (11727)PHILHAVEN HOSPITAL (11740)DIVINE PROVIDENCE HOSPITAL (11743)HEALTHSOUTH REHABILITATION HOSPITAL OF ERIE (11810)KINDRED HOSPITAL - PHILADELPHIA (11832)DANVILLE STATE HOSPITAL (11848)JOHN HEINZ INSTITUTE OF REHABILITATION (11861)SELECT SPECIALTY HOSPITAL - ERIE (11880)GOOD SHEPHERD SPECIALTY HOSPITAL (11887)GOOD SHEPHERD REHABILITATION HOSPITAL, THE (11896)HEALTHSOUTH REHABILITATION HOSPITAL OF ALTOONA (11903)PENN STATE HERSHEY REHABILITATION LLC (11915)FULTON COUNTY MEDICAL CENTER (11939)KINDRED HOSPITAL SOUTH PHILADELPHIA (11940)LIFECARE HOSPITALS OF PITTSBURGH (11945)CONEMAUGH MEYERSDALE MEDICAL CENTER (11968)GEISINGER HEALTHSOUTH REHABILITATION HOSPITAL (11993)LIFECARE HOSPITALS OF CHESTER COUNTY LLC (12005)SELECT SPECIALTY HOSPITAL - PITTSBURGH/UPMC (12009)VALLEY FORGE MEDICAL CENTER AND HOSPITAL (12029)NORRISTOWN STATE HOSPITAL (12047)FIRST HOSPITAL OF WYOMING VALLEY (12050)CLARKS SUMMIT STATE HOSPITAL (12051)HEALTHSOUTH REHABILITATION HOSPITAL OF YORK (12058)HEALTHSOUTH REHABILITATION HOSPITAL OF SEWICKLEY (12066)WARREN STATE HOSPITAL (12081)TORRANCE STATE HOSPITAL (12091)SELECT SPECIALTY HOSPITAL LAUREL HIGHLANDS INC (12108)SELECT SPECIALTY HOSPITAL - DANVILLE (12123)HEALTHSOUTH READING REHABILITATION HOSPITAL (12139)MAGEE REHABILITATION HOSPITAL (12146)SELECT SPECIALTY HOSPITAL - CENTRAL PENNSYLVANIA (CAMP HILL) (12147)MEADOWS PSYCHIATRIC CENTER, THE (12156)LIFECARE HOSPITALS OF PITTSBURGH - MONROEVILLE (12254)CHILDRENS INSTITUTE OF PITTSBURGH, THE (12266)KINDRED HOSPITAL AT HERITAGE VALLEY (12268)SELECT SPECIALTY HOSPITAL - MCKEESPORT, INC. (12271)CRICHTON REHABILITATION CENTER (12273)MONTGOMERY COUNTY MH/MR EMERGENCY SERVICES, INC. (12287)SELECT SPECIALTY HOSPITAL - JOHNSTOWN (12299)SELECT SPECIALTY HOSPITAL - CENTRAL PENNSYLVANIA (YORK) (12334)CHILDRENS HOME OF PITTSBURGH, THE (12336)KINDRED HOSPITAL - PITTSBURGH (12358)WERNERSVILLE STATE HOSPITAL (12368)LIFECARE HOSPITALS OF PITTSBURGH - SUBURBAN CAMPUS (12385)LIFECARE HOSPITALS OF MECHANICSBURG (12388)HEALTHSOUTH REHABILITATION HOSPITAL OF MECHANICSBURG (12402)KIDSPEACE ORCHARD HILLS CAMPUS (12430)SOUTHWOOD PSYCHIATRIC HOSPITAL (12453)CLARION PSYCHIATRIC CENTER (12454)BUCKTAIL MEDICAL CENTER (12461)FRIENDS HOSPITAL (12488)BELMONT CENTER FOR COMPREHENSIVE TREATMENT (12505)MOSS REHABILITATION (12508)HORSHAM CLINIC (12543)ST. JOHN VIANNEY HOSPITAL (12548)
146
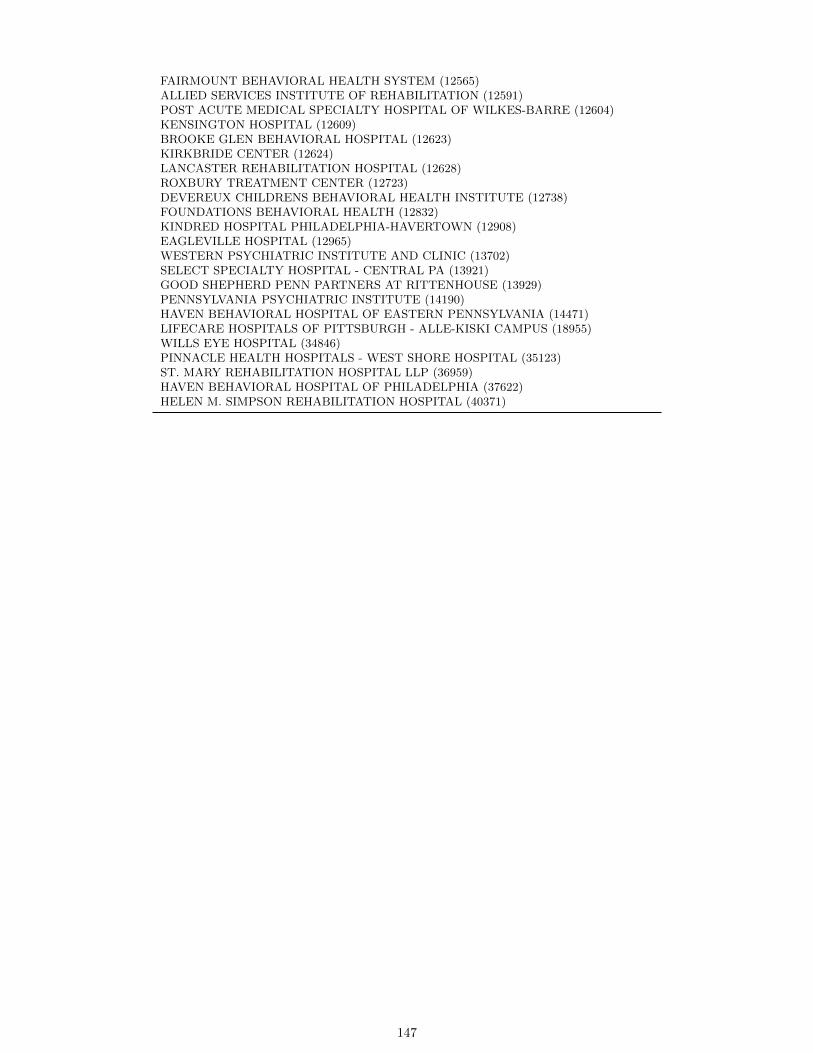
FAIRMOUNT BEHAVIORAL HEALTH SYSTEM (12565)ALLIED SERVICES INSTITUTE OF REHABILITATION (12591)POST ACUTE MEDICAL SPECIALTY HOSPITAL OF WILKES-BARRE (12604)KENSINGTON HOSPITAL (12609)BROOKE GLEN BEHAVIORAL HOSPITAL (12623)KIRKBRIDE CENTER (12624)LANCASTER REHABILITATION HOSPITAL (12628)ROXBURY TREATMENT CENTER (12723)DEVEREUX CHILDRENS BEHAVIORAL HEALTH INSTITUTE (12738)FOUNDATIONS BEHAVIORAL HEALTH (12832)KINDRED HOSPITAL PHILADELPHIA-HAVERTOWN (12908)EAGLEVILLE HOSPITAL (12965)WESTERN PSYCHIATRIC INSTITUTE AND CLINIC (13702)SELECT SPECIALTY HOSPITAL - CENTRAL PA (13921)GOOD SHEPHERD PENN PARTNERS AT RITTENHOUSE (13929)PENNSYLVANIA PSYCHIATRIC INSTITUTE (14190)HAVEN BEHAVIORAL HOSPITAL OF EASTERN PENNSYLVANIA (14471)LIFECARE HOSPITALS OF PITTSBURGH - ALLE-KISKI CAMPUS (18955)WILLS EYE HOSPITAL (34846)PINNACLE HEALTH HOSPITALS - WEST SHORE HOSPITAL (35123)ST. MARY REHABILITATION HOSPITAL LLP (36959)HAVEN BEHAVIORAL HOSPITAL OF PHILADELPHIA (37622)HELEN M. SIMPSON REHABILITATION HOSPITAL (40371)
147

Table 4.5.6: Hospitals with Significantly Fewer Surgical Site Infections (SSIs) than Predicted (Better = Smaller SIR)— Pennsylvania, 2014
Hospital Name (NHSN ID)
Cardiac (CARD)NONE
Cardiac bypass graft surgery with one incision (CBGC)NONE
Cardiac bypass graft surgery with two incisions (CBGB)NONE
Knee arthroplasty (KPRO)PINNACLE HEALTH HOSPITALS - HARRISBURG HOSPITAL (34068)UPMC PASSAVANT (11242)
Hip arthroplasty (HPRO)MAIN LINE HOSPITAL BRYN MAWR (11753)ROTHMAN ORTHOPAEDIC SPECIALTY HOSPITAL (15202)
Abdominal hysterectomy (HYST)LEHIGH VALLEY HOSPITAL (11884)MAGEE WOMENS HOSPITAL OF UPMC HEALTH SYSTEM (10301)READING HOSPITAL (12375)
Colon surgery (COLO)LEHIGH VALLEY HOSPITAL - HAZLETON (11878)LEHIGH VALLEY HOSPITAL (11884)MAIN LINE HOSPITAL - PAOLI (11750)MAIN LINE HOSPITAL LANKENAU MEDICAL CENTER (11770)MILTON S HERSHEY MEDICAL CENTER (11747)ROBERT PACKER HOSPITAL (12422)TEMPLE UNIVERSITY HOSPITAL (12382)
148

Table 4.5.7: Hospitals with Significantly More Surgical Site Infections (SSIs) than Predicted (Worse = Larger SIR)— Pennsylvania, 2014
Hospital Name (NHSN ID)
Cardiac (CARD)CHILDRENS HOSPITAL OF PHILADELPHIA (10306)CHILDRENS HOSPITAL OF PITTSBURGH OF UPMC (11640)ST. CHRISTOPHERS HOSPITAL FOR CHILDREN (12290)UPMC PRESBYTERIAN SHADYSIDE (10348)
Cardiac bypass graft surgery with one incision (CBGC)NONE
Cardiac bypass graft surgery with two incisions (CBGB)BRANDYWINE HOSPITAL (11979)EINSTEIN MEDICAL CENTER MONTGOMERY (30210)PENN PRESBYTERIAN MEDICAL CENTER (11814)WILLIAMSPORT REGIONAL MEDICAL CENTER (11732)
Knee arthroplasty (KPRO)CHESTNUT HILL HOSPITAL (12304)EINSTEIN AT ELKINS PARK (12500)EXCELA HEALTH LATROBE HOSPITAL (11651)HERITAGE VALLEY BEAVER (11831)LANCASTER REGIONAL MEDICAL CENTER (12335)MOUNT NITTANY MEDICAL CENTER (11797)TYRONE HOSPITAL (12717)
Hip arthroplasty (HPRO)GEISINGER MEDICAL CENTER (11775)GEISINGER-COMMUNITY MEDICAL CENTER (11914)PINNACLE HEALTH HOSPITALS - HARRISBURG HOSPITAL (34068)
Abdominal hysterectomy (HYST)GEISINGER MEDICAL CENTER (11775)GEISINGER WYOMING VALLEY MEDICAL CENTER (11780)J C BLAIR MEMORIAL HOSPITAL (11724)LANCASTER GENERAL HOSPITAL (10183)LEHIGH VALLEY HOSPITAL - HAZLETON (11878)PUNXSUTAWNEY AREA HOSPITAL (11830)THOMAS JEFFERSON UNIVERSITY HOSPITAL (11506)UPMC ALTOONA (10178)
Colon surgery (COLO)ALLEGHENY GENERAL HOSPITAL (10648)ALLEGHENY VALLEY HOSPITAL (11842)GEISINGER WYOMING VALLEY MEDICAL CENTER (11780)GNADEN HUETTEN MEMORIAL HOSPITAL (12241)J C BLAIR MEMORIAL HOSPITAL (11724)LANCASTER GENERAL HOSPITAL (10183)READING HOSPITAL (12375)SAINT VINCENT HOSPITAL (11699)UPMC MERCY (10384)UPMC PRESBYTERIAN SHADYSIDE - SHADYSIDE (10118)WARREN GENERAL HOSPITAL (12216)
149

Table 4.5.8: Rate (SIR) of Surgical Site Infections (SSIs) Associated with Cardiac Procedures by Hospital (Ordered by SIR)— Pennsylvania, 2009–2014
Number of SSIs (CARD) Predicted Number of SSIs (CARD) SIR (95% CI)
MAGEE WOMENS HOSPITAL OF UPMC HEALTH SYSTEM (10301)2014 . . .2013 0 0.01 0.00 (0.00–503.45)2012 . . .2011 . . .2010 . . .2009 . . .
MERCY SUBURBAN HOSPITAL (11952)2014 . . .2013 . . .2012 0 0.01 0.00 (0.00–394.22)2011 . . .2010 . . .2009 . . .
OHIO VALLEY GENERAL HOSPITAL (12298)2014 . . .2013 . . .2012 . . .2011 . . .2010 0 0.01 0.00 (0.00–349.76)2009 . . .
UPMC MCKEESPORT (11707)2014 0 0.01 0.00 (0.00–536.68)2013 0 0.04 0.00 (0.00–100.69)2012 0 0.01 0.00 (0.00–394.22)2011 0 0.01 0.00 (0.00–315.62)2010 . . .2009 . . .
GOOD SAMARITAN HOSPITAL, THE (11712)2014 0 0.01 0.00 (0.00–536.68)2013 0 0.04 0.00 (0.00–81.64)2012 0 0.01 0.00 (0.00–394.22)2011 0 0.01 0.00 (0.00–315.62)2010 0 0.02 0.00 (0.00–156.54)2009 0 0.40 0.00 (0.00–9.14)
ST. LUKES HOSPITAL- ANDERSON CAMPUS (21487)2014 0 0.01 0.00 (0.00–536.68)2013 . . .2012 . . .2011 . . .2010 . . .2009 . . .
HERITAGE VALLEY SEWICKLEY (10375)2014 0 0.01 0.00 (0.00–268.34)2013 . . .2012 . . .2011 0 0.01 0.00 (0.00–315.62)2010 0 0.04 0.00 (0.00–87.44)2009 . . .
Continued on next page . . .
150

Table 4.5.8 – Rate of SSIs (SIR) — Cardiac Procedures – Continued from previous page
Number of SSIs (CARD) Predicted Number of SSIs (CARD) SIR (95% CI)
UPMC EAST (28812)2014 0 0.01 0.00 (0.00–268.34)2013 0 0.01 0.00 (0.00–503.45)2012 . . .2011 . . .2010 . . .2009 . . .
RIDDLE MEMORIAL HOSPITAL (11731)2014 0 0.02 0.00 (0.00–178.89)2013 . . .2012 . . .2011 . . .2010 . . .2009 . . .
LOWER BUCKS HOSPITAL (12390)2014 0 0.02 0.00 (0.00–178.89)2013 0 0.03 0.00 (0.00–125.86)2012 0 0.07 0.00 (0.00–55.32)2011 1 0.06 17.81 (0.23–99.07)2010 0 0.06 0.00 (0.00–58.91)2009 0 0.14 0.00 (0.00–26.55)
UPMC HORIZON (11675)2014 0 0.03 0.00 (0.00–107.34)2013 0 0.01 0.00 (0.00–251.72)2012 0 0.04 0.00 (0.00–98.56)2011 0 0.05 0.00 (0.00–78.91)2010 . . .2009 . . .
UPMC ST. MARGARET (11561)2014 0 0.05 0.00 (0.00–76.42)2013 0 0.05 0.00 (0.00–68.14)2012 0 0.09 0.00 (0.00–39.42)2011 0 0.00 0.00 (0.00–3, 668.10)2010 . . .2009 . . .
SHARON REGIONAL HEALTH SYSTEM (12250)2014 0 0.05 0.00 (0.00–66.90)2013 0 0.06 0.00 (0.00–64.73)2012 0 0.16 0.00 (0.00–22.85)2011 0 0.23 0.00 (0.00–15.98)2010 0 0.25 0.00 (0.00–14.61)2009 0 0.13 0.00 (0.00–27.86)
WEST PENN HOSPITAL (11864)2014 0 0.14 0.00 (0.00–25.47)2013 0 0.08 0.00 (0.00–46.71)2012 . . .2011 . . .2010 2 0.88 2.28 (0.26–8.23)2009 0 1.59 0.00 (0.00–2.31)
LANCASTER REGIONAL MEDICAL CENTER (12335)2014 0 0.15 0.00 (0.00–25.20)2013 0 0.27 0.00 (0.00–13.59)2012 1 0.20 5.06 (0.07–28.18)2011 0 0.37 0.00 (0.00–9.94)2010 1 0.29 3.40 (0.04–18.92)2009 0 0.07 0.00 (0.00–52.03)
Continued on next page . . .
151
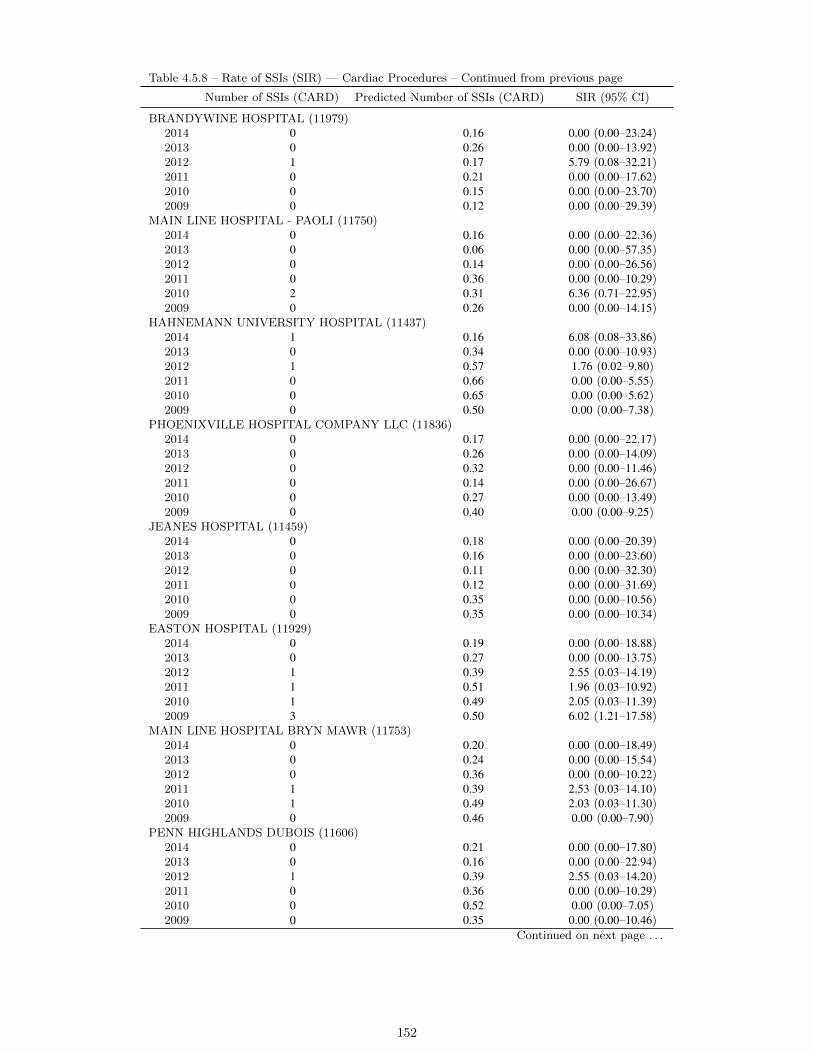
Table 4.5.8 – Rate of SSIs (SIR) — Cardiac Procedures – Continued from previous page
Number of SSIs (CARD) Predicted Number of SSIs (CARD) SIR (95% CI)
BRANDYWINE HOSPITAL (11979)2014 0 0.16 0.00 (0.00–23.24)2013 0 0.26 0.00 (0.00–13.92)2012 1 0.17 5.79 (0.08–32.21)2011 0 0.21 0.00 (0.00–17.62)2010 0 0.15 0.00 (0.00–23.70)2009 0 0.12 0.00 (0.00–29.39)
MAIN LINE HOSPITAL - PAOLI (11750)2014 0 0.16 0.00 (0.00–22.36)2013 0 0.06 0.00 (0.00–57.35)2012 0 0.14 0.00 (0.00–26.56)2011 0 0.36 0.00 (0.00–10.29)2010 2 0.31 6.36 (0.71–22.95)2009 0 0.26 0.00 (0.00–14.15)
HAHNEMANN UNIVERSITY HOSPITAL (11437)2014 1 0.16 6.08 (0.08–33.86)2013 0 0.34 0.00 (0.00–10.93)2012 1 0.57 1.76 (0.02–9.80)2011 0 0.66 0.00 (0.00–5.55)2010 0 0.65 0.00 (0.00–5.62)2009 0 0.50 0.00 (0.00–7.38)
PHOENIXVILLE HOSPITAL COMPANY LLC (11836)2014 0 0.17 0.00 (0.00–22.17)2013 0 0.26 0.00 (0.00–14.09)2012 0 0.32 0.00 (0.00–11.46)2011 0 0.14 0.00 (0.00–26.67)2010 0 0.27 0.00 (0.00–13.49)2009 0 0.40 0.00 (0.00–9.25)
JEANES HOSPITAL (11459)2014 0 0.18 0.00 (0.00–20.39)2013 0 0.16 0.00 (0.00–23.60)2012 0 0.11 0.00 (0.00–32.30)2011 0 0.12 0.00 (0.00–31.69)2010 0 0.35 0.00 (0.00–10.56)2009 0 0.35 0.00 (0.00–10.34)
EASTON HOSPITAL (11929)2014 0 0.19 0.00 (0.00–18.88)2013 0 0.27 0.00 (0.00–13.75)2012 1 0.39 2.55 (0.03–14.19)2011 1 0.51 1.96 (0.03–10.92)2010 1 0.49 2.05 (0.03–11.39)2009 3 0.50 6.02 (1.21–17.58)
MAIN LINE HOSPITAL BRYN MAWR (11753)2014 0 0.20 0.00 (0.00–18.49)2013 0 0.24 0.00 (0.00–15.54)2012 0 0.36 0.00 (0.00–10.22)2011 1 0.39 2.53 (0.03–14.10)2010 1 0.49 2.03 (0.03–11.30)2009 0 0.46 0.00 (0.00–7.90)
PENN HIGHLANDS DUBOIS (11606)2014 0 0.21 0.00 (0.00–17.80)2013 0 0.16 0.00 (0.00–22.94)2012 1 0.39 2.55 (0.03–14.20)2011 0 0.36 0.00 (0.00–10.29)2010 0 0.52 0.00 (0.00–7.05)2009 0 0.35 0.00 (0.00–10.46)
Continued on next page . . .
152
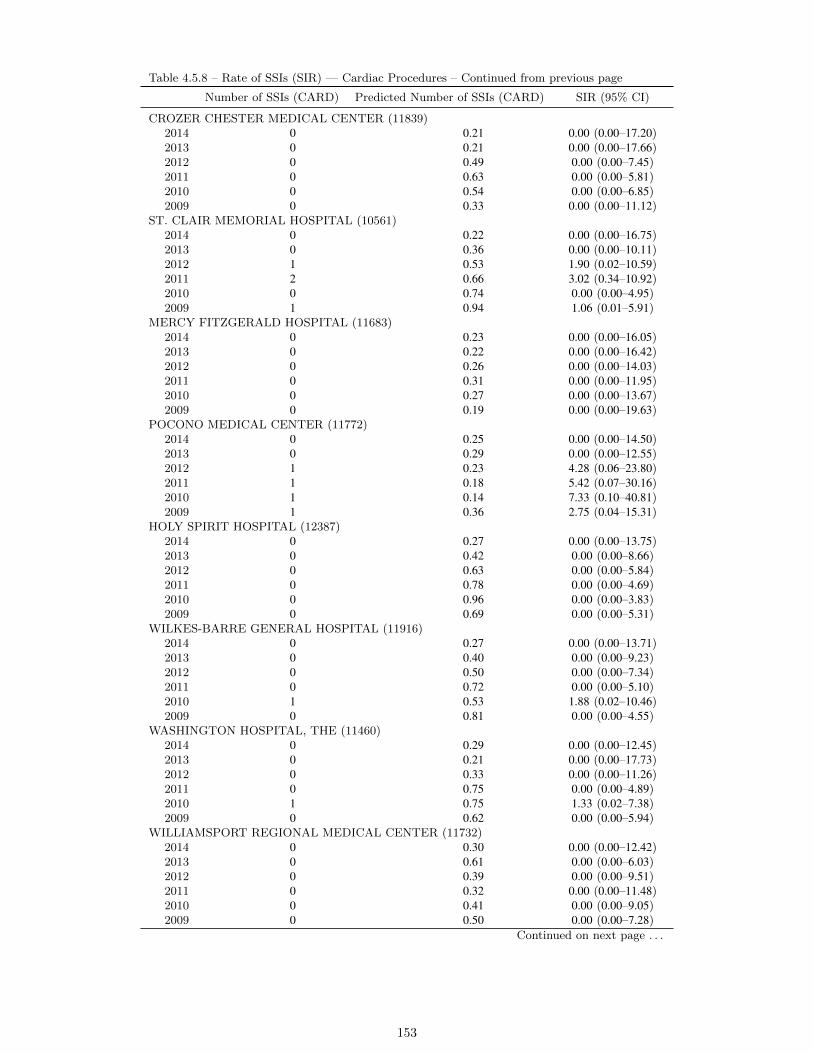
Table 4.5.8 – Rate of SSIs (SIR) — Cardiac Procedures – Continued from previous page
Number of SSIs (CARD) Predicted Number of SSIs (CARD) SIR (95% CI)
CROZER CHESTER MEDICAL CENTER (11839)2014 0 0.21 0.00 (0.00–17.20)2013 0 0.21 0.00 (0.00–17.66)2012 0 0.49 0.00 (0.00–7.45)2011 0 0.63 0.00 (0.00–5.81)2010 0 0.54 0.00 (0.00–6.85)2009 0 0.33 0.00 (0.00–11.12)
ST. CLAIR MEMORIAL HOSPITAL (10561)2014 0 0.22 0.00 (0.00–16.75)2013 0 0.36 0.00 (0.00–10.11)2012 1 0.53 1.90 (0.02–10.59)2011 2 0.66 3.02 (0.34–10.92)2010 0 0.74 0.00 (0.00–4.95)2009 1 0.94 1.06 (0.01–5.91)
MERCY FITZGERALD HOSPITAL (11683)2014 0 0.23 0.00 (0.00–16.05)2013 0 0.22 0.00 (0.00–16.42)2012 0 0.26 0.00 (0.00–14.03)2011 0 0.31 0.00 (0.00–11.95)2010 0 0.27 0.00 (0.00–13.67)2009 0 0.19 0.00 (0.00–19.63)
POCONO MEDICAL CENTER (11772)2014 0 0.25 0.00 (0.00–14.50)2013 0 0.29 0.00 (0.00–12.55)2012 1 0.23 4.28 (0.06–23.80)2011 1 0.18 5.42 (0.07–30.16)2010 1 0.14 7.33 (0.10–40.81)2009 1 0.36 2.75 (0.04–15.31)
HOLY SPIRIT HOSPITAL (12387)2014 0 0.27 0.00 (0.00–13.75)2013 0 0.42 0.00 (0.00–8.66)2012 0 0.63 0.00 (0.00–5.84)2011 0 0.78 0.00 (0.00–4.69)2010 0 0.96 0.00 (0.00–3.83)2009 0 0.69 0.00 (0.00–5.31)
WILKES-BARRE GENERAL HOSPITAL (11916)2014 0 0.27 0.00 (0.00–13.71)2013 0 0.40 0.00 (0.00–9.23)2012 0 0.50 0.00 (0.00–7.34)2011 0 0.72 0.00 (0.00–5.10)2010 1 0.53 1.88 (0.02–10.46)2009 0 0.81 0.00 (0.00–4.55)
WASHINGTON HOSPITAL, THE (11460)2014 0 0.29 0.00 (0.00–12.45)2013 0 0.21 0.00 (0.00–17.73)2012 0 0.33 0.00 (0.00–11.26)2011 0 0.75 0.00 (0.00–4.89)2010 1 0.75 1.33 (0.02–7.38)2009 0 0.62 0.00 (0.00–5.94)
WILLIAMSPORT REGIONAL MEDICAL CENTER (11732)2014 0 0.30 0.00 (0.00–12.42)2013 0 0.61 0.00 (0.00–6.03)2012 0 0.39 0.00 (0.00–9.51)2011 0 0.32 0.00 (0.00–11.48)2010 0 0.41 0.00 (0.00–9.05)2009 0 0.50 0.00 (0.00–7.28)
Continued on next page . . .
153
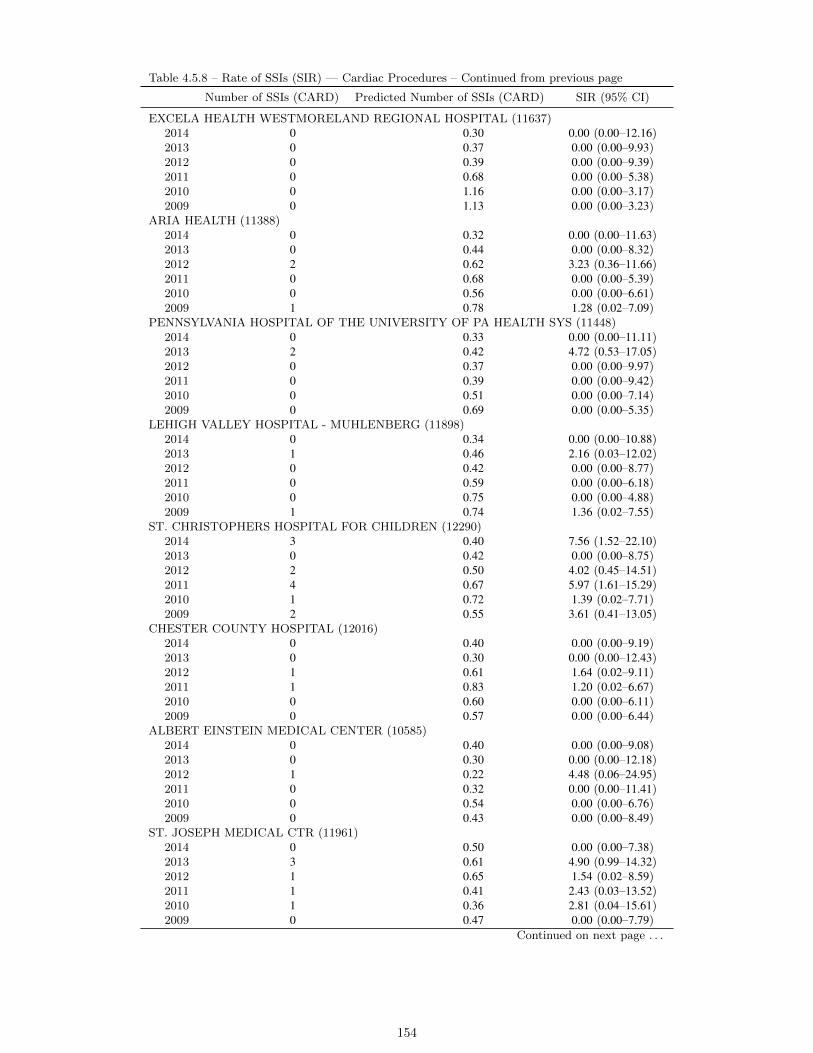
Table 4.5.8 – Rate of SSIs (SIR) — Cardiac Procedures – Continued from previous page
Number of SSIs (CARD) Predicted Number of SSIs (CARD) SIR (95% CI)
EXCELA HEALTH WESTMORELAND REGIONAL HOSPITAL (11637)2014 0 0.30 0.00 (0.00–12.16)2013 0 0.37 0.00 (0.00–9.93)2012 0 0.39 0.00 (0.00–9.39)2011 0 0.68 0.00 (0.00–5.38)2010 0 1.16 0.00 (0.00–3.17)2009 0 1.13 0.00 (0.00–3.23)
ARIA HEALTH (11388)2014 0 0.32 0.00 (0.00–11.63)2013 0 0.44 0.00 (0.00–8.32)2012 2 0.62 3.23 (0.36–11.66)2011 0 0.68 0.00 (0.00–5.39)2010 0 0.56 0.00 (0.00–6.61)2009 1 0.78 1.28 (0.02–7.09)
PENNSYLVANIA HOSPITAL OF THE UNIVERSITY OF PA HEALTH SYS (11448)2014 0 0.33 0.00 (0.00–11.11)2013 2 0.42 4.72 (0.53–17.05)2012 0 0.37 0.00 (0.00–9.97)2011 0 0.39 0.00 (0.00–9.42)2010 0 0.51 0.00 (0.00–7.14)2009 0 0.69 0.00 (0.00–5.35)
LEHIGH VALLEY HOSPITAL - MUHLENBERG (11898)2014 0 0.34 0.00 (0.00–10.88)2013 1 0.46 2.16 (0.03–12.02)2012 0 0.42 0.00 (0.00–8.77)2011 0 0.59 0.00 (0.00–6.18)2010 0 0.75 0.00 (0.00–4.88)2009 1 0.74 1.36 (0.02–7.55)
ST. CHRISTOPHERS HOSPITAL FOR CHILDREN (12290)2014 3 0.40 7.56 (1.52–22.10)2013 0 0.42 0.00 (0.00–8.75)2012 2 0.50 4.02 (0.45–14.51)2011 4 0.67 5.97 (1.61–15.29)2010 1 0.72 1.39 (0.02–7.71)2009 2 0.55 3.61 (0.41–13.05)
CHESTER COUNTY HOSPITAL (12016)2014 0 0.40 0.00 (0.00–9.19)2013 0 0.30 0.00 (0.00–12.43)2012 1 0.61 1.64 (0.02–9.11)2011 1 0.83 1.20 (0.02–6.67)2010 0 0.60 0.00 (0.00–6.11)2009 0 0.57 0.00 (0.00–6.44)
ALBERT EINSTEIN MEDICAL CENTER (10585)2014 0 0.40 0.00 (0.00–9.08)2013 0 0.30 0.00 (0.00–12.18)2012 1 0.22 4.48 (0.06–24.95)2011 0 0.32 0.00 (0.00–11.41)2010 0 0.54 0.00 (0.00–6.76)2009 0 0.43 0.00 (0.00–8.49)
ST. JOSEPH MEDICAL CTR (11961)2014 0 0.50 0.00 (0.00–7.38)2013 3 0.61 4.90 (0.99–14.32)2012 1 0.65 1.54 (0.02–8.59)2011 1 0.41 2.43 (0.03–13.52)2010 1 0.36 2.81 (0.04–15.61)2009 0 0.47 0.00 (0.00–7.79)
Continued on next page . . .
154
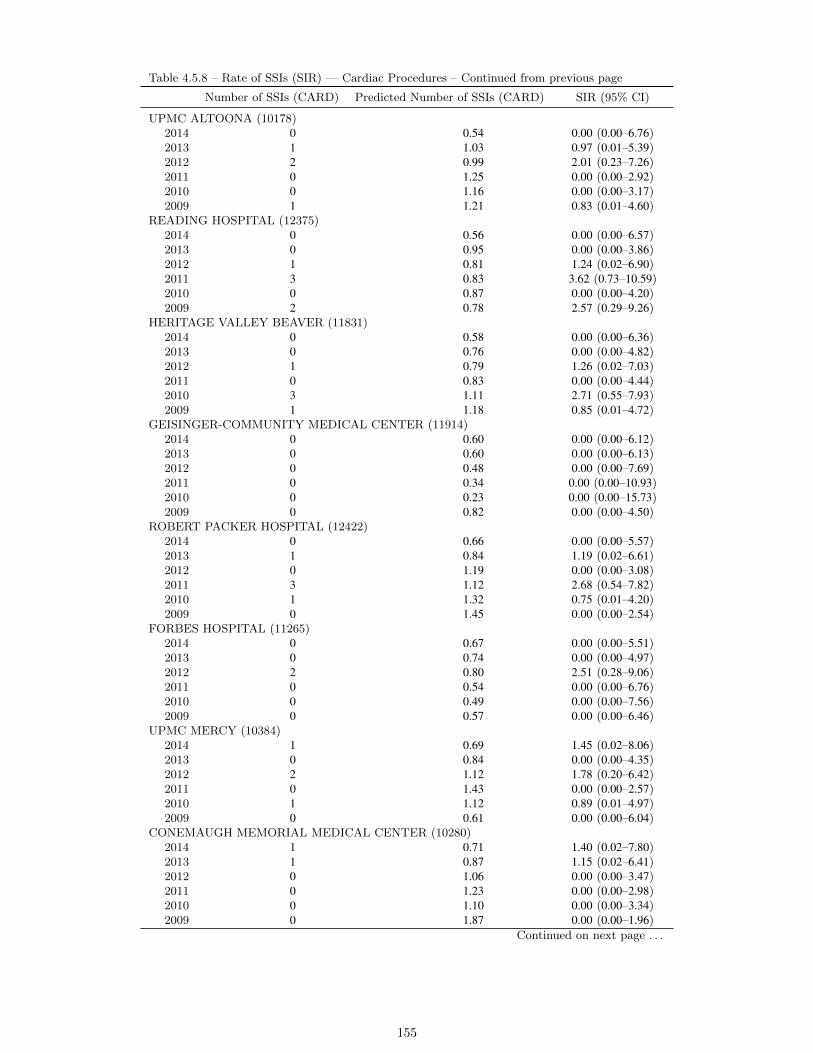
Table 4.5.8 – Rate of SSIs (SIR) — Cardiac Procedures – Continued from previous page
Number of SSIs (CARD) Predicted Number of SSIs (CARD) SIR (95% CI)
UPMC ALTOONA (10178)2014 0 0.54 0.00 (0.00–6.76)2013 1 1.03 0.97 (0.01–5.39)2012 2 0.99 2.01 (0.23–7.26)2011 0 1.25 0.00 (0.00–2.92)2010 0 1.16 0.00 (0.00–3.17)2009 1 1.21 0.83 (0.01–4.60)
READING HOSPITAL (12375)2014 0 0.56 0.00 (0.00–6.57)2013 0 0.95 0.00 (0.00–3.86)2012 1 0.81 1.24 (0.02–6.90)2011 3 0.83 3.62 (0.73–10.59)2010 0 0.87 0.00 (0.00–4.20)2009 2 0.78 2.57 (0.29–9.26)
HERITAGE VALLEY BEAVER (11831)2014 0 0.58 0.00 (0.00–6.36)2013 0 0.76 0.00 (0.00–4.82)2012 1 0.79 1.26 (0.02–7.03)2011 0 0.83 0.00 (0.00–4.44)2010 3 1.11 2.71 (0.55–7.93)2009 1 1.18 0.85 (0.01–4.72)
GEISINGER-COMMUNITY MEDICAL CENTER (11914)2014 0 0.60 0.00 (0.00–6.12)2013 0 0.60 0.00 (0.00–6.13)2012 0 0.48 0.00 (0.00–7.69)2011 0 0.34 0.00 (0.00–10.93)2010 0 0.23 0.00 (0.00–15.73)2009 0 0.82 0.00 (0.00–4.50)
ROBERT PACKER HOSPITAL (12422)2014 0 0.66 0.00 (0.00–5.57)2013 1 0.84 1.19 (0.02–6.61)2012 0 1.19 0.00 (0.00–3.08)2011 3 1.12 2.68 (0.54–7.82)2010 1 1.32 0.75 (0.01–4.20)2009 0 1.45 0.00 (0.00–2.54)
FORBES HOSPITAL (11265)2014 0 0.67 0.00 (0.00–5.51)2013 0 0.74 0.00 (0.00–4.97)2012 2 0.80 2.51 (0.28–9.06)2011 0 0.54 0.00 (0.00–6.76)2010 0 0.49 0.00 (0.00–7.56)2009 0 0.57 0.00 (0.00–6.46)
UPMC MERCY (10384)2014 1 0.69 1.45 (0.02–8.06)2013 0 0.84 0.00 (0.00–4.35)2012 2 1.12 1.78 (0.20–6.42)2011 0 1.43 0.00 (0.00–2.57)2010 1 1.12 0.89 (0.01–4.97)2009 0 0.61 0.00 (0.00–6.04)
CONEMAUGH MEMORIAL MEDICAL CENTER (10280)2014 1 0.71 1.40 (0.02–7.80)2013 1 0.87 1.15 (0.02–6.41)2012 0 1.06 0.00 (0.00–3.47)2011 0 1.23 0.00 (0.00–2.98)2010 0 1.10 0.00 (0.00–3.34)2009 0 1.87 0.00 (0.00–1.96)
Continued on next page . . .
155
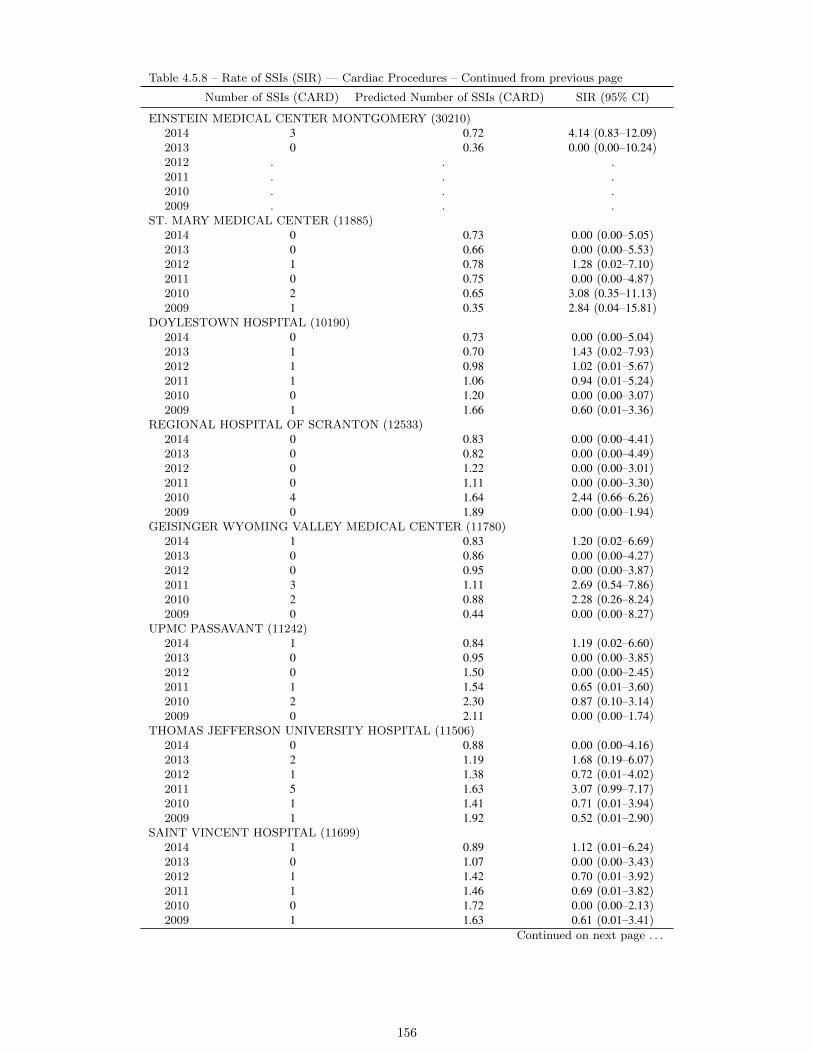
Table 4.5.8 – Rate of SSIs (SIR) — Cardiac Procedures – Continued from previous page
Number of SSIs (CARD) Predicted Number of SSIs (CARD) SIR (95% CI)
EINSTEIN MEDICAL CENTER MONTGOMERY (30210)2014 3 0.72 4.14 (0.83–12.09)2013 0 0.36 0.00 (0.00–10.24)2012 . . .2011 . . .2010 . . .2009 . . .
ST. MARY MEDICAL CENTER (11885)2014 0 0.73 0.00 (0.00–5.05)2013 0 0.66 0.00 (0.00–5.53)2012 1 0.78 1.28 (0.02–7.10)2011 0 0.75 0.00 (0.00–4.87)2010 2 0.65 3.08 (0.35–11.13)2009 1 0.35 2.84 (0.04–15.81)
DOYLESTOWN HOSPITAL (10190)2014 0 0.73 0.00 (0.00–5.04)2013 1 0.70 1.43 (0.02–7.93)2012 1 0.98 1.02 (0.01–5.67)2011 1 1.06 0.94 (0.01–5.24)2010 0 1.20 0.00 (0.00–3.07)2009 1 1.66 0.60 (0.01–3.36)
REGIONAL HOSPITAL OF SCRANTON (12533)2014 0 0.83 0.00 (0.00–4.41)2013 0 0.82 0.00 (0.00–4.49)2012 0 1.22 0.00 (0.00–3.01)2011 0 1.11 0.00 (0.00–3.30)2010 4 1.64 2.44 (0.66–6.26)2009 0 1.89 0.00 (0.00–1.94)
GEISINGER WYOMING VALLEY MEDICAL CENTER (11780)2014 1 0.83 1.20 (0.02–6.69)2013 0 0.86 0.00 (0.00–4.27)2012 0 0.95 0.00 (0.00–3.87)2011 3 1.11 2.69 (0.54–7.86)2010 2 0.88 2.28 (0.26–8.24)2009 0 0.44 0.00 (0.00–8.27)
UPMC PASSAVANT (11242)2014 1 0.84 1.19 (0.02–6.60)2013 0 0.95 0.00 (0.00–3.85)2012 0 1.50 0.00 (0.00–2.45)2011 1 1.54 0.65 (0.01–3.60)2010 2 2.30 0.87 (0.10–3.14)2009 0 2.11 0.00 (0.00–1.74)
THOMAS JEFFERSON UNIVERSITY HOSPITAL (11506)2014 0 0.88 0.00 (0.00–4.16)2013 2 1.19 1.68 (0.19–6.07)2012 1 1.38 0.72 (0.01–4.02)2011 5 1.63 3.07 (0.99–7.17)2010 1 1.41 0.71 (0.01–3.94)2009 1 1.92 0.52 (0.01–2.90)
SAINT VINCENT HOSPITAL (11699)2014 1 0.89 1.12 (0.01–6.24)2013 0 1.07 0.00 (0.00–3.43)2012 1 1.42 0.70 (0.01–3.92)2011 1 1.46 0.69 (0.01–3.82)2010 0 1.72 0.00 (0.00–2.13)2009 1 1.63 0.61 (0.01–3.41)
Continued on next page . . .
156

Table 4.5.8 – Rate of SSIs (SIR) — Cardiac Procedures – Continued from previous page
Number of SSIs (CARD) Predicted Number of SSIs (CARD) SIR (95% CI)
ABINGTON MEMORIAL HOSPITAL (11838)2014 1 0.91 1.09 (0.01–6.09)2013 0 1.20 0.00 (0.00–3.07)2012 1 1.06 0.94 (0.01–5.26)2011 0 1.44 0.00 (0.00–2.55)2010 0 1.19 0.00 (0.00–3.08)2009 2 1.16 1.72 (0.19–6.22)
BUTLER MEMORIAL HOSPITAL (11736)2014 0 0.93 0.00 (0.00–3.96)2013 0 0.74 0.00 (0.00–4.93)2012 0 0.49 0.00 (0.00–7.55)2011 0 0.74 0.00 (0.00–4.96)2010 1 0.56 1.80 (0.02–10.00)2009 0 0.63 0.00 (0.00–5.80)
ST. LUKES HOSPITAL BETHLEHEM (11718)2014 0 0.97 0.00 (0.00–3.79)2013 0 0.85 0.00 (0.00–4.34)2012 2 1.05 1.90 (0.21–6.87)2011 1 1.15 0.87 (0.01–4.83)2010 0 1.37 0.00 (0.00–2.69)2009 0 1.22 0.00 (0.00–3.02)
UPMC HAMOT (11725)2014 0 0.97 0.00 (0.00–3.78)2013 1 1.15 0.87 (0.01–4.83)2012 0 0.89 0.00 (0.00–4.14)2011 2 1.37 1.46 (0.16–5.27)2010 1 0.89 1.13 (0.01–6.28)2009 2 0.90 2.22 (0.25–8.01)
JEFFERSON HOSPITAL (10237)2014 0 1.04 0.00 (0.00–3.53)2013 2 1.10 1.81 (0.20–6.54)2012 0 1.32 0.00 (0.00–2.78)2011 1 1.40 0.72 (0.01–3.98)2010 1 1.64 0.61 (0.01–3.39)2009 1 1.92 0.52 (0.01–2.90)
LANCASTER GENERAL HOSPITAL (10183)2014 2 1.10 1.82 (0.20–6.58)2013 3 1.16 2.60 (0.52–7.58)2012 1 0.99 1.01 (0.01–5.61)2011 1 1.30 0.77 (0.01–4.27)2010 3 1.37 2.19 (0.44–6.41)2009 0 1.57 0.00 (0.00–2.34)
YORK HOSPITAL (10108)2014 1 1.52 0.66 (0.01–3.66)2013 1 1.75 0.57 (0.01–3.17)2012 1 2.18 0.46 (0.01–2.55)2011 3 1.87 1.61 (0.32–4.69)2010 0 1.34 0.00 (0.00–2.74)2009 3 1.60 1.87 (0.38–5.48)
CHILDRENS HOSPITAL OF PITTSBURGH OF UPMC (11640)2014 5 1.53 3.27 (1.06–7.64)2013 2 1.45 1.38 (0.16–5.00)2012 4 1.87 2.14 (0.57–5.47)2011 9 2.13 4.22 (1.92–8.01)2010 1 1.86 0.54 (0.01–2.98)2009 1 2.75 0.36 (0.00–2.02)
Continued on next page . . .
157

Table 4.5.8 – Rate of SSIs (SIR) — Cardiac Procedures – Continued from previous page
Number of SSIs (CARD) Predicted Number of SSIs (CARD) SIR (95% CI)
TEMPLE UNIVERSITY HOSPITAL (12382)2014 1 1.66 0.60 (0.01–3.35)2013 4 1.72 2.33 (0.63–5.96)2012 1 1.62 0.62 (0.01–3.43)2011 0 0.56 0.00 (0.00–6.52)2010 0 0.98 0.00 (0.00–3.73)2009 2 0.90 2.23 (0.25–8.04)
ALLEGHENY GENERAL HOSPITAL (10648)2014 0 1.69 0.00 (0.00–2.17)2013 2 2.52 0.79 (0.09–2.87)2012 0 2.85 0.00 (0.00–1.29)2011 0 2.77 0.00 (0.00–1.32)2010 0 2.37 0.00 (0.00–1.55)2009 1 2.46 0.41 (0.01–2.26)
MAIN LINE HOSPITAL LANKENAU MEDICAL CENTER (11770)2014 3 1.79 1.68 (0.34–4.90)2013 1 1.83 0.55 (0.01–3.04)2012 5 2.23 2.24 (0.72–5.23)2011 2 2.51 0.80 (0.09–2.88)2010 5 2.34 2.13 (0.69–4.98)2009 3 2.81 1.07 (0.21–3.12)
GEISINGER MEDICAL CENTER (11775)2014 2 2.13 0.94 (0.11–3.38)2013 5 2.78 1.80 (0.58–4.19)2012 1 3.22 0.31 (0.00–1.73)2011 5 3.10 1.61 (0.52–3.76)2010 1 2.99 0.33 (0.00–1.86)2009 5 2.07 2.41 (0.78–5.63)
LEHIGH VALLEY HOSPITAL (11884)2014 0 2.31 0.00 (0.00–1.59)2013 3 2.78 1.08 (0.22–3.15)2012 1 3.29 0.30 (0.00–1.69)2011 1 3.79 0.26 (0.00–1.47)2010 2 2.87 0.70 (0.08–2.51)2009 0 2.96 0.00 (0.00–1.24)
CHILDRENS HOSPITAL OF PHILADELPHIA (10306)2014 9 2.33 3.86 (1.76–7.33)2013 8 3.73 2.14 (0.92–4.22)2012 16 5.15 3.11 (1.77–5.05)2011 10 5.56 1.80 (0.86–3.31)2010 17 5.16 3.29 (1.92–5.27)2009 17 2.11 8.07 (4.70–12.92)
MILTON S HERSHEY MEDICAL CENTER (11747)2014 6 2.39 2.51 (0.92–5.46)2013 6 2.40 2.50 (0.91–5.45)2012 2 3.59 0.56 (0.06–2.01)2011 3 3.97 0.76 (0.15–2.21)2010 6 3.83 1.57 (0.57–3.41)2009 3 3.89 0.77 (0.15–2.25)
PINNACLE HEALTH HOSPITALS - HARRISBURG HOSPITAL (34068)2014 0 2.53 0.00 (0.00–1.45)2013 . . .2012 . . .2011 . . .2010 . . .2009 . . .
Continued on next page . . .
158

Table 4.5.8 – Rate of SSIs (SIR) — Cardiac Procedures – Continued from previous page
Number of SSIs (CARD) Predicted Number of SSIs (CARD) SIR (95% CI)
PENN PRESBYTERIAN MEDICAL CENTER (11814)2014 4 2.67 1.50 (0.40–3.84)2013 3 2.90 1.03 (0.21–3.02)2012 2 3.07 0.65 (0.07–2.36)2011 4 4.01 1.00 (0.27–2.56)2010 2 3.59 0.56 (0.06–2.01)2009 1 4.19 0.24 (0.00–1.33)
UPMC PRESBYTERIAN SHADYSIDE - SHADYSIDE (10118)2014 1 3.15 0.32 (0.00–1.77)2013 3 3.92 0.77 (0.15–2.24)2012 2 4.18 0.48 (0.05–1.73)2011 3 4.45 0.67 (0.14–1.97)2010 0 3.01 0.00 (0.00–1.22)2009 11 3.42 3.22 (1.61–5.76)
UPMC PRESBYTERIAN SHADYSIDE (10348)2014 8 3.28 2.44 (1.05–4.81)2013 5 3.70 1.35 (0.44–3.15)2012 1 4.20 0.24 (0.00–1.33)2011 5 3.88 1.29 (0.42–3.01)2010 8 2.46 3.25 (1.40–6.40)2009 4 2.62 1.52 (0.41–3.90)
HOSPITAL OF THE UNIVERSITY OF PENNSYLVANIA (10219)2014 4 5.68 0.70 (0.19–1.80)2013 7 8.61 0.81 (0.33–1.67)2012 12 9.79 1.23 (0.63–2.14)2011 8 10.68 0.75 (0.32–1.48)2010 5 10.26 0.49 (0.16–1.14)2009 8 9.13 0.88 (0.38–1.73)
159

Table 4.5.9: Rate (SIR) of Surgical Site Infections (SSIs) Associated with Coronary Bypass Surgery With Two Incisions(CBGB) by Hospital — Pennsylvania, 2009–2014
Number of SSIs (CBGB) Predicted Number of SSIs (CBGB) SIR (95% CI)
CHILDRENS HOSPITAL OF PHILADELPHIA (10306)2014 . . .2013 0 0.02 0.00 (0.00–241.54)2012 . . .2011 . . .2010 0 0.02 0.00 (0.00–209.85)2009 . . .
LOWER BUCKS HOSPITAL (12390)2014 . . .2013 0 0.02 0.00 (0.00–168.32)2012 0 0.78 0.00 (0.00–4.71)2011 0 0.51 0.00 (0.00–7.20)2010 1 0.97 1.03 (0.01–5.74)2009 0 1.04 0.00 (0.00–3.53)
HOLY SPIRIT HOSPITAL (12387)2014 0 0.32 0.00 (0.00–11.47)2013 0 0.37 0.00 (0.00–9.81)2012 2 1.34 1.50 (0.17–5.41)2011 4 4.13 0.97 (0.26–2.48)2010 3 4.60 0.65 (0.13–1.91)2009 11 6.49 1.70 (0.85–3.04)
SHARON REGIONAL HEALTH SYSTEM (12250)2014 1 0.33 3.05 (0.04–16.97)2013 1 0.65 1.53 (0.02–8.53)2012 0 1.03 0.00 (0.00–3.55)2011 2 1.31 1.53 (0.17–5.53)2010 0 1.23 0.00 (0.00–2.98)2009 4 1.61 2.48 (0.67–6.35)
MERCY FITZGERALD HOSPITAL (11683)2014 1 0.35 2.82 (0.04–15.68)2013 0 0.37 0.00 (0.00–10.05)2012 0 0.59 0.00 (0.00–6.17)2011 1 0.61 1.64 (0.02–9.12)2010 0 0.83 0.00 (0.00–4.42)2009 2 2.30 0.87 (0.10–3.14)
HAHNEMANN UNIVERSITY HOSPITAL (11437)2014 1 0.45 2.21 (0.03–12.28)2013 1 0.78 1.28 (0.02–7.10)2012 2 1.20 1.66 (0.19–6.00)2011 2 1.66 1.20 (0.14–4.35)2010 0 1.75 0.00 (0.00–2.09)2009 1 3.09 0.32 (0.00–1.80)
MAIN LINE HOSPITAL BRYN MAWR (11753)2014 1 0.46 2.18 (0.03–12.13)2013 0 0.88 0.00 (0.00–4.17)2012 0 1.35 0.00 (0.00–2.73)2011 0 1.17 0.00 (0.00–3.14)2010 0 1.25 0.00 (0.00–2.93)2009 0 1.51 0.00 (0.00–2.43)
Continued on next page . . .
160
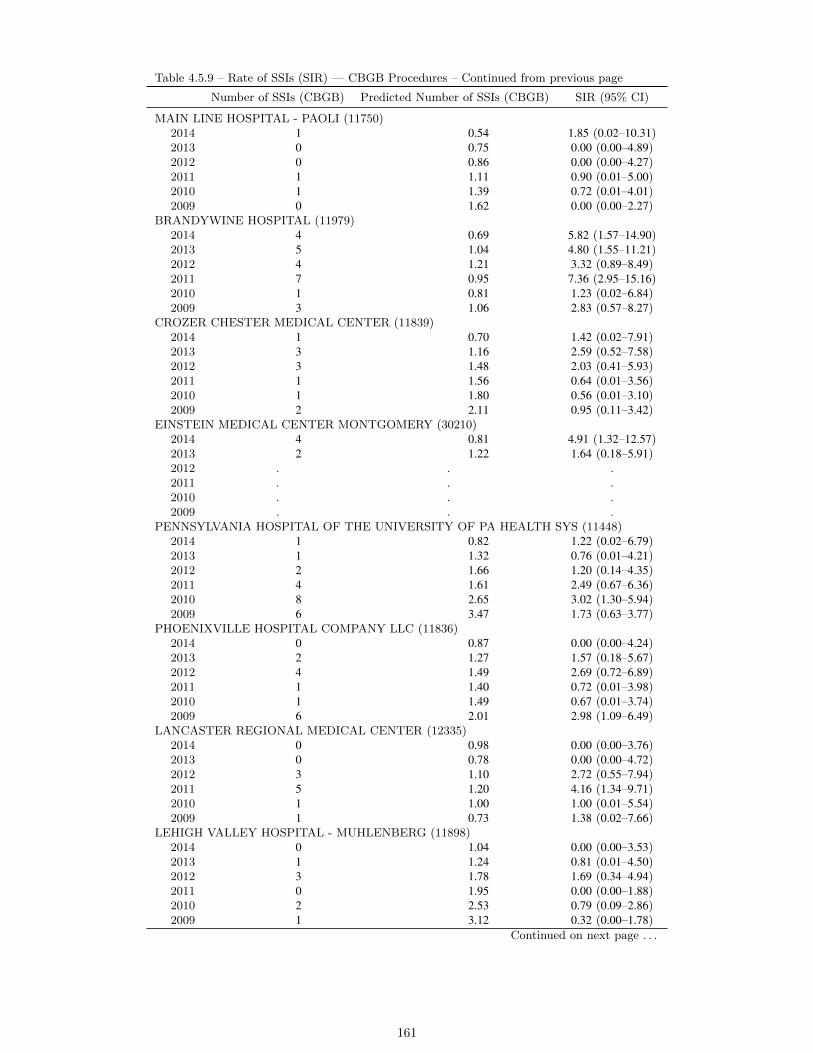
Table 4.5.9 – Rate of SSIs (SIR) — CBGB Procedures – Continued from previous page
Number of SSIs (CBGB) Predicted Number of SSIs (CBGB) SIR (95% CI)
MAIN LINE HOSPITAL - PAOLI (11750)2014 1 0.54 1.85 (0.02–10.31)2013 0 0.75 0.00 (0.00–4.89)2012 0 0.86 0.00 (0.00–4.27)2011 1 1.11 0.90 (0.01–5.00)2010 1 1.39 0.72 (0.01–4.01)2009 0 1.62 0.00 (0.00–2.27)
BRANDYWINE HOSPITAL (11979)2014 4 0.69 5.82 (1.57–14.90)2013 5 1.04 4.80 (1.55–11.21)2012 4 1.21 3.32 (0.89–8.49)2011 7 0.95 7.36 (2.95–15.16)2010 1 0.81 1.23 (0.02–6.84)2009 3 1.06 2.83 (0.57–8.27)
CROZER CHESTER MEDICAL CENTER (11839)2014 1 0.70 1.42 (0.02–7.91)2013 3 1.16 2.59 (0.52–7.58)2012 3 1.48 2.03 (0.41–5.93)2011 1 1.56 0.64 (0.01–3.56)2010 1 1.80 0.56 (0.01–3.10)2009 2 2.11 0.95 (0.11–3.42)
EINSTEIN MEDICAL CENTER MONTGOMERY (30210)2014 4 0.81 4.91 (1.32–12.57)2013 2 1.22 1.64 (0.18–5.91)2012 . . .2011 . . .2010 . . .2009 . . .
PENNSYLVANIA HOSPITAL OF THE UNIVERSITY OF PA HEALTH SYS (11448)2014 1 0.82 1.22 (0.02–6.79)2013 1 1.32 0.76 (0.01–4.21)2012 2 1.66 1.20 (0.14–4.35)2011 4 1.61 2.49 (0.67–6.36)2010 8 2.65 3.02 (1.30–5.94)2009 6 3.47 1.73 (0.63–3.77)
PHOENIXVILLE HOSPITAL COMPANY LLC (11836)2014 0 0.87 0.00 (0.00–4.24)2013 2 1.27 1.57 (0.18–5.67)2012 4 1.49 2.69 (0.72–6.89)2011 1 1.40 0.72 (0.01–3.98)2010 1 1.49 0.67 (0.01–3.74)2009 6 2.01 2.98 (1.09–6.49)
LANCASTER REGIONAL MEDICAL CENTER (12335)2014 0 0.98 0.00 (0.00–3.76)2013 0 0.78 0.00 (0.00–4.72)2012 3 1.10 2.72 (0.55–7.94)2011 5 1.20 4.16 (1.34–9.71)2010 1 1.00 1.00 (0.01–5.54)2009 1 0.73 1.38 (0.02–7.66)
LEHIGH VALLEY HOSPITAL - MUHLENBERG (11898)2014 0 1.04 0.00 (0.00–3.53)2013 1 1.24 0.81 (0.01–4.50)2012 3 1.78 1.69 (0.34–4.94)2011 0 1.95 0.00 (0.00–1.88)2010 2 2.53 0.79 (0.09–2.86)2009 1 3.12 0.32 (0.00–1.78)
Continued on next page . . .
161

Table 4.5.9 – Rate of SSIs (SIR) — CBGB Procedures – Continued from previous page
Number of SSIs (CBGB) Predicted Number of SSIs (CBGB) SIR (95% CI)
JEANES HOSPITAL (11459)2014 0 1.06 0.00 (0.00–3.47)2013 0 1.21 0.00 (0.00–3.04)2012 0 1.37 0.00 (0.00–2.68)2011 1 1.21 0.83 (0.01–4.60)2010 0 1.41 0.00 (0.00–2.61)2009 0 2.05 0.00 (0.00–1.79)
CHESTER COUNTY HOSPITAL (12016)2014 0 1.14 0.00 (0.00–3.21)2013 0 1.50 0.00 (0.00–2.45)2012 1 1.91 0.52 (0.01–2.91)2011 2 1.84 1.09 (0.12–3.93)2010 1 1.27 0.78 (0.01–4.36)2009 2 1.65 1.21 (0.14–4.37)
WEST PENN HOSPITAL (11864)2014 0 1.15 0.00 (0.00–3.20)2013 1 0.35 2.83 (0.04–15.72)2012 . . .2011 . . .2010 3 2.36 1.27 (0.26–3.72)2009 6 4.44 1.35 (0.49–2.94)
WASHINGTON HOSPITAL, THE (11460)2014 0 1.21 0.00 (0.00–3.03)2013 0 1.71 0.00 (0.00–2.14)2012 0 1.69 0.00 (0.00–2.18)2011 2 2.52 0.79 (0.09–2.87)2010 2 2.39 0.84 (0.09–3.02)2009 1 3.51 0.29 (0.00–1.59)
ST. CLAIR MEMORIAL HOSPITAL (10561)2014 0 1.28 0.00 (0.00–2.86)2013 0 1.52 0.00 (0.00–2.41)2012 1 2.33 0.43 (0.01–2.39)2011 0 2.30 0.00 (0.00–1.60)2010 1 2.88 0.35 (0.00–1.93)2009 5 4.00 1.25 (0.40–2.92)
DOYLESTOWN HOSPITAL (10190)2014 1 1.29 0.77 (0.01–4.31)2013 1 1.29 0.77 (0.01–4.30)2012 2 2.15 0.93 (0.10–3.36)2011 2 2.33 0.86 (0.10–3.10)2010 3 2.44 1.23 (0.25–3.59)2009 3 3.27 0.92 (0.18–2.68)
ALBERT EINSTEIN MEDICAL CENTER (10585)2014 1 1.30 0.77 (0.01–4.29)2013 1 1.30 0.77 (0.01–4.29)2012 4 2.06 1.94 (0.52–4.97)2011 8 1.59 5.02 (2.16–9.89)2010 5 1.28 3.90 (1.26–9.09)2009 5 2.09 2.39 (0.77–5.57)
WILLIAMSPORT REGIONAL MEDICAL CENTER (11732)2014 5 1.32 3.80 (1.22–8.87)2013 1 1.76 0.57 (0.01–3.16)2012 1 1.61 0.62 (0.01–3.46)2011 2 1.40 1.42 (0.16–5.14)2010 1 1.29 0.78 (0.01–4.32)2009 9 2.26 3.99 (1.82–7.57)
Continued on next page . . .
162
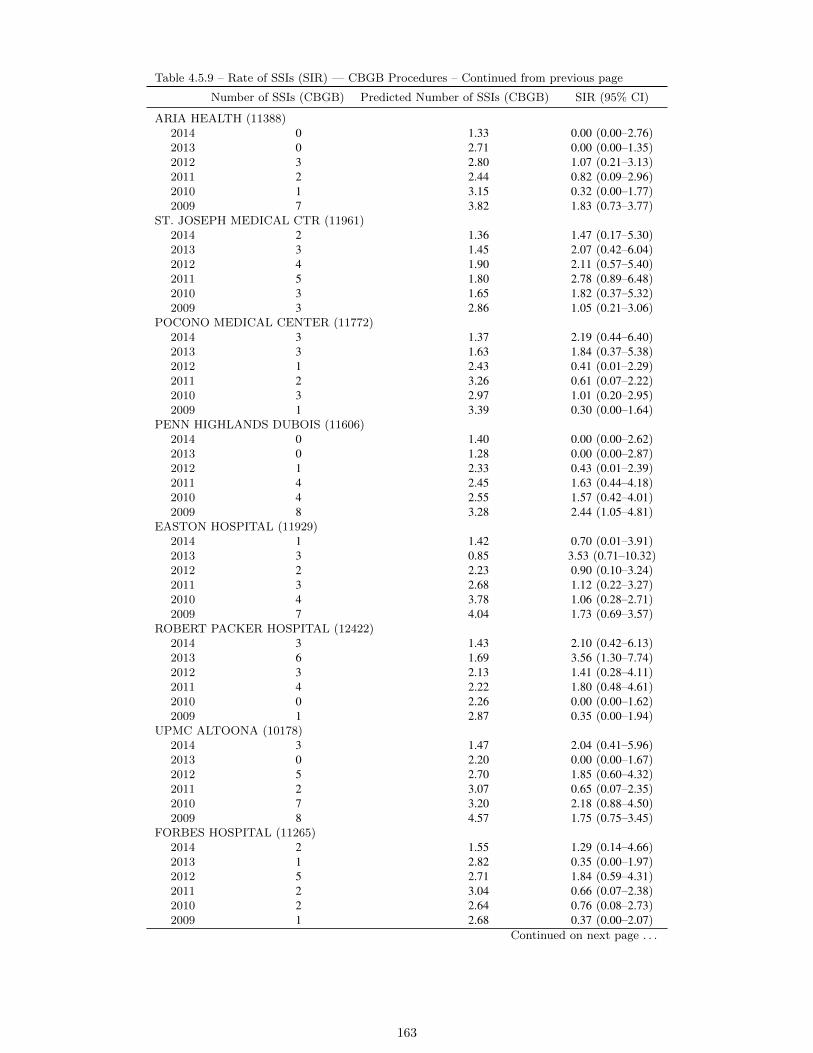
Table 4.5.9 – Rate of SSIs (SIR) — CBGB Procedures – Continued from previous page
Number of SSIs (CBGB) Predicted Number of SSIs (CBGB) SIR (95% CI)
ARIA HEALTH (11388)2014 0 1.33 0.00 (0.00–2.76)2013 0 2.71 0.00 (0.00–1.35)2012 3 2.80 1.07 (0.21–3.13)2011 2 2.44 0.82 (0.09–2.96)2010 1 3.15 0.32 (0.00–1.77)2009 7 3.82 1.83 (0.73–3.77)
ST. JOSEPH MEDICAL CTR (11961)2014 2 1.36 1.47 (0.17–5.30)2013 3 1.45 2.07 (0.42–6.04)2012 4 1.90 2.11 (0.57–5.40)2011 5 1.80 2.78 (0.89–6.48)2010 3 1.65 1.82 (0.37–5.32)2009 3 2.86 1.05 (0.21–3.06)
POCONO MEDICAL CENTER (11772)2014 3 1.37 2.19 (0.44–6.40)2013 3 1.63 1.84 (0.37–5.38)2012 1 2.43 0.41 (0.01–2.29)2011 2 3.26 0.61 (0.07–2.22)2010 3 2.97 1.01 (0.20–2.95)2009 1 3.39 0.30 (0.00–1.64)
PENN HIGHLANDS DUBOIS (11606)2014 0 1.40 0.00 (0.00–2.62)2013 0 1.28 0.00 (0.00–2.87)2012 1 2.33 0.43 (0.01–2.39)2011 4 2.45 1.63 (0.44–4.18)2010 4 2.55 1.57 (0.42–4.01)2009 8 3.28 2.44 (1.05–4.81)
EASTON HOSPITAL (11929)2014 1 1.42 0.70 (0.01–3.91)2013 3 0.85 3.53 (0.71–10.32)2012 2 2.23 0.90 (0.10–3.24)2011 3 2.68 1.12 (0.22–3.27)2010 4 3.78 1.06 (0.28–2.71)2009 7 4.04 1.73 (0.69–3.57)
ROBERT PACKER HOSPITAL (12422)2014 3 1.43 2.10 (0.42–6.13)2013 6 1.69 3.56 (1.30–7.74)2012 3 2.13 1.41 (0.28–4.11)2011 4 2.22 1.80 (0.48–4.61)2010 0 2.26 0.00 (0.00–1.62)2009 1 2.87 0.35 (0.00–1.94)
UPMC ALTOONA (10178)2014 3 1.47 2.04 (0.41–5.96)2013 0 2.20 0.00 (0.00–1.67)2012 5 2.70 1.85 (0.60–4.32)2011 2 3.07 0.65 (0.07–2.35)2010 7 3.20 2.18 (0.88–4.50)2009 8 4.57 1.75 (0.75–3.45)
FORBES HOSPITAL (11265)2014 2 1.55 1.29 (0.14–4.66)2013 1 2.82 0.35 (0.00–1.97)2012 5 2.71 1.84 (0.59–4.31)2011 2 3.04 0.66 (0.07–2.38)2010 2 2.64 0.76 (0.08–2.73)2009 1 2.68 0.37 (0.00–2.07)
Continued on next page . . .
163
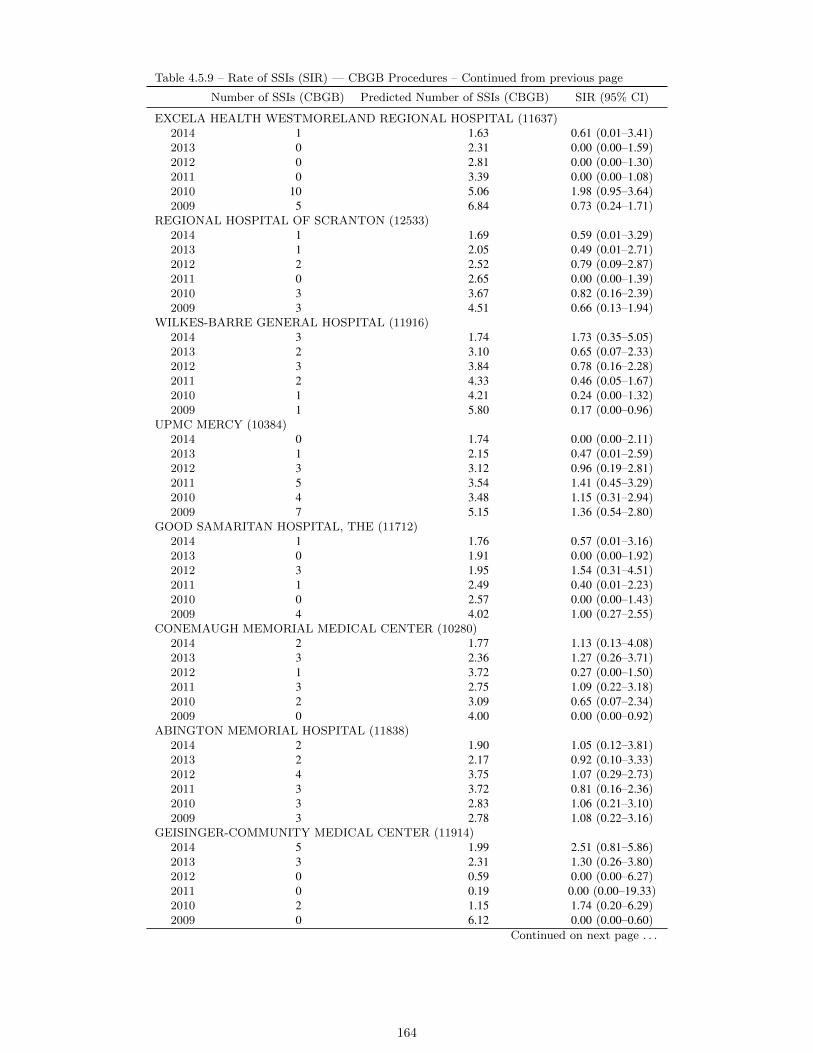
Table 4.5.9 – Rate of SSIs (SIR) — CBGB Procedures – Continued from previous page
Number of SSIs (CBGB) Predicted Number of SSIs (CBGB) SIR (95% CI)
EXCELA HEALTH WESTMORELAND REGIONAL HOSPITAL (11637)2014 1 1.63 0.61 (0.01–3.41)2013 0 2.31 0.00 (0.00–1.59)2012 0 2.81 0.00 (0.00–1.30)2011 0 3.39 0.00 (0.00–1.08)2010 10 5.06 1.98 (0.95–3.64)2009 5 6.84 0.73 (0.24–1.71)
REGIONAL HOSPITAL OF SCRANTON (12533)2014 1 1.69 0.59 (0.01–3.29)2013 1 2.05 0.49 (0.01–2.71)2012 2 2.52 0.79 (0.09–2.87)2011 0 2.65 0.00 (0.00–1.39)2010 3 3.67 0.82 (0.16–2.39)2009 3 4.51 0.66 (0.13–1.94)
WILKES-BARRE GENERAL HOSPITAL (11916)2014 3 1.74 1.73 (0.35–5.05)2013 2 3.10 0.65 (0.07–2.33)2012 3 3.84 0.78 (0.16–2.28)2011 2 4.33 0.46 (0.05–1.67)2010 1 4.21 0.24 (0.00–1.32)2009 1 5.80 0.17 (0.00–0.96)
UPMC MERCY (10384)2014 0 1.74 0.00 (0.00–2.11)2013 1 2.15 0.47 (0.01–2.59)2012 3 3.12 0.96 (0.19–2.81)2011 5 3.54 1.41 (0.45–3.29)2010 4 3.48 1.15 (0.31–2.94)2009 7 5.15 1.36 (0.54–2.80)
GOOD SAMARITAN HOSPITAL, THE (11712)2014 1 1.76 0.57 (0.01–3.16)2013 0 1.91 0.00 (0.00–1.92)2012 3 1.95 1.54 (0.31–4.51)2011 1 2.49 0.40 (0.01–2.23)2010 0 2.57 0.00 (0.00–1.43)2009 4 4.02 1.00 (0.27–2.55)
CONEMAUGH MEMORIAL MEDICAL CENTER (10280)2014 2 1.77 1.13 (0.13–4.08)2013 3 2.36 1.27 (0.26–3.71)2012 1 3.72 0.27 (0.00–1.50)2011 3 2.75 1.09 (0.22–3.18)2010 2 3.09 0.65 (0.07–2.34)2009 0 4.00 0.00 (0.00–0.92)
ABINGTON MEMORIAL HOSPITAL (11838)2014 2 1.90 1.05 (0.12–3.81)2013 2 2.17 0.92 (0.10–3.33)2012 4 3.75 1.07 (0.29–2.73)2011 3 3.72 0.81 (0.16–2.36)2010 3 2.83 1.06 (0.21–3.10)2009 3 2.78 1.08 (0.22–3.16)
GEISINGER-COMMUNITY MEDICAL CENTER (11914)2014 5 1.99 2.51 (0.81–5.86)2013 3 2.31 1.30 (0.26–3.80)2012 0 0.59 0.00 (0.00–6.27)2011 0 0.19 0.00 (0.00–19.33)2010 2 1.15 1.74 (0.20–6.29)2009 0 6.12 0.00 (0.00–0.60)
Continued on next page . . .
164
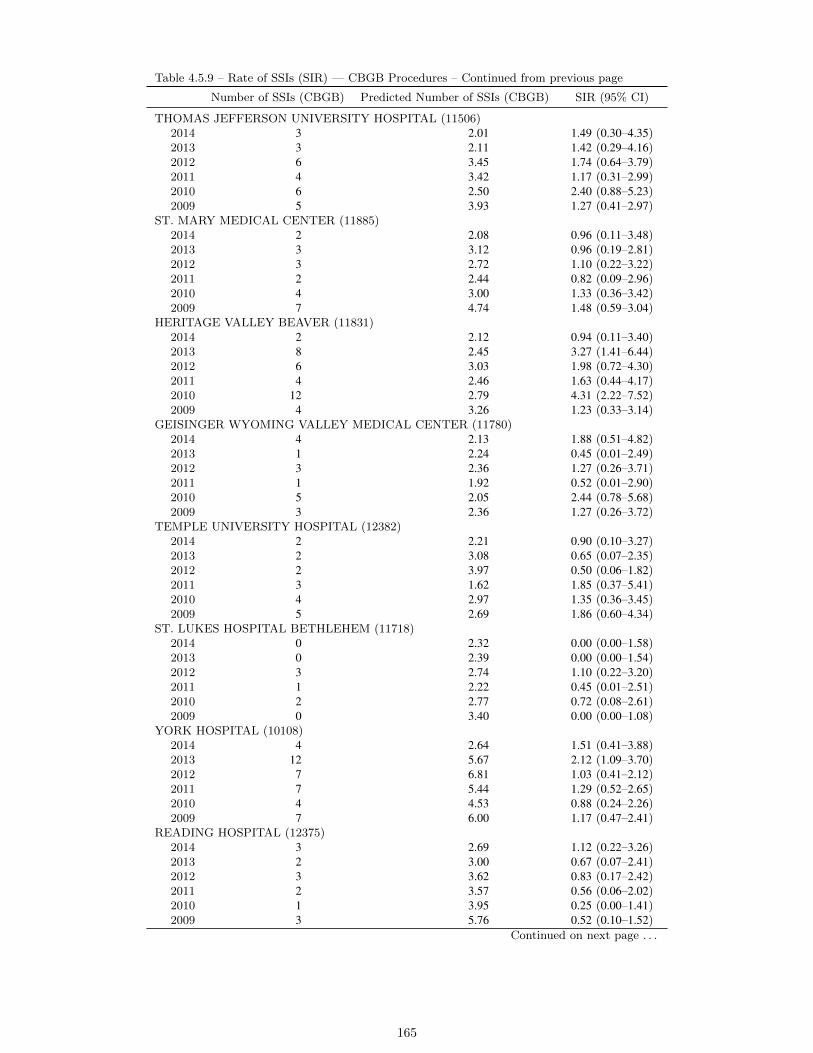
Table 4.5.9 – Rate of SSIs (SIR) — CBGB Procedures – Continued from previous page
Number of SSIs (CBGB) Predicted Number of SSIs (CBGB) SIR (95% CI)
THOMAS JEFFERSON UNIVERSITY HOSPITAL (11506)2014 3 2.01 1.49 (0.30–4.35)2013 3 2.11 1.42 (0.29–4.16)2012 6 3.45 1.74 (0.64–3.79)2011 4 3.42 1.17 (0.31–2.99)2010 6 2.50 2.40 (0.88–5.23)2009 5 3.93 1.27 (0.41–2.97)
ST. MARY MEDICAL CENTER (11885)2014 2 2.08 0.96 (0.11–3.48)2013 3 3.12 0.96 (0.19–2.81)2012 3 2.72 1.10 (0.22–3.22)2011 2 2.44 0.82 (0.09–2.96)2010 4 3.00 1.33 (0.36–3.42)2009 7 4.74 1.48 (0.59–3.04)
HERITAGE VALLEY BEAVER (11831)2014 2 2.12 0.94 (0.11–3.40)2013 8 2.45 3.27 (1.41–6.44)2012 6 3.03 1.98 (0.72–4.30)2011 4 2.46 1.63 (0.44–4.17)2010 12 2.79 4.31 (2.22–7.52)2009 4 3.26 1.23 (0.33–3.14)
GEISINGER WYOMING VALLEY MEDICAL CENTER (11780)2014 4 2.13 1.88 (0.51–4.82)2013 1 2.24 0.45 (0.01–2.49)2012 3 2.36 1.27 (0.26–3.71)2011 1 1.92 0.52 (0.01–2.90)2010 5 2.05 2.44 (0.78–5.68)2009 3 2.36 1.27 (0.26–3.72)
TEMPLE UNIVERSITY HOSPITAL (12382)2014 2 2.21 0.90 (0.10–3.27)2013 2 3.08 0.65 (0.07–2.35)2012 2 3.97 0.50 (0.06–1.82)2011 3 1.62 1.85 (0.37–5.41)2010 4 2.97 1.35 (0.36–3.45)2009 5 2.69 1.86 (0.60–4.34)
ST. LUKES HOSPITAL BETHLEHEM (11718)2014 0 2.32 0.00 (0.00–1.58)2013 0 2.39 0.00 (0.00–1.54)2012 3 2.74 1.10 (0.22–3.20)2011 1 2.22 0.45 (0.01–2.51)2010 2 2.77 0.72 (0.08–2.61)2009 0 3.40 0.00 (0.00–1.08)
YORK HOSPITAL (10108)2014 4 2.64 1.51 (0.41–3.88)2013 12 5.67 2.12 (1.09–3.70)2012 7 6.81 1.03 (0.41–2.12)2011 7 5.44 1.29 (0.52–2.65)2010 4 4.53 0.88 (0.24–2.26)2009 7 6.00 1.17 (0.47–2.41)
READING HOSPITAL (12375)2014 3 2.69 1.12 (0.22–3.26)2013 2 3.00 0.67 (0.07–2.41)2012 3 3.62 0.83 (0.17–2.42)2011 2 3.57 0.56 (0.06–2.02)2010 1 3.95 0.25 (0.00–1.41)2009 3 5.76 0.52 (0.10–1.52)
Continued on next page . . .
165
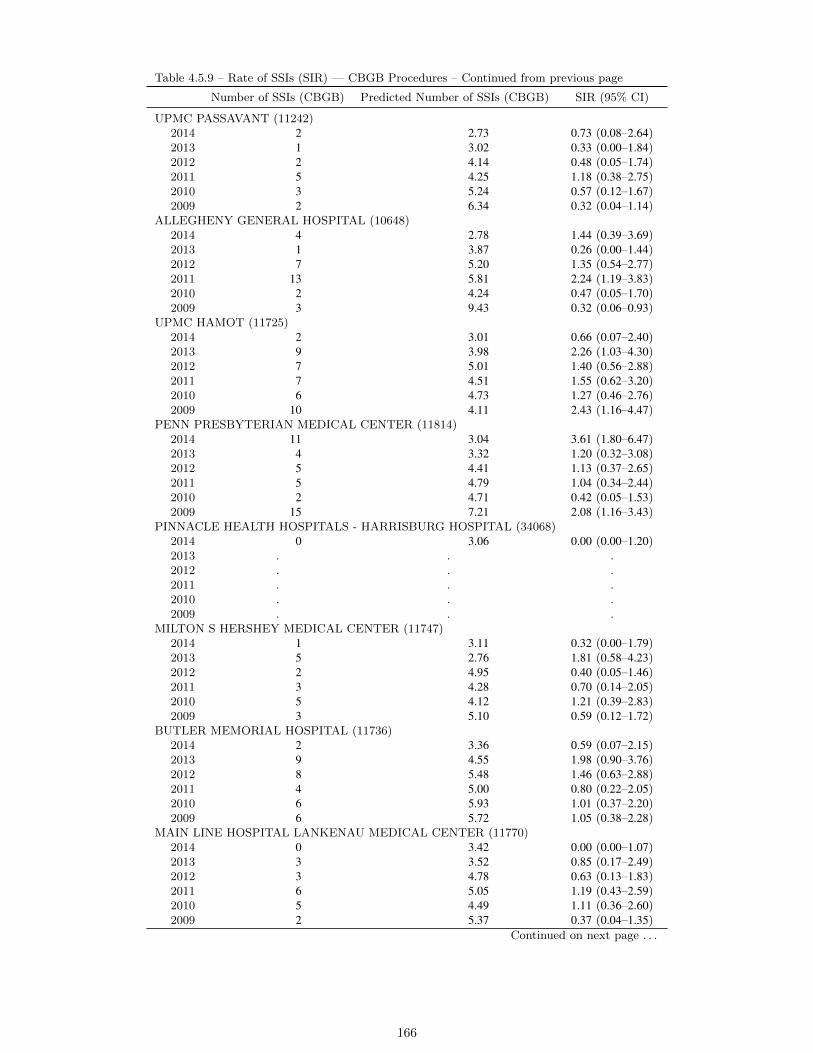
Table 4.5.9 – Rate of SSIs (SIR) — CBGB Procedures – Continued from previous page
Number of SSIs (CBGB) Predicted Number of SSIs (CBGB) SIR (95% CI)
UPMC PASSAVANT (11242)2014 2 2.73 0.73 (0.08–2.64)2013 1 3.02 0.33 (0.00–1.84)2012 2 4.14 0.48 (0.05–1.74)2011 5 4.25 1.18 (0.38–2.75)2010 3 5.24 0.57 (0.12–1.67)2009 2 6.34 0.32 (0.04–1.14)
ALLEGHENY GENERAL HOSPITAL (10648)2014 4 2.78 1.44 (0.39–3.69)2013 1 3.87 0.26 (0.00–1.44)2012 7 5.20 1.35 (0.54–2.77)2011 13 5.81 2.24 (1.19–3.83)2010 2 4.24 0.47 (0.05–1.70)2009 3 9.43 0.32 (0.06–0.93)
UPMC HAMOT (11725)2014 2 3.01 0.66 (0.07–2.40)2013 9 3.98 2.26 (1.03–4.30)2012 7 5.01 1.40 (0.56–2.88)2011 7 4.51 1.55 (0.62–3.20)2010 6 4.73 1.27 (0.46–2.76)2009 10 4.11 2.43 (1.16–4.47)
PENN PRESBYTERIAN MEDICAL CENTER (11814)2014 11 3.04 3.61 (1.80–6.47)2013 4 3.32 1.20 (0.32–3.08)2012 5 4.41 1.13 (0.37–2.65)2011 5 4.79 1.04 (0.34–2.44)2010 2 4.71 0.42 (0.05–1.53)2009 15 7.21 2.08 (1.16–3.43)
PINNACLE HEALTH HOSPITALS - HARRISBURG HOSPITAL (34068)2014 0 3.06 0.00 (0.00–1.20)2013 . . .2012 . . .2011 . . .2010 . . .2009 . . .
MILTON S HERSHEY MEDICAL CENTER (11747)2014 1 3.11 0.32 (0.00–1.79)2013 5 2.76 1.81 (0.58–4.23)2012 2 4.95 0.40 (0.05–1.46)2011 3 4.28 0.70 (0.14–2.05)2010 5 4.12 1.21 (0.39–2.83)2009 3 5.10 0.59 (0.12–1.72)
BUTLER MEMORIAL HOSPITAL (11736)2014 2 3.36 0.59 (0.07–2.15)2013 9 4.55 1.98 (0.90–3.76)2012 8 5.48 1.46 (0.63–2.88)2011 4 5.00 0.80 (0.22–2.05)2010 6 5.93 1.01 (0.37–2.20)2009 6 5.72 1.05 (0.38–2.28)
MAIN LINE HOSPITAL LANKENAU MEDICAL CENTER (11770)2014 0 3.42 0.00 (0.00–1.07)2013 3 3.52 0.85 (0.17–2.49)2012 3 4.78 0.63 (0.13–1.83)2011 6 5.05 1.19 (0.43–2.59)2010 5 4.49 1.11 (0.36–2.60)2009 2 5.37 0.37 (0.04–1.35)
Continued on next page . . .
166
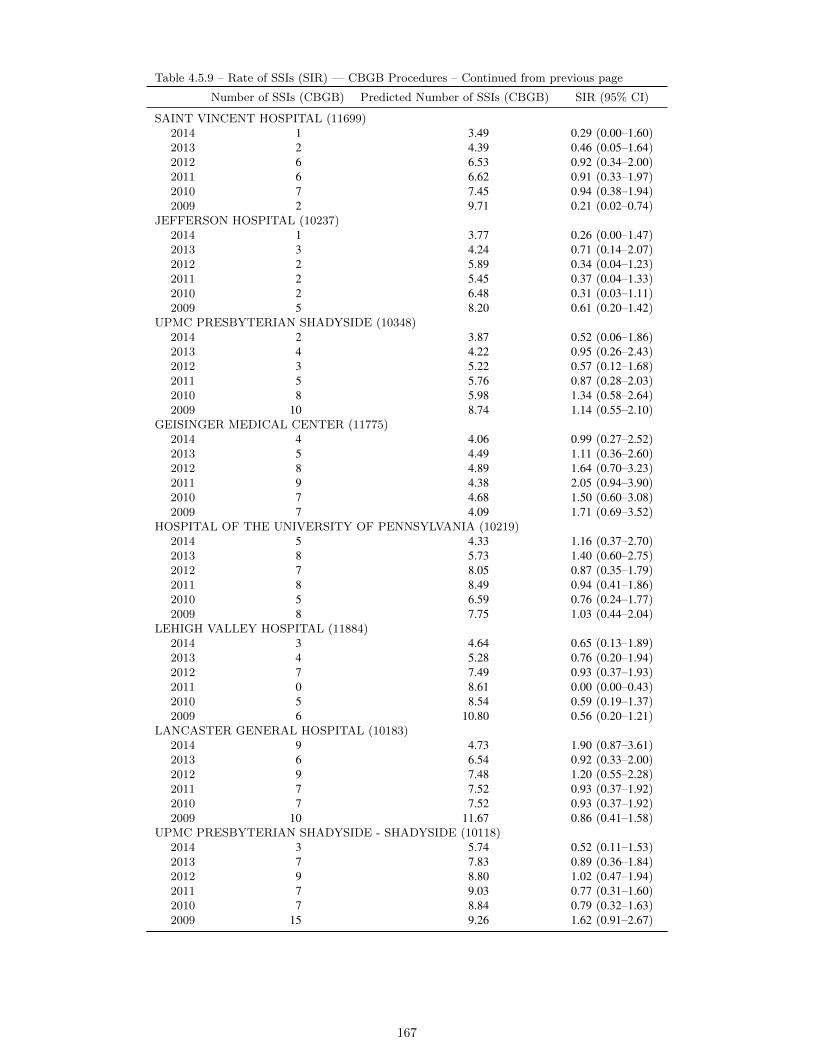
Table 4.5.9 – Rate of SSIs (SIR) — CBGB Procedures – Continued from previous page
Number of SSIs (CBGB) Predicted Number of SSIs (CBGB) SIR (95% CI)
SAINT VINCENT HOSPITAL (11699)2014 1 3.49 0.29 (0.00–1.60)2013 2 4.39 0.46 (0.05–1.64)2012 6 6.53 0.92 (0.34–2.00)2011 6 6.62 0.91 (0.33–1.97)2010 7 7.45 0.94 (0.38–1.94)2009 2 9.71 0.21 (0.02–0.74)
JEFFERSON HOSPITAL (10237)2014 1 3.77 0.26 (0.00–1.47)2013 3 4.24 0.71 (0.14–2.07)2012 2 5.89 0.34 (0.04–1.23)2011 2 5.45 0.37 (0.04–1.33)2010 2 6.48 0.31 (0.03–1.11)2009 5 8.20 0.61 (0.20–1.42)
UPMC PRESBYTERIAN SHADYSIDE (10348)2014 2 3.87 0.52 (0.06–1.86)2013 4 4.22 0.95 (0.26–2.43)2012 3 5.22 0.57 (0.12–1.68)2011 5 5.76 0.87 (0.28–2.03)2010 8 5.98 1.34 (0.58–2.64)2009 10 8.74 1.14 (0.55–2.10)
GEISINGER MEDICAL CENTER (11775)2014 4 4.06 0.99 (0.27–2.52)2013 5 4.49 1.11 (0.36–2.60)2012 8 4.89 1.64 (0.70–3.23)2011 9 4.38 2.05 (0.94–3.90)2010 7 4.68 1.50 (0.60–3.08)2009 7 4.09 1.71 (0.69–3.52)
HOSPITAL OF THE UNIVERSITY OF PENNSYLVANIA (10219)2014 5 4.33 1.16 (0.37–2.70)2013 8 5.73 1.40 (0.60–2.75)2012 7 8.05 0.87 (0.35–1.79)2011 8 8.49 0.94 (0.41–1.86)2010 5 6.59 0.76 (0.24–1.77)2009 8 7.75 1.03 (0.44–2.04)
LEHIGH VALLEY HOSPITAL (11884)2014 3 4.64 0.65 (0.13–1.89)2013 4 5.28 0.76 (0.20–1.94)2012 7 7.49 0.93 (0.37–1.93)2011 0 8.61 0.00 (0.00–0.43)2010 5 8.54 0.59 (0.19–1.37)2009 6 10.80 0.56 (0.20–1.21)
LANCASTER GENERAL HOSPITAL (10183)2014 9 4.73 1.90 (0.87–3.61)2013 6 6.54 0.92 (0.33–2.00)2012 9 7.48 1.20 (0.55–2.28)2011 7 7.52 0.93 (0.37–1.92)2010 7 7.52 0.93 (0.37–1.92)2009 10 11.67 0.86 (0.41–1.58)
UPMC PRESBYTERIAN SHADYSIDE - SHADYSIDE (10118)2014 3 5.74 0.52 (0.11–1.53)2013 7 7.83 0.89 (0.36–1.84)2012 9 8.80 1.02 (0.47–1.94)2011 7 9.03 0.77 (0.31–1.60)2010 7 8.84 0.79 (0.32–1.63)2009 15 9.26 1.62 (0.91–2.67)
167

Table 4.5.10: Rate (SIR) of Surgical Site Infections (SSIs) Associated with Coronary Bypass Surgery With One Incision(CBGC) by Hospital — Pennsylvania, 2009–2014
Number of SSIs (CBGC) Predicted Number of SSIs (CBGC) SIR (95% CI)
WILLIAMSPORT REGIONAL MEDICAL CENTER (11732)2014 . . .2013 0 0.15 0.00 (0.00–25.10)2012 1 0.02 52.43 (0.69–291.71)2011 0 0.03 0.00 (0.00–108.85)2010 0 0.04 0.00 (0.00–91.05)2009 0 0.06 0.00 (0.00–59.26)
LOWER BUCKS HOSPITAL (12390)2014 . . .2013 . . .2012 0 0.02 0.00 (0.00–173.01)2011 . . .2010 0 0.08 0.00 (0.00–47.99)2009 0 0.41 0.00 (0.00–8.86)
CHILDRENS HOSPITAL OF PITTSBURGH OF UPMC (11640)2014 0 0.01 0.00 (0.00–534.93)2013 . . .2012 . . .2011 . . .2010 . . .2009 . . .
SHARON REGIONAL HEALTH SYSTEM (12250)2014 0 0.01 0.00 (0.00–534.93)2013 0 0.15 0.00 (0.00–24.05)2012 0 0.10 0.00 (0.00–36.05)2011 0 0.07 0.00 (0.00–52.47)2010 0 0.01 0.00 (0.00–266.30)2009 0 0.03 0.00 (0.00–134.34)
MAIN LINE HOSPITAL - PAOLI (11750)2014 0 0.01 0.00 (0.00–342.97)2013 0 0.02 0.00 (0.00–170.97)2012 0 0.06 0.00 (0.00–64.10)2011 0 0.00 0.00 (0.00–1, 023.40)2010 0 0.08 0.00 (0.00–44.38)2009 0 0.08 0.00 (0.00–48.55)
JEFFERSON HOSPITAL (10237)2014 0 0.01 0.00 (0.00–267.47)2013 0 0.03 0.00 (0.00–113.98)2012 0 0.12 0.00 (0.00–31.47)2011 0 0.01 0.00 (0.00–276.52)2010 0 0.11 0.00 (0.00–33.93)2009 0 0.14 0.00 (0.00–26.87)
WASHINGTON HOSPITAL, THE (11460)2014 0 0.01 0.00 (0.00–267.47)2013 0 0.10 0.00 (0.00–37.99)2012 0 0.70 0.00 (0.00–5.28)2011 0 0.17 0.00 (0.00–21.27)2010 0 0.22 0.00 (0.00–16.80)2009 0 0.30 0.00 (0.00–12.18)
Continued on next page . . .
168

Table 4.5.10 – Rate of SSIs (SIR) — CBGC Procedures – Continued from previous page
Number of SSIs (CBGC) Predicted Number of SSIs (CBGC) SIR (95% CI)
CHESTER COUNTY HOSPITAL (12016)2014 0 0.01 0.00 (0.00–267.47)2013 0 0.09 0.00 (0.00–38.81)2012 0 0.12 0.00 (0.00–31.47)2011 1 0.17 5.85 (0.08–32.54)2010 1 0.41 2.42 (0.03–13.45)2009 1 0.42 2.40 (0.03–13.33)
HAHNEMANN UNIVERSITY HOSPITAL (11437)2014 0 0.02 0.00 (0.00–208.98)2013 0 0.05 0.00 (0.00–68.39)2012 0 0.11 0.00 (0.00–32.05)2011 0 0.09 0.00 (0.00–40.60)2010 0 0.21 0.00 (0.00–17.46)2009 0 0.20 0.00 (0.00–18.61)
EASTON HOSPITAL (11929)2014 0 0.02 0.00 (0.00–208.98)2013 0 0.80 0.00 (0.00–4.59)2012 0 0.21 0.00 (0.00–17.30)2011 0 0.03 0.00 (0.00–138.26)2010 . . .2009 . . .
BRANDYWINE HOSPITAL (11979)2014 1 0.02 48.61 (0.64–270.47)2013 1 0.06 15.54 (0.20–86.45)2012 0 0.08 0.00 (0.00–48.08)2011 0 0.03 0.00 (0.00–138.26)2010 0 0.12 0.00 (0.00–29.59)2009 0 0.04 0.00 (0.00–89.56)
GOOD SAMARITAN HOSPITAL, THE (11712)2014 0 0.02 0.00 (0.00–171.48)2013 0 0.07 0.00 (0.00–53.38)2012 0 0.06 0.00 (0.00–59.67)2011 . . .2010 0 0.01 0.00 (0.00–287.95)2009 0 0.06 0.00 (0.00–59.26)
ST. CLAIR MEMORIAL HOSPITAL (10561)2014 0 0.03 0.00 (0.00–133.73)2013 0 0.02 0.00 (0.00–170.97)2012 0 0.10 0.00 (0.00–38.46)2011 0 0.05 0.00 (0.00–69.13)2010 0 0.06 0.00 (0.00–66.58)2009 0 0.01 0.00 (0.00–268.69)
MAIN LINE HOSPITAL BRYN MAWR (11753)2014 0 0.03 0.00 (0.00–133.73)2013 . . .2012 0 0.08 0.00 (0.00–48.08)2011 0 0.03 0.00 (0.00–121.80)2010 0 0.10 0.00 (0.00–38.04)2009 0 0.11 0.00 (0.00–34.59)
JEANES HOSPITAL (11459)2014 0 0.03 0.00 (0.00–117.32)2013 0 0.07 0.00 (0.00–50.21)2012 . . .2011 0 0.03 0.00 (0.00–138.26)2010 . . .2009 0 0.05 0.00 (0.00–67.17)
Continued on next page . . .
169

Table 4.5.10 – Rate of SSIs (SIR) — CBGC Procedures – Continued from previous page
Number of SSIs (CBGC) Predicted Number of SSIs (CBGC) SIR (95% CI)
PHOENIXVILLE HOSPITAL COMPANY LLC (11836)2014 0 0.03 0.00 (0.00–117.32)2013 0 0.11 0.00 (0.00–34.85)2012 0 0.14 0.00 (0.00–27.04)2011 0 0.07 0.00 (0.00–55.30)2010 0 0.18 0.00 (0.00–20.48)2009 0 0.32 0.00 (0.00–11.42)
LEHIGH VALLEY HOSPITAL - MUHLENBERG (11898)2014 0 0.03 0.00 (0.00–117.32)2013 0 0.13 0.00 (0.00–27.99)2012 0 0.10 0.00 (0.00–37.62)2011 0 0.07 0.00 (0.00–52.47)2010 0 0.05 0.00 (0.00–67.85)2009 0 0.05 0.00 (0.00–67.17)
DOYLESTOWN HOSPITAL (10190)2014 0 0.03 0.00 (0.00–106.99)2013 0 0.06 0.00 (0.00–56.99)2012 0 0.15 0.00 (0.00–23.71)2011 0 0.10 0.00 (0.00–38.03)2010 1 0.07 14.52 (0.19–80.79)2009 0 0.05 0.00 (0.00–67.17)
PENN HIGHLANDS DUBOIS (11606)2014 0 0.03 0.00 (0.00–106.99)2013 0 0.06 0.00 (0.00–56.99)2012 0 0.15 0.00 (0.00–24.04)2011 0 0.10 0.00 (0.00–38.03)2010 1 0.11 9.07 (0.12–50.49)2009 0 0.05 0.00 (0.00–67.17)
POCONO MEDICAL CENTER (11772)2014 0 0.03 0.00 (0.00–106.99)2013 0 0.18 0.00 (0.00–20.84)2012 . . .2011 . . .2010 . . .2009 . . .
REGIONAL HOSPITAL OF SCRANTON (12533)2014 0 0.04 0.00 (0.00–89.16)2013 0 0.13 0.00 (0.00–27.99)2012 0 0.22 0.00 (0.00–16.64)2011 0 0.12 0.00 (0.00–29.83)2010 0 0.41 0.00 (0.00–9.04)2009 0 0.32 0.00 (0.00–11.61)
UPMC HAMOT (11725)2014 0 0.04 0.00 (0.00–81.55)2013 0 0.08 0.00 (0.00–46.18)2012 4 2.73 1.47 (0.39–3.75)2011 3 2.02 1.48 (0.30–4.33)2010 3 1.99 1.51 (0.30–4.41)2009 1 2.56 0.39 (0.01–2.17)
GEISINGER WYOMING VALLEY MEDICAL CENTER (11780)2014 0 0.04 0.00 (0.00–81.55)2013 0 0.22 0.00 (0.00–16.43)2012 0 0.21 0.00 (0.00–17.14)2011 1 0.04 23.05 (0.30–128.26)2010 0 0.15 0.00 (0.00–24.89)2009 0 0.07 0.00 (0.00–53.74)
Continued on next page . . .
170
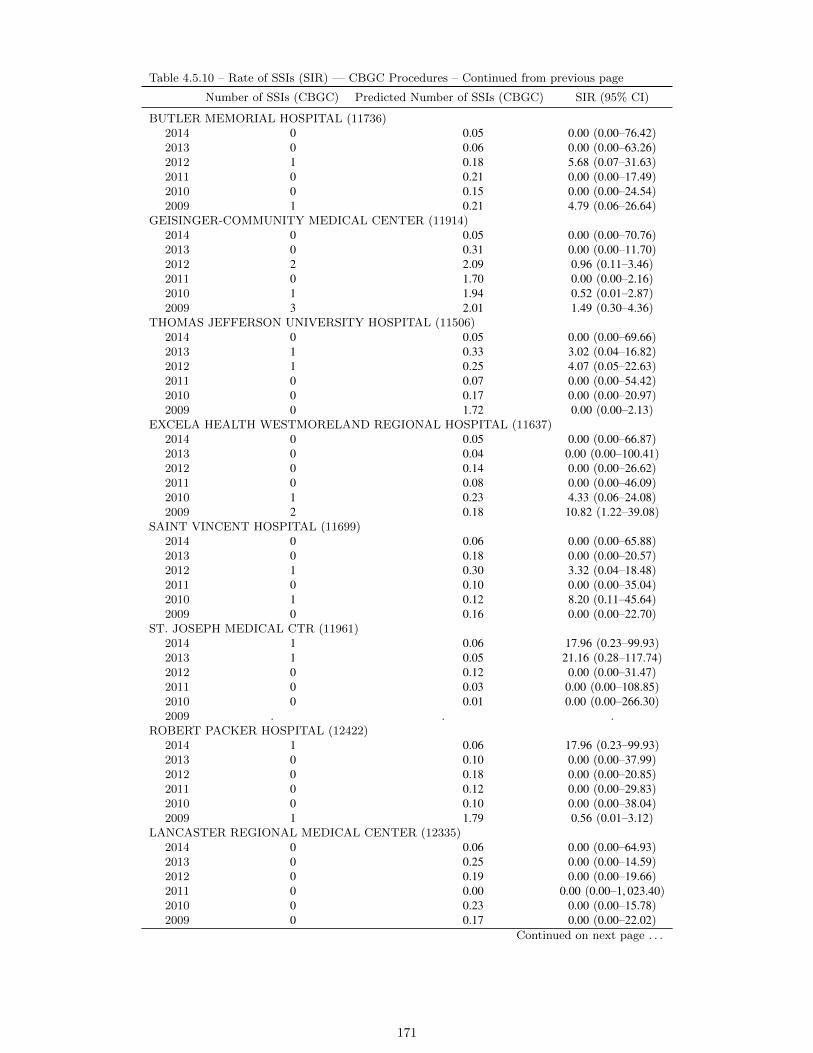
Table 4.5.10 – Rate of SSIs (SIR) — CBGC Procedures – Continued from previous page
Number of SSIs (CBGC) Predicted Number of SSIs (CBGC) SIR (95% CI)
BUTLER MEMORIAL HOSPITAL (11736)2014 0 0.05 0.00 (0.00–76.42)2013 0 0.06 0.00 (0.00–63.26)2012 1 0.18 5.68 (0.07–31.63)2011 0 0.21 0.00 (0.00–17.49)2010 0 0.15 0.00 (0.00–24.54)2009 1 0.21 4.79 (0.06–26.64)
GEISINGER-COMMUNITY MEDICAL CENTER (11914)2014 0 0.05 0.00 (0.00–70.76)2013 0 0.31 0.00 (0.00–11.70)2012 2 2.09 0.96 (0.11–3.46)2011 0 1.70 0.00 (0.00–2.16)2010 1 1.94 0.52 (0.01–2.87)2009 3 2.01 1.49 (0.30–4.36)
THOMAS JEFFERSON UNIVERSITY HOSPITAL (11506)2014 0 0.05 0.00 (0.00–69.66)2013 1 0.33 3.02 (0.04–16.82)2012 1 0.25 4.07 (0.05–22.63)2011 0 0.07 0.00 (0.00–54.42)2010 0 0.17 0.00 (0.00–20.97)2009 0 1.72 0.00 (0.00–2.13)
EXCELA HEALTH WESTMORELAND REGIONAL HOSPITAL (11637)2014 0 0.05 0.00 (0.00–66.87)2013 0 0.04 0.00 (0.00–100.41)2012 0 0.14 0.00 (0.00–26.62)2011 0 0.08 0.00 (0.00–46.09)2010 1 0.23 4.33 (0.06–24.08)2009 2 0.18 10.82 (1.22–39.08)
SAINT VINCENT HOSPITAL (11699)2014 0 0.06 0.00 (0.00–65.88)2013 0 0.18 0.00 (0.00–20.57)2012 1 0.30 3.32 (0.04–18.48)2011 0 0.10 0.00 (0.00–35.04)2010 1 0.12 8.20 (0.11–45.64)2009 0 0.16 0.00 (0.00–22.70)
ST. JOSEPH MEDICAL CTR (11961)2014 1 0.06 17.96 (0.23–99.93)2013 1 0.05 21.16 (0.28–117.74)2012 0 0.12 0.00 (0.00–31.47)2011 0 0.03 0.00 (0.00–108.85)2010 0 0.01 0.00 (0.00–266.30)2009 . . .
ROBERT PACKER HOSPITAL (12422)2014 1 0.06 17.96 (0.23–99.93)2013 0 0.10 0.00 (0.00–37.99)2012 0 0.18 0.00 (0.00–20.85)2011 0 0.12 0.00 (0.00–29.83)2010 0 0.10 0.00 (0.00–38.04)2009 1 1.79 0.56 (0.01–3.12)
LANCASTER REGIONAL MEDICAL CENTER (12335)2014 0 0.06 0.00 (0.00–64.93)2013 0 0.25 0.00 (0.00–14.59)2012 0 0.19 0.00 (0.00–19.66)2011 0 0.00 0.00 (0.00–1, 023.40)2010 0 0.23 0.00 (0.00–15.78)2009 0 0.17 0.00 (0.00–22.02)
Continued on next page . . .
171
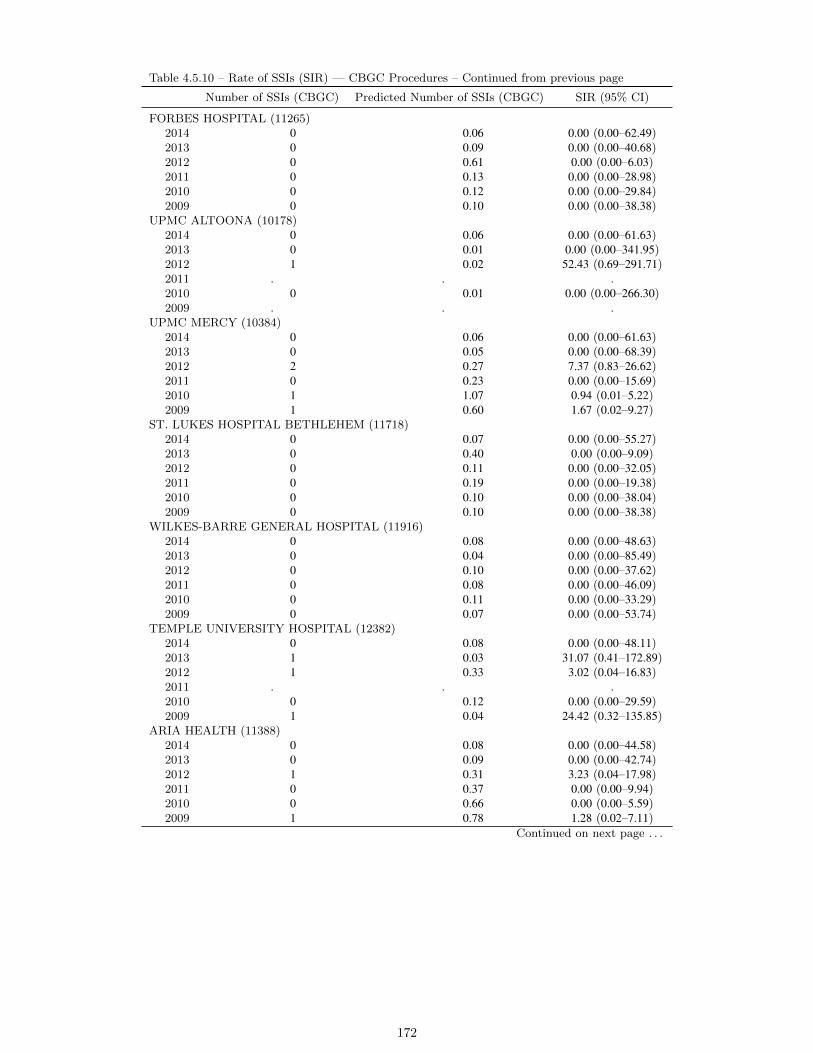
Table 4.5.10 – Rate of SSIs (SIR) — CBGC Procedures – Continued from previous page
Number of SSIs (CBGC) Predicted Number of SSIs (CBGC) SIR (95% CI)
FORBES HOSPITAL (11265)2014 0 0.06 0.00 (0.00–62.49)2013 0 0.09 0.00 (0.00–40.68)2012 0 0.61 0.00 (0.00–6.03)2011 0 0.13 0.00 (0.00–28.98)2010 0 0.12 0.00 (0.00–29.84)2009 0 0.10 0.00 (0.00–38.38)
UPMC ALTOONA (10178)2014 0 0.06 0.00 (0.00–61.63)2013 0 0.01 0.00 (0.00–341.95)2012 1 0.02 52.43 (0.69–291.71)2011 . . .2010 0 0.01 0.00 (0.00–266.30)2009 . . .
UPMC MERCY (10384)2014 0 0.06 0.00 (0.00–61.63)2013 0 0.05 0.00 (0.00–68.39)2012 2 0.27 7.37 (0.83–26.62)2011 0 0.23 0.00 (0.00–15.69)2010 1 1.07 0.94 (0.01–5.22)2009 1 0.60 1.67 (0.02–9.27)
ST. LUKES HOSPITAL BETHLEHEM (11718)2014 0 0.07 0.00 (0.00–55.27)2013 0 0.40 0.00 (0.00–9.09)2012 0 0.11 0.00 (0.00–32.05)2011 0 0.19 0.00 (0.00–19.38)2010 0 0.10 0.00 (0.00–38.04)2009 0 0.10 0.00 (0.00–38.38)
WILKES-BARRE GENERAL HOSPITAL (11916)2014 0 0.08 0.00 (0.00–48.63)2013 0 0.04 0.00 (0.00–85.49)2012 0 0.10 0.00 (0.00–37.62)2011 0 0.08 0.00 (0.00–46.09)2010 0 0.11 0.00 (0.00–33.29)2009 0 0.07 0.00 (0.00–53.74)
TEMPLE UNIVERSITY HOSPITAL (12382)2014 0 0.08 0.00 (0.00–48.11)2013 1 0.03 31.07 (0.41–172.89)2012 1 0.33 3.02 (0.04–16.83)2011 . . .2010 0 0.12 0.00 (0.00–29.59)2009 1 0.04 24.42 (0.32–135.85)
ARIA HEALTH (11388)2014 0 0.08 0.00 (0.00–44.58)2013 0 0.09 0.00 (0.00–42.74)2012 1 0.31 3.23 (0.04–17.98)2011 0 0.37 0.00 (0.00–9.94)2010 0 0.66 0.00 (0.00–5.59)2009 1 0.78 1.28 (0.02–7.11)
Continued on next page . . .
172

Table 4.5.10 – Rate of SSIs (SIR) — CBGC Procedures – Continued from previous page
Number of SSIs (CBGC) Predicted Number of SSIs (CBGC) SIR (95% CI)
PENNSYLVANIA HOSPITAL OF THE UNIVERSITY OF PA HEALTH SYS (11448)2014 1 0.08 11.92 (0.16–66.30)2013 0 0.06 0.00 (0.00–63.26)2012 0 0.02 0.00 (0.00–192.31)2011 0 0.05 0.00 (0.00–69.13)2010 0 0.07 0.00 (0.00–54.07)2009 1 0.01 73.25 (0.96–407.55)
MERCY FITZGERALD HOSPITAL (11683)2014 0 0.09 0.00 (0.00–42.19)2013 0 0.41 0.00 (0.00–8.90)2012 0 0.37 0.00 (0.00–10.00)2011 0 0.16 0.00 (0.00–22.39)2010 0 0.18 0.00 (0.00–20.72)2009 0 0.12 0.00 (0.00–29.85)
ABINGTON MEMORIAL HOSPITAL (11838)2014 0 0.10 0.00 (0.00–35.38)2013 1 0.24 4.09 (0.05–22.74)2012 0 0.06 0.00 (0.00–59.67)2011 0 0.04 0.00 (0.00–92.17)2010 0 0.23 0.00 (0.00–15.80)2009 1 0.24 4.18 (0.05–23.24)
ST. MARY MEDICAL CENTER (11885)2014 0 0.11 0.00 (0.00–33.43)2013 0 0.23 0.00 (0.00–16.12)2012 0 0.19 0.00 (0.00–19.23)2011 0 0.16 0.00 (0.00–23.04)2010 1 0.16 6.09 (0.08–33.87)2009 0 0.19 0.00 (0.00–19.52)
MILTON S HERSHEY MEDICAL CENTER (11747)2014 0 0.11 0.00 (0.00–32.30)2013 0 0.25 0.00 (0.00–14.48)2012 1 0.27 3.66 (0.05–20.35)2011 0 0.25 0.00 (0.00–14.43)2010 0 0.13 0.00 (0.00–27.24)2009 1 1.85 0.54 (0.01–3.01)
HERITAGE VALLEY BEAVER (11831)2014 0 0.12 0.00 (0.00–31.03)2013 0 0.11 0.00 (0.00–32.86)2012 1 0.33 3.06 (0.04–17.05)2011 1 0.33 3.07 (0.04–17.05)2010 0 0.67 0.00 (0.00–5.48)2009 0 2.42 0.00 (0.00–1.51)
CONEMAUGH MEMORIAL MEDICAL CENTER (10280)2014 0 0.13 0.00 (0.00–27.18)2013 3 0.15 19.98 (4.01–58.37)2012 0 0.31 0.00 (0.00–12.02)2011 0 0.20 0.00 (0.00–18.11)2010 0 0.17 0.00 (0.00–22.19)2009 0 0.27 0.00 (0.00–13.75)
CROZER CHESTER MEDICAL CENTER (11839)2014 0 0.15 0.00 (0.00–24.67)2013 0 0.40 0.00 (0.00–9.09)2012 0 0.56 0.00 (0.00–6.53)2011 0 0.45 0.00 (0.00–8.08)2010 0 0.68 0.00 (0.00–5.37)2009 1 0.69 1.45 (0.02–8.08)
Continued on next page . . .
173
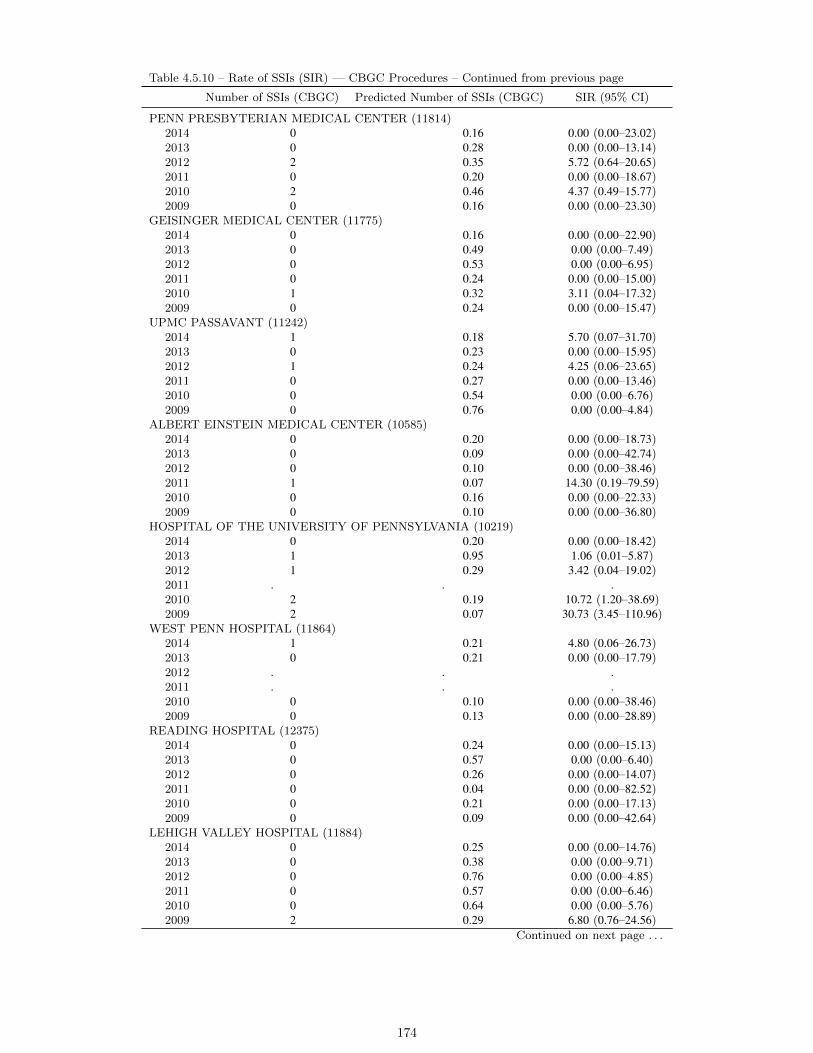
Table 4.5.10 – Rate of SSIs (SIR) — CBGC Procedures – Continued from previous page
Number of SSIs (CBGC) Predicted Number of SSIs (CBGC) SIR (95% CI)
PENN PRESBYTERIAN MEDICAL CENTER (11814)2014 0 0.16 0.00 (0.00–23.02)2013 0 0.28 0.00 (0.00–13.14)2012 2 0.35 5.72 (0.64–20.65)2011 0 0.20 0.00 (0.00–18.67)2010 2 0.46 4.37 (0.49–15.77)2009 0 0.16 0.00 (0.00–23.30)
GEISINGER MEDICAL CENTER (11775)2014 0 0.16 0.00 (0.00–22.90)2013 0 0.49 0.00 (0.00–7.49)2012 0 0.53 0.00 (0.00–6.95)2011 0 0.24 0.00 (0.00–15.00)2010 1 0.32 3.11 (0.04–17.32)2009 0 0.24 0.00 (0.00–15.47)
UPMC PASSAVANT (11242)2014 1 0.18 5.70 (0.07–31.70)2013 0 0.23 0.00 (0.00–15.95)2012 1 0.24 4.25 (0.06–23.65)2011 0 0.27 0.00 (0.00–13.46)2010 0 0.54 0.00 (0.00–6.76)2009 0 0.76 0.00 (0.00–4.84)
ALBERT EINSTEIN MEDICAL CENTER (10585)2014 0 0.20 0.00 (0.00–18.73)2013 0 0.09 0.00 (0.00–42.74)2012 0 0.10 0.00 (0.00–38.46)2011 1 0.07 14.30 (0.19–79.59)2010 0 0.16 0.00 (0.00–22.33)2009 0 0.10 0.00 (0.00–36.80)
HOSPITAL OF THE UNIVERSITY OF PENNSYLVANIA (10219)2014 0 0.20 0.00 (0.00–18.42)2013 1 0.95 1.06 (0.01–5.87)2012 1 0.29 3.42 (0.04–19.02)2011 . . .2010 2 0.19 10.72 (1.20–38.69)2009 2 0.07 30.73 (3.45–110.96)
WEST PENN HOSPITAL (11864)2014 1 0.21 4.80 (0.06–26.73)2013 0 0.21 0.00 (0.00–17.79)2012 . . .2011 . . .2010 0 0.10 0.00 (0.00–38.46)2009 0 0.13 0.00 (0.00–28.89)
READING HOSPITAL (12375)2014 0 0.24 0.00 (0.00–15.13)2013 0 0.57 0.00 (0.00–6.40)2012 0 0.26 0.00 (0.00–14.07)2011 0 0.04 0.00 (0.00–82.52)2010 0 0.21 0.00 (0.00–17.13)2009 0 0.09 0.00 (0.00–42.64)
LEHIGH VALLEY HOSPITAL (11884)2014 0 0.25 0.00 (0.00–14.76)2013 0 0.38 0.00 (0.00–9.71)2012 0 0.76 0.00 (0.00–4.85)2011 0 0.57 0.00 (0.00–6.46)2010 0 0.64 0.00 (0.00–5.76)2009 2 0.29 6.80 (0.76–24.56)
Continued on next page . . .
174
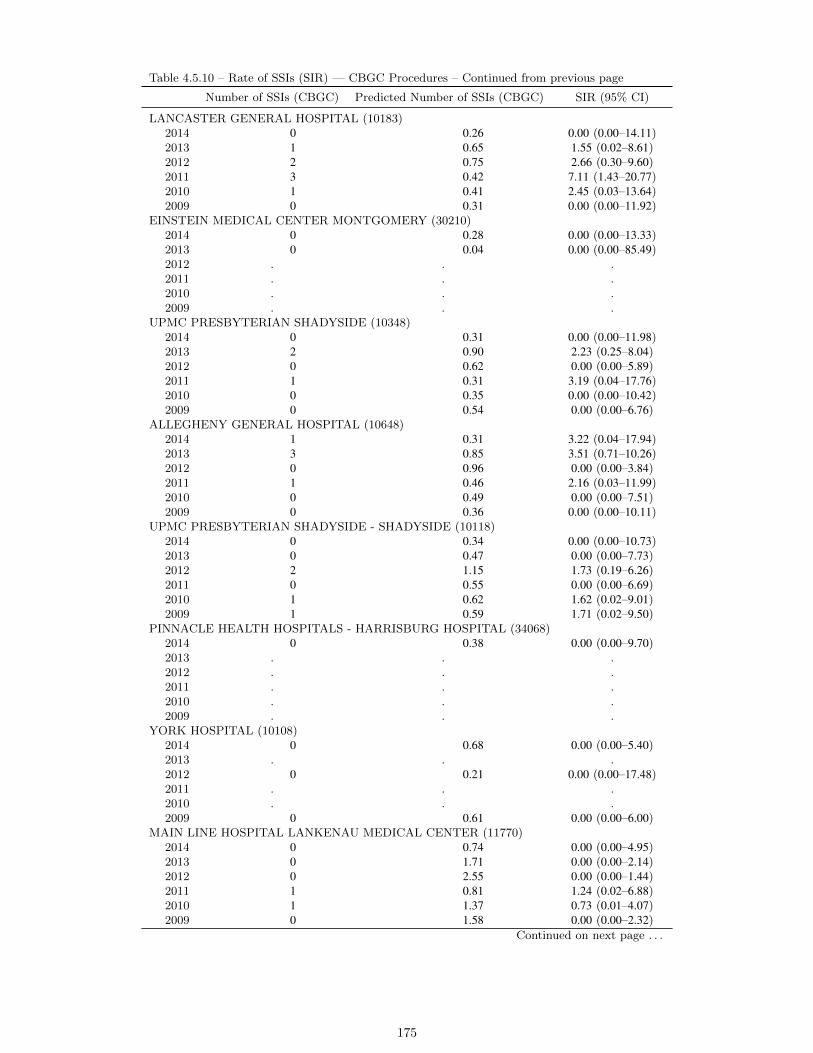
Table 4.5.10 – Rate of SSIs (SIR) — CBGC Procedures – Continued from previous page
Number of SSIs (CBGC) Predicted Number of SSIs (CBGC) SIR (95% CI)
LANCASTER GENERAL HOSPITAL (10183)2014 0 0.26 0.00 (0.00–14.11)2013 1 0.65 1.55 (0.02–8.61)2012 2 0.75 2.66 (0.30–9.60)2011 3 0.42 7.11 (1.43–20.77)2010 1 0.41 2.45 (0.03–13.64)2009 0 0.31 0.00 (0.00–11.92)
EINSTEIN MEDICAL CENTER MONTGOMERY (30210)2014 0 0.28 0.00 (0.00–13.33)2013 0 0.04 0.00 (0.00–85.49)2012 . . .2011 . . .2010 . . .2009 . . .
UPMC PRESBYTERIAN SHADYSIDE (10348)2014 0 0.31 0.00 (0.00–11.98)2013 2 0.90 2.23 (0.25–8.04)2012 0 0.62 0.00 (0.00–5.89)2011 1 0.31 3.19 (0.04–17.76)2010 0 0.35 0.00 (0.00–10.42)2009 0 0.54 0.00 (0.00–6.76)
ALLEGHENY GENERAL HOSPITAL (10648)2014 1 0.31 3.22 (0.04–17.94)2013 3 0.85 3.51 (0.71–10.26)2012 0 0.96 0.00 (0.00–3.84)2011 1 0.46 2.16 (0.03–11.99)2010 0 0.49 0.00 (0.00–7.51)2009 0 0.36 0.00 (0.00–10.11)
UPMC PRESBYTERIAN SHADYSIDE - SHADYSIDE (10118)2014 0 0.34 0.00 (0.00–10.73)2013 0 0.47 0.00 (0.00–7.73)2012 2 1.15 1.73 (0.19–6.26)2011 0 0.55 0.00 (0.00–6.69)2010 1 0.62 1.62 (0.02–9.01)2009 1 0.59 1.71 (0.02–9.50)
PINNACLE HEALTH HOSPITALS - HARRISBURG HOSPITAL (34068)2014 0 0.38 0.00 (0.00–9.70)2013 . . .2012 . . .2011 . . .2010 . . .2009 . . .
YORK HOSPITAL (10108)2014 0 0.68 0.00 (0.00–5.40)2013 . . .2012 0 0.21 0.00 (0.00–17.48)2011 . . .2010 . . .2009 0 0.61 0.00 (0.00–6.00)
MAIN LINE HOSPITAL LANKENAU MEDICAL CENTER (11770)2014 0 0.74 0.00 (0.00–4.95)2013 0 1.71 0.00 (0.00–2.14)2012 0 2.55 0.00 (0.00–1.44)2011 1 0.81 1.24 (0.02–6.88)2010 1 1.37 0.73 (0.01–4.07)2009 0 1.58 0.00 (0.00–2.32)
Continued on next page . . .
175

Table 4.5.10 – Rate of SSIs (SIR) — CBGC Procedures – Continued from previous page
Number of SSIs (CBGC) Predicted Number of SSIs (CBGC) SIR (95% CI)
HOLY SPIRIT HOSPITAL (12387)2014 1 0.79 1.27 (0.02–7.09)2013 0 1.92 0.00 (0.00–1.91)2012 2 4.48 0.45 (0.05–1.61)2011 1 1.09 0.92 (0.01–5.12)2010 0 0.45 0.00 (0.00–8.08)2009 0 0.16 0.00 (0.00–22.26)
176

Table 4.5.11: Rate (SIR) of Surgical Site Infections (SSIs) Associated with Knee Arthroplasty (KPRO) by Hospital — Penn-sylvania, 2009–2014
Number of SSIs (KPRO) Predicted Number of SSIs (KPRO) SIR (95% CI)
EXCELA HEALTH FRICK HOSPITAL (11639)2014 . . .2013 . . .2012 . . .2011 1 0.12 8.62 (0.11–47.94)2010 0 0.15 0.00 (0.00–23.71)2009 1 0.28 3.60 (0.05–20.05)
WAYNESBORO HOSPITAL (11642)2014 . . .2013 1 0.22 4.50 (0.06–25.06)2012 0 0.29 0.00 (0.00–12.60)2011 0 0.30 0.00 (0.00–12.41)2010 0 0.46 0.00 (0.00–8.04)2009 0 0.43 0.00 (0.00–8.46)
TITUSVILLE AREA HOSPITAL (11738)2014 . . .2013 0 0.15 0.00 (0.00–25.09)2012 0 0.39 0.00 (0.00–9.49)2011 0 0.35 0.00 (0.00–10.51)2010 0 0.10 0.00 (0.00–35.07)2009 1 0.42 2.38 (0.03–13.26)
BARIX CLINICS OF PENNSYLVANIA (12037)2014 . . .2013 0 0.01 0.00 (0.00–535.44)2012 0 0.05 0.00 (0.00–75.29)2011 . . .2010 . . .2009 . . .
LOCK HAVEN HOSPITAL (12097)2014 . . .2013 . . .2012 0 0.10 0.00 (0.00–38.60)2011 0 0.14 0.00 (0.00–25.33)2010 0 0.04 0.00 (0.00–82.98)2009 . . .
SHRINERS HOSPITALS FOR CHILDREN - PHILA (12244)2014 . . .2013 . . .2012 . . .2011 0 0.02 0.00 (0.00–212.80)2010 . . .2009 . . .
BARNES-KASSON COUNTY HOSPITAL (12404)2014 . . .2013 . . .2012 . . .2011 0 0.06 0.00 (0.00–60.86)2010 0 0.03 0.00 (0.00–117.96)2009 . . .
Continued on next page . . .
177

Table 4.5.11 – Rate of SSIs (SIR) — KPRO Procedures – Continued from previous page
Number of SSIs (KPRO) Predicted Number of SSIs (KPRO) SIR (95% CI)
PENN HIGHLANDS BROOKVILLE (12418)2014 . . .2013 . . .2012 . . .2011 0 0.02 0.00 (0.00–213.49)2010 0 0.14 0.00 (0.00–27.12)2009 0 0.12 0.00 (0.00–29.91)
TYLER MEMORIAL HOSPITAL (11829)2014 0 0.01 0.00 (0.00–586.92)2013 0 0.02 0.00 (0.00–171.34)2012 0 0.03 0.00 (0.00–145.02)2011 0 0.02 0.00 (0.00–212.80)2010 0 0.08 0.00 (0.00–44.19)2009 0 0.06 0.00 (0.00–62.25)
CHILDRENS HOSPITAL OF PHILADELPHIA (10306)2014 0 0.02 0.00 (0.00–239.67)2013 . . .2012 . . .2011 . . .2010 . . .2009 . . .
EASTERN REGIONAL MEDICAL CENTER (12348)2014 0 0.02 0.00 (0.00–239.67)2013 . . .2012 0 0.02 0.00 (0.00–171.12)2011 0 0.01 0.00 (0.00–425.61)2010 . . .2009 . . .
ST. JOSEPHS HOSPITAL (12438)2014 1 0.02 46.39 (0.61–258.13)2013 0 0.03 0.00 (0.00–125.99)2012 0 0.02 0.00 (0.00–171.12)2011 . . .2010 . . .2009 . . .
HIGHLANDS HOSPITAL (11902)2014 0 0.02 0.00 (0.00–149.31)2013 0 0.05 0.00 (0.00–76.49)2012 0 0.05 0.00 (0.00–78.31)2011 0 0.05 0.00 (0.00–77.43)2010 0 0.14 0.00 (0.00–26.58)2009 0 0.09 0.00 (0.00–39.04)
CHILDRENS HOSPITAL OF PITTSBURGH OF UPMC (11640)2014 0 0.03 0.00 (0.00–131.93)2013 . . .2012 . . .2011 . . .2010 . . .2009 . . .
SUNBURY COMMUNITY HOSP (12105)2014 0 0.03 0.00 (0.00–119.43)2013 0 0.23 0.00 (0.00–15.62)2012 0 0.58 0.00 (0.00–6.33)2011 0 0.41 0.00 (0.00–8.91)2010 2 0.25 8.06 (0.91–29.10)2009 1 0.30 3.34 (0.04–18.58)
Continued on next page . . .
178

Table 4.5.11 – Rate of SSIs (SIR) — KPRO Procedures – Continued from previous page
Number of SSIs (KPRO) Predicted Number of SSIs (KPRO) SIR (95% CI)
HOSPITAL OF THE UNIVERSITY OF PENNSYLVANIA (10219)2014 0 0.03 0.00 (0.00–109.43)2013 0 0.02 0.00 (0.00–171.34)2012 0 0.04 0.00 (0.00–85.56)2011 . . .2010 . . .2009 . . .
ST. LUKES HOSPITAL- ANDERSON CAMPUS (21487)2014 0 0.06 0.00 (0.00–57.31)2013 0 0.06 0.00 (0.00–63.93)2012 0 0.07 0.00 (0.00–50.93)2011 . . .2010 . . .2009 . . .
CROZER CHESTER MEDICAL CENTER (11839)2014 0 0.07 0.00 (0.00–53.24)2013 0 0.22 0.00 (0.00–16.50)2012 0 1.27 0.00 (0.00–2.89)2011 0 1.63 0.00 (0.00–2.25)2010 2 1.68 1.19 (0.13–4.31)2009 3 1.85 1.62 (0.33–4.74)
JERSEY SHORE HOSPITAL (11689)2014 0 0.07 0.00 (0.00–50.36)2013 0 0.11 0.00 (0.00–34.75)2012 0 0.15 0.00 (0.00–24.17)2011 0 0.19 0.00 (0.00–18.92)2010 0 0.15 0.00 (0.00–24.21)2009 0 0.15 0.00 (0.00–24.98)
CONEMAUGH MINERS MEDICAL CENTER (12295)2014 0 0.07 0.00 (0.00–49.76)2013 0 0.04 0.00 (0.00–101.99)2012 0 0.09 0.00 (0.00–39.25)2011 0 0.26 0.00 (0.00–14.14)2010 0 0.06 0.00 (0.00–58.98)2009 0 0.07 0.00 (0.00–50.94)
KANE COMMUNITY HOSPITAL (12111)2014 0 0.08 0.00 (0.00–44.26)2013 1 0.13 7.54 (0.10–41.96)2012 0 0.05 0.00 (0.00–71.50)2011 0 0.20 0.00 (0.00–18.25)2010 . . .2009 0 0.24 0.00 (0.00–15.42)
SOUTHWEST REGIONAL MEDICAL CENTER (11942)2014 0 0.09 0.00 (0.00–42.18)2013 0 0.16 0.00 (0.00–23.59)2012 0 0.18 0.00 (0.00–20.95)2011 0 0.21 0.00 (0.00–17.77)2010 0 0.15 0.00 (0.00–24.21)2009 1 0.31 3.25 (0.04–18.10)
LOWER BUCKS HOSPITAL (12390)2014 0 0.10 0.00 (0.00–38.50)2013 0 0.20 0.00 (0.00–18.46)2012 0 0.34 0.00 (0.00–10.91)2011 0 0.42 0.00 (0.00–8.66)2010 1 0.64 1.57 (0.02–8.74)2009 1 0.51 1.95 (0.03–10.84)
Continued on next page . . .
179
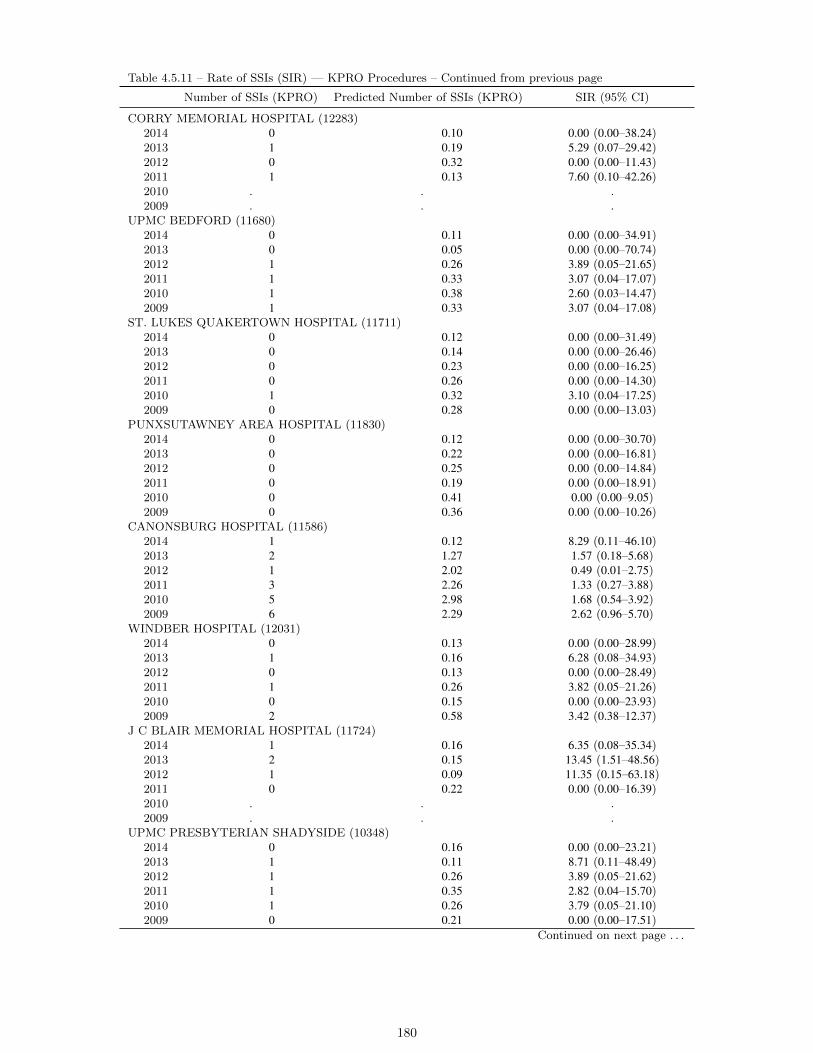
Table 4.5.11 – Rate of SSIs (SIR) — KPRO Procedures – Continued from previous page
Number of SSIs (KPRO) Predicted Number of SSIs (KPRO) SIR (95% CI)
CORRY MEMORIAL HOSPITAL (12283)2014 0 0.10 0.00 (0.00–38.24)2013 1 0.19 5.29 (0.07–29.42)2012 0 0.32 0.00 (0.00–11.43)2011 1 0.13 7.60 (0.10–42.26)2010 . . .2009 . . .
UPMC BEDFORD (11680)2014 0 0.11 0.00 (0.00–34.91)2013 0 0.05 0.00 (0.00–70.74)2012 1 0.26 3.89 (0.05–21.65)2011 1 0.33 3.07 (0.04–17.07)2010 1 0.38 2.60 (0.03–14.47)2009 1 0.33 3.07 (0.04–17.08)
ST. LUKES QUAKERTOWN HOSPITAL (11711)2014 0 0.12 0.00 (0.00–31.49)2013 0 0.14 0.00 (0.00–26.46)2012 0 0.23 0.00 (0.00–16.25)2011 0 0.26 0.00 (0.00–14.30)2010 1 0.32 3.10 (0.04–17.25)2009 0 0.28 0.00 (0.00–13.03)
PUNXSUTAWNEY AREA HOSPITAL (11830)2014 0 0.12 0.00 (0.00–30.70)2013 0 0.22 0.00 (0.00–16.81)2012 0 0.25 0.00 (0.00–14.84)2011 0 0.19 0.00 (0.00–18.91)2010 0 0.41 0.00 (0.00–9.05)2009 0 0.36 0.00 (0.00–10.26)
CANONSBURG HOSPITAL (11586)2014 1 0.12 8.29 (0.11–46.10)2013 2 1.27 1.57 (0.18–5.68)2012 1 2.02 0.49 (0.01–2.75)2011 3 2.26 1.33 (0.27–3.88)2010 5 2.98 1.68 (0.54–3.92)2009 6 2.29 2.62 (0.96–5.70)
WINDBER HOSPITAL (12031)2014 0 0.13 0.00 (0.00–28.99)2013 1 0.16 6.28 (0.08–34.93)2012 0 0.13 0.00 (0.00–28.49)2011 1 0.26 3.82 (0.05–21.26)2010 0 0.15 0.00 (0.00–23.93)2009 2 0.58 3.42 (0.38–12.37)
J C BLAIR MEMORIAL HOSPITAL (11724)2014 1 0.16 6.35 (0.08–35.34)2013 2 0.15 13.45 (1.51–48.56)2012 1 0.09 11.35 (0.15–63.18)2011 0 0.22 0.00 (0.00–16.39)2010 . . .2009 . . .
UPMC PRESBYTERIAN SHADYSIDE (10348)2014 0 0.16 0.00 (0.00–23.21)2013 1 0.11 8.71 (0.11–48.49)2012 1 0.26 3.89 (0.05–21.62)2011 1 0.35 2.82 (0.04–15.70)2010 1 0.26 3.79 (0.05–21.10)2009 0 0.21 0.00 (0.00–17.51)
Continued on next page . . .
180
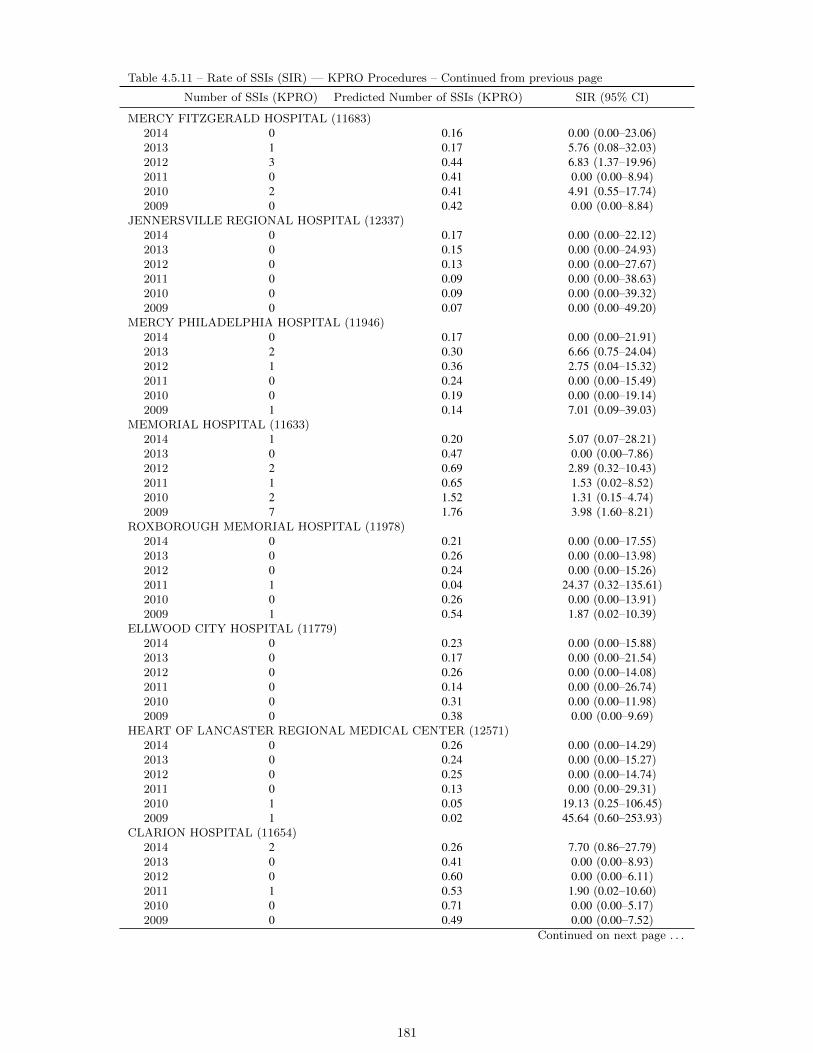
Table 4.5.11 – Rate of SSIs (SIR) — KPRO Procedures – Continued from previous page
Number of SSIs (KPRO) Predicted Number of SSIs (KPRO) SIR (95% CI)
MERCY FITZGERALD HOSPITAL (11683)2014 0 0.16 0.00 (0.00–23.06)2013 1 0.17 5.76 (0.08–32.03)2012 3 0.44 6.83 (1.37–19.96)2011 0 0.41 0.00 (0.00–8.94)2010 2 0.41 4.91 (0.55–17.74)2009 0 0.42 0.00 (0.00–8.84)
JENNERSVILLE REGIONAL HOSPITAL (12337)2014 0 0.17 0.00 (0.00–22.12)2013 0 0.15 0.00 (0.00–24.93)2012 0 0.13 0.00 (0.00–27.67)2011 0 0.09 0.00 (0.00–38.63)2010 0 0.09 0.00 (0.00–39.32)2009 0 0.07 0.00 (0.00–49.20)
MERCY PHILADELPHIA HOSPITAL (11946)2014 0 0.17 0.00 (0.00–21.91)2013 2 0.30 6.66 (0.75–24.04)2012 1 0.36 2.75 (0.04–15.32)2011 0 0.24 0.00 (0.00–15.49)2010 0 0.19 0.00 (0.00–19.14)2009 1 0.14 7.01 (0.09–39.03)
MEMORIAL HOSPITAL (11633)2014 1 0.20 5.07 (0.07–28.21)2013 0 0.47 0.00 (0.00–7.86)2012 2 0.69 2.89 (0.32–10.43)2011 1 0.65 1.53 (0.02–8.52)2010 2 1.52 1.31 (0.15–4.74)2009 7 1.76 3.98 (1.60–8.21)
ROXBOROUGH MEMORIAL HOSPITAL (11978)2014 0 0.21 0.00 (0.00–17.55)2013 0 0.26 0.00 (0.00–13.98)2012 0 0.24 0.00 (0.00–15.26)2011 1 0.04 24.37 (0.32–135.61)2010 0 0.26 0.00 (0.00–13.91)2009 1 0.54 1.87 (0.02–10.39)
ELLWOOD CITY HOSPITAL (11779)2014 0 0.23 0.00 (0.00–15.88)2013 0 0.17 0.00 (0.00–21.54)2012 0 0.26 0.00 (0.00–14.08)2011 0 0.14 0.00 (0.00–26.74)2010 0 0.31 0.00 (0.00–11.98)2009 0 0.38 0.00 (0.00–9.69)
HEART OF LANCASTER REGIONAL MEDICAL CENTER (12571)2014 0 0.26 0.00 (0.00–14.29)2013 0 0.24 0.00 (0.00–15.27)2012 0 0.25 0.00 (0.00–14.74)2011 0 0.13 0.00 (0.00–29.31)2010 1 0.05 19.13 (0.25–106.45)2009 1 0.02 45.64 (0.60–253.93)
CLARION HOSPITAL (11654)2014 2 0.26 7.70 (0.86–27.79)2013 0 0.41 0.00 (0.00–8.93)2012 0 0.60 0.00 (0.00–6.11)2011 1 0.53 1.90 (0.02–10.60)2010 0 0.71 0.00 (0.00–5.17)2009 0 0.49 0.00 (0.00–7.52)
Continued on next page . . .
181
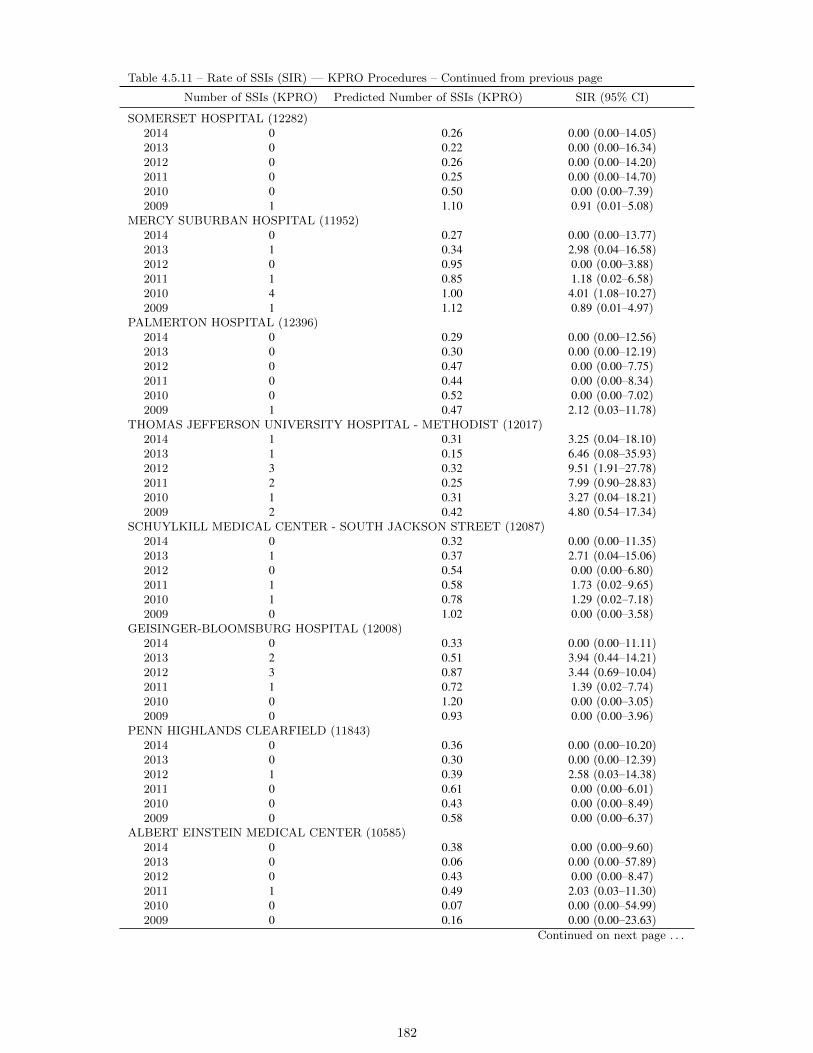
Table 4.5.11 – Rate of SSIs (SIR) — KPRO Procedures – Continued from previous page
Number of SSIs (KPRO) Predicted Number of SSIs (KPRO) SIR (95% CI)
SOMERSET HOSPITAL (12282)2014 0 0.26 0.00 (0.00–14.05)2013 0 0.22 0.00 (0.00–16.34)2012 0 0.26 0.00 (0.00–14.20)2011 0 0.25 0.00 (0.00–14.70)2010 0 0.50 0.00 (0.00–7.39)2009 1 1.10 0.91 (0.01–5.08)
MERCY SUBURBAN HOSPITAL (11952)2014 0 0.27 0.00 (0.00–13.77)2013 1 0.34 2.98 (0.04–16.58)2012 0 0.95 0.00 (0.00–3.88)2011 1 0.85 1.18 (0.02–6.58)2010 4 1.00 4.01 (1.08–10.27)2009 1 1.12 0.89 (0.01–4.97)
PALMERTON HOSPITAL (12396)2014 0 0.29 0.00 (0.00–12.56)2013 0 0.30 0.00 (0.00–12.19)2012 0 0.47 0.00 (0.00–7.75)2011 0 0.44 0.00 (0.00–8.34)2010 0 0.52 0.00 (0.00–7.02)2009 1 0.47 2.12 (0.03–11.78)
THOMAS JEFFERSON UNIVERSITY HOSPITAL - METHODIST (12017)2014 1 0.31 3.25 (0.04–18.10)2013 1 0.15 6.46 (0.08–35.93)2012 3 0.32 9.51 (1.91–27.78)2011 2 0.25 7.99 (0.90–28.83)2010 1 0.31 3.27 (0.04–18.21)2009 2 0.42 4.80 (0.54–17.34)
SCHUYLKILL MEDICAL CENTER - SOUTH JACKSON STREET (12087)2014 0 0.32 0.00 (0.00–11.35)2013 1 0.37 2.71 (0.04–15.06)2012 0 0.54 0.00 (0.00–6.80)2011 1 0.58 1.73 (0.02–9.65)2010 1 0.78 1.29 (0.02–7.18)2009 0 1.02 0.00 (0.00–3.58)
GEISINGER-BLOOMSBURG HOSPITAL (12008)2014 0 0.33 0.00 (0.00–11.11)2013 2 0.51 3.94 (0.44–14.21)2012 3 0.87 3.44 (0.69–10.04)2011 1 0.72 1.39 (0.02–7.74)2010 0 1.20 0.00 (0.00–3.05)2009 0 0.93 0.00 (0.00–3.96)
PENN HIGHLANDS CLEARFIELD (11843)2014 0 0.36 0.00 (0.00–10.20)2013 0 0.30 0.00 (0.00–12.39)2012 1 0.39 2.58 (0.03–14.38)2011 0 0.61 0.00 (0.00–6.01)2010 0 0.43 0.00 (0.00–8.49)2009 0 0.58 0.00 (0.00–6.37)
ALBERT EINSTEIN MEDICAL CENTER (10585)2014 0 0.38 0.00 (0.00–9.60)2013 0 0.06 0.00 (0.00–57.89)2012 0 0.43 0.00 (0.00–8.47)2011 1 0.49 2.03 (0.03–11.30)2010 0 0.07 0.00 (0.00–54.99)2009 0 0.16 0.00 (0.00–23.63)
Continued on next page . . .
182
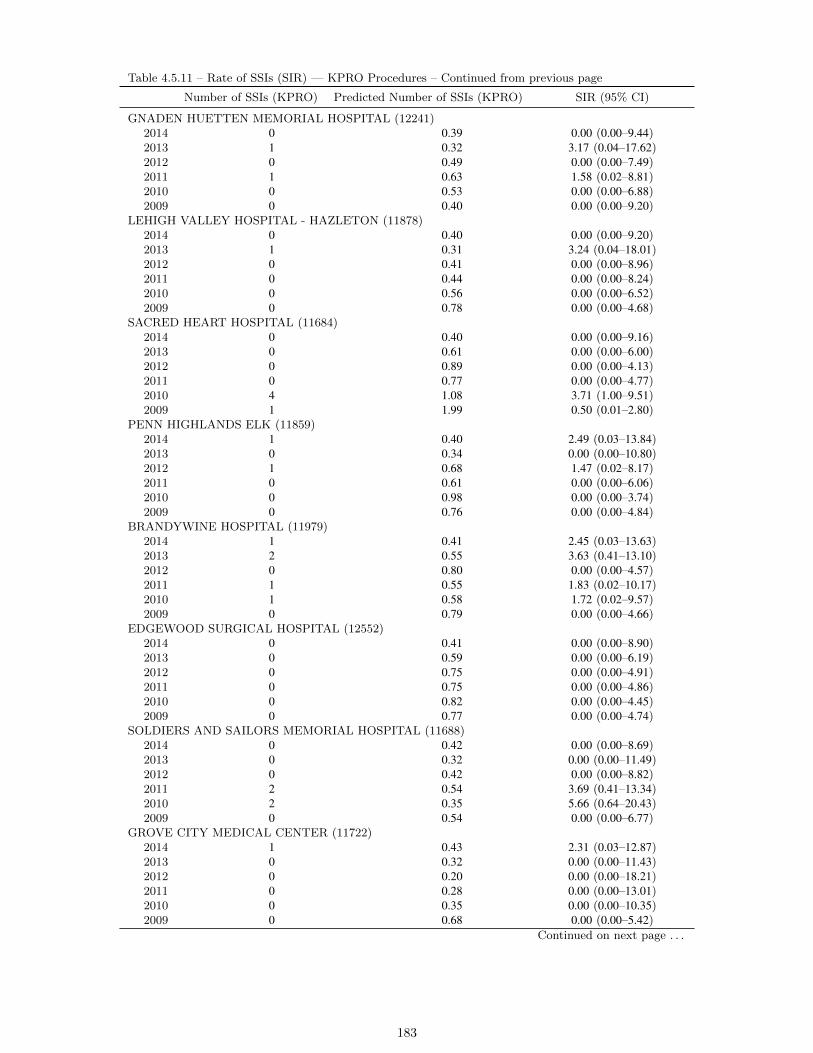
Table 4.5.11 – Rate of SSIs (SIR) — KPRO Procedures – Continued from previous page
Number of SSIs (KPRO) Predicted Number of SSIs (KPRO) SIR (95% CI)
GNADEN HUETTEN MEMORIAL HOSPITAL (12241)2014 0 0.39 0.00 (0.00–9.44)2013 1 0.32 3.17 (0.04–17.62)2012 0 0.49 0.00 (0.00–7.49)2011 1 0.63 1.58 (0.02–8.81)2010 0 0.53 0.00 (0.00–6.88)2009 0 0.40 0.00 (0.00–9.20)
LEHIGH VALLEY HOSPITAL - HAZLETON (11878)2014 0 0.40 0.00 (0.00–9.20)2013 1 0.31 3.24 (0.04–18.01)2012 0 0.41 0.00 (0.00–8.96)2011 0 0.44 0.00 (0.00–8.24)2010 0 0.56 0.00 (0.00–6.52)2009 0 0.78 0.00 (0.00–4.68)
SACRED HEART HOSPITAL (11684)2014 0 0.40 0.00 (0.00–9.16)2013 0 0.61 0.00 (0.00–6.00)2012 0 0.89 0.00 (0.00–4.13)2011 0 0.77 0.00 (0.00–4.77)2010 4 1.08 3.71 (1.00–9.51)2009 1 1.99 0.50 (0.01–2.80)
PENN HIGHLANDS ELK (11859)2014 1 0.40 2.49 (0.03–13.84)2013 0 0.34 0.00 (0.00–10.80)2012 1 0.68 1.47 (0.02–8.17)2011 0 0.61 0.00 (0.00–6.06)2010 0 0.98 0.00 (0.00–3.74)2009 0 0.76 0.00 (0.00–4.84)
BRANDYWINE HOSPITAL (11979)2014 1 0.41 2.45 (0.03–13.63)2013 2 0.55 3.63 (0.41–13.10)2012 0 0.80 0.00 (0.00–4.57)2011 1 0.55 1.83 (0.02–10.17)2010 1 0.58 1.72 (0.02–9.57)2009 0 0.79 0.00 (0.00–4.66)
EDGEWOOD SURGICAL HOSPITAL (12552)2014 0 0.41 0.00 (0.00–8.90)2013 0 0.59 0.00 (0.00–6.19)2012 0 0.75 0.00 (0.00–4.91)2011 0 0.75 0.00 (0.00–4.86)2010 0 0.82 0.00 (0.00–4.45)2009 0 0.77 0.00 (0.00–4.74)
SOLDIERS AND SAILORS MEMORIAL HOSPITAL (11688)2014 0 0.42 0.00 (0.00–8.69)2013 0 0.32 0.00 (0.00–11.49)2012 0 0.42 0.00 (0.00–8.82)2011 2 0.54 3.69 (0.41–13.34)2010 2 0.35 5.66 (0.64–20.43)2009 0 0.54 0.00 (0.00–6.77)
GROVE CITY MEDICAL CENTER (11722)2014 1 0.43 2.31 (0.03–12.87)2013 0 0.32 0.00 (0.00–11.43)2012 0 0.20 0.00 (0.00–18.21)2011 0 0.28 0.00 (0.00–13.01)2010 0 0.35 0.00 (0.00–10.35)2009 0 0.68 0.00 (0.00–5.42)
Continued on next page . . .
183

Table 4.5.11 – Rate of SSIs (SIR) — KPRO Procedures – Continued from previous page
Number of SSIs (KPRO) Predicted Number of SSIs (KPRO) SIR (95% CI)
SCHUYLKILL MEDICAL CENTER - EAST NORWEGIAN STREET (11922)2014 0 0.45 0.00 (0.00–8.22)2013 1 0.52 1.94 (0.03–10.80)2012 1 0.98 1.02 (0.01–5.66)2011 1 1.02 0.98 (0.01–5.48)2010 1 0.74 1.36 (0.02–7.57)2009 3 1.05 2.85 (0.57–8.33)
UPMC NORTHWEST (11837)2014 0 0.49 0.00 (0.00–7.54)2013 0 0.51 0.00 (0.00–7.17)2012 0 0.55 0.00 (0.00–6.62)2011 2 0.73 2.75 (0.31–9.92)2010 0 0.70 0.00 (0.00–5.21)2009 4 0.68 5.91 (1.59–15.13)
TYRONE HOSPITAL (12717)2014 3 0.49 6.15 (1.24–17.97)2013 1 0.31 3.21 (0.04–17.83)2012 2 0.26 7.82 (0.88–28.23)2011 1 0.11 8.97 (0.12–49.90)2010 0 0.02 0.00 (0.00–203.14)2009 0 0.22 0.00 (0.00–16.47)
UPMC MCKEESPORT (11707)2014 1 0.49 2.02 (0.03–11.24)2013 1 0.37 2.73 (0.04–15.18)2012 0 0.70 0.00 (0.00–5.22)2011 0 0.56 0.00 (0.00–6.50)2010 1 0.44 2.25 (0.03–12.51)2009 0 0.62 0.00 (0.00–5.95)
BERWICK HOSPITAL CENTER (11442)2014 1 0.50 1.99 (0.03–11.06)2013 0 0.42 0.00 (0.00–8.82)2012 0 0.70 0.00 (0.00–5.26)2011 0 1.20 0.00 (0.00–3.06)2010 0 0.57 0.00 (0.00–6.42)2009 1 0.66 1.52 (0.02–8.47)
CROZER CHESTER MEDICAL CENTER (11932)2014 0 0.51 0.00 (0.00–7.20)2013 0 0.40 0.00 (0.00–9.07)2012 1 0.50 2.02 (0.03–11.23)2011 0 0.45 0.00 (0.00–8.08)2010 0 0.73 0.00 (0.00–5.03)2009 0 1.14 0.00 (0.00–3.23)
BRADFORD REGIONAL MEDICAL CENTER (12361)2014 0 0.52 0.00 (0.00–7.10)2013 0 0.26 0.00 (0.00–14.23)2012 0 0.23 0.00 (0.00–16.16)2011 0 0.19 0.00 (0.00–19.77)2010 0 0.10 0.00 (0.00–35.52)2009 0 0.26 0.00 (0.00–13.98)
WAYNE MEMORIAL HOSPITAL (12004)2014 0 0.52 0.00 (0.00–7.04)2013 0 0.69 0.00 (0.00–5.29)2012 0 0.78 0.00 (0.00–4.68)2011 2 0.55 3.61 (0.41–13.04)2010 2 0.56 3.58 (0.40–12.94)2009 1 0.26 3.82 (0.05–21.25)
Continued on next page . . .
184

Table 4.5.11 – Rate of SSIs (SIR) — KPRO Procedures – Continued from previous page
Number of SSIs (KPRO) Predicted Number of SSIs (KPRO) SIR (95% CI)
CHESTNUT HILL HOSPITAL (12304)2014 3 0.53 5.64 (1.13–16.48)2013 0 0.39 0.00 (0.00–9.52)2012 1 0.28 3.59 (0.05–19.97)2011 1 0.17 6.04 (0.08–33.60)2010 0 0.25 0.00 (0.00–14.76)2009 0 0.38 0.00 (0.00–9.71)
ST. LUKES MINERS MEMORIAL HOSPITAL (11784)2014 0 0.53 0.00 (0.00–6.89)2013 0 0.58 0.00 (0.00–6.30)2012 1 0.84 1.18 (0.02–6.59)2011 0 0.66 0.00 (0.00–5.53)2010 1 1.12 0.89 (0.01–4.95)2009 2 1.47 1.36 (0.15–4.90)
POCONO MEDICAL CENTER (11772)2014 1 0.54 1.85 (0.02–10.27)2013 0 0.60 0.00 (0.00–6.07)2012 0 0.16 0.00 (0.00–22.79)2011 1 0.50 2.01 (0.03–11.17)2010 0 0.54 0.00 (0.00–6.79)2009 0 0.50 0.00 (0.00–7.32)
ENDLESS MOUNTAINS HEALTH SYSTEMS (11817)2014 0 0.59 0.00 (0.00–6.17)2013 0 0.36 0.00 (0.00–10.30)2012 0 0.55 0.00 (0.00–6.67)2011 1 0.69 1.45 (0.02–8.06)2010 0 0.65 0.00 (0.00–5.64)2009 1 0.56 1.78 (0.02–9.89)
OHIO VALLEY GENERAL HOSPITAL (12298)2014 0 0.60 0.00 (0.00–6.16)2013 0 0.48 0.00 (0.00–7.62)2012 1 0.46 2.16 (0.03–12.00)2011 0 0.47 0.00 (0.00–7.73)2010 1 0.94 1.07 (0.01–5.93)2009 0 0.59 0.00 (0.00–6.25)
WASHINGTON HOSPITAL, THE (11460)2014 2 0.65 3.06 (0.34–11.05)2013 0 0.90 0.00 (0.00–4.08)2012 0 1.37 0.00 (0.00–2.67)2011 2 1.25 1.60 (0.18–5.78)2010 2 2.43 0.82 (0.09–2.97)2009 4 3.39 1.18 (0.32–3.02)
ST. JOSEPH MEDICAL CTR (11961)2014 3 0.68 4.44 (0.89–12.96)2013 1 0.70 1.43 (0.02–7.98)2012 1 1.20 0.84 (0.01–4.65)2011 0 0.99 0.00 (0.00–3.72)2010 1 1.22 0.82 (0.01–4.54)2009 1 1.15 0.87 (0.01–4.85)
NASON HOSPITAL (11907)2014 0 0.70 0.00 (0.00–5.21)2013 0 0.69 0.00 (0.00–5.34)2012 0 0.47 0.00 (0.00–7.74)2011 0 0.26 0.00 (0.00–13.98)2010 0 0.37 0.00 (0.00–9.94)2009 0 0.36 0.00 (0.00–10.20)
Continued on next page . . .
185
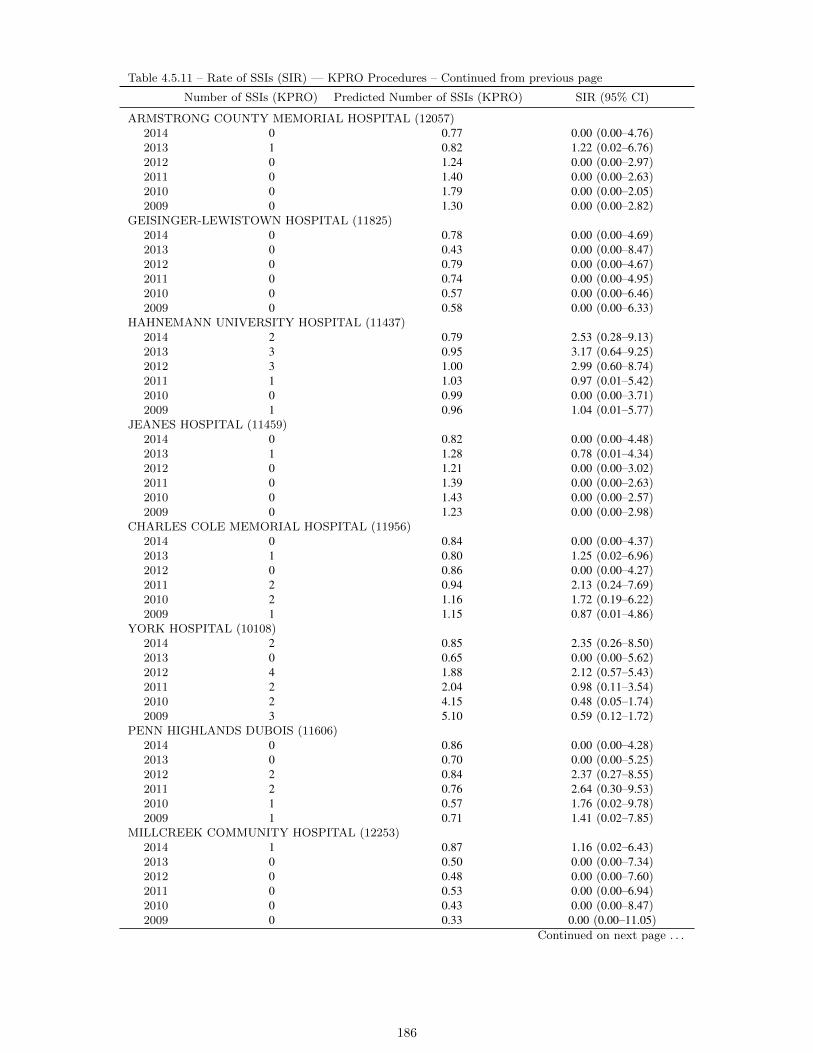
Table 4.5.11 – Rate of SSIs (SIR) — KPRO Procedures – Continued from previous page
Number of SSIs (KPRO) Predicted Number of SSIs (KPRO) SIR (95% CI)
ARMSTRONG COUNTY MEMORIAL HOSPITAL (12057)2014 0 0.77 0.00 (0.00–4.76)2013 1 0.82 1.22 (0.02–6.76)2012 0 1.24 0.00 (0.00–2.97)2011 0 1.40 0.00 (0.00–2.63)2010 0 1.79 0.00 (0.00–2.05)2009 0 1.30 0.00 (0.00–2.82)
GEISINGER-LEWISTOWN HOSPITAL (11825)2014 0 0.78 0.00 (0.00–4.69)2013 0 0.43 0.00 (0.00–8.47)2012 0 0.79 0.00 (0.00–4.67)2011 0 0.74 0.00 (0.00–4.95)2010 0 0.57 0.00 (0.00–6.46)2009 0 0.58 0.00 (0.00–6.33)
HAHNEMANN UNIVERSITY HOSPITAL (11437)2014 2 0.79 2.53 (0.28–9.13)2013 3 0.95 3.17 (0.64–9.25)2012 3 1.00 2.99 (0.60–8.74)2011 1 1.03 0.97 (0.01–5.42)2010 0 0.99 0.00 (0.00–3.71)2009 1 0.96 1.04 (0.01–5.77)
JEANES HOSPITAL (11459)2014 0 0.82 0.00 (0.00–4.48)2013 1 1.28 0.78 (0.01–4.34)2012 0 1.21 0.00 (0.00–3.02)2011 0 1.39 0.00 (0.00–2.63)2010 0 1.43 0.00 (0.00–2.57)2009 0 1.23 0.00 (0.00–2.98)
CHARLES COLE MEMORIAL HOSPITAL (11956)2014 0 0.84 0.00 (0.00–4.37)2013 1 0.80 1.25 (0.02–6.96)2012 0 0.86 0.00 (0.00–4.27)2011 2 0.94 2.13 (0.24–7.69)2010 2 1.16 1.72 (0.19–6.22)2009 1 1.15 0.87 (0.01–4.86)
YORK HOSPITAL (10108)2014 2 0.85 2.35 (0.26–8.50)2013 0 0.65 0.00 (0.00–5.62)2012 4 1.88 2.12 (0.57–5.43)2011 2 2.04 0.98 (0.11–3.54)2010 2 4.15 0.48 (0.05–1.74)2009 3 5.10 0.59 (0.12–1.72)
PENN HIGHLANDS DUBOIS (11606)2014 0 0.86 0.00 (0.00–4.28)2013 0 0.70 0.00 (0.00–5.25)2012 2 0.84 2.37 (0.27–8.55)2011 2 0.76 2.64 (0.30–9.53)2010 1 0.57 1.76 (0.02–9.78)2009 1 0.71 1.41 (0.02–7.85)
MILLCREEK COMMUNITY HOSPITAL (12253)2014 1 0.87 1.16 (0.02–6.43)2013 0 0.50 0.00 (0.00–7.34)2012 0 0.48 0.00 (0.00–7.60)2011 0 0.53 0.00 (0.00–6.94)2010 0 0.43 0.00 (0.00–8.47)2009 0 0.33 0.00 (0.00–11.05)
Continued on next page . . .
186
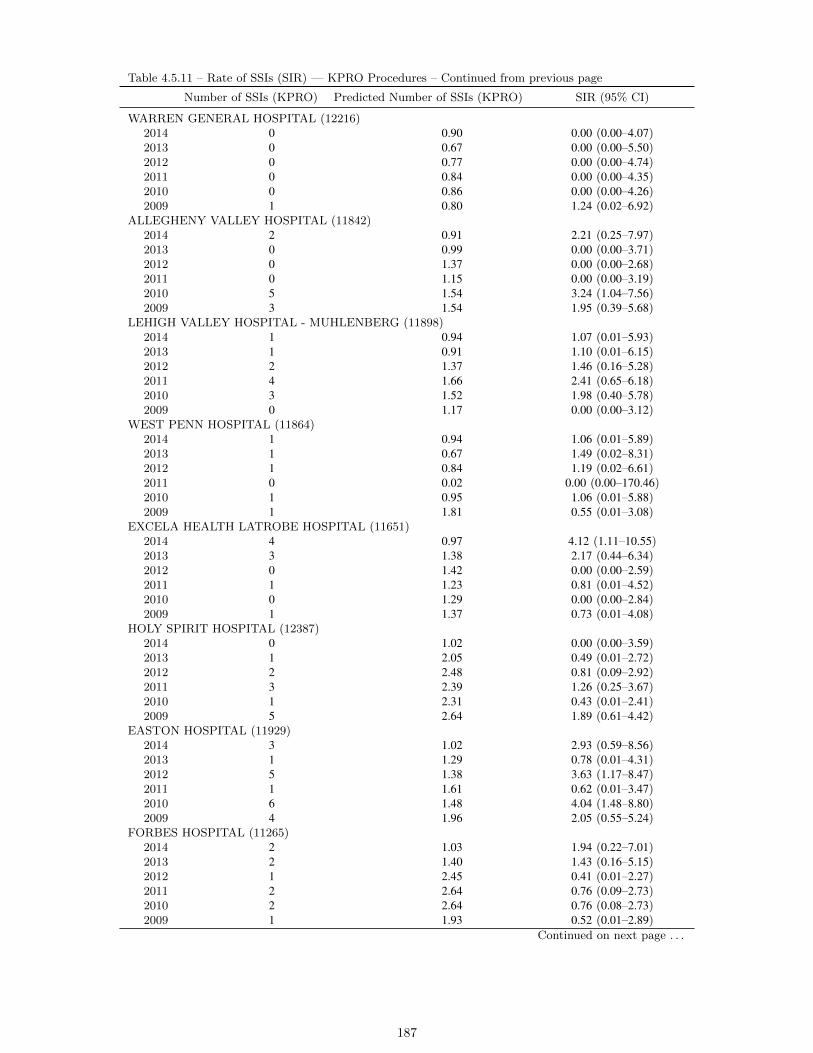
Table 4.5.11 – Rate of SSIs (SIR) — KPRO Procedures – Continued from previous page
Number of SSIs (KPRO) Predicted Number of SSIs (KPRO) SIR (95% CI)
WARREN GENERAL HOSPITAL (12216)2014 0 0.90 0.00 (0.00–4.07)2013 0 0.67 0.00 (0.00–5.50)2012 0 0.77 0.00 (0.00–4.74)2011 0 0.84 0.00 (0.00–4.35)2010 0 0.86 0.00 (0.00–4.26)2009 1 0.80 1.24 (0.02–6.92)
ALLEGHENY VALLEY HOSPITAL (11842)2014 2 0.91 2.21 (0.25–7.97)2013 0 0.99 0.00 (0.00–3.71)2012 0 1.37 0.00 (0.00–2.68)2011 0 1.15 0.00 (0.00–3.19)2010 5 1.54 3.24 (1.04–7.56)2009 3 1.54 1.95 (0.39–5.68)
LEHIGH VALLEY HOSPITAL - MUHLENBERG (11898)2014 1 0.94 1.07 (0.01–5.93)2013 1 0.91 1.10 (0.01–6.15)2012 2 1.37 1.46 (0.16–5.28)2011 4 1.66 2.41 (0.65–6.18)2010 3 1.52 1.98 (0.40–5.78)2009 0 1.17 0.00 (0.00–3.12)
WEST PENN HOSPITAL (11864)2014 1 0.94 1.06 (0.01–5.89)2013 1 0.67 1.49 (0.02–8.31)2012 1 0.84 1.19 (0.02–6.61)2011 0 0.02 0.00 (0.00–170.46)2010 1 0.95 1.06 (0.01–5.88)2009 1 1.81 0.55 (0.01–3.08)
EXCELA HEALTH LATROBE HOSPITAL (11651)2014 4 0.97 4.12 (1.11–10.55)2013 3 1.38 2.17 (0.44–6.34)2012 0 1.42 0.00 (0.00–2.59)2011 1 1.23 0.81 (0.01–4.52)2010 0 1.29 0.00 (0.00–2.84)2009 1 1.37 0.73 (0.01–4.08)
HOLY SPIRIT HOSPITAL (12387)2014 0 1.02 0.00 (0.00–3.59)2013 1 2.05 0.49 (0.01–2.72)2012 2 2.48 0.81 (0.09–2.92)2011 3 2.39 1.26 (0.25–3.67)2010 1 2.31 0.43 (0.01–2.41)2009 5 2.64 1.89 (0.61–4.42)
EASTON HOSPITAL (11929)2014 3 1.02 2.93 (0.59–8.56)2013 1 1.29 0.78 (0.01–4.31)2012 5 1.38 3.63 (1.17–8.47)2011 1 1.61 0.62 (0.01–3.47)2010 6 1.48 4.04 (1.48–8.80)2009 4 1.96 2.05 (0.55–5.24)
FORBES HOSPITAL (11265)2014 2 1.03 1.94 (0.22–7.01)2013 2 1.40 1.43 (0.16–5.15)2012 1 2.45 0.41 (0.01–2.27)2011 2 2.64 0.76 (0.09–2.73)2010 2 2.64 0.76 (0.08–2.73)2009 1 1.93 0.52 (0.01–2.89)
Continued on next page . . .
187
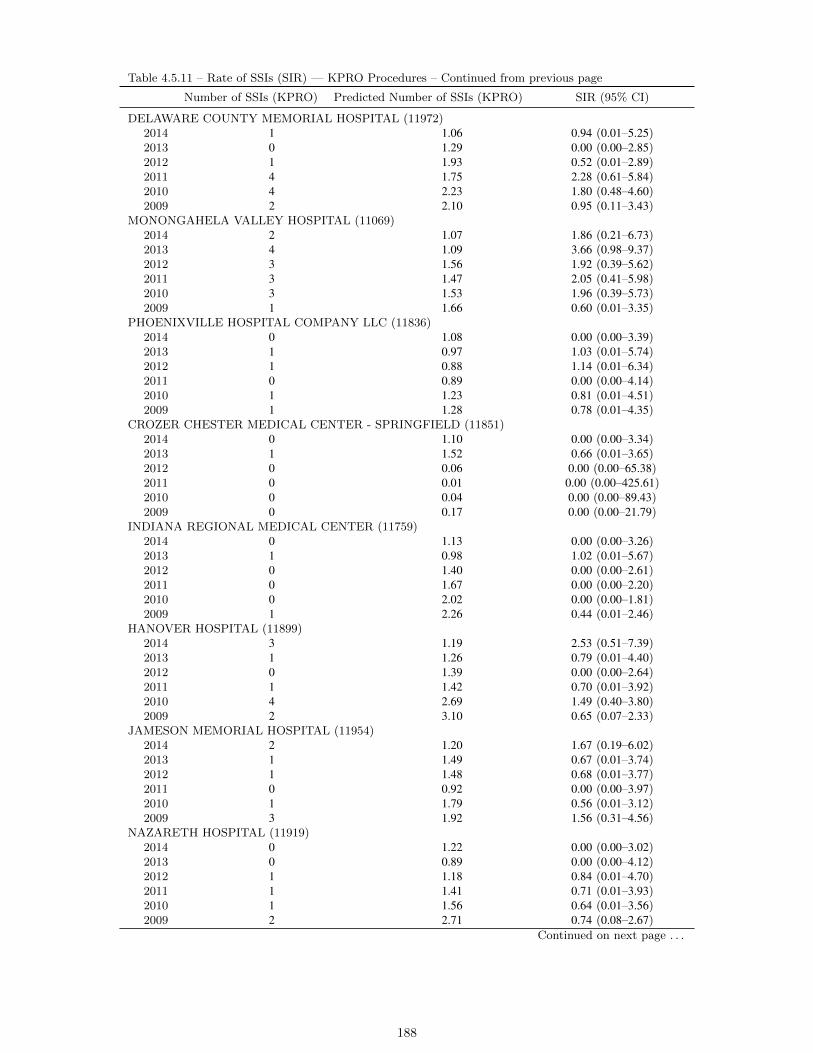
Table 4.5.11 – Rate of SSIs (SIR) — KPRO Procedures – Continued from previous page
Number of SSIs (KPRO) Predicted Number of SSIs (KPRO) SIR (95% CI)
DELAWARE COUNTY MEMORIAL HOSPITAL (11972)2014 1 1.06 0.94 (0.01–5.25)2013 0 1.29 0.00 (0.00–2.85)2012 1 1.93 0.52 (0.01–2.89)2011 4 1.75 2.28 (0.61–5.84)2010 4 2.23 1.80 (0.48–4.60)2009 2 2.10 0.95 (0.11–3.43)
MONONGAHELA VALLEY HOSPITAL (11069)2014 2 1.07 1.86 (0.21–6.73)2013 4 1.09 3.66 (0.98–9.37)2012 3 1.56 1.92 (0.39–5.62)2011 3 1.47 2.05 (0.41–5.98)2010 3 1.53 1.96 (0.39–5.73)2009 1 1.66 0.60 (0.01–3.35)
PHOENIXVILLE HOSPITAL COMPANY LLC (11836)2014 0 1.08 0.00 (0.00–3.39)2013 1 0.97 1.03 (0.01–5.74)2012 1 0.88 1.14 (0.01–6.34)2011 0 0.89 0.00 (0.00–4.14)2010 1 1.23 0.81 (0.01–4.51)2009 1 1.28 0.78 (0.01–4.35)
CROZER CHESTER MEDICAL CENTER - SPRINGFIELD (11851)2014 0 1.10 0.00 (0.00–3.34)2013 1 1.52 0.66 (0.01–3.65)2012 0 0.06 0.00 (0.00–65.38)2011 0 0.01 0.00 (0.00–425.61)2010 0 0.04 0.00 (0.00–89.43)2009 0 0.17 0.00 (0.00–21.79)
INDIANA REGIONAL MEDICAL CENTER (11759)2014 0 1.13 0.00 (0.00–3.26)2013 1 0.98 1.02 (0.01–5.67)2012 0 1.40 0.00 (0.00–2.61)2011 0 1.67 0.00 (0.00–2.20)2010 0 2.02 0.00 (0.00–1.81)2009 1 2.26 0.44 (0.01–2.46)
HANOVER HOSPITAL (11899)2014 3 1.19 2.53 (0.51–7.39)2013 1 1.26 0.79 (0.01–4.40)2012 0 1.39 0.00 (0.00–2.64)2011 1 1.42 0.70 (0.01–3.92)2010 4 2.69 1.49 (0.40–3.80)2009 2 3.10 0.65 (0.07–2.33)
JAMESON MEMORIAL HOSPITAL (11954)2014 2 1.20 1.67 (0.19–6.02)2013 1 1.49 0.67 (0.01–3.74)2012 1 1.48 0.68 (0.01–3.77)2011 0 0.92 0.00 (0.00–3.97)2010 1 1.79 0.56 (0.01–3.12)2009 3 1.92 1.56 (0.31–4.56)
NAZARETH HOSPITAL (11919)2014 0 1.22 0.00 (0.00–3.02)2013 0 0.89 0.00 (0.00–4.12)2012 1 1.18 0.84 (0.01–4.70)2011 1 1.41 0.71 (0.01–3.93)2010 1 1.56 0.64 (0.01–3.56)2009 2 2.71 0.74 (0.08–2.67)
Continued on next page . . .
188

Table 4.5.11 – Rate of SSIs (SIR) — KPRO Procedures – Continued from previous page
Number of SSIs (KPRO) Predicted Number of SSIs (KPRO) SIR (95% CI)
UNIONTOWN HOSPITAL (10441)2014 0 1.26 0.00 (0.00–2.92)2013 0 1.35 0.00 (0.00–2.72)2012 1 1.89 0.53 (0.01–2.94)2011 0 1.95 0.00 (0.00–1.88)2010 7 2.37 2.96 (1.18–6.09)2009 0 2.63 0.00 (0.00–1.39)
EINSTEIN MEDICAL CENTER MONTGOMERY (30210)2014 3 1.27 2.36 (0.47–6.90)2013 4 1.45 2.75 (0.74–7.04)2012 . . .2011 . . .2010 . . .2009 . . .
HERITAGE VALLEY BEAVER (11831)2014 5 1.28 3.90 (1.26–9.11)2013 4 1.42 2.81 (0.76–7.20)2012 6 1.83 3.27 (1.20–7.12)2011 2 1.84 1.09 (0.12–3.93)2010 4 2.02 1.98 (0.53–5.06)2009 2 2.16 0.93 (0.10–3.35)
LANSDALE HOSPITAL (12032)2014 1 1.29 0.78 (0.01–4.33)2013 1 1.43 0.70 (0.01–3.90)2012 0 1.48 0.00 (0.00–2.47)2011 1 1.13 0.88 (0.01–4.91)2010 0 0.45 0.00 (0.00–8.21)2009 0 0.71 0.00 (0.00–5.19)
POTTSTOWN MEMORIAL MEDICAL CENTER (11983)2014 1 1.30 0.77 (0.01–4.27)2013 2 1.64 1.22 (0.14–4.39)2012 4 2.31 1.73 (0.46–4.42)2011 0 2.57 0.00 (0.00–1.43)2010 3 2.77 1.08 (0.22–3.17)2009 0 2.72 0.00 (0.00–1.35)
GOOD SAMARITAN HOSPITAL, THE (11712)2014 0 1.33 0.00 (0.00–2.76)2013 1 1.62 0.62 (0.01–3.44)2012 0 2.11 0.00 (0.00–1.73)2011 0 2.13 0.00 (0.00–1.72)2010 0 2.35 0.00 (0.00–1.56)2009 0 2.68 0.00 (0.00–1.37)
UPMC MERCY (10384)2014 1 1.35 0.74 (0.01–4.13)2013 4 1.77 2.26 (0.61–5.79)2012 2 1.98 1.01 (0.11–3.64)2011 2 2.17 0.92 (0.10–3.33)2010 6 2.71 2.22 (0.81–4.82)2009 1 1.77 0.56 (0.01–3.14)
SHARON REGIONAL HEALTH SYSTEM (12250)2014 0 1.37 0.00 (0.00–2.67)2013 0 1.53 0.00 (0.00–2.40)2012 1 2.04 0.49 (0.01–2.72)2011 1 1.87 0.53 (0.01–2.98)2010 2 2.32 0.86 (0.10–3.11)2009 1 2.81 0.36 (0.00–1.98)
Continued on next page . . .
189
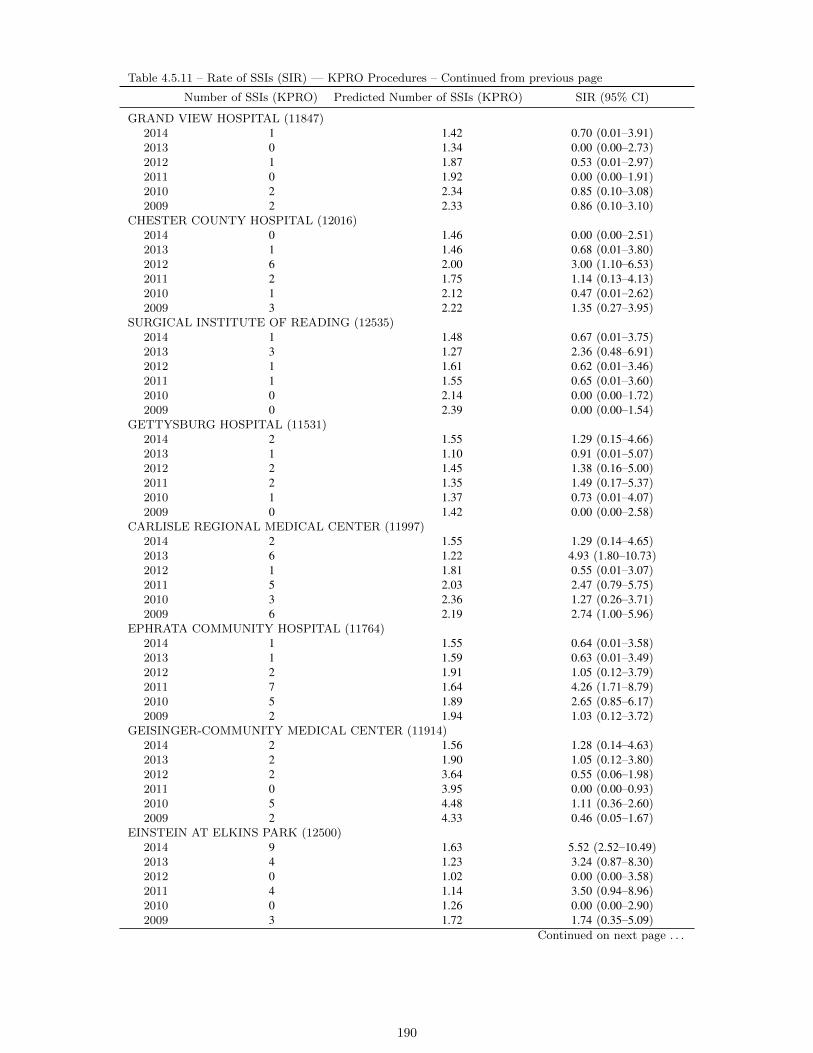
Table 4.5.11 – Rate of SSIs (SIR) — KPRO Procedures – Continued from previous page
Number of SSIs (KPRO) Predicted Number of SSIs (KPRO) SIR (95% CI)
GRAND VIEW HOSPITAL (11847)2014 1 1.42 0.70 (0.01–3.91)2013 0 1.34 0.00 (0.00–2.73)2012 1 1.87 0.53 (0.01–2.97)2011 0 1.92 0.00 (0.00–1.91)2010 2 2.34 0.85 (0.10–3.08)2009 2 2.33 0.86 (0.10–3.10)
CHESTER COUNTY HOSPITAL (12016)2014 0 1.46 0.00 (0.00–2.51)2013 1 1.46 0.68 (0.01–3.80)2012 6 2.00 3.00 (1.10–6.53)2011 2 1.75 1.14 (0.13–4.13)2010 1 2.12 0.47 (0.01–2.62)2009 3 2.22 1.35 (0.27–3.95)
SURGICAL INSTITUTE OF READING (12535)2014 1 1.48 0.67 (0.01–3.75)2013 3 1.27 2.36 (0.48–6.91)2012 1 1.61 0.62 (0.01–3.46)2011 1 1.55 0.65 (0.01–3.60)2010 0 2.14 0.00 (0.00–1.72)2009 0 2.39 0.00 (0.00–1.54)
GETTYSBURG HOSPITAL (11531)2014 2 1.55 1.29 (0.15–4.66)2013 1 1.10 0.91 (0.01–5.07)2012 2 1.45 1.38 (0.16–5.00)2011 2 1.35 1.49 (0.17–5.37)2010 1 1.37 0.73 (0.01–4.07)2009 0 1.42 0.00 (0.00–2.58)
CARLISLE REGIONAL MEDICAL CENTER (11997)2014 2 1.55 1.29 (0.14–4.65)2013 6 1.22 4.93 (1.80–10.73)2012 1 1.81 0.55 (0.01–3.07)2011 5 2.03 2.47 (0.79–5.75)2010 3 2.36 1.27 (0.26–3.71)2009 6 2.19 2.74 (1.00–5.96)
EPHRATA COMMUNITY HOSPITAL (11764)2014 1 1.55 0.64 (0.01–3.58)2013 1 1.59 0.63 (0.01–3.49)2012 2 1.91 1.05 (0.12–3.79)2011 7 1.64 4.26 (1.71–8.79)2010 5 1.89 2.65 (0.85–6.17)2009 2 1.94 1.03 (0.12–3.72)
GEISINGER-COMMUNITY MEDICAL CENTER (11914)2014 2 1.56 1.28 (0.14–4.63)2013 2 1.90 1.05 (0.12–3.80)2012 2 3.64 0.55 (0.06–1.98)2011 0 3.95 0.00 (0.00–0.93)2010 5 4.48 1.11 (0.36–2.60)2009 2 4.33 0.46 (0.05–1.67)
EINSTEIN AT ELKINS PARK (12500)2014 9 1.63 5.52 (2.52–10.49)2013 4 1.23 3.24 (0.87–8.30)2012 0 1.02 0.00 (0.00–3.58)2011 4 1.14 3.50 (0.94–8.96)2010 0 1.26 0.00 (0.00–2.90)2009 3 1.72 1.74 (0.35–5.09)
Continued on next page . . .
190

Table 4.5.11 – Rate of SSIs (SIR) — KPRO Procedures – Continued from previous page
Number of SSIs (KPRO) Predicted Number of SSIs (KPRO) SIR (95% CI)
WELLSPAN SURGERY AND REHABILITATION HOSPITAL (27430)2014 2 1.68 1.19 (0.13–4.31)2013 1 1.49 0.67 (0.01–3.73)2012 . . .2011 . . .2010 . . .2009 . . .
SURGICAL SPECIALTY CENTER AT COORDINATED HEALTH, THE (15259)2014 2 1.68 1.19 (0.13–4.29)2013 0 1.46 0.00 (0.00–2.51)2012 1 2.51 0.40 (0.01–2.21)2011 2 2.46 0.81 (0.09–2.94)2010 1 2.49 0.40 (0.01–2.23)2009 . . .
PHYSICIANS CARE SURGICAL HOSPITAL (19630)2014 1 1.74 0.58 (0.01–3.20)2013 0 1.16 0.00 (0.00–3.16)2012 0 0.35 0.00 (0.00–10.52)2011 0 0.35 0.00 (0.00–10.36)2010 . . .2009 . . .
UPMC EAST (28812)2014 2 1.74 1.15 (0.13–4.16)2013 1 0.80 1.25 (0.02–6.93)2012 . . .2011 . . .2010 . . .2009 . . .
WILKES-BARRE GENERAL HOSPITAL (11916)2014 1 1.79 0.56 (0.01–3.12)2013 2 1.78 1.13 (0.13–4.07)2012 3 2.86 1.05 (0.21–3.06)2011 3 2.74 1.09 (0.22–3.19)2010 1 3.34 0.30 (0.00–1.67)2009 1 3.42 0.29 (0.00–1.63)
LANCASTER REGIONAL MEDICAL CENTER (12335)2014 6 1.79 3.34 (1.22–7.28)2013 1 1.79 0.56 (0.01–3.11)2012 3 2.49 1.21 (0.24–3.53)2011 4 2.54 1.57 (0.42–4.03)2010 2 2.02 0.99 (0.11–3.57)2009 1 1.05 0.95 (0.01–5.29)
DOYLESTOWN HOSPITAL (10190)2014 2 1.86 1.07 (0.12–3.88)2013 2 1.90 1.05 (0.12–3.80)2012 0 2.35 0.00 (0.00–1.56)2011 1 2.04 0.49 (0.01–2.72)2010 1 2.42 0.41 (0.01–2.30)2009 0 2.16 0.00 (0.00–1.70)
ROTHMAN ORTHOPAEDIC SPECIALTY HOSPITAL (15202)2014 0 1.90 0.00 (0.00–1.93)2013 2 1.80 1.11 (0.12–4.01)2012 3 1.83 1.64 (0.33–4.78)2011 0 1.27 0.00 (0.00–2.88)2010 0 0.71 0.00 (0.00–5.16)2009 . . .
Continued on next page . . .
191
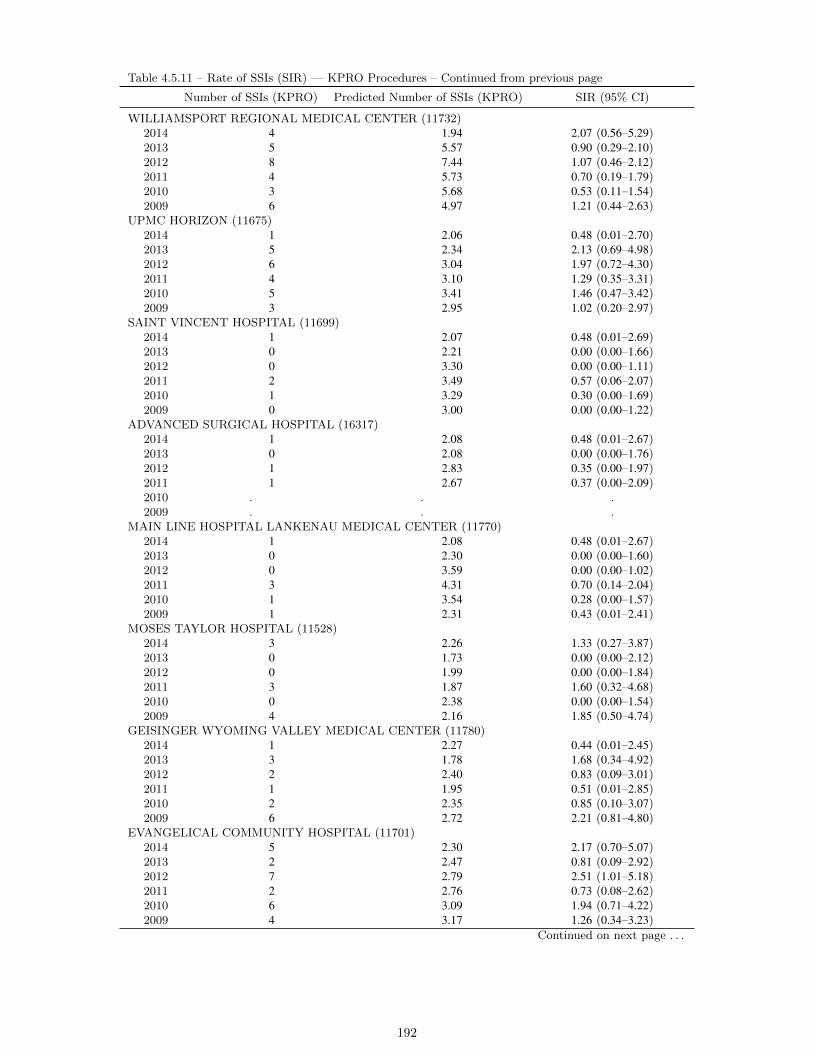
Table 4.5.11 – Rate of SSIs (SIR) — KPRO Procedures – Continued from previous page
Number of SSIs (KPRO) Predicted Number of SSIs (KPRO) SIR (95% CI)
WILLIAMSPORT REGIONAL MEDICAL CENTER (11732)2014 4 1.94 2.07 (0.56–5.29)2013 5 5.57 0.90 (0.29–2.10)2012 8 7.44 1.07 (0.46–2.12)2011 4 5.73 0.70 (0.19–1.79)2010 3 5.68 0.53 (0.11–1.54)2009 6 4.97 1.21 (0.44–2.63)
UPMC HORIZON (11675)2014 1 2.06 0.48 (0.01–2.70)2013 5 2.34 2.13 (0.69–4.98)2012 6 3.04 1.97 (0.72–4.30)2011 4 3.10 1.29 (0.35–3.31)2010 5 3.41 1.46 (0.47–3.42)2009 3 2.95 1.02 (0.20–2.97)
SAINT VINCENT HOSPITAL (11699)2014 1 2.07 0.48 (0.01–2.69)2013 0 2.21 0.00 (0.00–1.66)2012 0 3.30 0.00 (0.00–1.11)2011 2 3.49 0.57 (0.06–2.07)2010 1 3.29 0.30 (0.00–1.69)2009 0 3.00 0.00 (0.00–1.22)
ADVANCED SURGICAL HOSPITAL (16317)2014 1 2.08 0.48 (0.01–2.67)2013 0 2.08 0.00 (0.00–1.76)2012 1 2.83 0.35 (0.00–1.97)2011 1 2.67 0.37 (0.00–2.09)2010 . . .2009 . . .
MAIN LINE HOSPITAL LANKENAU MEDICAL CENTER (11770)2014 1 2.08 0.48 (0.01–2.67)2013 0 2.30 0.00 (0.00–1.60)2012 0 3.59 0.00 (0.00–1.02)2011 3 4.31 0.70 (0.14–2.04)2010 1 3.54 0.28 (0.00–1.57)2009 1 2.31 0.43 (0.01–2.41)
MOSES TAYLOR HOSPITAL (11528)2014 3 2.26 1.33 (0.27–3.87)2013 0 1.73 0.00 (0.00–2.12)2012 0 1.99 0.00 (0.00–1.84)2011 3 1.87 1.60 (0.32–4.68)2010 0 2.38 0.00 (0.00–1.54)2009 4 2.16 1.85 (0.50–4.74)
GEISINGER WYOMING VALLEY MEDICAL CENTER (11780)2014 1 2.27 0.44 (0.01–2.45)2013 3 1.78 1.68 (0.34–4.92)2012 2 2.40 0.83 (0.09–3.01)2011 1 1.95 0.51 (0.01–2.85)2010 2 2.35 0.85 (0.10–3.07)2009 6 2.72 2.21 (0.81–4.80)
EVANGELICAL COMMUNITY HOSPITAL (11701)2014 5 2.30 2.17 (0.70–5.07)2013 2 2.47 0.81 (0.09–2.92)2012 7 2.79 2.51 (1.01–5.18)2011 2 2.76 0.73 (0.08–2.62)2010 6 3.09 1.94 (0.71–4.22)2009 4 3.17 1.26 (0.34–3.23)
Continued on next page . . .
192
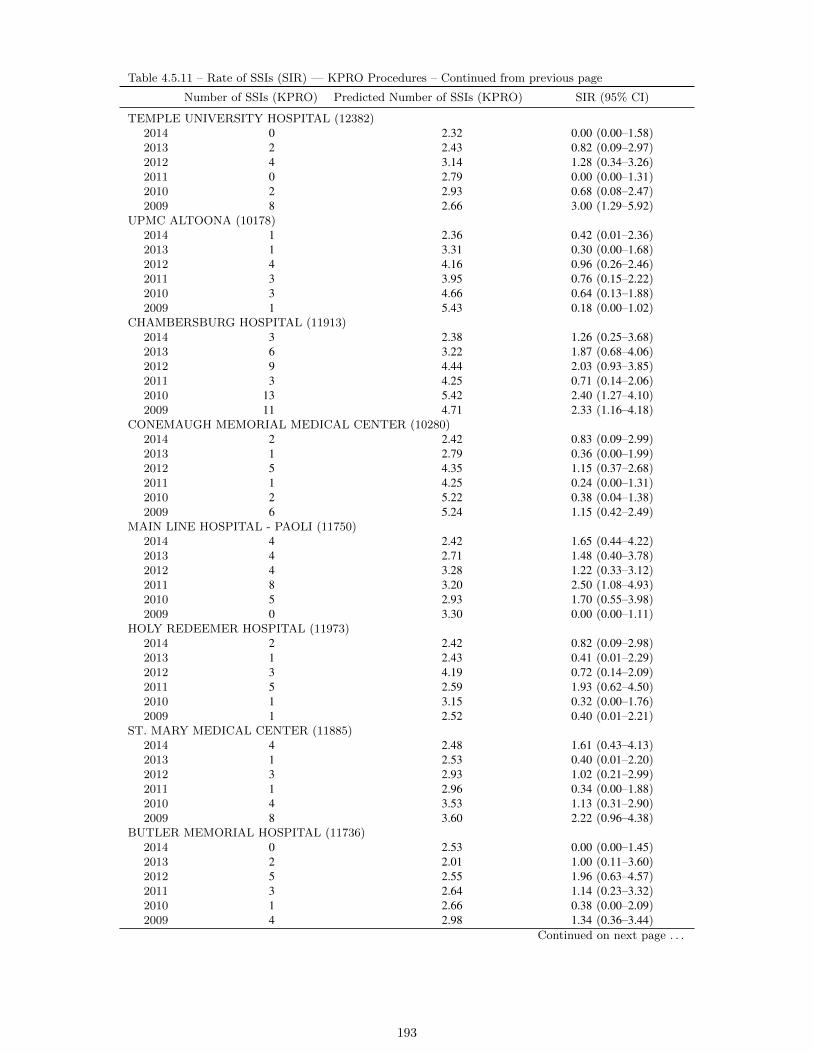
Table 4.5.11 – Rate of SSIs (SIR) — KPRO Procedures – Continued from previous page
Number of SSIs (KPRO) Predicted Number of SSIs (KPRO) SIR (95% CI)
TEMPLE UNIVERSITY HOSPITAL (12382)2014 0 2.32 0.00 (0.00–1.58)2013 2 2.43 0.82 (0.09–2.97)2012 4 3.14 1.28 (0.34–3.26)2011 0 2.79 0.00 (0.00–1.31)2010 2 2.93 0.68 (0.08–2.47)2009 8 2.66 3.00 (1.29–5.92)
UPMC ALTOONA (10178)2014 1 2.36 0.42 (0.01–2.36)2013 1 3.31 0.30 (0.00–1.68)2012 4 4.16 0.96 (0.26–2.46)2011 3 3.95 0.76 (0.15–2.22)2010 3 4.66 0.64 (0.13–1.88)2009 1 5.43 0.18 (0.00–1.02)
CHAMBERSBURG HOSPITAL (11913)2014 3 2.38 1.26 (0.25–3.68)2013 6 3.22 1.87 (0.68–4.06)2012 9 4.44 2.03 (0.93–3.85)2011 3 4.25 0.71 (0.14–2.06)2010 13 5.42 2.40 (1.27–4.10)2009 11 4.71 2.33 (1.16–4.18)
CONEMAUGH MEMORIAL MEDICAL CENTER (10280)2014 2 2.42 0.83 (0.09–2.99)2013 1 2.79 0.36 (0.00–1.99)2012 5 4.35 1.15 (0.37–2.68)2011 1 4.25 0.24 (0.00–1.31)2010 2 5.22 0.38 (0.04–1.38)2009 6 5.24 1.15 (0.42–2.49)
MAIN LINE HOSPITAL - PAOLI (11750)2014 4 2.42 1.65 (0.44–4.22)2013 4 2.71 1.48 (0.40–3.78)2012 4 3.28 1.22 (0.33–3.12)2011 8 3.20 2.50 (1.08–4.93)2010 5 2.93 1.70 (0.55–3.98)2009 0 3.30 0.00 (0.00–1.11)
HOLY REDEEMER HOSPITAL (11973)2014 2 2.42 0.82 (0.09–2.98)2013 1 2.43 0.41 (0.01–2.29)2012 3 4.19 0.72 (0.14–2.09)2011 5 2.59 1.93 (0.62–4.50)2010 1 3.15 0.32 (0.00–1.76)2009 1 2.52 0.40 (0.01–2.21)
ST. MARY MEDICAL CENTER (11885)2014 4 2.48 1.61 (0.43–4.13)2013 1 2.53 0.40 (0.01–2.20)2012 3 2.93 1.02 (0.21–2.99)2011 1 2.96 0.34 (0.00–1.88)2010 4 3.53 1.13 (0.31–2.90)2009 8 3.60 2.22 (0.96–4.38)
BUTLER MEMORIAL HOSPITAL (11736)2014 0 2.53 0.00 (0.00–1.45)2013 2 2.01 1.00 (0.11–3.60)2012 5 2.55 1.96 (0.63–4.57)2011 3 2.64 1.14 (0.23–3.32)2010 1 2.66 0.38 (0.00–2.09)2009 4 2.98 1.34 (0.36–3.44)
Continued on next page . . .
193
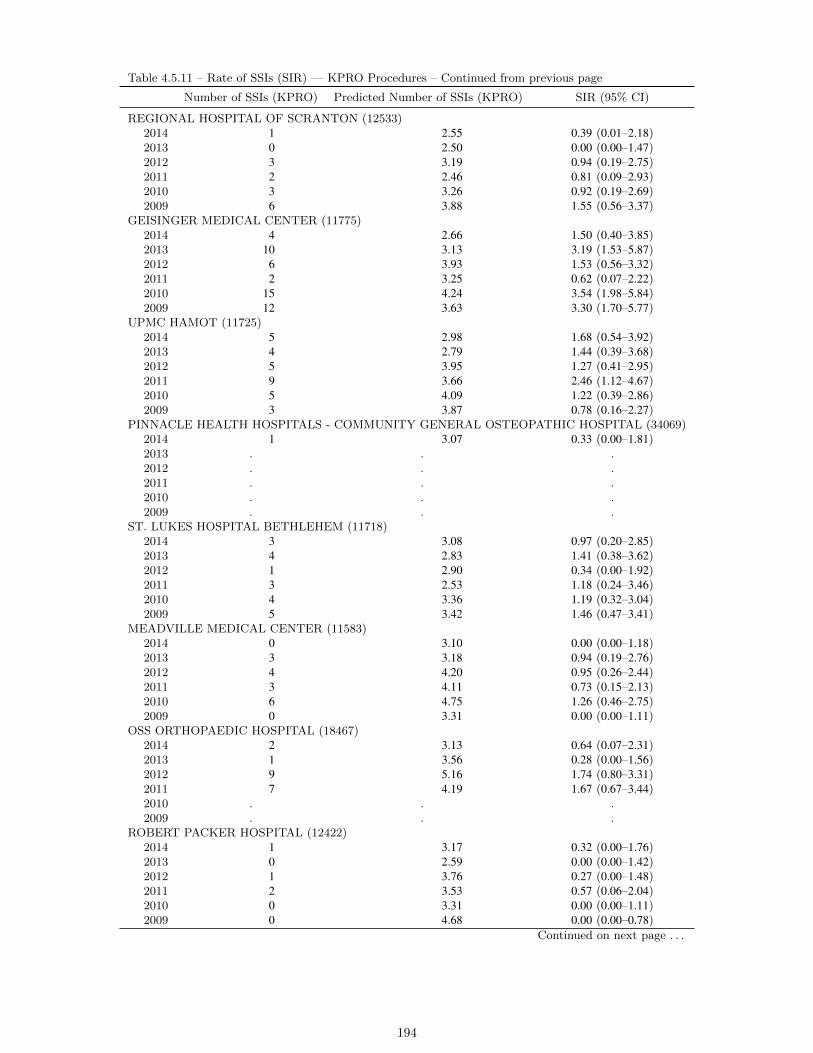
Table 4.5.11 – Rate of SSIs (SIR) — KPRO Procedures – Continued from previous page
Number of SSIs (KPRO) Predicted Number of SSIs (KPRO) SIR (95% CI)
REGIONAL HOSPITAL OF SCRANTON (12533)2014 1 2.55 0.39 (0.01–2.18)2013 0 2.50 0.00 (0.00–1.47)2012 3 3.19 0.94 (0.19–2.75)2011 2 2.46 0.81 (0.09–2.93)2010 3 3.26 0.92 (0.19–2.69)2009 6 3.88 1.55 (0.56–3.37)
GEISINGER MEDICAL CENTER (11775)2014 4 2.66 1.50 (0.40–3.85)2013 10 3.13 3.19 (1.53–5.87)2012 6 3.93 1.53 (0.56–3.32)2011 2 3.25 0.62 (0.07–2.22)2010 15 4.24 3.54 (1.98–5.84)2009 12 3.63 3.30 (1.70–5.77)
UPMC HAMOT (11725)2014 5 2.98 1.68 (0.54–3.92)2013 4 2.79 1.44 (0.39–3.68)2012 5 3.95 1.27 (0.41–2.95)2011 9 3.66 2.46 (1.12–4.67)2010 5 4.09 1.22 (0.39–2.86)2009 3 3.87 0.78 (0.16–2.27)
PINNACLE HEALTH HOSPITALS - COMMUNITY GENERAL OSTEOPATHIC HOSPITAL (34069)2014 1 3.07 0.33 (0.00–1.81)2013 . . .2012 . . .2011 . . .2010 . . .2009 . . .
ST. LUKES HOSPITAL BETHLEHEM (11718)2014 3 3.08 0.97 (0.20–2.85)2013 4 2.83 1.41 (0.38–3.62)2012 1 2.90 0.34 (0.00–1.92)2011 3 2.53 1.18 (0.24–3.46)2010 4 3.36 1.19 (0.32–3.04)2009 5 3.42 1.46 (0.47–3.41)
MEADVILLE MEDICAL CENTER (11583)2014 0 3.10 0.00 (0.00–1.18)2013 3 3.18 0.94 (0.19–2.76)2012 4 4.20 0.95 (0.26–2.44)2011 3 4.11 0.73 (0.15–2.13)2010 6 4.75 1.26 (0.46–2.75)2009 0 3.31 0.00 (0.00–1.11)
OSS ORTHOPAEDIC HOSPITAL (18467)2014 2 3.13 0.64 (0.07–2.31)2013 1 3.56 0.28 (0.00–1.56)2012 9 5.16 1.74 (0.80–3.31)2011 7 4.19 1.67 (0.67–3.44)2010 . . .2009 . . .
ROBERT PACKER HOSPITAL (12422)2014 1 3.17 0.32 (0.00–1.76)2013 0 2.59 0.00 (0.00–1.42)2012 1 3.76 0.27 (0.00–1.48)2011 2 3.53 0.57 (0.06–2.04)2010 0 3.31 0.00 (0.00–1.11)2009 0 4.68 0.00 (0.00–0.78)
Continued on next page . . .
194
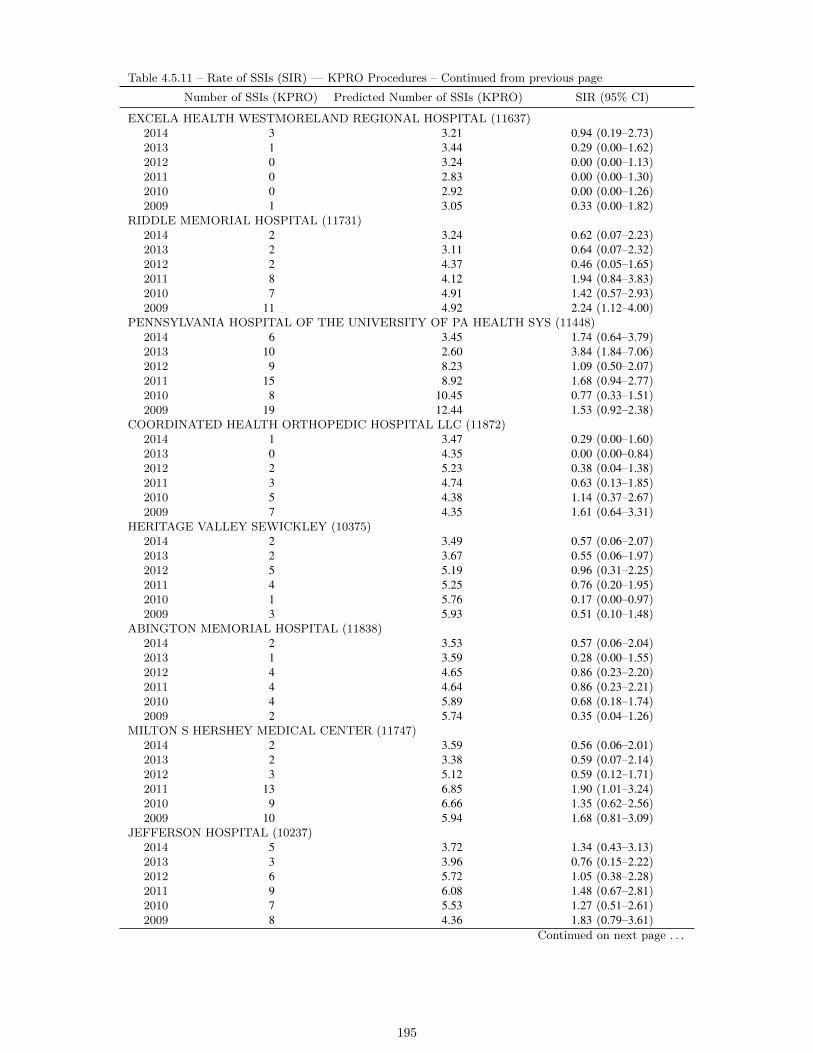
Table 4.5.11 – Rate of SSIs (SIR) — KPRO Procedures – Continued from previous page
Number of SSIs (KPRO) Predicted Number of SSIs (KPRO) SIR (95% CI)
EXCELA HEALTH WESTMORELAND REGIONAL HOSPITAL (11637)2014 3 3.21 0.94 (0.19–2.73)2013 1 3.44 0.29 (0.00–1.62)2012 0 3.24 0.00 (0.00–1.13)2011 0 2.83 0.00 (0.00–1.30)2010 0 2.92 0.00 (0.00–1.26)2009 1 3.05 0.33 (0.00–1.82)
RIDDLE MEMORIAL HOSPITAL (11731)2014 2 3.24 0.62 (0.07–2.23)2013 2 3.11 0.64 (0.07–2.32)2012 2 4.37 0.46 (0.05–1.65)2011 8 4.12 1.94 (0.84–3.83)2010 7 4.91 1.42 (0.57–2.93)2009 11 4.92 2.24 (1.12–4.00)
PENNSYLVANIA HOSPITAL OF THE UNIVERSITY OF PA HEALTH SYS (11448)2014 6 3.45 1.74 (0.64–3.79)2013 10 2.60 3.84 (1.84–7.06)2012 9 8.23 1.09 (0.50–2.07)2011 15 8.92 1.68 (0.94–2.77)2010 8 10.45 0.77 (0.33–1.51)2009 19 12.44 1.53 (0.92–2.38)
COORDINATED HEALTH ORTHOPEDIC HOSPITAL LLC (11872)2014 1 3.47 0.29 (0.00–1.60)2013 0 4.35 0.00 (0.00–0.84)2012 2 5.23 0.38 (0.04–1.38)2011 3 4.74 0.63 (0.13–1.85)2010 5 4.38 1.14 (0.37–2.67)2009 7 4.35 1.61 (0.64–3.31)
HERITAGE VALLEY SEWICKLEY (10375)2014 2 3.49 0.57 (0.06–2.07)2013 2 3.67 0.55 (0.06–1.97)2012 5 5.19 0.96 (0.31–2.25)2011 4 5.25 0.76 (0.20–1.95)2010 1 5.76 0.17 (0.00–0.97)2009 3 5.93 0.51 (0.10–1.48)
ABINGTON MEMORIAL HOSPITAL (11838)2014 2 3.53 0.57 (0.06–2.04)2013 1 3.59 0.28 (0.00–1.55)2012 4 4.65 0.86 (0.23–2.20)2011 4 4.64 0.86 (0.23–2.21)2010 4 5.89 0.68 (0.18–1.74)2009 2 5.74 0.35 (0.04–1.26)
MILTON S HERSHEY MEDICAL CENTER (11747)2014 2 3.59 0.56 (0.06–2.01)2013 2 3.38 0.59 (0.07–2.14)2012 3 5.12 0.59 (0.12–1.71)2011 13 6.85 1.90 (1.01–3.24)2010 9 6.66 1.35 (0.62–2.56)2009 10 5.94 1.68 (0.81–3.09)
JEFFERSON HOSPITAL (10237)2014 5 3.72 1.34 (0.43–3.13)2013 3 3.96 0.76 (0.15–2.22)2012 6 5.72 1.05 (0.38–2.28)2011 9 6.08 1.48 (0.67–2.81)2010 7 5.53 1.27 (0.51–2.61)2009 8 4.36 1.83 (0.79–3.61)
Continued on next page . . .
195

Table 4.5.11 – Rate of SSIs (SIR) — KPRO Procedures – Continued from previous page
Number of SSIs (KPRO) Predicted Number of SSIs (KPRO) SIR (95% CI)
PINNACLE HEALTH HOSPITALS - HARRISBURG HOSPITAL (34068)2014 0 3.73 0.00 (0.00–0.98)2013 . . .2012 . . .2011 . . .2010 . . .2009 . . .
UPMC PASSAVANT (11242)2014 0 3.75 0.00 (0.00–0.98)2013 1 3.80 0.26 (0.00–1.46)2012 4 4.28 0.93 (0.25–2.39)2011 2 3.93 0.51 (0.06–1.84)2010 2 4.06 0.49 (0.06–1.78)2009 1 3.88 0.26 (0.00–1.43)
ST. CLAIR MEMORIAL HOSPITAL (10561)2014 4 3.84 1.04 (0.28–2.67)2013 3 3.95 0.76 (0.15–2.22)2012 10 5.32 1.88 (0.90–3.46)2011 9 5.59 1.61 (0.74–3.06)2010 5 4.51 1.11 (0.36–2.59)2009 5 4.23 1.18 (0.38–2.76)
READING HOSPITAL (12375)2014 1 3.84 0.26 (0.00–1.45)2013 3 4.22 0.71 (0.14–2.08)2012 3 5.32 0.56 (0.11–1.65)2011 1 5.22 0.19 (0.00–1.07)2010 2 5.69 0.35 (0.04–1.27)2009 2 6.25 0.32 (0.04–1.15)
ARIA HEALTH (11388)2014 4 4.38 0.91 (0.25–2.34)2013 3 4.16 0.72 (0.15–2.11)2012 1 1.60 0.62 (0.01–3.47)2011 4 1.90 2.10 (0.56–5.38)2010 4 1.42 2.82 (0.76–7.22)2009 2 1.27 1.58 (0.18–5.69)
MAGEE WOMENS HOSPITAL OF UPMC HEALTH SYSTEM (10301)2014 2 4.54 0.44 (0.05–1.59)2013 1 4.17 0.24 (0.00–1.33)2012 5 5.10 0.98 (0.32–2.29)2011 3 6.33 0.47 (0.10–1.38)2010 2 5.28 0.38 (0.04–1.37)2009 0 4.70 0.00 (0.00–0.78)
ALLEGHENY GENERAL HOSPITAL (10648)2014 2 4.60 0.43 (0.05–1.57)2013 5 4.50 1.11 (0.36–2.59)2012 5 6.84 0.73 (0.24–1.71)2011 4 7.13 0.56 (0.15–1.44)2010 5 7.33 0.68 (0.22–1.59)2009 3 8.54 0.35 (0.07–1.03)
MAIN LINE HOSPITAL BRYN MAWR (11753)2014 5 4.61 1.08 (0.35–2.53)2013 4 5.57 0.72 (0.19–1.84)2012 6 7.25 0.83 (0.30–1.80)2011 4 7.10 0.56 (0.15–1.44)2010 6 6.98 0.86 (0.31–1.87)2009 3 7.05 0.43 (0.09–1.24)
Continued on next page . . .
196
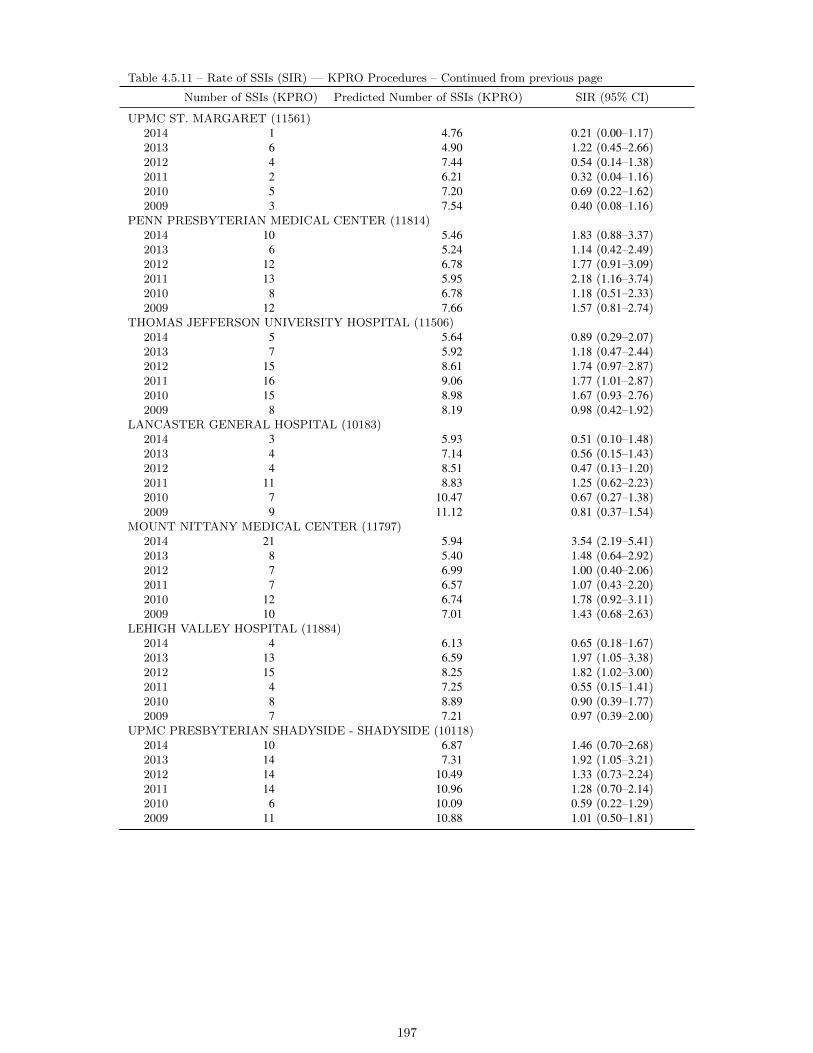
Table 4.5.11 – Rate of SSIs (SIR) — KPRO Procedures – Continued from previous page
Number of SSIs (KPRO) Predicted Number of SSIs (KPRO) SIR (95% CI)
UPMC ST. MARGARET (11561)2014 1 4.76 0.21 (0.00–1.17)2013 6 4.90 1.22 (0.45–2.66)2012 4 7.44 0.54 (0.14–1.38)2011 2 6.21 0.32 (0.04–1.16)2010 5 7.20 0.69 (0.22–1.62)2009 3 7.54 0.40 (0.08–1.16)
PENN PRESBYTERIAN MEDICAL CENTER (11814)2014 10 5.46 1.83 (0.88–3.37)2013 6 5.24 1.14 (0.42–2.49)2012 12 6.78 1.77 (0.91–3.09)2011 13 5.95 2.18 (1.16–3.74)2010 8 6.78 1.18 (0.51–2.33)2009 12 7.66 1.57 (0.81–2.74)
THOMAS JEFFERSON UNIVERSITY HOSPITAL (11506)2014 5 5.64 0.89 (0.29–2.07)2013 7 5.92 1.18 (0.47–2.44)2012 15 8.61 1.74 (0.97–2.87)2011 16 9.06 1.77 (1.01–2.87)2010 15 8.98 1.67 (0.93–2.76)2009 8 8.19 0.98 (0.42–1.92)
LANCASTER GENERAL HOSPITAL (10183)2014 3 5.93 0.51 (0.10–1.48)2013 4 7.14 0.56 (0.15–1.43)2012 4 8.51 0.47 (0.13–1.20)2011 11 8.83 1.25 (0.62–2.23)2010 7 10.47 0.67 (0.27–1.38)2009 9 11.12 0.81 (0.37–1.54)
MOUNT NITTANY MEDICAL CENTER (11797)2014 21 5.94 3.54 (2.19–5.41)2013 8 5.40 1.48 (0.64–2.92)2012 7 6.99 1.00 (0.40–2.06)2011 7 6.57 1.07 (0.43–2.20)2010 12 6.74 1.78 (0.92–3.11)2009 10 7.01 1.43 (0.68–2.63)
LEHIGH VALLEY HOSPITAL (11884)2014 4 6.13 0.65 (0.18–1.67)2013 13 6.59 1.97 (1.05–3.38)2012 15 8.25 1.82 (1.02–3.00)2011 4 7.25 0.55 (0.15–1.41)2010 8 8.89 0.90 (0.39–1.77)2009 7 7.21 0.97 (0.39–2.00)
UPMC PRESBYTERIAN SHADYSIDE - SHADYSIDE (10118)2014 10 6.87 1.46 (0.70–2.68)2013 14 7.31 1.92 (1.05–3.21)2012 14 10.49 1.33 (0.73–2.24)2011 14 10.96 1.28 (0.70–2.14)2010 6 10.09 0.59 (0.22–1.29)2009 11 10.88 1.01 (0.50–1.81)
197
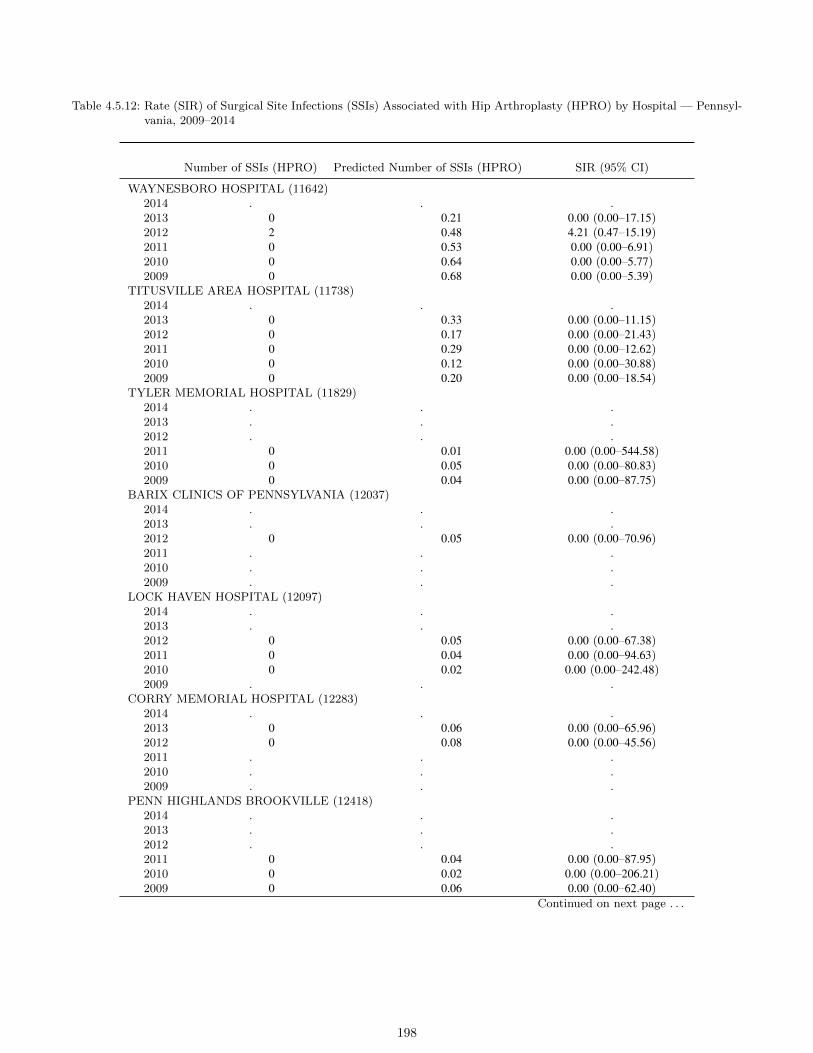
Table 4.5.12: Rate (SIR) of Surgical Site Infections (SSIs) Associated with Hip Arthroplasty (HPRO) by Hospital — Pennsyl-vania, 2009–2014
Number of SSIs (HPRO) Predicted Number of SSIs (HPRO) SIR (95% CI)
WAYNESBORO HOSPITAL (11642)2014 . . .2013 0 0.21 0.00 (0.00–17.15)2012 2 0.48 4.21 (0.47–15.19)2011 0 0.53 0.00 (0.00–6.91)2010 0 0.64 0.00 (0.00–5.77)2009 0 0.68 0.00 (0.00–5.39)
TITUSVILLE AREA HOSPITAL (11738)2014 . . .2013 0 0.33 0.00 (0.00–11.15)2012 0 0.17 0.00 (0.00–21.43)2011 0 0.29 0.00 (0.00–12.62)2010 0 0.12 0.00 (0.00–30.88)2009 0 0.20 0.00 (0.00–18.54)
TYLER MEMORIAL HOSPITAL (11829)2014 . . .2013 . . .2012 . . .2011 0 0.01 0.00 (0.00–544.58)2010 0 0.05 0.00 (0.00–80.83)2009 0 0.04 0.00 (0.00–87.75)
BARIX CLINICS OF PENNSYLVANIA (12037)2014 . . .2013 . . .2012 0 0.05 0.00 (0.00–70.96)2011 . . .2010 . . .2009 . . .
LOCK HAVEN HOSPITAL (12097)2014 . . .2013 . . .2012 0 0.05 0.00 (0.00–67.38)2011 0 0.04 0.00 (0.00–94.63)2010 0 0.02 0.00 (0.00–242.48)2009 . . .
CORRY MEMORIAL HOSPITAL (12283)2014 . . .2013 0 0.06 0.00 (0.00–65.96)2012 0 0.08 0.00 (0.00–45.56)2011 . . .2010 . . .2009 . . .
PENN HIGHLANDS BROOKVILLE (12418)2014 . . .2013 . . .2012 . . .2011 0 0.04 0.00 (0.00–87.95)2010 0 0.02 0.00 (0.00–206.21)2009 0 0.06 0.00 (0.00–62.40)
Continued on next page . . .
198
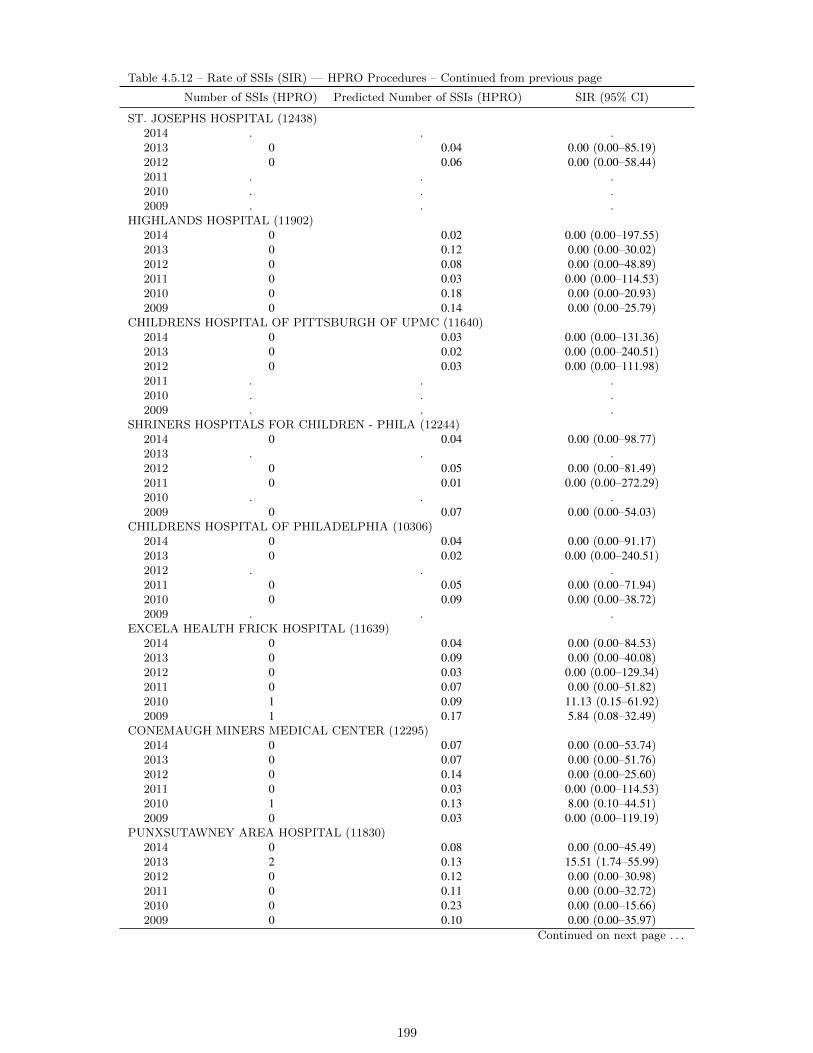
Table 4.5.12 – Rate of SSIs (SIR) — HPRO Procedures – Continued from previous page
Number of SSIs (HPRO) Predicted Number of SSIs (HPRO) SIR (95% CI)
ST. JOSEPHS HOSPITAL (12438)2014 . . .2013 0 0.04 0.00 (0.00–85.19)2012 0 0.06 0.00 (0.00–58.44)2011 . . .2010 . . .2009 . . .
HIGHLANDS HOSPITAL (11902)2014 0 0.02 0.00 (0.00–197.55)2013 0 0.12 0.00 (0.00–30.02)2012 0 0.08 0.00 (0.00–48.89)2011 0 0.03 0.00 (0.00–114.53)2010 0 0.18 0.00 (0.00–20.93)2009 0 0.14 0.00 (0.00–25.79)
CHILDRENS HOSPITAL OF PITTSBURGH OF UPMC (11640)2014 0 0.03 0.00 (0.00–131.36)2013 0 0.02 0.00 (0.00–240.51)2012 0 0.03 0.00 (0.00–111.98)2011 . . .2010 . . .2009 . . .
SHRINERS HOSPITALS FOR CHILDREN - PHILA (12244)2014 0 0.04 0.00 (0.00–98.77)2013 . . .2012 0 0.05 0.00 (0.00–81.49)2011 0 0.01 0.00 (0.00–272.29)2010 . . .2009 0 0.07 0.00 (0.00–54.03)
CHILDRENS HOSPITAL OF PHILADELPHIA (10306)2014 0 0.04 0.00 (0.00–91.17)2013 0 0.02 0.00 (0.00–240.51)2012 . . .2011 0 0.05 0.00 (0.00–71.94)2010 0 0.09 0.00 (0.00–38.72)2009 . . .
EXCELA HEALTH FRICK HOSPITAL (11639)2014 0 0.04 0.00 (0.00–84.53)2013 0 0.09 0.00 (0.00–40.08)2012 0 0.03 0.00 (0.00–129.34)2011 0 0.07 0.00 (0.00–51.82)2010 1 0.09 11.13 (0.15–61.92)2009 1 0.17 5.84 (0.08–32.49)
CONEMAUGH MINERS MEDICAL CENTER (12295)2014 0 0.07 0.00 (0.00–53.74)2013 0 0.07 0.00 (0.00–51.76)2012 0 0.14 0.00 (0.00–25.60)2011 0 0.03 0.00 (0.00–114.53)2010 1 0.13 8.00 (0.10–44.51)2009 0 0.03 0.00 (0.00–119.19)
PUNXSUTAWNEY AREA HOSPITAL (11830)2014 0 0.08 0.00 (0.00–45.49)2013 2 0.13 15.51 (1.74–55.99)2012 0 0.12 0.00 (0.00–30.98)2011 0 0.11 0.00 (0.00–32.72)2010 0 0.23 0.00 (0.00–15.66)2009 0 0.10 0.00 (0.00–35.97)
Continued on next page . . .
199
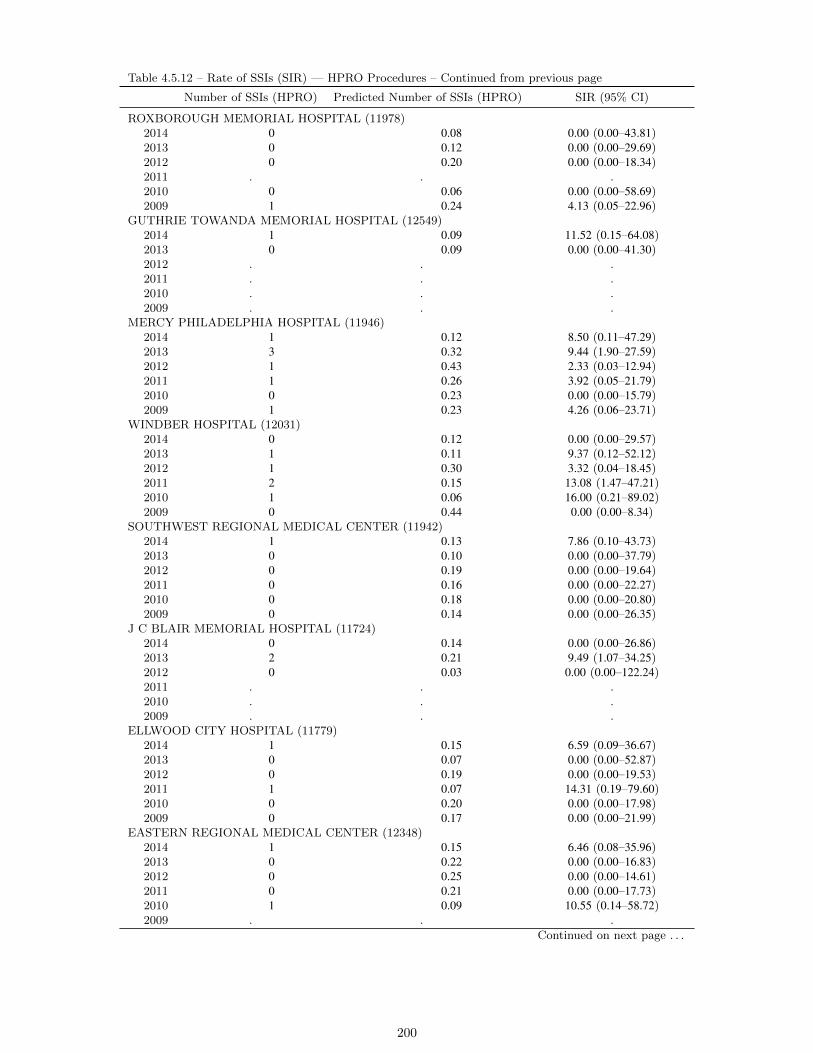
Table 4.5.12 – Rate of SSIs (SIR) — HPRO Procedures – Continued from previous page
Number of SSIs (HPRO) Predicted Number of SSIs (HPRO) SIR (95% CI)
ROXBOROUGH MEMORIAL HOSPITAL (11978)2014 0 0.08 0.00 (0.00–43.81)2013 0 0.12 0.00 (0.00–29.69)2012 0 0.20 0.00 (0.00–18.34)2011 . . .2010 0 0.06 0.00 (0.00–58.69)2009 1 0.24 4.13 (0.05–22.96)
GUTHRIE TOWANDA MEMORIAL HOSPITAL (12549)2014 1 0.09 11.52 (0.15–64.08)2013 0 0.09 0.00 (0.00–41.30)2012 . . .2011 . . .2010 . . .2009 . . .
MERCY PHILADELPHIA HOSPITAL (11946)2014 1 0.12 8.50 (0.11–47.29)2013 3 0.32 9.44 (1.90–27.59)2012 1 0.43 2.33 (0.03–12.94)2011 1 0.26 3.92 (0.05–21.79)2010 0 0.23 0.00 (0.00–15.79)2009 1 0.23 4.26 (0.06–23.71)
WINDBER HOSPITAL (12031)2014 0 0.12 0.00 (0.00–29.57)2013 1 0.11 9.37 (0.12–52.12)2012 1 0.30 3.32 (0.04–18.45)2011 2 0.15 13.08 (1.47–47.21)2010 1 0.06 16.00 (0.21–89.02)2009 0 0.44 0.00 (0.00–8.34)
SOUTHWEST REGIONAL MEDICAL CENTER (11942)2014 1 0.13 7.86 (0.10–43.73)2013 0 0.10 0.00 (0.00–37.79)2012 0 0.19 0.00 (0.00–19.64)2011 0 0.16 0.00 (0.00–22.27)2010 0 0.18 0.00 (0.00–20.80)2009 0 0.14 0.00 (0.00–26.35)
J C BLAIR MEMORIAL HOSPITAL (11724)2014 0 0.14 0.00 (0.00–26.86)2013 2 0.21 9.49 (1.07–34.25)2012 0 0.03 0.00 (0.00–122.24)2011 . . .2010 . . .2009 . . .
ELLWOOD CITY HOSPITAL (11779)2014 1 0.15 6.59 (0.09–36.67)2013 0 0.07 0.00 (0.00–52.87)2012 0 0.19 0.00 (0.00–19.53)2011 1 0.07 14.31 (0.19–79.60)2010 0 0.20 0.00 (0.00–17.98)2009 0 0.17 0.00 (0.00–21.99)
EASTERN REGIONAL MEDICAL CENTER (12348)2014 1 0.15 6.46 (0.08–35.96)2013 0 0.22 0.00 (0.00–16.83)2012 0 0.25 0.00 (0.00–14.61)2011 0 0.21 0.00 (0.00–17.73)2010 1 0.09 10.55 (0.14–58.72)2009 . . .
Continued on next page . . .
200

Table 4.5.12 – Rate of SSIs (SIR) — HPRO Procedures – Continued from previous page
Number of SSIs (HPRO) Predicted Number of SSIs (HPRO) SIR (95% CI)
ST. LUKES MINERS MEMORIAL HOSPITAL (11784)2014 0 0.16 0.00 (0.00–22.31)2013 3 0.31 9.65 (1.94–28.19)2012 1 0.45 2.20 (0.03–12.25)2011 0 0.22 0.00 (0.00–16.30)2010 0 0.09 0.00 (0.00–39.26)2009 0 0.26 0.00 (0.00–13.97)
JERSEY SHORE HOSPITAL (11689)2014 0 0.17 0.00 (0.00–21.51)2013 0 0.11 0.00 (0.00–34.31)2012 0 0.10 0.00 (0.00–37.93)2011 0 0.25 0.00 (0.00–14.81)2010 0 0.13 0.00 (0.00–27.40)2009 0 0.13 0.00 (0.00–28.99)
UPMC BEDFORD (11680)2014 0 0.20 0.00 (0.00–17.93)2013 0 0.26 0.00 (0.00–13.84)2012 0 0.20 0.00 (0.00–18.03)2011 0 0.30 0.00 (0.00–12.23)2010 0 0.12 0.00 (0.00–30.71)2009 0 0.25 0.00 (0.00–14.83)
KANE COMMUNITY HOSPITAL (12111)2014 1 0.25 3.98 (0.05–22.15)2013 0 0.13 0.00 (0.00–27.82)2012 0 0.18 0.00 (0.00–20.84)2011 0 0.21 0.00 (0.00–17.73)2010 . . .2009 0 0.06 0.00 (0.00–62.55)
SUNBURY COMMUNITY HOSP (12105)2014 0 0.26 0.00 (0.00–13.91)2013 0 0.49 0.00 (0.00–7.49)2012 0 0.55 0.00 (0.00–6.67)2011 0 0.65 0.00 (0.00–5.65)2010 1 0.79 1.27 (0.02–7.09)2009 0 0.55 0.00 (0.00–6.66)
GEISINGER-BLOOMSBURG HOSPITAL (12008)2014 2 0.28 7.26 (0.82–26.23)2013 0 0.79 0.00 (0.00–4.66)2012 2 0.84 2.39 (0.27–8.64)2011 0 1.00 0.00 (0.00–3.65)2010 1 0.90 1.12 (0.01–6.21)2009 1 0.80 1.25 (0.02–6.93)
PENN HIGHLANDS ELK (11859)2014 0 0.28 0.00 (0.00–13.16)2013 0 0.58 0.00 (0.00–6.31)2012 1 0.59 1.69 (0.02–9.43)2011 0 0.80 0.00 (0.00–4.57)2010 0 0.81 0.00 (0.00–4.51)2009 0 0.82 0.00 (0.00–4.48)
PALMERTON HOSPITAL (12396)2014 0 0.28 0.00 (0.00–12.99)2013 0 0.28 0.00 (0.00–13.29)2012 0 0.41 0.00 (0.00–9.04)2011 0 0.39 0.00 (0.00–9.52)2010 0 0.44 0.00 (0.00–8.31)2009 0 0.41 0.00 (0.00–9.02)
Continued on next page . . .
201
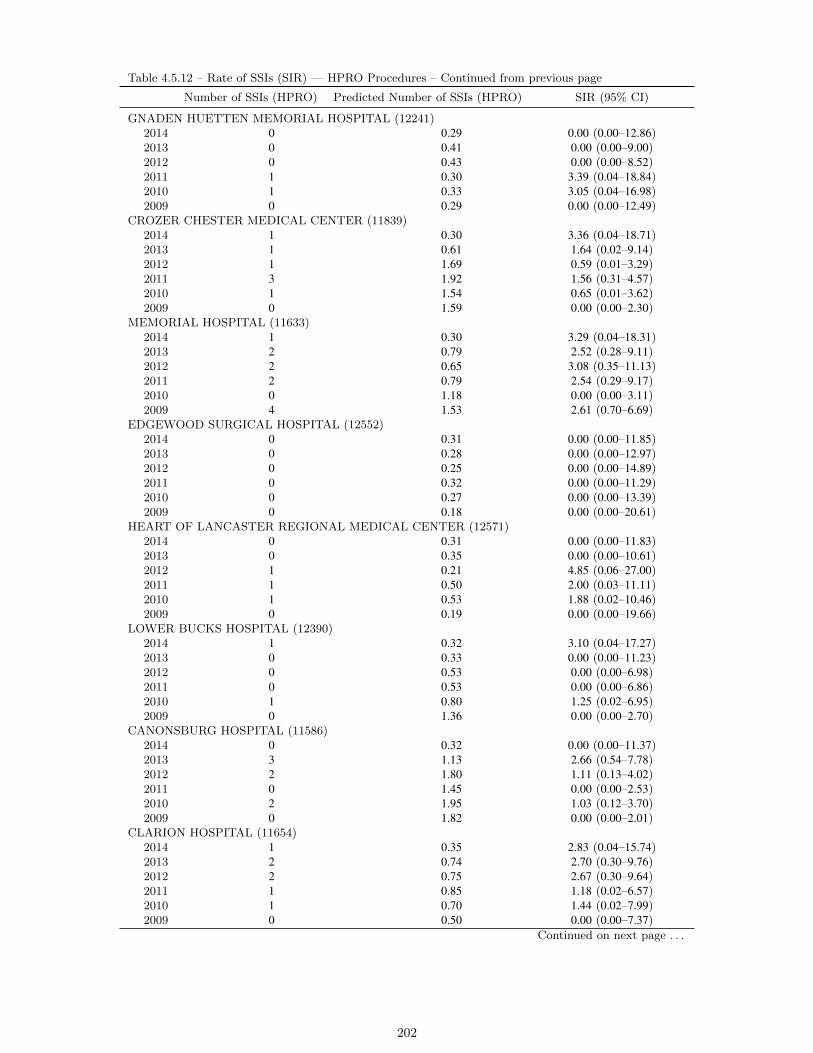
Table 4.5.12 – Rate of SSIs (SIR) — HPRO Procedures – Continued from previous page
Number of SSIs (HPRO) Predicted Number of SSIs (HPRO) SIR (95% CI)
GNADEN HUETTEN MEMORIAL HOSPITAL (12241)2014 0 0.29 0.00 (0.00–12.86)2013 0 0.41 0.00 (0.00–9.00)2012 0 0.43 0.00 (0.00–8.52)2011 1 0.30 3.39 (0.04–18.84)2010 1 0.33 3.05 (0.04–16.98)2009 0 0.29 0.00 (0.00–12.49)
CROZER CHESTER MEDICAL CENTER (11839)2014 1 0.30 3.36 (0.04–18.71)2013 1 0.61 1.64 (0.02–9.14)2012 1 1.69 0.59 (0.01–3.29)2011 3 1.92 1.56 (0.31–4.57)2010 1 1.54 0.65 (0.01–3.62)2009 0 1.59 0.00 (0.00–2.30)
MEMORIAL HOSPITAL (11633)2014 1 0.30 3.29 (0.04–18.31)2013 2 0.79 2.52 (0.28–9.11)2012 2 0.65 3.08 (0.35–11.13)2011 2 0.79 2.54 (0.29–9.17)2010 0 1.18 0.00 (0.00–3.11)2009 4 1.53 2.61 (0.70–6.69)
EDGEWOOD SURGICAL HOSPITAL (12552)2014 0 0.31 0.00 (0.00–11.85)2013 0 0.28 0.00 (0.00–12.97)2012 0 0.25 0.00 (0.00–14.89)2011 0 0.32 0.00 (0.00–11.29)2010 0 0.27 0.00 (0.00–13.39)2009 0 0.18 0.00 (0.00–20.61)
HEART OF LANCASTER REGIONAL MEDICAL CENTER (12571)2014 0 0.31 0.00 (0.00–11.83)2013 0 0.35 0.00 (0.00–10.61)2012 1 0.21 4.85 (0.06–27.00)2011 1 0.50 2.00 (0.03–11.11)2010 1 0.53 1.88 (0.02–10.46)2009 0 0.19 0.00 (0.00–19.66)
LOWER BUCKS HOSPITAL (12390)2014 1 0.32 3.10 (0.04–17.27)2013 0 0.33 0.00 (0.00–11.23)2012 0 0.53 0.00 (0.00–6.98)2011 0 0.53 0.00 (0.00–6.86)2010 1 0.80 1.25 (0.02–6.95)2009 0 1.36 0.00 (0.00–2.70)
CANONSBURG HOSPITAL (11586)2014 0 0.32 0.00 (0.00–11.37)2013 3 1.13 2.66 (0.54–7.78)2012 2 1.80 1.11 (0.13–4.02)2011 0 1.45 0.00 (0.00–2.53)2010 2 1.95 1.03 (0.12–3.70)2009 0 1.82 0.00 (0.00–2.01)
CLARION HOSPITAL (11654)2014 1 0.35 2.83 (0.04–15.74)2013 2 0.74 2.70 (0.30–9.76)2012 2 0.75 2.67 (0.30–9.64)2011 1 0.85 1.18 (0.02–6.57)2010 1 0.70 1.44 (0.02–7.99)2009 0 0.50 0.00 (0.00–7.37)
Continued on next page . . .
202
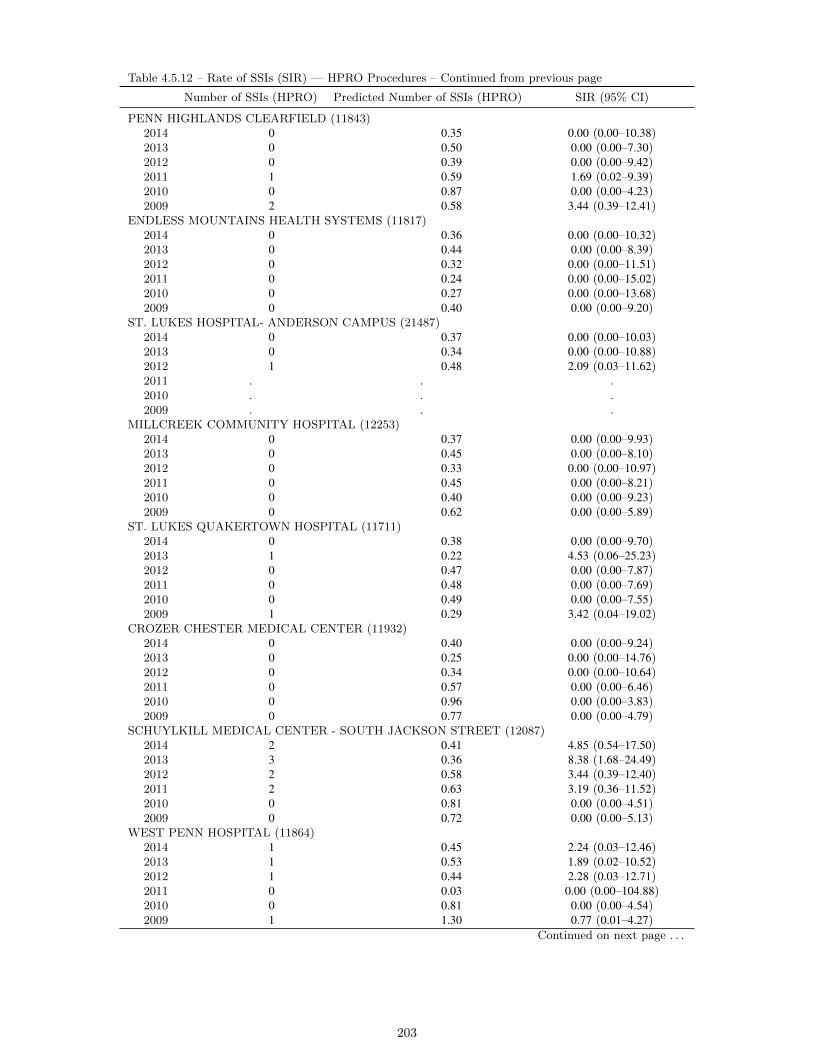
Table 4.5.12 – Rate of SSIs (SIR) — HPRO Procedures – Continued from previous page
Number of SSIs (HPRO) Predicted Number of SSIs (HPRO) SIR (95% CI)
PENN HIGHLANDS CLEARFIELD (11843)2014 0 0.35 0.00 (0.00–10.38)2013 0 0.50 0.00 (0.00–7.30)2012 0 0.39 0.00 (0.00–9.42)2011 1 0.59 1.69 (0.02–9.39)2010 0 0.87 0.00 (0.00–4.23)2009 2 0.58 3.44 (0.39–12.41)
ENDLESS MOUNTAINS HEALTH SYSTEMS (11817)2014 0 0.36 0.00 (0.00–10.32)2013 0 0.44 0.00 (0.00–8.39)2012 0 0.32 0.00 (0.00–11.51)2011 0 0.24 0.00 (0.00–15.02)2010 0 0.27 0.00 (0.00–13.68)2009 0 0.40 0.00 (0.00–9.20)
ST. LUKES HOSPITAL- ANDERSON CAMPUS (21487)2014 0 0.37 0.00 (0.00–10.03)2013 0 0.34 0.00 (0.00–10.88)2012 1 0.48 2.09 (0.03–11.62)2011 . . .2010 . . .2009 . . .
MILLCREEK COMMUNITY HOSPITAL (12253)2014 0 0.37 0.00 (0.00–9.93)2013 0 0.45 0.00 (0.00–8.10)2012 0 0.33 0.00 (0.00–10.97)2011 0 0.45 0.00 (0.00–8.21)2010 0 0.40 0.00 (0.00–9.23)2009 0 0.62 0.00 (0.00–5.89)
ST. LUKES QUAKERTOWN HOSPITAL (11711)2014 0 0.38 0.00 (0.00–9.70)2013 1 0.22 4.53 (0.06–25.23)2012 0 0.47 0.00 (0.00–7.87)2011 0 0.48 0.00 (0.00–7.69)2010 0 0.49 0.00 (0.00–7.55)2009 1 0.29 3.42 (0.04–19.02)
CROZER CHESTER MEDICAL CENTER (11932)2014 0 0.40 0.00 (0.00–9.24)2013 0 0.25 0.00 (0.00–14.76)2012 0 0.34 0.00 (0.00–10.64)2011 0 0.57 0.00 (0.00–6.46)2010 0 0.96 0.00 (0.00–3.83)2009 0 0.77 0.00 (0.00–4.79)
SCHUYLKILL MEDICAL CENTER - SOUTH JACKSON STREET (12087)2014 2 0.41 4.85 (0.54–17.50)2013 3 0.36 8.38 (1.68–24.49)2012 2 0.58 3.44 (0.39–12.40)2011 2 0.63 3.19 (0.36–11.52)2010 0 0.81 0.00 (0.00–4.51)2009 0 0.72 0.00 (0.00–5.13)
WEST PENN HOSPITAL (11864)2014 1 0.45 2.24 (0.03–12.46)2013 1 0.53 1.89 (0.02–10.52)2012 1 0.44 2.28 (0.03–12.71)2011 0 0.03 0.00 (0.00–104.88)2010 0 0.81 0.00 (0.00–4.54)2009 1 1.30 0.77 (0.01–4.27)
Continued on next page . . .
203

Table 4.5.12 – Rate of SSIs (SIR) — HPRO Procedures – Continued from previous page
Number of SSIs (HPRO) Predicted Number of SSIs (HPRO) SIR (95% CI)
SOLDIERS AND SAILORS MEMORIAL HOSPITAL (11688)2014 1 0.46 2.18 (0.03–12.13)2013 0 0.39 0.00 (0.00–9.34)2012 0 0.28 0.00 (0.00–12.90)2011 0 0.30 0.00 (0.00–12.23)2010 0 0.28 0.00 (0.00–13.26)2009 0 0.24 0.00 (0.00–15.33)
GROVE CITY MEDICAL CENTER (11722)2014 1 0.47 2.12 (0.03–11.81)2013 1 0.41 2.46 (0.03–13.69)2012 2 0.33 6.09 (0.68–21.98)2011 1 0.48 2.09 (0.03–11.62)2010 0 0.38 0.00 (0.00–9.54)2009 0 0.37 0.00 (0.00–9.79)
LEHIGH VALLEY HOSPITAL - HAZLETON (11878)2014 2 0.47 4.21 (0.47–15.21)2013 2 0.38 5.32 (0.60–19.21)2012 2 0.57 3.54 (0.40–12.77)2011 1 0.42 2.39 (0.03–13.31)2010 4 0.93 4.30 (1.16–11.01)2009 0 0.29 0.00 (0.00–12.69)
TYRONE HOSPITAL (12717)2014 1 0.49 2.03 (0.03–11.29)2013 0 0.26 0.00 (0.00–14.21)2012 2 0.23 8.88 (1.00–32.05)2011 0 0.12 0.00 (0.00–31.79)2010 0 0.07 0.00 (0.00–55.72)2009 0 0.02 0.00 (0.00–237.34)
MERCY SUBURBAN HOSPITAL (11952)2014 1 0.55 1.83 (0.02–10.20)2013 1 0.64 1.57 (0.02–8.73)2012 0 0.73 0.00 (0.00–5.04)2011 1 1.00 1.00 (0.01–5.54)2010 2 0.70 2.85 (0.32–10.30)2009 0 0.86 0.00 (0.00–4.25)
JENNERSVILLE REGIONAL HOSPITAL (12337)2014 1 0.56 1.78 (0.02–9.91)2013 1 0.39 2.53 (0.03–14.10)2012 1 0.45 2.20 (0.03–12.25)2011 1 0.42 2.36 (0.03–13.13)2010 0 0.39 0.00 (0.00–9.51)2009 0 0.51 0.00 (0.00–7.22)
SOMERSET HOSPITAL (12282)2014 0 0.57 0.00 (0.00–6.39)2013 0 0.12 0.00 (0.00–31.85)2012 0 0.12 0.00 (0.00–29.72)2011 0 0.19 0.00 (0.00–19.34)2010 0 0.43 0.00 (0.00–8.52)2009 0 0.99 0.00 (0.00–3.69)
BERWICK HOSPITAL CENTER (11442)2014 1 0.58 1.72 (0.02–9.54)2013 0 0.29 0.00 (0.00–12.77)2012 2 0.39 5.15 (0.58–18.59)2011 0 0.45 0.00 (0.00–8.08)2010 0 0.63 0.00 (0.00–5.80)2009 0 0.57 0.00 (0.00–6.44)
Continued on next page . . .
204
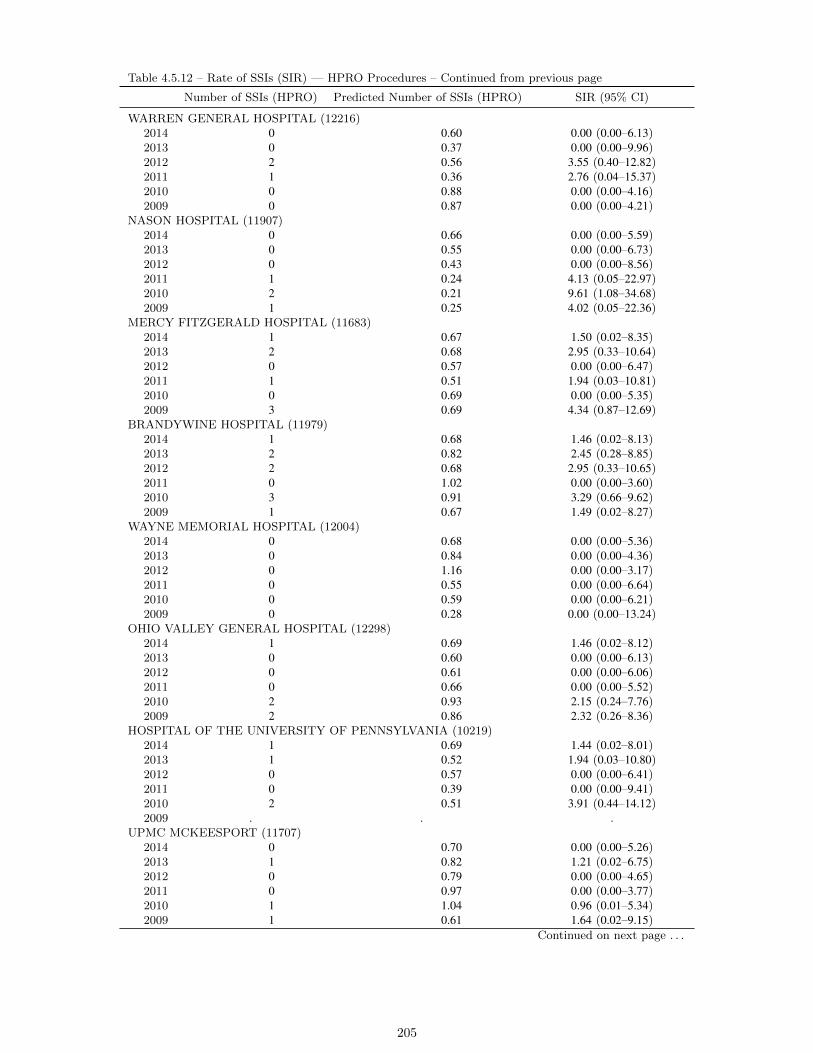
Table 4.5.12 – Rate of SSIs (SIR) — HPRO Procedures – Continued from previous page
Number of SSIs (HPRO) Predicted Number of SSIs (HPRO) SIR (95% CI)
WARREN GENERAL HOSPITAL (12216)2014 0 0.60 0.00 (0.00–6.13)2013 0 0.37 0.00 (0.00–9.96)2012 2 0.56 3.55 (0.40–12.82)2011 1 0.36 2.76 (0.04–15.37)2010 0 0.88 0.00 (0.00–4.16)2009 0 0.87 0.00 (0.00–4.21)
NASON HOSPITAL (11907)2014 0 0.66 0.00 (0.00–5.59)2013 0 0.55 0.00 (0.00–6.73)2012 0 0.43 0.00 (0.00–8.56)2011 1 0.24 4.13 (0.05–22.97)2010 2 0.21 9.61 (1.08–34.68)2009 1 0.25 4.02 (0.05–22.36)
MERCY FITZGERALD HOSPITAL (11683)2014 1 0.67 1.50 (0.02–8.35)2013 2 0.68 2.95 (0.33–10.64)2012 0 0.57 0.00 (0.00–6.47)2011 1 0.51 1.94 (0.03–10.81)2010 0 0.69 0.00 (0.00–5.35)2009 3 0.69 4.34 (0.87–12.69)
BRANDYWINE HOSPITAL (11979)2014 1 0.68 1.46 (0.02–8.13)2013 2 0.82 2.45 (0.28–8.85)2012 2 0.68 2.95 (0.33–10.65)2011 0 1.02 0.00 (0.00–3.60)2010 3 0.91 3.29 (0.66–9.62)2009 1 0.67 1.49 (0.02–8.27)
WAYNE MEMORIAL HOSPITAL (12004)2014 0 0.68 0.00 (0.00–5.36)2013 0 0.84 0.00 (0.00–4.36)2012 0 1.16 0.00 (0.00–3.17)2011 0 0.55 0.00 (0.00–6.64)2010 0 0.59 0.00 (0.00–6.21)2009 0 0.28 0.00 (0.00–13.24)
OHIO VALLEY GENERAL HOSPITAL (12298)2014 1 0.69 1.46 (0.02–8.12)2013 0 0.60 0.00 (0.00–6.13)2012 0 0.61 0.00 (0.00–6.06)2011 0 0.66 0.00 (0.00–5.52)2010 2 0.93 2.15 (0.24–7.76)2009 2 0.86 2.32 (0.26–8.36)
HOSPITAL OF THE UNIVERSITY OF PENNSYLVANIA (10219)2014 1 0.69 1.44 (0.02–8.01)2013 1 0.52 1.94 (0.03–10.80)2012 0 0.57 0.00 (0.00–6.41)2011 0 0.39 0.00 (0.00–9.41)2010 2 0.51 3.91 (0.44–14.12)2009 . . .
UPMC MCKEESPORT (11707)2014 0 0.70 0.00 (0.00–5.26)2013 1 0.82 1.21 (0.02–6.75)2012 0 0.79 0.00 (0.00–4.65)2011 0 0.97 0.00 (0.00–3.77)2010 1 1.04 0.96 (0.01–5.34)2009 1 0.61 1.64 (0.02–9.15)
Continued on next page . . .
205
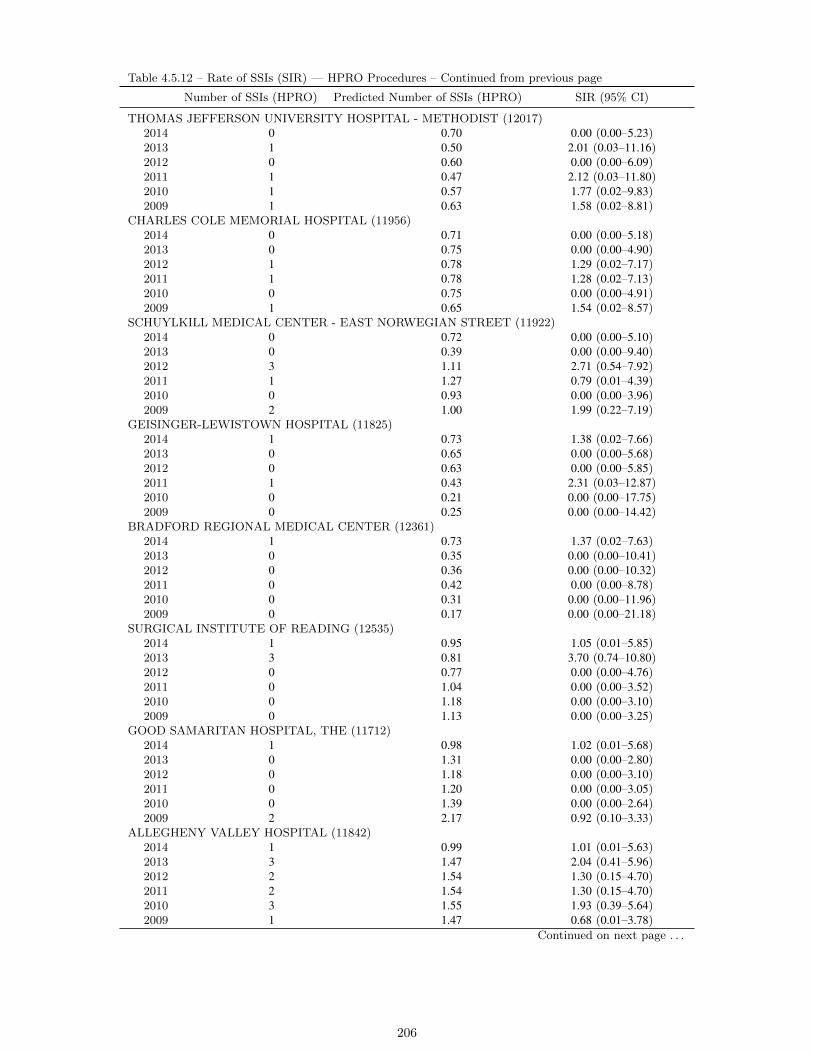
Table 4.5.12 – Rate of SSIs (SIR) — HPRO Procedures – Continued from previous page
Number of SSIs (HPRO) Predicted Number of SSIs (HPRO) SIR (95% CI)
THOMAS JEFFERSON UNIVERSITY HOSPITAL - METHODIST (12017)2014 0 0.70 0.00 (0.00–5.23)2013 1 0.50 2.01 (0.03–11.16)2012 0 0.60 0.00 (0.00–6.09)2011 1 0.47 2.12 (0.03–11.80)2010 1 0.57 1.77 (0.02–9.83)2009 1 0.63 1.58 (0.02–8.81)
CHARLES COLE MEMORIAL HOSPITAL (11956)2014 0 0.71 0.00 (0.00–5.18)2013 0 0.75 0.00 (0.00–4.90)2012 1 0.78 1.29 (0.02–7.17)2011 1 0.78 1.28 (0.02–7.13)2010 0 0.75 0.00 (0.00–4.91)2009 1 0.65 1.54 (0.02–8.57)
SCHUYLKILL MEDICAL CENTER - EAST NORWEGIAN STREET (11922)2014 0 0.72 0.00 (0.00–5.10)2013 0 0.39 0.00 (0.00–9.40)2012 3 1.11 2.71 (0.54–7.92)2011 1 1.27 0.79 (0.01–4.39)2010 0 0.93 0.00 (0.00–3.96)2009 2 1.00 1.99 (0.22–7.19)
GEISINGER-LEWISTOWN HOSPITAL (11825)2014 1 0.73 1.38 (0.02–7.66)2013 0 0.65 0.00 (0.00–5.68)2012 0 0.63 0.00 (0.00–5.85)2011 1 0.43 2.31 (0.03–12.87)2010 0 0.21 0.00 (0.00–17.75)2009 0 0.25 0.00 (0.00–14.42)
BRADFORD REGIONAL MEDICAL CENTER (12361)2014 1 0.73 1.37 (0.02–7.63)2013 0 0.35 0.00 (0.00–10.41)2012 0 0.36 0.00 (0.00–10.32)2011 0 0.42 0.00 (0.00–8.78)2010 0 0.31 0.00 (0.00–11.96)2009 0 0.17 0.00 (0.00–21.18)
SURGICAL INSTITUTE OF READING (12535)2014 1 0.95 1.05 (0.01–5.85)2013 3 0.81 3.70 (0.74–10.80)2012 0 0.77 0.00 (0.00–4.76)2011 0 1.04 0.00 (0.00–3.52)2010 0 1.18 0.00 (0.00–3.10)2009 0 1.13 0.00 (0.00–3.25)
GOOD SAMARITAN HOSPITAL, THE (11712)2014 1 0.98 1.02 (0.01–5.68)2013 0 1.31 0.00 (0.00–2.80)2012 0 1.18 0.00 (0.00–3.10)2011 0 1.20 0.00 (0.00–3.05)2010 0 1.39 0.00 (0.00–2.64)2009 2 2.17 0.92 (0.10–3.33)
ALLEGHENY VALLEY HOSPITAL (11842)2014 1 0.99 1.01 (0.01–5.63)2013 3 1.47 2.04 (0.41–5.96)2012 2 1.54 1.30 (0.15–4.70)2011 2 1.54 1.30 (0.15–4.70)2010 3 1.55 1.93 (0.39–5.64)2009 1 1.47 0.68 (0.01–3.78)
Continued on next page . . .
206

Table 4.5.12 – Rate of SSIs (SIR) — HPRO Procedures – Continued from previous page
Number of SSIs (HPRO) Predicted Number of SSIs (HPRO) SIR (95% CI)
WASHINGTON HOSPITAL, THE (11460)2014 0 1.00 0.00 (0.00–3.67)2013 3 1.42 2.11 (0.42–6.17)2012 1 1.49 0.67 (0.01–3.72)2011 2 1.81 1.11 (0.12–3.99)2010 3 2.13 1.41 (0.28–4.12)2009 3 1.94 1.54 (0.31–4.51)
CARLISLE REGIONAL MEDICAL CENTER (11997)2014 1 1.00 1.00 (0.01–5.56)2013 2 1.19 1.67 (0.19–6.04)2012 0 1.48 0.00 (0.00–2.48)2011 2 1.24 1.61 (0.18–5.82)2010 2 1.99 1.01 (0.11–3.63)2009 7 1.72 4.07 (1.63–8.39)
GETTYSBURG HOSPITAL (11531)2014 2 1.02 1.96 (0.22–7.07)2013 1 0.91 1.10 (0.01–6.12)2012 1 0.90 1.11 (0.01–6.17)2011 1 0.73 1.37 (0.02–7.63)2010 1 1.23 0.81 (0.01–4.52)2009 0 0.79 0.00 (0.00–4.65)
CHESTNUT HILL HOSPITAL (12304)2014 0 1.03 0.00 (0.00–3.56)2013 1 0.92 1.09 (0.01–6.07)2012 1 0.62 1.60 (0.02–8.92)2011 3 0.54 5.61 (1.13–16.38)2010 3 0.54 5.57 (1.12–16.28)2009 2 0.61 3.29 (0.37–11.86)
ALBERT EINSTEIN MEDICAL CENTER (10585)2014 2 1.04 1.93 (0.22–6.95)2013 1 0.69 1.44 (0.02–8.04)2012 4 1.19 3.36 (0.90–8.60)2011 3 1.09 2.76 (0.55–8.07)2010 0 0.65 0.00 (0.00–5.63)2009 0 0.40 0.00 (0.00–9.27)
ARMSTRONG COUNTY MEMORIAL HOSPITAL (12057)2014 0 1.08 0.00 (0.00–3.41)2013 0 0.99 0.00 (0.00–3.69)2012 0 1.39 0.00 (0.00–2.64)2011 2 1.23 1.63 (0.18–5.89)2010 1 1.46 0.68 (0.01–3.80)2009 2 1.05 1.90 (0.21–6.86)
JEANES HOSPITAL (11459)2014 0 1.09 0.00 (0.00–3.36)2013 1 1.52 0.66 (0.01–3.65)2012 1 1.11 0.90 (0.01–5.03)2011 0 1.23 0.00 (0.00–2.97)2010 0 1.12 0.00 (0.00–3.29)2009 1 1.18 0.85 (0.01–4.71)
DELAWARE COUNTY MEMORIAL HOSPITAL (11972)2014 2 1.11 1.80 (0.20–6.50)2013 1 1.36 0.74 (0.01–4.10)2012 1 1.57 0.64 (0.01–3.55)2011 0 1.33 0.00 (0.00–2.75)2010 0 1.68 0.00 (0.00–2.18)2009 1 1.43 0.70 (0.01–3.88)
Continued on next page . . .
207

Table 4.5.12 – Rate of SSIs (SIR) — HPRO Procedures – Continued from previous page
Number of SSIs (HPRO) Predicted Number of SSIs (HPRO) SIR (95% CI)
UPMC NORTHWEST (11837)2014 3 1.12 2.69 (0.54–7.85)2013 0 1.10 0.00 (0.00–3.32)2012 3 0.90 3.34 (0.67–9.76)2011 1 0.79 1.27 (0.02–7.05)2010 1 0.69 1.46 (0.02–8.10)2009 3 0.59 5.08 (1.02–14.84)
SACRED HEART HOSPITAL (11684)2014 0 1.12 0.00 (0.00–3.27)2013 0 1.16 0.00 (0.00–3.15)2012 0 2.00 0.00 (0.00–1.83)2011 1 1.57 0.64 (0.01–3.54)2010 0 0.58 0.00 (0.00–6.31)2009 1 0.71 1.41 (0.02–7.86)
PENN HIGHLANDS DUBOIS (11606)2014 1 1.20 0.83 (0.01–4.63)2013 0 1.22 0.00 (0.00–3.01)2012 1 1.35 0.74 (0.01–4.13)2011 1 0.98 1.02 (0.01–5.67)2010 1 0.89 1.12 (0.01–6.22)2009 0 0.96 0.00 (0.00–3.81)
ST. JOSEPH MEDICAL CTR (11961)2014 1 1.23 0.81 (0.01–4.53)2013 1 1.12 0.89 (0.01–4.96)2012 0 1.42 0.00 (0.00–2.58)2011 1 1.24 0.81 (0.01–4.50)2010 1 1.22 0.82 (0.01–4.57)2009 1 1.14 0.87 (0.01–4.86)
HANOVER HOSPITAL (11899)2014 2 1.23 1.62 (0.18–5.86)2013 0 1.73 0.00 (0.00–2.12)2012 3 1.55 1.93 (0.39–5.65)2011 3 0.96 3.14 (0.63–9.18)2010 1 2.10 0.48 (0.01–2.64)2009 1 1.79 0.56 (0.01–3.11)
HOLY SPIRIT HOSPITAL (12387)2014 2 1.27 1.57 (0.18–5.68)2013 1 2.99 0.33 (0.00–1.86)2012 3 2.71 1.11 (0.22–3.24)2011 2 3.24 0.62 (0.07–2.23)2010 3 2.62 1.14 (0.23–3.34)2009 2 2.37 0.85 (0.09–3.05)
JAMESON MEMORIAL HOSPITAL (11954)2014 0 1.28 0.00 (0.00–2.86)2013 2 1.57 1.27 (0.14–4.59)2012 3 1.23 2.44 (0.49–7.13)2011 0 1.10 0.00 (0.00–3.35)2010 2 1.11 1.80 (0.20–6.52)2009 1 0.83 1.21 (0.02–6.73)
EASTON HOSPITAL (11929)2014 3 1.30 2.32 (0.47–6.76)2013 0 1.84 0.00 (0.00–2.00)2012 0 1.34 0.00 (0.00–2.75)2011 2 1.43 1.40 (0.16–5.06)2010 4 1.75 2.29 (0.62–5.85)2009 0 1.83 0.00 (0.00–2.01)
Continued on next page . . .
208

Table 4.5.12 – Rate of SSIs (SIR) — HPRO Procedures – Continued from previous page
Number of SSIs (HPRO) Predicted Number of SSIs (HPRO) SIR (95% CI)
EINSTEIN MEDICAL CENTER MONTGOMERY (30210)2014 0 1.30 0.00 (0.00–2.83)2013 0 1.46 0.00 (0.00–2.52)2012 . . .2011 . . .2010 . . .2009 . . .
EINSTEIN AT ELKINS PARK (12500)2014 0 1.31 0.00 (0.00–2.80)2013 3 1.12 2.67 (0.54–7.80)2012 1 0.74 1.36 (0.02–7.55)2011 1 0.77 1.30 (0.02–7.24)2010 2 1.23 1.62 (0.18–5.85)2009 2 1.05 1.91 (0.21–6.90)
LEHIGH VALLEY HOSPITAL - MUHLENBERG (11898)2014 1 1.32 0.76 (0.01–4.22)2013 3 1.55 1.93 (0.39–5.64)2012 0 1.39 0.00 (0.00–2.63)2011 2 2.13 0.94 (0.11–3.40)2010 1 1.77 0.56 (0.01–3.14)2009 2 1.46 1.37 (0.15–4.96)
CROZER CHESTER MEDICAL CENTER - SPRINGFIELD (11851)2014 1 1.33 0.75 (0.01–4.17)2013 3 1.47 2.04 (0.41–5.95)2012 0 0.17 0.00 (0.00–21.57)2011 0 0.10 0.00 (0.00–35.68)2010 1 0.08 12.88 (0.17–71.67)2009 0 0.18 0.00 (0.00–20.45)
EXCELA HEALTH LATROBE HOSPITAL (11651)2014 1 1.40 0.71 (0.01–3.96)2013 1 1.62 0.62 (0.01–3.44)2012 1 1.71 0.58 (0.01–3.25)2011 2 1.48 1.36 (0.15–4.89)2010 1 1.29 0.78 (0.01–4.33)2009 2 1.52 1.32 (0.15–4.76)
PHOENIXVILLE HOSPITAL COMPANY LLC (11836)2014 0 1.48 0.00 (0.00–2.48)2013 1 0.97 1.03 (0.01–5.74)2012 0 0.80 0.00 (0.00–4.59)2011 0 0.82 0.00 (0.00–4.47)2010 0 1.03 0.00 (0.00–3.56)2009 0 1.12 0.00 (0.00–3.29)
POTTSTOWN MEMORIAL MEDICAL CENTER (11983)2014 1 1.49 0.67 (0.01–3.72)2013 1 1.85 0.54 (0.01–3.00)2012 0 1.99 0.00 (0.00–1.84)2011 0 1.73 0.00 (0.00–2.12)2010 1 1.71 0.58 (0.01–3.25)2009 0 1.78 0.00 (0.00–2.06)
INDIANA REGIONAL MEDICAL CENTER (11759)2014 0 1.50 0.00 (0.00–2.45)2013 0 1.69 0.00 (0.00–2.18)2012 1 1.50 0.67 (0.01–3.72)2011 2 1.88 1.07 (0.12–3.85)2010 1 1.82 0.55 (0.01–3.06)2009 0 1.76 0.00 (0.00–2.09)
Continued on next page . . .
209
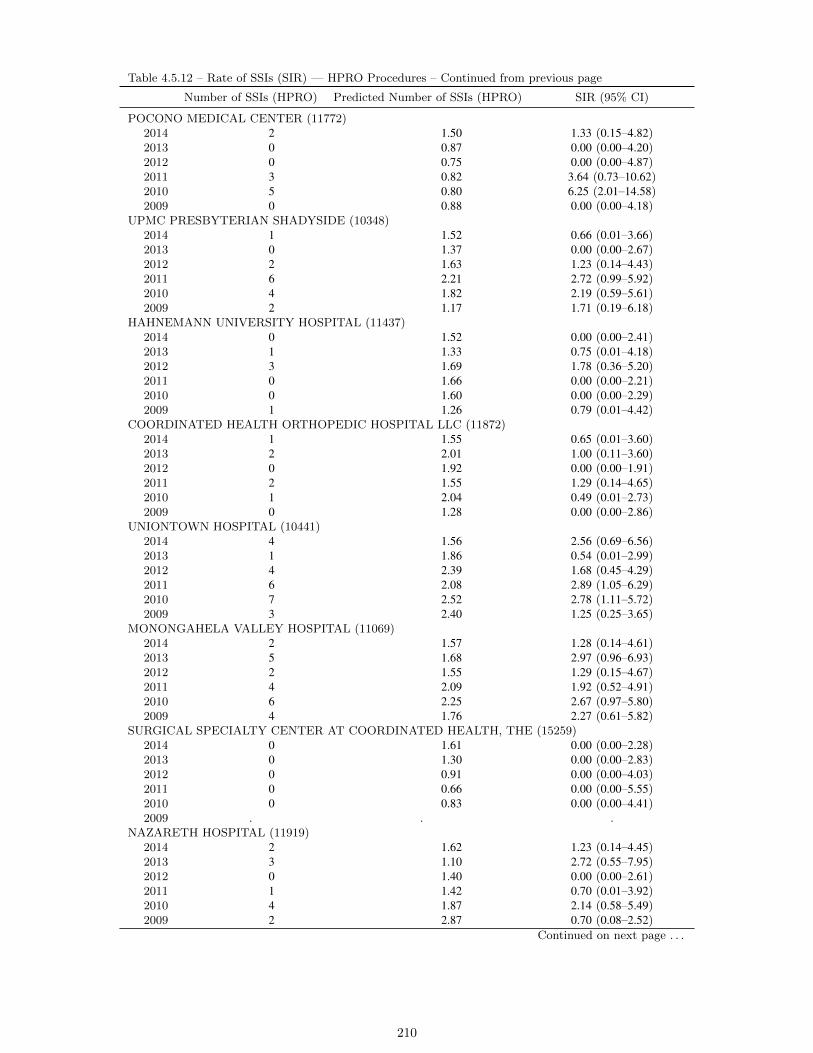
Table 4.5.12 – Rate of SSIs (SIR) — HPRO Procedures – Continued from previous page
Number of SSIs (HPRO) Predicted Number of SSIs (HPRO) SIR (95% CI)
POCONO MEDICAL CENTER (11772)2014 2 1.50 1.33 (0.15–4.82)2013 0 0.87 0.00 (0.00–4.20)2012 0 0.75 0.00 (0.00–4.87)2011 3 0.82 3.64 (0.73–10.62)2010 5 0.80 6.25 (2.01–14.58)2009 0 0.88 0.00 (0.00–4.18)
UPMC PRESBYTERIAN SHADYSIDE (10348)2014 1 1.52 0.66 (0.01–3.66)2013 0 1.37 0.00 (0.00–2.67)2012 2 1.63 1.23 (0.14–4.43)2011 6 2.21 2.72 (0.99–5.92)2010 4 1.82 2.19 (0.59–5.61)2009 2 1.17 1.71 (0.19–6.18)
HAHNEMANN UNIVERSITY HOSPITAL (11437)2014 0 1.52 0.00 (0.00–2.41)2013 1 1.33 0.75 (0.01–4.18)2012 3 1.69 1.78 (0.36–5.20)2011 0 1.66 0.00 (0.00–2.21)2010 0 1.60 0.00 (0.00–2.29)2009 1 1.26 0.79 (0.01–4.42)
COORDINATED HEALTH ORTHOPEDIC HOSPITAL LLC (11872)2014 1 1.55 0.65 (0.01–3.60)2013 2 2.01 1.00 (0.11–3.60)2012 0 1.92 0.00 (0.00–1.91)2011 2 1.55 1.29 (0.14–4.65)2010 1 2.04 0.49 (0.01–2.73)2009 0 1.28 0.00 (0.00–2.86)
UNIONTOWN HOSPITAL (10441)2014 4 1.56 2.56 (0.69–6.56)2013 1 1.86 0.54 (0.01–2.99)2012 4 2.39 1.68 (0.45–4.29)2011 6 2.08 2.89 (1.05–6.29)2010 7 2.52 2.78 (1.11–5.72)2009 3 2.40 1.25 (0.25–3.65)
MONONGAHELA VALLEY HOSPITAL (11069)2014 2 1.57 1.28 (0.14–4.61)2013 5 1.68 2.97 (0.96–6.93)2012 2 1.55 1.29 (0.15–4.67)2011 4 2.09 1.92 (0.52–4.91)2010 6 2.25 2.67 (0.97–5.80)2009 4 1.76 2.27 (0.61–5.82)
SURGICAL SPECIALTY CENTER AT COORDINATED HEALTH, THE (15259)2014 0 1.61 0.00 (0.00–2.28)2013 0 1.30 0.00 (0.00–2.83)2012 0 0.91 0.00 (0.00–4.03)2011 0 0.66 0.00 (0.00–5.55)2010 0 0.83 0.00 (0.00–4.41)2009 . . .
NAZARETH HOSPITAL (11919)2014 2 1.62 1.23 (0.14–4.45)2013 3 1.10 2.72 (0.55–7.95)2012 0 1.40 0.00 (0.00–2.61)2011 1 1.42 0.70 (0.01–3.92)2010 4 1.87 2.14 (0.58–5.49)2009 2 2.87 0.70 (0.08–2.52)
Continued on next page . . .
210
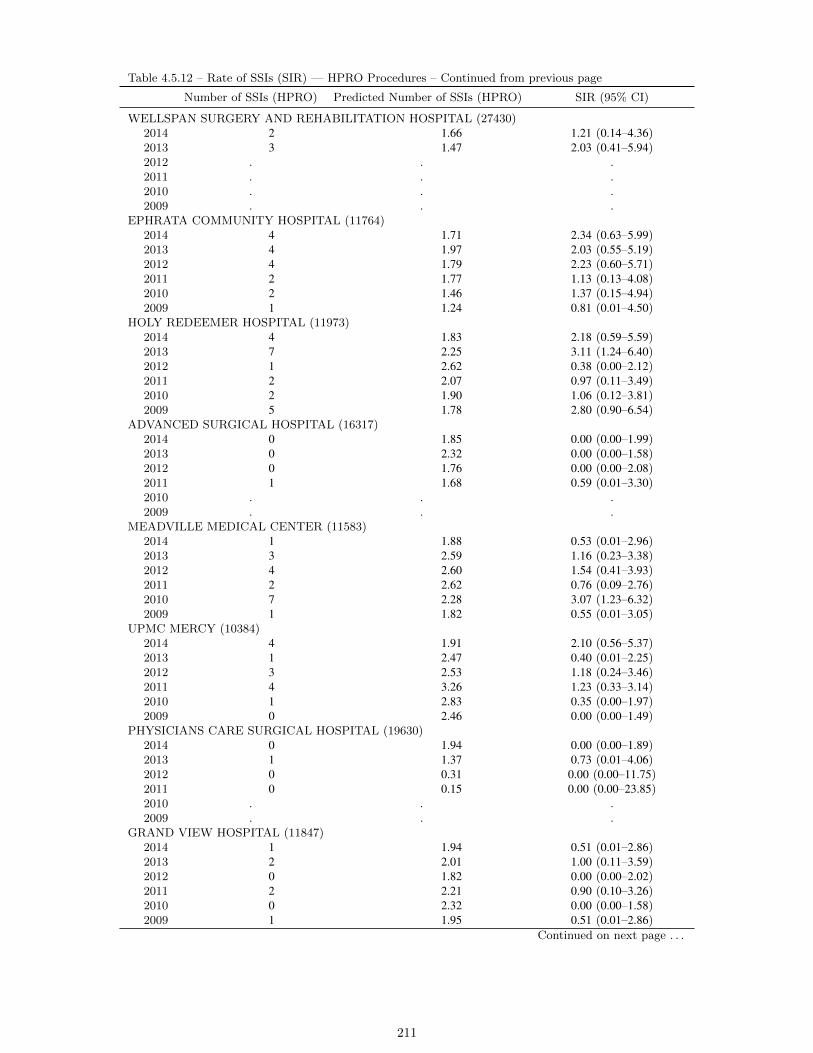
Table 4.5.12 – Rate of SSIs (SIR) — HPRO Procedures – Continued from previous page
Number of SSIs (HPRO) Predicted Number of SSIs (HPRO) SIR (95% CI)
WELLSPAN SURGERY AND REHABILITATION HOSPITAL (27430)2014 2 1.66 1.21 (0.14–4.36)2013 3 1.47 2.03 (0.41–5.94)2012 . . .2011 . . .2010 . . .2009 . . .
EPHRATA COMMUNITY HOSPITAL (11764)2014 4 1.71 2.34 (0.63–5.99)2013 4 1.97 2.03 (0.55–5.19)2012 4 1.79 2.23 (0.60–5.71)2011 2 1.77 1.13 (0.13–4.08)2010 2 1.46 1.37 (0.15–4.94)2009 1 1.24 0.81 (0.01–4.50)
HOLY REDEEMER HOSPITAL (11973)2014 4 1.83 2.18 (0.59–5.59)2013 7 2.25 3.11 (1.24–6.40)2012 1 2.62 0.38 (0.00–2.12)2011 2 2.07 0.97 (0.11–3.49)2010 2 1.90 1.06 (0.12–3.81)2009 5 1.78 2.80 (0.90–6.54)
ADVANCED SURGICAL HOSPITAL (16317)2014 0 1.85 0.00 (0.00–1.99)2013 0 2.32 0.00 (0.00–1.58)2012 0 1.76 0.00 (0.00–2.08)2011 1 1.68 0.59 (0.01–3.30)2010 . . .2009 . . .
MEADVILLE MEDICAL CENTER (11583)2014 1 1.88 0.53 (0.01–2.96)2013 3 2.59 1.16 (0.23–3.38)2012 4 2.60 1.54 (0.41–3.93)2011 2 2.62 0.76 (0.09–2.76)2010 7 2.28 3.07 (1.23–6.32)2009 1 1.82 0.55 (0.01–3.05)
UPMC MERCY (10384)2014 4 1.91 2.10 (0.56–5.37)2013 1 2.47 0.40 (0.01–2.25)2012 3 2.53 1.18 (0.24–3.46)2011 4 3.26 1.23 (0.33–3.14)2010 1 2.83 0.35 (0.00–1.97)2009 0 2.46 0.00 (0.00–1.49)
PHYSICIANS CARE SURGICAL HOSPITAL (19630)2014 0 1.94 0.00 (0.00–1.89)2013 1 1.37 0.73 (0.01–4.06)2012 0 0.31 0.00 (0.00–11.75)2011 0 0.15 0.00 (0.00–23.85)2010 . . .2009 . . .
GRAND VIEW HOSPITAL (11847)2014 1 1.94 0.51 (0.01–2.86)2013 2 2.01 1.00 (0.11–3.59)2012 0 1.82 0.00 (0.00–2.02)2011 2 2.21 0.90 (0.10–3.26)2010 0 2.32 0.00 (0.00–1.58)2009 1 1.95 0.51 (0.01–2.86)
Continued on next page . . .
211
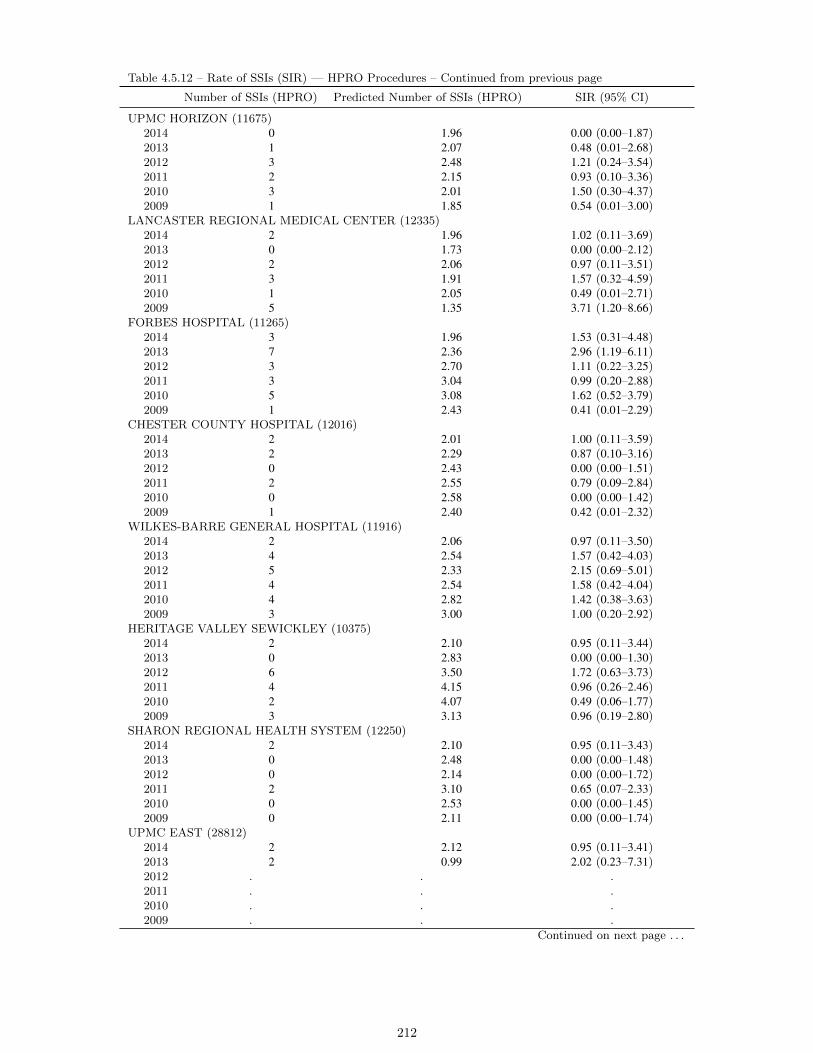
Table 4.5.12 – Rate of SSIs (SIR) — HPRO Procedures – Continued from previous page
Number of SSIs (HPRO) Predicted Number of SSIs (HPRO) SIR (95% CI)
UPMC HORIZON (11675)2014 0 1.96 0.00 (0.00–1.87)2013 1 2.07 0.48 (0.01–2.68)2012 3 2.48 1.21 (0.24–3.54)2011 2 2.15 0.93 (0.10–3.36)2010 3 2.01 1.50 (0.30–4.37)2009 1 1.85 0.54 (0.01–3.00)
LANCASTER REGIONAL MEDICAL CENTER (12335)2014 2 1.96 1.02 (0.11–3.69)2013 0 1.73 0.00 (0.00–2.12)2012 2 2.06 0.97 (0.11–3.51)2011 3 1.91 1.57 (0.32–4.59)2010 1 2.05 0.49 (0.01–2.71)2009 5 1.35 3.71 (1.20–8.66)
FORBES HOSPITAL (11265)2014 3 1.96 1.53 (0.31–4.48)2013 7 2.36 2.96 (1.19–6.11)2012 3 2.70 1.11 (0.22–3.25)2011 3 3.04 0.99 (0.20–2.88)2010 5 3.08 1.62 (0.52–3.79)2009 1 2.43 0.41 (0.01–2.29)
CHESTER COUNTY HOSPITAL (12016)2014 2 2.01 1.00 (0.11–3.59)2013 2 2.29 0.87 (0.10–3.16)2012 0 2.43 0.00 (0.00–1.51)2011 2 2.55 0.79 (0.09–2.84)2010 0 2.58 0.00 (0.00–1.42)2009 1 2.40 0.42 (0.01–2.32)
WILKES-BARRE GENERAL HOSPITAL (11916)2014 2 2.06 0.97 (0.11–3.50)2013 4 2.54 1.57 (0.42–4.03)2012 5 2.33 2.15 (0.69–5.01)2011 4 2.54 1.58 (0.42–4.04)2010 4 2.82 1.42 (0.38–3.63)2009 3 3.00 1.00 (0.20–2.92)
HERITAGE VALLEY SEWICKLEY (10375)2014 2 2.10 0.95 (0.11–3.44)2013 0 2.83 0.00 (0.00–1.30)2012 6 3.50 1.72 (0.63–3.73)2011 4 4.15 0.96 (0.26–2.46)2010 2 4.07 0.49 (0.06–1.77)2009 3 3.13 0.96 (0.19–2.80)
SHARON REGIONAL HEALTH SYSTEM (12250)2014 2 2.10 0.95 (0.11–3.43)2013 0 2.48 0.00 (0.00–1.48)2012 0 2.14 0.00 (0.00–1.72)2011 2 3.10 0.65 (0.07–2.33)2010 0 2.53 0.00 (0.00–1.45)2009 0 2.11 0.00 (0.00–1.74)
UPMC EAST (28812)2014 2 2.12 0.95 (0.11–3.41)2013 2 0.99 2.02 (0.23–7.31)2012 . . .2011 . . .2010 . . .2009 . . .
Continued on next page . . .
212
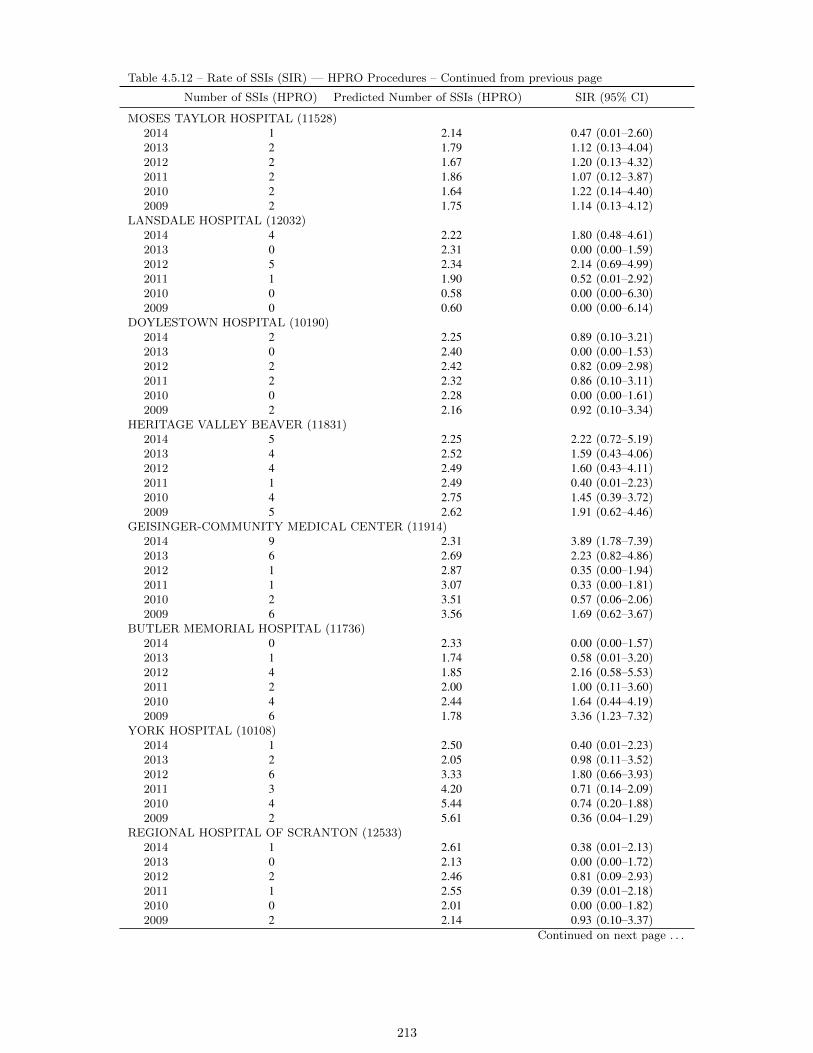
Table 4.5.12 – Rate of SSIs (SIR) — HPRO Procedures – Continued from previous page
Number of SSIs (HPRO) Predicted Number of SSIs (HPRO) SIR (95% CI)
MOSES TAYLOR HOSPITAL (11528)2014 1 2.14 0.47 (0.01–2.60)2013 2 1.79 1.12 (0.13–4.04)2012 2 1.67 1.20 (0.13–4.32)2011 2 1.86 1.07 (0.12–3.87)2010 2 1.64 1.22 (0.14–4.40)2009 2 1.75 1.14 (0.13–4.12)
LANSDALE HOSPITAL (12032)2014 4 2.22 1.80 (0.48–4.61)2013 0 2.31 0.00 (0.00–1.59)2012 5 2.34 2.14 (0.69–4.99)2011 1 1.90 0.52 (0.01–2.92)2010 0 0.58 0.00 (0.00–6.30)2009 0 0.60 0.00 (0.00–6.14)
DOYLESTOWN HOSPITAL (10190)2014 2 2.25 0.89 (0.10–3.21)2013 0 2.40 0.00 (0.00–1.53)2012 2 2.42 0.82 (0.09–2.98)2011 2 2.32 0.86 (0.10–3.11)2010 0 2.28 0.00 (0.00–1.61)2009 2 2.16 0.92 (0.10–3.34)
HERITAGE VALLEY BEAVER (11831)2014 5 2.25 2.22 (0.72–5.19)2013 4 2.52 1.59 (0.43–4.06)2012 4 2.49 1.60 (0.43–4.11)2011 1 2.49 0.40 (0.01–2.23)2010 4 2.75 1.45 (0.39–3.72)2009 5 2.62 1.91 (0.62–4.46)
GEISINGER-COMMUNITY MEDICAL CENTER (11914)2014 9 2.31 3.89 (1.78–7.39)2013 6 2.69 2.23 (0.82–4.86)2012 1 2.87 0.35 (0.00–1.94)2011 1 3.07 0.33 (0.00–1.81)2010 2 3.51 0.57 (0.06–2.06)2009 6 3.56 1.69 (0.62–3.67)
BUTLER MEMORIAL HOSPITAL (11736)2014 0 2.33 0.00 (0.00–1.57)2013 1 1.74 0.58 (0.01–3.20)2012 4 1.85 2.16 (0.58–5.53)2011 2 2.00 1.00 (0.11–3.60)2010 4 2.44 1.64 (0.44–4.19)2009 6 1.78 3.36 (1.23–7.32)
YORK HOSPITAL (10108)2014 1 2.50 0.40 (0.01–2.23)2013 2 2.05 0.98 (0.11–3.52)2012 6 3.33 1.80 (0.66–3.93)2011 3 4.20 0.71 (0.14–2.09)2010 4 5.44 0.74 (0.20–1.88)2009 2 5.61 0.36 (0.04–1.29)
REGIONAL HOSPITAL OF SCRANTON (12533)2014 1 2.61 0.38 (0.01–2.13)2013 0 2.13 0.00 (0.00–1.72)2012 2 2.46 0.81 (0.09–2.93)2011 1 2.55 0.39 (0.01–2.18)2010 0 2.01 0.00 (0.00–1.82)2009 2 2.14 0.93 (0.10–3.37)
Continued on next page . . .
213
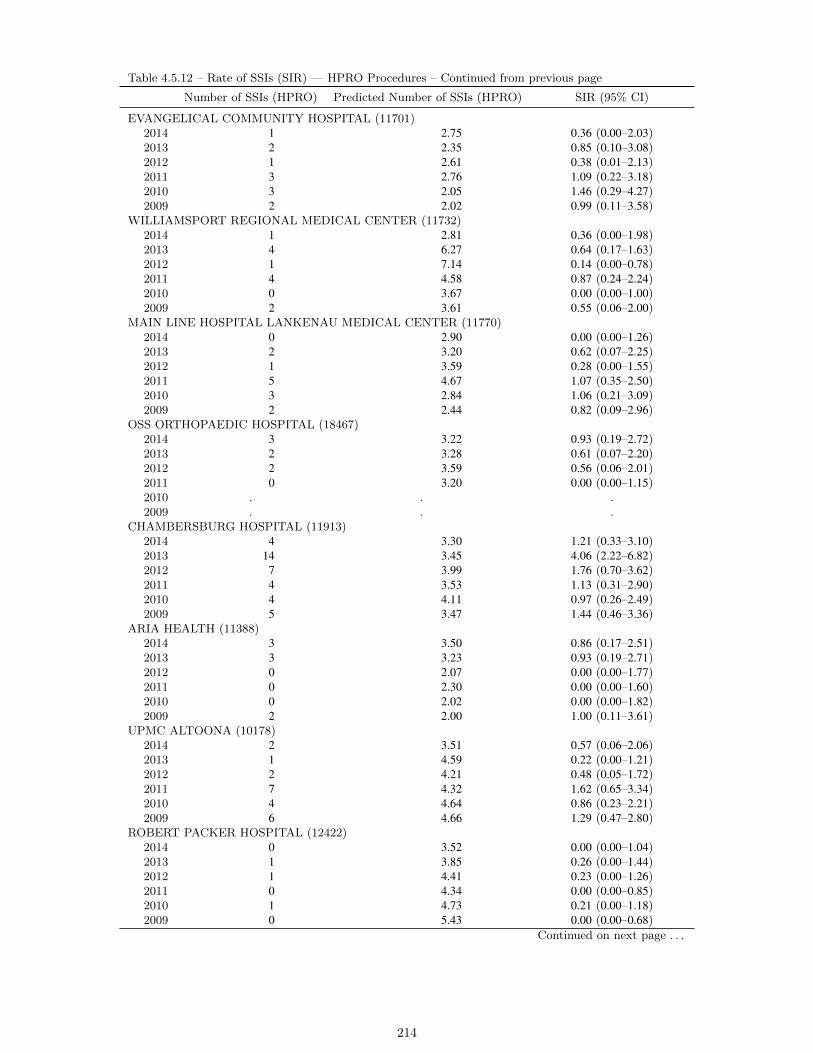
Table 4.5.12 – Rate of SSIs (SIR) — HPRO Procedures – Continued from previous page
Number of SSIs (HPRO) Predicted Number of SSIs (HPRO) SIR (95% CI)
EVANGELICAL COMMUNITY HOSPITAL (11701)2014 1 2.75 0.36 (0.00–2.03)2013 2 2.35 0.85 (0.10–3.08)2012 1 2.61 0.38 (0.01–2.13)2011 3 2.76 1.09 (0.22–3.18)2010 3 2.05 1.46 (0.29–4.27)2009 2 2.02 0.99 (0.11–3.58)
WILLIAMSPORT REGIONAL MEDICAL CENTER (11732)2014 1 2.81 0.36 (0.00–1.98)2013 4 6.27 0.64 (0.17–1.63)2012 1 7.14 0.14 (0.00–0.78)2011 4 4.58 0.87 (0.24–2.24)2010 0 3.67 0.00 (0.00–1.00)2009 2 3.61 0.55 (0.06–2.00)
MAIN LINE HOSPITAL LANKENAU MEDICAL CENTER (11770)2014 0 2.90 0.00 (0.00–1.26)2013 2 3.20 0.62 (0.07–2.25)2012 1 3.59 0.28 (0.00–1.55)2011 5 4.67 1.07 (0.35–2.50)2010 3 2.84 1.06 (0.21–3.09)2009 2 2.44 0.82 (0.09–2.96)
OSS ORTHOPAEDIC HOSPITAL (18467)2014 3 3.22 0.93 (0.19–2.72)2013 2 3.28 0.61 (0.07–2.20)2012 2 3.59 0.56 (0.06–2.01)2011 0 3.20 0.00 (0.00–1.15)2010 . . .2009 . . .
CHAMBERSBURG HOSPITAL (11913)2014 4 3.30 1.21 (0.33–3.10)2013 14 3.45 4.06 (2.22–6.82)2012 7 3.99 1.76 (0.70–3.62)2011 4 3.53 1.13 (0.31–2.90)2010 4 4.11 0.97 (0.26–2.49)2009 5 3.47 1.44 (0.46–3.36)
ARIA HEALTH (11388)2014 3 3.50 0.86 (0.17–2.51)2013 3 3.23 0.93 (0.19–2.71)2012 0 2.07 0.00 (0.00–1.77)2011 0 2.30 0.00 (0.00–1.60)2010 0 2.02 0.00 (0.00–1.82)2009 2 2.00 1.00 (0.11–3.61)
UPMC ALTOONA (10178)2014 2 3.51 0.57 (0.06–2.06)2013 1 4.59 0.22 (0.00–1.21)2012 2 4.21 0.48 (0.05–1.72)2011 7 4.32 1.62 (0.65–3.34)2010 4 4.64 0.86 (0.23–2.21)2009 6 4.66 1.29 (0.47–2.80)
ROBERT PACKER HOSPITAL (12422)2014 0 3.52 0.00 (0.00–1.04)2013 1 3.85 0.26 (0.00–1.44)2012 1 4.41 0.23 (0.00–1.26)2011 0 4.34 0.00 (0.00–0.85)2010 1 4.73 0.21 (0.00–1.18)2009 0 5.43 0.00 (0.00–0.68)
Continued on next page . . .
214
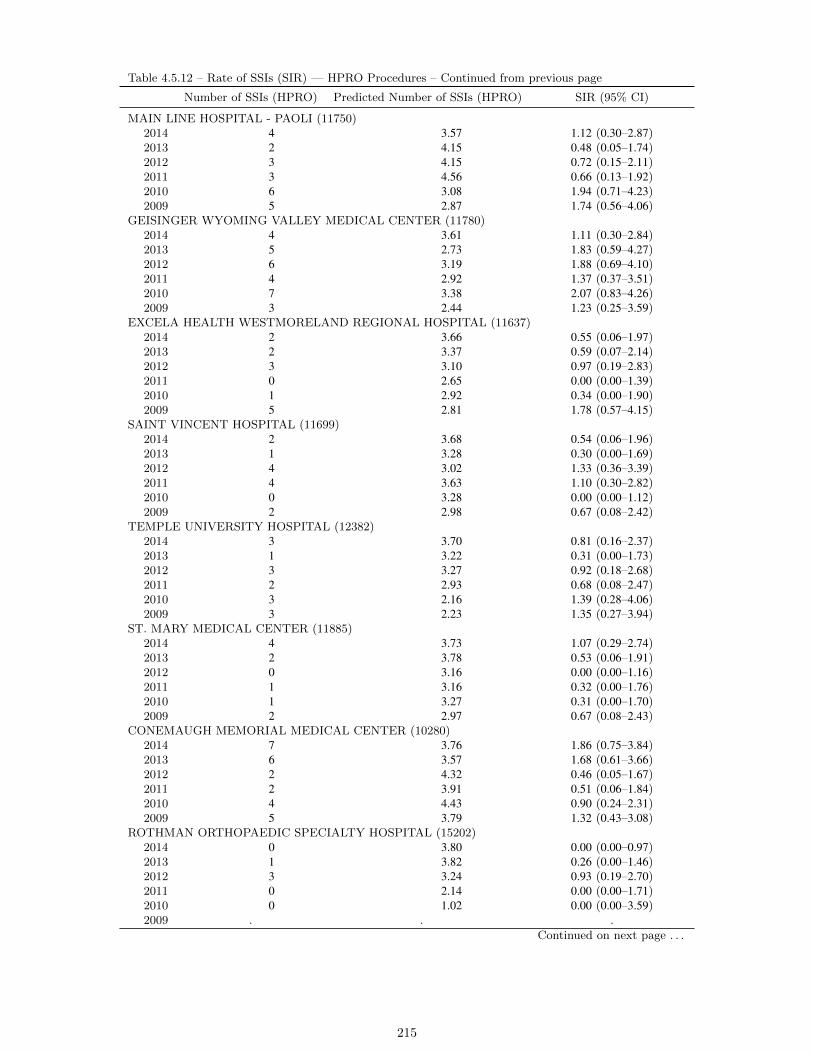
Table 4.5.12 – Rate of SSIs (SIR) — HPRO Procedures – Continued from previous page
Number of SSIs (HPRO) Predicted Number of SSIs (HPRO) SIR (95% CI)
MAIN LINE HOSPITAL - PAOLI (11750)2014 4 3.57 1.12 (0.30–2.87)2013 2 4.15 0.48 (0.05–1.74)2012 3 4.15 0.72 (0.15–2.11)2011 3 4.56 0.66 (0.13–1.92)2010 6 3.08 1.94 (0.71–4.23)2009 5 2.87 1.74 (0.56–4.06)
GEISINGER WYOMING VALLEY MEDICAL CENTER (11780)2014 4 3.61 1.11 (0.30–2.84)2013 5 2.73 1.83 (0.59–4.27)2012 6 3.19 1.88 (0.69–4.10)2011 4 2.92 1.37 (0.37–3.51)2010 7 3.38 2.07 (0.83–4.26)2009 3 2.44 1.23 (0.25–3.59)
EXCELA HEALTH WESTMORELAND REGIONAL HOSPITAL (11637)2014 2 3.66 0.55 (0.06–1.97)2013 2 3.37 0.59 (0.07–2.14)2012 3 3.10 0.97 (0.19–2.83)2011 0 2.65 0.00 (0.00–1.39)2010 1 2.92 0.34 (0.00–1.90)2009 5 2.81 1.78 (0.57–4.15)
SAINT VINCENT HOSPITAL (11699)2014 2 3.68 0.54 (0.06–1.96)2013 1 3.28 0.30 (0.00–1.69)2012 4 3.02 1.33 (0.36–3.39)2011 4 3.63 1.10 (0.30–2.82)2010 0 3.28 0.00 (0.00–1.12)2009 2 2.98 0.67 (0.08–2.42)
TEMPLE UNIVERSITY HOSPITAL (12382)2014 3 3.70 0.81 (0.16–2.37)2013 1 3.22 0.31 (0.00–1.73)2012 3 3.27 0.92 (0.18–2.68)2011 2 2.93 0.68 (0.08–2.47)2010 3 2.16 1.39 (0.28–4.06)2009 3 2.23 1.35 (0.27–3.94)
ST. MARY MEDICAL CENTER (11885)2014 4 3.73 1.07 (0.29–2.74)2013 2 3.78 0.53 (0.06–1.91)2012 0 3.16 0.00 (0.00–1.16)2011 1 3.16 0.32 (0.00–1.76)2010 1 3.27 0.31 (0.00–1.70)2009 2 2.97 0.67 (0.08–2.43)
CONEMAUGH MEMORIAL MEDICAL CENTER (10280)2014 7 3.76 1.86 (0.75–3.84)2013 6 3.57 1.68 (0.61–3.66)2012 2 4.32 0.46 (0.05–1.67)2011 2 3.91 0.51 (0.06–1.84)2010 4 4.43 0.90 (0.24–2.31)2009 5 3.79 1.32 (0.43–3.08)
ROTHMAN ORTHOPAEDIC SPECIALTY HOSPITAL (15202)2014 0 3.80 0.00 (0.00–0.97)2013 1 3.82 0.26 (0.00–1.46)2012 3 3.24 0.93 (0.19–2.70)2011 0 2.14 0.00 (0.00–1.71)2010 0 1.02 0.00 (0.00–3.59)2009 . . .
Continued on next page . . .
215
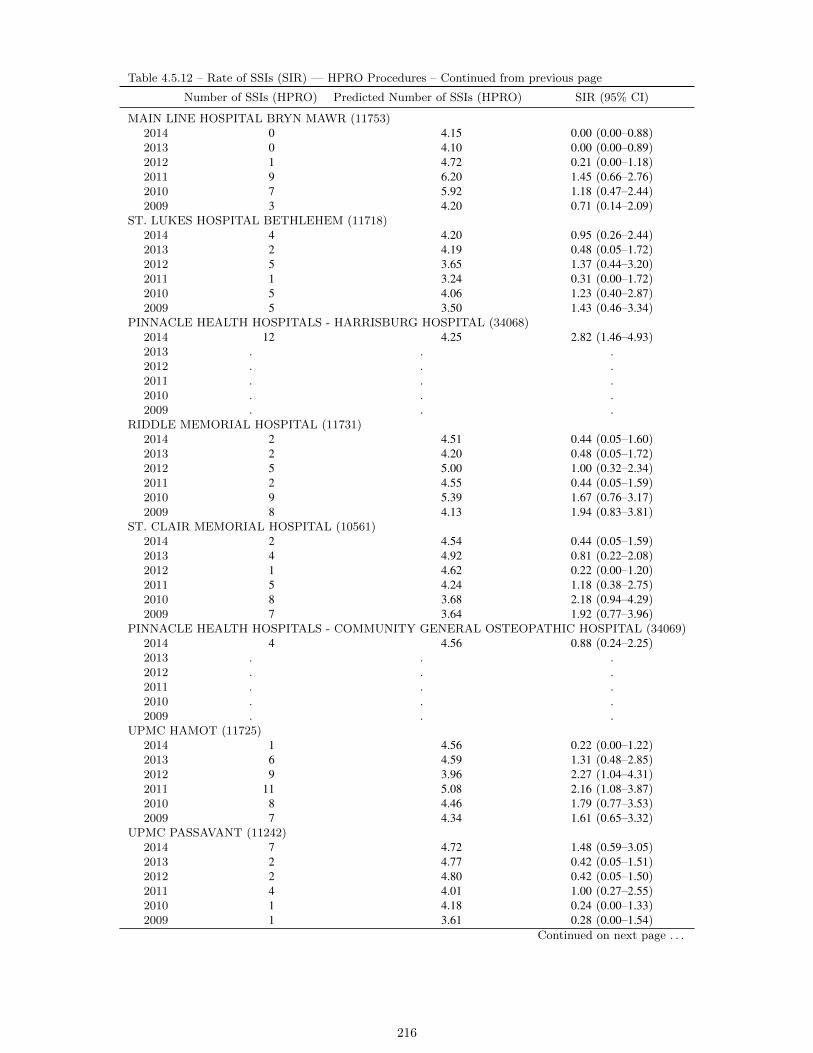
Table 4.5.12 – Rate of SSIs (SIR) — HPRO Procedures – Continued from previous page
Number of SSIs (HPRO) Predicted Number of SSIs (HPRO) SIR (95% CI)
MAIN LINE HOSPITAL BRYN MAWR (11753)2014 0 4.15 0.00 (0.00–0.88)2013 0 4.10 0.00 (0.00–0.89)2012 1 4.72 0.21 (0.00–1.18)2011 9 6.20 1.45 (0.66–2.76)2010 7 5.92 1.18 (0.47–2.44)2009 3 4.20 0.71 (0.14–2.09)
ST. LUKES HOSPITAL BETHLEHEM (11718)2014 4 4.20 0.95 (0.26–2.44)2013 2 4.19 0.48 (0.05–1.72)2012 5 3.65 1.37 (0.44–3.20)2011 1 3.24 0.31 (0.00–1.72)2010 5 4.06 1.23 (0.40–2.87)2009 5 3.50 1.43 (0.46–3.34)
PINNACLE HEALTH HOSPITALS - HARRISBURG HOSPITAL (34068)2014 12 4.25 2.82 (1.46–4.93)2013 . . .2012 . . .2011 . . .2010 . . .2009 . . .
RIDDLE MEMORIAL HOSPITAL (11731)2014 2 4.51 0.44 (0.05–1.60)2013 2 4.20 0.48 (0.05–1.72)2012 5 5.00 1.00 (0.32–2.34)2011 2 4.55 0.44 (0.05–1.59)2010 9 5.39 1.67 (0.76–3.17)2009 8 4.13 1.94 (0.83–3.81)
ST. CLAIR MEMORIAL HOSPITAL (10561)2014 2 4.54 0.44 (0.05–1.59)2013 4 4.92 0.81 (0.22–2.08)2012 1 4.62 0.22 (0.00–1.20)2011 5 4.24 1.18 (0.38–2.75)2010 8 3.68 2.18 (0.94–4.29)2009 7 3.64 1.92 (0.77–3.96)
PINNACLE HEALTH HOSPITALS - COMMUNITY GENERAL OSTEOPATHIC HOSPITAL (34069)2014 4 4.56 0.88 (0.24–2.25)2013 . . .2012 . . .2011 . . .2010 . . .2009 . . .
UPMC HAMOT (11725)2014 1 4.56 0.22 (0.00–1.22)2013 6 4.59 1.31 (0.48–2.85)2012 9 3.96 2.27 (1.04–4.31)2011 11 5.08 2.16 (1.08–3.87)2010 8 4.46 1.79 (0.77–3.53)2009 7 4.34 1.61 (0.65–3.32)
UPMC PASSAVANT (11242)2014 7 4.72 1.48 (0.59–3.05)2013 2 4.77 0.42 (0.05–1.51)2012 2 4.80 0.42 (0.05–1.50)2011 4 4.01 1.00 (0.27–2.55)2010 1 4.18 0.24 (0.00–1.33)2009 1 3.61 0.28 (0.00–1.54)
Continued on next page . . .
216

Table 4.5.12 – Rate of SSIs (SIR) — HPRO Procedures – Continued from previous page
Number of SSIs (HPRO) Predicted Number of SSIs (HPRO) SIR (95% CI)
MILTON S HERSHEY MEDICAL CENTER (11747)2014 6 4.74 1.27 (0.46–2.76)2013 9 5.95 1.51 (0.69–2.87)2012 6 6.72 0.89 (0.33–1.94)2011 11 8.13 1.35 (0.67–2.42)2010 8 7.13 1.12 (0.48–2.21)2009 6 6.02 1.00 (0.36–2.17)
READING HOSPITAL (12375)2014 4 4.79 0.83 (0.22–2.14)2013 4 5.52 0.73 (0.20–1.86)2012 1 6.01 0.17 (0.00–0.93)2011 3 5.54 0.54 (0.11–1.58)2010 2 5.72 0.35 (0.04–1.26)2009 4 4.96 0.81 (0.22–2.07)
GEISINGER MEDICAL CENTER (11775)2014 15 4.79 3.13 (1.75–5.16)2013 6 4.85 1.24 (0.45–2.69)2012 7 5.38 1.30 (0.52–2.68)2011 12 5.33 2.25 (1.16–3.93)2010 12 5.91 2.03 (1.05–3.55)2009 7 4.19 1.67 (0.67–3.45)
JEFFERSON HOSPITAL (10237)2014 7 5.26 1.33 (0.53–2.74)2013 7 4.70 1.49 (0.60–3.07)2012 12 4.89 2.46 (1.27–4.29)2011 3 5.01 0.60 (0.12–1.75)2010 1 3.66 0.27 (0.00–1.52)2009 4 2.47 1.62 (0.44–4.15)
UPMC ST. MARGARET (11561)2014 4 5.41 0.74 (0.20–1.89)2013 5 4.81 1.04 (0.33–2.42)2012 1 6.05 0.17 (0.00–0.92)2011 8 6.18 1.30 (0.56–2.55)2010 1 5.36 0.19 (0.00–1.04)2009 7 5.29 1.32 (0.53–2.73)
MOUNT NITTANY MEDICAL CENTER (11797)2014 6 5.55 1.08 (0.39–2.35)2013 7 5.70 1.23 (0.49–2.53)2012 8 4.94 1.62 (0.70–3.19)2011 4 4.91 0.82 (0.22–2.09)2010 1 4.53 0.22 (0.00–1.23)2009 6 4.34 1.38 (0.50–3.01)
MAGEE WOMENS HOSPITAL OF UPMC HEALTH SYSTEM (10301)2014 3 5.94 0.51 (0.10–1.48)2013 6 6.37 0.94 (0.34–2.05)2012 11 6.06 1.82 (0.90–3.25)2011 6 7.19 0.83 (0.30–1.82)2010 4 5.68 0.70 (0.19–1.80)2009 1 4.20 0.24 (0.00–1.32)
PENN PRESBYTERIAN MEDICAL CENTER (11814)2014 7 6.55 1.07 (0.43–2.20)2013 9 6.14 1.47 (0.67–2.78)2012 7 6.81 1.03 (0.41–2.12)2011 6 6.22 0.97 (0.35–2.10)2010 10 7.56 1.32 (0.63–2.43)2009 7 8.32 0.84 (0.34–1.73)
Continued on next page . . .
217
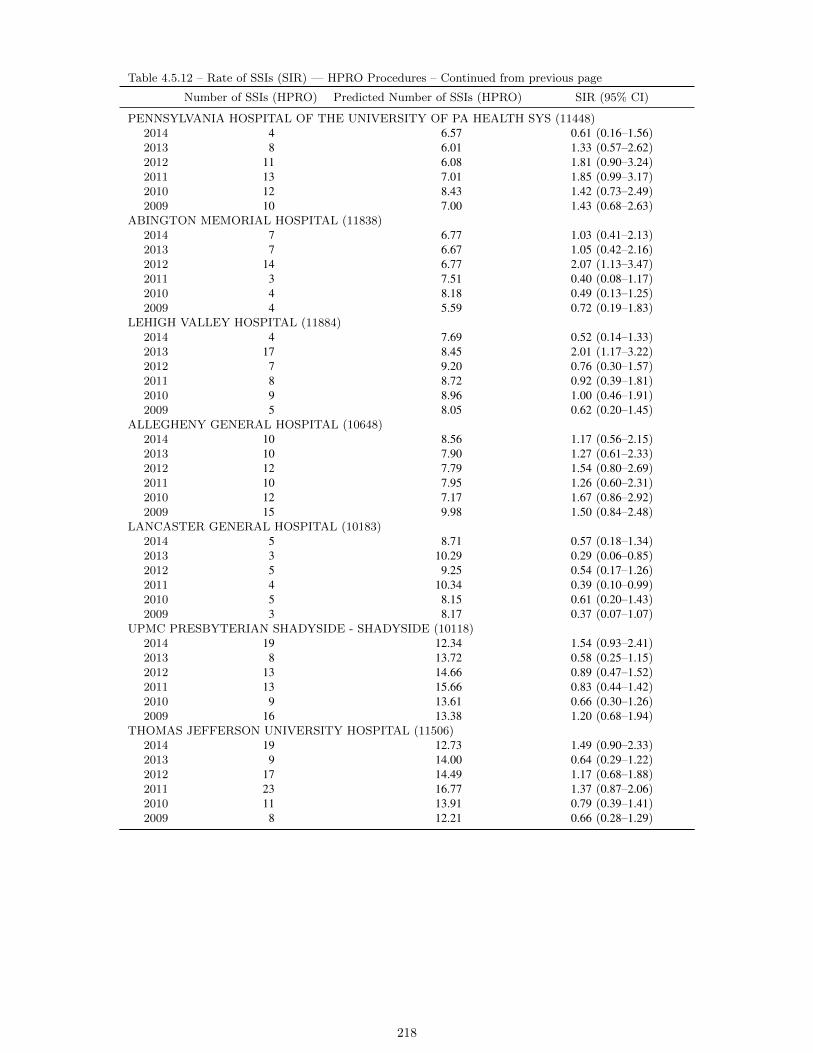
Table 4.5.12 – Rate of SSIs (SIR) — HPRO Procedures – Continued from previous page
Number of SSIs (HPRO) Predicted Number of SSIs (HPRO) SIR (95% CI)
PENNSYLVANIA HOSPITAL OF THE UNIVERSITY OF PA HEALTH SYS (11448)2014 4 6.57 0.61 (0.16–1.56)2013 8 6.01 1.33 (0.57–2.62)2012 11 6.08 1.81 (0.90–3.24)2011 13 7.01 1.85 (0.99–3.17)2010 12 8.43 1.42 (0.73–2.49)2009 10 7.00 1.43 (0.68–2.63)
ABINGTON MEMORIAL HOSPITAL (11838)2014 7 6.77 1.03 (0.41–2.13)2013 7 6.67 1.05 (0.42–2.16)2012 14 6.77 2.07 (1.13–3.47)2011 3 7.51 0.40 (0.08–1.17)2010 4 8.18 0.49 (0.13–1.25)2009 4 5.59 0.72 (0.19–1.83)
LEHIGH VALLEY HOSPITAL (11884)2014 4 7.69 0.52 (0.14–1.33)2013 17 8.45 2.01 (1.17–3.22)2012 7 9.20 0.76 (0.30–1.57)2011 8 8.72 0.92 (0.39–1.81)2010 9 8.96 1.00 (0.46–1.91)2009 5 8.05 0.62 (0.20–1.45)
ALLEGHENY GENERAL HOSPITAL (10648)2014 10 8.56 1.17 (0.56–2.15)2013 10 7.90 1.27 (0.61–2.33)2012 12 7.79 1.54 (0.80–2.69)2011 10 7.95 1.26 (0.60–2.31)2010 12 7.17 1.67 (0.86–2.92)2009 15 9.98 1.50 (0.84–2.48)
LANCASTER GENERAL HOSPITAL (10183)2014 5 8.71 0.57 (0.18–1.34)2013 3 10.29 0.29 (0.06–0.85)2012 5 9.25 0.54 (0.17–1.26)2011 4 10.34 0.39 (0.10–0.99)2010 5 8.15 0.61 (0.20–1.43)2009 3 8.17 0.37 (0.07–1.07)
UPMC PRESBYTERIAN SHADYSIDE - SHADYSIDE (10118)2014 19 12.34 1.54 (0.93–2.41)2013 8 13.72 0.58 (0.25–1.15)2012 13 14.66 0.89 (0.47–1.52)2011 13 15.66 0.83 (0.44–1.42)2010 9 13.61 0.66 (0.30–1.26)2009 16 13.38 1.20 (0.68–1.94)
THOMAS JEFFERSON UNIVERSITY HOSPITAL (11506)2014 19 12.73 1.49 (0.90–2.33)2013 9 14.00 0.64 (0.29–1.22)2012 17 14.49 1.17 (0.68–1.88)2011 23 16.77 1.37 (0.87–2.06)2010 11 13.91 0.79 (0.39–1.41)2009 8 12.21 0.66 (0.28–1.29)
218

Table 4.5.13: Rate (SIR) of Surgical Site Infections (SSIs) Associated with Abdominal Hysterectomy (HYST) by Hospital —Pennsylvania, 2009–2014
Number of SSIs (HYST) Predicted Number of SSIs (HYST) SIR (95% CI)
CHILDRENS HOSPITAL OF PHILADELPHIA (10306)2014 . . .2013 . . .2012 . . .2011 0 0.03 0.00 (0.00–144.04)2010 0 0.01 0.00 (0.00–346.66)2009 . . .
JERSEY SHORE HOSPITAL (11689)2014 . . .2013 1 0.03 34.36 (0.45–191.16)2012 . . .2011 0 0.01 0.00 (0.00–323.09)2010 . . .2009 . . .
TITUSVILLE AREA HOSPITAL (11738)2014 . . .2013 0 0.25 0.00 (0.00–14.84)2012 0 0.44 0.00 (0.00–8.38)2011 0 0.32 0.00 (0.00–11.45)2010 2 0.51 3.94 (0.44–14.22)2009 0 0.35 0.00 (0.00–10.59)
ELLWOOD CITY HOSPITAL (11779)2014 . . .2013 0 0.03 0.00 (0.00–130.99)2012 0 0.03 0.00 (0.00–106.50)2011 0 0.05 0.00 (0.00–80.77)2010 1 0.15 6.59 (0.09–36.69)2009 1 0.16 6.31 (0.08–35.09)
TYLER MEMORIAL HOSPITAL (11829)2014 . . .2013 . . .2012 . . .2011 . . .2010 . . .2009 0 0.06 0.00 (0.00–60.04)
CROZER CHESTER MEDICAL CENTER - SPRINGFIELD (11851)2014 . . .2013 . . .2012 0 2.09 0.00 (0.00–1.76)2011 0 0.11 0.00 (0.00–34.65)2010 0 0.12 0.00 (0.00–31.05)2009 1 0.08 11.91 (0.16–66.27)
SCHUYLKILL MEDICAL CENTER - EAST NORWEGIAN STREET (11922)2014 . . .2013 0 0.10 0.00 (0.00–38.59)2012 . . .2011 0 0.04 0.00 (0.00–99.63)2010 0 0.03 0.00 (0.00–118.86)2009 1 0.15 6.89 (0.09–38.36)
Continued on next page . . .
219
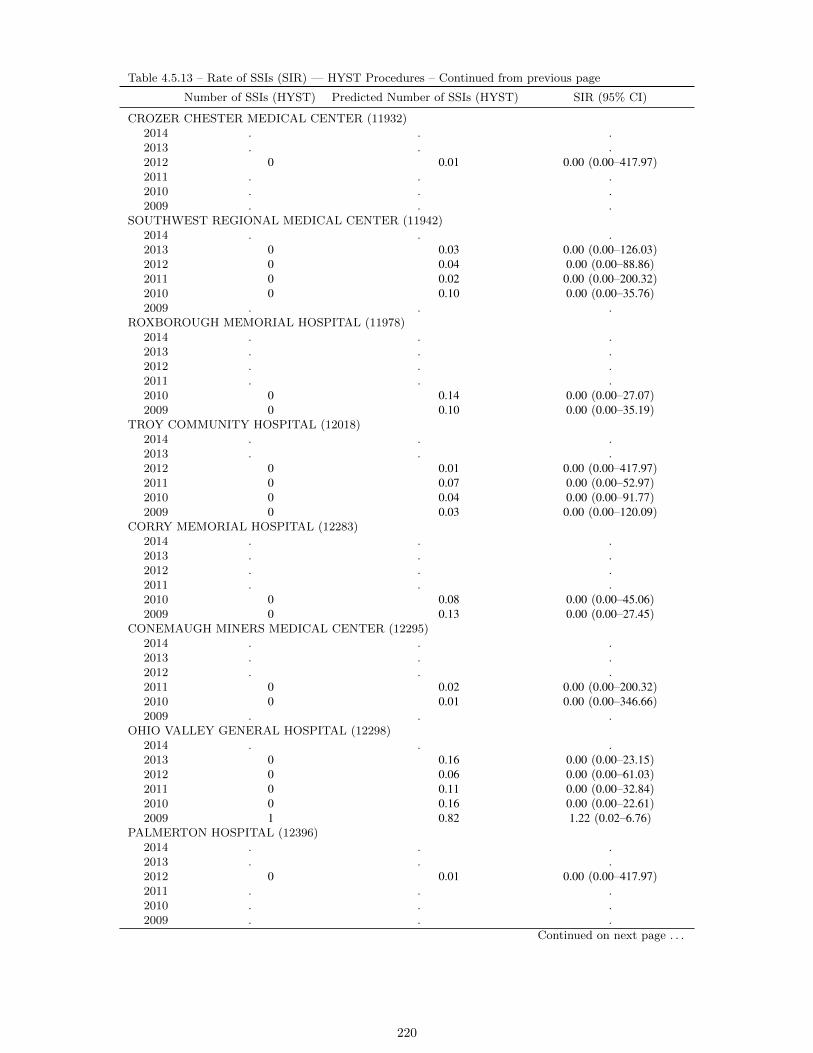
Table 4.5.13 – Rate of SSIs (SIR) — HYST Procedures – Continued from previous page
Number of SSIs (HYST) Predicted Number of SSIs (HYST) SIR (95% CI)
CROZER CHESTER MEDICAL CENTER (11932)2014 . . .2013 . . .2012 0 0.01 0.00 (0.00–417.97)2011 . . .2010 . . .2009 . . .
SOUTHWEST REGIONAL MEDICAL CENTER (11942)2014 . . .2013 0 0.03 0.00 (0.00–126.03)2012 0 0.04 0.00 (0.00–88.86)2011 0 0.02 0.00 (0.00–200.32)2010 0 0.10 0.00 (0.00–35.76)2009 . . .
ROXBOROUGH MEMORIAL HOSPITAL (11978)2014 . . .2013 . . .2012 . . .2011 . . .2010 0 0.14 0.00 (0.00–27.07)2009 0 0.10 0.00 (0.00–35.19)
TROY COMMUNITY HOSPITAL (12018)2014 . . .2013 . . .2012 0 0.01 0.00 (0.00–417.97)2011 0 0.07 0.00 (0.00–52.97)2010 0 0.04 0.00 (0.00–91.77)2009 0 0.03 0.00 (0.00–120.09)
CORRY MEMORIAL HOSPITAL (12283)2014 . . .2013 . . .2012 . . .2011 . . .2010 0 0.08 0.00 (0.00–45.06)2009 0 0.13 0.00 (0.00–27.45)
CONEMAUGH MINERS MEDICAL CENTER (12295)2014 . . .2013 . . .2012 . . .2011 0 0.02 0.00 (0.00–200.32)2010 0 0.01 0.00 (0.00–346.66)2009 . . .
OHIO VALLEY GENERAL HOSPITAL (12298)2014 . . .2013 0 0.16 0.00 (0.00–23.15)2012 0 0.06 0.00 (0.00–61.03)2011 0 0.11 0.00 (0.00–32.84)2010 0 0.16 0.00 (0.00–22.61)2009 1 0.82 1.22 (0.02–6.76)
PALMERTON HOSPITAL (12396)2014 . . .2013 . . .2012 0 0.01 0.00 (0.00–417.97)2011 . . .2010 . . .2009 . . .
Continued on next page . . .
220
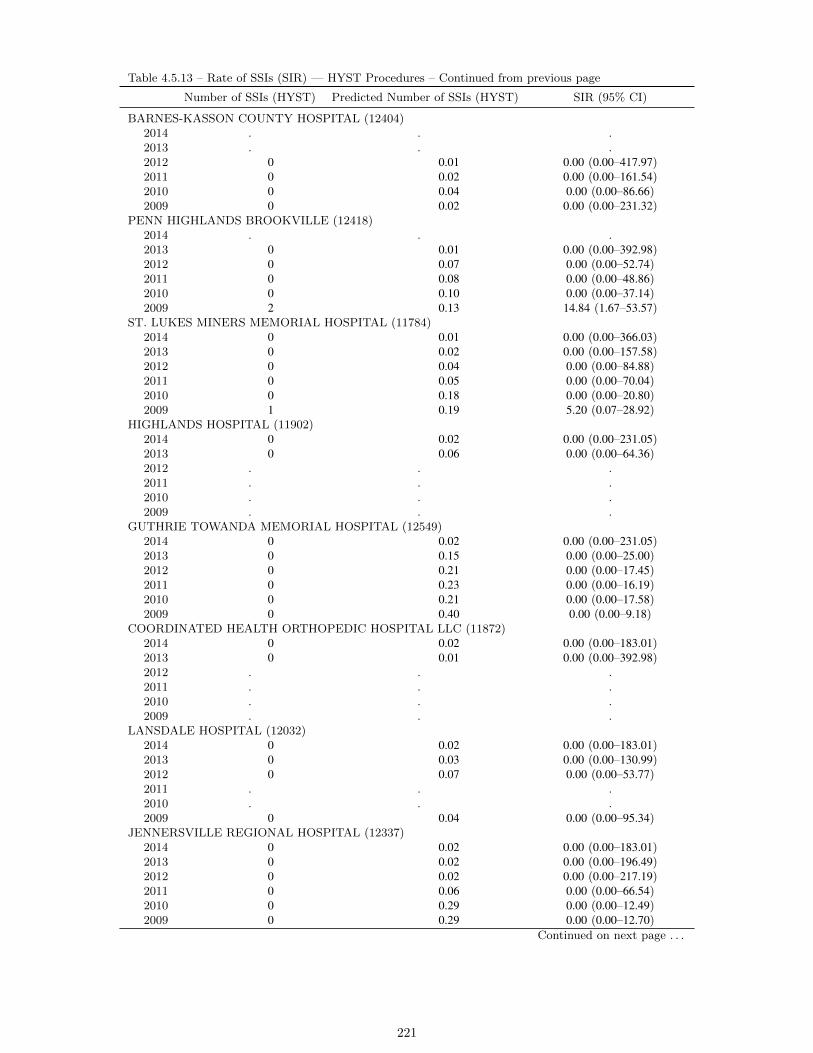
Table 4.5.13 – Rate of SSIs (SIR) — HYST Procedures – Continued from previous page
Number of SSIs (HYST) Predicted Number of SSIs (HYST) SIR (95% CI)
BARNES-KASSON COUNTY HOSPITAL (12404)2014 . . .2013 . . .2012 0 0.01 0.00 (0.00–417.97)2011 0 0.02 0.00 (0.00–161.54)2010 0 0.04 0.00 (0.00–86.66)2009 0 0.02 0.00 (0.00–231.32)
PENN HIGHLANDS BROOKVILLE (12418)2014 . . .2013 0 0.01 0.00 (0.00–392.98)2012 0 0.07 0.00 (0.00–52.74)2011 0 0.08 0.00 (0.00–48.86)2010 0 0.10 0.00 (0.00–37.14)2009 2 0.13 14.84 (1.67–53.57)
ST. LUKES MINERS MEMORIAL HOSPITAL (11784)2014 0 0.01 0.00 (0.00–366.03)2013 0 0.02 0.00 (0.00–157.58)2012 0 0.04 0.00 (0.00–84.88)2011 0 0.05 0.00 (0.00–70.04)2010 0 0.18 0.00 (0.00–20.80)2009 1 0.19 5.20 (0.07–28.92)
HIGHLANDS HOSPITAL (11902)2014 0 0.02 0.00 (0.00–231.05)2013 0 0.06 0.00 (0.00–64.36)2012 . . .2011 . . .2010 . . .2009 . . .
GUTHRIE TOWANDA MEMORIAL HOSPITAL (12549)2014 0 0.02 0.00 (0.00–231.05)2013 0 0.15 0.00 (0.00–25.00)2012 0 0.21 0.00 (0.00–17.45)2011 0 0.23 0.00 (0.00–16.19)2010 0 0.21 0.00 (0.00–17.58)2009 0 0.40 0.00 (0.00–9.18)
COORDINATED HEALTH ORTHOPEDIC HOSPITAL LLC (11872)2014 0 0.02 0.00 (0.00–183.01)2013 0 0.01 0.00 (0.00–392.98)2012 . . .2011 . . .2010 . . .2009 . . .
LANSDALE HOSPITAL (12032)2014 0 0.02 0.00 (0.00–183.01)2013 0 0.03 0.00 (0.00–130.99)2012 0 0.07 0.00 (0.00–53.77)2011 . . .2010 . . .2009 0 0.04 0.00 (0.00–95.34)
JENNERSVILLE REGIONAL HOSPITAL (12337)2014 0 0.02 0.00 (0.00–183.01)2013 0 0.02 0.00 (0.00–196.49)2012 0 0.02 0.00 (0.00–217.19)2011 0 0.06 0.00 (0.00–66.54)2010 0 0.29 0.00 (0.00–12.49)2009 0 0.29 0.00 (0.00–12.70)
Continued on next page . . .
221
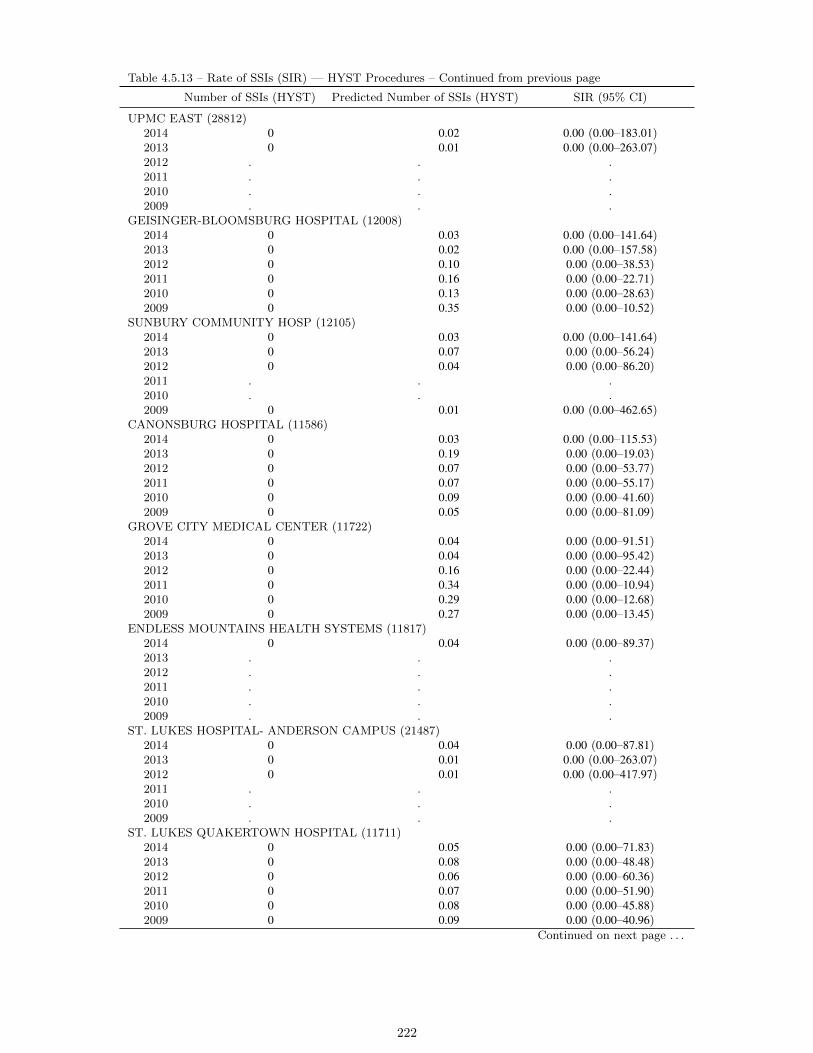
Table 4.5.13 – Rate of SSIs (SIR) — HYST Procedures – Continued from previous page
Number of SSIs (HYST) Predicted Number of SSIs (HYST) SIR (95% CI)
UPMC EAST (28812)2014 0 0.02 0.00 (0.00–183.01)2013 0 0.01 0.00 (0.00–263.07)2012 . . .2011 . . .2010 . . .2009 . . .
GEISINGER-BLOOMSBURG HOSPITAL (12008)2014 0 0.03 0.00 (0.00–141.64)2013 0 0.02 0.00 (0.00–157.58)2012 0 0.10 0.00 (0.00–38.53)2011 0 0.16 0.00 (0.00–22.71)2010 0 0.13 0.00 (0.00–28.63)2009 0 0.35 0.00 (0.00–10.52)
SUNBURY COMMUNITY HOSP (12105)2014 0 0.03 0.00 (0.00–141.64)2013 0 0.07 0.00 (0.00–56.24)2012 0 0.04 0.00 (0.00–86.20)2011 . . .2010 . . .2009 0 0.01 0.00 (0.00–462.65)
CANONSBURG HOSPITAL (11586)2014 0 0.03 0.00 (0.00–115.53)2013 0 0.19 0.00 (0.00–19.03)2012 0 0.07 0.00 (0.00–53.77)2011 0 0.07 0.00 (0.00–55.17)2010 0 0.09 0.00 (0.00–41.60)2009 0 0.05 0.00 (0.00–81.09)
GROVE CITY MEDICAL CENTER (11722)2014 0 0.04 0.00 (0.00–91.51)2013 0 0.04 0.00 (0.00–95.42)2012 0 0.16 0.00 (0.00–22.44)2011 0 0.34 0.00 (0.00–10.94)2010 0 0.29 0.00 (0.00–12.68)2009 0 0.27 0.00 (0.00–13.45)
ENDLESS MOUNTAINS HEALTH SYSTEMS (11817)2014 0 0.04 0.00 (0.00–89.37)2013 . . .2012 . . .2011 . . .2010 . . .2009 . . .
ST. LUKES HOSPITAL- ANDERSON CAMPUS (21487)2014 0 0.04 0.00 (0.00–87.81)2013 0 0.01 0.00 (0.00–263.07)2012 0 0.01 0.00 (0.00–417.97)2011 . . .2010 . . .2009 . . .
ST. LUKES QUAKERTOWN HOSPITAL (11711)2014 0 0.05 0.00 (0.00–71.83)2013 0 0.08 0.00 (0.00–48.48)2012 0 0.06 0.00 (0.00–60.36)2011 0 0.07 0.00 (0.00–51.90)2010 0 0.08 0.00 (0.00–45.88)2009 0 0.09 0.00 (0.00–40.96)
Continued on next page . . .
222
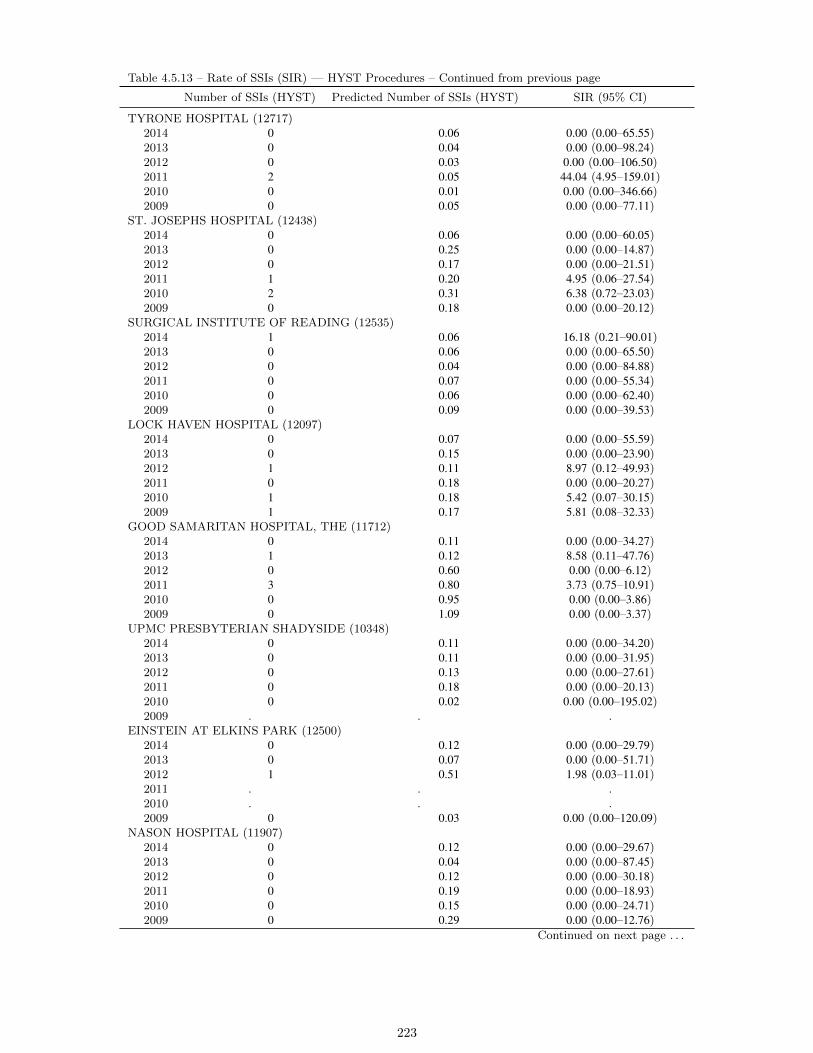
Table 4.5.13 – Rate of SSIs (SIR) — HYST Procedures – Continued from previous page
Number of SSIs (HYST) Predicted Number of SSIs (HYST) SIR (95% CI)
TYRONE HOSPITAL (12717)2014 0 0.06 0.00 (0.00–65.55)2013 0 0.04 0.00 (0.00–98.24)2012 0 0.03 0.00 (0.00–106.50)2011 2 0.05 44.04 (4.95–159.01)2010 0 0.01 0.00 (0.00–346.66)2009 0 0.05 0.00 (0.00–77.11)
ST. JOSEPHS HOSPITAL (12438)2014 0 0.06 0.00 (0.00–60.05)2013 0 0.25 0.00 (0.00–14.87)2012 0 0.17 0.00 (0.00–21.51)2011 1 0.20 4.95 (0.06–27.54)2010 2 0.31 6.38 (0.72–23.03)2009 0 0.18 0.00 (0.00–20.12)
SURGICAL INSTITUTE OF READING (12535)2014 1 0.06 16.18 (0.21–90.01)2013 0 0.06 0.00 (0.00–65.50)2012 0 0.04 0.00 (0.00–84.88)2011 0 0.07 0.00 (0.00–55.34)2010 0 0.06 0.00 (0.00–62.40)2009 0 0.09 0.00 (0.00–39.53)
LOCK HAVEN HOSPITAL (12097)2014 0 0.07 0.00 (0.00–55.59)2013 0 0.15 0.00 (0.00–23.90)2012 1 0.11 8.97 (0.12–49.93)2011 0 0.18 0.00 (0.00–20.27)2010 1 0.18 5.42 (0.07–30.15)2009 1 0.17 5.81 (0.08–32.33)
GOOD SAMARITAN HOSPITAL, THE (11712)2014 0 0.11 0.00 (0.00–34.27)2013 1 0.12 8.58 (0.11–47.76)2012 0 0.60 0.00 (0.00–6.12)2011 3 0.80 3.73 (0.75–10.91)2010 0 0.95 0.00 (0.00–3.86)2009 0 1.09 0.00 (0.00–3.37)
UPMC PRESBYTERIAN SHADYSIDE (10348)2014 0 0.11 0.00 (0.00–34.20)2013 0 0.11 0.00 (0.00–31.95)2012 0 0.13 0.00 (0.00–27.61)2011 0 0.18 0.00 (0.00–20.13)2010 0 0.02 0.00 (0.00–195.02)2009 . . .
EINSTEIN AT ELKINS PARK (12500)2014 0 0.12 0.00 (0.00–29.79)2013 0 0.07 0.00 (0.00–51.71)2012 1 0.51 1.98 (0.03–11.01)2011 . . .2010 . . .2009 0 0.03 0.00 (0.00–120.09)
NASON HOSPITAL (11907)2014 0 0.12 0.00 (0.00–29.67)2013 0 0.04 0.00 (0.00–87.45)2012 0 0.12 0.00 (0.00–30.18)2011 0 0.19 0.00 (0.00–18.93)2010 0 0.15 0.00 (0.00–24.71)2009 0 0.29 0.00 (0.00–12.76)
Continued on next page . . .
223
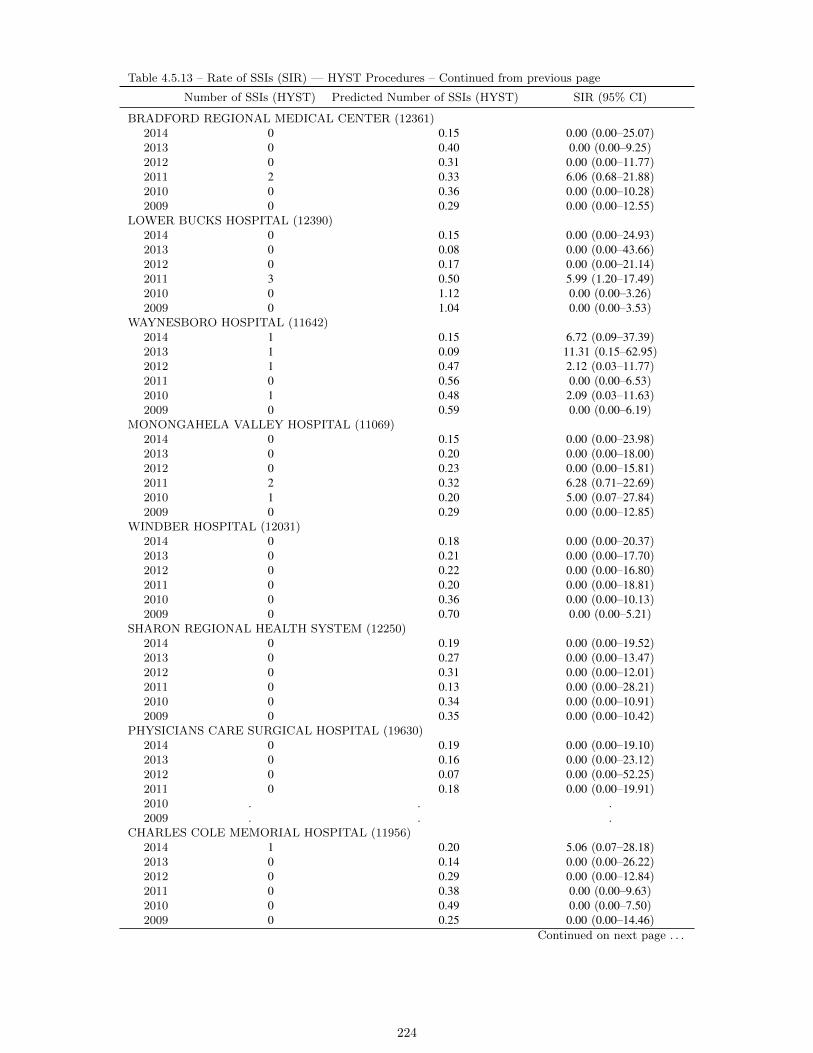
Table 4.5.13 – Rate of SSIs (SIR) — HYST Procedures – Continued from previous page
Number of SSIs (HYST) Predicted Number of SSIs (HYST) SIR (95% CI)
BRADFORD REGIONAL MEDICAL CENTER (12361)2014 0 0.15 0.00 (0.00–25.07)2013 0 0.40 0.00 (0.00–9.25)2012 0 0.31 0.00 (0.00–11.77)2011 2 0.33 6.06 (0.68–21.88)2010 0 0.36 0.00 (0.00–10.28)2009 0 0.29 0.00 (0.00–12.55)
LOWER BUCKS HOSPITAL (12390)2014 0 0.15 0.00 (0.00–24.93)2013 0 0.08 0.00 (0.00–43.66)2012 0 0.17 0.00 (0.00–21.14)2011 3 0.50 5.99 (1.20–17.49)2010 0 1.12 0.00 (0.00–3.26)2009 0 1.04 0.00 (0.00–3.53)
WAYNESBORO HOSPITAL (11642)2014 1 0.15 6.72 (0.09–37.39)2013 1 0.09 11.31 (0.15–62.95)2012 1 0.47 2.12 (0.03–11.77)2011 0 0.56 0.00 (0.00–6.53)2010 1 0.48 2.09 (0.03–11.63)2009 0 0.59 0.00 (0.00–6.19)
MONONGAHELA VALLEY HOSPITAL (11069)2014 0 0.15 0.00 (0.00–23.98)2013 0 0.20 0.00 (0.00–18.00)2012 0 0.23 0.00 (0.00–15.81)2011 2 0.32 6.28 (0.71–22.69)2010 1 0.20 5.00 (0.07–27.84)2009 0 0.29 0.00 (0.00–12.85)
WINDBER HOSPITAL (12031)2014 0 0.18 0.00 (0.00–20.37)2013 0 0.21 0.00 (0.00–17.70)2012 0 0.22 0.00 (0.00–16.80)2011 0 0.20 0.00 (0.00–18.81)2010 0 0.36 0.00 (0.00–10.13)2009 0 0.70 0.00 (0.00–5.21)
SHARON REGIONAL HEALTH SYSTEM (12250)2014 0 0.19 0.00 (0.00–19.52)2013 0 0.27 0.00 (0.00–13.47)2012 0 0.31 0.00 (0.00–12.01)2011 0 0.13 0.00 (0.00–28.21)2010 0 0.34 0.00 (0.00–10.91)2009 0 0.35 0.00 (0.00–10.42)
PHYSICIANS CARE SURGICAL HOSPITAL (19630)2014 0 0.19 0.00 (0.00–19.10)2013 0 0.16 0.00 (0.00–23.12)2012 0 0.07 0.00 (0.00–52.25)2011 0 0.18 0.00 (0.00–19.91)2010 . . .2009 . . .
CHARLES COLE MEMORIAL HOSPITAL (11956)2014 1 0.20 5.06 (0.07–28.18)2013 0 0.14 0.00 (0.00–26.22)2012 0 0.29 0.00 (0.00–12.84)2011 0 0.38 0.00 (0.00–9.63)2010 0 0.49 0.00 (0.00–7.50)2009 0 0.25 0.00 (0.00–14.46)
Continued on next page . . .
224

Table 4.5.13 – Rate of SSIs (SIR) — HYST Procedures – Continued from previous page
Number of SSIs (HYST) Predicted Number of SSIs (HYST) SIR (95% CI)
GNADEN HUETTEN MEMORIAL HOSPITAL (12241)2014 0 0.20 0.00 (0.00–18.51)2013 0 0.04 0.00 (0.00–98.55)2012 1 0.17 5.83 (0.08–32.43)2011 1 0.24 4.13 (0.05–23.00)2010 2 0.23 8.68 (0.97–31.34)2009 2 0.19 10.40 (1.17–37.54)
GEISINGER-COMMUNITY MEDICAL CENTER (11914)2014 1 0.20 4.98 (0.07–27.71)2013 0 0.02 0.00 (0.00–157.58)2012 0 0.15 0.00 (0.00–25.20)2011 0 0.04 0.00 (0.00–89.43)2010 . . .2009 . . .
ARMSTRONG COUNTY MEMORIAL HOSPITAL (12057)2014 0 0.21 0.00 (0.00–17.85)2013 0 0.16 0.00 (0.00–22.50)2012 0 0.13 0.00 (0.00–28.29)2011 0 0.17 0.00 (0.00–22.01)2010 0 0.20 0.00 (0.00–18.44)2009 0 0.46 0.00 (0.00–8.04)
JAMESON MEMORIAL HOSPITAL (11954)2014 1 0.23 4.43 (0.06–24.65)2013 0 0.30 0.00 (0.00–12.25)2012 0 0.46 0.00 (0.00–8.04)2011 0 0.61 0.00 (0.00–6.01)2010 0 0.67 0.00 (0.00–5.50)2009 0 0.69 0.00 (0.00–5.31)
PENN HIGHLANDS CLEARFIELD (11843)2014 0 0.23 0.00 (0.00–15.78)2013 0 0.28 0.00 (0.00–13.11)2012 0 0.38 0.00 (0.00–9.63)2011 1 0.37 2.71 (0.04–15.10)2010 1 0.42 2.41 (0.03–13.41)2009 2 0.50 4.00 (0.45–14.43)
DELAWARE COUNTY MEMORIAL HOSPITAL (11972)2014 0 0.23 0.00 (0.00–15.67)2013 1 0.29 3.40 (0.04–18.89)2012 0 0.46 0.00 (0.00–7.92)2011 0 0.73 0.00 (0.00–5.02)2010 0 0.89 0.00 (0.00–4.10)2009 0 0.73 0.00 (0.00–5.05)
WILLIAMSPORT REGIONAL MEDICAL CENTER (11732)2014 0 0.25 0.00 (0.00–14.92)2013 1 0.74 1.35 (0.02–7.53)2012 0 1.18 0.00 (0.00–3.10)2011 3 2.28 1.32 (0.26–3.84)2010 2 2.14 0.94 (0.11–3.38)2009 2 2.16 0.93 (0.10–3.35)
PUNXSUTAWNEY AREA HOSPITAL (11830)2014 4 0.25 16.02 (4.31–41.01)2013 2 0.36 5.57 (0.63–20.11)2012 0 0.35 0.00 (0.00–10.37)2011 1 0.19 5.35 (0.07–29.76)2010 0 0.17 0.00 (0.00–21.52)2009 0 0.19 0.00 (0.00–18.84)
Continued on next page . . .
225
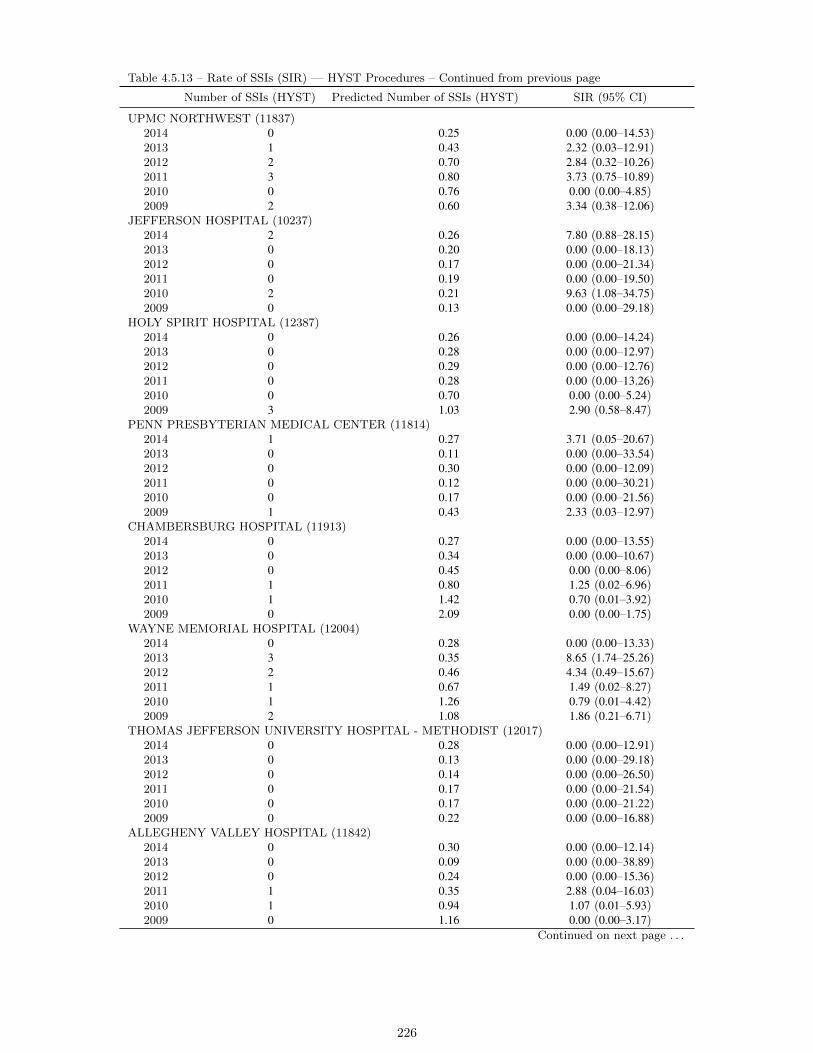
Table 4.5.13 – Rate of SSIs (SIR) — HYST Procedures – Continued from previous page
Number of SSIs (HYST) Predicted Number of SSIs (HYST) SIR (95% CI)
UPMC NORTHWEST (11837)2014 0 0.25 0.00 (0.00–14.53)2013 1 0.43 2.32 (0.03–12.91)2012 2 0.70 2.84 (0.32–10.26)2011 3 0.80 3.73 (0.75–10.89)2010 0 0.76 0.00 (0.00–4.85)2009 2 0.60 3.34 (0.38–12.06)
JEFFERSON HOSPITAL (10237)2014 2 0.26 7.80 (0.88–28.15)2013 0 0.20 0.00 (0.00–18.13)2012 0 0.17 0.00 (0.00–21.34)2011 0 0.19 0.00 (0.00–19.50)2010 2 0.21 9.63 (1.08–34.75)2009 0 0.13 0.00 (0.00–29.18)
HOLY SPIRIT HOSPITAL (12387)2014 0 0.26 0.00 (0.00–14.24)2013 0 0.28 0.00 (0.00–12.97)2012 0 0.29 0.00 (0.00–12.76)2011 0 0.28 0.00 (0.00–13.26)2010 0 0.70 0.00 (0.00–5.24)2009 3 1.03 2.90 (0.58–8.47)
PENN PRESBYTERIAN MEDICAL CENTER (11814)2014 1 0.27 3.71 (0.05–20.67)2013 0 0.11 0.00 (0.00–33.54)2012 0 0.30 0.00 (0.00–12.09)2011 0 0.12 0.00 (0.00–30.21)2010 0 0.17 0.00 (0.00–21.56)2009 1 0.43 2.33 (0.03–12.97)
CHAMBERSBURG HOSPITAL (11913)2014 0 0.27 0.00 (0.00–13.55)2013 0 0.34 0.00 (0.00–10.67)2012 0 0.45 0.00 (0.00–8.06)2011 1 0.80 1.25 (0.02–6.96)2010 1 1.42 0.70 (0.01–3.92)2009 0 2.09 0.00 (0.00–1.75)
WAYNE MEMORIAL HOSPITAL (12004)2014 0 0.28 0.00 (0.00–13.33)2013 3 0.35 8.65 (1.74–25.26)2012 2 0.46 4.34 (0.49–15.67)2011 1 0.67 1.49 (0.02–8.27)2010 1 1.26 0.79 (0.01–4.42)2009 2 1.08 1.86 (0.21–6.71)
THOMAS JEFFERSON UNIVERSITY HOSPITAL - METHODIST (12017)2014 0 0.28 0.00 (0.00–12.91)2013 0 0.13 0.00 (0.00–29.18)2012 0 0.14 0.00 (0.00–26.50)2011 0 0.17 0.00 (0.00–21.54)2010 0 0.17 0.00 (0.00–21.22)2009 0 0.22 0.00 (0.00–16.88)
ALLEGHENY VALLEY HOSPITAL (11842)2014 0 0.30 0.00 (0.00–12.14)2013 0 0.09 0.00 (0.00–38.89)2012 0 0.24 0.00 (0.00–15.36)2011 1 0.35 2.88 (0.04–16.03)2010 1 0.94 1.07 (0.01–5.93)2009 0 1.16 0.00 (0.00–3.17)
Continued on next page . . .
226

Table 4.5.13 – Rate of SSIs (SIR) — HYST Procedures – Continued from previous page
Number of SSIs (HYST) Predicted Number of SSIs (HYST) SIR (95% CI)
MERCY PHILADELPHIA HOSPITAL (11946)2014 0 0.30 0.00 (0.00–12.13)2013 0 0.54 0.00 (0.00–6.73)2012 0 0.52 0.00 (0.00–7.05)2011 0 0.30 0.00 (0.00–12.35)2010 0 0.67 0.00 (0.00–5.49)2009 0 0.42 0.00 (0.00–8.68)
PENN HIGHLANDS ELK (11859)2014 0 0.33 0.00 (0.00–11.25)2013 0 0.38 0.00 (0.00–9.67)2012 1 0.49 2.06 (0.03–11.47)2011 1 0.89 1.12 (0.01–6.22)2010 1 0.79 1.27 (0.02–7.05)2009 0 0.26 0.00 (0.00–14.21)
POTTSTOWN MEMORIAL MEDICAL CENTER (11983)2014 0 0.33 0.00 (0.00–11.06)2013 0 0.30 0.00 (0.00–12.29)2012 1 0.42 2.40 (0.03–13.38)2011 0 0.51 0.00 (0.00–7.26)2010 0 0.54 0.00 (0.00–6.74)2009 1 0.54 1.86 (0.02–10.37)
SOMERSET HOSPITAL (12282)2014 0 0.35 0.00 (0.00–10.63)2013 2 0.57 3.54 (0.40–12.77)2012 0 0.41 0.00 (0.00–8.90)2011 0 0.16 0.00 (0.00–22.61)2010 0 0.42 0.00 (0.00–8.83)2009 0 0.48 0.00 (0.00–7.72)
NAZARETH HOSPITAL (11919)2014 1 0.35 2.87 (0.04–15.95)2013 1 0.15 6.72 (0.09–37.40)2012 1 0.04 23.50 (0.31–130.75)2011 0 0.30 0.00 (0.00–12.43)2010 . . .2009 . . .
BERWICK HOSPITAL CENTER (11442)2014 0 0.35 0.00 (0.00–10.45)2013 0 0.17 0.00 (0.00–21.88)2012 0 0.31 0.00 (0.00–12.02)2011 0 0.51 0.00 (0.00–7.18)2010 0 0.75 0.00 (0.00–4.90)2009 1 0.71 1.41 (0.02–7.83)
MILLCREEK COMMUNITY HOSPITAL (12253)2014 0 0.36 0.00 (0.00–10.13)2013 0 0.46 0.00 (0.00–7.96)2012 0 0.51 0.00 (0.00–7.13)2011 0 0.39 0.00 (0.00–9.40)2010 0 0.51 0.00 (0.00–7.22)2009 1 0.43 2.34 (0.03–13.03)
PINNACLE HEALTH HOSPITALS - COMMUNITY GENERAL OSTEOPATHIC HOSPITAL (34069)2014 0 0.40 0.00 (0.00–9.12)2013 . . .2012 . . .2011 . . .2010 . . .2009 . . .
Continued on next page . . .
227

Table 4.5.13 – Rate of SSIs (SIR) — HYST Procedures – Continued from previous page
Number of SSIs (HYST) Predicted Number of SSIs (HYST) SIR (95% CI)
BRANDYWINE HOSPITAL (11979)2014 0 0.40 0.00 (0.00–9.07)2013 0 0.28 0.00 (0.00–12.98)2012 1 0.48 2.10 (0.03–11.71)2011 0 0.61 0.00 (0.00–5.98)2010 . . .2009 . . .
EVANGELICAL COMMUNITY HOSPITAL (11701)2014 2 0.41 4.90 (0.55–17.67)2013 0 0.25 0.00 (0.00–14.72)2012 0 0.41 0.00 (0.00–8.93)2011 1 0.66 1.52 (0.02–8.47)2010 1 1.44 0.69 (0.01–3.86)2009 1 1.83 0.55 (0.01–3.04)
UPMC ST. MARGARET (11561)2014 0 0.43 0.00 (0.00–8.59)2013 1 0.56 1.79 (0.02–9.97)2012 1 0.44 2.25 (0.03–12.51)2011 1 0.56 1.77 (0.02–9.88)2010 1 0.50 2.02 (0.03–11.23)2009 1 0.51 1.96 (0.03–10.90)
LEHIGH VALLEY HOSPITAL - HAZLETON (11878)2014 3 0.45 6.65 (1.34–19.43)2013 0 0.30 0.00 (0.00–12.24)2012 1 0.41 2.43 (0.03–13.51)2011 1 0.56 1.79 (0.02–9.95)2010 1 0.67 1.50 (0.02–8.32)2009 0 0.74 0.00 (0.00–4.95)
GRAND VIEW HOSPITAL (11847)2014 0 0.45 0.00 (0.00–8.10)2013 1 0.97 1.03 (0.01–5.72)2012 1 2.01 0.50 (0.01–2.77)2011 1 2.61 0.38 (0.01–2.13)2010 0 2.16 0.00 (0.00–1.69)2009 0 1.85 0.00 (0.00–1.99)
ALLEGHENY GENERAL HOSPITAL (10648)2014 2 0.46 4.32 (0.48–15.58)2013 0 0.47 0.00 (0.00–7.86)2012 1 0.47 2.15 (0.03–11.95)2011 1 0.69 1.44 (0.02–8.02)2010 2 1.59 1.26 (0.14–4.55)2009 5 3.84 1.30 (0.42–3.04)
MERCY FITZGERALD HOSPITAL (11683)2014 0 0.50 0.00 (0.00–7.37)2013 0 0.68 0.00 (0.00–5.37)2012 1 0.53 1.88 (0.02–10.49)2011 0 0.47 0.00 (0.00–7.79)2010 1 0.56 1.78 (0.02–9.89)2009 2 0.84 2.37 (0.27–8.55)
CLARION HOSPITAL (11654)2014 1 0.52 1.93 (0.03–10.71)2013 1 0.34 2.98 (0.04–16.60)2012 0 0.51 0.00 (0.00–7.24)2011 0 0.36 0.00 (0.00–10.29)2010 2 0.77 2.61 (0.29–9.44)2009 0 0.86 0.00 (0.00–4.24)
Continued on next page . . .
228
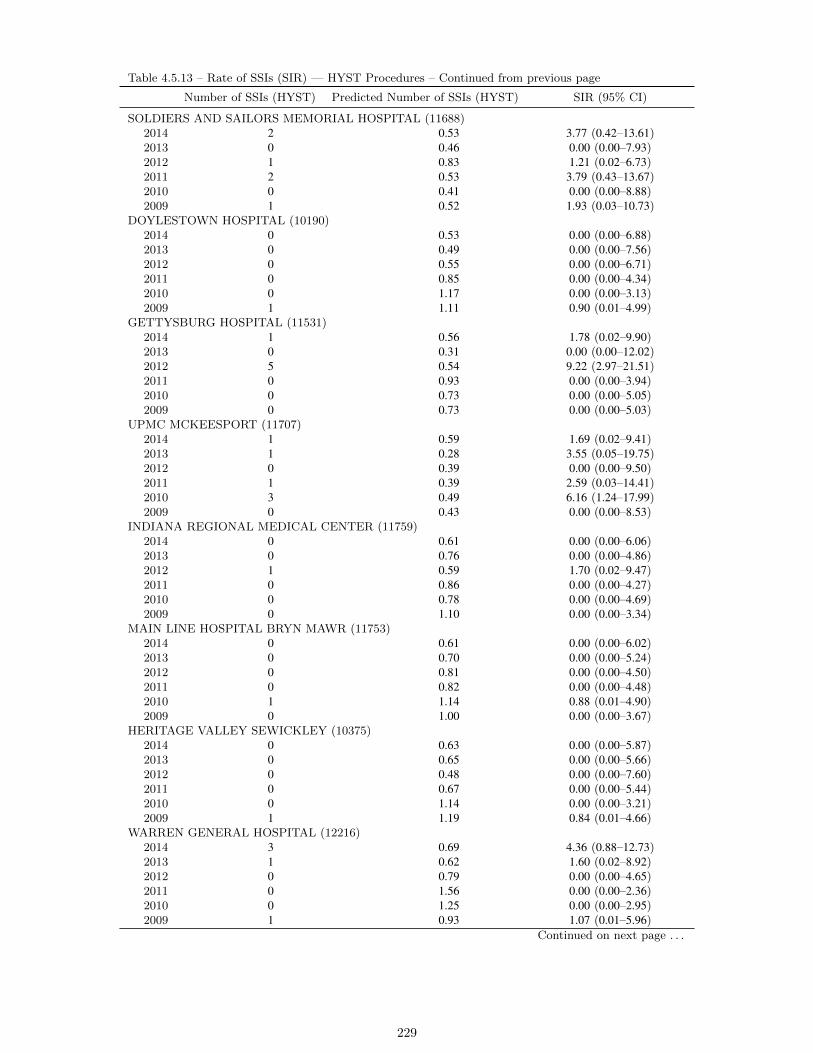
Table 4.5.13 – Rate of SSIs (SIR) — HYST Procedures – Continued from previous page
Number of SSIs (HYST) Predicted Number of SSIs (HYST) SIR (95% CI)
SOLDIERS AND SAILORS MEMORIAL HOSPITAL (11688)2014 2 0.53 3.77 (0.42–13.61)2013 0 0.46 0.00 (0.00–7.93)2012 1 0.83 1.21 (0.02–6.73)2011 2 0.53 3.79 (0.43–13.67)2010 0 0.41 0.00 (0.00–8.88)2009 1 0.52 1.93 (0.03–10.73)
DOYLESTOWN HOSPITAL (10190)2014 0 0.53 0.00 (0.00–6.88)2013 0 0.49 0.00 (0.00–7.56)2012 0 0.55 0.00 (0.00–6.71)2011 0 0.85 0.00 (0.00–4.34)2010 0 1.17 0.00 (0.00–3.13)2009 1 1.11 0.90 (0.01–4.99)
GETTYSBURG HOSPITAL (11531)2014 1 0.56 1.78 (0.02–9.90)2013 0 0.31 0.00 (0.00–12.02)2012 5 0.54 9.22 (2.97–21.51)2011 0 0.93 0.00 (0.00–3.94)2010 0 0.73 0.00 (0.00–5.05)2009 0 0.73 0.00 (0.00–5.03)
UPMC MCKEESPORT (11707)2014 1 0.59 1.69 (0.02–9.41)2013 1 0.28 3.55 (0.05–19.75)2012 0 0.39 0.00 (0.00–9.50)2011 1 0.39 2.59 (0.03–14.41)2010 3 0.49 6.16 (1.24–17.99)2009 0 0.43 0.00 (0.00–8.53)
INDIANA REGIONAL MEDICAL CENTER (11759)2014 0 0.61 0.00 (0.00–6.06)2013 0 0.76 0.00 (0.00–4.86)2012 1 0.59 1.70 (0.02–9.47)2011 0 0.86 0.00 (0.00–4.27)2010 0 0.78 0.00 (0.00–4.69)2009 0 1.10 0.00 (0.00–3.34)
MAIN LINE HOSPITAL BRYN MAWR (11753)2014 0 0.61 0.00 (0.00–6.02)2013 0 0.70 0.00 (0.00–5.24)2012 0 0.81 0.00 (0.00–4.50)2011 0 0.82 0.00 (0.00–4.48)2010 1 1.14 0.88 (0.01–4.90)2009 0 1.00 0.00 (0.00–3.67)
HERITAGE VALLEY SEWICKLEY (10375)2014 0 0.63 0.00 (0.00–5.87)2013 0 0.65 0.00 (0.00–5.66)2012 0 0.48 0.00 (0.00–7.60)2011 0 0.67 0.00 (0.00–5.44)2010 0 1.14 0.00 (0.00–3.21)2009 1 1.19 0.84 (0.01–4.66)
WARREN GENERAL HOSPITAL (12216)2014 3 0.69 4.36 (0.88–12.73)2013 1 0.62 1.60 (0.02–8.92)2012 0 0.79 0.00 (0.00–4.65)2011 0 1.56 0.00 (0.00–2.36)2010 0 1.25 0.00 (0.00–2.95)2009 1 0.93 1.07 (0.01–5.96)
Continued on next page . . .
229
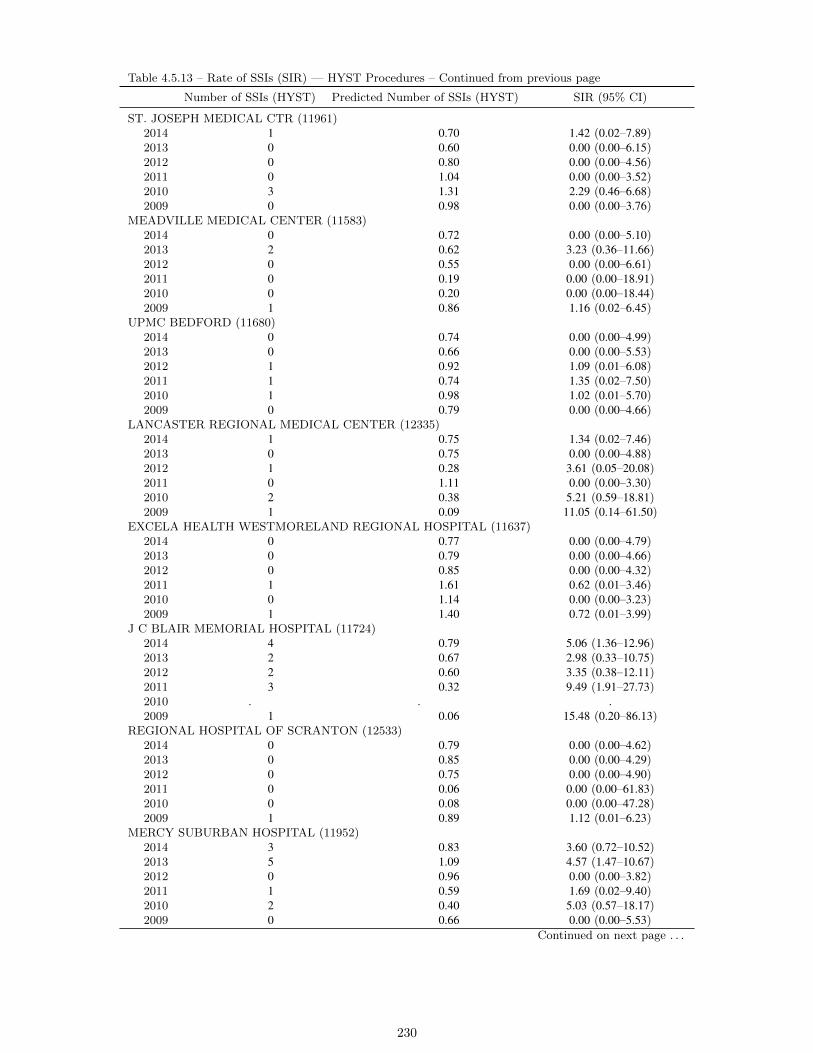
Table 4.5.13 – Rate of SSIs (SIR) — HYST Procedures – Continued from previous page
Number of SSIs (HYST) Predicted Number of SSIs (HYST) SIR (95% CI)
ST. JOSEPH MEDICAL CTR (11961)2014 1 0.70 1.42 (0.02–7.89)2013 0 0.60 0.00 (0.00–6.15)2012 0 0.80 0.00 (0.00–4.56)2011 0 1.04 0.00 (0.00–3.52)2010 3 1.31 2.29 (0.46–6.68)2009 0 0.98 0.00 (0.00–3.76)
MEADVILLE MEDICAL CENTER (11583)2014 0 0.72 0.00 (0.00–5.10)2013 2 0.62 3.23 (0.36–11.66)2012 0 0.55 0.00 (0.00–6.61)2011 0 0.19 0.00 (0.00–18.91)2010 0 0.20 0.00 (0.00–18.44)2009 1 0.86 1.16 (0.02–6.45)
UPMC BEDFORD (11680)2014 0 0.74 0.00 (0.00–4.99)2013 0 0.66 0.00 (0.00–5.53)2012 1 0.92 1.09 (0.01–6.08)2011 1 0.74 1.35 (0.02–7.50)2010 1 0.98 1.02 (0.01–5.70)2009 0 0.79 0.00 (0.00–4.66)
LANCASTER REGIONAL MEDICAL CENTER (12335)2014 1 0.75 1.34 (0.02–7.46)2013 0 0.75 0.00 (0.00–4.88)2012 1 0.28 3.61 (0.05–20.08)2011 0 1.11 0.00 (0.00–3.30)2010 2 0.38 5.21 (0.59–18.81)2009 1 0.09 11.05 (0.14–61.50)
EXCELA HEALTH WESTMORELAND REGIONAL HOSPITAL (11637)2014 0 0.77 0.00 (0.00–4.79)2013 0 0.79 0.00 (0.00–4.66)2012 0 0.85 0.00 (0.00–4.32)2011 1 1.61 0.62 (0.01–3.46)2010 0 1.14 0.00 (0.00–3.23)2009 1 1.40 0.72 (0.01–3.99)
J C BLAIR MEMORIAL HOSPITAL (11724)2014 4 0.79 5.06 (1.36–12.96)2013 2 0.67 2.98 (0.33–10.75)2012 2 0.60 3.35 (0.38–12.11)2011 3 0.32 9.49 (1.91–27.73)2010 . . .2009 1 0.06 15.48 (0.20–86.13)
REGIONAL HOSPITAL OF SCRANTON (12533)2014 0 0.79 0.00 (0.00–4.62)2013 0 0.85 0.00 (0.00–4.29)2012 0 0.75 0.00 (0.00–4.90)2011 0 0.06 0.00 (0.00–61.83)2010 0 0.08 0.00 (0.00–47.28)2009 1 0.89 1.12 (0.01–6.23)
MERCY SUBURBAN HOSPITAL (11952)2014 3 0.83 3.60 (0.72–10.52)2013 5 1.09 4.57 (1.47–10.67)2012 0 0.96 0.00 (0.00–3.82)2011 1 0.59 1.69 (0.02–9.40)2010 2 0.40 5.03 (0.57–18.17)2009 0 0.66 0.00 (0.00–5.53)
Continued on next page . . .
230
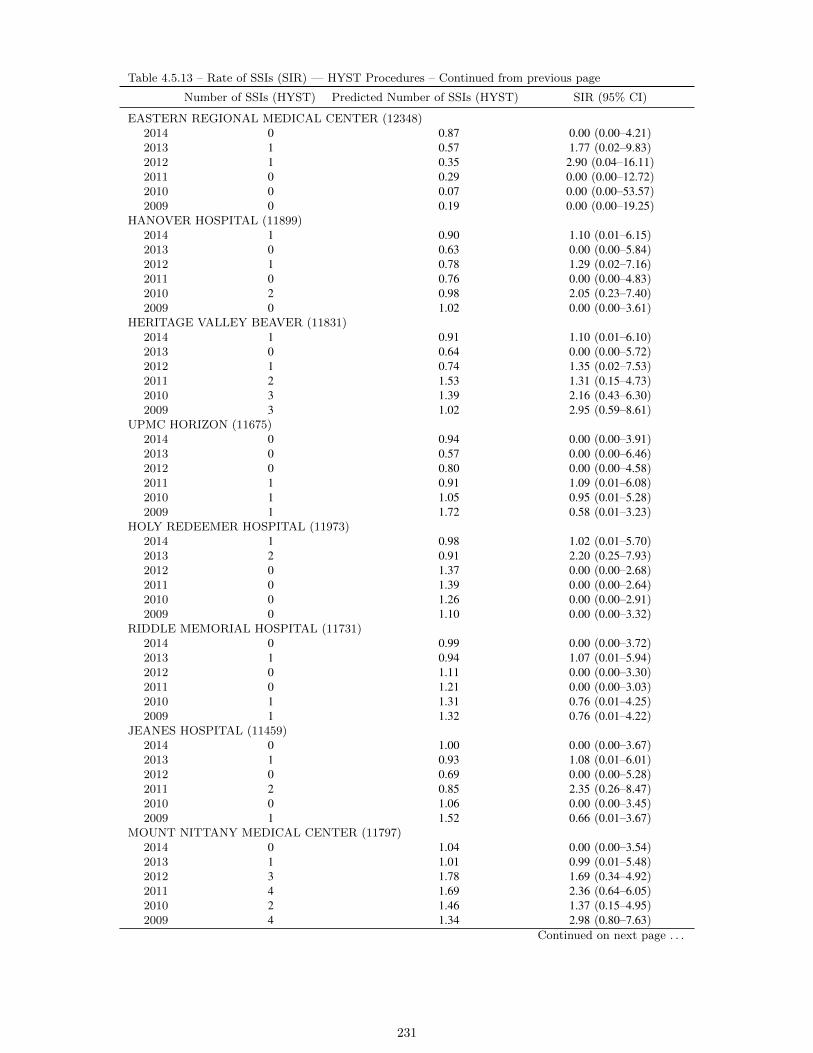
Table 4.5.13 – Rate of SSIs (SIR) — HYST Procedures – Continued from previous page
Number of SSIs (HYST) Predicted Number of SSIs (HYST) SIR (95% CI)
EASTERN REGIONAL MEDICAL CENTER (12348)2014 0 0.87 0.00 (0.00–4.21)2013 1 0.57 1.77 (0.02–9.83)2012 1 0.35 2.90 (0.04–16.11)2011 0 0.29 0.00 (0.00–12.72)2010 0 0.07 0.00 (0.00–53.57)2009 0 0.19 0.00 (0.00–19.25)
HANOVER HOSPITAL (11899)2014 1 0.90 1.10 (0.01–6.15)2013 0 0.63 0.00 (0.00–5.84)2012 1 0.78 1.29 (0.02–7.16)2011 0 0.76 0.00 (0.00–4.83)2010 2 0.98 2.05 (0.23–7.40)2009 0 1.02 0.00 (0.00–3.61)
HERITAGE VALLEY BEAVER (11831)2014 1 0.91 1.10 (0.01–6.10)2013 0 0.64 0.00 (0.00–5.72)2012 1 0.74 1.35 (0.02–7.53)2011 2 1.53 1.31 (0.15–4.73)2010 3 1.39 2.16 (0.43–6.30)2009 3 1.02 2.95 (0.59–8.61)
UPMC HORIZON (11675)2014 0 0.94 0.00 (0.00–3.91)2013 0 0.57 0.00 (0.00–6.46)2012 0 0.80 0.00 (0.00–4.58)2011 1 0.91 1.09 (0.01–6.08)2010 1 1.05 0.95 (0.01–5.28)2009 1 1.72 0.58 (0.01–3.23)
HOLY REDEEMER HOSPITAL (11973)2014 1 0.98 1.02 (0.01–5.70)2013 2 0.91 2.20 (0.25–7.93)2012 0 1.37 0.00 (0.00–2.68)2011 0 1.39 0.00 (0.00–2.64)2010 0 1.26 0.00 (0.00–2.91)2009 0 1.10 0.00 (0.00–3.32)
RIDDLE MEMORIAL HOSPITAL (11731)2014 0 0.99 0.00 (0.00–3.72)2013 1 0.94 1.07 (0.01–5.94)2012 0 1.11 0.00 (0.00–3.30)2011 0 1.21 0.00 (0.00–3.03)2010 1 1.31 0.76 (0.01–4.25)2009 1 1.32 0.76 (0.01–4.22)
JEANES HOSPITAL (11459)2014 0 1.00 0.00 (0.00–3.67)2013 1 0.93 1.08 (0.01–6.01)2012 0 0.69 0.00 (0.00–5.28)2011 2 0.85 2.35 (0.26–8.47)2010 0 1.06 0.00 (0.00–3.45)2009 1 1.52 0.66 (0.01–3.67)
MOUNT NITTANY MEDICAL CENTER (11797)2014 0 1.04 0.00 (0.00–3.54)2013 1 1.01 0.99 (0.01–5.48)2012 3 1.78 1.69 (0.34–4.92)2011 4 1.69 2.36 (0.64–6.05)2010 2 1.46 1.37 (0.15–4.95)2009 4 1.34 2.98 (0.80–7.63)
Continued on next page . . .
231

Table 4.5.13 – Rate of SSIs (SIR) — HYST Procedures – Continued from previous page
Number of SSIs (HYST) Predicted Number of SSIs (HYST) SIR (95% CI)
EXCELA HEALTH LATROBE HOSPITAL (11651)2014 1 1.13 0.88 (0.01–4.91)2013 1 1.29 0.77 (0.01–4.31)2012 2 1.93 1.04 (0.12–3.74)2011 0 0.61 0.00 (0.00–6.01)2010 1 1.34 0.75 (0.01–4.15)2009 0 1.15 0.00 (0.00–3.20)
MEMORIAL HOSPITAL (11633)2014 0 1.13 0.00 (0.00–3.24)2013 3 1.10 2.73 (0.55–7.97)2012 0 0.75 0.00 (0.00–4.91)2011 2 0.78 2.57 (0.29–9.29)2010 0 1.62 0.00 (0.00–2.27)2009 1 1.31 0.76 (0.01–4.24)
BUTLER MEMORIAL HOSPITAL (11736)2014 2 1.15 1.74 (0.20–6.28)2013 3 1.14 2.63 (0.53–7.68)2012 7 1.41 4.96 (1.99–10.21)2011 4 1.40 2.86 (0.77–7.32)2010 3 1.55 1.94 (0.39–5.67)2009 1 1.42 0.70 (0.01–3.92)
CHESTNUT HILL HOSPITAL (12304)2014 1 1.16 0.86 (0.01–4.81)2013 0 1.65 0.00 (0.00–2.22)2012 0 1.76 0.00 (0.00–2.08)2011 0 2.34 0.00 (0.00–1.57)2010 1 2.39 0.42 (0.01–2.33)2009 0 1.13 0.00 (0.00–3.26)
UPMC PRESBYTERIAN SHADYSIDE - SHADYSIDE (10118)2014 0 1.18 0.00 (0.00–3.12)2013 1 1.50 0.67 (0.01–3.70)2012 2 1.98 1.01 (0.11–3.64)2011 1 2.34 0.43 (0.01–2.38)2010 4 1.18 3.40 (0.91–8.70)2009 4 1.87 2.13 (0.57–5.46)
EASTON HOSPITAL (11929)2014 0 1.20 0.00 (0.00–3.06)2013 1 1.32 0.76 (0.01–4.20)2012 0 1.70 0.00 (0.00–2.16)2011 0 1.82 0.00 (0.00–2.01)2010 2 1.87 1.07 (0.12–3.87)2009 3 2.45 1.22 (0.25–3.58)
ST. CLAIR MEMORIAL HOSPITAL (10561)2014 0 1.23 0.00 (0.00–2.98)2013 0 0.97 0.00 (0.00–3.78)2012 2 1.57 1.27 (0.14–4.60)2011 6 2.51 2.39 (0.87–5.20)2010 3 2.37 1.27 (0.25–3.70)2009 1 1.93 0.52 (0.01–2.88)
PENN HIGHLANDS DUBOIS (11606)2014 1 1.35 0.74 (0.01–4.11)2013 1 1.39 0.72 (0.01–4.00)2012 0 0.39 0.00 (0.00–9.31)2011 0 1.27 0.00 (0.00–2.88)2010 2 1.80 1.11 (0.12–4.01)2009 1 0.94 1.07 (0.01–5.94)
Continued on next page . . .
232

Table 4.5.13 – Rate of SSIs (SIR) — HYST Procedures – Continued from previous page
Number of SSIs (HYST) Predicted Number of SSIs (HYST) SIR (95% CI)
ALBERT EINSTEIN MEDICAL CENTER (10585)2014 1 1.46 0.69 (0.01–3.81)2013 1 1.27 0.79 (0.01–4.37)2012 0 1.97 0.00 (0.00–1.86)2011 3 2.01 1.49 (0.30–4.37)2010 1 2.32 0.43 (0.01–2.40)2009 1 2.26 0.44 (0.01–2.47)
ROBERT PACKER HOSPITAL (12422)2014 0 1.50 0.00 (0.00–2.44)2013 1 1.32 0.76 (0.01–4.21)2012 2 2.43 0.82 (0.09–2.97)2011 0 1.62 0.00 (0.00–2.27)2010 0 1.05 0.00 (0.00–3.48)2009 0 0.63 0.00 (0.00–5.87)
POCONO MEDICAL CENTER (11772)2014 0 1.53 0.00 (0.00–2.39)2013 0 0.93 0.00 (0.00–3.94)2012 0 2.34 0.00 (0.00–1.57)2011 1 2.21 0.45 (0.01–2.51)2010 1 1.93 0.52 (0.01–2.88)2009 0 0.88 0.00 (0.00–4.15)
SAINT VINCENT HOSPITAL (11699)2014 0 1.54 0.00 (0.00–2.39)2013 1 0.99 1.01 (0.01–5.64)2012 2 1.14 1.76 (0.20–6.36)2011 3 1.69 1.77 (0.36–5.18)2010 3 3.13 0.96 (0.19–2.80)2009 7 1.70 4.11 (1.65–8.47)
GEISINGER WYOMING VALLEY MEDICAL CENTER (11780)2014 8 1.54 5.19 (2.23–10.22)2013 9 1.34 6.70 (3.06–12.71)2012 4 1.33 3.00 (0.81–7.69)2011 2 1.25 1.60 (0.18–5.77)2010 4 1.14 3.51 (0.94–8.98)2009 0 1.30 0.00 (0.00–2.83)
CARLISLE REGIONAL MEDICAL CENTER (11997)2014 1 1.61 0.62 (0.01–3.46)2013 1 1.56 0.64 (0.01–3.56)2012 1 1.37 0.73 (0.01–4.05)2011 0 0.18 0.00 (0.00–20.80)2010 0 0.42 0.00 (0.00–8.74)2009 3 0.51 5.89 (1.18–17.20)
UNIONTOWN HOSPITAL (10441)2014 1 1.63 0.61 (0.01–3.41)2013 2 1.67 1.20 (0.13–4.34)2012 2 1.71 1.17 (0.13–4.23)2011 3 2.74 1.09 (0.22–3.20)2010 5 2.39 2.10 (0.68–4.89)2009 5 2.64 1.89 (0.61–4.42)
FORBES HOSPITAL (11265)2014 2 1.65 1.21 (0.14–4.37)2013 0 1.01 0.00 (0.00–3.63)2012 0 1.42 0.00 (0.00–2.58)2011 1 1.27 0.79 (0.01–4.38)2010 1 0.85 1.18 (0.02–6.57)2009 0 1.19 0.00 (0.00–3.07)
Continued on next page . . .
233

Table 4.5.13 – Rate of SSIs (SIR) — HYST Procedures – Continued from previous page
Number of SSIs (HYST) Predicted Number of SSIs (HYST) SIR (95% CI)
SACRED HEART HOSPITAL (11684)2014 1 1.68 0.60 (0.01–3.32)2013 2 1.77 1.13 (0.13–4.07)2012 3 3.10 0.97 (0.19–2.82)2011 6 3.02 1.99 (0.73–4.33)2010 3 3.38 0.89 (0.18–2.59)2009 1 3.52 0.28 (0.00–1.58)
ARIA HEALTH (11388)2014 0 1.68 0.00 (0.00–2.18)2013 0 0.87 0.00 (0.00–4.21)2012 0 1.29 0.00 (0.00–2.84)2011 0 0.28 0.00 (0.00–13.12)2010 2 0.49 4.10 (0.46–14.79)2009 2 0.43 4.62 (0.52–16.69)
EINSTEIN MEDICAL CENTER MONTGOMERY (30210)2014 2 1.70 1.17 (0.13–4.24)2013 1 1.32 0.76 (0.01–4.21)2012 . . .2011 . . .2010 . . .2009 . . .
EPHRATA COMMUNITY HOSPITAL (11764)2014 1 1.78 0.56 (0.01–3.12)2013 0 1.80 0.00 (0.00–2.04)2012 0 1.84 0.00 (0.00–1.99)2011 0 1.82 0.00 (0.00–2.01)2010 0 0.71 0.00 (0.00–5.19)2009 2 1.09 1.84 (0.21–6.63)
UPMC ALTOONA (10178)2014 8 1.80 4.45 (1.92–8.78)2013 4 1.19 3.35 (0.90–8.59)2012 6 1.41 4.25 (1.55–9.26)2011 5 2.01 2.49 (0.80–5.80)2010 3 2.56 1.17 (0.24–3.43)2009 4 3.47 1.15 (0.31–2.96)
UPMC HAMOT (11725)2014 2 1.85 1.08 (0.12–3.90)2013 1 2.38 0.42 (0.01–2.33)2012 0 1.00 0.00 (0.00–3.65)2011 1 1.50 0.67 (0.01–3.70)2010 0 0.75 0.00 (0.00–4.91)2009 1 1.04 0.96 (0.01–5.35)
PHOENIXVILLE HOSPITAL COMPANY LLC (11836)2014 1 1.90 0.53 (0.01–2.93)2013 1 1.31 0.76 (0.01–4.25)2012 2 2.37 0.84 (0.09–3.04)2011 3 0.71 4.25 (0.85–12.41)2010 2 0.78 2.56 (0.29–9.26)2009 0 0.50 0.00 (0.00–7.32)
HEART OF LANCASTER REGIONAL MEDICAL CENTER (12571)2014 3 2.04 1.47 (0.30–4.30)2013 4 2.63 1.52 (0.41–3.89)2012 2 2.94 0.68 (0.08–2.46)2011 1 2.03 0.49 (0.01–2.75)2010 2 0.67 2.97 (0.33–10.73)2009 1 0.21 4.85 (0.06–26.99)
Continued on next page . . .
234
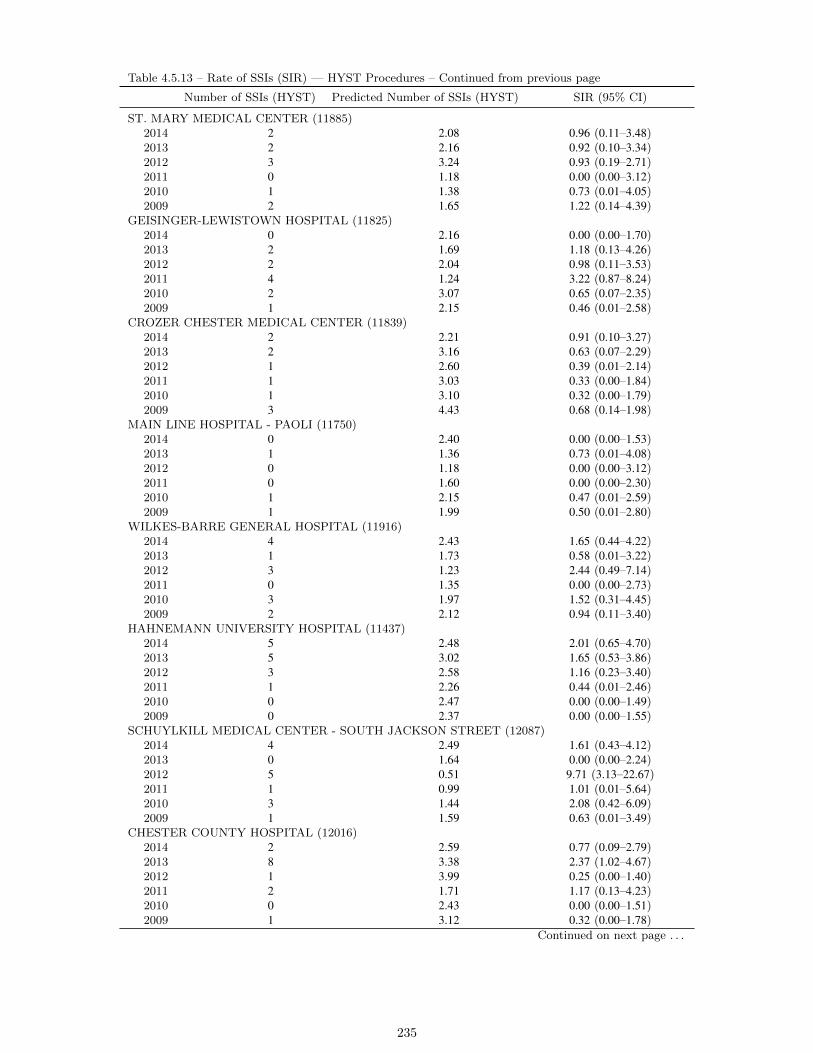
Table 4.5.13 – Rate of SSIs (SIR) — HYST Procedures – Continued from previous page
Number of SSIs (HYST) Predicted Number of SSIs (HYST) SIR (95% CI)
ST. MARY MEDICAL CENTER (11885)2014 2 2.08 0.96 (0.11–3.48)2013 2 2.16 0.92 (0.10–3.34)2012 3 3.24 0.93 (0.19–2.71)2011 0 1.18 0.00 (0.00–3.12)2010 1 1.38 0.73 (0.01–4.05)2009 2 1.65 1.22 (0.14–4.39)
GEISINGER-LEWISTOWN HOSPITAL (11825)2014 0 2.16 0.00 (0.00–1.70)2013 2 1.69 1.18 (0.13–4.26)2012 2 2.04 0.98 (0.11–3.53)2011 4 1.24 3.22 (0.87–8.24)2010 2 3.07 0.65 (0.07–2.35)2009 1 2.15 0.46 (0.01–2.58)
CROZER CHESTER MEDICAL CENTER (11839)2014 2 2.21 0.91 (0.10–3.27)2013 2 3.16 0.63 (0.07–2.29)2012 1 2.60 0.39 (0.01–2.14)2011 1 3.03 0.33 (0.00–1.84)2010 1 3.10 0.32 (0.00–1.79)2009 3 4.43 0.68 (0.14–1.98)
MAIN LINE HOSPITAL - PAOLI (11750)2014 0 2.40 0.00 (0.00–1.53)2013 1 1.36 0.73 (0.01–4.08)2012 0 1.18 0.00 (0.00–3.12)2011 0 1.60 0.00 (0.00–2.30)2010 1 2.15 0.47 (0.01–2.59)2009 1 1.99 0.50 (0.01–2.80)
WILKES-BARRE GENERAL HOSPITAL (11916)2014 4 2.43 1.65 (0.44–4.22)2013 1 1.73 0.58 (0.01–3.22)2012 3 1.23 2.44 (0.49–7.14)2011 0 1.35 0.00 (0.00–2.73)2010 3 1.97 1.52 (0.31–4.45)2009 2 2.12 0.94 (0.11–3.40)
HAHNEMANN UNIVERSITY HOSPITAL (11437)2014 5 2.48 2.01 (0.65–4.70)2013 5 3.02 1.65 (0.53–3.86)2012 3 2.58 1.16 (0.23–3.40)2011 1 2.26 0.44 (0.01–2.46)2010 0 2.47 0.00 (0.00–1.49)2009 0 2.37 0.00 (0.00–1.55)
SCHUYLKILL MEDICAL CENTER - SOUTH JACKSON STREET (12087)2014 4 2.49 1.61 (0.43–4.12)2013 0 1.64 0.00 (0.00–2.24)2012 5 0.51 9.71 (3.13–22.67)2011 1 0.99 1.01 (0.01–5.64)2010 3 1.44 2.08 (0.42–6.09)2009 1 1.59 0.63 (0.01–3.49)
CHESTER COUNTY HOSPITAL (12016)2014 2 2.59 0.77 (0.09–2.79)2013 8 3.38 2.37 (1.02–4.67)2012 1 3.99 0.25 (0.00–1.40)2011 2 1.71 1.17 (0.13–4.23)2010 0 2.43 0.00 (0.00–1.51)2009 1 3.12 0.32 (0.00–1.78)
Continued on next page . . .
235

Table 4.5.13 – Rate of SSIs (SIR) — HYST Procedures – Continued from previous page
Number of SSIs (HYST) Predicted Number of SSIs (HYST) SIR (95% CI)
CONEMAUGH MEMORIAL MEDICAL CENTER (10280)2014 1 2.63 0.38 (0.00–2.11)2013 1 2.42 0.41 (0.01–2.30)2012 1 0.98 1.02 (0.01–5.68)2011 0 0.60 0.00 (0.00–6.15)2010 1 1.01 0.99 (0.01–5.49)2009 0 0.88 0.00 (0.00–4.17)
ST. LUKES HOSPITAL BETHLEHEM (11718)2014 4 2.65 1.51 (0.41–3.86)2013 6 2.11 2.84 (1.04–6.18)2012 4 2.19 1.83 (0.49–4.69)2011 0 2.08 0.00 (0.00–1.76)2010 1 1.78 0.56 (0.01–3.12)2009 1 3.48 0.29 (0.00–1.60)
WASHINGTON HOSPITAL, THE (11460)2014 1 2.72 0.37 (0.00–2.04)2013 1 2.04 0.49 (0.01–2.73)2012 2 1.52 1.31 (0.15–4.74)2011 0 1.62 0.00 (0.00–2.26)2010 3 1.54 1.95 (0.39–5.71)2009 1 1.67 0.60 (0.01–3.33)
MOSES TAYLOR HOSPITAL (11528)2014 2 2.77 0.72 (0.08–2.61)2013 0 1.59 0.00 (0.00–2.31)2012 0 1.85 0.00 (0.00–1.98)2011 2 2.94 0.68 (0.08–2.45)2010 2 3.52 0.57 (0.06–2.05)2009 3 3.44 0.87 (0.18–2.55)
GEISINGER MEDICAL CENTER (11775)2014 9 2.84 3.17 (1.45–6.02)2013 8 3.06 2.61 (1.12–5.15)2012 8 4.37 1.83 (0.79–3.61)2011 5 4.29 1.16 (0.38–2.72)2010 8 4.45 1.80 (0.77–3.54)2009 7 4.53 1.54 (0.62–3.18)
LEHIGH VALLEY HOSPITAL - MUHLENBERG (11898)2014 1 3.24 0.31 (0.00–1.72)2013 0 2.88 0.00 (0.00–1.27)2012 0 0.91 0.00 (0.00–4.03)2011 0 0.66 0.00 (0.00–5.57)2010 1 0.69 1.45 (0.02–8.09)2009 0 0.63 0.00 (0.00–5.82)
TEMPLE UNIVERSITY HOSPITAL (12382)2014 3 3.43 0.87 (0.18–2.56)2013 4 4.55 0.88 (0.24–2.25)2012 2 6.04 0.33 (0.04–1.19)2011 3 6.47 0.46 (0.09–1.35)2010 3 5.49 0.55 (0.11–1.60)2009 5 4.56 1.10 (0.35–2.56)
UPMC MERCY (10384)2014 4 3.52 1.14 (0.31–2.91)2013 7 4.29 1.63 (0.65–3.36)2012 15 5.30 2.83 (1.58–4.67)2011 8 4.25 1.88 (0.81–3.71)2010 10 4.88 2.05 (0.98–3.77)2009 7 4.29 1.63 (0.65–3.36)
Continued on next page . . .
236
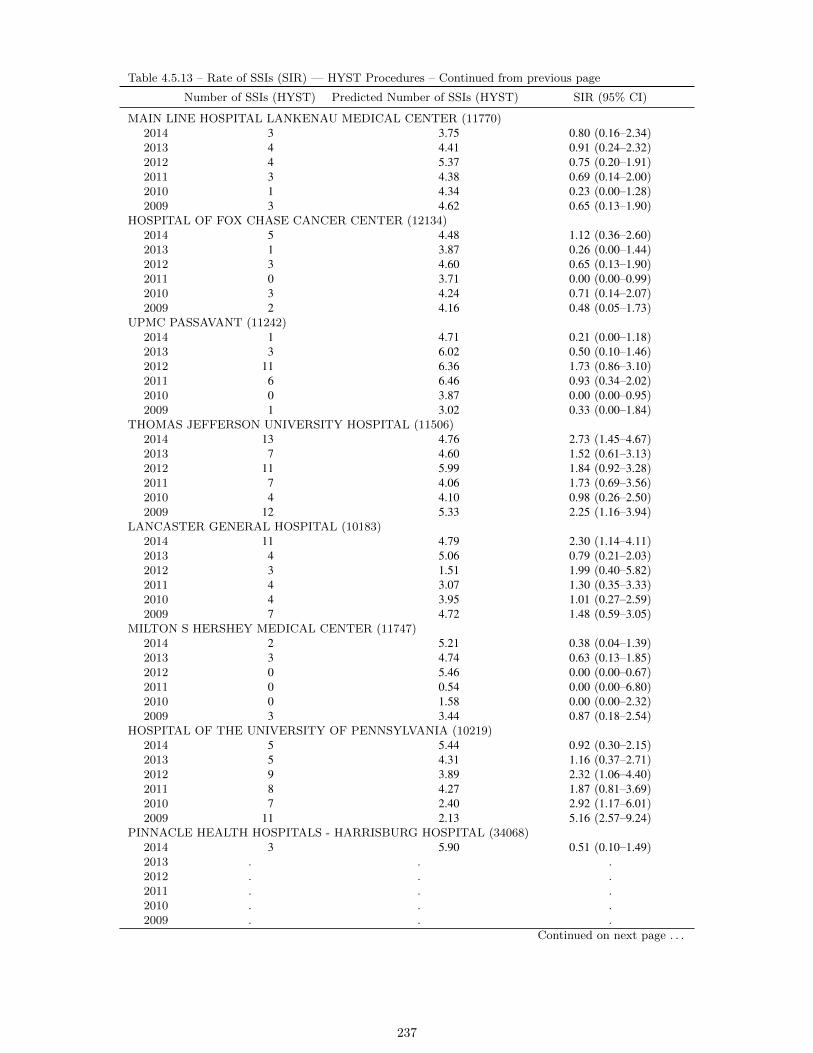
Table 4.5.13 – Rate of SSIs (SIR) — HYST Procedures – Continued from previous page
Number of SSIs (HYST) Predicted Number of SSIs (HYST) SIR (95% CI)
MAIN LINE HOSPITAL LANKENAU MEDICAL CENTER (11770)2014 3 3.75 0.80 (0.16–2.34)2013 4 4.41 0.91 (0.24–2.32)2012 4 5.37 0.75 (0.20–1.91)2011 3 4.38 0.69 (0.14–2.00)2010 1 4.34 0.23 (0.00–1.28)2009 3 4.62 0.65 (0.13–1.90)
HOSPITAL OF FOX CHASE CANCER CENTER (12134)2014 5 4.48 1.12 (0.36–2.60)2013 1 3.87 0.26 (0.00–1.44)2012 3 4.60 0.65 (0.13–1.90)2011 0 3.71 0.00 (0.00–0.99)2010 3 4.24 0.71 (0.14–2.07)2009 2 4.16 0.48 (0.05–1.73)
UPMC PASSAVANT (11242)2014 1 4.71 0.21 (0.00–1.18)2013 3 6.02 0.50 (0.10–1.46)2012 11 6.36 1.73 (0.86–3.10)2011 6 6.46 0.93 (0.34–2.02)2010 0 3.87 0.00 (0.00–0.95)2009 1 3.02 0.33 (0.00–1.84)
THOMAS JEFFERSON UNIVERSITY HOSPITAL (11506)2014 13 4.76 2.73 (1.45–4.67)2013 7 4.60 1.52 (0.61–3.13)2012 11 5.99 1.84 (0.92–3.28)2011 7 4.06 1.73 (0.69–3.56)2010 4 4.10 0.98 (0.26–2.50)2009 12 5.33 2.25 (1.16–3.94)
LANCASTER GENERAL HOSPITAL (10183)2014 11 4.79 2.30 (1.14–4.11)2013 4 5.06 0.79 (0.21–2.03)2012 3 1.51 1.99 (0.40–5.82)2011 4 3.07 1.30 (0.35–3.33)2010 4 3.95 1.01 (0.27–2.59)2009 7 4.72 1.48 (0.59–3.05)
MILTON S HERSHEY MEDICAL CENTER (11747)2014 2 5.21 0.38 (0.04–1.39)2013 3 4.74 0.63 (0.13–1.85)2012 0 5.46 0.00 (0.00–0.67)2011 0 0.54 0.00 (0.00–6.80)2010 0 1.58 0.00 (0.00–2.32)2009 3 3.44 0.87 (0.18–2.54)
HOSPITAL OF THE UNIVERSITY OF PENNSYLVANIA (10219)2014 5 5.44 0.92 (0.30–2.15)2013 5 4.31 1.16 (0.37–2.71)2012 9 3.89 2.32 (1.06–4.40)2011 8 4.27 1.87 (0.81–3.69)2010 7 2.40 2.92 (1.17–6.01)2009 11 2.13 5.16 (2.57–9.24)
PINNACLE HEALTH HOSPITALS - HARRISBURG HOSPITAL (34068)2014 3 5.90 0.51 (0.10–1.49)2013 . . .2012 . . .2011 . . .2010 . . .2009 . . .
Continued on next page . . .
237
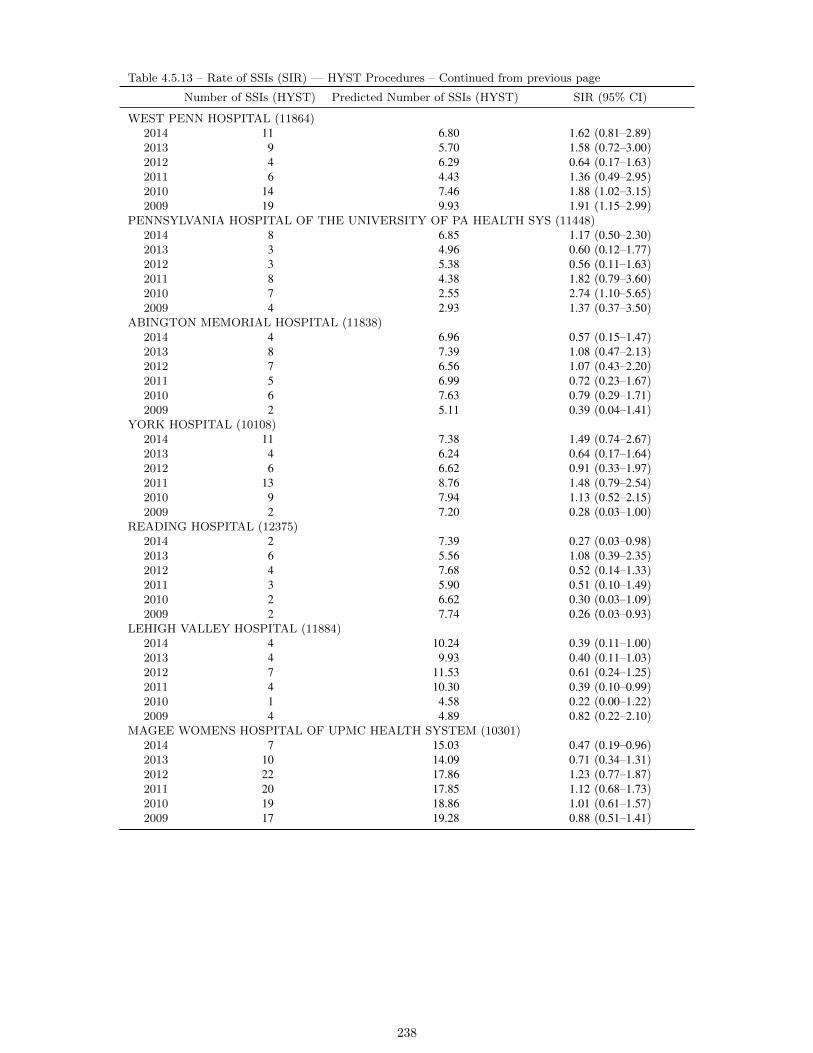
Table 4.5.13 – Rate of SSIs (SIR) — HYST Procedures – Continued from previous page
Number of SSIs (HYST) Predicted Number of SSIs (HYST) SIR (95% CI)
WEST PENN HOSPITAL (11864)2014 11 6.80 1.62 (0.81–2.89)2013 9 5.70 1.58 (0.72–3.00)2012 4 6.29 0.64 (0.17–1.63)2011 6 4.43 1.36 (0.49–2.95)2010 14 7.46 1.88 (1.02–3.15)2009 19 9.93 1.91 (1.15–2.99)
PENNSYLVANIA HOSPITAL OF THE UNIVERSITY OF PA HEALTH SYS (11448)2014 8 6.85 1.17 (0.50–2.30)2013 3 4.96 0.60 (0.12–1.77)2012 3 5.38 0.56 (0.11–1.63)2011 8 4.38 1.82 (0.79–3.60)2010 7 2.55 2.74 (1.10–5.65)2009 4 2.93 1.37 (0.37–3.50)
ABINGTON MEMORIAL HOSPITAL (11838)2014 4 6.96 0.57 (0.15–1.47)2013 8 7.39 1.08 (0.47–2.13)2012 7 6.56 1.07 (0.43–2.20)2011 5 6.99 0.72 (0.23–1.67)2010 6 7.63 0.79 (0.29–1.71)2009 2 5.11 0.39 (0.04–1.41)
YORK HOSPITAL (10108)2014 11 7.38 1.49 (0.74–2.67)2013 4 6.24 0.64 (0.17–1.64)2012 6 6.62 0.91 (0.33–1.97)2011 13 8.76 1.48 (0.79–2.54)2010 9 7.94 1.13 (0.52–2.15)2009 2 7.20 0.28 (0.03–1.00)
READING HOSPITAL (12375)2014 2 7.39 0.27 (0.03–0.98)2013 6 5.56 1.08 (0.39–2.35)2012 4 7.68 0.52 (0.14–1.33)2011 3 5.90 0.51 (0.10–1.49)2010 2 6.62 0.30 (0.03–1.09)2009 2 7.74 0.26 (0.03–0.93)
LEHIGH VALLEY HOSPITAL (11884)2014 4 10.24 0.39 (0.11–1.00)2013 4 9.93 0.40 (0.11–1.03)2012 7 11.53 0.61 (0.24–1.25)2011 4 10.30 0.39 (0.10–0.99)2010 1 4.58 0.22 (0.00–1.22)2009 4 4.89 0.82 (0.22–2.10)
MAGEE WOMENS HOSPITAL OF UPMC HEALTH SYSTEM (10301)2014 7 15.03 0.47 (0.19–0.96)2013 10 14.09 0.71 (0.34–1.31)2012 22 17.86 1.23 (0.77–1.87)2011 20 17.85 1.12 (0.68–1.73)2010 19 18.86 1.01 (0.61–1.57)2009 17 19.28 0.88 (0.51–1.41)
238

Table 4.5.14: Rate (SIR) of Surgical Site Infections (SSIs) Associated with Colon Surgery by Hospital — Pennsylvania, 2009–2014
Number of SSIs (COLO) Predicted Number of SSIs (COLO) SIR (95% CI)
TITUSVILLE AREA HOSPITAL (11738)2014 . . .2013 2 0.69 2.88 (0.32–10.40)2012 2 0.55 3.67 (0.41–13.24)
MUNCY VALLEY HOSPITAL (11748)2014 . . .2013 1 0.31 3.21 (0.04–17.88)2012 0 0.35 0.00 (0.00–10.59)
SOUTHWEST REGIONAL MEDICAL CENTER (11942)2014 . . .2013 0 1.70 0.00 (0.00–2.16)2012 0 2.10 0.00 (0.00–1.75)
TROY COMMUNITY HOSPITAL (12018)2014 . . .2013 0 0.06 0.00 (0.00–60.22)2012 0 0.05 0.00 (0.00–67.52)
PHYSICIANS CARE SURGICAL HOSPITAL (19630)2014 . . .2013 0 0.37 0.00 (0.00–9.85)2012 0 0.39 0.00 (0.00–9.37)
CORRY MEMORIAL HOSPITAL (12283)2014 0 0.03 0.00 (0.00–114.40)2013 0 0.04 0.00 (0.00–82.95)2012 0 0.38 0.00 (0.00–9.57)
LOCK HAVEN HOSPITAL (12097)2014 0 0.12 0.00 (0.00–31.63)2013 0 0.11 0.00 (0.00–34.89)2012 0 0.27 0.00 (0.00–13.39)
CONEMAUGH MINERS MEDICAL CENTER (12295)2014 0 0.12 0.00 (0.00–31.63)2013 0 0.10 0.00 (0.00–36.36)2012 0 0.32 0.00 (0.00–11.35)
TYRONE HOSPITAL (12717)2014 0 0.13 0.00 (0.00–28.60)2013 0 0.34 0.00 (0.00–10.89)2012 0 0.08 0.00 (0.00–44.60)
BARNES-KASSON COUNTY HOSPITAL (12404)2014 0 0.13 0.00 (0.00–28.32)2013 . . .2012 0 0.05 0.00 (0.00–67.52)
GUTHRIE TOWANDA MEMORIAL HOSPITAL (12549)2014 0 0.13 0.00 (0.00–28.32)2013 1 0.28 3.55 (0.05–19.73)2012 1 0.15 6.77 (0.09–37.68)
BERWICK HOSPITAL CENTER (11442)2014 0 0.16 0.00 (0.00–22.70)2013 0 0.06 0.00 (0.00–60.22)2012 0 0.28 0.00 (0.00–12.90)
KANE COMMUNITY HOSPITAL (12111)2014 1 0.16 6.07 (0.08–33.78)2013 0 0.27 0.00 (0.00–13.62)2012 0 0.38 0.00 (0.00–9.63)
Continued on next page . . .
239

Table 4.5.14 – Rate of SSIs (SIR) — COLO Procedures – Continued from previous page
Number of SSIs (COLO) Predicted Number of SSIs (COLO) SIR (95% CI)
PENN HIGHLANDS BROOKVILLE (12418)2014 0 0.17 0.00 (0.00–21.56)2013 1 0.30 3.35 (0.04–18.63)2012 0 0.40 0.00 (0.00–9.08)
SURGICAL INSTITUTE OF READING (12535)2014 0 0.19 0.00 (0.00–19.07)2013 0 0.40 0.00 (0.00–9.18)2012 2 0.34 5.84 (0.66–21.09)
CROZER CHESTER MEDICAL CENTER - SPRINGFIELD (11851)2014 0 0.21 0.00 (0.00–17.19)2013 0 0.73 0.00 (0.00–5.06)2012 0 0.53 0.00 (0.00–6.98)
GROVE CITY MEDICAL CENTER (11722)2014 0 0.34 0.00 (0.00–10.79)2013 0 0.27 0.00 (0.00–13.41)2012 1 0.55 1.81 (0.02–10.06)
CHARLES COLE MEMORIAL HOSPITAL (11956)2014 1 0.40 2.53 (0.03–14.07)2013 1 1.19 0.84 (0.01–4.66)2012 3 0.66 4.55 (0.91–13.28)
SACRED HEART HOSPITAL (11684)2014 0 0.41 0.00 (0.00–9.05)2013 2 1.40 1.43 (0.16–5.15)2012 3 1.59 1.89 (0.38–5.52)
ST. JOSEPHS HOSPITAL (12438)2014 1 0.42 2.41 (0.03–13.40)2013 0 0.49 0.00 (0.00–7.45)2012 0 0.67 0.00 (0.00–5.45)
ROXBOROUGH MEMORIAL HOSPITAL (11978)2014 0 0.46 0.00 (0.00–7.98)2013 0 0.70 0.00 (0.00–5.21)2012 0 0.50 0.00 (0.00–7.35)
TYLER MEMORIAL HOSPITAL (11829)2014 0 0.50 0.00 (0.00–7.40)2013 0 0.47 0.00 (0.00–7.77)2012 0 0.39 0.00 (0.00–9.38)
UPMC BEDFORD (11680)2014 0 0.50 0.00 (0.00–7.27)2013 1 0.46 2.17 (0.03–12.08)2012 1 0.47 2.12 (0.03–11.81)
MILLCREEK COMMUNITY HOSPITAL (12253)2014 0 0.52 0.00 (0.00–7.08)2013 0 0.38 0.00 (0.00–9.58)2012 0 0.23 0.00 (0.00–15.95)
GNADEN HUETTEN MEMORIAL HOSPITAL (12241)2014 3 0.56 5.39 (1.08–15.75)2013 2 0.83 2.40 (0.27–8.68)2012 3 1.33 2.25 (0.45–6.58)
SUNBURY COMMUNITY HOSP (12105)2014 0 0.57 0.00 (0.00–6.44)2013 1 0.82 1.22 (0.02–6.80)2012 2 0.88 2.27 (0.26–8.20)
JERSEY SHORE HOSPITAL (11689)2014 1 0.59 1.70 (0.02–9.48)2013 1 0.79 1.27 (0.02–7.07)2012 1 0.70 1.43 (0.02–7.98)
Continued on next page . . .
240

Table 4.5.14 – Rate of SSIs (SIR) — COLO Procedures – Continued from previous page
Number of SSIs (COLO) Predicted Number of SSIs (COLO) SIR (95% CI)
HEART OF LANCASTER REGIONAL MEDICAL CENTER (12571)2014 2 0.61 3.31 (0.37–11.93)2013 0 0.72 0.00 (0.00–5.07)2012 3 1.02 2.95 (0.59–8.62)
J C BLAIR MEMORIAL HOSPITAL (11724)2014 4 0.61 6.53 (1.76–16.72)2013 1 0.37 2.70 (0.04–15.04)2012 2 0.33 6.11 (0.69–22.05)
PUNXSUTAWNEY AREA HOSPITAL (11830)2014 0 0.64 0.00 (0.00–5.77)2013 0 0.77 0.00 (0.00–4.79)2012 4 1.02 3.92 (1.05–10.03)
WAYNESBORO HOSPITAL (11642)2014 1 0.68 1.46 (0.02–8.14)2013 0 0.46 0.00 (0.00–8.00)2012 2 0.92 2.17 (0.24–7.85)
ST. LUKES MINERS MEMORIAL HOSPITAL (11784)2014 1 0.70 1.43 (0.02–7.97)2013 0 0.69 0.00 (0.00–5.35)2012 1 0.73 1.37 (0.02–7.61)
SOLDIERS AND SAILORS MEMORIAL HOSPITAL (11688)2014 0 0.72 0.00 (0.00–5.10)2013 2 1.38 1.45 (0.16–5.23)2012 4 1.10 3.64 (0.98–9.33)
PENN HIGHLANDS ELK (11859)2014 2 0.73 2.73 (0.31–9.87)2013 0 0.74 0.00 (0.00–4.93)2012 1 0.65 1.55 (0.02–8.61)
WILLIAMSPORT REGIONAL MEDICAL CENTER (11732)2014 2 0.77 2.60 (0.29–9.37)2013 3 2.30 1.31 (0.26–3.82)2012 5 2.02 2.48 (0.80–5.78)
ELLWOOD CITY HOSPITAL (11779)2014 1 0.86 1.16 (0.02–6.47)2013 0 0.31 0.00 (0.00–11.95)2012 0 0.82 0.00 (0.00–4.47)
GEISINGER-BLOOMSBURG HOSPITAL (12008)2014 2 0.93 2.15 (0.24–7.75)2013 2 1.55 1.29 (0.14–4.66)2012 1 1.03 0.97 (0.01–5.42)
BRADFORD REGIONAL MEDICAL CENTER (12361)2014 0 0.93 0.00 (0.00–3.93)2013 2 0.73 2.75 (0.31–9.92)2012 1 1.04 0.97 (0.01–5.37)
LOWER BUCKS HOSPITAL (12390)2014 0 1.08 0.00 (0.00–3.41)2013 0 1.10 0.00 (0.00–3.32)2012 0 1.01 0.00 (0.00–3.64)
ST. LUKES QUAKERTOWN HOSPITAL (11711)2014 1 1.08 0.93 (0.01–5.16)2013 1 1.19 0.84 (0.01–4.66)2012 1 1.12 0.89 (0.01–4.98)
MEMORIAL HOSPITAL (11633)2014 0 1.26 0.00 (0.00–2.91)2013 6 2.07 2.90 (1.06–6.32)2012 5 1.78 2.81 (0.91–6.55)
Continued on next page . . .
241
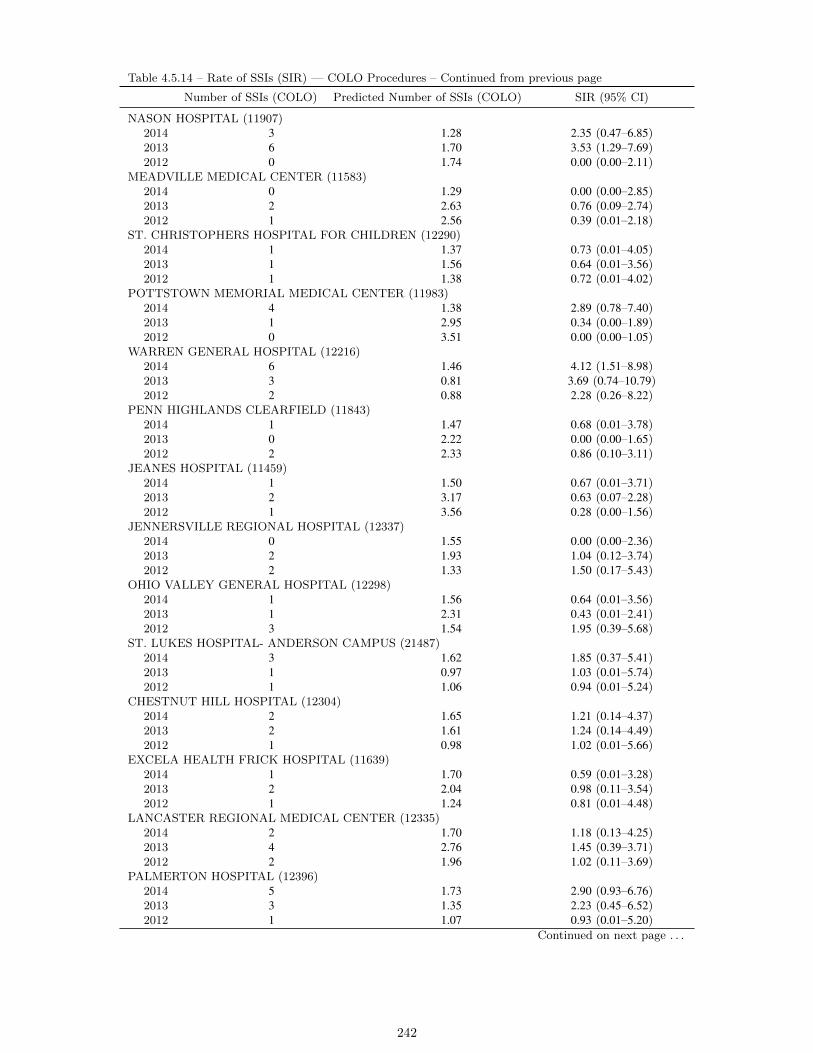
Table 4.5.14 – Rate of SSIs (SIR) — COLO Procedures – Continued from previous page
Number of SSIs (COLO) Predicted Number of SSIs (COLO) SIR (95% CI)
NASON HOSPITAL (11907)2014 3 1.28 2.35 (0.47–6.85)2013 6 1.70 3.53 (1.29–7.69)2012 0 1.74 0.00 (0.00–2.11)
MEADVILLE MEDICAL CENTER (11583)2014 0 1.29 0.00 (0.00–2.85)2013 2 2.63 0.76 (0.09–2.74)2012 1 2.56 0.39 (0.01–2.18)
ST. CHRISTOPHERS HOSPITAL FOR CHILDREN (12290)2014 1 1.37 0.73 (0.01–4.05)2013 1 1.56 0.64 (0.01–3.56)2012 1 1.38 0.72 (0.01–4.02)
POTTSTOWN MEMORIAL MEDICAL CENTER (11983)2014 4 1.38 2.89 (0.78–7.40)2013 1 2.95 0.34 (0.00–1.89)2012 0 3.51 0.00 (0.00–1.05)
WARREN GENERAL HOSPITAL (12216)2014 6 1.46 4.12 (1.51–8.98)2013 3 0.81 3.69 (0.74–10.79)2012 2 0.88 2.28 (0.26–8.22)
PENN HIGHLANDS CLEARFIELD (11843)2014 1 1.47 0.68 (0.01–3.78)2013 0 2.22 0.00 (0.00–1.65)2012 2 2.33 0.86 (0.10–3.11)
JEANES HOSPITAL (11459)2014 1 1.50 0.67 (0.01–3.71)2013 2 3.17 0.63 (0.07–2.28)2012 1 3.56 0.28 (0.00–1.56)
JENNERSVILLE REGIONAL HOSPITAL (12337)2014 0 1.55 0.00 (0.00–2.36)2013 2 1.93 1.04 (0.12–3.74)2012 2 1.33 1.50 (0.17–5.43)
OHIO VALLEY GENERAL HOSPITAL (12298)2014 1 1.56 0.64 (0.01–3.56)2013 1 2.31 0.43 (0.01–2.41)2012 3 1.54 1.95 (0.39–5.68)
ST. LUKES HOSPITAL- ANDERSON CAMPUS (21487)2014 3 1.62 1.85 (0.37–5.41)2013 1 0.97 1.03 (0.01–5.74)2012 1 1.06 0.94 (0.01–5.24)
CHESTNUT HILL HOSPITAL (12304)2014 2 1.65 1.21 (0.14–4.37)2013 2 1.61 1.24 (0.14–4.49)2012 1 0.98 1.02 (0.01–5.66)
EXCELA HEALTH FRICK HOSPITAL (11639)2014 1 1.70 0.59 (0.01–3.28)2013 2 2.04 0.98 (0.11–3.54)2012 1 1.24 0.81 (0.01–4.48)
LANCASTER REGIONAL MEDICAL CENTER (12335)2014 2 1.70 1.18 (0.13–4.25)2013 4 2.76 1.45 (0.39–3.71)2012 2 1.96 1.02 (0.11–3.69)
PALMERTON HOSPITAL (12396)2014 5 1.73 2.90 (0.93–6.76)2013 3 1.35 2.23 (0.45–6.52)2012 1 1.07 0.93 (0.01–5.20)
Continued on next page . . .
242

Table 4.5.14 – Rate of SSIs (SIR) — COLO Procedures – Continued from previous page
Number of SSIs (COLO) Predicted Number of SSIs (COLO) SIR (95% CI)
UPMC NORTHWEST (11837)2014 3 1.75 1.72 (0.35–5.02)2013 1 1.96 0.51 (0.01–2.85)2012 1 1.73 0.58 (0.01–3.22)
CLARION HOSPITAL (11654)2014 0 1.87 0.00 (0.00–1.96)2013 1 1.23 0.81 (0.01–4.51)2012 0 0.64 0.00 (0.00–5.70)
EINSTEIN AT ELKINS PARK (12500)2014 3 2.09 1.43 (0.29–4.19)2013 1 2.14 0.47 (0.01–2.60)2012 2 1.25 1.61 (0.18–5.80)
CROZER CHESTER MEDICAL CENTER (11932)2014 3 2.18 1.37 (0.28–4.02)2013 1 4.22 0.24 (0.00–1.32)2012 3 2.31 1.30 (0.26–3.80)
HIGHLANDS HOSPITAL (11902)2014 4 2.20 1.82 (0.49–4.66)2013 0 0.69 0.00 (0.00–5.34)2012 3 0.93 3.22 (0.65–9.41)
WAYNE MEMORIAL HOSPITAL (12004)2014 4 2.21 1.81 (0.49–4.64)2013 5 2.62 1.91 (0.61–4.45)2012 6 2.40 2.50 (0.91–5.43)
HANOVER HOSPITAL (11899)2014 2 2.24 0.89 (0.10–3.22)2013 0 2.46 0.00 (0.00–1.49)2012 6 2.22 2.70 (0.99–5.88)
ARMSTRONG COUNTY MEMORIAL HOSPITAL (12057)2014 4 2.35 1.70 (0.46–4.36)2013 1 2.44 0.41 (0.01–2.28)2012 2 2.38 0.84 (0.09–3.04)
MERCY PHILADELPHIA HOSPITAL (11946)2014 0 2.35 0.00 (0.00–1.56)2013 4 2.91 1.37 (0.37–3.52)2012 2 2.82 0.71 (0.08–2.56)
EPHRATA COMMUNITY HOSPITAL (11764)2014 3 2.38 1.26 (0.25–3.68)2013 7 4.03 1.74 (0.70–3.58)2012 4 3.93 1.02 (0.27–2.61)
WINDBER HOSPITAL (12031)2014 1 2.40 0.42 (0.01–2.32)2013 1 2.60 0.38 (0.01–2.14)2012 1 2.36 0.42 (0.01–2.36)
EVANGELICAL COMMUNITY HOSPITAL (11701)2014 3 2.45 1.22 (0.25–3.58)2013 12 3.89 3.09 (1.59–5.39)2012 4 2.61 1.53 (0.41–3.92)
LANSDALE HOSPITAL (12032)2014 2 2.66 0.75 (0.08–2.72)2013 0 2.30 0.00 (0.00–1.59)2012 0 2.90 0.00 (0.00–1.27)
ST. JOSEPH MEDICAL CTR (11961)2014 1 2.66 0.38 (0.00–2.09)2013 4 3.81 1.05 (0.28–2.69)2012 5 3.60 1.39 (0.45–3.24)
Continued on next page . . .
243
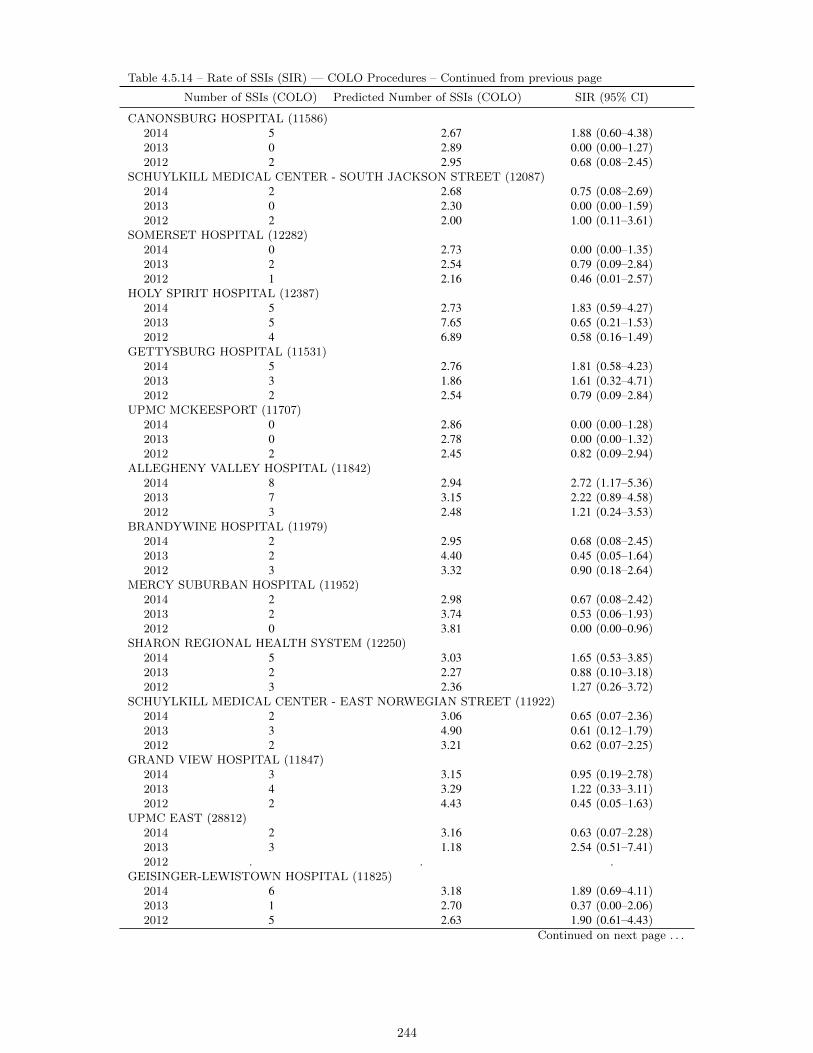
Table 4.5.14 – Rate of SSIs (SIR) — COLO Procedures – Continued from previous page
Number of SSIs (COLO) Predicted Number of SSIs (COLO) SIR (95% CI)
CANONSBURG HOSPITAL (11586)2014 5 2.67 1.88 (0.60–4.38)2013 0 2.89 0.00 (0.00–1.27)2012 2 2.95 0.68 (0.08–2.45)
SCHUYLKILL MEDICAL CENTER - SOUTH JACKSON STREET (12087)2014 2 2.68 0.75 (0.08–2.69)2013 0 2.30 0.00 (0.00–1.59)2012 2 2.00 1.00 (0.11–3.61)
SOMERSET HOSPITAL (12282)2014 0 2.73 0.00 (0.00–1.35)2013 2 2.54 0.79 (0.09–2.84)2012 1 2.16 0.46 (0.01–2.57)
HOLY SPIRIT HOSPITAL (12387)2014 5 2.73 1.83 (0.59–4.27)2013 5 7.65 0.65 (0.21–1.53)2012 4 6.89 0.58 (0.16–1.49)
GETTYSBURG HOSPITAL (11531)2014 5 2.76 1.81 (0.58–4.23)2013 3 1.86 1.61 (0.32–4.71)2012 2 2.54 0.79 (0.09–2.84)
UPMC MCKEESPORT (11707)2014 0 2.86 0.00 (0.00–1.28)2013 0 2.78 0.00 (0.00–1.32)2012 2 2.45 0.82 (0.09–2.94)
ALLEGHENY VALLEY HOSPITAL (11842)2014 8 2.94 2.72 (1.17–5.36)2013 7 3.15 2.22 (0.89–4.58)2012 3 2.48 1.21 (0.24–3.53)
BRANDYWINE HOSPITAL (11979)2014 2 2.95 0.68 (0.08–2.45)2013 2 4.40 0.45 (0.05–1.64)2012 3 3.32 0.90 (0.18–2.64)
MERCY SUBURBAN HOSPITAL (11952)2014 2 2.98 0.67 (0.08–2.42)2013 2 3.74 0.53 (0.06–1.93)2012 0 3.81 0.00 (0.00–0.96)
SHARON REGIONAL HEALTH SYSTEM (12250)2014 5 3.03 1.65 (0.53–3.85)2013 2 2.27 0.88 (0.10–3.18)2012 3 2.36 1.27 (0.26–3.72)
SCHUYLKILL MEDICAL CENTER - EAST NORWEGIAN STREET (11922)2014 2 3.06 0.65 (0.07–2.36)2013 3 4.90 0.61 (0.12–1.79)2012 2 3.21 0.62 (0.07–2.25)
GRAND VIEW HOSPITAL (11847)2014 3 3.15 0.95 (0.19–2.78)2013 4 3.29 1.22 (0.33–3.11)2012 2 4.43 0.45 (0.05–1.63)
UPMC EAST (28812)2014 2 3.16 0.63 (0.07–2.28)2013 3 1.18 2.54 (0.51–7.41)2012 . . .
GEISINGER-LEWISTOWN HOSPITAL (11825)2014 6 3.18 1.89 (0.69–4.11)2013 1 2.70 0.37 (0.00–2.06)2012 5 2.63 1.90 (0.61–4.43)
Continued on next page . . .
244

Table 4.5.14 – Rate of SSIs (SIR) — COLO Procedures – Continued from previous page
Number of SSIs (COLO) Predicted Number of SSIs (COLO) SIR (95% CI)
THOMAS JEFFERSON UNIVERSITY HOSPITAL - METHODIST (12017)2014 1 3.28 0.30 (0.00–1.70)2013 1 2.23 0.45 (0.01–2.50)2012 1 1.29 0.78 (0.01–4.32)
UPMC HORIZON (11675)2014 0 3.29 0.00 (0.00–1.12)2013 1 3.35 0.30 (0.00–1.66)2012 2 3.09 0.65 (0.07–2.34)
MERCY FITZGERALD HOSPITAL (11683)2014 4 3.35 1.19 (0.32–3.06)2013 6 3.98 1.51 (0.55–3.28)2012 2 3.59 0.56 (0.06–2.01)
JAMESON MEMORIAL HOSPITAL (11954)2014 3 3.47 0.87 (0.17–2.53)2013 2 2.16 0.93 (0.10–3.34)2012 4 3.72 1.08 (0.29–2.76)
WEST PENN HOSPITAL (11864)2014 2 3.49 0.57 (0.06–2.07)2013 3 2.36 1.27 (0.26–3.72)2012 1 1.09 0.91 (0.01–5.08)
MONONGAHELA VALLEY HOSPITAL (11069)2014 7 3.75 1.87 (0.75–3.84)2013 9 4.08 2.20 (1.01–4.18)2012 4 3.72 1.08 (0.29–2.75)
PENN HIGHLANDS DUBOIS (11606)2014 5 3.80 1.32 (0.42–3.07)2013 5 4.38 1.14 (0.37–2.66)2012 5 4.29 1.17 (0.38–2.72)
NAZARETH HOSPITAL (11919)2014 3 3.81 0.79 (0.16–2.30)2013 6 4.66 1.29 (0.47–2.80)2012 4 4.11 0.97 (0.26–2.49)
CHAMBERSBURG HOSPITAL (11913)2014 8 3.97 2.02 (0.87–3.97)2013 7 4.12 1.70 (0.68–3.50)2012 3 5.27 0.57 (0.11–1.66)
GOOD SAMARITAN HOSPITAL, THE (11712)2014 1 4.03 0.25 (0.00–1.38)2013 5 4.08 1.23 (0.40–2.86)2012 2 3.32 0.60 (0.07–2.18)
EINSTEIN MEDICAL CENTER MONTGOMERY (30210)2014 2 4.04 0.49 (0.06–1.79)2013 0 2.84 0.00 (0.00–1.29)2012 . . .
DELAWARE COUNTY MEMORIAL HOSPITAL (11972)2014 1 4.06 0.25 (0.00–1.37)2013 2 5.66 0.35 (0.04–1.28)2012 2 5.58 0.36 (0.04–1.29)
CARLISLE REGIONAL MEDICAL CENTER (11997)2014 2 4.16 0.48 (0.05–1.74)2013 4 2.84 1.41 (0.38–3.60)2012 4 3.11 1.29 (0.35–3.30)
HERITAGE VALLEY SEWICKLEY (10375)2014 3 4.23 0.71 (0.14–2.07)2013 9 5.45 1.65 (0.75–3.14)2012 7 4.43 1.58 (0.63–3.26)
Continued on next page . . .
245
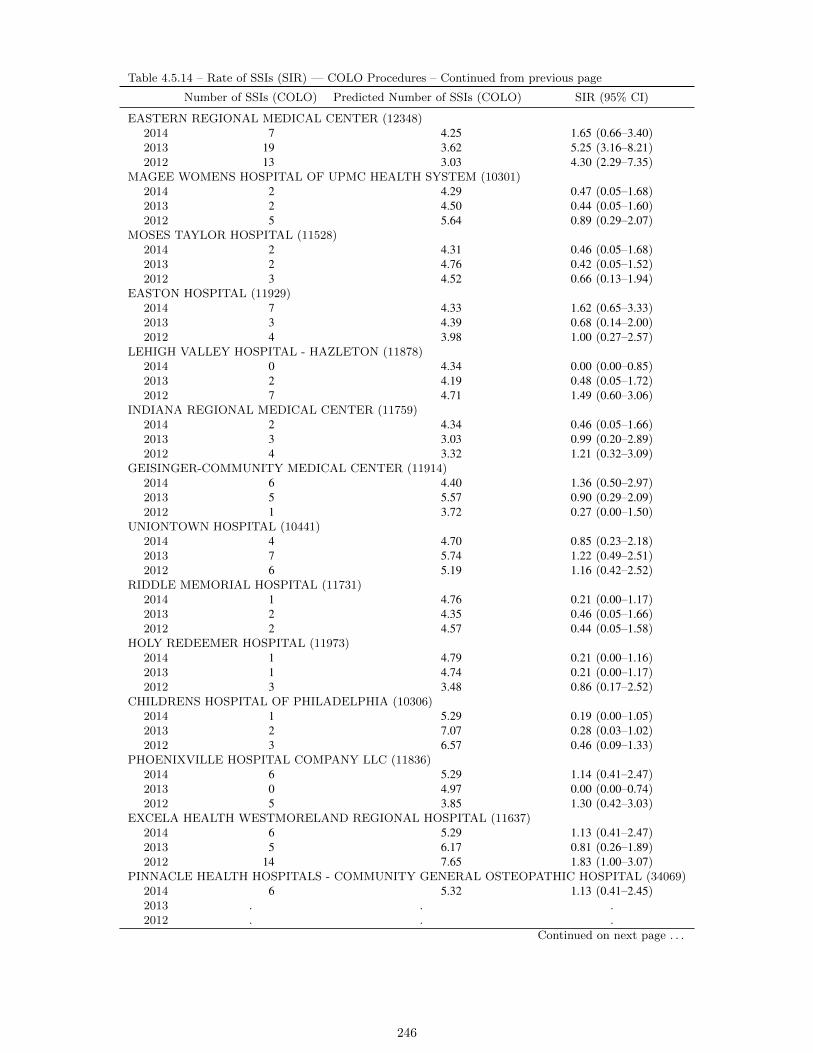
Table 4.5.14 – Rate of SSIs (SIR) — COLO Procedures – Continued from previous page
Number of SSIs (COLO) Predicted Number of SSIs (COLO) SIR (95% CI)
EASTERN REGIONAL MEDICAL CENTER (12348)2014 7 4.25 1.65 (0.66–3.40)2013 19 3.62 5.25 (3.16–8.21)2012 13 3.03 4.30 (2.29–7.35)
MAGEE WOMENS HOSPITAL OF UPMC HEALTH SYSTEM (10301)2014 2 4.29 0.47 (0.05–1.68)2013 2 4.50 0.44 (0.05–1.60)2012 5 5.64 0.89 (0.29–2.07)
MOSES TAYLOR HOSPITAL (11528)2014 2 4.31 0.46 (0.05–1.68)2013 2 4.76 0.42 (0.05–1.52)2012 3 4.52 0.66 (0.13–1.94)
EASTON HOSPITAL (11929)2014 7 4.33 1.62 (0.65–3.33)2013 3 4.39 0.68 (0.14–2.00)2012 4 3.98 1.00 (0.27–2.57)
LEHIGH VALLEY HOSPITAL - HAZLETON (11878)2014 0 4.34 0.00 (0.00–0.85)2013 2 4.19 0.48 (0.05–1.72)2012 7 4.71 1.49 (0.60–3.06)
INDIANA REGIONAL MEDICAL CENTER (11759)2014 2 4.34 0.46 (0.05–1.66)2013 3 3.03 0.99 (0.20–2.89)2012 4 3.32 1.21 (0.32–3.09)
GEISINGER-COMMUNITY MEDICAL CENTER (11914)2014 6 4.40 1.36 (0.50–2.97)2013 5 5.57 0.90 (0.29–2.09)2012 1 3.72 0.27 (0.00–1.50)
UNIONTOWN HOSPITAL (10441)2014 4 4.70 0.85 (0.23–2.18)2013 7 5.74 1.22 (0.49–2.51)2012 6 5.19 1.16 (0.42–2.52)
RIDDLE MEMORIAL HOSPITAL (11731)2014 1 4.76 0.21 (0.00–1.17)2013 2 4.35 0.46 (0.05–1.66)2012 2 4.57 0.44 (0.05–1.58)
HOLY REDEEMER HOSPITAL (11973)2014 1 4.79 0.21 (0.00–1.16)2013 1 4.74 0.21 (0.00–1.17)2012 3 3.48 0.86 (0.17–2.52)
CHILDRENS HOSPITAL OF PHILADELPHIA (10306)2014 1 5.29 0.19 (0.00–1.05)2013 2 7.07 0.28 (0.03–1.02)2012 3 6.57 0.46 (0.09–1.33)
PHOENIXVILLE HOSPITAL COMPANY LLC (11836)2014 6 5.29 1.14 (0.41–2.47)2013 0 4.97 0.00 (0.00–0.74)2012 5 3.85 1.30 (0.42–3.03)
EXCELA HEALTH WESTMORELAND REGIONAL HOSPITAL (11637)2014 6 5.29 1.13 (0.41–2.47)2013 5 6.17 0.81 (0.26–1.89)2012 14 7.65 1.83 (1.00–3.07)
PINNACLE HEALTH HOSPITALS - COMMUNITY GENERAL OSTEOPATHIC HOSPITAL (34069)2014 6 5.32 1.13 (0.41–2.45)2013 . . .2012 . . .
Continued on next page . . .
246
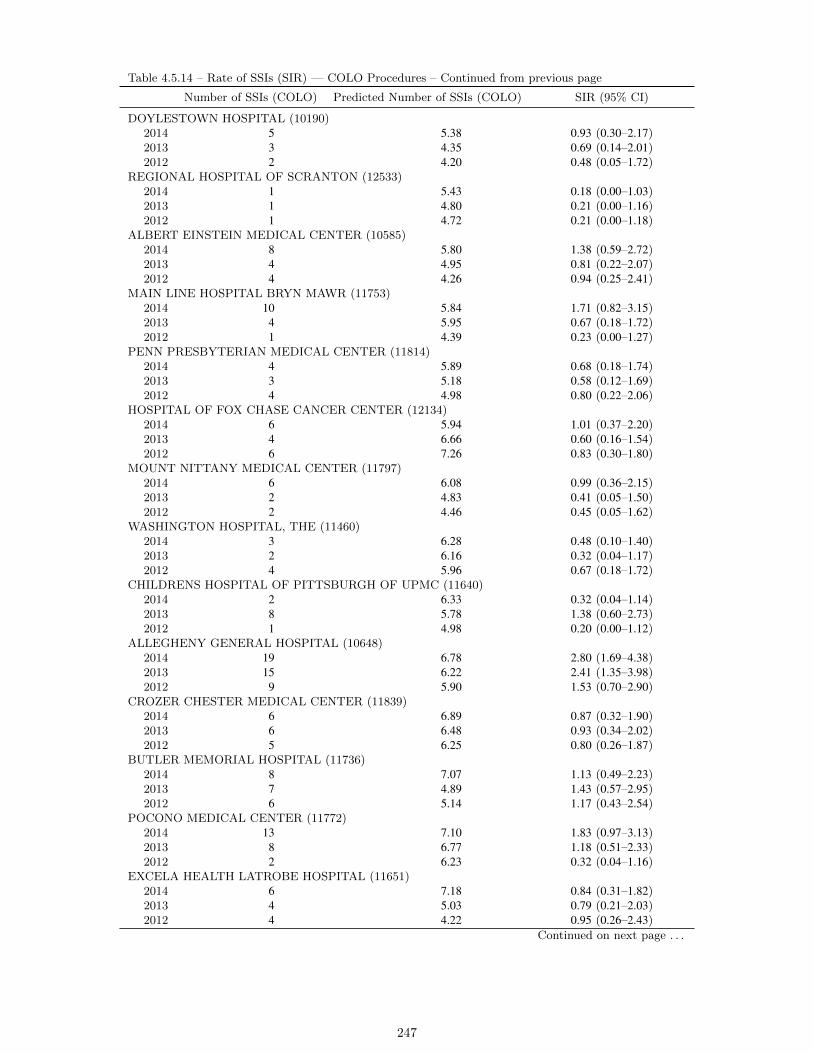
Table 4.5.14 – Rate of SSIs (SIR) — COLO Procedures – Continued from previous page
Number of SSIs (COLO) Predicted Number of SSIs (COLO) SIR (95% CI)
DOYLESTOWN HOSPITAL (10190)2014 5 5.38 0.93 (0.30–2.17)2013 3 4.35 0.69 (0.14–2.01)2012 2 4.20 0.48 (0.05–1.72)
REGIONAL HOSPITAL OF SCRANTON (12533)2014 1 5.43 0.18 (0.00–1.03)2013 1 4.80 0.21 (0.00–1.16)2012 1 4.72 0.21 (0.00–1.18)
ALBERT EINSTEIN MEDICAL CENTER (10585)2014 8 5.80 1.38 (0.59–2.72)2013 4 4.95 0.81 (0.22–2.07)2012 4 4.26 0.94 (0.25–2.41)
MAIN LINE HOSPITAL BRYN MAWR (11753)2014 10 5.84 1.71 (0.82–3.15)2013 4 5.95 0.67 (0.18–1.72)2012 1 4.39 0.23 (0.00–1.27)
PENN PRESBYTERIAN MEDICAL CENTER (11814)2014 4 5.89 0.68 (0.18–1.74)2013 3 5.18 0.58 (0.12–1.69)2012 4 4.98 0.80 (0.22–2.06)
HOSPITAL OF FOX CHASE CANCER CENTER (12134)2014 6 5.94 1.01 (0.37–2.20)2013 4 6.66 0.60 (0.16–1.54)2012 6 7.26 0.83 (0.30–1.80)
MOUNT NITTANY MEDICAL CENTER (11797)2014 6 6.08 0.99 (0.36–2.15)2013 2 4.83 0.41 (0.05–1.50)2012 2 4.46 0.45 (0.05–1.62)
WASHINGTON HOSPITAL, THE (11460)2014 3 6.28 0.48 (0.10–1.40)2013 2 6.16 0.32 (0.04–1.17)2012 4 5.96 0.67 (0.18–1.72)
CHILDRENS HOSPITAL OF PITTSBURGH OF UPMC (11640)2014 2 6.33 0.32 (0.04–1.14)2013 8 5.78 1.38 (0.60–2.73)2012 1 4.98 0.20 (0.00–1.12)
ALLEGHENY GENERAL HOSPITAL (10648)2014 19 6.78 2.80 (1.69–4.38)2013 15 6.22 2.41 (1.35–3.98)2012 9 5.90 1.53 (0.70–2.90)
CROZER CHESTER MEDICAL CENTER (11839)2014 6 6.89 0.87 (0.32–1.90)2013 6 6.48 0.93 (0.34–2.02)2012 5 6.25 0.80 (0.26–1.87)
BUTLER MEMORIAL HOSPITAL (11736)2014 8 7.07 1.13 (0.49–2.23)2013 7 4.89 1.43 (0.57–2.95)2012 6 5.14 1.17 (0.43–2.54)
POCONO MEDICAL CENTER (11772)2014 13 7.10 1.83 (0.97–3.13)2013 8 6.77 1.18 (0.51–2.33)2012 2 6.23 0.32 (0.04–1.16)
EXCELA HEALTH LATROBE HOSPITAL (11651)2014 6 7.18 0.84 (0.31–1.82)2013 4 5.03 0.79 (0.21–2.03)2012 4 4.22 0.95 (0.26–2.43)
Continued on next page . . .
247

Table 4.5.14 – Rate of SSIs (SIR) — COLO Procedures – Continued from previous page
Number of SSIs (COLO) Predicted Number of SSIs (COLO) SIR (95% CI)
ST. MARY MEDICAL CENTER (11885)2014 9 7.21 1.25 (0.57–2.37)2013 5 4.95 1.01 (0.33–2.36)2012 5 5.12 0.98 (0.31–2.28)
LEHIGH VALLEY HOSPITAL - MUHLENBERG (11898)2014 3 7.82 0.38 (0.08–1.12)2013 1 5.96 0.17 (0.00–0.93)2012 6 5.61 1.07 (0.39–2.33)
MAIN LINE HOSPITAL - PAOLI (11750)2014 2 7.88 0.25 (0.03–0.92)2013 6 7.55 0.79 (0.29–1.73)2012 0 5.40 0.00 (0.00–0.68)
HAHNEMANN UNIVERSITY HOSPITAL (11437)2014 13 8.20 1.59 (0.84–2.71)2013 9 8.02 1.12 (0.51–2.13)2012 9 7.56 1.19 (0.54–2.26)
UPMC MERCY (10384)2014 23 8.40 2.74 (1.73–4.11)2013 11 9.16 1.20 (0.60–2.15)2012 13 9.75 1.33 (0.71–2.28)
ROBERT PACKER HOSPITAL (12422)2014 1 8.63 0.12 (0.00–0.64)2013 3 8.62 0.35 (0.07–1.02)2012 5 8.23 0.61 (0.20–1.42)
GEISINGER WYOMING VALLEY MEDICAL CENTER (11780)2014 17 8.80 1.93 (1.13–3.09)2013 12 10.36 1.16 (0.60–2.02)2012 14 7.76 1.80 (0.99–3.03)
HERITAGE VALLEY BEAVER (11831)2014 4 8.84 0.45 (0.12–1.16)2013 5 9.60 0.52 (0.17–1.21)2012 4 5.95 0.67 (0.18–1.72)
CHESTER COUNTY HOSPITAL (12016)2014 6 9.06 0.66 (0.24–1.44)2013 4 8.50 0.47 (0.13–1.20)2012 3 7.43 0.40 (0.08–1.18)
FORBES HOSPITAL (11265)2014 12 9.08 1.32 (0.68–2.31)2013 7 8.05 0.87 (0.35–1.79)2012 9 7.59 1.19 (0.54–2.25)
ST. CLAIR MEMORIAL HOSPITAL (10561)2014 10 9.11 1.10 (0.53–2.02)2013 11 5.63 1.96 (0.97–3.50)2012 20 5.65 3.54 (2.16–5.47)
SAINT VINCENT HOSPITAL (11699)2014 22 9.29 2.37 (1.48–3.58)2013 16 8.53 1.88 (1.07–3.05)2012 9 7.09 1.27 (0.58–2.41)
CONEMAUGH MEMORIAL MEDICAL CENTER (10280)2014 9 9.75 0.92 (0.42–1.75)2013 7 9.01 0.78 (0.31–1.60)2012 6 9.57 0.63 (0.23–1.36)
PENNSYLVANIA HOSPITAL OF THE UNIVERSITY OF PA HEALTH SYS (11448)2014 8 9.77 0.82 (0.35–1.61)2013 16 10.84 1.48 (0.84–2.40)2012 13 7.91 1.64 (0.87–2.81)
Continued on next page . . .
248
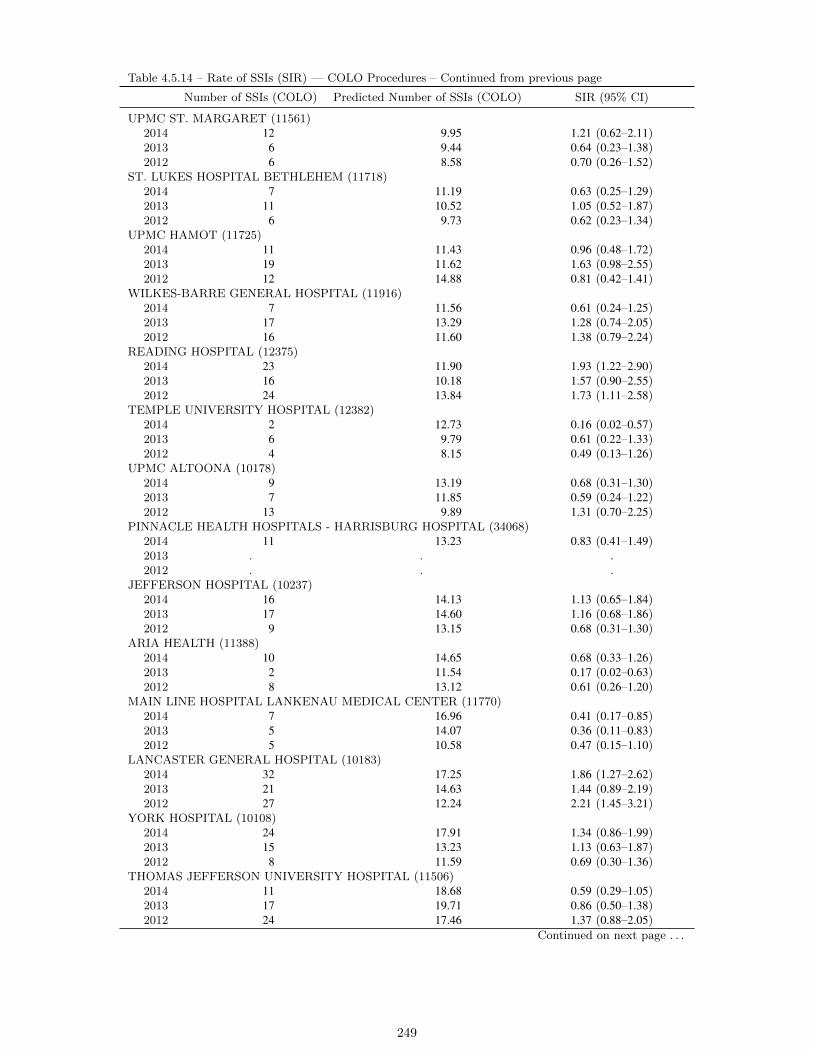
Table 4.5.14 – Rate of SSIs (SIR) — COLO Procedures – Continued from previous page
Number of SSIs (COLO) Predicted Number of SSIs (COLO) SIR (95% CI)
UPMC ST. MARGARET (11561)2014 12 9.95 1.21 (0.62–2.11)2013 6 9.44 0.64 (0.23–1.38)2012 6 8.58 0.70 (0.26–1.52)
ST. LUKES HOSPITAL BETHLEHEM (11718)2014 7 11.19 0.63 (0.25–1.29)2013 11 10.52 1.05 (0.52–1.87)2012 6 9.73 0.62 (0.23–1.34)
UPMC HAMOT (11725)2014 11 11.43 0.96 (0.48–1.72)2013 19 11.62 1.63 (0.98–2.55)2012 12 14.88 0.81 (0.42–1.41)
WILKES-BARRE GENERAL HOSPITAL (11916)2014 7 11.56 0.61 (0.24–1.25)2013 17 13.29 1.28 (0.74–2.05)2012 16 11.60 1.38 (0.79–2.24)
READING HOSPITAL (12375)2014 23 11.90 1.93 (1.22–2.90)2013 16 10.18 1.57 (0.90–2.55)2012 24 13.84 1.73 (1.11–2.58)
TEMPLE UNIVERSITY HOSPITAL (12382)2014 2 12.73 0.16 (0.02–0.57)2013 6 9.79 0.61 (0.22–1.33)2012 4 8.15 0.49 (0.13–1.26)
UPMC ALTOONA (10178)2014 9 13.19 0.68 (0.31–1.30)2013 7 11.85 0.59 (0.24–1.22)2012 13 9.89 1.31 (0.70–2.25)
PINNACLE HEALTH HOSPITALS - HARRISBURG HOSPITAL (34068)2014 11 13.23 0.83 (0.41–1.49)2013 . . .2012 . . .
JEFFERSON HOSPITAL (10237)2014 16 14.13 1.13 (0.65–1.84)2013 17 14.60 1.16 (0.68–1.86)2012 9 13.15 0.68 (0.31–1.30)
ARIA HEALTH (11388)2014 10 14.65 0.68 (0.33–1.26)2013 2 11.54 0.17 (0.02–0.63)2012 8 13.12 0.61 (0.26–1.20)
MAIN LINE HOSPITAL LANKENAU MEDICAL CENTER (11770)2014 7 16.96 0.41 (0.17–0.85)2013 5 14.07 0.36 (0.11–0.83)2012 5 10.58 0.47 (0.15–1.10)
LANCASTER GENERAL HOSPITAL (10183)2014 32 17.25 1.86 (1.27–2.62)2013 21 14.63 1.44 (0.89–2.19)2012 27 12.24 2.21 (1.45–3.21)
YORK HOSPITAL (10108)2014 24 17.91 1.34 (0.86–1.99)2013 15 13.23 1.13 (0.63–1.87)2012 8 11.59 0.69 (0.30–1.36)
THOMAS JEFFERSON UNIVERSITY HOSPITAL (11506)2014 11 18.68 0.59 (0.29–1.05)2013 17 19.71 0.86 (0.50–1.38)2012 24 17.46 1.37 (0.88–2.05)
Continued on next page . . .
249

Table 4.5.14 – Rate of SSIs (SIR) — COLO Procedures – Continued from previous page
Number of SSIs (COLO) Predicted Number of SSIs (COLO) SIR (95% CI)
ABINGTON MEMORIAL HOSPITAL (11838)2014 13 20.53 0.63 (0.34–1.08)2013 15 17.01 0.88 (0.49–1.45)2012 10 14.40 0.69 (0.33–1.28)
MILTON S HERSHEY MEDICAL CENTER (11747)2014 6 20.60 0.29 (0.11–0.63)2013 10 21.81 0.46 (0.22–0.84)2012 8 19.14 0.42 (0.18–0.82)
UPMC PRESBYTERIAN SHADYSIDE - SHADYSIDE (10118)2014 57 20.68 2.76 (2.09–3.57)2013 69 22.59 3.05 (2.38–3.87)2012 15 18.61 0.81 (0.45–1.33)
GEISINGER MEDICAL CENTER (11775)2014 18 21.97 0.82 (0.49–1.29)2013 13 21.11 0.62 (0.33–1.05)2012 11 16.60 0.66 (0.33–1.19)
UPMC PASSAVANT (11242)2014 19 23.23 0.82 (0.49–1.28)2013 43 25.76 1.67 (1.21–2.25)2012 31 22.72 1.36 (0.93–1.94)
HOSPITAL OF THE UNIVERSITY OF PENNSYLVANIA (10219)2014 32 29.90 1.07 (0.73–1.51)2013 23 23.11 1.00 (0.63–1.49)2012 18 13.70 1.31 (0.78–2.08)
UPMC PRESBYTERIAN SHADYSIDE (10348)2014 30 30.43 0.99 (0.66–1.41)2013 21 30.24 0.69 (0.43–1.06)2012 13 24.69 0.53 (0.28–0.90)
LEHIGH VALLEY HOSPITAL (11884)2014 15 31.30 0.48 (0.27–0.79)2013 18 25.25 0.71 (0.42–1.13)2012 25 24.26 1.03 (0.67–1.52)
250
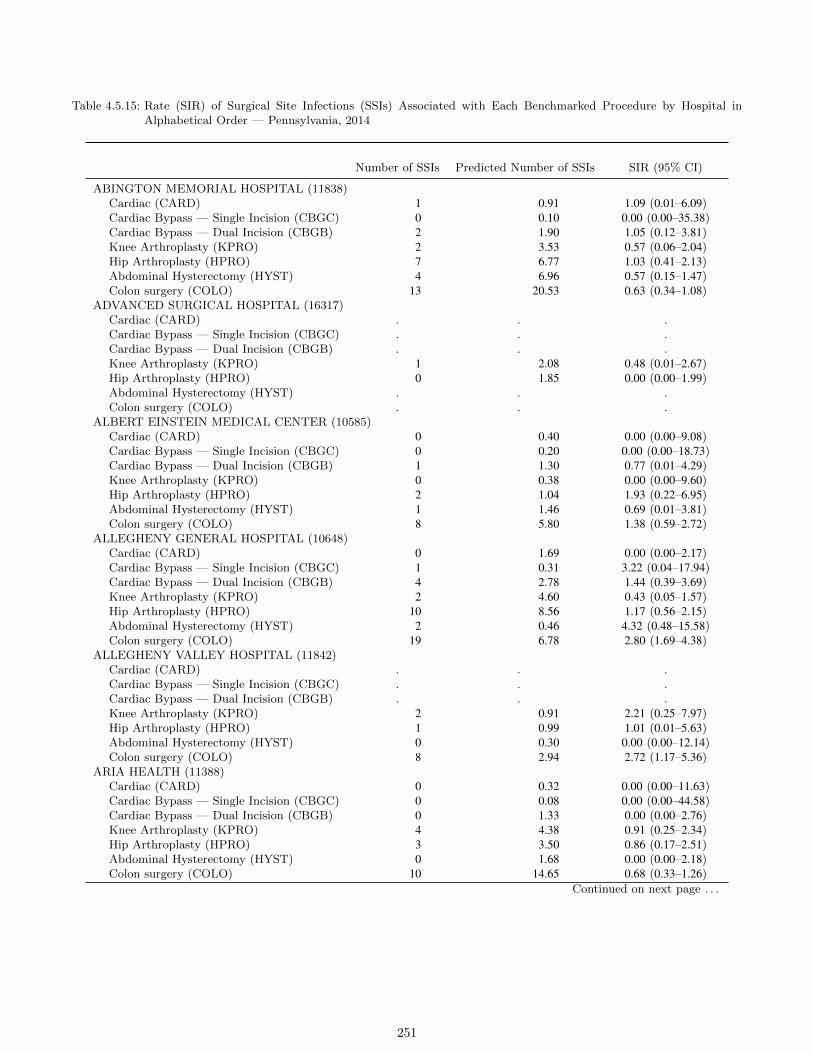
Table 4.5.15: Rate (SIR) of Surgical Site Infections (SSIs) Associated with Each Benchmarked Procedure by Hospital inAlphabetical Order — Pennsylvania, 2014
Number of SSIs Predicted Number of SSIs SIR (95% CI)
ABINGTON MEMORIAL HOSPITAL (11838)Cardiac (CARD) 1 0.91 1.09 (0.01–6.09)Cardiac Bypass — Single Incision (CBGC) 0 0.10 0.00 (0.00–35.38)Cardiac Bypass — Dual Incision (CBGB) 2 1.90 1.05 (0.12–3.81)Knee Arthroplasty (KPRO) 2 3.53 0.57 (0.06–2.04)Hip Arthroplasty (HPRO) 7 6.77 1.03 (0.41–2.13)Abdominal Hysterectomy (HYST) 4 6.96 0.57 (0.15–1.47)Colon surgery (COLO) 13 20.53 0.63 (0.34–1.08)
ADVANCED SURGICAL HOSPITAL (16317)Cardiac (CARD) . . .Cardiac Bypass — Single Incision (CBGC) . . .Cardiac Bypass — Dual Incision (CBGB) . . .Knee Arthroplasty (KPRO) 1 2.08 0.48 (0.01–2.67)Hip Arthroplasty (HPRO) 0 1.85 0.00 (0.00–1.99)Abdominal Hysterectomy (HYST) . . .Colon surgery (COLO) . . .
ALBERT EINSTEIN MEDICAL CENTER (10585)Cardiac (CARD) 0 0.40 0.00 (0.00–9.08)Cardiac Bypass — Single Incision (CBGC) 0 0.20 0.00 (0.00–18.73)Cardiac Bypass — Dual Incision (CBGB) 1 1.30 0.77 (0.01–4.29)Knee Arthroplasty (KPRO) 0 0.38 0.00 (0.00–9.60)Hip Arthroplasty (HPRO) 2 1.04 1.93 (0.22–6.95)Abdominal Hysterectomy (HYST) 1 1.46 0.69 (0.01–3.81)Colon surgery (COLO) 8 5.80 1.38 (0.59–2.72)
ALLEGHENY GENERAL HOSPITAL (10648)Cardiac (CARD) 0 1.69 0.00 (0.00–2.17)Cardiac Bypass — Single Incision (CBGC) 1 0.31 3.22 (0.04–17.94)Cardiac Bypass — Dual Incision (CBGB) 4 2.78 1.44 (0.39–3.69)Knee Arthroplasty (KPRO) 2 4.60 0.43 (0.05–1.57)Hip Arthroplasty (HPRO) 10 8.56 1.17 (0.56–2.15)Abdominal Hysterectomy (HYST) 2 0.46 4.32 (0.48–15.58)Colon surgery (COLO) 19 6.78 2.80 (1.69–4.38)
ALLEGHENY VALLEY HOSPITAL (11842)Cardiac (CARD) . . .Cardiac Bypass — Single Incision (CBGC) . . .Cardiac Bypass — Dual Incision (CBGB) . . .Knee Arthroplasty (KPRO) 2 0.91 2.21 (0.25–7.97)Hip Arthroplasty (HPRO) 1 0.99 1.01 (0.01–5.63)Abdominal Hysterectomy (HYST) 0 0.30 0.00 (0.00–12.14)Colon surgery (COLO) 8 2.94 2.72 (1.17–5.36)
ARIA HEALTH (11388)Cardiac (CARD) 0 0.32 0.00 (0.00–11.63)Cardiac Bypass — Single Incision (CBGC) 0 0.08 0.00 (0.00–44.58)Cardiac Bypass — Dual Incision (CBGB) 0 1.33 0.00 (0.00–2.76)Knee Arthroplasty (KPRO) 4 4.38 0.91 (0.25–2.34)Hip Arthroplasty (HPRO) 3 3.50 0.86 (0.17–2.51)Abdominal Hysterectomy (HYST) 0 1.68 0.00 (0.00–2.18)Colon surgery (COLO) 10 14.65 0.68 (0.33–1.26)
Continued on next page . . .
251

Table 4.5.15 – Rate of SSIs (SIR) — All Procedures By Facility (alphabetical order) – Continued from previous page
Number of SSIs Predicted Number of SSIs SIR (95% CI)
ARMSTRONG COUNTY MEMORIAL HOSPITAL (12057)Cardiac (CARD) . . .Cardiac Bypass — Single Incision (CBGC) . . .Cardiac Bypass — Dual Incision (CBGB) . . .Knee Arthroplasty (KPRO) 0 0.77 0.00 (0.00–4.76)Hip Arthroplasty (HPRO) 0 1.08 0.00 (0.00–3.41)Abdominal Hysterectomy (HYST) 0 0.21 0.00 (0.00–17.85)Colon surgery (COLO) 4 2.35 1.70 (0.46–4.36)
BARNES-KASSON COUNTY HOSPITAL (12404)Cardiac (CARD) . . .Cardiac Bypass — Single Incision (CBGC) . . .Cardiac Bypass — Dual Incision (CBGB) . . .Knee Arthroplasty (KPRO) . . .Hip Arthroplasty (HPRO) . . .Abdominal Hysterectomy (HYST) . . .Colon surgery (COLO) 0 0.13 0.00 (0.00–28.32)
BERWICK HOSPITAL CENTER (11442)Cardiac (CARD) . . .Cardiac Bypass — Single Incision (CBGC) . . .Cardiac Bypass — Dual Incision (CBGB) . . .Knee Arthroplasty (KPRO) 1 0.50 1.99 (0.03–11.06)Hip Arthroplasty (HPRO) 1 0.58 1.72 (0.02–9.54)Abdominal Hysterectomy (HYST) 0 0.35 0.00 (0.00–10.45)Colon surgery (COLO) 0 0.16 0.00 (0.00–22.70)
BRADFORD REGIONAL MEDICAL CENTER (12361)Cardiac (CARD) . . .Cardiac Bypass — Single Incision (CBGC) . . .Cardiac Bypass — Dual Incision (CBGB) . . .Knee Arthroplasty (KPRO) 0 0.52 0.00 (0.00–7.10)Hip Arthroplasty (HPRO) 1 0.73 1.37 (0.02–7.63)Abdominal Hysterectomy (HYST) 0 0.15 0.00 (0.00–25.07)Colon surgery (COLO) 0 0.93 0.00 (0.00–3.93)
BRANDYWINE HOSPITAL (11979)Cardiac (CARD) 0 0.16 0.00 (0.00–23.24)Cardiac Bypass — Single Incision (CBGC) 1 0.02 48.61 (0.64–270.47)Cardiac Bypass — Dual Incision (CBGB) 4 0.69 5.82 (1.57–14.90)Knee Arthroplasty (KPRO) 1 0.41 2.45 (0.03–13.63)Hip Arthroplasty (HPRO) 1 0.68 1.46 (0.02–8.13)Abdominal Hysterectomy (HYST) 0 0.40 0.00 (0.00–9.07)Colon surgery (COLO) 2 2.95 0.68 (0.08–2.45)
BUTLER MEMORIAL HOSPITAL (11736)Cardiac (CARD) 0 0.93 0.00 (0.00–3.96)Cardiac Bypass — Single Incision (CBGC) 0 0.05 0.00 (0.00–76.42)Cardiac Bypass — Dual Incision (CBGB) 2 3.36 0.59 (0.07–2.15)Knee Arthroplasty (KPRO) 0 2.53 0.00 (0.00–1.45)Hip Arthroplasty (HPRO) 0 2.33 0.00 (0.00–1.57)Abdominal Hysterectomy (HYST) 2 1.15 1.74 (0.20–6.28)Colon surgery (COLO) 8 7.07 1.13 (0.49–2.23)
CANONSBURG HOSPITAL (11586)Cardiac (CARD) . . .Cardiac Bypass — Single Incision (CBGC) . . .Cardiac Bypass — Dual Incision (CBGB) . . .Knee Arthroplasty (KPRO) 1 0.12 8.29 (0.11–46.10)Hip Arthroplasty (HPRO) 0 0.32 0.00 (0.00–11.37)Abdominal Hysterectomy (HYST) 0 0.03 0.00 (0.00–115.53)Colon surgery (COLO) 5 2.67 1.88 (0.60–4.38)
Continued on next page . . .
252

Table 4.5.15 – Rate of SSIs (SIR) — All Procedures By Facility (alphabetical order) – Continued from previous page
Number of SSIs Predicted Number of SSIs SIR (95% CI)
CARLISLE REGIONAL MEDICAL CENTER (11997)Cardiac (CARD) . . .Cardiac Bypass — Single Incision (CBGC) . . .Cardiac Bypass — Dual Incision (CBGB) . . .Knee Arthroplasty (KPRO) 2 1.55 1.29 (0.14–4.65)Hip Arthroplasty (HPRO) 1 1.00 1.00 (0.01–5.56)Abdominal Hysterectomy (HYST) 1 1.61 0.62 (0.01–3.46)Colon surgery (COLO) 2 4.16 0.48 (0.05–1.74)
CHAMBERSBURG HOSPITAL (11913)Cardiac (CARD) . . .Cardiac Bypass — Single Incision (CBGC) . . .Cardiac Bypass — Dual Incision (CBGB) . . .Knee Arthroplasty (KPRO) 3 2.38 1.26 (0.25–3.68)Hip Arthroplasty (HPRO) 4 3.30 1.21 (0.33–3.10)Abdominal Hysterectomy (HYST) 0 0.27 0.00 (0.00–13.55)Colon surgery (COLO) 8 3.97 2.02 (0.87–3.97)
CHARLES COLE MEMORIAL HOSPITAL (11956)Cardiac (CARD) . . .Cardiac Bypass — Single Incision (CBGC) . . .Cardiac Bypass — Dual Incision (CBGB) . . .Knee Arthroplasty (KPRO) 0 0.84 0.00 (0.00–4.37)Hip Arthroplasty (HPRO) 0 0.71 0.00 (0.00–5.18)Abdominal Hysterectomy (HYST) 1 0.20 5.06 (0.07–28.18)Colon surgery (COLO) 1 0.40 2.53 (0.03–14.07)
CHESTER COUNTY HOSPITAL (12016)Cardiac (CARD) 0 0.40 0.00 (0.00–9.19)Cardiac Bypass — Single Incision (CBGC) 0 0.01 0.00 (0.00–267.47)Cardiac Bypass — Dual Incision (CBGB) 0 1.14 0.00 (0.00–3.21)Knee Arthroplasty (KPRO) 0 1.46 0.00 (0.00–2.51)Hip Arthroplasty (HPRO) 2 2.01 1.00 (0.11–3.59)Abdominal Hysterectomy (HYST) 2 2.59 0.77 (0.09–2.79)Colon surgery (COLO) 6 9.06 0.66 (0.24–1.44)
CHESTNUT HILL HOSPITAL (12304)Cardiac (CARD) . . .Cardiac Bypass — Single Incision (CBGC) . . .Cardiac Bypass — Dual Incision (CBGB) . . .Knee Arthroplasty (KPRO) 3 0.53 5.64 (1.13–16.48)Hip Arthroplasty (HPRO) 0 1.03 0.00 (0.00–3.56)Abdominal Hysterectomy (HYST) 1 1.16 0.86 (0.01–4.81)Colon surgery (COLO) 2 1.65 1.21 (0.14–4.37)
CHILDRENS HOSPITAL OF PHILADELPHIA (10306)Cardiac (CARD) 9 2.33 3.86 (1.76–7.33)Cardiac Bypass — Single Incision (CBGC) . . .Cardiac Bypass — Dual Incision (CBGB) . . .Knee Arthroplasty (KPRO) 0 0.02 0.00 (0.00–239.67)Hip Arthroplasty (HPRO) 0 0.04 0.00 (0.00–91.17)Abdominal Hysterectomy (HYST) . . .Colon surgery (COLO) 1 5.29 0.19 (0.00–1.05)
CHILDRENS HOSPITAL OF PITTSBURGH OF UPMC (11640)Cardiac (CARD) 5 1.53 3.27 (1.06–7.64)Cardiac Bypass — Single Incision (CBGC) 0 0.01 0.00 (0.00–534.93)Cardiac Bypass — Dual Incision (CBGB) . . .Knee Arthroplasty (KPRO) 0 0.03 0.00 (0.00–131.93)Hip Arthroplasty (HPRO) 0 0.03 0.00 (0.00–131.36)Abdominal Hysterectomy (HYST) . . .Colon surgery (COLO) 2 6.33 0.32 (0.04–1.14)
Continued on next page . . .
253

Table 4.5.15 – Rate of SSIs (SIR) — All Procedures By Facility (alphabetical order) – Continued from previous page
Number of SSIs Predicted Number of SSIs SIR (95% CI)
CLARION HOSPITAL (11654)Cardiac (CARD) . . .Cardiac Bypass — Single Incision (CBGC) . . .Cardiac Bypass — Dual Incision (CBGB) . . .Knee Arthroplasty (KPRO) 2 0.26 7.70 (0.86–27.79)Hip Arthroplasty (HPRO) 1 0.35 2.83 (0.04–15.74)Abdominal Hysterectomy (HYST) 1 0.52 1.93 (0.03–10.71)Colon surgery (COLO) 0 1.87 0.00 (0.00–1.96)
CONEMAUGH MEMORIAL MEDICAL CENTER (10280)Cardiac (CARD) 1 0.71 1.40 (0.02–7.80)Cardiac Bypass — Single Incision (CBGC) 0 0.13 0.00 (0.00–27.18)Cardiac Bypass — Dual Incision (CBGB) 2 1.77 1.13 (0.13–4.08)Knee Arthroplasty (KPRO) 2 2.42 0.83 (0.09–2.99)Hip Arthroplasty (HPRO) 7 3.76 1.86 (0.75–3.84)Abdominal Hysterectomy (HYST) 1 2.63 0.38 (0.00–2.11)Colon surgery (COLO) 9 9.75 0.92 (0.42–1.75)
CONEMAUGH MINERS MEDICAL CENTER (12295)Cardiac (CARD) . . .Cardiac Bypass — Single Incision (CBGC) . . .Cardiac Bypass — Dual Incision (CBGB) . . .Knee Arthroplasty (KPRO) 0 0.07 0.00 (0.00–49.76)Hip Arthroplasty (HPRO) 0 0.07 0.00 (0.00–53.74)Abdominal Hysterectomy (HYST) . . .Colon surgery (COLO) 0 0.12 0.00 (0.00–31.63)
COORDINATED HEALTH ORTHOPEDIC HOSPITAL LLC (11872)Cardiac (CARD) . . .Cardiac Bypass — Single Incision (CBGC) . . .Cardiac Bypass — Dual Incision (CBGB) . . .Knee Arthroplasty (KPRO) 1 3.47 0.29 (0.00–1.60)Hip Arthroplasty (HPRO) 1 1.55 0.65 (0.01–3.60)Abdominal Hysterectomy (HYST) 0 0.02 0.00 (0.00–183.01)Colon surgery (COLO) . . .
CORRY MEMORIAL HOSPITAL (12283)Cardiac (CARD) . . .Cardiac Bypass — Single Incision (CBGC) . . .Cardiac Bypass — Dual Incision (CBGB) . . .Knee Arthroplasty (KPRO) 0 0.10 0.00 (0.00–38.24)Hip Arthroplasty (HPRO) . . .Abdominal Hysterectomy (HYST) . . .Colon surgery (COLO) 0 0.03 0.00 (0.00–114.40)
CROZER CHESTER MEDICAL CENTER - SPRINGFIELD (11851)Cardiac (CARD) . . .Cardiac Bypass — Single Incision (CBGC) . . .Cardiac Bypass — Dual Incision (CBGB) . . .Knee Arthroplasty (KPRO) 0 1.10 0.00 (0.00–3.34)Hip Arthroplasty (HPRO) 1 1.33 0.75 (0.01–4.17)Abdominal Hysterectomy (HYST) . . .Colon surgery (COLO) 0 0.21 0.00 (0.00–17.19)
CROZER CHESTER MEDICAL CENTER (11839)Cardiac (CARD) 0 0.21 0.00 (0.00–17.20)Cardiac Bypass — Single Incision (CBGC) 0 0.15 0.00 (0.00–24.67)Cardiac Bypass — Dual Incision (CBGB) 1 0.70 1.42 (0.02–7.91)Knee Arthroplasty (KPRO) 0 0.07 0.00 (0.00–53.24)Hip Arthroplasty (HPRO) 1 0.30 3.36 (0.04–18.71)Abdominal Hysterectomy (HYST) 2 2.21 0.91 (0.10–3.27)Colon surgery (COLO) 6 6.89 0.87 (0.32–1.90)
Continued on next page . . .
254

Table 4.5.15 – Rate of SSIs (SIR) — All Procedures By Facility (alphabetical order) – Continued from previous page
Number of SSIs Predicted Number of SSIs SIR (95% CI)
CROZER CHESTER MEDICAL CENTER (11932)Cardiac (CARD) . . .Cardiac Bypass — Single Incision (CBGC) . . .Cardiac Bypass — Dual Incision (CBGB) . . .Knee Arthroplasty (KPRO) 0 0.51 0.00 (0.00–7.20)Hip Arthroplasty (HPRO) 0 0.40 0.00 (0.00–9.24)Abdominal Hysterectomy (HYST) . . .Colon surgery (COLO) 3 2.18 1.37 (0.28–4.02)
DELAWARE COUNTY MEMORIAL HOSPITAL (11972)Cardiac (CARD) . . .Cardiac Bypass — Single Incision (CBGC) . . .Cardiac Bypass — Dual Incision (CBGB) . . .Knee Arthroplasty (KPRO) 1 1.06 0.94 (0.01–5.25)Hip Arthroplasty (HPRO) 2 1.11 1.80 (0.20–6.50)Abdominal Hysterectomy (HYST) 0 0.23 0.00 (0.00–15.67)Colon surgery (COLO) 1 4.06 0.25 (0.00–1.37)
DOYLESTOWN HOSPITAL (10190)Cardiac (CARD) 0 0.73 0.00 (0.00–5.04)Cardiac Bypass — Single Incision (CBGC) 0 0.03 0.00 (0.00–106.99)Cardiac Bypass — Dual Incision (CBGB) 1 1.29 0.77 (0.01–4.31)Knee Arthroplasty (KPRO) 2 1.86 1.07 (0.12–3.88)Hip Arthroplasty (HPRO) 2 2.25 0.89 (0.10–3.21)Abdominal Hysterectomy (HYST) 0 0.53 0.00 (0.00–6.88)Colon surgery (COLO) 5 5.38 0.93 (0.30–2.17)
EASTERN REGIONAL MEDICAL CENTER (12348)Cardiac (CARD) . . .Cardiac Bypass — Single Incision (CBGC) . . .Cardiac Bypass — Dual Incision (CBGB) . . .Knee Arthroplasty (KPRO) 0 0.02 0.00 (0.00–239.67)Hip Arthroplasty (HPRO) 1 0.15 6.46 (0.08–35.96)Abdominal Hysterectomy (HYST) 0 0.87 0.00 (0.00–4.21)Colon surgery (COLO) 7 4.25 1.65 (0.66–3.40)
EASTON HOSPITAL (11929)Cardiac (CARD) 0 0.19 0.00 (0.00–18.88)Cardiac Bypass — Single Incision (CBGC) 0 0.02 0.00 (0.00–208.98)Cardiac Bypass — Dual Incision (CBGB) 1 1.42 0.70 (0.01–3.91)Knee Arthroplasty (KPRO) 3 1.02 2.93 (0.59–8.56)Hip Arthroplasty (HPRO) 3 1.30 2.32 (0.47–6.76)Abdominal Hysterectomy (HYST) 0 1.20 0.00 (0.00–3.06)Colon surgery (COLO) 7 4.33 1.62 (0.65–3.33)
EDGEWOOD SURGICAL HOSPITAL (12552)Cardiac (CARD) . . .Cardiac Bypass — Single Incision (CBGC) . . .Cardiac Bypass — Dual Incision (CBGB) . . .Knee Arthroplasty (KPRO) 0 0.41 0.00 (0.00–8.90)Hip Arthroplasty (HPRO) 0 0.31 0.00 (0.00–11.85)Abdominal Hysterectomy (HYST) . . .Colon surgery (COLO) . . .
EINSTEIN AT ELKINS PARK (12500)Cardiac (CARD) . . .Cardiac Bypass — Single Incision (CBGC) . . .Cardiac Bypass — Dual Incision (CBGB) . . .Knee Arthroplasty (KPRO) 9 1.63 5.52 (2.52–10.49)Hip Arthroplasty (HPRO) 0 1.31 0.00 (0.00–2.80)Abdominal Hysterectomy (HYST) 0 0.12 0.00 (0.00–29.79)Colon surgery (COLO) 3 2.09 1.43 (0.29–4.19)
Continued on next page . . .
255
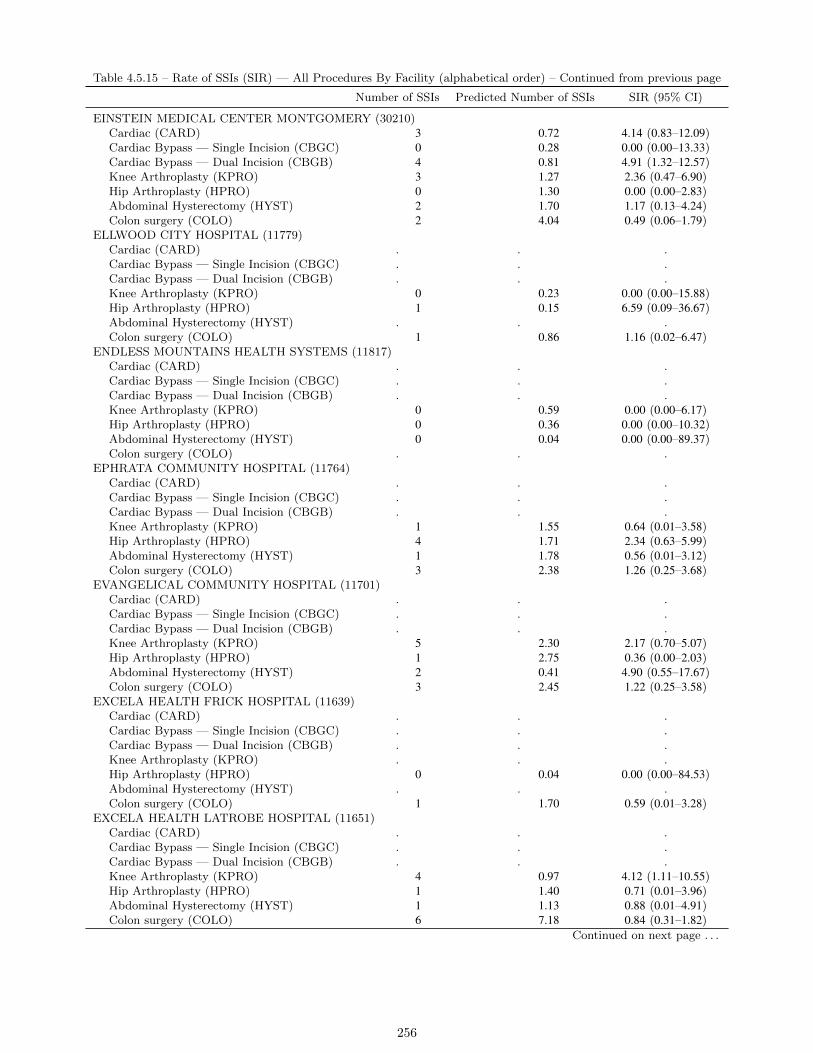
Table 4.5.15 – Rate of SSIs (SIR) — All Procedures By Facility (alphabetical order) – Continued from previous page
Number of SSIs Predicted Number of SSIs SIR (95% CI)
EINSTEIN MEDICAL CENTER MONTGOMERY (30210)Cardiac (CARD) 3 0.72 4.14 (0.83–12.09)Cardiac Bypass — Single Incision (CBGC) 0 0.28 0.00 (0.00–13.33)Cardiac Bypass — Dual Incision (CBGB) 4 0.81 4.91 (1.32–12.57)Knee Arthroplasty (KPRO) 3 1.27 2.36 (0.47–6.90)Hip Arthroplasty (HPRO) 0 1.30 0.00 (0.00–2.83)Abdominal Hysterectomy (HYST) 2 1.70 1.17 (0.13–4.24)Colon surgery (COLO) 2 4.04 0.49 (0.06–1.79)
ELLWOOD CITY HOSPITAL (11779)Cardiac (CARD) . . .Cardiac Bypass — Single Incision (CBGC) . . .Cardiac Bypass — Dual Incision (CBGB) . . .Knee Arthroplasty (KPRO) 0 0.23 0.00 (0.00–15.88)Hip Arthroplasty (HPRO) 1 0.15 6.59 (0.09–36.67)Abdominal Hysterectomy (HYST) . . .Colon surgery (COLO) 1 0.86 1.16 (0.02–6.47)
ENDLESS MOUNTAINS HEALTH SYSTEMS (11817)Cardiac (CARD) . . .Cardiac Bypass — Single Incision (CBGC) . . .Cardiac Bypass — Dual Incision (CBGB) . . .Knee Arthroplasty (KPRO) 0 0.59 0.00 (0.00–6.17)Hip Arthroplasty (HPRO) 0 0.36 0.00 (0.00–10.32)Abdominal Hysterectomy (HYST) 0 0.04 0.00 (0.00–89.37)Colon surgery (COLO) . . .
EPHRATA COMMUNITY HOSPITAL (11764)Cardiac (CARD) . . .Cardiac Bypass — Single Incision (CBGC) . . .Cardiac Bypass — Dual Incision (CBGB) . . .Knee Arthroplasty (KPRO) 1 1.55 0.64 (0.01–3.58)Hip Arthroplasty (HPRO) 4 1.71 2.34 (0.63–5.99)Abdominal Hysterectomy (HYST) 1 1.78 0.56 (0.01–3.12)Colon surgery (COLO) 3 2.38 1.26 (0.25–3.68)
EVANGELICAL COMMUNITY HOSPITAL (11701)Cardiac (CARD) . . .Cardiac Bypass — Single Incision (CBGC) . . .Cardiac Bypass — Dual Incision (CBGB) . . .Knee Arthroplasty (KPRO) 5 2.30 2.17 (0.70–5.07)Hip Arthroplasty (HPRO) 1 2.75 0.36 (0.00–2.03)Abdominal Hysterectomy (HYST) 2 0.41 4.90 (0.55–17.67)Colon surgery (COLO) 3 2.45 1.22 (0.25–3.58)
EXCELA HEALTH FRICK HOSPITAL (11639)Cardiac (CARD) . . .Cardiac Bypass — Single Incision (CBGC) . . .Cardiac Bypass — Dual Incision (CBGB) . . .Knee Arthroplasty (KPRO) . . .Hip Arthroplasty (HPRO) 0 0.04 0.00 (0.00–84.53)Abdominal Hysterectomy (HYST) . . .Colon surgery (COLO) 1 1.70 0.59 (0.01–3.28)
EXCELA HEALTH LATROBE HOSPITAL (11651)Cardiac (CARD) . . .Cardiac Bypass — Single Incision (CBGC) . . .Cardiac Bypass — Dual Incision (CBGB) . . .Knee Arthroplasty (KPRO) 4 0.97 4.12 (1.11–10.55)Hip Arthroplasty (HPRO) 1 1.40 0.71 (0.01–3.96)Abdominal Hysterectomy (HYST) 1 1.13 0.88 (0.01–4.91)Colon surgery (COLO) 6 7.18 0.84 (0.31–1.82)
Continued on next page . . .
256
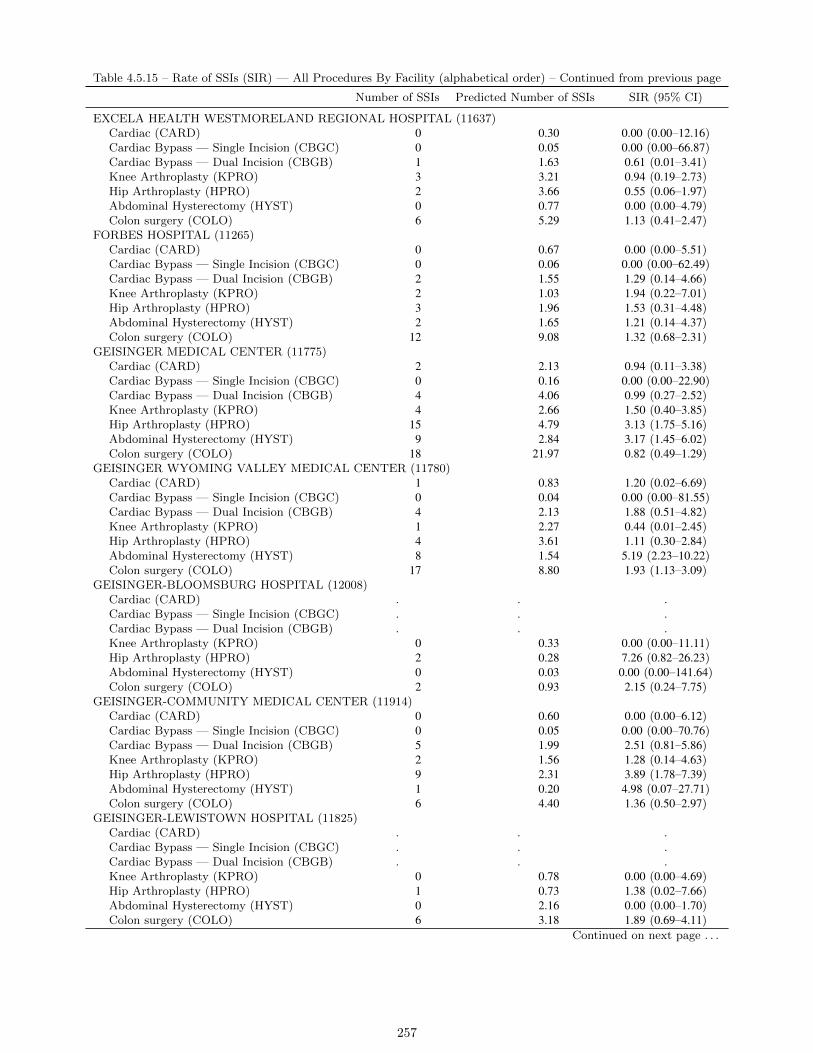
Table 4.5.15 – Rate of SSIs (SIR) — All Procedures By Facility (alphabetical order) – Continued from previous page
Number of SSIs Predicted Number of SSIs SIR (95% CI)
EXCELA HEALTH WESTMORELAND REGIONAL HOSPITAL (11637)Cardiac (CARD) 0 0.30 0.00 (0.00–12.16)Cardiac Bypass — Single Incision (CBGC) 0 0.05 0.00 (0.00–66.87)Cardiac Bypass — Dual Incision (CBGB) 1 1.63 0.61 (0.01–3.41)Knee Arthroplasty (KPRO) 3 3.21 0.94 (0.19–2.73)Hip Arthroplasty (HPRO) 2 3.66 0.55 (0.06–1.97)Abdominal Hysterectomy (HYST) 0 0.77 0.00 (0.00–4.79)Colon surgery (COLO) 6 5.29 1.13 (0.41–2.47)
FORBES HOSPITAL (11265)Cardiac (CARD) 0 0.67 0.00 (0.00–5.51)Cardiac Bypass — Single Incision (CBGC) 0 0.06 0.00 (0.00–62.49)Cardiac Bypass — Dual Incision (CBGB) 2 1.55 1.29 (0.14–4.66)Knee Arthroplasty (KPRO) 2 1.03 1.94 (0.22–7.01)Hip Arthroplasty (HPRO) 3 1.96 1.53 (0.31–4.48)Abdominal Hysterectomy (HYST) 2 1.65 1.21 (0.14–4.37)Colon surgery (COLO) 12 9.08 1.32 (0.68–2.31)
GEISINGER MEDICAL CENTER (11775)Cardiac (CARD) 2 2.13 0.94 (0.11–3.38)Cardiac Bypass — Single Incision (CBGC) 0 0.16 0.00 (0.00–22.90)Cardiac Bypass — Dual Incision (CBGB) 4 4.06 0.99 (0.27–2.52)Knee Arthroplasty (KPRO) 4 2.66 1.50 (0.40–3.85)Hip Arthroplasty (HPRO) 15 4.79 3.13 (1.75–5.16)Abdominal Hysterectomy (HYST) 9 2.84 3.17 (1.45–6.02)Colon surgery (COLO) 18 21.97 0.82 (0.49–1.29)
GEISINGER WYOMING VALLEY MEDICAL CENTER (11780)Cardiac (CARD) 1 0.83 1.20 (0.02–6.69)Cardiac Bypass — Single Incision (CBGC) 0 0.04 0.00 (0.00–81.55)Cardiac Bypass — Dual Incision (CBGB) 4 2.13 1.88 (0.51–4.82)Knee Arthroplasty (KPRO) 1 2.27 0.44 (0.01–2.45)Hip Arthroplasty (HPRO) 4 3.61 1.11 (0.30–2.84)Abdominal Hysterectomy (HYST) 8 1.54 5.19 (2.23–10.22)Colon surgery (COLO) 17 8.80 1.93 (1.13–3.09)
GEISINGER-BLOOMSBURG HOSPITAL (12008)Cardiac (CARD) . . .Cardiac Bypass — Single Incision (CBGC) . . .Cardiac Bypass — Dual Incision (CBGB) . . .Knee Arthroplasty (KPRO) 0 0.33 0.00 (0.00–11.11)Hip Arthroplasty (HPRO) 2 0.28 7.26 (0.82–26.23)Abdominal Hysterectomy (HYST) 0 0.03 0.00 (0.00–141.64)Colon surgery (COLO) 2 0.93 2.15 (0.24–7.75)
GEISINGER-COMMUNITY MEDICAL CENTER (11914)Cardiac (CARD) 0 0.60 0.00 (0.00–6.12)Cardiac Bypass — Single Incision (CBGC) 0 0.05 0.00 (0.00–70.76)Cardiac Bypass — Dual Incision (CBGB) 5 1.99 2.51 (0.81–5.86)Knee Arthroplasty (KPRO) 2 1.56 1.28 (0.14–4.63)Hip Arthroplasty (HPRO) 9 2.31 3.89 (1.78–7.39)Abdominal Hysterectomy (HYST) 1 0.20 4.98 (0.07–27.71)Colon surgery (COLO) 6 4.40 1.36 (0.50–2.97)
GEISINGER-LEWISTOWN HOSPITAL (11825)Cardiac (CARD) . . .Cardiac Bypass — Single Incision (CBGC) . . .Cardiac Bypass — Dual Incision (CBGB) . . .Knee Arthroplasty (KPRO) 0 0.78 0.00 (0.00–4.69)Hip Arthroplasty (HPRO) 1 0.73 1.38 (0.02–7.66)Abdominal Hysterectomy (HYST) 0 2.16 0.00 (0.00–1.70)Colon surgery (COLO) 6 3.18 1.89 (0.69–4.11)
Continued on next page . . .
257

Table 4.5.15 – Rate of SSIs (SIR) — All Procedures By Facility (alphabetical order) – Continued from previous page
Number of SSIs Predicted Number of SSIs SIR (95% CI)
GETTYSBURG HOSPITAL (11531)Cardiac (CARD) . . .Cardiac Bypass — Single Incision (CBGC) . . .Cardiac Bypass — Dual Incision (CBGB) . . .Knee Arthroplasty (KPRO) 2 1.55 1.29 (0.15–4.66)Hip Arthroplasty (HPRO) 2 1.02 1.96 (0.22–7.07)Abdominal Hysterectomy (HYST) 1 0.56 1.78 (0.02–9.90)Colon surgery (COLO) 5 2.76 1.81 (0.58–4.23)
GNADEN HUETTEN MEMORIAL HOSPITAL (12241)Cardiac (CARD) . . .Cardiac Bypass — Single Incision (CBGC) . . .Cardiac Bypass — Dual Incision (CBGB) . . .Knee Arthroplasty (KPRO) 0 0.39 0.00 (0.00–9.44)Hip Arthroplasty (HPRO) 0 0.29 0.00 (0.00–12.86)Abdominal Hysterectomy (HYST) 0 0.20 0.00 (0.00–18.51)Colon surgery (COLO) 3 0.56 5.39 (1.08–15.75)
GOOD SAMARITAN HOSPITAL, THE (11712)Cardiac (CARD) 0 0.01 0.00 (0.00–536.68)Cardiac Bypass — Single Incision (CBGC) 0 0.02 0.00 (0.00–171.48)Cardiac Bypass — Dual Incision (CBGB) 1 1.76 0.57 (0.01–3.16)Knee Arthroplasty (KPRO) 0 1.33 0.00 (0.00–2.76)Hip Arthroplasty (HPRO) 1 0.98 1.02 (0.01–5.68)Abdominal Hysterectomy (HYST) 0 0.11 0.00 (0.00–34.27)Colon surgery (COLO) 1 4.03 0.25 (0.00–1.38)
GRAND VIEW HOSPITAL (11847)Cardiac (CARD) . . .Cardiac Bypass — Single Incision (CBGC) . . .Cardiac Bypass — Dual Incision (CBGB) . . .Knee Arthroplasty (KPRO) 1 1.42 0.70 (0.01–3.91)Hip Arthroplasty (HPRO) 1 1.94 0.51 (0.01–2.86)Abdominal Hysterectomy (HYST) 0 0.45 0.00 (0.00–8.10)Colon surgery (COLO) 3 3.15 0.95 (0.19–2.78)
GROVE CITY MEDICAL CENTER (11722)Cardiac (CARD) . . .Cardiac Bypass — Single Incision (CBGC) . . .Cardiac Bypass — Dual Incision (CBGB) . . .Knee Arthroplasty (KPRO) 1 0.43 2.31 (0.03–12.87)Hip Arthroplasty (HPRO) 1 0.47 2.12 (0.03–11.81)Abdominal Hysterectomy (HYST) 0 0.04 0.00 (0.00–91.51)Colon surgery (COLO) 0 0.34 0.00 (0.00–10.79)
GUTHRIE TOWANDA MEMORIAL HOSPITAL (12549)Cardiac (CARD) . . .Cardiac Bypass — Single Incision (CBGC) . . .Cardiac Bypass — Dual Incision (CBGB) . . .Knee Arthroplasty (KPRO) . . .Hip Arthroplasty (HPRO) 1 0.09 11.52 (0.15–64.08)Abdominal Hysterectomy (HYST) 0 0.02 0.00 (0.00–231.05)Colon surgery (COLO) 0 0.13 0.00 (0.00–28.32)
HAHNEMANN UNIVERSITY HOSPITAL (11437)Cardiac (CARD) 1 0.16 6.08 (0.08–33.86)Cardiac Bypass — Single Incision (CBGC) 0 0.02 0.00 (0.00–208.98)Cardiac Bypass — Dual Incision (CBGB) 1 0.45 2.21 (0.03–12.28)Knee Arthroplasty (KPRO) 2 0.79 2.53 (0.28–9.13)Hip Arthroplasty (HPRO) 0 1.52 0.00 (0.00–2.41)Abdominal Hysterectomy (HYST) 5 2.48 2.01 (0.65–4.70)Colon surgery (COLO) 13 8.20 1.59 (0.84–2.71)
Continued on next page . . .
258
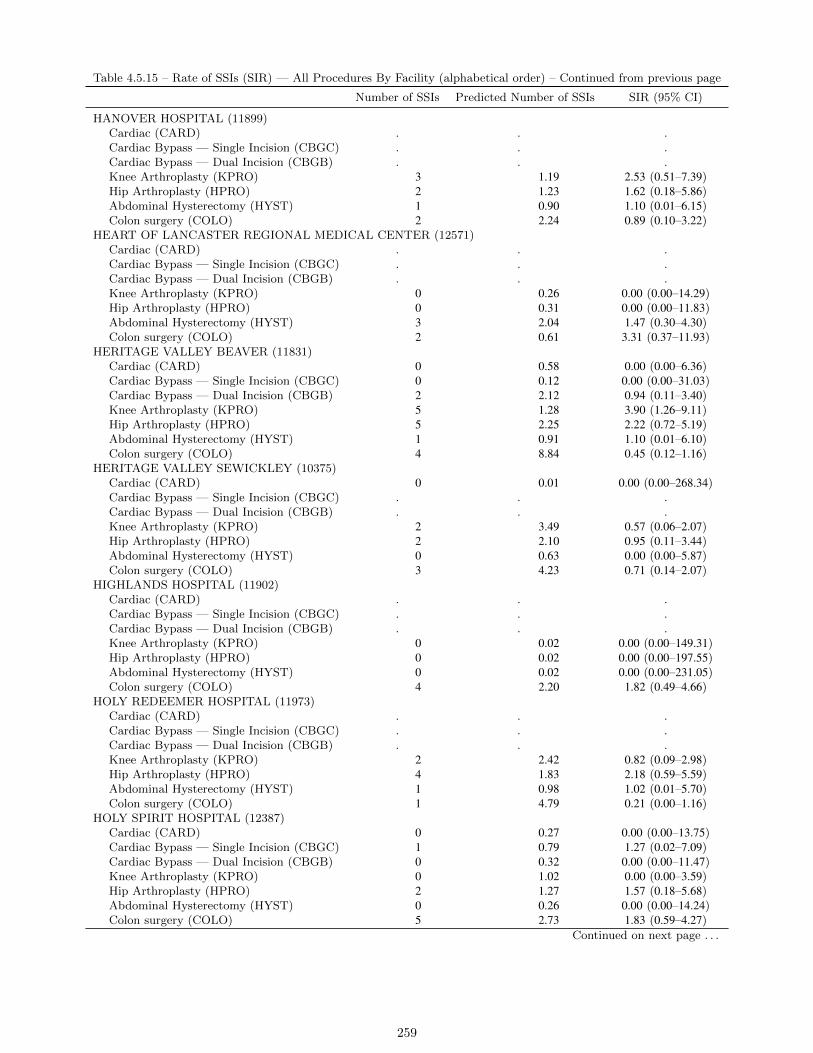
Table 4.5.15 – Rate of SSIs (SIR) — All Procedures By Facility (alphabetical order) – Continued from previous page
Number of SSIs Predicted Number of SSIs SIR (95% CI)
HANOVER HOSPITAL (11899)Cardiac (CARD) . . .Cardiac Bypass — Single Incision (CBGC) . . .Cardiac Bypass — Dual Incision (CBGB) . . .Knee Arthroplasty (KPRO) 3 1.19 2.53 (0.51–7.39)Hip Arthroplasty (HPRO) 2 1.23 1.62 (0.18–5.86)Abdominal Hysterectomy (HYST) 1 0.90 1.10 (0.01–6.15)Colon surgery (COLO) 2 2.24 0.89 (0.10–3.22)
HEART OF LANCASTER REGIONAL MEDICAL CENTER (12571)Cardiac (CARD) . . .Cardiac Bypass — Single Incision (CBGC) . . .Cardiac Bypass — Dual Incision (CBGB) . . .Knee Arthroplasty (KPRO) 0 0.26 0.00 (0.00–14.29)Hip Arthroplasty (HPRO) 0 0.31 0.00 (0.00–11.83)Abdominal Hysterectomy (HYST) 3 2.04 1.47 (0.30–4.30)Colon surgery (COLO) 2 0.61 3.31 (0.37–11.93)
HERITAGE VALLEY BEAVER (11831)Cardiac (CARD) 0 0.58 0.00 (0.00–6.36)Cardiac Bypass — Single Incision (CBGC) 0 0.12 0.00 (0.00–31.03)Cardiac Bypass — Dual Incision (CBGB) 2 2.12 0.94 (0.11–3.40)Knee Arthroplasty (KPRO) 5 1.28 3.90 (1.26–9.11)Hip Arthroplasty (HPRO) 5 2.25 2.22 (0.72–5.19)Abdominal Hysterectomy (HYST) 1 0.91 1.10 (0.01–6.10)Colon surgery (COLO) 4 8.84 0.45 (0.12–1.16)
HERITAGE VALLEY SEWICKLEY (10375)Cardiac (CARD) 0 0.01 0.00 (0.00–268.34)Cardiac Bypass — Single Incision (CBGC) . . .Cardiac Bypass — Dual Incision (CBGB) . . .Knee Arthroplasty (KPRO) 2 3.49 0.57 (0.06–2.07)Hip Arthroplasty (HPRO) 2 2.10 0.95 (0.11–3.44)Abdominal Hysterectomy (HYST) 0 0.63 0.00 (0.00–5.87)Colon surgery (COLO) 3 4.23 0.71 (0.14–2.07)
HIGHLANDS HOSPITAL (11902)Cardiac (CARD) . . .Cardiac Bypass — Single Incision (CBGC) . . .Cardiac Bypass — Dual Incision (CBGB) . . .Knee Arthroplasty (KPRO) 0 0.02 0.00 (0.00–149.31)Hip Arthroplasty (HPRO) 0 0.02 0.00 (0.00–197.55)Abdominal Hysterectomy (HYST) 0 0.02 0.00 (0.00–231.05)Colon surgery (COLO) 4 2.20 1.82 (0.49–4.66)
HOLY REDEEMER HOSPITAL (11973)Cardiac (CARD) . . .Cardiac Bypass — Single Incision (CBGC) . . .Cardiac Bypass — Dual Incision (CBGB) . . .Knee Arthroplasty (KPRO) 2 2.42 0.82 (0.09–2.98)Hip Arthroplasty (HPRO) 4 1.83 2.18 (0.59–5.59)Abdominal Hysterectomy (HYST) 1 0.98 1.02 (0.01–5.70)Colon surgery (COLO) 1 4.79 0.21 (0.00–1.16)
HOLY SPIRIT HOSPITAL (12387)Cardiac (CARD) 0 0.27 0.00 (0.00–13.75)Cardiac Bypass — Single Incision (CBGC) 1 0.79 1.27 (0.02–7.09)Cardiac Bypass — Dual Incision (CBGB) 0 0.32 0.00 (0.00–11.47)Knee Arthroplasty (KPRO) 0 1.02 0.00 (0.00–3.59)Hip Arthroplasty (HPRO) 2 1.27 1.57 (0.18–5.68)Abdominal Hysterectomy (HYST) 0 0.26 0.00 (0.00–14.24)Colon surgery (COLO) 5 2.73 1.83 (0.59–4.27)
Continued on next page . . .
259
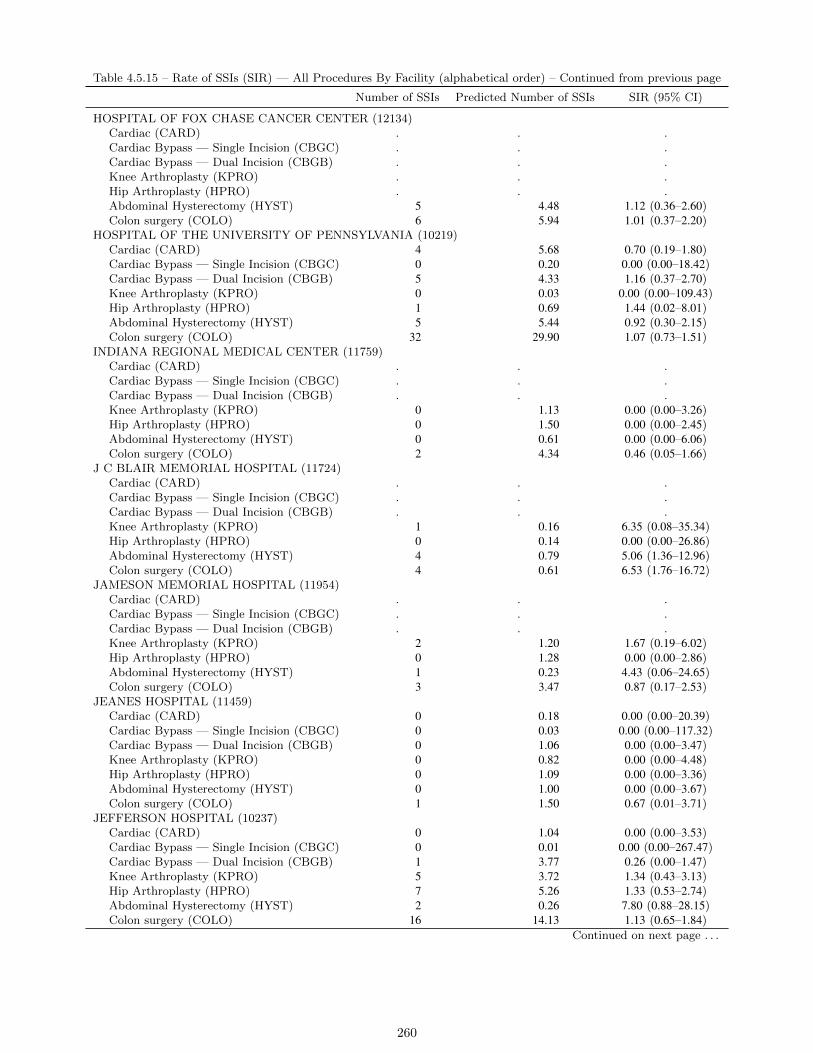
Table 4.5.15 – Rate of SSIs (SIR) — All Procedures By Facility (alphabetical order) – Continued from previous page
Number of SSIs Predicted Number of SSIs SIR (95% CI)
HOSPITAL OF FOX CHASE CANCER CENTER (12134)Cardiac (CARD) . . .Cardiac Bypass — Single Incision (CBGC) . . .Cardiac Bypass — Dual Incision (CBGB) . . .Knee Arthroplasty (KPRO) . . .Hip Arthroplasty (HPRO) . . .Abdominal Hysterectomy (HYST) 5 4.48 1.12 (0.36–2.60)Colon surgery (COLO) 6 5.94 1.01 (0.37–2.20)
HOSPITAL OF THE UNIVERSITY OF PENNSYLVANIA (10219)Cardiac (CARD) 4 5.68 0.70 (0.19–1.80)Cardiac Bypass — Single Incision (CBGC) 0 0.20 0.00 (0.00–18.42)Cardiac Bypass — Dual Incision (CBGB) 5 4.33 1.16 (0.37–2.70)Knee Arthroplasty (KPRO) 0 0.03 0.00 (0.00–109.43)Hip Arthroplasty (HPRO) 1 0.69 1.44 (0.02–8.01)Abdominal Hysterectomy (HYST) 5 5.44 0.92 (0.30–2.15)Colon surgery (COLO) 32 29.90 1.07 (0.73–1.51)
INDIANA REGIONAL MEDICAL CENTER (11759)Cardiac (CARD) . . .Cardiac Bypass — Single Incision (CBGC) . . .Cardiac Bypass — Dual Incision (CBGB) . . .Knee Arthroplasty (KPRO) 0 1.13 0.00 (0.00–3.26)Hip Arthroplasty (HPRO) 0 1.50 0.00 (0.00–2.45)Abdominal Hysterectomy (HYST) 0 0.61 0.00 (0.00–6.06)Colon surgery (COLO) 2 4.34 0.46 (0.05–1.66)
J C BLAIR MEMORIAL HOSPITAL (11724)Cardiac (CARD) . . .Cardiac Bypass — Single Incision (CBGC) . . .Cardiac Bypass — Dual Incision (CBGB) . . .Knee Arthroplasty (KPRO) 1 0.16 6.35 (0.08–35.34)Hip Arthroplasty (HPRO) 0 0.14 0.00 (0.00–26.86)Abdominal Hysterectomy (HYST) 4 0.79 5.06 (1.36–12.96)Colon surgery (COLO) 4 0.61 6.53 (1.76–16.72)
JAMESON MEMORIAL HOSPITAL (11954)Cardiac (CARD) . . .Cardiac Bypass — Single Incision (CBGC) . . .Cardiac Bypass — Dual Incision (CBGB) . . .Knee Arthroplasty (KPRO) 2 1.20 1.67 (0.19–6.02)Hip Arthroplasty (HPRO) 0 1.28 0.00 (0.00–2.86)Abdominal Hysterectomy (HYST) 1 0.23 4.43 (0.06–24.65)Colon surgery (COLO) 3 3.47 0.87 (0.17–2.53)
JEANES HOSPITAL (11459)Cardiac (CARD) 0 0.18 0.00 (0.00–20.39)Cardiac Bypass — Single Incision (CBGC) 0 0.03 0.00 (0.00–117.32)Cardiac Bypass — Dual Incision (CBGB) 0 1.06 0.00 (0.00–3.47)Knee Arthroplasty (KPRO) 0 0.82 0.00 (0.00–4.48)Hip Arthroplasty (HPRO) 0 1.09 0.00 (0.00–3.36)Abdominal Hysterectomy (HYST) 0 1.00 0.00 (0.00–3.67)Colon surgery (COLO) 1 1.50 0.67 (0.01–3.71)
JEFFERSON HOSPITAL (10237)Cardiac (CARD) 0 1.04 0.00 (0.00–3.53)Cardiac Bypass — Single Incision (CBGC) 0 0.01 0.00 (0.00–267.47)Cardiac Bypass — Dual Incision (CBGB) 1 3.77 0.26 (0.00–1.47)Knee Arthroplasty (KPRO) 5 3.72 1.34 (0.43–3.13)Hip Arthroplasty (HPRO) 7 5.26 1.33 (0.53–2.74)Abdominal Hysterectomy (HYST) 2 0.26 7.80 (0.88–28.15)Colon surgery (COLO) 16 14.13 1.13 (0.65–1.84)
Continued on next page . . .
260

Table 4.5.15 – Rate of SSIs (SIR) — All Procedures By Facility (alphabetical order) – Continued from previous page
Number of SSIs Predicted Number of SSIs SIR (95% CI)
JENNERSVILLE REGIONAL HOSPITAL (12337)Cardiac (CARD) . . .Cardiac Bypass — Single Incision (CBGC) . . .Cardiac Bypass — Dual Incision (CBGB) . . .Knee Arthroplasty (KPRO) 0 0.17 0.00 (0.00–22.12)Hip Arthroplasty (HPRO) 1 0.56 1.78 (0.02–9.91)Abdominal Hysterectomy (HYST) 0 0.02 0.00 (0.00–183.01)Colon surgery (COLO) 0 1.55 0.00 (0.00–2.36)
JERSEY SHORE HOSPITAL (11689)Cardiac (CARD) . . .Cardiac Bypass — Single Incision (CBGC) . . .Cardiac Bypass — Dual Incision (CBGB) . . .Knee Arthroplasty (KPRO) 0 0.07 0.00 (0.00–50.36)Hip Arthroplasty (HPRO) 0 0.17 0.00 (0.00–21.51)Abdominal Hysterectomy (HYST) . . .Colon surgery (COLO) 1 0.59 1.70 (0.02–9.48)
KANE COMMUNITY HOSPITAL (12111)Cardiac (CARD) . . .Cardiac Bypass — Single Incision (CBGC) . . .Cardiac Bypass — Dual Incision (CBGB) . . .Knee Arthroplasty (KPRO) 0 0.08 0.00 (0.00–44.26)Hip Arthroplasty (HPRO) 1 0.25 3.98 (0.05–22.15)Abdominal Hysterectomy (HYST) . . .Colon surgery (COLO) 1 0.16 6.07 (0.08–33.78)
LANCASTER GENERAL HOSPITAL (10183)Cardiac (CARD) 2 1.10 1.82 (0.20–6.58)Cardiac Bypass — Single Incision (CBGC) 0 0.26 0.00 (0.00–14.11)Cardiac Bypass — Dual Incision (CBGB) 9 4.73 1.90 (0.87–3.61)Knee Arthroplasty (KPRO) 3 5.93 0.51 (0.10–1.48)Hip Arthroplasty (HPRO) 5 8.71 0.57 (0.18–1.34)Abdominal Hysterectomy (HYST) 11 4.79 2.30 (1.14–4.11)Colon surgery (COLO) 32 17.25 1.86 (1.27–2.62)
LANCASTER REGIONAL MEDICAL CENTER (12335)Cardiac (CARD) 0 0.15 0.00 (0.00–25.20)Cardiac Bypass — Single Incision (CBGC) 0 0.06 0.00 (0.00–64.93)Cardiac Bypass — Dual Incision (CBGB) 0 0.98 0.00 (0.00–3.76)Knee Arthroplasty (KPRO) 6 1.79 3.34 (1.22–7.28)Hip Arthroplasty (HPRO) 2 1.96 1.02 (0.11–3.69)Abdominal Hysterectomy (HYST) 1 0.75 1.34 (0.02–7.46)Colon surgery (COLO) 2 1.70 1.18 (0.13–4.25)
LANSDALE HOSPITAL (12032)Cardiac (CARD) . . .Cardiac Bypass — Single Incision (CBGC) . . .Cardiac Bypass — Dual Incision (CBGB) . . .Knee Arthroplasty (KPRO) 1 1.29 0.78 (0.01–4.33)Hip Arthroplasty (HPRO) 4 2.22 1.80 (0.48–4.61)Abdominal Hysterectomy (HYST) 0 0.02 0.00 (0.00–183.01)Colon surgery (COLO) 2 2.66 0.75 (0.08–2.72)
LEHIGH VALLEY HOSPITAL - HAZLETON (11878)Cardiac (CARD) . . .Cardiac Bypass — Single Incision (CBGC) . . .Cardiac Bypass — Dual Incision (CBGB) . . .Knee Arthroplasty (KPRO) 0 0.40 0.00 (0.00–9.20)Hip Arthroplasty (HPRO) 2 0.47 4.21 (0.47–15.21)Abdominal Hysterectomy (HYST) 3 0.45 6.65 (1.34–19.43)Colon surgery (COLO) 0 4.34 0.00 (0.00–0.85)
Continued on next page . . .
261

Table 4.5.15 – Rate of SSIs (SIR) — All Procedures By Facility (alphabetical order) – Continued from previous page
Number of SSIs Predicted Number of SSIs SIR (95% CI)
LEHIGH VALLEY HOSPITAL - MUHLENBERG (11898)Cardiac (CARD) 0 0.34 0.00 (0.00–10.88)Cardiac Bypass — Single Incision (CBGC) 0 0.03 0.00 (0.00–117.32)Cardiac Bypass — Dual Incision (CBGB) 0 1.04 0.00 (0.00–3.53)Knee Arthroplasty (KPRO) 1 0.94 1.07 (0.01–5.93)Hip Arthroplasty (HPRO) 1 1.32 0.76 (0.01–4.22)Abdominal Hysterectomy (HYST) 1 3.24 0.31 (0.00–1.72)Colon surgery (COLO) 3 7.82 0.38 (0.08–1.12)
LEHIGH VALLEY HOSPITAL (11884)Cardiac (CARD) 0 2.31 0.00 (0.00–1.59)Cardiac Bypass — Single Incision (CBGC) 0 0.25 0.00 (0.00–14.76)Cardiac Bypass — Dual Incision (CBGB) 3 4.64 0.65 (0.13–1.89)Knee Arthroplasty (KPRO) 4 6.13 0.65 (0.18–1.67)Hip Arthroplasty (HPRO) 4 7.69 0.52 (0.14–1.33)Abdominal Hysterectomy (HYST) 4 10.24 0.39 (0.11–1.00)Colon surgery (COLO) 15 31.30 0.48 (0.27–0.79)
LOCK HAVEN HOSPITAL (12097)Cardiac (CARD) . . .Cardiac Bypass — Single Incision (CBGC) . . .Cardiac Bypass — Dual Incision (CBGB) . . .Knee Arthroplasty (KPRO) . . .Hip Arthroplasty (HPRO) . . .Abdominal Hysterectomy (HYST) 0 0.07 0.00 (0.00–55.59)Colon surgery (COLO) 0 0.12 0.00 (0.00–31.63)
LOWER BUCKS HOSPITAL (12390)Cardiac (CARD) 0 0.02 0.00 (0.00–178.89)Cardiac Bypass — Single Incision (CBGC) . . .Cardiac Bypass — Dual Incision (CBGB) . . .Knee Arthroplasty (KPRO) 0 0.10 0.00 (0.00–38.50)Hip Arthroplasty (HPRO) 1 0.32 3.10 (0.04–17.27)Abdominal Hysterectomy (HYST) 0 0.15 0.00 (0.00–24.93)Colon surgery (COLO) 0 1.08 0.00 (0.00–3.41)
MAGEE WOMENS HOSPITAL OF UPMC HEALTH SYSTEM (10301)Cardiac (CARD) . . .Cardiac Bypass — Single Incision (CBGC) . . .Cardiac Bypass — Dual Incision (CBGB) . . .Knee Arthroplasty (KPRO) 2 4.54 0.44 (0.05–1.59)Hip Arthroplasty (HPRO) 3 5.94 0.51 (0.10–1.48)Abdominal Hysterectomy (HYST) 7 15.03 0.47 (0.19–0.96)Colon surgery (COLO) 2 4.29 0.47 (0.05–1.68)
MAIN LINE HOSPITAL - PAOLI (11750)Cardiac (CARD) 0 0.16 0.00 (0.00–22.36)Cardiac Bypass — Single Incision (CBGC) 0 0.01 0.00 (0.00–342.97)Cardiac Bypass — Dual Incision (CBGB) 1 0.54 1.85 (0.02–10.31)Knee Arthroplasty (KPRO) 4 2.42 1.65 (0.44–4.22)Hip Arthroplasty (HPRO) 4 3.57 1.12 (0.30–2.87)Abdominal Hysterectomy (HYST) 0 2.40 0.00 (0.00–1.53)Colon surgery (COLO) 2 7.88 0.25 (0.03–0.92)
MAIN LINE HOSPITAL BRYN MAWR (11753)Cardiac (CARD) 0 0.20 0.00 (0.00–18.49)Cardiac Bypass — Single Incision (CBGC) 0 0.03 0.00 (0.00–133.73)Cardiac Bypass — Dual Incision (CBGB) 1 0.46 2.18 (0.03–12.13)Knee Arthroplasty (KPRO) 5 4.61 1.08 (0.35–2.53)Hip Arthroplasty (HPRO) 0 4.15 0.00 (0.00–0.88)Abdominal Hysterectomy (HYST) 0 0.61 0.00 (0.00–6.02)Colon surgery (COLO) 10 5.84 1.71 (0.82–3.15)
Continued on next page . . .
262

Table 4.5.15 – Rate of SSIs (SIR) — All Procedures By Facility (alphabetical order) – Continued from previous page
Number of SSIs Predicted Number of SSIs SIR (95% CI)
MAIN LINE HOSPITAL LANKENAU MEDICAL CENTER (11770)Cardiac (CARD) 3 1.79 1.68 (0.34–4.90)Cardiac Bypass — Single Incision (CBGC) 0 0.74 0.00 (0.00–4.95)Cardiac Bypass — Dual Incision (CBGB) 0 3.42 0.00 (0.00–1.07)Knee Arthroplasty (KPRO) 1 2.08 0.48 (0.01–2.67)Hip Arthroplasty (HPRO) 0 2.90 0.00 (0.00–1.26)Abdominal Hysterectomy (HYST) 3 3.75 0.80 (0.16–2.34)Colon surgery (COLO) 7 16.96 0.41 (0.17–0.85)
MEADVILLE MEDICAL CENTER (11583)Cardiac (CARD) . . .Cardiac Bypass — Single Incision (CBGC) . . .Cardiac Bypass — Dual Incision (CBGB) . . .Knee Arthroplasty (KPRO) 0 3.10 0.00 (0.00–1.18)Hip Arthroplasty (HPRO) 1 1.88 0.53 (0.01–2.96)Abdominal Hysterectomy (HYST) 0 0.72 0.00 (0.00–5.10)Colon surgery (COLO) 0 1.29 0.00 (0.00–2.85)
MEMORIAL HOSPITAL (11633)Cardiac (CARD) . . .Cardiac Bypass — Single Incision (CBGC) . . .Cardiac Bypass — Dual Incision (CBGB) . . .Knee Arthroplasty (KPRO) 1 0.20 5.07 (0.07–28.21)Hip Arthroplasty (HPRO) 1 0.30 3.29 (0.04–18.31)Abdominal Hysterectomy (HYST) 0 1.13 0.00 (0.00–3.24)Colon surgery (COLO) 0 1.26 0.00 (0.00–2.91)
MERCY FITZGERALD HOSPITAL (11683)Cardiac (CARD) 0 0.23 0.00 (0.00–16.05)Cardiac Bypass — Single Incision (CBGC) 0 0.09 0.00 (0.00–42.19)Cardiac Bypass — Dual Incision (CBGB) 1 0.35 2.82 (0.04–15.68)Knee Arthroplasty (KPRO) 0 0.16 0.00 (0.00–23.06)Hip Arthroplasty (HPRO) 1 0.67 1.50 (0.02–8.35)Abdominal Hysterectomy (HYST) 0 0.50 0.00 (0.00–7.37)Colon surgery (COLO) 4 3.35 1.19 (0.32–3.06)
MERCY PHILADELPHIA HOSPITAL (11946)Cardiac (CARD) . . .Cardiac Bypass — Single Incision (CBGC) . . .Cardiac Bypass — Dual Incision (CBGB) . . .Knee Arthroplasty (KPRO) 0 0.17 0.00 (0.00–21.91)Hip Arthroplasty (HPRO) 1 0.12 8.50 (0.11–47.29)Abdominal Hysterectomy (HYST) 0 0.30 0.00 (0.00–12.13)Colon surgery (COLO) 0 2.35 0.00 (0.00–1.56)
MERCY SUBURBAN HOSPITAL (11952)Cardiac (CARD) . . .Cardiac Bypass — Single Incision (CBGC) . . .Cardiac Bypass — Dual Incision (CBGB) . . .Knee Arthroplasty (KPRO) 0 0.27 0.00 (0.00–13.77)Hip Arthroplasty (HPRO) 1 0.55 1.83 (0.02–10.20)Abdominal Hysterectomy (HYST) 3 0.83 3.60 (0.72–10.52)Colon surgery (COLO) 2 2.98 0.67 (0.08–2.42)
MILLCREEK COMMUNITY HOSPITAL (12253)Cardiac (CARD) . . .Cardiac Bypass — Single Incision (CBGC) . . .Cardiac Bypass — Dual Incision (CBGB) . . .Knee Arthroplasty (KPRO) 1 0.87 1.16 (0.02–6.43)Hip Arthroplasty (HPRO) 0 0.37 0.00 (0.00–9.93)Abdominal Hysterectomy (HYST) 0 0.36 0.00 (0.00–10.13)Colon surgery (COLO) 0 0.52 0.00 (0.00–7.08)
Continued on next page . . .
263

Table 4.5.15 – Rate of SSIs (SIR) — All Procedures By Facility (alphabetical order) – Continued from previous page
Number of SSIs Predicted Number of SSIs SIR (95% CI)
MILTON S HERSHEY MEDICAL CENTER (11747)Cardiac (CARD) 6 2.39 2.51 (0.92–5.46)Cardiac Bypass — Single Incision (CBGC) 0 0.11 0.00 (0.00–32.30)Cardiac Bypass — Dual Incision (CBGB) 1 3.11 0.32 (0.00–1.79)Knee Arthroplasty (KPRO) 2 3.59 0.56 (0.06–2.01)Hip Arthroplasty (HPRO) 6 4.74 1.27 (0.46–2.76)Abdominal Hysterectomy (HYST) 2 5.21 0.38 (0.04–1.39)Colon surgery (COLO) 6 20.60 0.29 (0.11–0.63)
MONONGAHELA VALLEY HOSPITAL (11069)Cardiac (CARD) . . .Cardiac Bypass — Single Incision (CBGC) . . .Cardiac Bypass — Dual Incision (CBGB) . . .Knee Arthroplasty (KPRO) 2 1.07 1.86 (0.21–6.73)Hip Arthroplasty (HPRO) 2 1.57 1.28 (0.14–4.61)Abdominal Hysterectomy (HYST) 0 0.15 0.00 (0.00–23.98)Colon surgery (COLO) 7 3.75 1.87 (0.75–3.84)
MOSES TAYLOR HOSPITAL (11528)Cardiac (CARD) . . .Cardiac Bypass — Single Incision (CBGC) . . .Cardiac Bypass — Dual Incision (CBGB) . . .Knee Arthroplasty (KPRO) 3 2.26 1.33 (0.27–3.87)Hip Arthroplasty (HPRO) 1 2.14 0.47 (0.01–2.60)Abdominal Hysterectomy (HYST) 2 2.77 0.72 (0.08–2.61)Colon surgery (COLO) 2 4.31 0.46 (0.05–1.68)
MOUNT NITTANY MEDICAL CENTER (11797)Cardiac (CARD) . . .Cardiac Bypass — Single Incision (CBGC) . . .Cardiac Bypass — Dual Incision (CBGB) . . .Knee Arthroplasty (KPRO) 21 5.94 3.54 (2.19–5.41)Hip Arthroplasty (HPRO) 6 5.55 1.08 (0.39–2.35)Abdominal Hysterectomy (HYST) 0 1.04 0.00 (0.00–3.54)Colon surgery (COLO) 6 6.08 0.99 (0.36–2.15)
NASON HOSPITAL (11907)Cardiac (CARD) . . .Cardiac Bypass — Single Incision (CBGC) . . .Cardiac Bypass — Dual Incision (CBGB) . . .Knee Arthroplasty (KPRO) 0 0.70 0.00 (0.00–5.21)Hip Arthroplasty (HPRO) 0 0.66 0.00 (0.00–5.59)Abdominal Hysterectomy (HYST) 0 0.12 0.00 (0.00–29.67)Colon surgery (COLO) 3 1.28 2.35 (0.47–6.85)
NAZARETH HOSPITAL (11919)Cardiac (CARD) . . .Cardiac Bypass — Single Incision (CBGC) . . .Cardiac Bypass — Dual Incision (CBGB) . . .Knee Arthroplasty (KPRO) 0 1.22 0.00 (0.00–3.02)Hip Arthroplasty (HPRO) 2 1.62 1.23 (0.14–4.45)Abdominal Hysterectomy (HYST) 1 0.35 2.87 (0.04–15.95)Colon surgery (COLO) 3 3.81 0.79 (0.16–2.30)
OHIO VALLEY GENERAL HOSPITAL (12298)Cardiac (CARD) . . .Cardiac Bypass — Single Incision (CBGC) . . .Cardiac Bypass — Dual Incision (CBGB) . . .Knee Arthroplasty (KPRO) 0 0.60 0.00 (0.00–6.16)Hip Arthroplasty (HPRO) 1 0.69 1.46 (0.02–8.12)Abdominal Hysterectomy (HYST) . . .Colon surgery (COLO) 1 1.56 0.64 (0.01–3.56)
Continued on next page . . .
264

Table 4.5.15 – Rate of SSIs (SIR) — All Procedures By Facility (alphabetical order) – Continued from previous page
Number of SSIs Predicted Number of SSIs SIR (95% CI)
OSS ORTHOPAEDIC HOSPITAL (18467)Cardiac (CARD) . . .Cardiac Bypass — Single Incision (CBGC) . . .Cardiac Bypass — Dual Incision (CBGB) . . .Knee Arthroplasty (KPRO) 2 3.13 0.64 (0.07–2.31)Hip Arthroplasty (HPRO) 3 3.22 0.93 (0.19–2.72)Abdominal Hysterectomy (HYST) . . .Colon surgery (COLO) . . .
PALMERTON HOSPITAL (12396)Cardiac (CARD) . . .Cardiac Bypass — Single Incision (CBGC) . . .Cardiac Bypass — Dual Incision (CBGB) . . .Knee Arthroplasty (KPRO) 0 0.29 0.00 (0.00–12.56)Hip Arthroplasty (HPRO) 0 0.28 0.00 (0.00–12.99)Abdominal Hysterectomy (HYST) . . .Colon surgery (COLO) 5 1.73 2.90 (0.93–6.76)
PENN HIGHLANDS BROOKVILLE (12418)Cardiac (CARD) . . .Cardiac Bypass — Single Incision (CBGC) . . .Cardiac Bypass — Dual Incision (CBGB) . . .Knee Arthroplasty (KPRO) . . .Hip Arthroplasty (HPRO) . . .Abdominal Hysterectomy (HYST) . . .Colon surgery (COLO) 0 0.17 0.00 (0.00–21.56)
PENN HIGHLANDS CLEARFIELD (11843)Cardiac (CARD) . . .Cardiac Bypass — Single Incision (CBGC) . . .Cardiac Bypass — Dual Incision (CBGB) . . .Knee Arthroplasty (KPRO) 0 0.36 0.00 (0.00–10.20)Hip Arthroplasty (HPRO) 0 0.35 0.00 (0.00–10.38)Abdominal Hysterectomy (HYST) 0 0.23 0.00 (0.00–15.78)Colon surgery (COLO) 1 1.47 0.68 (0.01–3.78)
PENN HIGHLANDS DUBOIS (11606)Cardiac (CARD) 0 0.21 0.00 (0.00–17.80)Cardiac Bypass — Single Incision (CBGC) 0 0.03 0.00 (0.00–106.99)Cardiac Bypass — Dual Incision (CBGB) 0 1.40 0.00 (0.00–2.62)Knee Arthroplasty (KPRO) 0 0.86 0.00 (0.00–4.28)Hip Arthroplasty (HPRO) 1 1.20 0.83 (0.01–4.63)Abdominal Hysterectomy (HYST) 1 1.35 0.74 (0.01–4.11)Colon surgery (COLO) 5 3.80 1.32 (0.42–3.07)
PENN HIGHLANDS ELK (11859)Cardiac (CARD) . . .Cardiac Bypass — Single Incision (CBGC) . . .Cardiac Bypass — Dual Incision (CBGB) . . .Knee Arthroplasty (KPRO) 1 0.40 2.49 (0.03–13.84)Hip Arthroplasty (HPRO) 0 0.28 0.00 (0.00–13.16)Abdominal Hysterectomy (HYST) 0 0.33 0.00 (0.00–11.25)Colon surgery (COLO) 2 0.73 2.73 (0.31–9.87)
PENN PRESBYTERIAN MEDICAL CENTER (11814)Cardiac (CARD) 4 2.67 1.50 (0.40–3.84)Cardiac Bypass — Single Incision (CBGC) 0 0.16 0.00 (0.00–23.02)Cardiac Bypass — Dual Incision (CBGB) 11 3.04 3.61 (1.80–6.47)Knee Arthroplasty (KPRO) 10 5.46 1.83 (0.88–3.37)Hip Arthroplasty (HPRO) 7 6.55 1.07 (0.43–2.20)Abdominal Hysterectomy (HYST) 1 0.27 3.71 (0.05–20.67)Colon surgery (COLO) 4 5.89 0.68 (0.18–1.74)
Continued on next page . . .
265

Table 4.5.15 – Rate of SSIs (SIR) — All Procedures By Facility (alphabetical order) – Continued from previous page
Number of SSIs Predicted Number of SSIs SIR (95% CI)
PENNSYLVANIA HOSPITAL OF THE UNIVERSITY OF PA HEALTH SYS (11448)Cardiac (CARD) 0 0.33 0.00 (0.00–11.11)Cardiac Bypass — Single Incision (CBGC) 1 0.08 11.92 (0.16–66.30)Cardiac Bypass — Dual Incision (CBGB) 1 0.82 1.22 (0.02–6.79)Knee Arthroplasty (KPRO) 6 3.45 1.74 (0.64–3.79)Hip Arthroplasty (HPRO) 4 6.57 0.61 (0.16–1.56)Abdominal Hysterectomy (HYST) 8 6.85 1.17 (0.50–2.30)Colon surgery (COLO) 8 9.77 0.82 (0.35–1.61)
PHOENIXVILLE HOSPITAL COMPANY LLC (11836)Cardiac (CARD) 0 0.17 0.00 (0.00–22.17)Cardiac Bypass — Single Incision (CBGC) 0 0.03 0.00 (0.00–117.32)Cardiac Bypass — Dual Incision (CBGB) 0 0.87 0.00 (0.00–4.24)Knee Arthroplasty (KPRO) 0 1.08 0.00 (0.00–3.39)Hip Arthroplasty (HPRO) 0 1.48 0.00 (0.00–2.48)Abdominal Hysterectomy (HYST) 1 1.90 0.53 (0.01–2.93)Colon surgery (COLO) 6 5.29 1.14 (0.41–2.47)
PHYSICIANS CARE SURGICAL HOSPITAL (19630)Cardiac (CARD) . . .Cardiac Bypass — Single Incision (CBGC) . . .Cardiac Bypass — Dual Incision (CBGB) . . .Knee Arthroplasty (KPRO) 1 1.74 0.58 (0.01–3.20)Hip Arthroplasty (HPRO) 0 1.94 0.00 (0.00–1.89)Abdominal Hysterectomy (HYST) 0 0.19 0.00 (0.00–19.10)Colon surgery (COLO) . . .
PINNACLE HEALTH HOSPITALS - COMMUNITY GENERAL OSTEOPATHIC HOSPITAL (34069)Cardiac (CARD) . . .Cardiac Bypass — Single Incision (CBGC) . . .Cardiac Bypass — Dual Incision (CBGB) . . .Knee Arthroplasty (KPRO) 1 3.07 0.33 (0.00–1.81)Hip Arthroplasty (HPRO) 4 4.56 0.88 (0.24–2.25)Abdominal Hysterectomy (HYST) 0 0.40 0.00 (0.00–9.12)Colon surgery (COLO) 6 5.32 1.13 (0.41–2.45)
PINNACLE HEALTH HOSPITALS - HARRISBURG HOSPITAL (34068)Cardiac (CARD) 0 2.53 0.00 (0.00–1.45)Cardiac Bypass — Single Incision (CBGC) 0 0.38 0.00 (0.00–9.70)Cardiac Bypass — Dual Incision (CBGB) 0 3.06 0.00 (0.00–1.20)Knee Arthroplasty (KPRO) 0 3.73 0.00 (0.00–0.98)Hip Arthroplasty (HPRO) 12 4.25 2.82 (1.46–4.93)Abdominal Hysterectomy (HYST) 3 5.90 0.51 (0.10–1.49)Colon surgery (COLO) 11 13.23 0.83 (0.41–1.49)
POCONO MEDICAL CENTER (11772)Cardiac (CARD) 0 0.25 0.00 (0.00–14.50)Cardiac Bypass — Single Incision (CBGC) 0 0.03 0.00 (0.00–106.99)Cardiac Bypass — Dual Incision (CBGB) 3 1.37 2.19 (0.44–6.40)Knee Arthroplasty (KPRO) 1 0.54 1.85 (0.02–10.27)Hip Arthroplasty (HPRO) 2 1.50 1.33 (0.15–4.82)Abdominal Hysterectomy (HYST) 0 1.53 0.00 (0.00–2.39)Colon surgery (COLO) 13 7.10 1.83 (0.97–3.13)
POTTSTOWN MEMORIAL MEDICAL CENTER (11983)Cardiac (CARD) . . .Cardiac Bypass — Single Incision (CBGC) . . .Cardiac Bypass — Dual Incision (CBGB) . . .Knee Arthroplasty (KPRO) 1 1.30 0.77 (0.01–4.27)Hip Arthroplasty (HPRO) 1 1.49 0.67 (0.01–3.72)Abdominal Hysterectomy (HYST) 0 0.33 0.00 (0.00–11.06)Colon surgery (COLO) 4 1.38 2.89 (0.78–7.40)
Continued on next page . . .
266
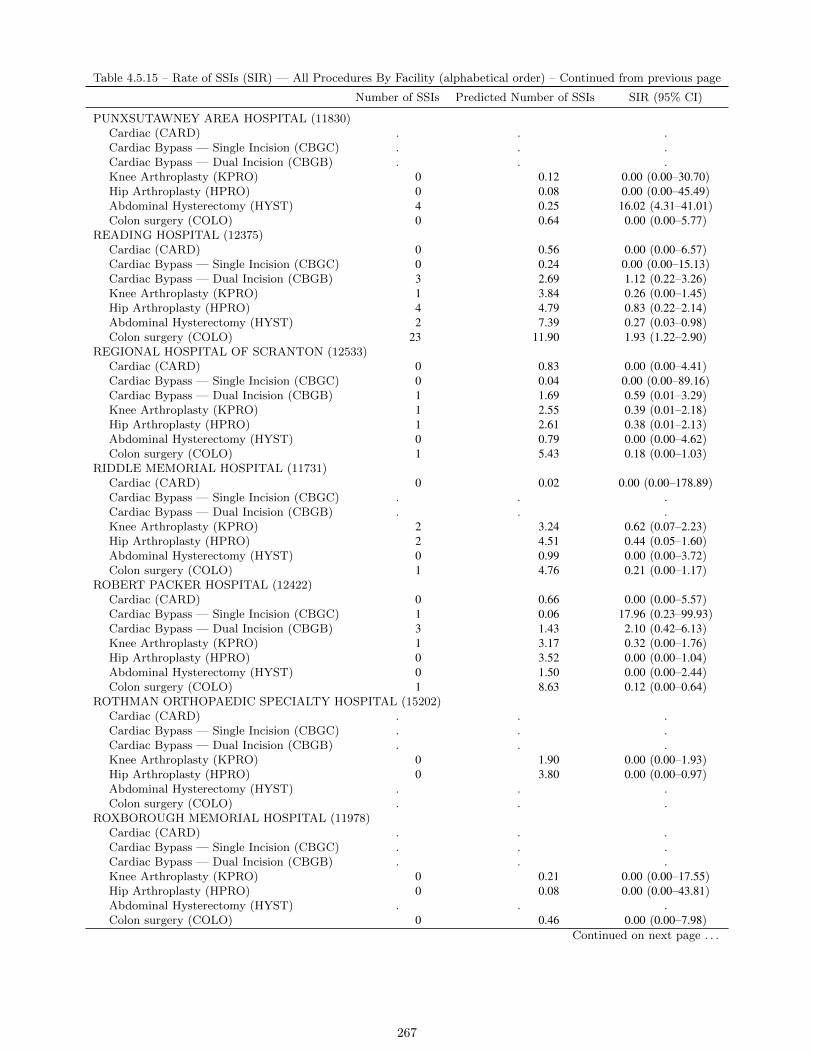
Table 4.5.15 – Rate of SSIs (SIR) — All Procedures By Facility (alphabetical order) – Continued from previous page
Number of SSIs Predicted Number of SSIs SIR (95% CI)
PUNXSUTAWNEY AREA HOSPITAL (11830)Cardiac (CARD) . . .Cardiac Bypass — Single Incision (CBGC) . . .Cardiac Bypass — Dual Incision (CBGB) . . .Knee Arthroplasty (KPRO) 0 0.12 0.00 (0.00–30.70)Hip Arthroplasty (HPRO) 0 0.08 0.00 (0.00–45.49)Abdominal Hysterectomy (HYST) 4 0.25 16.02 (4.31–41.01)Colon surgery (COLO) 0 0.64 0.00 (0.00–5.77)
READING HOSPITAL (12375)Cardiac (CARD) 0 0.56 0.00 (0.00–6.57)Cardiac Bypass — Single Incision (CBGC) 0 0.24 0.00 (0.00–15.13)Cardiac Bypass — Dual Incision (CBGB) 3 2.69 1.12 (0.22–3.26)Knee Arthroplasty (KPRO) 1 3.84 0.26 (0.00–1.45)Hip Arthroplasty (HPRO) 4 4.79 0.83 (0.22–2.14)Abdominal Hysterectomy (HYST) 2 7.39 0.27 (0.03–0.98)Colon surgery (COLO) 23 11.90 1.93 (1.22–2.90)
REGIONAL HOSPITAL OF SCRANTON (12533)Cardiac (CARD) 0 0.83 0.00 (0.00–4.41)Cardiac Bypass — Single Incision (CBGC) 0 0.04 0.00 (0.00–89.16)Cardiac Bypass — Dual Incision (CBGB) 1 1.69 0.59 (0.01–3.29)Knee Arthroplasty (KPRO) 1 2.55 0.39 (0.01–2.18)Hip Arthroplasty (HPRO) 1 2.61 0.38 (0.01–2.13)Abdominal Hysterectomy (HYST) 0 0.79 0.00 (0.00–4.62)Colon surgery (COLO) 1 5.43 0.18 (0.00–1.03)
RIDDLE MEMORIAL HOSPITAL (11731)Cardiac (CARD) 0 0.02 0.00 (0.00–178.89)Cardiac Bypass — Single Incision (CBGC) . . .Cardiac Bypass — Dual Incision (CBGB) . . .Knee Arthroplasty (KPRO) 2 3.24 0.62 (0.07–2.23)Hip Arthroplasty (HPRO) 2 4.51 0.44 (0.05–1.60)Abdominal Hysterectomy (HYST) 0 0.99 0.00 (0.00–3.72)Colon surgery (COLO) 1 4.76 0.21 (0.00–1.17)
ROBERT PACKER HOSPITAL (12422)Cardiac (CARD) 0 0.66 0.00 (0.00–5.57)Cardiac Bypass — Single Incision (CBGC) 1 0.06 17.96 (0.23–99.93)Cardiac Bypass — Dual Incision (CBGB) 3 1.43 2.10 (0.42–6.13)Knee Arthroplasty (KPRO) 1 3.17 0.32 (0.00–1.76)Hip Arthroplasty (HPRO) 0 3.52 0.00 (0.00–1.04)Abdominal Hysterectomy (HYST) 0 1.50 0.00 (0.00–2.44)Colon surgery (COLO) 1 8.63 0.12 (0.00–0.64)
ROTHMAN ORTHOPAEDIC SPECIALTY HOSPITAL (15202)Cardiac (CARD) . . .Cardiac Bypass — Single Incision (CBGC) . . .Cardiac Bypass — Dual Incision (CBGB) . . .Knee Arthroplasty (KPRO) 0 1.90 0.00 (0.00–1.93)Hip Arthroplasty (HPRO) 0 3.80 0.00 (0.00–0.97)Abdominal Hysterectomy (HYST) . . .Colon surgery (COLO) . . .
ROXBOROUGH MEMORIAL HOSPITAL (11978)Cardiac (CARD) . . .Cardiac Bypass — Single Incision (CBGC) . . .Cardiac Bypass — Dual Incision (CBGB) . . .Knee Arthroplasty (KPRO) 0 0.21 0.00 (0.00–17.55)Hip Arthroplasty (HPRO) 0 0.08 0.00 (0.00–43.81)Abdominal Hysterectomy (HYST) . . .Colon surgery (COLO) 0 0.46 0.00 (0.00–7.98)
Continued on next page . . .
267

Table 4.5.15 – Rate of SSIs (SIR) — All Procedures By Facility (alphabetical order) – Continued from previous page
Number of SSIs Predicted Number of SSIs SIR (95% CI)
SACRED HEART HOSPITAL (11684)Cardiac (CARD) . . .Cardiac Bypass — Single Incision (CBGC) . . .Cardiac Bypass — Dual Incision (CBGB) . . .Knee Arthroplasty (KPRO) 0 0.40 0.00 (0.00–9.16)Hip Arthroplasty (HPRO) 0 1.12 0.00 (0.00–3.27)Abdominal Hysterectomy (HYST) 1 1.68 0.60 (0.01–3.32)Colon surgery (COLO) 0 0.41 0.00 (0.00–9.05)
SAINT VINCENT HOSPITAL (11699)Cardiac (CARD) 1 0.89 1.12 (0.01–6.24)Cardiac Bypass — Single Incision (CBGC) 0 0.06 0.00 (0.00–65.88)Cardiac Bypass — Dual Incision (CBGB) 1 3.49 0.29 (0.00–1.60)Knee Arthroplasty (KPRO) 1 2.07 0.48 (0.01–2.69)Hip Arthroplasty (HPRO) 2 3.68 0.54 (0.06–1.96)Abdominal Hysterectomy (HYST) 0 1.54 0.00 (0.00–2.39)Colon surgery (COLO) 22 9.29 2.37 (1.48–3.58)
SCHUYLKILL MEDICAL CENTER - EAST NORWEGIAN STREET (11922)Cardiac (CARD) . . .Cardiac Bypass — Single Incision (CBGC) . . .Cardiac Bypass — Dual Incision (CBGB) . . .Knee Arthroplasty (KPRO) 0 0.45 0.00 (0.00–8.22)Hip Arthroplasty (HPRO) 0 0.72 0.00 (0.00–5.10)Abdominal Hysterectomy (HYST) . . .Colon surgery (COLO) 2 3.06 0.65 (0.07–2.36)
SCHUYLKILL MEDICAL CENTER - SOUTH JACKSON STREET (12087)Cardiac (CARD) . . .Cardiac Bypass — Single Incision (CBGC) . . .Cardiac Bypass — Dual Incision (CBGB) . . .Knee Arthroplasty (KPRO) 0 0.32 0.00 (0.00–11.35)Hip Arthroplasty (HPRO) 2 0.41 4.85 (0.54–17.50)Abdominal Hysterectomy (HYST) 4 2.49 1.61 (0.43–4.12)Colon surgery (COLO) 2 2.68 0.75 (0.08–2.69)
SHARON REGIONAL HEALTH SYSTEM (12250)Cardiac (CARD) 0 0.05 0.00 (0.00–66.90)Cardiac Bypass — Single Incision (CBGC) 0 0.01 0.00 (0.00–534.93)Cardiac Bypass — Dual Incision (CBGB) 1 0.33 3.05 (0.04–16.97)Knee Arthroplasty (KPRO) 0 1.37 0.00 (0.00–2.67)Hip Arthroplasty (HPRO) 2 2.10 0.95 (0.11–3.43)Abdominal Hysterectomy (HYST) 0 0.19 0.00 (0.00–19.52)Colon surgery (COLO) 5 3.03 1.65 (0.53–3.85)
SHRINERS HOSPITALS FOR CHILDREN - PHILA (12244)Cardiac (CARD) . . .Cardiac Bypass — Single Incision (CBGC) . . .Cardiac Bypass — Dual Incision (CBGB) . . .Knee Arthroplasty (KPRO) . . .Hip Arthroplasty (HPRO) 0 0.04 0.00 (0.00–98.77)Abdominal Hysterectomy (HYST) . . .Colon surgery (COLO) . . .
SOLDIERS AND SAILORS MEMORIAL HOSPITAL (11688)Cardiac (CARD) . . .Cardiac Bypass — Single Incision (CBGC) . . .Cardiac Bypass — Dual Incision (CBGB) . . .Knee Arthroplasty (KPRO) 0 0.42 0.00 (0.00–8.69)Hip Arthroplasty (HPRO) 1 0.46 2.18 (0.03–12.13)Abdominal Hysterectomy (HYST) 2 0.53 3.77 (0.42–13.61)Colon surgery (COLO) 0 0.72 0.00 (0.00–5.10)
Continued on next page . . .
268

Table 4.5.15 – Rate of SSIs (SIR) — All Procedures By Facility (alphabetical order) – Continued from previous page
Number of SSIs Predicted Number of SSIs SIR (95% CI)
SOMERSET HOSPITAL (12282)Cardiac (CARD) . . .Cardiac Bypass — Single Incision (CBGC) . . .Cardiac Bypass — Dual Incision (CBGB) . . .Knee Arthroplasty (KPRO) 0 0.26 0.00 (0.00–14.05)Hip Arthroplasty (HPRO) 0 0.57 0.00 (0.00–6.39)Abdominal Hysterectomy (HYST) 0 0.35 0.00 (0.00–10.63)Colon surgery (COLO) 0 2.73 0.00 (0.00–1.35)
SOUTHWEST REGIONAL MEDICAL CENTER (11942)Cardiac (CARD) . . .Cardiac Bypass — Single Incision (CBGC) . . .Cardiac Bypass — Dual Incision (CBGB) . . .Knee Arthroplasty (KPRO) 0 0.09 0.00 (0.00–42.18)Hip Arthroplasty (HPRO) 1 0.13 7.86 (0.10–43.73)Abdominal Hysterectomy (HYST) . . .Colon surgery (COLO) . . .
ST. CHRISTOPHERS HOSPITAL FOR CHILDREN (12290)Cardiac (CARD) 3 0.40 7.56 (1.52–22.10)Cardiac Bypass — Single Incision (CBGC) . . .Cardiac Bypass — Dual Incision (CBGB) . . .Knee Arthroplasty (KPRO) . . .Hip Arthroplasty (HPRO) . . .Abdominal Hysterectomy (HYST) . . .Colon surgery (COLO) 1 1.37 0.73 (0.01–4.05)
ST. CLAIR MEMORIAL HOSPITAL (10561)Cardiac (CARD) 0 0.22 0.00 (0.00–16.75)Cardiac Bypass — Single Incision (CBGC) 0 0.03 0.00 (0.00–133.73)Cardiac Bypass — Dual Incision (CBGB) 0 1.28 0.00 (0.00–2.86)Knee Arthroplasty (KPRO) 4 3.84 1.04 (0.28–2.67)Hip Arthroplasty (HPRO) 2 4.54 0.44 (0.05–1.59)Abdominal Hysterectomy (HYST) 0 1.23 0.00 (0.00–2.98)Colon surgery (COLO) 10 9.11 1.10 (0.53–2.02)
ST. JOSEPH MEDICAL CTR (11961)Cardiac (CARD) 0 0.50 0.00 (0.00–7.38)Cardiac Bypass — Single Incision (CBGC) 1 0.06 17.96 (0.23–99.93)Cardiac Bypass — Dual Incision (CBGB) 2 1.36 1.47 (0.17–5.30)Knee Arthroplasty (KPRO) 3 0.68 4.44 (0.89–12.96)Hip Arthroplasty (HPRO) 1 1.23 0.81 (0.01–4.53)Abdominal Hysterectomy (HYST) 1 0.70 1.42 (0.02–7.89)Colon surgery (COLO) 1 2.66 0.38 (0.00–2.09)
ST. JOSEPHS HOSPITAL (12438)Cardiac (CARD) . . .Cardiac Bypass — Single Incision (CBGC) . . .Cardiac Bypass — Dual Incision (CBGB) . . .Knee Arthroplasty (KPRO) 1 0.02 46.39 (0.61–258.13)Hip Arthroplasty (HPRO) . . .Abdominal Hysterectomy (HYST) 0 0.06 0.00 (0.00–60.05)Colon surgery (COLO) 1 0.42 2.41 (0.03–13.40)
ST. LUKES HOSPITAL BETHLEHEM (11718)Cardiac (CARD) 0 0.97 0.00 (0.00–3.79)Cardiac Bypass — Single Incision (CBGC) 0 0.07 0.00 (0.00–55.27)Cardiac Bypass — Dual Incision (CBGB) 0 2.32 0.00 (0.00–1.58)Knee Arthroplasty (KPRO) 3 3.08 0.97 (0.20–2.85)Hip Arthroplasty (HPRO) 4 4.20 0.95 (0.26–2.44)Abdominal Hysterectomy (HYST) 4 2.65 1.51 (0.41–3.86)Colon surgery (COLO) 7 11.19 0.63 (0.25–1.29)
Continued on next page . . .
269
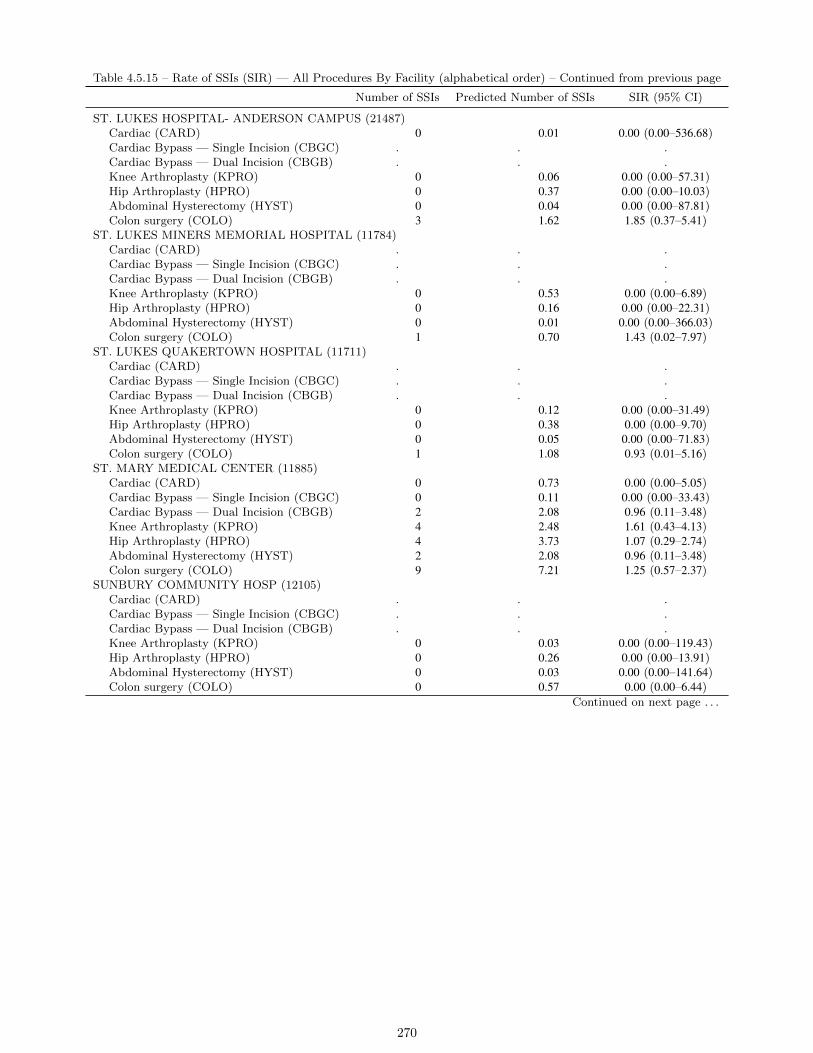
Table 4.5.15 – Rate of SSIs (SIR) — All Procedures By Facility (alphabetical order) – Continued from previous page
Number of SSIs Predicted Number of SSIs SIR (95% CI)
ST. LUKES HOSPITAL- ANDERSON CAMPUS (21487)Cardiac (CARD) 0 0.01 0.00 (0.00–536.68)Cardiac Bypass — Single Incision (CBGC) . . .Cardiac Bypass — Dual Incision (CBGB) . . .Knee Arthroplasty (KPRO) 0 0.06 0.00 (0.00–57.31)Hip Arthroplasty (HPRO) 0 0.37 0.00 (0.00–10.03)Abdominal Hysterectomy (HYST) 0 0.04 0.00 (0.00–87.81)Colon surgery (COLO) 3 1.62 1.85 (0.37–5.41)
ST. LUKES MINERS MEMORIAL HOSPITAL (11784)Cardiac (CARD) . . .Cardiac Bypass — Single Incision (CBGC) . . .Cardiac Bypass — Dual Incision (CBGB) . . .Knee Arthroplasty (KPRO) 0 0.53 0.00 (0.00–6.89)Hip Arthroplasty (HPRO) 0 0.16 0.00 (0.00–22.31)Abdominal Hysterectomy (HYST) 0 0.01 0.00 (0.00–366.03)Colon surgery (COLO) 1 0.70 1.43 (0.02–7.97)
ST. LUKES QUAKERTOWN HOSPITAL (11711)Cardiac (CARD) . . .Cardiac Bypass — Single Incision (CBGC) . . .Cardiac Bypass — Dual Incision (CBGB) . . .Knee Arthroplasty (KPRO) 0 0.12 0.00 (0.00–31.49)Hip Arthroplasty (HPRO) 0 0.38 0.00 (0.00–9.70)Abdominal Hysterectomy (HYST) 0 0.05 0.00 (0.00–71.83)Colon surgery (COLO) 1 1.08 0.93 (0.01–5.16)
ST. MARY MEDICAL CENTER (11885)Cardiac (CARD) 0 0.73 0.00 (0.00–5.05)Cardiac Bypass — Single Incision (CBGC) 0 0.11 0.00 (0.00–33.43)Cardiac Bypass — Dual Incision (CBGB) 2 2.08 0.96 (0.11–3.48)Knee Arthroplasty (KPRO) 4 2.48 1.61 (0.43–4.13)Hip Arthroplasty (HPRO) 4 3.73 1.07 (0.29–2.74)Abdominal Hysterectomy (HYST) 2 2.08 0.96 (0.11–3.48)Colon surgery (COLO) 9 7.21 1.25 (0.57–2.37)
SUNBURY COMMUNITY HOSP (12105)Cardiac (CARD) . . .Cardiac Bypass — Single Incision (CBGC) . . .Cardiac Bypass — Dual Incision (CBGB) . . .Knee Arthroplasty (KPRO) 0 0.03 0.00 (0.00–119.43)Hip Arthroplasty (HPRO) 0 0.26 0.00 (0.00–13.91)Abdominal Hysterectomy (HYST) 0 0.03 0.00 (0.00–141.64)Colon surgery (COLO) 0 0.57 0.00 (0.00–6.44)
Continued on next page . . .
270
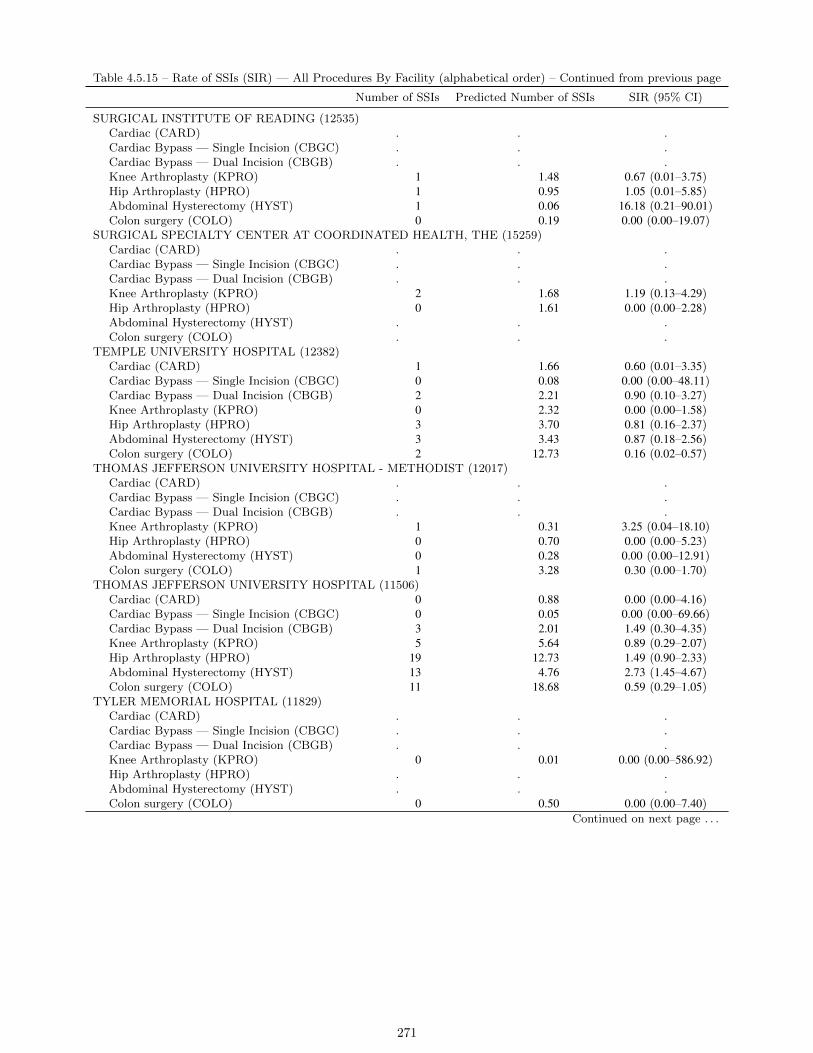
Table 4.5.15 – Rate of SSIs (SIR) — All Procedures By Facility (alphabetical order) – Continued from previous page
Number of SSIs Predicted Number of SSIs SIR (95% CI)
SURGICAL INSTITUTE OF READING (12535)Cardiac (CARD) . . .Cardiac Bypass — Single Incision (CBGC) . . .Cardiac Bypass — Dual Incision (CBGB) . . .Knee Arthroplasty (KPRO) 1 1.48 0.67 (0.01–3.75)Hip Arthroplasty (HPRO) 1 0.95 1.05 (0.01–5.85)Abdominal Hysterectomy (HYST) 1 0.06 16.18 (0.21–90.01)Colon surgery (COLO) 0 0.19 0.00 (0.00–19.07)
SURGICAL SPECIALTY CENTER AT COORDINATED HEALTH, THE (15259)Cardiac (CARD) . . .Cardiac Bypass — Single Incision (CBGC) . . .Cardiac Bypass — Dual Incision (CBGB) . . .Knee Arthroplasty (KPRO) 2 1.68 1.19 (0.13–4.29)Hip Arthroplasty (HPRO) 0 1.61 0.00 (0.00–2.28)Abdominal Hysterectomy (HYST) . . .Colon surgery (COLO) . . .
TEMPLE UNIVERSITY HOSPITAL (12382)Cardiac (CARD) 1 1.66 0.60 (0.01–3.35)Cardiac Bypass — Single Incision (CBGC) 0 0.08 0.00 (0.00–48.11)Cardiac Bypass — Dual Incision (CBGB) 2 2.21 0.90 (0.10–3.27)Knee Arthroplasty (KPRO) 0 2.32 0.00 (0.00–1.58)Hip Arthroplasty (HPRO) 3 3.70 0.81 (0.16–2.37)Abdominal Hysterectomy (HYST) 3 3.43 0.87 (0.18–2.56)Colon surgery (COLO) 2 12.73 0.16 (0.02–0.57)
THOMAS JEFFERSON UNIVERSITY HOSPITAL - METHODIST (12017)Cardiac (CARD) . . .Cardiac Bypass — Single Incision (CBGC) . . .Cardiac Bypass — Dual Incision (CBGB) . . .Knee Arthroplasty (KPRO) 1 0.31 3.25 (0.04–18.10)Hip Arthroplasty (HPRO) 0 0.70 0.00 (0.00–5.23)Abdominal Hysterectomy (HYST) 0 0.28 0.00 (0.00–12.91)Colon surgery (COLO) 1 3.28 0.30 (0.00–1.70)
THOMAS JEFFERSON UNIVERSITY HOSPITAL (11506)Cardiac (CARD) 0 0.88 0.00 (0.00–4.16)Cardiac Bypass — Single Incision (CBGC) 0 0.05 0.00 (0.00–69.66)Cardiac Bypass — Dual Incision (CBGB) 3 2.01 1.49 (0.30–4.35)Knee Arthroplasty (KPRO) 5 5.64 0.89 (0.29–2.07)Hip Arthroplasty (HPRO) 19 12.73 1.49 (0.90–2.33)Abdominal Hysterectomy (HYST) 13 4.76 2.73 (1.45–4.67)Colon surgery (COLO) 11 18.68 0.59 (0.29–1.05)
TYLER MEMORIAL HOSPITAL (11829)Cardiac (CARD) . . .Cardiac Bypass — Single Incision (CBGC) . . .Cardiac Bypass — Dual Incision (CBGB) . . .Knee Arthroplasty (KPRO) 0 0.01 0.00 (0.00–586.92)Hip Arthroplasty (HPRO) . . .Abdominal Hysterectomy (HYST) . . .Colon surgery (COLO) 0 0.50 0.00 (0.00–7.40)
Continued on next page . . .
271
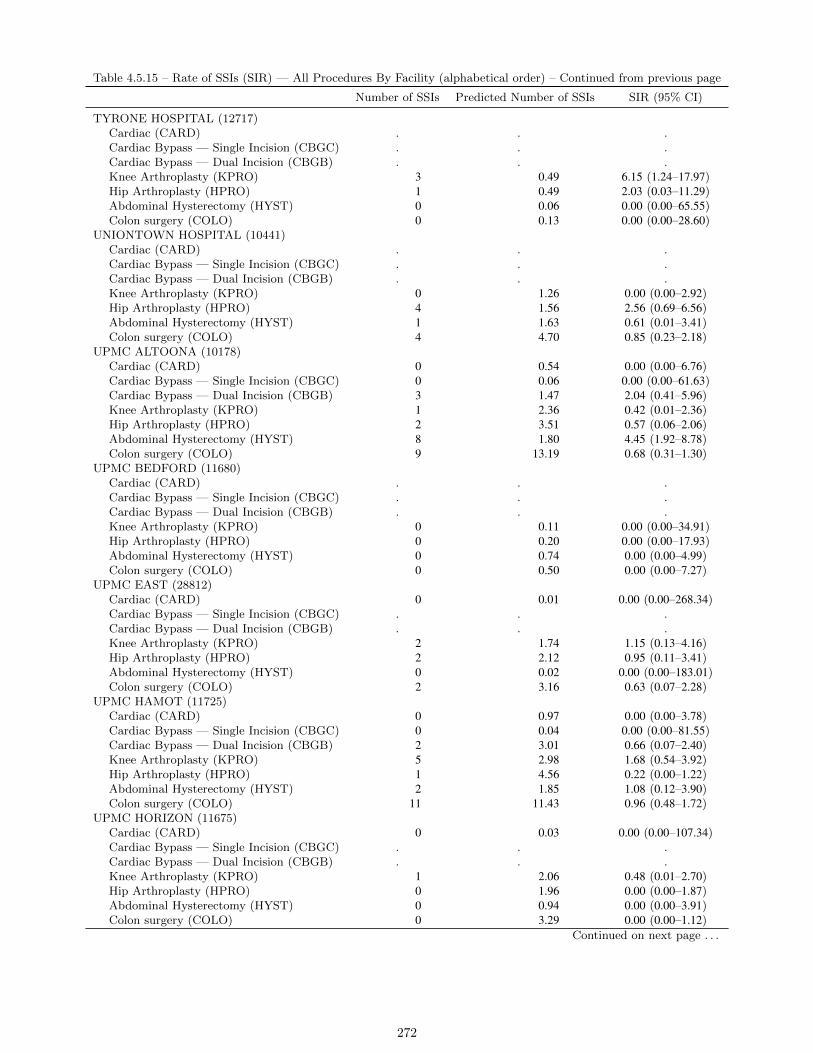
Table 4.5.15 – Rate of SSIs (SIR) — All Procedures By Facility (alphabetical order) – Continued from previous page
Number of SSIs Predicted Number of SSIs SIR (95% CI)
TYRONE HOSPITAL (12717)Cardiac (CARD) . . .Cardiac Bypass — Single Incision (CBGC) . . .Cardiac Bypass — Dual Incision (CBGB) . . .Knee Arthroplasty (KPRO) 3 0.49 6.15 (1.24–17.97)Hip Arthroplasty (HPRO) 1 0.49 2.03 (0.03–11.29)Abdominal Hysterectomy (HYST) 0 0.06 0.00 (0.00–65.55)Colon surgery (COLO) 0 0.13 0.00 (0.00–28.60)
UNIONTOWN HOSPITAL (10441)Cardiac (CARD) . . .Cardiac Bypass — Single Incision (CBGC) . . .Cardiac Bypass — Dual Incision (CBGB) . . .Knee Arthroplasty (KPRO) 0 1.26 0.00 (0.00–2.92)Hip Arthroplasty (HPRO) 4 1.56 2.56 (0.69–6.56)Abdominal Hysterectomy (HYST) 1 1.63 0.61 (0.01–3.41)Colon surgery (COLO) 4 4.70 0.85 (0.23–2.18)
UPMC ALTOONA (10178)Cardiac (CARD) 0 0.54 0.00 (0.00–6.76)Cardiac Bypass — Single Incision (CBGC) 0 0.06 0.00 (0.00–61.63)Cardiac Bypass — Dual Incision (CBGB) 3 1.47 2.04 (0.41–5.96)Knee Arthroplasty (KPRO) 1 2.36 0.42 (0.01–2.36)Hip Arthroplasty (HPRO) 2 3.51 0.57 (0.06–2.06)Abdominal Hysterectomy (HYST) 8 1.80 4.45 (1.92–8.78)Colon surgery (COLO) 9 13.19 0.68 (0.31–1.30)
UPMC BEDFORD (11680)Cardiac (CARD) . . .Cardiac Bypass — Single Incision (CBGC) . . .Cardiac Bypass — Dual Incision (CBGB) . . .Knee Arthroplasty (KPRO) 0 0.11 0.00 (0.00–34.91)Hip Arthroplasty (HPRO) 0 0.20 0.00 (0.00–17.93)Abdominal Hysterectomy (HYST) 0 0.74 0.00 (0.00–4.99)Colon surgery (COLO) 0 0.50 0.00 (0.00–7.27)
UPMC EAST (28812)Cardiac (CARD) 0 0.01 0.00 (0.00–268.34)Cardiac Bypass — Single Incision (CBGC) . . .Cardiac Bypass — Dual Incision (CBGB) . . .Knee Arthroplasty (KPRO) 2 1.74 1.15 (0.13–4.16)Hip Arthroplasty (HPRO) 2 2.12 0.95 (0.11–3.41)Abdominal Hysterectomy (HYST) 0 0.02 0.00 (0.00–183.01)Colon surgery (COLO) 2 3.16 0.63 (0.07–2.28)
UPMC HAMOT (11725)Cardiac (CARD) 0 0.97 0.00 (0.00–3.78)Cardiac Bypass — Single Incision (CBGC) 0 0.04 0.00 (0.00–81.55)Cardiac Bypass — Dual Incision (CBGB) 2 3.01 0.66 (0.07–2.40)Knee Arthroplasty (KPRO) 5 2.98 1.68 (0.54–3.92)Hip Arthroplasty (HPRO) 1 4.56 0.22 (0.00–1.22)Abdominal Hysterectomy (HYST) 2 1.85 1.08 (0.12–3.90)Colon surgery (COLO) 11 11.43 0.96 (0.48–1.72)
UPMC HORIZON (11675)Cardiac (CARD) 0 0.03 0.00 (0.00–107.34)Cardiac Bypass — Single Incision (CBGC) . . .Cardiac Bypass — Dual Incision (CBGB) . . .Knee Arthroplasty (KPRO) 1 2.06 0.48 (0.01–2.70)Hip Arthroplasty (HPRO) 0 1.96 0.00 (0.00–1.87)Abdominal Hysterectomy (HYST) 0 0.94 0.00 (0.00–3.91)Colon surgery (COLO) 0 3.29 0.00 (0.00–1.12)
Continued on next page . . .
272

Table 4.5.15 – Rate of SSIs (SIR) — All Procedures By Facility (alphabetical order) – Continued from previous page
Number of SSIs Predicted Number of SSIs SIR (95% CI)
UPMC MCKEESPORT (11707)Cardiac (CARD) 0 0.01 0.00 (0.00–536.68)Cardiac Bypass — Single Incision (CBGC) . . .Cardiac Bypass — Dual Incision (CBGB) . . .Knee Arthroplasty (KPRO) 1 0.49 2.02 (0.03–11.24)Hip Arthroplasty (HPRO) 0 0.70 0.00 (0.00–5.26)Abdominal Hysterectomy (HYST) 1 0.59 1.69 (0.02–9.41)Colon surgery (COLO) 0 2.86 0.00 (0.00–1.28)
UPMC MERCY (10384)Cardiac (CARD) 1 0.69 1.45 (0.02–8.06)Cardiac Bypass — Single Incision (CBGC) 0 0.06 0.00 (0.00–61.63)Cardiac Bypass — Dual Incision (CBGB) 0 1.74 0.00 (0.00–2.11)Knee Arthroplasty (KPRO) 1 1.35 0.74 (0.01–4.13)Hip Arthroplasty (HPRO) 4 1.91 2.10 (0.56–5.37)Abdominal Hysterectomy (HYST) 4 3.52 1.14 (0.31–2.91)Colon surgery (COLO) 23 8.40 2.74 (1.73–4.11)
UPMC NORTHWEST (11837)Cardiac (CARD) . . .Cardiac Bypass — Single Incision (CBGC) . . .Cardiac Bypass — Dual Incision (CBGB) . . .Knee Arthroplasty (KPRO) 0 0.49 0.00 (0.00–7.54)Hip Arthroplasty (HPRO) 3 1.12 2.69 (0.54–7.85)Abdominal Hysterectomy (HYST) 0 0.25 0.00 (0.00–14.53)Colon surgery (COLO) 3 1.75 1.72 (0.35–5.02)
UPMC PASSAVANT (11242)Cardiac (CARD) 1 0.84 1.19 (0.02–6.60)Cardiac Bypass — Single Incision (CBGC) 1 0.18 5.70 (0.07–31.70)Cardiac Bypass — Dual Incision (CBGB) 2 2.73 0.73 (0.08–2.64)Knee Arthroplasty (KPRO) 0 3.75 0.00 (0.00–0.98)Hip Arthroplasty (HPRO) 7 4.72 1.48 (0.59–3.05)Abdominal Hysterectomy (HYST) 1 4.71 0.21 (0.00–1.18)Colon surgery (COLO) 19 23.23 0.82 (0.49–1.28)
UPMC PRESBYTERIAN SHADYSIDE - SHADYSIDE (10118)Cardiac (CARD) 1 3.15 0.32 (0.00–1.77)Cardiac Bypass — Single Incision (CBGC) 0 0.34 0.00 (0.00–10.73)Cardiac Bypass — Dual Incision (CBGB) 3 5.74 0.52 (0.11–1.53)Knee Arthroplasty (KPRO) 10 6.87 1.46 (0.70–2.68)Hip Arthroplasty (HPRO) 19 12.34 1.54 (0.93–2.41)Abdominal Hysterectomy (HYST) 0 1.18 0.00 (0.00–3.12)Colon surgery (COLO) 57 20.68 2.76 (2.09–3.57)
UPMC PRESBYTERIAN SHADYSIDE (10348)Cardiac (CARD) 8 3.28 2.44 (1.05–4.81)Cardiac Bypass — Single Incision (CBGC) 0 0.31 0.00 (0.00–11.98)Cardiac Bypass — Dual Incision (CBGB) 2 3.87 0.52 (0.06–1.86)Knee Arthroplasty (KPRO) 0 0.16 0.00 (0.00–23.21)Hip Arthroplasty (HPRO) 1 1.52 0.66 (0.01–3.66)Abdominal Hysterectomy (HYST) 0 0.11 0.00 (0.00–34.20)Colon surgery (COLO) 30 30.43 0.99 (0.66–1.41)
UPMC ST. MARGARET (11561)Cardiac (CARD) 0 0.05 0.00 (0.00–76.42)Cardiac Bypass — Single Incision (CBGC) . . .Cardiac Bypass — Dual Incision (CBGB) . . .Knee Arthroplasty (KPRO) 1 4.76 0.21 (0.00–1.17)Hip Arthroplasty (HPRO) 4 5.41 0.74 (0.20–1.89)Abdominal Hysterectomy (HYST) 0 0.43 0.00 (0.00–8.59)Colon surgery (COLO) 12 9.95 1.21 (0.62–2.11)
Continued on next page . . .
273
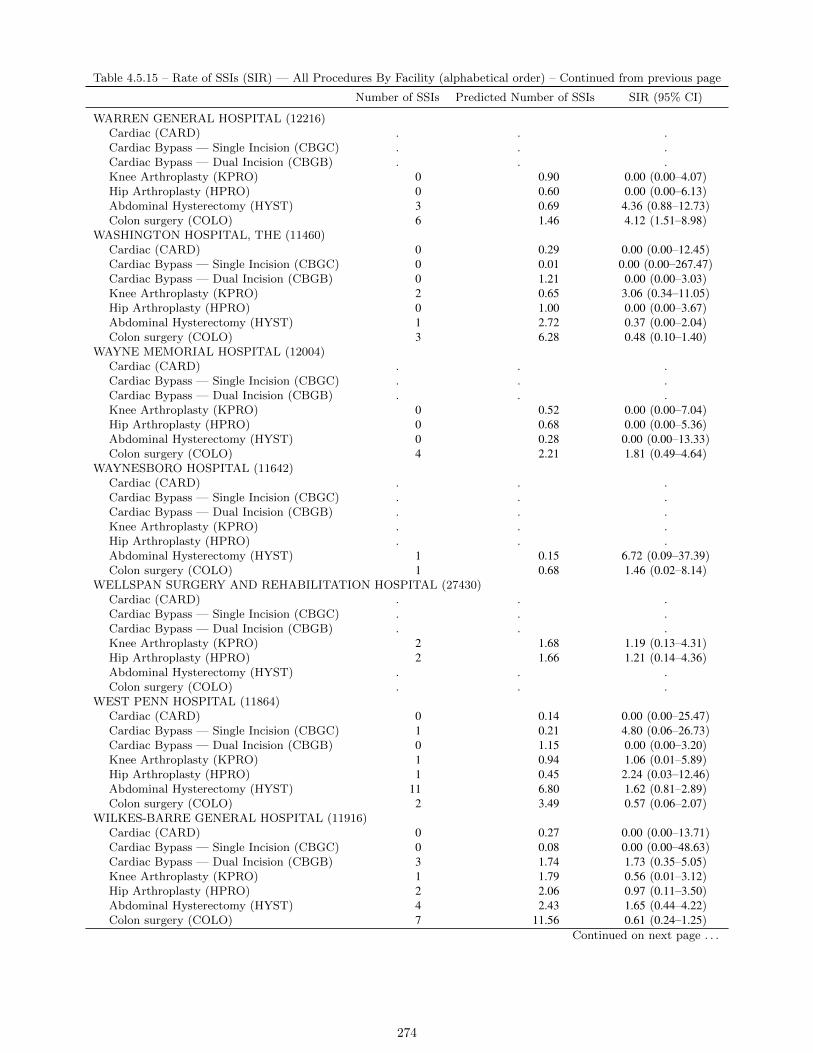
Table 4.5.15 – Rate of SSIs (SIR) — All Procedures By Facility (alphabetical order) – Continued from previous page
Number of SSIs Predicted Number of SSIs SIR (95% CI)
WARREN GENERAL HOSPITAL (12216)Cardiac (CARD) . . .Cardiac Bypass — Single Incision (CBGC) . . .Cardiac Bypass — Dual Incision (CBGB) . . .Knee Arthroplasty (KPRO) 0 0.90 0.00 (0.00–4.07)Hip Arthroplasty (HPRO) 0 0.60 0.00 (0.00–6.13)Abdominal Hysterectomy (HYST) 3 0.69 4.36 (0.88–12.73)Colon surgery (COLO) 6 1.46 4.12 (1.51–8.98)
WASHINGTON HOSPITAL, THE (11460)Cardiac (CARD) 0 0.29 0.00 (0.00–12.45)Cardiac Bypass — Single Incision (CBGC) 0 0.01 0.00 (0.00–267.47)Cardiac Bypass — Dual Incision (CBGB) 0 1.21 0.00 (0.00–3.03)Knee Arthroplasty (KPRO) 2 0.65 3.06 (0.34–11.05)Hip Arthroplasty (HPRO) 0 1.00 0.00 (0.00–3.67)Abdominal Hysterectomy (HYST) 1 2.72 0.37 (0.00–2.04)Colon surgery (COLO) 3 6.28 0.48 (0.10–1.40)
WAYNE MEMORIAL HOSPITAL (12004)Cardiac (CARD) . . .Cardiac Bypass — Single Incision (CBGC) . . .Cardiac Bypass — Dual Incision (CBGB) . . .Knee Arthroplasty (KPRO) 0 0.52 0.00 (0.00–7.04)Hip Arthroplasty (HPRO) 0 0.68 0.00 (0.00–5.36)Abdominal Hysterectomy (HYST) 0 0.28 0.00 (0.00–13.33)Colon surgery (COLO) 4 2.21 1.81 (0.49–4.64)
WAYNESBORO HOSPITAL (11642)Cardiac (CARD) . . .Cardiac Bypass — Single Incision (CBGC) . . .Cardiac Bypass — Dual Incision (CBGB) . . .Knee Arthroplasty (KPRO) . . .Hip Arthroplasty (HPRO) . . .Abdominal Hysterectomy (HYST) 1 0.15 6.72 (0.09–37.39)Colon surgery (COLO) 1 0.68 1.46 (0.02–8.14)
WELLSPAN SURGERY AND REHABILITATION HOSPITAL (27430)Cardiac (CARD) . . .Cardiac Bypass — Single Incision (CBGC) . . .Cardiac Bypass — Dual Incision (CBGB) . . .Knee Arthroplasty (KPRO) 2 1.68 1.19 (0.13–4.31)Hip Arthroplasty (HPRO) 2 1.66 1.21 (0.14–4.36)Abdominal Hysterectomy (HYST) . . .Colon surgery (COLO) . . .
WEST PENN HOSPITAL (11864)Cardiac (CARD) 0 0.14 0.00 (0.00–25.47)Cardiac Bypass — Single Incision (CBGC) 1 0.21 4.80 (0.06–26.73)Cardiac Bypass — Dual Incision (CBGB) 0 1.15 0.00 (0.00–3.20)Knee Arthroplasty (KPRO) 1 0.94 1.06 (0.01–5.89)Hip Arthroplasty (HPRO) 1 0.45 2.24 (0.03–12.46)Abdominal Hysterectomy (HYST) 11 6.80 1.62 (0.81–2.89)Colon surgery (COLO) 2 3.49 0.57 (0.06–2.07)
WILKES-BARRE GENERAL HOSPITAL (11916)Cardiac (CARD) 0 0.27 0.00 (0.00–13.71)Cardiac Bypass — Single Incision (CBGC) 0 0.08 0.00 (0.00–48.63)Cardiac Bypass — Dual Incision (CBGB) 3 1.74 1.73 (0.35–5.05)Knee Arthroplasty (KPRO) 1 1.79 0.56 (0.01–3.12)Hip Arthroplasty (HPRO) 2 2.06 0.97 (0.11–3.50)Abdominal Hysterectomy (HYST) 4 2.43 1.65 (0.44–4.22)Colon surgery (COLO) 7 11.56 0.61 (0.24–1.25)
Continued on next page . . .
274

Table 4.5.15 – Rate of SSIs (SIR) — All Procedures By Facility (alphabetical order) – Continued from previous page
Number of SSIs Predicted Number of SSIs SIR (95% CI)
WILLIAMSPORT REGIONAL MEDICAL CENTER (11732)Cardiac (CARD) 0 0.30 0.00 (0.00–12.42)Cardiac Bypass — Single Incision (CBGC) . . .Cardiac Bypass — Dual Incision (CBGB) 5 1.32 3.80 (1.22–8.87)Knee Arthroplasty (KPRO) 4 1.94 2.07 (0.56–5.29)Hip Arthroplasty (HPRO) 1 2.81 0.36 (0.00–1.98)Abdominal Hysterectomy (HYST) 0 0.25 0.00 (0.00–14.92)Colon surgery (COLO) 2 0.77 2.60 (0.29–9.37)
WINDBER HOSPITAL (12031)Cardiac (CARD) . . .Cardiac Bypass — Single Incision (CBGC) . . .Cardiac Bypass — Dual Incision (CBGB) . . .Knee Arthroplasty (KPRO) 0 0.13 0.00 (0.00–28.99)Hip Arthroplasty (HPRO) 0 0.12 0.00 (0.00–29.57)Abdominal Hysterectomy (HYST) 0 0.18 0.00 (0.00–20.37)Colon surgery (COLO) 1 2.40 0.42 (0.01–2.32)
YORK HOSPITAL (10108)Cardiac (CARD) 1 1.52 0.66 (0.01–3.66)Cardiac Bypass — Single Incision (CBGC) 0 0.68 0.00 (0.00–5.40)Cardiac Bypass — Dual Incision (CBGB) 4 2.64 1.51 (0.41–3.88)Knee Arthroplasty (KPRO) 2 0.85 2.35 (0.26–8.50)Hip Arthroplasty (HPRO) 1 2.50 0.40 (0.01–2.23)Abdominal Hysterectomy (HYST) 11 7.38 1.49 (0.74–2.67)Colon surgery (COLO) 24 17.91 1.34 (0.86–1.99)
275
4.6 Influenza Vaccination of Healthcare Providers (HCP)
Vaccination of HCP against influenza is an important indicator and measure of institutional commitment to patientsafety. Influenza vaccination is the single most effective way of preventing influenza. Influenza vaccination keepsHCP healthy, protects their families and likely reduces the risk of transmission in healthcare settings. VaccinatingHCP against influenza protects patients by not exposing them to infected personnel, decreasing absenteeism, andpromoting a healthy workforce to care for those who tend to be most at risk. Initiatives to promote universal influenzavaccination for HCP are strongly encouraged for all hospitals in Pennsylvania to achieve the Healthy People 2020goal of at least 90 percent coverage.
PADOH published hospital HCP influenza vaccination rates in aggregate in the 2011 annual report and has publishedfacility-specific vaccination rates since then to promote awareness and provide a statewide baseline for this importantmeasure of institutional commitment to patient safety. Act 52 does not require hospitals to provide this information.However, federal initiatives and changes to Joint Commission Accreditation Standards make it critical for healthcareinstitutions to have effective healthcare personnel influenza vaccination programs in place:
1. Healthcare personnel influenza vaccination rates are now tied to Medicare reimbursement. On Aug. 18, 2011,the Centers for Medicare and Medicaid Services (CMS) published a final rule requiring acute care hospitalsto report healthcare personnel influenza vaccination rates through CDC’s National Healthcare Safety Network(NHSN). Fiscal year 2015 payments under Medicare’s inpatient prospective payment system (IPPS) will bereduced by 2 percent if acute care hospitals fail to report required quality measures starting in January 2013.Quality data also are made publicly available on CMS’s Hospital Compare website.
2. The Joint Commission (JC) has issued accreditation standards to encourage influenza vaccination rates amonghealthcare personnel to achieve vaccination of healthcare personnel of 90 percent or better. In addition tohospitals (including critical access hospitals), these standards apply to ambulatory, behavioral, home care,laboratory, long-term care and office-based surgery facilities.http://www.jointcommission.org/ic020401_CAH_HAP_LTC/
This is the third year that PADOH is publishing facility-specific HCP vaccination rates. These rates are based ondata submitted by facilities to NHSN. The NHSN assessment of HCP vaccination rates is based on National QualityForum (NQF) Metric 0431. Reporting of contractor vaccination rates to NHSN is possible but optional and notnecessary to qualify for full CMS pay-for-reporting incentives. Please refer to the following resources for a detaileddescription of the assessments:
• 2011 PADOH HAI Annual Reporthttp://www.portal.state.pa.us/portal/server.pt?open=18&objID=1302961&mode=2
• NHSN Documentationhttp://www.cdc.gov/nhsn/PDFs/HPS-manual/vaccination/HPS-flu-vaccine-protocol.pdf
• CDC FAQ for Influenza Vaccination Summary Reportinghttp://www.cdc.gov/nhsn/faqs/FAQ-Influenza-Vaccination-Summary-Reporting.html
4.6.1 Influenza Vaccination of HCP — Statewide Summary
All 252 hospitals open during the 2014–2015 influenza season reported healthcare personnel influenza vaccination ratesto NHSN (including five hospitals that opened part way through the season), and 161 hospitals (64 percent) reportedvaccination rates for contractors in addition to vaccination rates for employees, licensed independent practioners(LIP), and adult students, trainees and volunteers (STV). Overall, hospitals reported the vaccination status of 399,635HCP (see Table 4.6.1; individual HCP might be represented in the numerator and denominator data reported bymultiple facilities if the HCP worked in more than one NHSN facility during the influenza season).
The median percent of HCP with unknown vaccination status decreased 68 percent from the 2013–2014 season to the
276
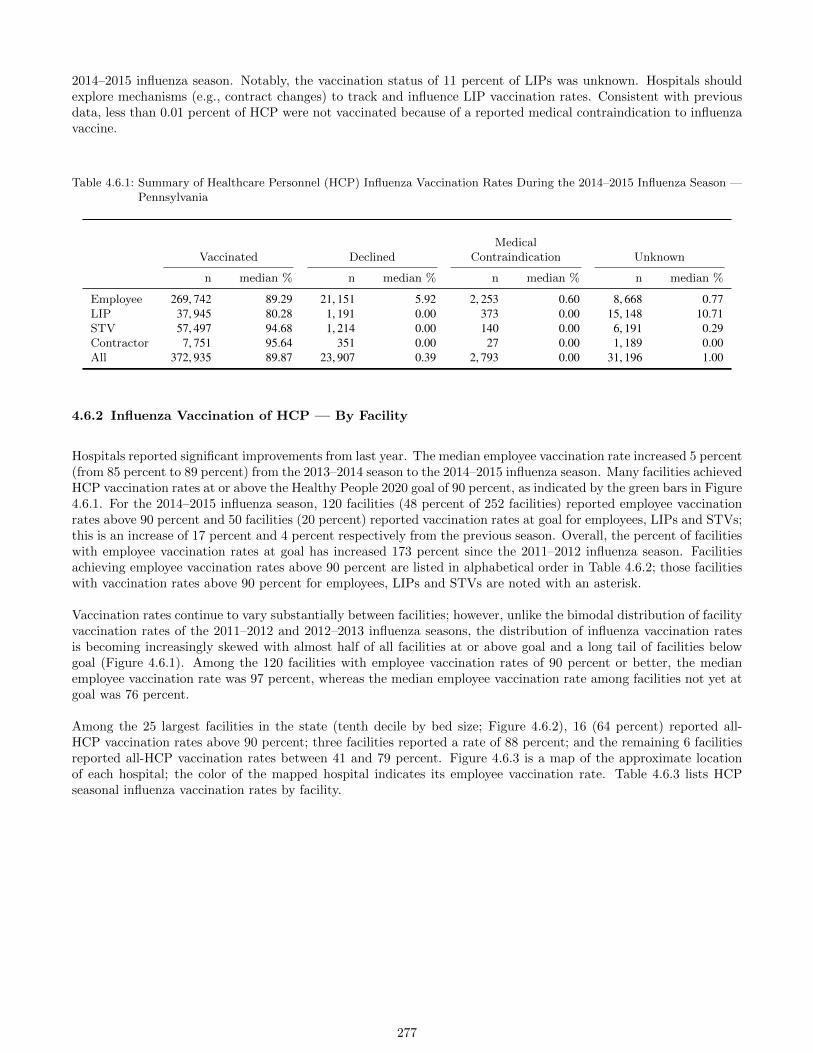
2014–2015 influenza season. Notably, the vaccination status of 11 percent of LIPs was unknown. Hospitals shouldexplore mechanisms (e.g., contract changes) to track and influence LIP vaccination rates. Consistent with previousdata, less than 0.01 percent of HCP were not vaccinated because of a reported medical contraindication to influenzavaccine.
Table 4.6.1: Summary of Healthcare Personnel (HCP) Influenza Vaccination Rates During the 2014–2015 Influenza Season —Pennsylvania
Vaccinated DeclinedMedical
Contraindication Unknown
n median % n median % n median % n median %
Employee 269, 742 89.29 21, 151 5.92 2, 253 0.60 8, 668 0.77LIP 37, 945 80.28 1, 191 0.00 373 0.00 15, 148 10.71STV 57, 497 94.68 1, 214 0.00 140 0.00 6, 191 0.29Contractor 7, 751 95.64 351 0.00 27 0.00 1, 189 0.00All 372, 935 89.87 23, 907 0.39 2, 793 0.00 31, 196 1.00
4.6.2 Influenza Vaccination of HCP — By Facility
Hospitals reported significant improvements from last year. The median employee vaccination rate increased 5 percent(from 85 percent to 89 percent) from the 2013–2014 season to the 2014–2015 influenza season. Many facilities achievedHCP vaccination rates at or above the Healthy People 2020 goal of 90 percent, as indicated by the green bars in Figure4.6.1. For the 2014–2015 influenza season, 120 facilities (48 percent of 252 facilities) reported employee vaccinationrates above 90 percent and 50 facilities (20 percent) reported vaccination rates at goal for employees, LIPs and STVs;this is an increase of 17 percent and 4 percent respectively from the previous season. Overall, the percent of facilitieswith employee vaccination rates at goal has increased 173 percent since the 2011–2012 influenza season. Facilitiesachieving employee vaccination rates above 90 percent are listed in alphabetical order in Table 4.6.2; those facilitieswith vaccination rates above 90 percent for employees, LIPs and STVs are noted with an asterisk.
Vaccination rates continue to vary substantially between facilities; however, unlike the bimodal distribution of facilityvaccination rates of the 2011–2012 and 2012–2013 influenza seasons, the distribution of influenza vaccination ratesis becoming increasingly skewed with almost half of all facilities at or above goal and a long tail of facilities belowgoal (Figure 4.6.1). Among the 120 facilities with employee vaccination rates of 90 percent or better, the medianemployee vaccination rate was 97 percent, whereas the median employee vaccination rate among facilities not yet atgoal was 76 percent.
Among the 25 largest facilities in the state (tenth decile by bed size; Figure 4.6.2), 16 (64 percent) reported all-HCP vaccination rates above 90 percent; three facilities reported a rate of 88 percent; and the remaining 6 facilitiesreported all-HCP vaccination rates between 41 and 79 percent. Figure 4.6.3 is a map of the approximate locationof each hospital; the color of the mapped hospital indicates its employee vaccination rate. Table 4.6.3 lists HCPseasonal influenza vaccination rates by facility.
277

Figure 4.6.1: Distribution of Facility Healthcare Personnel (HCP) Seasonal Influneza Vaccination Rates by WorkerType — Pennsylvania, 2014–2015
Healthy People 2020 Goal = 90%
Median: 89%
Hospitals at goal:48%
(120/252)
Median: 80%
Hospitals at goal:36%
(90/252)
Median: 95%
Hospitals at goal:54%
(136/252)
Median: 96%
Hospitals at goal:47%
(75/161)
Median: 87%
Hospitals at goal:40%
(101/252)
0
30
60
90
0
30
60
90
0
30
60
90
0
30
60
90
0
30
60
90
Em
ployeeLIP
ST
VC
ontractorA
ll HC
P
0 10 20 30 40 50 60 70 80 90 100
Vaccination rate (%)
Num
ber
of in
patie
nt fa
cilit
ies
0 to < 60% 60 to < 80% 80 to < 90% 90 to 100%
278

Figure 4.6.2: Distribution of Facility Healthcare Personnel (HCP) Seasonal Influneza Vaccination Rates Among 25Largest Facilities — Pennsylvania, 2014–2015
Figure Includes All HCP Types; Healthy People 2020 Goal = 90%
0
1
2
3
4
5
6
7
8
9
25 Largest Facilities
0 10 20 30 40 50 60 70 80 90 100
Vaccination rate (%)
Num
ber
of in
patie
nt fa
cilit
ies
0 to < 60% 60 to < 80% 80 to < 90% 90 to 100%
279
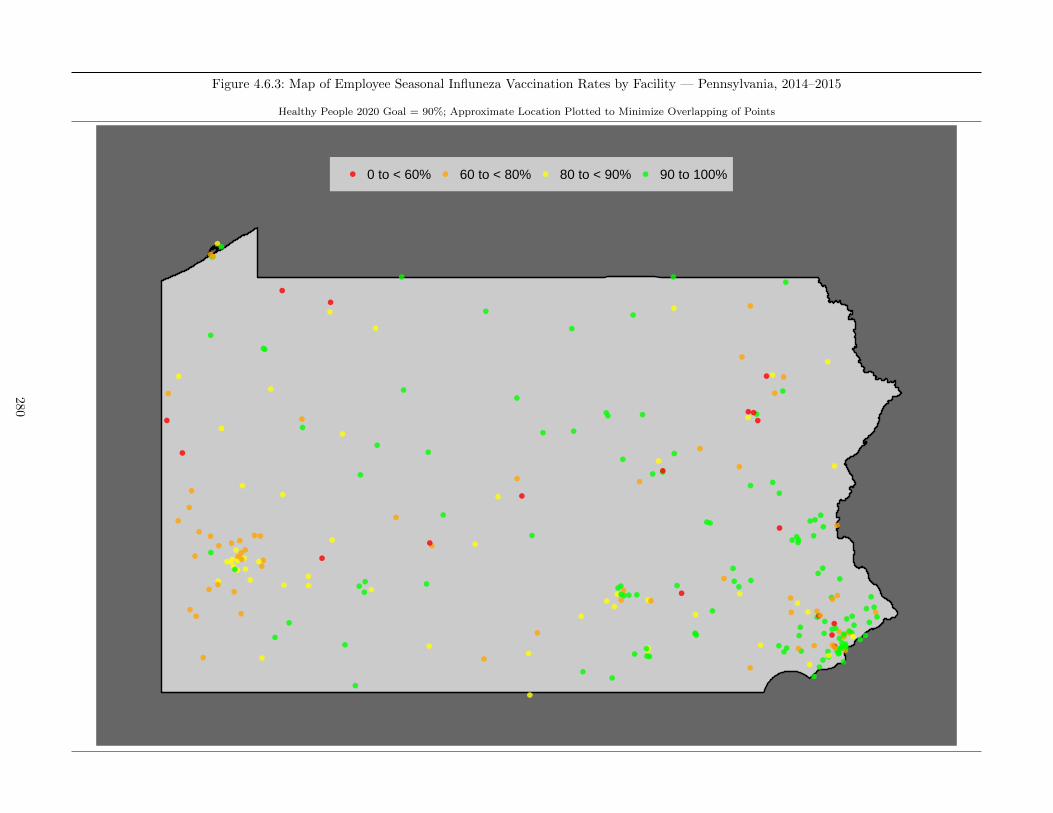
Figure 4.6.3: Map of Employee Seasonal Influneza Vaccination Rates by Facility — Pennsylvania, 2014–2015
Healthy People 2020 Goal = 90%; Approximate Location Plotted to Minimize Overlapping of Points
0 to < 60% 60 to < 80% 80 to < 90% 90 to 100%
280
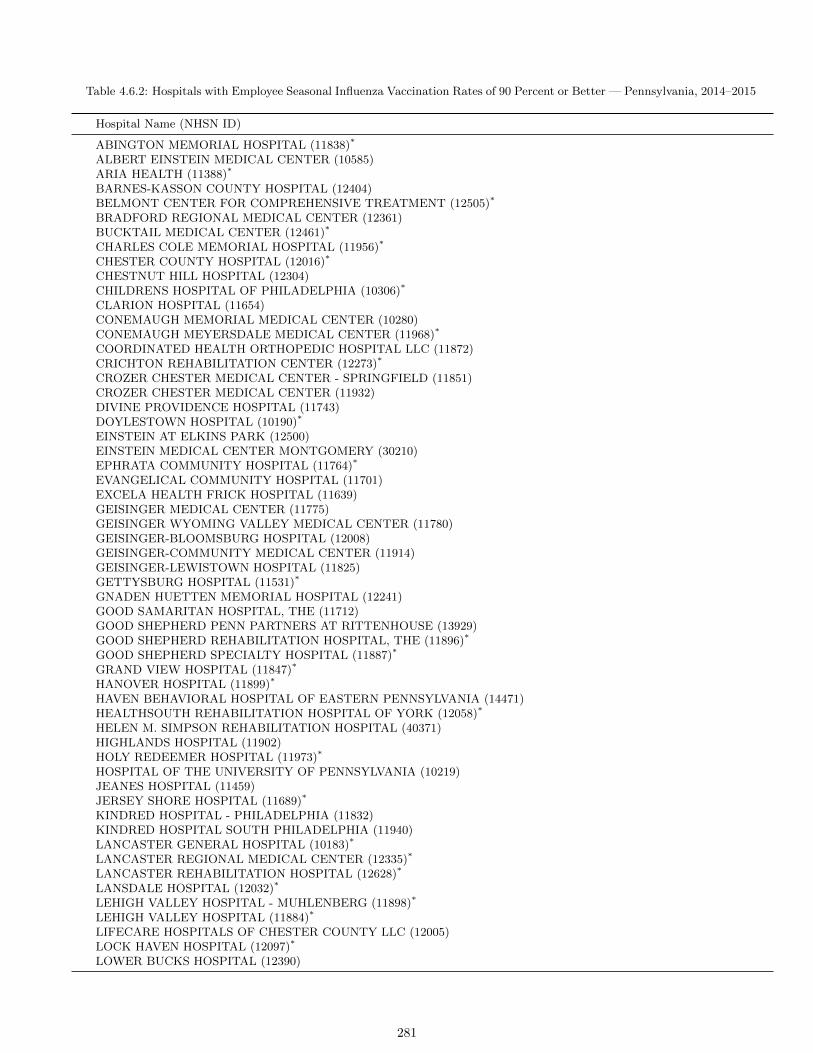
Table 4.6.2: Hospitals with Employee Seasonal Influenza Vaccination Rates of 90 Percent or Better — Pennsylvania, 2014–2015
Hospital Name (NHSN ID)
ABINGTON MEMORIAL HOSPITAL (11838)*
ALBERT EINSTEIN MEDICAL CENTER (10585)ARIA HEALTH (11388)*
BARNES-KASSON COUNTY HOSPITAL (12404)BELMONT CENTER FOR COMPREHENSIVE TREATMENT (12505)*
BRADFORD REGIONAL MEDICAL CENTER (12361)BUCKTAIL MEDICAL CENTER (12461)*
CHARLES COLE MEMORIAL HOSPITAL (11956)*
CHESTER COUNTY HOSPITAL (12016)*
CHESTNUT HILL HOSPITAL (12304)CHILDRENS HOSPITAL OF PHILADELPHIA (10306)*
CLARION HOSPITAL (11654)CONEMAUGH MEMORIAL MEDICAL CENTER (10280)CONEMAUGH MEYERSDALE MEDICAL CENTER (11968)*
COORDINATED HEALTH ORTHOPEDIC HOSPITAL LLC (11872)CRICHTON REHABILITATION CENTER (12273)*
CROZER CHESTER MEDICAL CENTER - SPRINGFIELD (11851)CROZER CHESTER MEDICAL CENTER (11932)DIVINE PROVIDENCE HOSPITAL (11743)DOYLESTOWN HOSPITAL (10190)*
EINSTEIN AT ELKINS PARK (12500)EINSTEIN MEDICAL CENTER MONTGOMERY (30210)EPHRATA COMMUNITY HOSPITAL (11764)*
EVANGELICAL COMMUNITY HOSPITAL (11701)EXCELA HEALTH FRICK HOSPITAL (11639)GEISINGER MEDICAL CENTER (11775)GEISINGER WYOMING VALLEY MEDICAL CENTER (11780)GEISINGER-BLOOMSBURG HOSPITAL (12008)GEISINGER-COMMUNITY MEDICAL CENTER (11914)GEISINGER-LEWISTOWN HOSPITAL (11825)GETTYSBURG HOSPITAL (11531)*
GNADEN HUETTEN MEMORIAL HOSPITAL (12241)GOOD SAMARITAN HOSPITAL, THE (11712)GOOD SHEPHERD PENN PARTNERS AT RITTENHOUSE (13929)GOOD SHEPHERD REHABILITATION HOSPITAL, THE (11896)*
GOOD SHEPHERD SPECIALTY HOSPITAL (11887)*
GRAND VIEW HOSPITAL (11847)*
HANOVER HOSPITAL (11899)*
HAVEN BEHAVIORAL HOSPITAL OF EASTERN PENNSYLVANIA (14471)HEALTHSOUTH REHABILITATION HOSPITAL OF YORK (12058)*
HELEN M. SIMPSON REHABILITATION HOSPITAL (40371)HIGHLANDS HOSPITAL (11902)HOLY REDEEMER HOSPITAL (11973)*
HOSPITAL OF THE UNIVERSITY OF PENNSYLVANIA (10219)JEANES HOSPITAL (11459)JERSEY SHORE HOSPITAL (11689)*
KINDRED HOSPITAL - PHILADELPHIA (11832)KINDRED HOSPITAL SOUTH PHILADELPHIA (11940)LANCASTER GENERAL HOSPITAL (10183)*
LANCASTER REGIONAL MEDICAL CENTER (12335)*
LANCASTER REHABILITATION HOSPITAL (12628)*
LANSDALE HOSPITAL (12032)*
LEHIGH VALLEY HOSPITAL - MUHLENBERG (11898)*
LEHIGH VALLEY HOSPITAL (11884)*
LIFECARE HOSPITALS OF CHESTER COUNTY LLC (12005)LOCK HAVEN HOSPITAL (12097)*
LOWER BUCKS HOSPITAL (12390)
281

Table 4.6.2: (continued)
Hospital Name (NHSN ID)
MAGEE REHABILITATION HOSPITAL (12146)*
MAIN LINE HOSPITAL - PAOLI (11750)*
MAIN LINE HOSPITAL BRYN MAWR (11753)*
MAIN LINE HOSPITAL BRYN MAWR REHABILITATION (11417)*
MAIN LINE HOSPITAL LANKENAU MEDICAL CENTER (11770)*
MEADVILLE MEDICAL CENTER (11583)MERCY FITZGERALD HOSPITAL (11683)MERCY PHILADELPHIA HOSPITAL (11946)MERCY SUBURBAN HOSPITAL (11952)MOSS REHABILITATION (12508)MUNCY VALLEY HOSPITAL (11748)NASON HOSPITAL (11907)NAZARETH HOSPITAL (11919)OHIO VALLEY GENERAL HOSPITAL (12298)OSS ORTHOPAEDIC HOSPITAL (18467)PALMERTON HOSPITAL (12396)PENN HIGHLANDS CLEARFIELD (11843)PENN HIGHLANDS DUBOIS (11606)PENN HIGHLANDS ELK (11859)PENN PRESBYTERIAN MEDICAL CENTER (11814)PENNSYLVANIA HOSPITAL OF THE UNIVERSITY OF PA HEALTH SYS (11448)PINNACLE HEALTH HOSPITALS - COMMUNITY GENERAL OSTEOPATHIC HOSPITAL (34069)PINNACLE HEALTH HOSPITALS - HARRISBURG HOSPITAL (34068)PINNACLE HEALTH HOSPITALS - WEST SHORE HOSPITAL (35123)PUNXSUTAWNEY AREA HOSPITAL (11830)*
READING HOSPITAL (12375)*
RIDDLE MEMORIAL HOSPITAL (11731)*
ROBERT PACKER HOSPITAL (12422)*
ROTHMAN ORTHOPAEDIC SPECIALTY HOSPITAL (15202)ROXBOROUGH MEMORIAL HOSPITAL (11978)*
SACRED HEART HOSPITAL (11684)*
SAINT VINCENT HOSPITAL (11699)*
SCHUYLKILL MEDICAL CENTER - EAST NORWEGIAN STREET (11922)SCHUYLKILL MEDICAL CENTER - SOUTH JACKSON STREET (12087)SELECT SPECIALTY HOSPITAL - ERIE (11880)SELECT SPECIALTY HOSPITAL - CENTRAL PA (13921)SELECT SPECIALTY HOSPITAL - DANVILLE (12123)SELECT SPECIALTY HOSPITAL - JOHNSTOWN (12299)SELECT SPECIALTY HOSPITAL - PITTSBURGH/UPMC (12009)SOLDIERS AND SAILORS MEMORIAL HOSPITAL (11688)*
SOMERSET HOSPITAL (12282)ST. CHRISTOPHERS HOSPITAL FOR CHILDREN (12290)*
ST. JOHN VIANNEY HOSPITAL (12548)*
ST. JOSEPH MEDICAL CTR (11961)*
ST. JOSEPHS HOSPITAL (12438)*
ST. LUKES HOSPITAL BETHLEHEM (11718)ST. LUKES HOSPITAL- ANDERSON CAMPUS (21487)ST. LUKES MINERS MEMORIAL HOSPITAL (11784)ST. LUKES QUAKERTOWN HOSPITAL (11711)*
ST. MARY MEDICAL CENTER (11885)ST. MARY REHABILITATION HOSPITAL LLP (36959)SURGICAL INSTITUTE OF READING (12535)SURGICAL SPECIALTY CENTER AT COORDINATED HEALTH, THE (15259)TEMPLE UNIVERSITY HOSPITAL (12382)THOMAS JEFFERSON UNIVERSITY HOSPITAL - METHODIST (12017)*
THOMAS JEFFERSON UNIVERSITY HOSPITAL (11506)*
TITUSVILLE AREA HOSPITAL (11738)
282

Table 4.6.2: (continued)
Hospital Name (NHSN ID)
TROY COMMUNITY HOSPITAL (12018)*
TYRONE HOSPITAL (12717)*
WELLSPAN SURGERY AND REHABILITATION HOSPITAL (27430)*
WILLIAMSPORT REGIONAL MEDICAL CENTER (11732)WILLS EYE HOSPITAL (34846)YORK HOSPITAL (10108)*
* Facility reported vaccination rates of 90 percent or better among employees, LIPs and STVs.
283
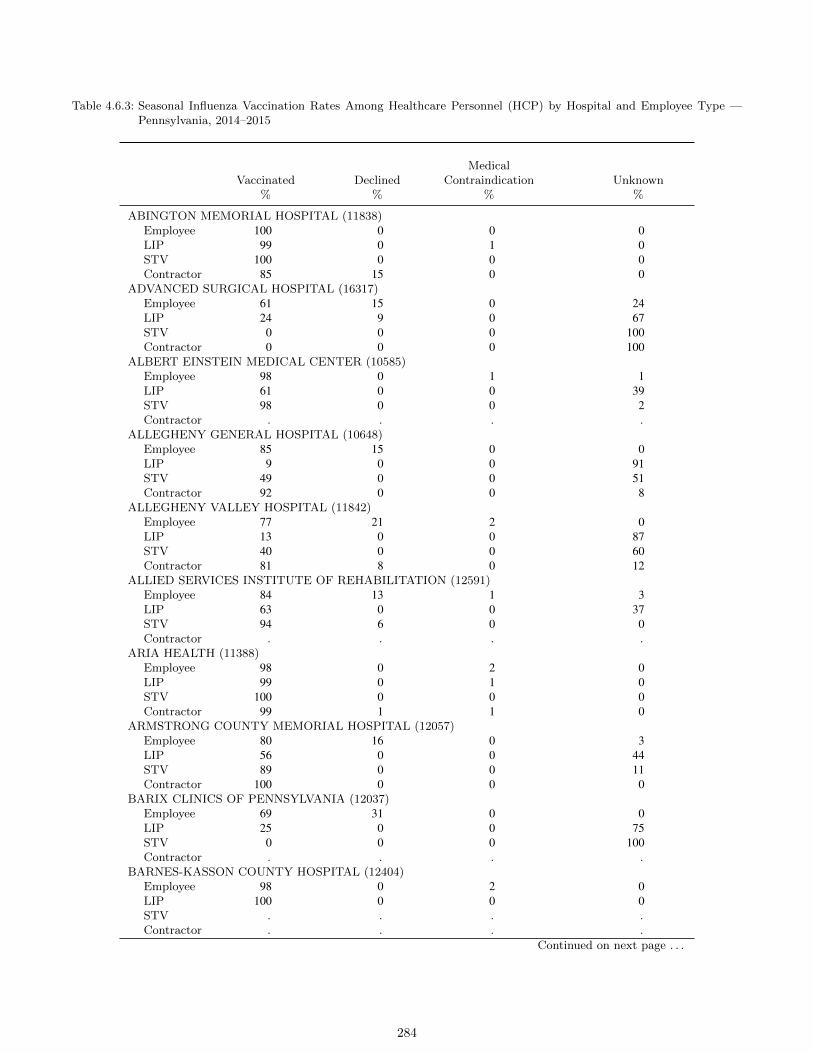
Table 4.6.3: Seasonal Influenza Vaccination Rates Among Healthcare Personnel (HCP) by Hospital and Employee Type —Pennsylvania, 2014–2015
Vaccinated%
Declined%
MedicalContraindication
%Unknown
%
ABINGTON MEMORIAL HOSPITAL (11838)Employee 100 0 0 0LIP 99 0 1 0STV 100 0 0 0Contractor 85 15 0 0
ADVANCED SURGICAL HOSPITAL (16317)Employee 61 15 0 24LIP 24 9 0 67STV 0 0 0 100Contractor 0 0 0 100
ALBERT EINSTEIN MEDICAL CENTER (10585)Employee 98 0 1 1LIP 61 0 0 39STV 98 0 0 2Contractor . . . .
ALLEGHENY GENERAL HOSPITAL (10648)Employee 85 15 0 0LIP 9 0 0 91STV 49 0 0 51Contractor 92 0 0 8
ALLEGHENY VALLEY HOSPITAL (11842)Employee 77 21 2 0LIP 13 0 0 87STV 40 0 0 60Contractor 81 8 0 12
ALLIED SERVICES INSTITUTE OF REHABILITATION (12591)Employee 84 13 1 3LIP 63 0 0 37STV 94 6 0 0Contractor . . . .
ARIA HEALTH (11388)Employee 98 0 2 0LIP 99 0 1 0STV 100 0 0 0Contractor 99 1 1 0
ARMSTRONG COUNTY MEMORIAL HOSPITAL (12057)Employee 80 16 0 3LIP 56 0 0 44STV 89 0 0 11Contractor 100 0 0 0
BARIX CLINICS OF PENNSYLVANIA (12037)Employee 69 31 0 0LIP 25 0 0 75STV 0 0 0 100Contractor . . . .
BARNES-KASSON COUNTY HOSPITAL (12404)Employee 98 0 2 0LIP 100 0 0 0STV . . . .Contractor . . . .
Continued on next page . . .
284
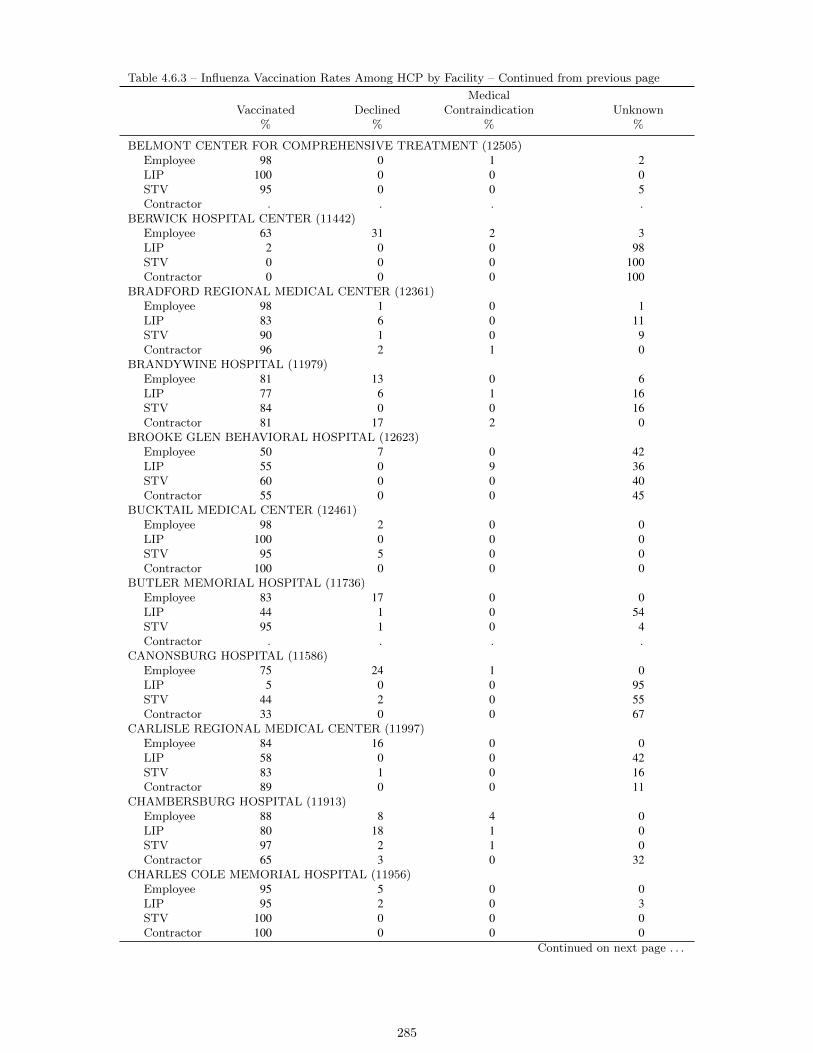
Table 4.6.3 – Influenza Vaccination Rates Among HCP by Facility – Continued from previous page
Vaccinated%
Declined%
MedicalContraindication
%Unknown
%
BELMONT CENTER FOR COMPREHENSIVE TREATMENT (12505)Employee 98 0 1 2LIP 100 0 0 0STV 95 0 0 5Contractor . . . .
BERWICK HOSPITAL CENTER (11442)Employee 63 31 2 3LIP 2 0 0 98STV 0 0 0 100Contractor 0 0 0 100
BRADFORD REGIONAL MEDICAL CENTER (12361)Employee 98 1 0 1LIP 83 6 0 11STV 90 1 0 9Contractor 96 2 1 0
BRANDYWINE HOSPITAL (11979)Employee 81 13 0 6LIP 77 6 1 16STV 84 0 0 16Contractor 81 17 2 0
BROOKE GLEN BEHAVIORAL HOSPITAL (12623)Employee 50 7 0 42LIP 55 0 9 36STV 60 0 0 40Contractor 55 0 0 45
BUCKTAIL MEDICAL CENTER (12461)Employee 98 2 0 0LIP 100 0 0 0STV 95 5 0 0Contractor 100 0 0 0
BUTLER MEMORIAL HOSPITAL (11736)Employee 83 17 0 0LIP 44 1 0 54STV 95 1 0 4Contractor . . . .
CANONSBURG HOSPITAL (11586)Employee 75 24 1 0LIP 5 0 0 95STV 44 2 0 55Contractor 33 0 0 67
CARLISLE REGIONAL MEDICAL CENTER (11997)Employee 84 16 0 0LIP 58 0 0 42STV 83 1 0 16Contractor 89 0 0 11
CHAMBERSBURG HOSPITAL (11913)Employee 88 8 4 0LIP 80 18 1 0STV 97 2 1 0Contractor 65 3 0 32
CHARLES COLE MEMORIAL HOSPITAL (11956)Employee 95 5 0 0LIP 95 2 0 3STV 100 0 0 0Contractor 100 0 0 0
Continued on next page . . .
285
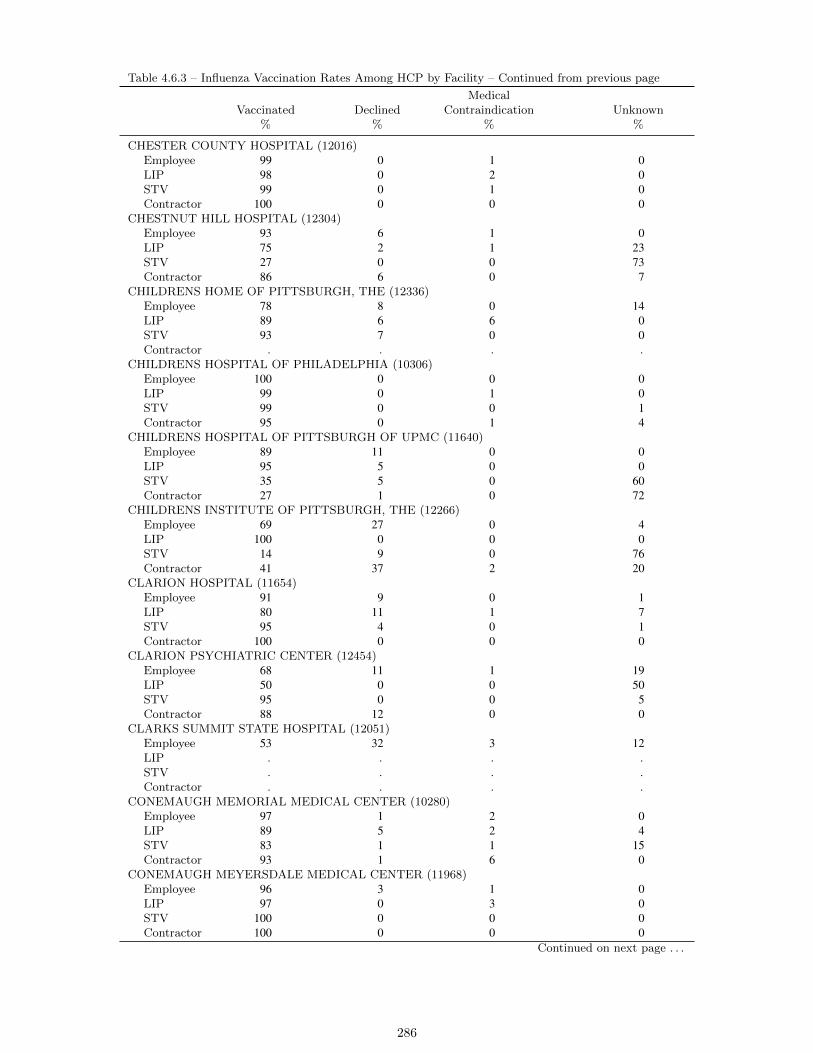
Table 4.6.3 – Influenza Vaccination Rates Among HCP by Facility – Continued from previous page
Vaccinated%
Declined%
MedicalContraindication
%Unknown
%
CHESTER COUNTY HOSPITAL (12016)Employee 99 0 1 0LIP 98 0 2 0STV 99 0 1 0Contractor 100 0 0 0
CHESTNUT HILL HOSPITAL (12304)Employee 93 6 1 0LIP 75 2 1 23STV 27 0 0 73Contractor 86 6 0 7
CHILDRENS HOME OF PITTSBURGH, THE (12336)Employee 78 8 0 14LIP 89 6 6 0STV 93 7 0 0Contractor . . . .
CHILDRENS HOSPITAL OF PHILADELPHIA (10306)Employee 100 0 0 0LIP 99 0 1 0STV 99 0 0 1Contractor 95 0 1 4
CHILDRENS HOSPITAL OF PITTSBURGH OF UPMC (11640)Employee 89 11 0 0LIP 95 5 0 0STV 35 5 0 60Contractor 27 1 0 72
CHILDRENS INSTITUTE OF PITTSBURGH, THE (12266)Employee 69 27 0 4LIP 100 0 0 0STV 14 9 0 76Contractor 41 37 2 20
CLARION HOSPITAL (11654)Employee 91 9 0 1LIP 80 11 1 7STV 95 4 0 1Contractor 100 0 0 0
CLARION PSYCHIATRIC CENTER (12454)Employee 68 11 1 19LIP 50 0 0 50STV 95 0 0 5Contractor 88 12 0 0
CLARKS SUMMIT STATE HOSPITAL (12051)Employee 53 32 3 12LIP . . . .STV . . . .Contractor . . . .
CONEMAUGH MEMORIAL MEDICAL CENTER (10280)Employee 97 1 2 0LIP 89 5 2 4STV 83 1 1 15Contractor 93 1 6 0
CONEMAUGH MEYERSDALE MEDICAL CENTER (11968)Employee 96 3 1 0LIP 97 0 3 0STV 100 0 0 0Contractor 100 0 0 0
Continued on next page . . .
286

Table 4.6.3 – Influenza Vaccination Rates Among HCP by Facility – Continued from previous page
Vaccinated%
Declined%
MedicalContraindication
%Unknown
%
CONEMAUGH MINERS MEDICAL CENTER (12295)Employee 72 26 1 0LIP 26 0 0 74STV 100 0 0 0Contractor 88 12 0 0
COORDINATED HEALTH ORTHOPEDIC HOSPITAL LLC (11872)Employee 94 0 2 4LIP 100 0 0 0STV . . . .Contractor . . . .
CORRY MEMORIAL HOSPITAL (12283)Employee 58 40 1 2LIP 0 0 0 100STV . . . .Contractor 55 45 0 0
CRICHTON REHABILITATION CENTER (12273)Employee 98 0 2 0LIP 94 2 2 3STV 100 0 0 0Contractor 88 0 12 0
CROZER CHESTER MEDICAL CENTER - SPRINGFIELD (11851)Employee 93 0 2 5LIP 91 0 1 8STV 63 0 7 31Contractor . . . .
CROZER CHESTER MEDICAL CENTER (11839)Employee 90 0 3 7LIP 91 0 1 8STV 58 0 0 42Contractor . . . .
CROZER CHESTER MEDICAL CENTER (11932)Employee 92 0 3 5LIP 91 0 1 8STV 79 0 5 16Contractor . . . .
DANVILLE STATE HOSPITAL (11848)Employee 54 45 1 1LIP 44 0 0 56STV 0 0 0 100Contractor 44 0 0 56
DELAWARE COUNTY MEMORIAL HOSPITAL (11972)Employee 88 0 5 6LIP 82 0 2 16STV 57 0 1 42Contractor . . . .
DEVEREUX CHILDRENS BEHAVIORAL HEALTH INSTITUTE (12738)Employee 61 18 4 17LIP 83 0 0 17STV 100 0 0 0Contractor . . . .
DIVINE PROVIDENCE HOSPITAL (11743)Employee 95 3 0 1LIP 96 0 4 0STV 70 0 0 30Contractor 92 1 0 7
Continued on next page . . .
287
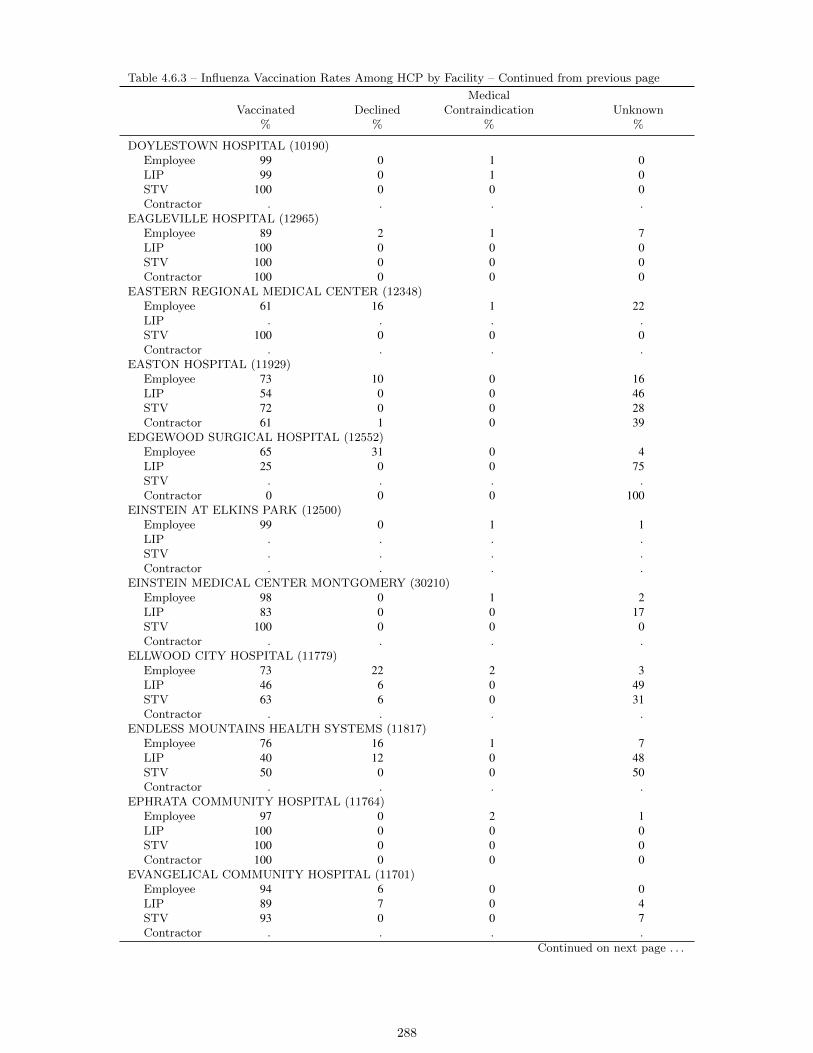
Table 4.6.3 – Influenza Vaccination Rates Among HCP by Facility – Continued from previous page
Vaccinated%
Declined%
MedicalContraindication
%Unknown
%
DOYLESTOWN HOSPITAL (10190)Employee 99 0 1 0LIP 99 0 1 0STV 100 0 0 0Contractor . . . .
EAGLEVILLE HOSPITAL (12965)Employee 89 2 1 7LIP 100 0 0 0STV 100 0 0 0Contractor 100 0 0 0
EASTERN REGIONAL MEDICAL CENTER (12348)Employee 61 16 1 22LIP . . . .STV 100 0 0 0Contractor . . . .
EASTON HOSPITAL (11929)Employee 73 10 0 16LIP 54 0 0 46STV 72 0 0 28Contractor 61 1 0 39
EDGEWOOD SURGICAL HOSPITAL (12552)Employee 65 31 0 4LIP 25 0 0 75STV . . . .Contractor 0 0 0 100
EINSTEIN AT ELKINS PARK (12500)Employee 99 0 1 1LIP . . . .STV . . . .Contractor . . . .
EINSTEIN MEDICAL CENTER MONTGOMERY (30210)Employee 98 0 1 2LIP 83 0 0 17STV 100 0 0 0Contractor . . . .
ELLWOOD CITY HOSPITAL (11779)Employee 73 22 2 3LIP 46 6 0 49STV 63 6 0 31Contractor . . . .
ENDLESS MOUNTAINS HEALTH SYSTEMS (11817)Employee 76 16 1 7LIP 40 12 0 48STV 50 0 0 50Contractor . . . .
EPHRATA COMMUNITY HOSPITAL (11764)Employee 97 0 2 1LIP 100 0 0 0STV 100 0 0 0Contractor 100 0 0 0
EVANGELICAL COMMUNITY HOSPITAL (11701)Employee 94 6 0 0LIP 89 7 0 4STV 93 0 0 7Contractor . . . .
Continued on next page . . .
288
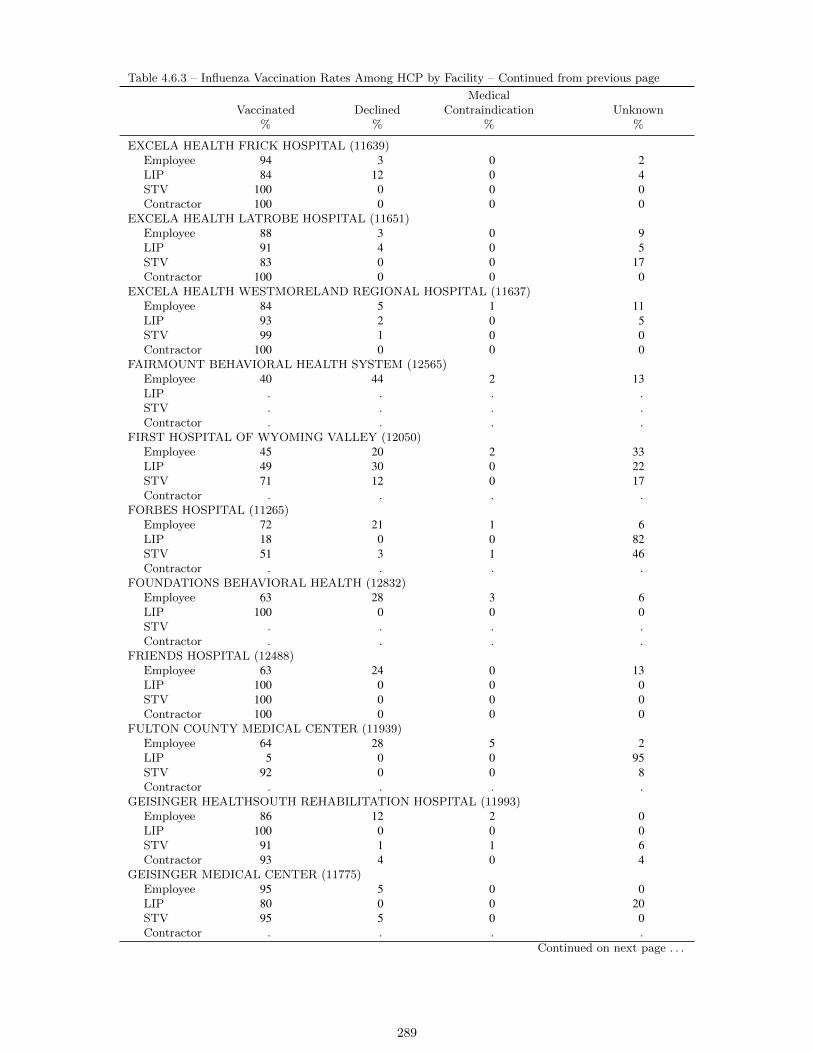
Table 4.6.3 – Influenza Vaccination Rates Among HCP by Facility – Continued from previous page
Vaccinated%
Declined%
MedicalContraindication
%Unknown
%
EXCELA HEALTH FRICK HOSPITAL (11639)Employee 94 3 0 2LIP 84 12 0 4STV 100 0 0 0Contractor 100 0 0 0
EXCELA HEALTH LATROBE HOSPITAL (11651)Employee 88 3 0 9LIP 91 4 0 5STV 83 0 0 17Contractor 100 0 0 0
EXCELA HEALTH WESTMORELAND REGIONAL HOSPITAL (11637)Employee 84 5 1 11LIP 93 2 0 5STV 99 1 0 0Contractor 100 0 0 0
FAIRMOUNT BEHAVIORAL HEALTH SYSTEM (12565)Employee 40 44 2 13LIP . . . .STV . . . .Contractor . . . .
FIRST HOSPITAL OF WYOMING VALLEY (12050)Employee 45 20 2 33LIP 49 30 0 22STV 71 12 0 17Contractor . . . .
FORBES HOSPITAL (11265)Employee 72 21 1 6LIP 18 0 0 82STV 51 3 1 46Contractor . . . .
FOUNDATIONS BEHAVIORAL HEALTH (12832)Employee 63 28 3 6LIP 100 0 0 0STV . . . .Contractor . . . .
FRIENDS HOSPITAL (12488)Employee 63 24 0 13LIP 100 0 0 0STV 100 0 0 0Contractor 100 0 0 0
FULTON COUNTY MEDICAL CENTER (11939)Employee 64 28 5 2LIP 5 0 0 95STV 92 0 0 8Contractor . . . .
GEISINGER HEALTHSOUTH REHABILITATION HOSPITAL (11993)Employee 86 12 2 0LIP 100 0 0 0STV 91 1 1 6Contractor 93 4 0 4
GEISINGER MEDICAL CENTER (11775)Employee 95 5 0 0LIP 80 0 0 20STV 95 5 0 0Contractor . . . .
Continued on next page . . .
289
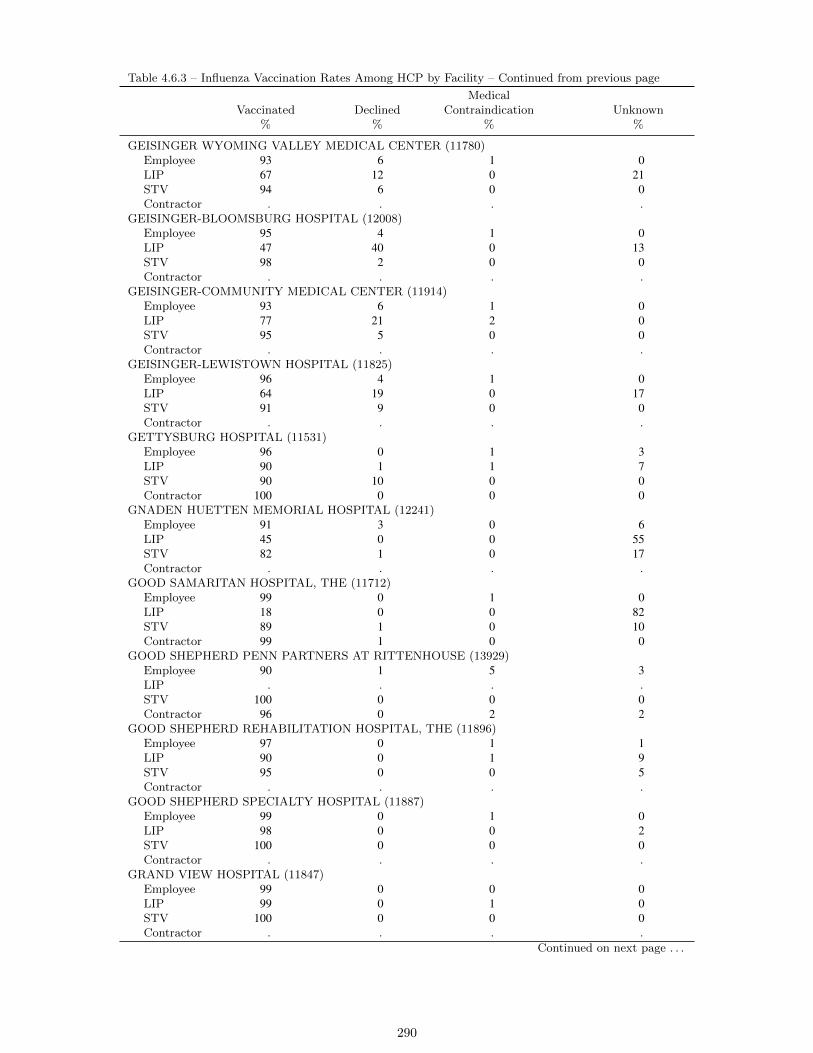
Table 4.6.3 – Influenza Vaccination Rates Among HCP by Facility – Continued from previous page
Vaccinated%
Declined%
MedicalContraindication
%Unknown
%
GEISINGER WYOMING VALLEY MEDICAL CENTER (11780)Employee 93 6 1 0LIP 67 12 0 21STV 94 6 0 0Contractor . . . .
GEISINGER-BLOOMSBURG HOSPITAL (12008)Employee 95 4 1 0LIP 47 40 0 13STV 98 2 0 0Contractor . . . .
GEISINGER-COMMUNITY MEDICAL CENTER (11914)Employee 93 6 1 0LIP 77 21 2 0STV 95 5 0 0Contractor . . . .
GEISINGER-LEWISTOWN HOSPITAL (11825)Employee 96 4 1 0LIP 64 19 0 17STV 91 9 0 0Contractor . . . .
GETTYSBURG HOSPITAL (11531)Employee 96 0 1 3LIP 90 1 1 7STV 90 10 0 0Contractor 100 0 0 0
GNADEN HUETTEN MEMORIAL HOSPITAL (12241)Employee 91 3 0 6LIP 45 0 0 55STV 82 1 0 17Contractor . . . .
GOOD SAMARITAN HOSPITAL, THE (11712)Employee 99 0 1 0LIP 18 0 0 82STV 89 1 0 10Contractor 99 1 0 0
GOOD SHEPHERD PENN PARTNERS AT RITTENHOUSE (13929)Employee 90 1 5 3LIP . . . .STV 100 0 0 0Contractor 96 0 2 2
GOOD SHEPHERD REHABILITATION HOSPITAL, THE (11896)Employee 97 0 1 1LIP 90 0 1 9STV 95 0 0 5Contractor . . . .
GOOD SHEPHERD SPECIALTY HOSPITAL (11887)Employee 99 0 1 0LIP 98 0 0 2STV 100 0 0 0Contractor . . . .
GRAND VIEW HOSPITAL (11847)Employee 99 0 0 0LIP 99 0 1 0STV 100 0 0 0Contractor . . . .
Continued on next page . . .
290
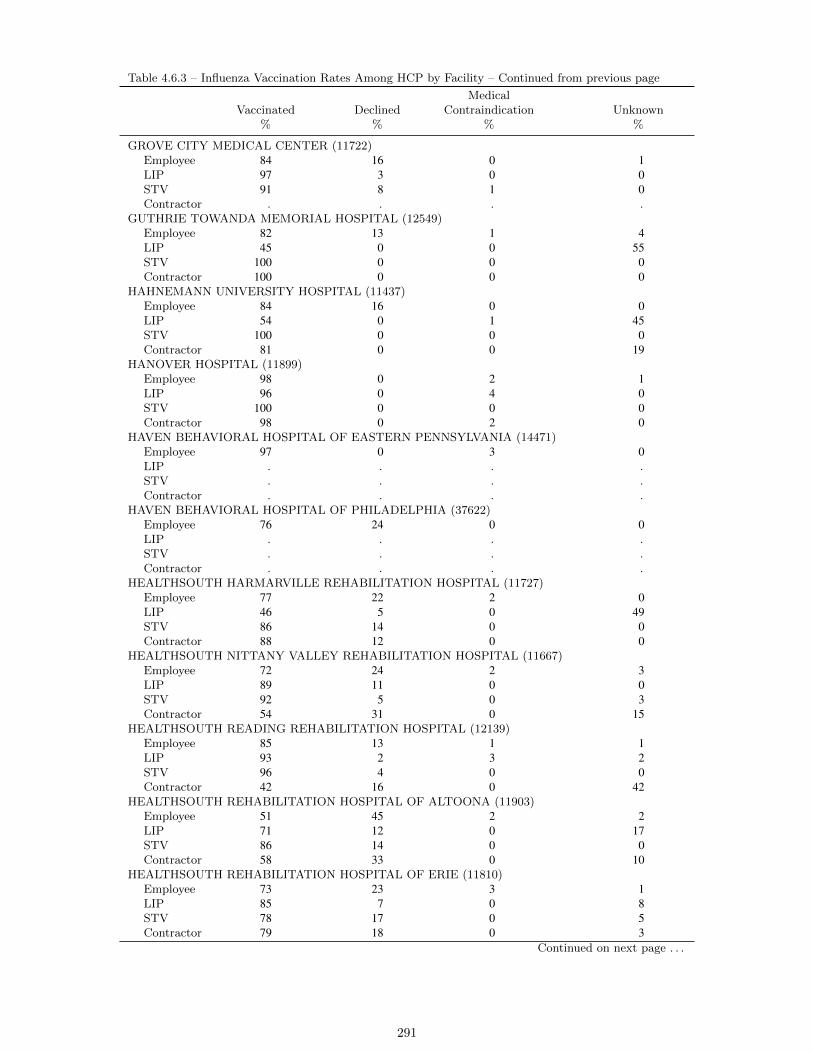
Table 4.6.3 – Influenza Vaccination Rates Among HCP by Facility – Continued from previous page
Vaccinated%
Declined%
MedicalContraindication
%Unknown
%
GROVE CITY MEDICAL CENTER (11722)Employee 84 16 0 1LIP 97 3 0 0STV 91 8 1 0Contractor . . . .
GUTHRIE TOWANDA MEMORIAL HOSPITAL (12549)Employee 82 13 1 4LIP 45 0 0 55STV 100 0 0 0Contractor 100 0 0 0
HAHNEMANN UNIVERSITY HOSPITAL (11437)Employee 84 16 0 0LIP 54 0 1 45STV 100 0 0 0Contractor 81 0 0 19
HANOVER HOSPITAL (11899)Employee 98 0 2 1LIP 96 0 4 0STV 100 0 0 0Contractor 98 0 2 0
HAVEN BEHAVIORAL HOSPITAL OF EASTERN PENNSYLVANIA (14471)Employee 97 0 3 0LIP . . . .STV . . . .Contractor . . . .
HAVEN BEHAVIORAL HOSPITAL OF PHILADELPHIA (37622)Employee 76 24 0 0LIP . . . .STV . . . .Contractor . . . .
HEALTHSOUTH HARMARVILLE REHABILITATION HOSPITAL (11727)Employee 77 22 2 0LIP 46 5 0 49STV 86 14 0 0Contractor 88 12 0 0
HEALTHSOUTH NITTANY VALLEY REHABILITATION HOSPITAL (11667)Employee 72 24 2 3LIP 89 11 0 0STV 92 5 0 3Contractor 54 31 0 15
HEALTHSOUTH READING REHABILITATION HOSPITAL (12139)Employee 85 13 1 1LIP 93 2 3 2STV 96 4 0 0Contractor 42 16 0 42
HEALTHSOUTH REHABILITATION HOSPITAL OF ALTOONA (11903)Employee 51 45 2 2LIP 71 12 0 17STV 86 14 0 0Contractor 58 33 0 10
HEALTHSOUTH REHABILITATION HOSPITAL OF ERIE (11810)Employee 73 23 3 1LIP 85 7 0 8STV 78 17 0 5Contractor 79 18 0 3
Continued on next page . . .
291

Table 4.6.3 – Influenza Vaccination Rates Among HCP by Facility – Continued from previous page
Vaccinated%
Declined%
MedicalContraindication
%Unknown
%
HEALTHSOUTH REHABILITATION HOSPITAL OF MECHANICSBURG (12402)Employee 83 15 1 0LIP 95 0 5 0STV 82 0 9 9Contractor 56 41 0 3
HEALTHSOUTH REHABILITATION HOSPITAL OF SEWICKLEY (12066)Employee 72 20 1 7LIP 71 6 0 24STV 91 6 0 3Contractor . . . .
HEALTHSOUTH REHABILITATION HOSPITAL OF YORK (12058)Employee 90 8 1 1LIP 98 2 0 0STV 99 1 0 0Contractor . . . .
HEART OF LANCASTER REGIONAL MEDICAL CENTER (12571)Employee 80 7 0 13LIP 17 0 0 83STV 42 0 0 58Contractor . . . .
HELEN M. SIMPSON REHABILITATION HOSPITAL (40371)Employee 94 2 5 0LIP 18 0 0 82STV 100 0 0 0Contractor 100 0 0 0
HERITAGE VALLEY BEAVER (11831)Employee 66 29 0 5LIP 59 2 0 39STV 58 30 0 12Contractor . . . .
HERITAGE VALLEY SEWICKLEY (10375)Employee 68 29 1 3LIP 26 1 0 74STV 49 3 1 47Contractor . . . .
HIGHLANDS HOSPITAL (11902)Employee 90 2 0 8LIP 65 0 0 35STV 98 2 0 0Contractor . . . .
HOLY REDEEMER HOSPITAL (11973)Employee 99 0 1 0LIP 100 0 0 0STV 100 0 0 0Contractor . . . .
HOLY SPIRIT HOSPITAL (12387)Employee 79 1 0 19LIP 28 0 0 72STV 46 0 0 54Contractor . . . .
HORSHAM CLINIC (12543)Employee 64 34 2 0LIP . . . .STV . . . .Contractor 25 0 0 75
Continued on next page . . .
292
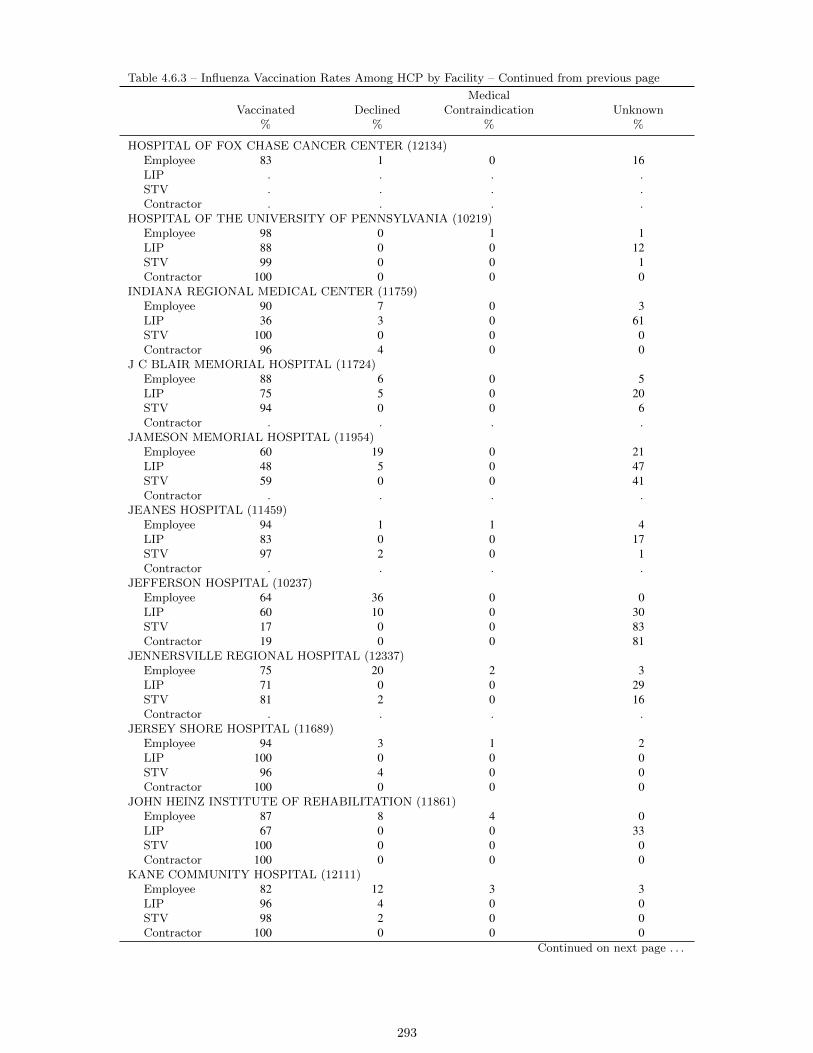
Table 4.6.3 – Influenza Vaccination Rates Among HCP by Facility – Continued from previous page
Vaccinated%
Declined%
MedicalContraindication
%Unknown
%
HOSPITAL OF FOX CHASE CANCER CENTER (12134)Employee 83 1 0 16LIP . . . .STV . . . .Contractor . . . .
HOSPITAL OF THE UNIVERSITY OF PENNSYLVANIA (10219)Employee 98 0 1 1LIP 88 0 0 12STV 99 0 0 1Contractor 100 0 0 0
INDIANA REGIONAL MEDICAL CENTER (11759)Employee 90 7 0 3LIP 36 3 0 61STV 100 0 0 0Contractor 96 4 0 0
J C BLAIR MEMORIAL HOSPITAL (11724)Employee 88 6 0 5LIP 75 5 0 20STV 94 0 0 6Contractor . . . .
JAMESON MEMORIAL HOSPITAL (11954)Employee 60 19 0 21LIP 48 5 0 47STV 59 0 0 41Contractor . . . .
JEANES HOSPITAL (11459)Employee 94 1 1 4LIP 83 0 0 17STV 97 2 0 1Contractor . . . .
JEFFERSON HOSPITAL (10237)Employee 64 36 0 0LIP 60 10 0 30STV 17 0 0 83Contractor 19 0 0 81
JENNERSVILLE REGIONAL HOSPITAL (12337)Employee 75 20 2 3LIP 71 0 0 29STV 81 2 0 16Contractor . . . .
JERSEY SHORE HOSPITAL (11689)Employee 94 3 1 2LIP 100 0 0 0STV 96 4 0 0Contractor 100 0 0 0
JOHN HEINZ INSTITUTE OF REHABILITATION (11861)Employee 87 8 4 0LIP 67 0 0 33STV 100 0 0 0Contractor 100 0 0 0
KANE COMMUNITY HOSPITAL (12111)Employee 82 12 3 3LIP 96 4 0 0STV 98 2 0 0Contractor 100 0 0 0
Continued on next page . . .
293
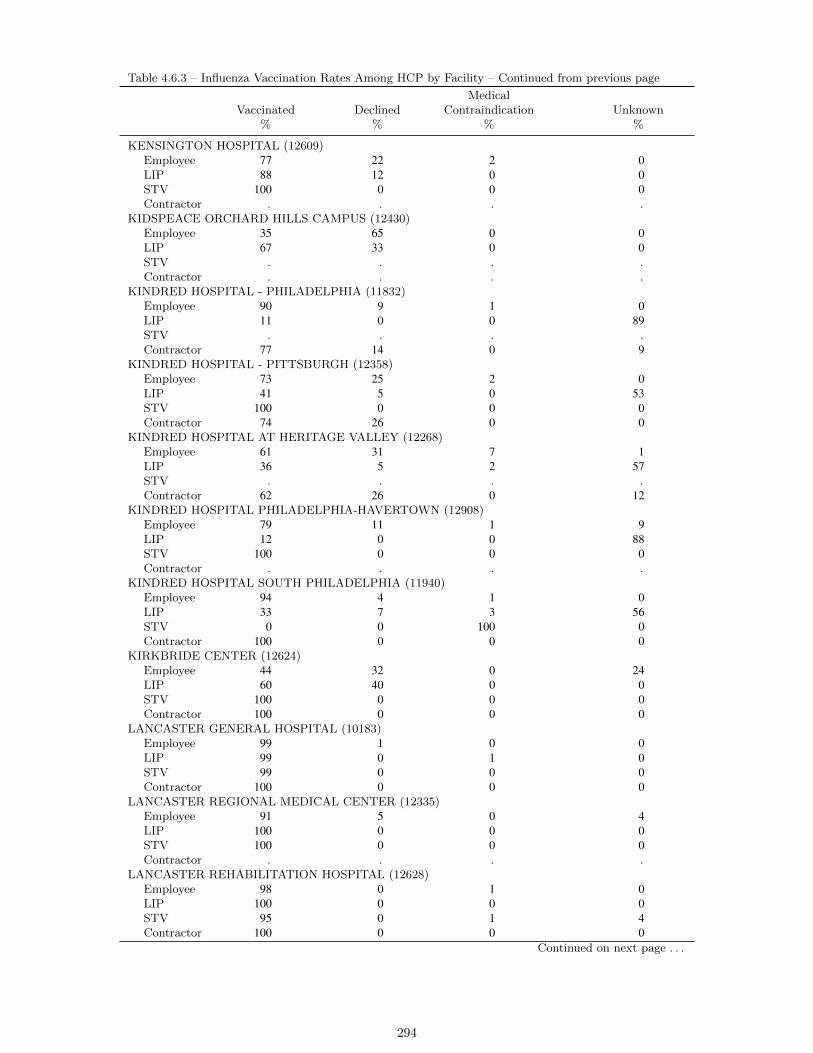
Table 4.6.3 – Influenza Vaccination Rates Among HCP by Facility – Continued from previous page
Vaccinated%
Declined%
MedicalContraindication
%Unknown
%
KENSINGTON HOSPITAL (12609)Employee 77 22 2 0LIP 88 12 0 0STV 100 0 0 0Contractor . . . .
KIDSPEACE ORCHARD HILLS CAMPUS (12430)Employee 35 65 0 0LIP 67 33 0 0STV . . . .Contractor . . . .
KINDRED HOSPITAL - PHILADELPHIA (11832)Employee 90 9 1 0LIP 11 0 0 89STV . . . .Contractor 77 14 0 9
KINDRED HOSPITAL - PITTSBURGH (12358)Employee 73 25 2 0LIP 41 5 0 53STV 100 0 0 0Contractor 74 26 0 0
KINDRED HOSPITAL AT HERITAGE VALLEY (12268)Employee 61 31 7 1LIP 36 5 2 57STV . . . .Contractor 62 26 0 12
KINDRED HOSPITAL PHILADELPHIA-HAVERTOWN (12908)Employee 79 11 1 9LIP 12 0 0 88STV 100 0 0 0Contractor . . . .
KINDRED HOSPITAL SOUTH PHILADELPHIA (11940)Employee 94 4 1 0LIP 33 7 3 56STV 0 0 100 0Contractor 100 0 0 0
KIRKBRIDE CENTER (12624)Employee 44 32 0 24LIP 60 40 0 0STV 100 0 0 0Contractor 100 0 0 0
LANCASTER GENERAL HOSPITAL (10183)Employee 99 1 0 0LIP 99 0 1 0STV 99 0 0 0Contractor 100 0 0 0
LANCASTER REGIONAL MEDICAL CENTER (12335)Employee 91 5 0 4LIP 100 0 0 0STV 100 0 0 0Contractor . . . .
LANCASTER REHABILITATION HOSPITAL (12628)Employee 98 0 1 0LIP 100 0 0 0STV 95 0 1 4Contractor 100 0 0 0
Continued on next page . . .
294

Table 4.6.3 – Influenza Vaccination Rates Among HCP by Facility – Continued from previous page
Vaccinated%
Declined%
MedicalContraindication
%Unknown
%
LANSDALE HOSPITAL (12032)Employee 100 0 0 0LIP 100 0 0 0STV 100 0 0 0Contractor . . . .
LEHIGH VALLEY HOSPITAL - HAZLETON (11878)Employee 63 27 1 9LIP 100 0 0 0STV 100 0 0 0Contractor 100 0 0 0
LEHIGH VALLEY HOSPITAL - MUHLENBERG (11898)Employee 100 0 0 0LIP 99 1 0 0STV 100 0 0 0Contractor . . . .
LEHIGH VALLEY HOSPITAL (11884)Employee 99 1 0 0LIP 99 1 0 0STV 100 0 0 0Contractor . . . .
LIFECARE HOSPITALS OF CHESTER COUNTY LLC (12005)Employee 97 1 1 2LIP 78 1 1 20STV . . . .Contractor . . . .
LIFECARE HOSPITALS OF MECHANICSBURG (12388)Employee 86 7 2 6LIP 63 11 3 22STV 100 0 0 0Contractor . . . .
LIFECARE HOSPITALS OF PITTSBURGH - ALLE-KISKI CAMPUS (18955)Employee 72 12 0 16LIP 16 1 0 83STV 100 0 0 0Contractor . . . .
LIFECARE HOSPITALS OF PITTSBURGH - MONROEVILLE (12254)Employee 78 11 0 11LIP 8 0 0 92STV 80 0 0 20Contractor . . . .
LIFECARE HOSPITALS OF PITTSBURGH - SUBURBAN CAMPUS (12385)Employee 72 12 0 16LIP 16 1 0 83STV 87 0 0 13Contractor . . . .
LIFECARE HOSPITALS OF PITTSBURGH (11945)Employee 73 12 0 15LIP 16 1 0 83STV 100 0 0 0Contractor . . . .
LOCK HAVEN HOSPITAL (12097)Employee 99 1 0 0LIP 100 0 0 0STV 100 0 0 0Contractor 100 0 0 0
Continued on next page . . .
295

Table 4.6.3 – Influenza Vaccination Rates Among HCP by Facility – Continued from previous page
Vaccinated%
Declined%
MedicalContraindication
%Unknown
%
LOWER BUCKS HOSPITAL (12390)Employee 99 0 1 0LIP 98 0 1 0STV 70 0 0 30Contractor . . . .
MAGEE REHABILITATION HOSPITAL (12146)Employee 98 0 2 0LIP 100 0 0 0STV 100 0 0 0Contractor 100 0 0 0
MAGEE WOMENS HOSPITAL OF UPMC HEALTH SYSTEM (10301)Employee 86 14 0 0LIP 96 4 0 0STV 68 12 0 20Contractor . . . .
MAIN LINE HOSPITAL - PAOLI (11750)Employee 97 0 3 0LIP 96 0 4 0STV 100 0 0 0Contractor . . . .
MAIN LINE HOSPITAL BRYN MAWR (11753)Employee 98 0 2 0LIP 96 0 4 0STV 100 0 0 0Contractor . . . .
MAIN LINE HOSPITAL BRYN MAWR REHABILITATION (11417)Employee 96 0 4 0LIP 96 0 4 0STV 100 0 0 0Contractor . . . .
MAIN LINE HOSPITAL LANKENAU MEDICAL CENTER (11770)Employee 98 0 2 0LIP 96 0 4 0STV 100 0 0 0Contractor . . . .
MEADOWS PSYCHIATRIC CENTER, THE (12156)Employee 44 48 3 5LIP . . . .STV 100 0 0 0Contractor 71 0 0 29
MEADVILLE MEDICAL CENTER (11583)Employee 97 2 1 1LIP 90 3 2 6STV 97 1 0 2Contractor 96 0 0 4
MEMORIAL HOSPITAL (11633)Employee 89 5 0 5LIP 14 0 0 86STV 97 3 0 0Contractor . . . .
MERCY FITZGERALD HOSPITAL (11683)Employee 96 0 1 3LIP 69 0 0 31STV 100 0 0 0Contractor . . . .
Continued on next page . . .
296
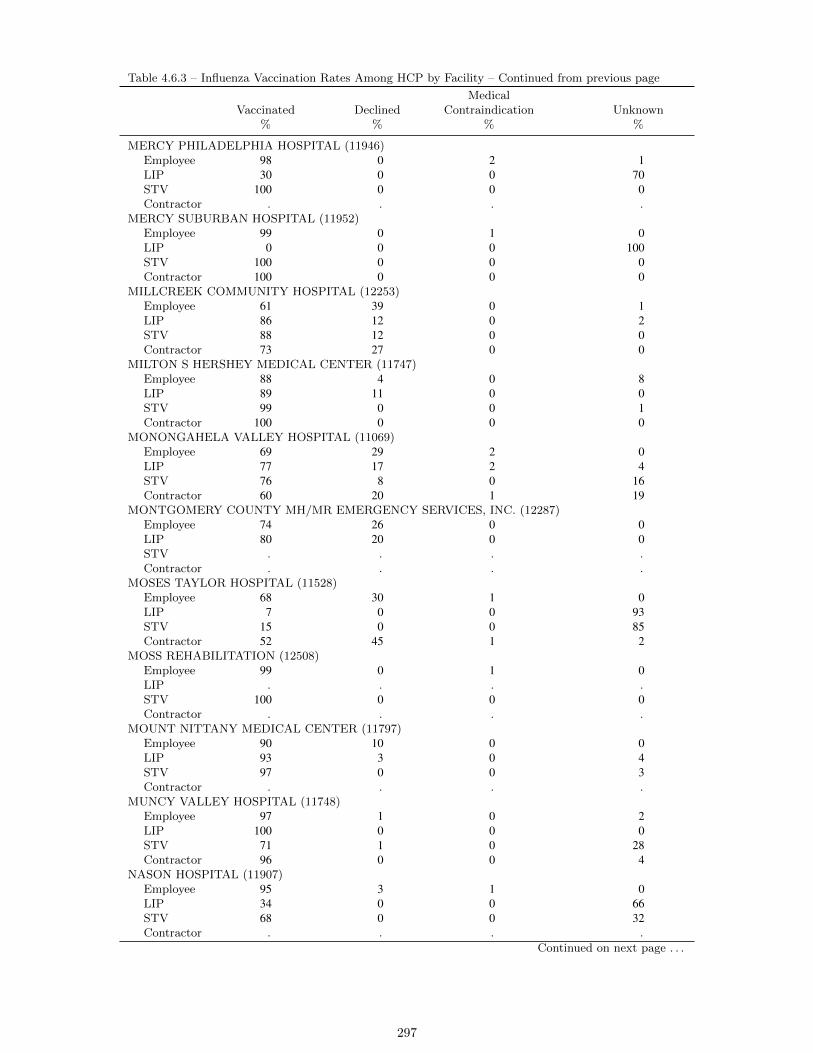
Table 4.6.3 – Influenza Vaccination Rates Among HCP by Facility – Continued from previous page
Vaccinated%
Declined%
MedicalContraindication
%Unknown
%
MERCY PHILADELPHIA HOSPITAL (11946)Employee 98 0 2 1LIP 30 0 0 70STV 100 0 0 0Contractor . . . .
MERCY SUBURBAN HOSPITAL (11952)Employee 99 0 1 0LIP 0 0 0 100STV 100 0 0 0Contractor 100 0 0 0
MILLCREEK COMMUNITY HOSPITAL (12253)Employee 61 39 0 1LIP 86 12 0 2STV 88 12 0 0Contractor 73 27 0 0
MILTON S HERSHEY MEDICAL CENTER (11747)Employee 88 4 0 8LIP 89 11 0 0STV 99 0 0 1Contractor 100 0 0 0
MONONGAHELA VALLEY HOSPITAL (11069)Employee 69 29 2 0LIP 77 17 2 4STV 76 8 0 16Contractor 60 20 1 19
MONTGOMERY COUNTY MH/MR EMERGENCY SERVICES, INC. (12287)Employee 74 26 0 0LIP 80 20 0 0STV . . . .Contractor . . . .
MOSES TAYLOR HOSPITAL (11528)Employee 68 30 1 0LIP 7 0 0 93STV 15 0 0 85Contractor 52 45 1 2
MOSS REHABILITATION (12508)Employee 99 0 1 0LIP . . . .STV 100 0 0 0Contractor . . . .
MOUNT NITTANY MEDICAL CENTER (11797)Employee 90 10 0 0LIP 93 3 0 4STV 97 0 0 3Contractor . . . .
MUNCY VALLEY HOSPITAL (11748)Employee 97 1 0 2LIP 100 0 0 0STV 71 1 0 28Contractor 96 0 0 4
NASON HOSPITAL (11907)Employee 95 3 1 0LIP 34 0 0 66STV 68 0 0 32Contractor . . . .
Continued on next page . . .
297

Table 4.6.3 – Influenza Vaccination Rates Among HCP by Facility – Continued from previous page
Vaccinated%
Declined%
MedicalContraindication
%Unknown
%
NAZARETH HOSPITAL (11919)Employee 97 0 1 2LIP 51 0 0 49STV 100 0 0 0Contractor . . . .
NORRISTOWN STATE HOSPITAL (12047)Employee 47 8 1 44LIP . . . .STV 11 0 0 89Contractor . . . .
OHIO VALLEY GENERAL HOSPITAL (12298)Employee 96 2 0 1LIP 87 4 1 7STV 92 4 1 3Contractor 91 9 0 0
OSS ORTHOPAEDIC HOSPITAL (18467)Employee 92 6 1 1LIP 98 2 0 0STV 83 0 0 17Contractor . . . .
PALMERTON HOSPITAL (12396)Employee 92 2 1 5LIP 45 0 0 55STV 84 2 0 14Contractor . . . .
PENN HIGHLANDS BROOKVILLE (12418)Employee 88 3 0 9LIP 33 0 0 67STV . . . .Contractor 100 0 0 0
PENN HIGHLANDS CLEARFIELD (11843)Employee 94 6 0 0LIP 85 15 0 0STV 91 5 5 0Contractor 100 0 0 0
PENN HIGHLANDS DUBOIS (11606)Employee 96 4 0 0LIP 33 0 0 67STV 87 5 0 8Contractor . . . .
PENN HIGHLANDS ELK (11859)Employee 95 5 0 0LIP 62 38 0 0STV 87 13 0 0Contractor 91 9 0 0
PENN PRESBYTERIAN MEDICAL CENTER (11814)Employee 98 0 0 2LIP 81 0 1 18STV 96 3 0 1Contractor 94 5 0 1
PENN STATE HERSHEY REHABILITATION LLC (11915)Employee 74 2 0 23LIP 100 0 0 0STV 59 0 0 41Contractor 17 0 0 83
Continued on next page . . .
298

Table 4.6.3 – Influenza Vaccination Rates Among HCP by Facility – Continued from previous page
Vaccinated%
Declined%
MedicalContraindication
%Unknown
%
PENNSYLVANIA HOSPITAL OF THE UNIVERSITY OF PA HEALTH SYS (11448)Employee 98 0 1 0LIP 46 0 0 53STV 100 0 0 0Contractor . . . .
PENNSYLVANIA PSYCHIATRIC INSTITUTE (14190)Employee 63 18 3 16LIP 65 27 2 6STV 100 0 0 0Contractor 67 0 33 0
PHILHAVEN HOSPITAL (11740)Employee 58 33 3 6LIP 84 3 0 12STV 77 1 0 22Contractor 62 6 0 31
PHOENIXVILLE HOSPITAL COMPANY LLC (11836)Employee 79 16 1 4LIP 64 2 1 33STV 95 3 1 1Contractor 100 0 0 0
PHYSICIANS CARE SURGICAL HOSPITAL (19630)Employee 90 0 0 10LIP 85 0 0 15STV 100 0 0 0Contractor 100 0 0 0
PINNACLE HEALTH HOSPITALS - COMMUNITY GENERAL OSTEOPATHIC HOSPITAL (34069)Employee 98 0 0 1LIP 61 0 1 38STV 98 0 1 0Contractor . . . .
PINNACLE HEALTH HOSPITALS - HARRISBURG HOSPITAL (34068)Employee 98 0 1 1LIP 61 0 1 38STV 99 0 0 1Contractor . . . .
PINNACLE HEALTH HOSPITALS - WEST SHORE HOSPITAL (35123)Employee 97 0 0 2LIP 61 0 1 38STV 99 1 0 0Contractor . . . .
POCONO MEDICAL CENTER (11772)Employee 86 3 0 11LIP 79 0 0 21STV 68 0 0 32Contractor 68 0 0 32
POST ACUTE MEDICAL SPECIALTY HOSPITAL OF WILKES-BARRE (12604)Employee 53 36 1 11LIP 44 0 0 56STV 100 0 0 0Contractor 49 0 0 51
POTTSTOWN MEMORIAL MEDICAL CENTER (11983)Employee 65 23 2 11LIP 12 1 0 87STV 20 0 0 80Contractor 55 12 0 33
Continued on next page . . .
299
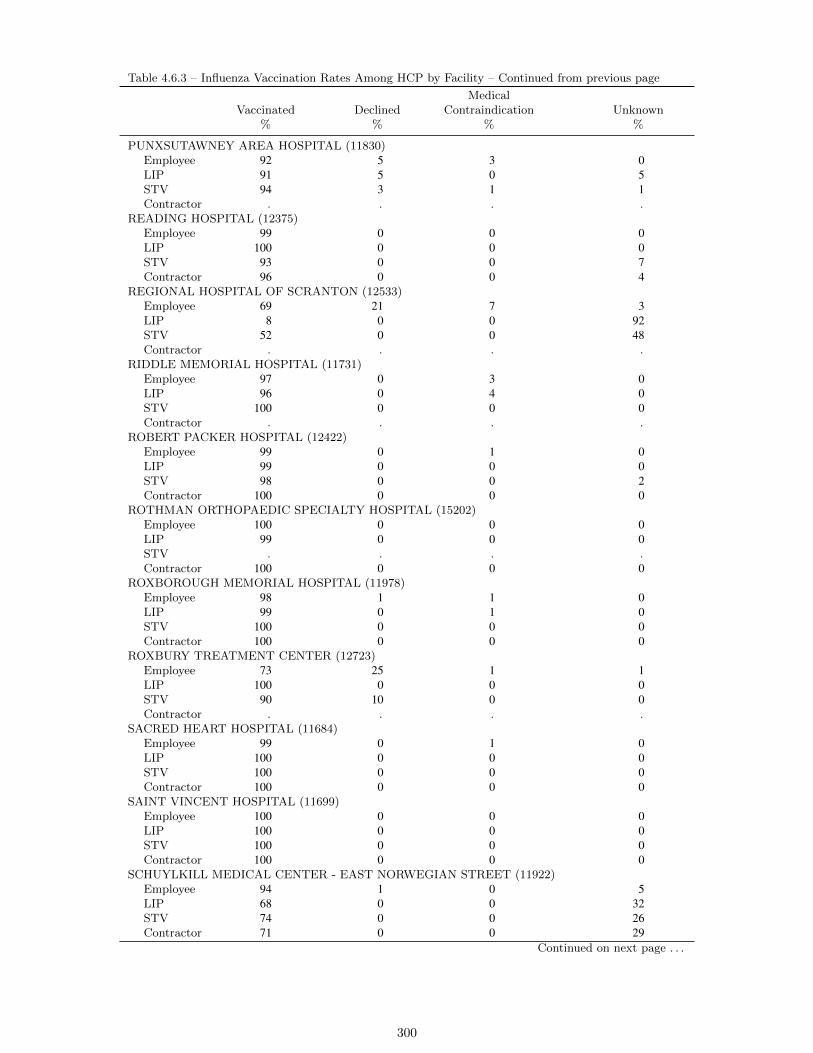
Table 4.6.3 – Influenza Vaccination Rates Among HCP by Facility – Continued from previous page
Vaccinated%
Declined%
MedicalContraindication
%Unknown
%
PUNXSUTAWNEY AREA HOSPITAL (11830)Employee 92 5 3 0LIP 91 5 0 5STV 94 3 1 1Contractor . . . .
READING HOSPITAL (12375)Employee 99 0 0 0LIP 100 0 0 0STV 93 0 0 7Contractor 96 0 0 4
REGIONAL HOSPITAL OF SCRANTON (12533)Employee 69 21 7 3LIP 8 0 0 92STV 52 0 0 48Contractor . . . .
RIDDLE MEMORIAL HOSPITAL (11731)Employee 97 0 3 0LIP 96 0 4 0STV 100 0 0 0Contractor . . . .
ROBERT PACKER HOSPITAL (12422)Employee 99 0 1 0LIP 99 0 0 0STV 98 0 0 2Contractor 100 0 0 0
ROTHMAN ORTHOPAEDIC SPECIALTY HOSPITAL (15202)Employee 100 0 0 0LIP 99 0 0 0STV . . . .Contractor 100 0 0 0
ROXBOROUGH MEMORIAL HOSPITAL (11978)Employee 98 1 1 0LIP 99 0 1 0STV 100 0 0 0Contractor 100 0 0 0
ROXBURY TREATMENT CENTER (12723)Employee 73 25 1 1LIP 100 0 0 0STV 90 10 0 0Contractor . . . .
SACRED HEART HOSPITAL (11684)Employee 99 0 1 0LIP 100 0 0 0STV 100 0 0 0Contractor 100 0 0 0
SAINT VINCENT HOSPITAL (11699)Employee 100 0 0 0LIP 100 0 0 0STV 100 0 0 0Contractor 100 0 0 0
SCHUYLKILL MEDICAL CENTER - EAST NORWEGIAN STREET (11922)Employee 94 1 0 5LIP 68 0 0 32STV 74 0 0 26Contractor 71 0 0 29
Continued on next page . . .
300
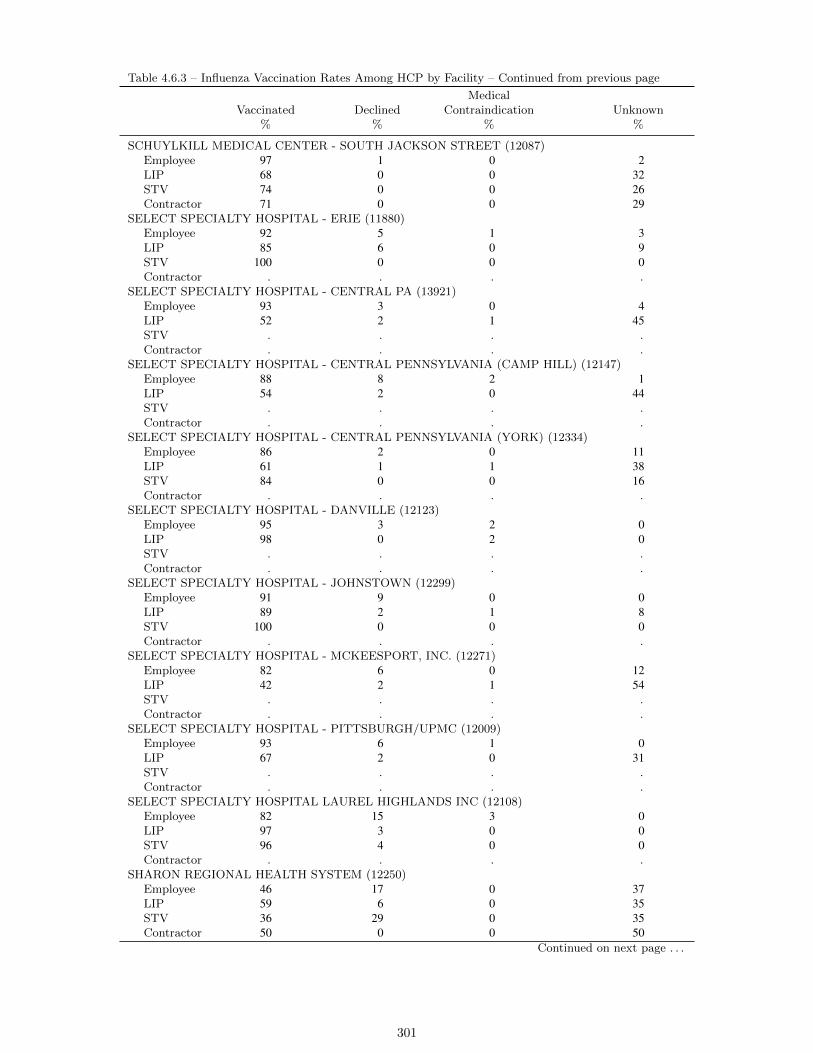
Table 4.6.3 – Influenza Vaccination Rates Among HCP by Facility – Continued from previous page
Vaccinated%
Declined%
MedicalContraindication
%Unknown
%
SCHUYLKILL MEDICAL CENTER - SOUTH JACKSON STREET (12087)Employee 97 1 0 2LIP 68 0 0 32STV 74 0 0 26Contractor 71 0 0 29
SELECT SPECIALTY HOSPITAL - ERIE (11880)Employee 92 5 1 3LIP 85 6 0 9STV 100 0 0 0Contractor . . . .
SELECT SPECIALTY HOSPITAL - CENTRAL PA (13921)Employee 93 3 0 4LIP 52 2 1 45STV . . . .Contractor . . . .
SELECT SPECIALTY HOSPITAL - CENTRAL PENNSYLVANIA (CAMP HILL) (12147)Employee 88 8 2 1LIP 54 2 0 44STV . . . .Contractor . . . .
SELECT SPECIALTY HOSPITAL - CENTRAL PENNSYLVANIA (YORK) (12334)Employee 86 2 0 11LIP 61 1 1 38STV 84 0 0 16Contractor . . . .
SELECT SPECIALTY HOSPITAL - DANVILLE (12123)Employee 95 3 2 0LIP 98 0 2 0STV . . . .Contractor . . . .
SELECT SPECIALTY HOSPITAL - JOHNSTOWN (12299)Employee 91 9 0 0LIP 89 2 1 8STV 100 0 0 0Contractor . . . .
SELECT SPECIALTY HOSPITAL - MCKEESPORT, INC. (12271)Employee 82 6 0 12LIP 42 2 1 54STV . . . .Contractor . . . .
SELECT SPECIALTY HOSPITAL - PITTSBURGH/UPMC (12009)Employee 93 6 1 0LIP 67 2 0 31STV . . . .Contractor . . . .
SELECT SPECIALTY HOSPITAL LAUREL HIGHLANDS INC (12108)Employee 82 15 3 0LIP 97 3 0 0STV 96 4 0 0Contractor . . . .
SHARON REGIONAL HEALTH SYSTEM (12250)Employee 46 17 0 37LIP 59 6 0 35STV 36 29 0 35Contractor 50 0 0 50
Continued on next page . . .
301
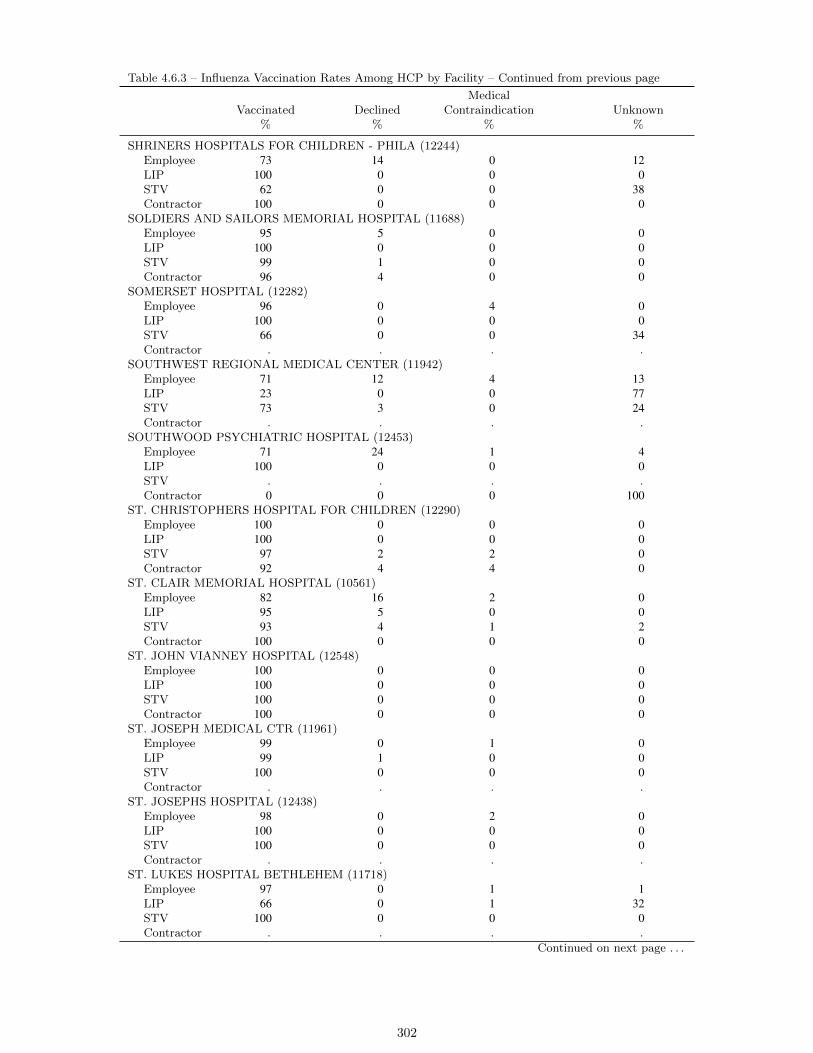
Table 4.6.3 – Influenza Vaccination Rates Among HCP by Facility – Continued from previous page
Vaccinated%
Declined%
MedicalContraindication
%Unknown
%
SHRINERS HOSPITALS FOR CHILDREN - PHILA (12244)Employee 73 14 0 12LIP 100 0 0 0STV 62 0 0 38Contractor 100 0 0 0
SOLDIERS AND SAILORS MEMORIAL HOSPITAL (11688)Employee 95 5 0 0LIP 100 0 0 0STV 99 1 0 0Contractor 96 4 0 0
SOMERSET HOSPITAL (12282)Employee 96 0 4 0LIP 100 0 0 0STV 66 0 0 34Contractor . . . .
SOUTHWEST REGIONAL MEDICAL CENTER (11942)Employee 71 12 4 13LIP 23 0 0 77STV 73 3 0 24Contractor . . . .
SOUTHWOOD PSYCHIATRIC HOSPITAL (12453)Employee 71 24 1 4LIP 100 0 0 0STV . . . .Contractor 0 0 0 100
ST. CHRISTOPHERS HOSPITAL FOR CHILDREN (12290)Employee 100 0 0 0LIP 100 0 0 0STV 97 2 2 0Contractor 92 4 4 0
ST. CLAIR MEMORIAL HOSPITAL (10561)Employee 82 16 2 0LIP 95 5 0 0STV 93 4 1 2Contractor 100 0 0 0
ST. JOHN VIANNEY HOSPITAL (12548)Employee 100 0 0 0LIP 100 0 0 0STV 100 0 0 0Contractor 100 0 0 0
ST. JOSEPH MEDICAL CTR (11961)Employee 99 0 1 0LIP 99 1 0 0STV 100 0 0 0Contractor . . . .
ST. JOSEPHS HOSPITAL (12438)Employee 98 0 2 0LIP 100 0 0 0STV 100 0 0 0Contractor . . . .
ST. LUKES HOSPITAL BETHLEHEM (11718)Employee 97 0 1 1LIP 66 0 1 32STV 100 0 0 0Contractor . . . .
Continued on next page . . .
302
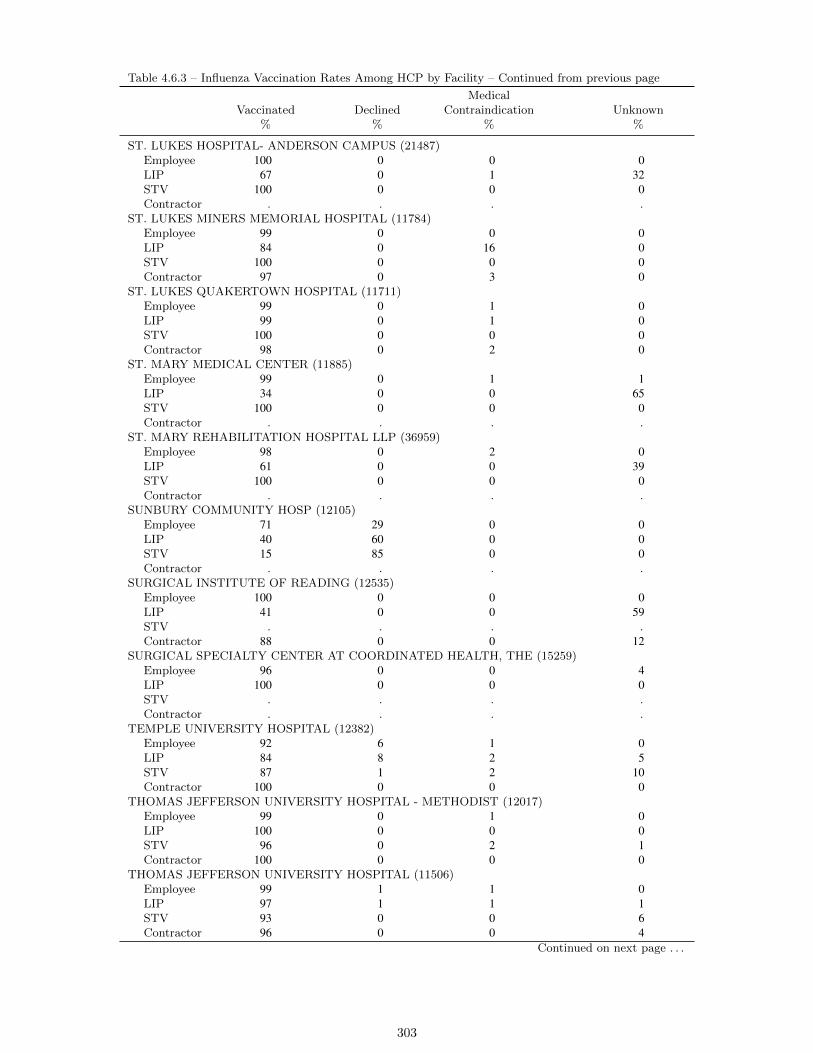
Table 4.6.3 – Influenza Vaccination Rates Among HCP by Facility – Continued from previous page
Vaccinated%
Declined%
MedicalContraindication
%Unknown
%
ST. LUKES HOSPITAL- ANDERSON CAMPUS (21487)Employee 100 0 0 0LIP 67 0 1 32STV 100 0 0 0Contractor . . . .
ST. LUKES MINERS MEMORIAL HOSPITAL (11784)Employee 99 0 0 0LIP 84 0 16 0STV 100 0 0 0Contractor 97 0 3 0
ST. LUKES QUAKERTOWN HOSPITAL (11711)Employee 99 0 1 0LIP 99 0 1 0STV 100 0 0 0Contractor 98 0 2 0
ST. MARY MEDICAL CENTER (11885)Employee 99 0 1 1LIP 34 0 0 65STV 100 0 0 0Contractor . . . .
ST. MARY REHABILITATION HOSPITAL LLP (36959)Employee 98 0 2 0LIP 61 0 0 39STV 100 0 0 0Contractor . . . .
SUNBURY COMMUNITY HOSP (12105)Employee 71 29 0 0LIP 40 60 0 0STV 15 85 0 0Contractor . . . .
SURGICAL INSTITUTE OF READING (12535)Employee 100 0 0 0LIP 41 0 0 59STV . . . .Contractor 88 0 0 12
SURGICAL SPECIALTY CENTER AT COORDINATED HEALTH, THE (15259)Employee 96 0 0 4LIP 100 0 0 0STV . . . .Contractor . . . .
TEMPLE UNIVERSITY HOSPITAL (12382)Employee 92 6 1 0LIP 84 8 2 5STV 87 1 2 10Contractor 100 0 0 0
THOMAS JEFFERSON UNIVERSITY HOSPITAL - METHODIST (12017)Employee 99 0 1 0LIP 100 0 0 0STV 96 0 2 1Contractor 100 0 0 0
THOMAS JEFFERSON UNIVERSITY HOSPITAL (11506)Employee 99 1 1 0LIP 97 1 1 1STV 93 0 0 6Contractor 96 0 0 4
Continued on next page . . .
303
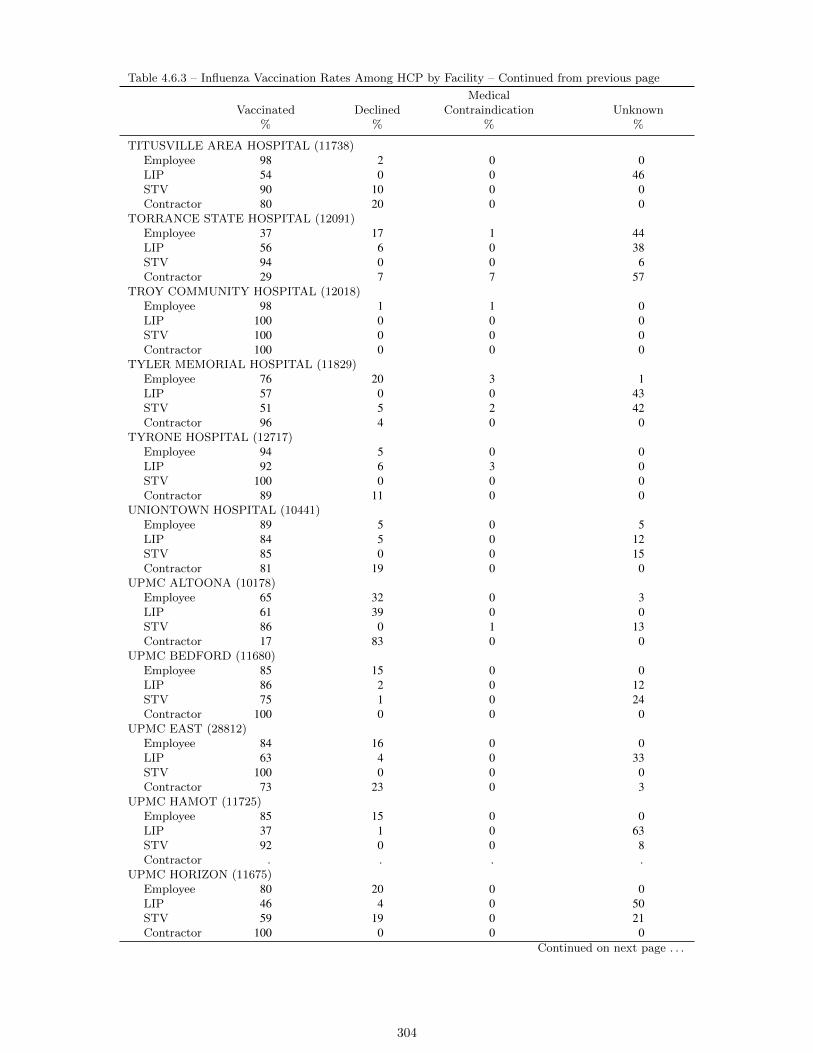
Table 4.6.3 – Influenza Vaccination Rates Among HCP by Facility – Continued from previous page
Vaccinated%
Declined%
MedicalContraindication
%Unknown
%
TITUSVILLE AREA HOSPITAL (11738)Employee 98 2 0 0LIP 54 0 0 46STV 90 10 0 0Contractor 80 20 0 0
TORRANCE STATE HOSPITAL (12091)Employee 37 17 1 44LIP 56 6 0 38STV 94 0 0 6Contractor 29 7 7 57
TROY COMMUNITY HOSPITAL (12018)Employee 98 1 1 0LIP 100 0 0 0STV 100 0 0 0Contractor 100 0 0 0
TYLER MEMORIAL HOSPITAL (11829)Employee 76 20 3 1LIP 57 0 0 43STV 51 5 2 42Contractor 96 4 0 0
TYRONE HOSPITAL (12717)Employee 94 5 0 0LIP 92 6 3 0STV 100 0 0 0Contractor 89 11 0 0
UNIONTOWN HOSPITAL (10441)Employee 89 5 0 5LIP 84 5 0 12STV 85 0 0 15Contractor 81 19 0 0
UPMC ALTOONA (10178)Employee 65 32 0 3LIP 61 39 0 0STV 86 0 1 13Contractor 17 83 0 0
UPMC BEDFORD (11680)Employee 85 15 0 0LIP 86 2 0 12STV 75 1 0 24Contractor 100 0 0 0
UPMC EAST (28812)Employee 84 16 0 0LIP 63 4 0 33STV 100 0 0 0Contractor 73 23 0 3
UPMC HAMOT (11725)Employee 85 15 0 0LIP 37 1 0 63STV 92 0 0 8Contractor . . . .
UPMC HORIZON (11675)Employee 80 20 0 0LIP 46 4 0 50STV 59 19 0 21Contractor 100 0 0 0
Continued on next page . . .
304
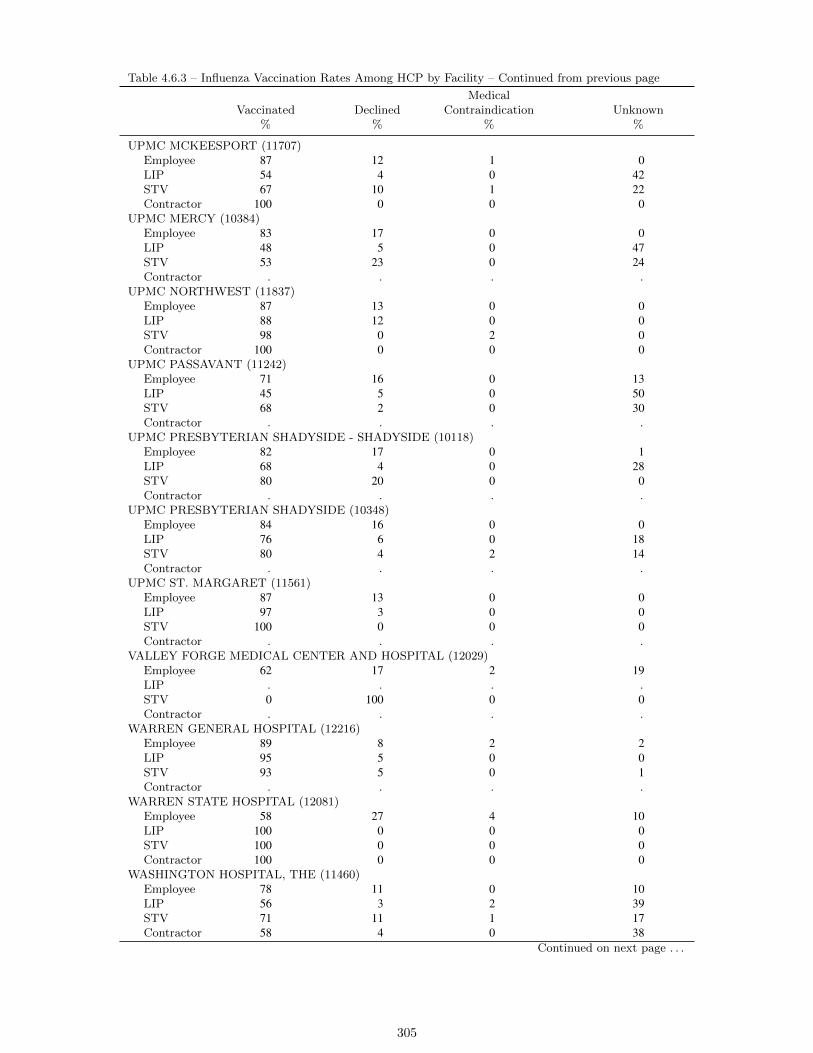
Table 4.6.3 – Influenza Vaccination Rates Among HCP by Facility – Continued from previous page
Vaccinated%
Declined%
MedicalContraindication
%Unknown
%
UPMC MCKEESPORT (11707)Employee 87 12 1 0LIP 54 4 0 42STV 67 10 1 22Contractor 100 0 0 0
UPMC MERCY (10384)Employee 83 17 0 0LIP 48 5 0 47STV 53 23 0 24Contractor . . . .
UPMC NORTHWEST (11837)Employee 87 13 0 0LIP 88 12 0 0STV 98 0 2 0Contractor 100 0 0 0
UPMC PASSAVANT (11242)Employee 71 16 0 13LIP 45 5 0 50STV 68 2 0 30Contractor . . . .
UPMC PRESBYTERIAN SHADYSIDE - SHADYSIDE (10118)Employee 82 17 0 1LIP 68 4 0 28STV 80 20 0 0Contractor . . . .
UPMC PRESBYTERIAN SHADYSIDE (10348)Employee 84 16 0 0LIP 76 6 0 18STV 80 4 2 14Contractor . . . .
UPMC ST. MARGARET (11561)Employee 87 13 0 0LIP 97 3 0 0STV 100 0 0 0Contractor . . . .
VALLEY FORGE MEDICAL CENTER AND HOSPITAL (12029)Employee 62 17 2 19LIP . . . .STV 0 100 0 0Contractor . . . .
WARREN GENERAL HOSPITAL (12216)Employee 89 8 2 2LIP 95 5 0 0STV 93 5 0 1Contractor . . . .
WARREN STATE HOSPITAL (12081)Employee 58 27 4 10LIP 100 0 0 0STV 100 0 0 0Contractor 100 0 0 0
WASHINGTON HOSPITAL, THE (11460)Employee 78 11 0 10LIP 56 3 2 39STV 71 11 1 17Contractor 58 4 0 38
Continued on next page . . .
305

Table 4.6.3 – Influenza Vaccination Rates Among HCP by Facility – Continued from previous page
Vaccinated%
Declined%
MedicalContraindication
%Unknown
%
WAYNE MEMORIAL HOSPITAL (12004)Employee 87 3 0 10LIP 50 0 0 50STV 82 3 0 16Contractor 100 0 0 0
WAYNESBORO HOSPITAL (11642)Employee 89 11 0 0LIP 81 19 0 0STV 94 6 0 0Contractor . . . .
WELLSPAN SURGERY AND REHABILITATION HOSPITAL (27430)Employee 99 0 0 0LIP 100 0 0 0STV 100 0 0 0Contractor 100 0 0 0
WERNERSVILLE STATE HOSPITAL (12368)Employee 70 26 4 0LIP 100 0 0 0STV 97 3 0 0Contractor 58 12 0 31
WEST PENN HOSPITAL (11864)Employee 83 17 0 0LIP 8 0 0 92STV 48 0 0 51Contractor 57 10 0 33
WESTERN PSYCHIATRIC INSTITUTE AND CLINIC (13702)Employee 77 23 0 0LIP 79 0 4 16STV 71 0 0 29Contractor . . . .
WILKES-BARRE GENERAL HOSPITAL (11916)Employee 57 24 0 19LIP 8 0 0 92STV 0 0 0 100Contractor . . . .
WILLIAMSPORT REGIONAL MEDICAL CENTER (11732)Employee 97 1 0 2LIP 100 0 0 0STV 60 0 0 40Contractor 96 0 0 4
WILLS EYE HOSPITAL (34846)Employee 100 0 0 0LIP 100 0 0 0STV . . . .Contractor . . . .
WINDBER HOSPITAL (12031)Employee 89 10 0 1LIP 18 0 0 82STV 61 0 0 39Contractor . . . .
YORK HOSPITAL (10108)Employee 95 1 1 4LIP 99 0 1 0STV 96 4 0 0Contractor 100 0 0 0
306

5 Conclusion
The 2014 report is the seventh report published by PADOH since reporting was mandated by the 2007 amendment tothe MCARE Act. This report, like previous reports, demonstrates the significant progress and enduring commitmentmade by hospitals in Pennsylvania to reduce HAIs. Hospitals have demonstrated particular success in driving downCLABSI and CAUTI rates (41 percent and 20 percent decrease respectively since 2009) and improving influenzavaccination rates among health care personnel (173 percent increase since 2011–2012 influenza season). In addition,the SSI rates for cardiac procedures, cardiac bypass graft surgery with one incision, cardiac bypass graft surgery withtwo incisions, knee prosthesis procedures and hip prosthesis surgeries are the lowest they’ve ever been since reportingwas implemented.
It has been estimated (Scott, 2009) that the average cost of any type of HAI is between $14,000 – $15,000, consideringonly direct medical costs. HAIs such as bloodstream infections and surgical site infections are known to be muchcostlier. Using conservative estimates, the reductions seen over the last four years in Pennsylvania have saved aminimum of $138 million in direct health care costs that would have been associated with those HAIs.
The reductions seen in Pennsylvania are the result of a concerted effort on the part of the infection preventioncommunity to address the problem of HAIs. Some of the factors that have contributed to the favorable trends arethe increased spotlight on HAIs by the public, public reporting of data, implementation of prevention strategies byinfection preventionists, health care providers and health care systems, participation in prevention collaboratives,increased scrutiny by hospital administration and federal efforts to link incentive payments to successful control ofHAIs.
As seen throughout this report, there is significant variation in the rates of HAIs among the 247 hospitals in Penn-sylvania. The major reason for these differences is the wide variation in the type of care being provided, the intensityof care, and the patient population being served. Larger tertiary referral centers would be expected to providemore intensive care for sicker patients who are at greater risk for developing an HAI. The analyses presented in thisreport recognize these differences through the use of risk adjustments methods for the CAUTI, CLABSI and SSIstandardized infection ratios. However, these risk adjustment methods are imperfect and cannot fully account forall of these differences between hospitals. It is important to keep this in mind when using the information containedin this report. The HAI rate is only one factor that should be used when making decisions about where to receivehealth care; it should not necessarily be construed that hospitals with higher rates or SIRs provide ”worse” care andhospitals with lower rates and SIRs provide ”better” care.
The section of the 2014 report dealing with health care personnel influenza vaccination provides an alternative metricin measuring hospital commitment to patient safety and HAI prevention. The median employee influenza vaccinationrate was 89 percent and 120 facilities achieved employee vaccination rates of 90 percent or better, a 2020 HealthyPeople goal, during the 2014–2015 influenza season. This is a dramatic 173 percent improvement from baselinedata. The number of facilities at goal for employees, licensed independent practitioners and students, trainees andvolunteers increased from 6 to 50 since the 2011–2012 influenza season. This is a 733 percent improvement! There iswidespread agreement in the health care community that health care workers ought to be vaccinated against influenzato protect their own health and to protect the health of their patients. Vaccination also decreases absenteeism (upto 30 percent in some studies) and preserves surge capacity during flu season. Universal influenza vaccination of thehealth care workforce (generally defined as 90 percent or better vaccination coverage) is endorsed by major medicalorganizations and federal recommendations. These improvements are the result of collaboration between facilitiesand stakeholders across the state, sharing of best practices and strong leadership within facilities.
Despite these notable achievements among many facilities, HCP vaccination rates are still significantly below goalfor other facilities. The hospitals with the highest vaccination coverage have done so through mandatory vaccinationpolicies as a condition of employment. This policy is the only one that has been shown to consistently resultin high levels of vaccination (often greater than 97 percent coverage; Talbot et al., 2010). Other methods canalso be successful, but generally require a great deal of effort to promote vaccination and encourage personnelto receive the vaccine; they have also been difficult to sustain over time. Hospitals are encouraged to considermandatory vaccination policies in order to achieve the Healthy People 2020 goal. The Pennsylvania Departmentof Health will continue to be publish HCP influenza vaccination rates in this report and the Centers for Medicaidand Medicare Services will be publishing HCP influenza vaccination rates on the CMS Hospital Compare Website
307
(https://data.medicare.gov/data/hospital-compare) for those facilities that receive reimbursement for servicesthrough the Inpatient Prospective Payment System.
The Department of Health will continue to work with its partner agencies, the Patient Safety Authority, the Penn-sylvania Health Care Cost Containment Council, with outside organizations, and with the infection preventioncommunity to collect data on the occurrence of HAIs and to recommend methods to reduce their occurrence. Animportant role is to continue to validate the accuracy of data submitted by the hospitals to assure the accuracy of thereported rates and standardized infection ratios. This will be done through continuous inspection of the submittedreports and through on-site validation as resources permit. PADOH is committed to ensuring useful and usable dataon HAIs for the health care community and the public. The information can then be used by all stakeholders tocontinue to reduce the occurrence of HAIs with a goal of eventually eliminating them.
308
6 References
Cardo, D., Dennehy, P. H., Halverson, P., Fishman, N., Kohn, M., Murphy, C. L., Whitley, R. J., Brennan, P. J.,Bright, J., Curry, C., Graham, D., Haerum, B., Kainer, M., Kaye, K., Lundstrom, T., Richards, C., Tomlinson,L., Skillen, E. L., Streed, S., Young, M., and Septimus, E. Moving toward elimination of healthcare-associatedinfections: a call to action. Infection control and hospital epidemiology : the official journal of theSociety of Hospital Epidemiologists of America, 31(11):1101–5, November 2010.
R Core Team. R: A Language and Environment for Statistical Computing. R Foundation for StatisticalComputing, Vienna, Austria, 2015.
RStudio Team. RStudio: Integrated Development Environment for R. RStudio, Inc., Boston, MA, 2015.
Scott, R. D., II. The Direct Medical Costs of Healthcare-Associated Infections in U.S. Hospitals and the Benefits ofPrevention. Technical Report March, Centers for Disease Control and Prevention, 2009.
Talbot, T. R., Babcock, H., Caplan, A. L., Cotton, D., Maragakis, L. L., Poland, G. a., Septimus, E. J., Tapper,M. L., and Weber, D. J. Revised SHEA position paper: influenza vaccination of healthcare personnel. Infectioncontrol and hospital epidemiology : the official journal of the Society of Hospital Epidemiologistsof America, 31(10):987–95, October 2010.
309


