155
1 Healthcare-Associated Infections in Pennsylvania 2011 Report August 2012
1
Healthcare-Associated
Infections in Pennsylvania
2011 Report
August 2012

2
Table of Contents
Executive Summary 5
Introduction 9
Data and Methods 11
Results 15
Table 1A: Characteristics of Hospitals Reporting HAIs – Pennsylvania 2011 15
Table 1B: Characteristics of Hospitals Reporting HAIs - Pennsylvania 2011 16
Overall HAI Patterns 16
Table 2: Healthcare-Associated Infections in PA Hospitals by Type – 2011 17
Table 2A: Comparison of HAI Percentages in PA Hospitals 2010 versus 2011 17
Table 3: Methicillin Resistant Staphylococcus aureus 18
Table 3A: Comparison of Proportion of HAIs Caused by Methicillin Resistant Staphylococcus aureus –
2010 versus 2011 19
Table 4: Healthcare-Associated Infections in PA hospitals by Category 20
Catheter-Associated Urinary Tract Infections (CAUTIs) 33
Table 5: CAUTIs by Location 34
Table 5A: CAUTIs by Location 2010 versus 2011 35
Table 6: CAUTIs by Pathogen 2011 36
Figures 1-4: Comparison of Pennsylvania CAUTI rates to national rates 37
Facility Specific CAUTI Findings 39
Tables 7, 8: Pennsylvania Hospitals with a Significantly Better or Worse than Predicted
Number of CAUTIs in 2011 40
Hospitals Omitted from Tables 9 & 10 with No Reported Catheter Use 41
Table 9: CAUTI-Adjusted SIRs by Hospital 42
Table 10: Ranking of PA Hospitals by Adjusted SIR for CAUTI
Hospitals with <1 Predicted Infections 49
Hospitals with 1-2.99 Predicted Infections 51

3
Hospitals with 3-7.49 Predicted Infections 53
Hospitals with 7.5-14.99 Predicted Infections 55
Hospitals with 15-29.99 Predicted Infections 57
Hospitals with 30+ Predicted Infections 58
Central Line-Associated Bloodstream Infections (CLABSIs) 59
Figure 5: Distribution of CLABSIs by unit type 60
Table 11: CLABSIs by Location 61
Table 11A: CLABSIs by Location 2010 versus 2011 62
Figures 6-11: Comparison of Pennsylvania CLABSI Rates to National Rates 63
Table 12: Percentage of CLABSI in PA Hospitals by Pathogens 2011 66
Facility-specific Central Line-Associated Bloodstream Infection Findings 67
Tables 13, 14: Pennsylvania Hospitals with a Significantly Better or Worse than Predicted
Number of CLABSIs in 2011 68
Hospital Omitted from Tables 15-19 Due to No Use of Central Lines 69
Table 15: CLABSI-Adjusted SIR by PA Hospitals by Location 70
Table 16: Ranking of PA Hospitals by Adjusted SIR for CLABSI - ICU and other Wards
Hospitals with <1 Predicted Infections 79
Hospitals with 1-2.99 Predicted Infections 81
Hospitals with 3-7.49 Predicted Infections 83
Hospitals with 7.5-14.99 Predicted Infections 85
Hospitals with 15-29.99 Predicted Infections 86
Hospitals with 30+ Predicted Infections 87
Table 17: Ranking of PA Hospitals by Adjusted SIR for CLABSI - NICU
Hospitals with <1 Predicted Infections 88
Hospitals with 1+ Predicted Infections 89
Table 18: Ranking of PA Hospitals by Adjusted SIR for CLABSI – SCA
Hospitals with <7.5 Predicted Infections 90
Hospitals with 7.5+ Predicted Infections 91

4
Table 19: Ranking of PA Hospitals by Adjusted SIR for CLABSI – LTAC
Hospitals with <7.5 Predicted Infections 92
Hospitals with 7.5+ Predicted Infections 93
Surgical Site Infections (SSIs) 94
Table 20: Surgical Site Infections in Pennsylvania Hospitals, 2010 96
Table 21: Surgical Site Infections in Pennsylvania, Comparison of 2009 to 2010 96
Comparison of Pennsylvania SSI rates with National Rates 97
Figure 12: SSI Rates by Operative Procedure Type 97
Table 22: Pathogens Associated with the Six Benchmark SSI Infections in PA Hospitals, 2010 98
Risk Adjusted Rates 99
Table 23: Surgical Site Infection Rates by Risk Index Category 100
Table 24: Summary Information on Surgical Site Infections, Pennsylvania 2010 103
Tables 25, 26: Hospitals with Significantly Better & Worse than Predicted Number of SSIs, 2010 104
Table 27: 2010 Hospital Specific SSI Standardized Infection Ratios (SIRs) by Procedure 105
Table 28: 2010 Hospital Specific SSI Standardized Infection Ratios by Facility 126
Influenza Vaccination of Healthcare Providers 148
Table 29: Hospital Survey Participation and Reported Employee Vaccination Rates 150
Table 30: Vaccination Status of Health Care Personnel 151
Figure 13: Distribution of Hospital Vaccination Rates 151
Table 31: Facilities with Employee Vaccination Rates of 90% or Better 152
Conclusions 153

5
Executive Summary
Overview The 2011 report on the occurrence and patterns of health care-associated infections (HAIs) is the fourth to be released by the Pennsylvania Department of Health (PADOH) since the passage of Act 52 in 2007. The overall findings for 2011 show a continued pattern of steady decline in the incidence of HAIs in Pennsylvania. Declines were also seen in the incidence of each of the three categories of HAIs used by PADOH for hospital benchmarking. These categories are: catheter-associated urinary tract infections (CAUTIs), central line-associated bloodstream infections (CLABSIs), and selected types of surgical site infections (SSIs). The declining numbers are likely the result of ongoing efforts undertaken by infection preventionists, health care providers and systems, professional societies and governmental agencies to control and prevent HAIs. The impact of these efforts should be improved health status and outcomes of patients cared for in Pennsylvania hospitals, which are the primary motivation for HAI prevention and control, along with reduced health care expenditures. Background All hospitals in Pennsylvania are required to report any HAI that occurs in an in-patient location. These infections are reported by the hospitals to the Centers for Disease Control and Prevention’s (CDC’s) National Healthcare Safety Network (NHSN), which is now the primary data collection tool used for HAI reporting by more than 5,000 hospitals across the country. The information submitted to NHSN from Pennsylvania hospitals is provided to PADOH in order to be compiled, analyzed and published on an annual basis. As in previous reports, the 2011 report contains a summary of the overall and hospital-specific number and type of HAIs. This is followed by separate sections on each of the three HAI categories that PADOH uses for benchmarking hospital performance. Hospital comparisons in these sections are done using the risk-adjusted standardized infection ratio (SIR) approach. The SIR is a value based on the ratio of infections reported by each hospital to NHSN (referred to as observed infections) to the number of infections predicted to occur at that hospital (referred to as predicted infections). The number of predicted infections is a calculated value that PADOH assigns to the hospital based on the overall statewide rate for each type of infection. The 2011 report includes a new section on hospital-specific healthcare worker (HCW) influenza vaccination coverage rates. This is the first time PADOH is including a measure in the annual report that is not an HAI. It is a measure of vaccination coverage, not a measure of infection. Hospitals are not mandated by Act 52 to report this information. Rather, it is being voluntarily provided to PADOH by the hospital as a valuable yard stick in measuring the hospital’s commitment to patient safety. Influenza is unquestionably a serious problem for both patients and HCWs and is known to be transmitted in healthcare settings. Therefore, annual influenza vaccination of healthcare workers is strongly encouraged; attaining a vaccination coverage level of 90 percent of a facility’s HCWs is a U.S. Department of Health and Human Services Healthy People 2020 goal. Beginning in 2013, the federal Centers of Medicare and Medicaid Services (CMS) requires that all hospitals receiving in-patient prospective payment from CMS report HCW influenza vaccination coverage through NHSN. The 2011 report for the first time includes an appendix showing longitudinal annual data for each Pennsylvania hospital since reporting was initiated under Act 52. This allows users of the report to more easily view trends for a particular hospital of interest. This information is now being included because there are enough annual data points to demonstrate time trends by hospital. Since only two full years

6
of data on SSIs are available (SSI data lags other HAIs by 12 months), longitudinal data on SSIs will not be displayed until next year’s report. In 2011, there were 254 hospitals in Pennsylvania that submitted data to NHSN and were in continuous operation over the 12-month time period. Cumulatively, these hospitals reported a total of 22,713 HAIs occurring over 10,212,208 patient-days of hospital care. Patient-days are the number of hospitalizations multiplied by the length of stay of each hospitalization (i.e., one patient hospitalized for 5 days equals 5 patient-days). This results in an overall statewide rate of 2.22 HAIs per 1,000 patient-days. This is a 3.1 percent decline from the overall HAI rate in 2010 and a 6.3 percent decrease from 2009, which is considered the baseline year of measurement for Act 52. This represents 2,274 fewer HAIs than would have occurred if the 2009 HAI rate had persisted into 2011. In this report (as in 2010) the most commonly reported categories of HAIs are surgical site infections (26.9 percent of all HAIs) followed by urinary tract infections (22.3 percent) and gastrointestinal infections (17.4 percent). Catheter-Associated Urinary Tract Infections (CAUTIs) Among the 254 hospitals, there were 234 (92.1 percent) that reported using urinary catheters and 191 (81.6 percent of those using urinary catheters) that reported at least one CAUTI. There were a total of 2,819 CAUTIs reported in 2011 over more than 1.82 million days of urinary catheter use, for a rate of 1.55 CAUTIs per 1,000 urinary catheter days. Compared to 2010, this represents a decrease in the CAUTI rate of 9.4 percent, and a 21.3 percent decline when compared to the baseline year of 2009. This translates to 1,256 fewer CAUTIs in Pennsylvania since 2009. Among the 234 hospitals reporting use of urinary catheters in 2011, there were 28 (12.0 percent) that reported significantly fewer CAUTIs than PADOH predicted would occur and 28 (12.0 percent) that reported significantly more CAUTIs than predicted by PADOH. These hospitals are found in Tables 7 and 8. Central Line-Associated Bloodstream Infections (CLABSIs) Among the 254 hospitals, there were 222 (87.4 percent) that used central lines (catheters inserted into the large arteries near the heart) and 147 (66.2 percent of those using central lines) that reported at least one CLABSI. There were a total of 1,540 CLABSIs reported in 2011 in more than 1.7 million days of central line use, giving an overall rate of 0.89 CLABSIs per 1,000 central line days. Compared to 2010, this represents a 4.3 percent decline in CLABSIs and a 27.6 percent decline compared to the baseline year of 2009. This translates to 1,113 fewer CLABSIs in Pennsylvania since 2009. CLABSIs are subdivided by hospital location type. In neonatal intensive care units (NICUs), the CLABSI rate in 2011 was 1.53 per 1,000 central line days (a 24.6 percent decline from 2010); in specialty care areas, the CLABSI rate in 2011 was 1.23 per 1,000 central line days (a 6.8 percent decline from 2010); in long term acute care units, the CLABSI rate in 2011 was 1.30 per 1,000 central line days (a 7.8 percent decline from 2010). In all other parts of the hospital (hospital wards and non-NICU intensive care units) the CLABSI rate was 0.78 per 1,000 central line days (a decline of 1.3 percent). For the ward/ICU locations, there were 13 hospitals (6.7 percent) that had a significantly lower number of CLABSIs than PADOH predicted and 14 hospitals (7.3 percent) that had a significantly higher number of CLABSIs than PADOH predicted. In the other three hospital locations, there were five hospitals that had a significantly lower number of CLABSIs and six that had a significantly higher number of CLABSIs than predicted by PADOH. These hospitals can be found in Tables 13 and 14. Surgical Site Infections (SSIs) Among the six benchmark surgical procedures (cardiac surgery, cardiac bypass grafts [with a single and with dual incision sites], hip prostheses, knee prostheses, and abdominal hysterectomy) tracked for SSIs, all but one can involve implantable devices. NHSN definitions for implant-associated surgical

7
procedures currently require a 12-month follow-up period to detect an SSI. Therefore the information in this report for the SSI benchmark lags the other conditions by a year. In 2010, at least one of these six procedures was performed in 164 Pennsylvania hospitals. For all six procedures combined, a total of 95,034 operations took place, with knee prostheses forming the largest number (41.8 percent). For all six procedures combined, a total of 1,206 SSIs were identified. This produces an overall rate of 1.27 SSIs per 100 procedures, representing a decline of 5.9 percent compared to the 2009 baseline rate. This translates to 77 fewer SSIs in Pennsylvania since 2009. The rate per procedure ranged from a high of 2.02 SSIs per 100 procedures for dual-incision cardiac bypass grafts to 0.88 SSIs per 100 procedures for cardiac surgeries and abdominal hysterectomies. Among all of the hospitals that performed at least one of the six benchmark procedures, many reported no, or very few, infections. As a result, the number of hospitals found to have a significantly better or worse number of SSIs than predicted in any of the benchmarked procedures is small. Most of the hospitals found to be significantly better or worse than predicted are larger in size and, therefore, perform a larger number of procedures. The criteria used for risk adjustment (patient risk index) may not fully differentiate the complexity and overall illness status (both of which influence risk) between patients undergoing the same type of procedure at different hospitals. In 2010, only two hospitals were identified as having a significantly lower number of SSIs than predicted, while 21 different hospitals were identified as having a significantly higher number of SSIs than predicted in at least one of the six benchmarked procedure categories (Tables 25 and 26). Of note, PADOH, in consultation with its Healthcare-Associated Infections Advisory Committee, added the category of colon surgeries as a seventh benchmarking category beginning in 2012. This procedure was added to benchmarking because colon surgery-related SSIs are the most commonly reported type by Pennsylvania hospitals and should help determine hospitals that are performing better or worse than predicted. In addition, this procedure, along with abdominal hysterectomy, was chosen for in-patient prospective payment determinations by CMS, and this aligns Pennsylvania with CMS reporting requirements. Health Care Provider Influenza Vaccination A total of 236 (93 percent) hospitals voluntarily submitted data on influenza vaccination coverage on a total of 355,514 healthcare providers, although most could not provide full data on employees, licensed independent practitioners and volunteers. Among hospital employees, influenza vaccination coverage was 72 percent. Among licensed independent practitioners, it was 67 percent. Among volunteers, it was 66 percent. The proportion of persons with unknown vaccination status ranged from 20-32 percent per group. There were 44 hospitals (19 percent) that reported achieving the Healthy People 2020 goal of 90 percent or better influenza vaccine coverage. The hospitals meeting the Healthy People 2020 goal can be found in Table 31. Conclusions The findings in 2011 demonstrate that progress continues to be made in preventing the occurrence of HAIs in Pennsylvania. This progress is gradual, with overall declines of approximately 3 percent in each of the last two years, but declines are occurring across the range of measured HAIs. This suggests that widely applied measures to reduce the burden of HAIs are successful. Of note, after 2 years of >20 percent declines in CLABSIs, the decline noted in 2011 is considerably lower (4.3 percent). This finding suggests that some CLABSIs may be especially difficult to prevent due to the underlying health condition of the patient or the complexity of care being administered. Additional strategies may be needed to address CLABSIs in these situations. PADOH continues to work with a variety of stakeholders on prevention collaboratives and assessments of methods to reduce the burden of HAIs. Efforts to date by the healthcare community have resulted in the prevention of thousands of HAIs in just the past two

8
years. This results in improved patient outcomes, decreases in re-hospitalization and long term rehabilitation, and conservative savings of at least $34 million in direct healthcare costs. PADOH, working with stakeholders inside and outside government, will continue to monitor trends and promote prevention strategies with a goal of elimination of HAIs as a public health concern.

9
Introduction
Healthcare-associated infection (HAI) is the term used for an infection that occurs in a patient as a direct consequence of the health care interventions being delivered to them. HAIs are one of the major types of adverse events that can occur in the health care environment and are a considerable patient safety concern. HAIs represent a diverse group of complications, ranging from infections that occur in a surgical wound to pneumonias among patients on ventilators. They vary based on the reason that the patient is receiving care, the type of interventions being administered, the portion of the healthcare system being used by the patient, and the patient’s underlying health status and circumstances. HAIs also vary substantially in terms of their impact on the patient, the outcome and their cost. They can be relatively minor and easily treatable (such as a minor skin infection in an outpatient), or they can result in significant patient deterioration, longer hospital stays, and even death. Taken as a group, HAIs are considered among the leading causes of death in the United States and have been estimated to cost the health care system tens of billions of dollars annually. These factors have resulted in a growing awareness of the importance of HAIs, and have helped to establish patient safety as a core pillar of the health care system. Although HAIs are an important factor throughout the health care continuum, nowhere are they more impactful than in the hospital setting, where the sickest patients are located and treated. As recently as the 1990s, HAIs were considered an inevitable consequence of health care delivery. But this view has shifted dramatically as HAIs are recognized to be preventable. This had led to a paradigm shift throughout the healthcare system that the elimination of HAIs as a public health and patient safety concern is a possibility and the ultimate goal. In a 2010 article* co-authored by the Centers for Disease Control and Prevention (CDC) and a consortium of patient safety organizations, four major pillars crucial to meeting the goal of elimination of HAIs were identified. They are:
1. Comprehensive, systematic and continuous adherence to evidence-based prevention practices 2. Alignment of incentives to promote the adoption of prevention practices 3. Conducting research to identify strategies to reduce HAIs where knowledge gaps remain 4. Collecting, analyzing and disseminating data for action
Pennsylvania is considered a national leader in all of these areas. Researchers in the commonwealth have conducted some of the seminal studies used to develop the knowledge base for HAI prevention. Practitioners have demonstrated the impact of systematic implementation of HAI prevention strategies. And Pennsylvania was one of the first states to require that all hospitals publicly disclose their HAI data. The current report focuses on the fourth pillar of the HAI elimination blueprint published in 2010. Legislation known as Act 52 was passed and enacted in 2007 that contains the most comprehensive reporting requirements of any state. The act requires the Pennsylvania Department of Health (PADOH) to collect information on all in-patient HAIs, summarize the findings, and publicly report the results. Since Act 52’s requirements took effect in February 2008, PADOH has published a comprehensive report on the patterns of HAIs in Pennsylvania. The current report is the fourth in this series. It includes data * Cardo D et al. Moving toward Elimination of Healthcare-Associated Infections: A Call to Action. Infect Cont Hosp Epidemiol 2010;31:1101-5.
10
on the overall patterns of HAIs in Pennsylvania acute care in-patient institutions, and focuses on the three types of HAIs that are used to measure the progress in HAI reductions. These HAI types are known as benchmark HAIs. They were selected by PADOH in collaboration with a statewide HAI Advisory Committee established by Act 52 based on their burden, impact and preventability. They are catheter- associated urinary tract infections (CAUTIs), central line-associated bloodstream infections (CLABSIs) and six different types of surgical site infections (SSIs). These HAI types were also selected to allow some type of measure to be established across the range of in-patient facilities present in a large, diverse state like Pennsylvania. Even the smallest hospitals are likely to use urinary catheters and to perform at least one of the six surgical procedures. With the growing focus on patient safety, the demand for measures of progress in reducing HAIs and in demonstrating a culture of patient safety is also growing. In addition to measuring actual trends in HAIs, there is growing interest in assessing process measures of patient safety. Therefore, PADOH has added a new category of information to the 2011 report. This section examines vaccination coverage of the health care workforce against influenza. Influenza is recognized as a major cause of illness and death, can be transmitted in health care settings, and is preventable through vaccination. Major healthcare organizations, societies, and federal and state governments have all promoted influenza vaccination of healthcare workers to control influenza and to keep the workforce healthy. The U.S. Department of Health and Human Services has established a Healthy People 2020 goal for 90 percent of health care workers to be vaccinated against influenza annually. Submission of data on health care worker vaccination is not a mandated requirement of Act 52. But starting in 2013, all hospitals receiving in-patient payments from the federal Centers for Medicare and Medicaid Services (CMS) will be required to submit data to the National Healthcare Safety Network (NHSN) system that is currently used by Pennsylvania to report HAIs. In recognition of this requirement, PADOH partnered with the Pennsylvania Healthcare Quality Alliance (PHCQA) to collect and display information on health care worker influenza vaccination from hospitals on a voluntary basis, using National Quality Forum endorsed metric 0431. For this first year of reporting, PADOH is publishing aggregate vaccination rates and recognizing the accomplishments of those facilities that achieved employee vaccination rates of 90 percent or better. PADOH will display all vaccination rates reported by facilities to NHSN in future reports. In an effort to make data on HAIs more useful and useable by stakeholders, especially the public, the 2011 annual report contains for the first time hospital-specific trends in the occurrence of HAIs. Since this is the fourth published report, there are now enough data points to make this information meaningful. This will enable any user of the data to see whether the overall rates of HAIs, and the rates of CAUTIs and CLABSIs, are increasing, decreasing or remaining stable, on a hospital-by-hospital basis. As in previous reports, the information in 2011 is divided into several sections. First, composite information is provided for the entire state. That is followed by hospital-specific data on the overall numbers of HAIs in each reporting category in NHSN. Separate sections then focus on CAUTIs, CLABSIs and SSIs, followed by the section on healthcare worker flu vaccination. The hospital-specific trends over time are included as an appendix to the report. It is important to note that PADOH works collaboratively with a variety of stakeholder organizations to promote healthcare quality and reduce the incidence of healthcare-associated infections. In addition, two governmental partners, the Pennsylvania Patient Safety Authority (PSA) and the Pennsylvania Health Care Cost Containment Council (PHC4), have specific roles under Act 52 and work closely with
11
PADOH on HAI prevention and control. Readers of the annual report are encouraged to examine companion reports published by PSA and PHC4. The PSA annual report for 2011 describes PSA HAI-related activities and can be found at http://patientsafetyauthority.org. The PHC4 report entitled The Impact of Healthcare Associated Infections in Pennsylvania, 2010, examines costs, mortality, readmissions and underlying health conditions associated with HAIs. It can be found at http://www.phc4.org. Data and Methods The data, analytic approaches and methods used in this report are similar to those used in previous reports. They are described in much greater detail in the 2009 report, which is available on the Pennsylvania Department of Health website at the following address: www.portal.health.state.pa.us/portal/server.pt/community/healthcare_associated_infections/14234 All hospitals are required to report all HAIs associated with any in-patient location using the Patient Safety Module of CDC’s National Healthcare Safety Network (NHSN). These infection types are:
Bone and joint infections (BJ)
Blood stream infections (BSI) with or without a central line o BSI associated with a central line are known as central line associated bloodstream
infections (CLABSI)
Central nervous system infections (CNS) Cardiovascular system infections (CVS)
Eye, Ear Nose and Throat infections (EENT)
Gastrointestinal infections (GI)
Lower respiratory tract infections (LRI)
Pneumonia (PNEU) whether ventilator or non-ventilator associated
Reproductive tract infections (REPR)
Skin and soft tissue infections (SST)
Surgical site infections (SSI)
Systemic infections (SYS)
Urinary tract infections (UTI) with or without a catheter o UTI associated with a urinary catheter are known as catheter associated urinary tract
infections (CAUTI) NHSN uses standardized definitions for each of these infection types, including methods for their detection, how they are to be identified, and the time frames for the infection to occur upon and after hospitalization. The NHSN definitions can be found in the NHSN Patient Safety Manual at http://www.cdc.gov/nhsn. Infection preventionists and data reporters under Act 52 are required to use the standardized NHSN criteria and methods to determine whether an identified infection should be reported as an HAI. Hospitals also collect certain denominator information to enable the calculation of HAI rates. This information includes:
Patient days – the total number of patients in the hospital per day over the entire calendar year (total hospitalizations multiplied by the duration of each hospitalization).

12
Urinary catheter days – the total number of hospitalized patients with a urinary catheter in place per day over the entire calendar year (total number of patients with a urinary catheter in place multiplied by the number of days a catheter was used for each patient).
Central line days – the total number of hospitalized patients with a central line in place per day over the entire calendar year (total number of patients with at least one central line in place multiplied by the number of days a central line was in place for each patient).
For the six benchmarked surgical procedures, hospitals collect and submit certain standardized information on all patients who had the procedure performed during the period of interest, not just those in whom an HAI subsequently developed. This includes risk index information for all patients undergoing one of the benchmarked procedures, allowing risk index-specific HAI rates for each procedure category.
The overall rate of HAIs by hospital (Table 4) is calculated as infections per 1,000 patient-days. This is a standard method of reporting HAIs. For CAUTIs and CLABSIs, the identified rates are per 1,000 device days (either catheter days or central line days), since these are the more appropriate denominators. For benchmarked SSIs, the rates are reported as infections per 100 procedures. All of the reported rates are unadjusted for factors that might be related to differences in HAIs between or within a hospital, such as the type and intensity of care, size of the facility or differences in patient populations. Hospitals also complete accessory reports that indicate the ward types present in their facility, the number of infection preventionists, and hospital characteristics (including number of beds). This information is summarized in Table 1. NHSN contains certain basic error checks that help to ensure that the information reported into the system is valid. PADOH also reviews the information submitted by each Pennsylvania hospital on a quarterly basis to spot unusual patterns or information that might suggest reporting errors or incomplete reporting. Each hospital receives a “data integrity verification” (DIV) report every 90 days that includes a list of any questionable reports submitted in the preceding quarter. The hospital is then given 30 days to review and correct the information before the data are considered “locked down” for analytical purposes. In 2011, PADOH also initiated on-site auditing procedures for selected hospitals to further determine the accuracy of the information reported in NHSN. The auditing process focused on the benchmarking categories of CAUTIs, CLABSIs and SSIs, looking to identify inaccurately reported infections and unreported infections. Act 52 requires PADOH to: (1) assess overall trends in HAIs in Pennsylvania, (2) compare the rates of HAIs in Pennsylvania to the rates elsewhere in the country, and (3) compare the occurrence of HAIs between hospitals and over time in each hospital. To assess overall HAI trends in Pennsylvania, PADOH produces summary statistics on the patterns of HAIs by category, the overall rates of HAIs, and the rates by category. Information is also provided on the pathogens causing HAIs, with an emphasis on infections caused by methicillin-resistant Staphylococcus aureus (MRSA), which was a special focus of Act 52. To compare Pennsylvania’s rates and patterns of HAIs to the rest of the country, this report uses information contained in the NHSN summary report. NHSN now collects data from more than 5,000 hospitals across the United States and produces the definitive dataset on HAIs. However, the most recently available report from CDC on device-associated HAIs covers those infections reported in 2010, not 2011. Thus, Pennsylvania’s 2011 rates by ward type for CAUTI and CLABSI are compared to national

13
data from 2010, which might account for some of the differences observed in the graphs and tables that show Pennsylvania performing better than the country as a whole. To compare differences between hospitals, the recommended approach is the use of a standardized infection ratio, or SIR. The SIR is a comparison between the reported occurrence (the observed number of infections) of a specific HAI (e.g., CAUTI or CLABSI) in a hospital to the number that would be predicted to occur (predicted) in that hospital if the hospital’s rate was identical to the statewide HAI rate for that infection type. If a hospital reported 10 CAUTIs during 2010 (and based on the overall statewide rate of CAUTIs per 1,000 catheter-days we would have predicted only 5 CAUTIs should occur in that hospital), the standardized infection ratio (SIR) would be 10/5 or 2.00. If another hospital reported 5 CAUTIs (and based on statewide rates we would have predicted the hospital would have 10 CAUTIs), the SIR would be 5/10 or 0.50. An SIR of 1.00 means the hospital reported exactly the same number of infections as predicted based on statewide rates (i.e. the hospital’s rate was exactly the same as the statewide rate). An SIR >1.00 means the hospital reported more infections than predicted, and an SIR <1.00 means the hospital reported fewer infections than predicted. Differences between hospitals (such as intensity of care or patient populations) may explain why they have differences in their HAI rates. Some hospitals care for sicker patients, and these patients are at higher risk for an HAI with all other factors being equal. To account for such differences, an adjustment is made to the predicted number of infections (the predicted number is adjusted upward for hospitals that provide more complex care and downward for hospitals that provide less complex care). It is difficult to precisely measure complexity of care. Factors that were examined for this purpose for CAUTIs and CLABSIs include device utilization ratio (how often a catheter or central line is used in each hospital – calculated as the number of catheter or central line days divided by the number of patient days), the bed size of the hospital, the geographic location of the hospital (urban or rural) and whether the hospital is affiliated with a medical school. These factors have been shown in medical literature to influence the likelihood of an HAI as a surrogate for patient population differences or intensity of care. The final risk adjustment model for CAUTIs and CLABSIs incorporates the device utilization ratio (DUR) and medical school affiliation, similar to previous reports. For SSIs, such adjustments are not needed, as information is collected on all patients who underwent a procedure whether or not an infection subsequently occurred. Adjustment factors for predicting the number of infections used for SSIs include the American Society of Anesthesiology (ASA) score (the patient’s level of health), duration of the surgical procedure, and whether or not the operation site was “clean” or “contaminated.” Together, these comprise the risk index. After the SIR is calculated, a determination is made regarding whether any differences seen between hospitals are statistically meaningful. For a small hospital that performs few operative procedures or uses very few catheters or central lines, the level of confidence in the reliability of the calculated rates is lower than for a larger hospital. This is reflected in a calculation known as the “confidence interval” or CI, for which a lower limit and an upper limit are calculated and displayed. The true SIR for the hospital is found somewhere in between the lower value and the upper value of the confidence interval. In general, the smaller the facility, the wider the confidence interval, meaning our confidence in the calculated rate is low. Larger facilities tend to have narrower confidence intervals, meaning there was more information available to calculate the rates. If the two values in the confidence interval are both <1.00, it means the observed number of infections in that hospital is significantly lower than predicted. If both values in the confidence interval are >1.00, it means there are significantly more infections than predicted. If the confidence interval includes the value of 1.00, it means the observed number of infections is not statistically different than predicted based on statewide rates. Hospitals with a

14
significantly lower number of observed infections are depicted in green in the graphs included in the report; hospitals with a significantly higher number of observed infections are depicted in red in the graphs. Hospitals that are no different than predicted are depicted in yellow in the graphs. For the section on health care worker influenza vaccination, hospitals were asked to voluntarily submit information on the number of health care workers in their facility and the number of these workers that were documented to have received influenza vaccine (whether or not the vaccine was administered at the hospital) for the 2011-2012 flu season. The methods for counting vaccination are based on those developed by the National Quality Forum (NQF), which uses three separate categories (hospital employees, licensed independent practioners, and adult volunteers or students) and counts only those present in the hospital for at least 30 days during the flu season.

15
Results Hospital Characteristics In 2011, a total of 254 hospitals reported data on the occurrence of healthcare-associated infections to the National Healthcare Safety Network (NHSN) for the entire calendar year. The characteristics of these hospitals are found in Table 1A and Table 1B.
Table 1A Characteristics of Hospitals Reporting
Healthcare-Associated Infections – Pennsylvania 2011 (State Hospital Survey and NHSN)
*Behavioral facility
Hospital Characteristics N Percentage
254 100
Facility Type Acute Care Hospital 163 64.2
Critical Access Hospital 13 5.1
Children’s Hospital 7 2.8
Long Term Acute Care (LTAC) 27 10.6
Psychiatric hospital 25 9.8
Rehab Hospital 19 7.5
Medical School Affiliation No affiliation 176 69.3
Affiliation 78 30.7
Number of Infection Preventionists (IPs)
0* 1 0.4
1 170 66.9
2 42 16.5
3+ 41 16.1

16
Table 1B Characteristics of Hospitals Reporting
Healthcare-Associated Infections in Pennsylvania - 2011 (State Hospital Survey and U.S. Census)
Overall Patterns of Healthcare-Associated Infections Among the 254 reporting hospitals, there were a total of 22,713 healthcare-associated infections reported (Table 2). These HAIs occurred over a total of 10,212,208 patient-days of care in Pennsylvania hospitals. The number of reported HAIs in 2011 is 3.8 percent lower than in 2010, and the number of patient days in 2011 is 0.7 percent lower than in 2010. The overall rate of HAIs in 2011 is 2.22 HAIs per 1,000 patient days, which is 3.1 percent lower than the rate of 2.29 HAIs per 1,000 patient days in 2010, and 6.3 percent lower than the rate of 2.37 HAIs per 1,000 patient days in 2009 (the baseline year for Pennsylvania data). These declines translate to 2,274 fewer healthcare-associated infections having occurred in Pennsylvania since 2009.
Healthcare-Associated Infections in Pennsylvania (2009-2011)
Year No. of HAIs No. of Patient Days Rate per 1,000 Patient Days
Percent Decline (prior year/ cumulative)
2009 25,914 10,920,596 2.37
2010 23,601 10,289,079 2.29 3.4/3.4
2011 22,713 10,212,208 2.22 3.1/6.3 Among the 22,713 HAIs that occurred in 2011, the most common types are found in Table 2. Surgical site infections (SSIs) continue to be the most commonly identified category of HAIs, comprising 26.9 percent of all HAIs, followed by urinary tract infections (UTIs) at 22.3 percent, and gastrointestinal infections (GI) at 17.4 percent.
Urban Status N=254 Percentage
Urban 82 32.3
Suburban 93 36.6
Rural 79 31.1
Hospital Bed Size < 200 172 65.4
201-500 65 25.2
> 500 17 9.4

17
Table 2 Healthcare-Associated Infections in PA Hospitals by Type - 2011
Infection Type Number Percent
Bone and Joint (BJ) 27 0.12
Blood Stream Infection (BSI) 2,479 10.91
Central Nervous System (CNS) 73 0.32
Cardiovascular System (CVS) 103 0.45
Eye Ear Nose and Throat (EENT) 741 3.26
Gastrointestinal (GI) 3,951 17.40
Lower Respiratory Tract (LRI) 865 3.81
Pneumonia (PNEU) 2,420 10.65
Reproductive (REPR) 77 0.34
Surgical Site Infection (SSI) 6,113 26.91
Skin and Soft Tissue (SST) 799 3.52
Systemic (SYS) 2 0.01
Urinary Tract Infection (UTI) 5,063 22.29
TOTAL 22,713 100%
Table 2A compares the proportions of each HAI category between 2010 and 2011. The overall patterns are similar between the two years, although there was a decline of more than one percentage point for urinary tract infections. The proportion of HAIs due to surgical site infections continues to increase.
Table 2A Comparison of HAI Percentages in PA Hospitals 2010-2011
Infection Type Percent in 2010 Percent in 2011
Bone and Joint (BJ) 0.09 0.12
Blood Stream Infection (BSI) 11.06 10.91
Central Nervous System (CNS) 0.35 0.32
Cardiovascular System (CVS) 0.44 0.45
Eye Ear Nose and Throat (EENT) 2.74 3.26
Gastrointestinal (GI) 17.43 17.40
Lower Respiratory Tract (LRI) 3.42 3.81
Pneumonia (PNEU) 10.95 10.65
Reproductive (REPR) 0.42 0.34
Surgical Site Infection (SSI) 26.24 26.91
Skin and Soft Tissue (SST) 3.50 3.52
Systemic (SYS) 0.03 0.01
Urinary Tract Infection (UTI) 23.34 22.29
TOTAL 100% 100%

18
Methicillin Resistant Staphylococcus Aureus (MRSA) Methicillin-resistant Staphylococcus aureus (MRSA) continues to be a serious concern in the healthcare setting. Act 52 instituted specific requirements related to MRSA, including screening of high-risk patients on admission. The Department’s annual HAI reports have included information on the incidence of MRSA and progress in reducing the burden of this infection in Pennsylvania. Table 3 includes information for 2011. It shows the total number of HAI due to MRSA by category of HAI. In 2011, a total of 1,840 HAIs were caused by MRSA, accounting for 8.1 percent of all HAIs. For those categories of HAIs with over 100 reported infections, the highest proportion caused by MRSA were skin and soft tissue (SST) infections (22.2 percent) followed by cardiovascular system (CVS) infections (14.6 percent) and surgical site infections (SSI) (14.0 percent). By category, the largest proportion of the 1,840 total MRSA HAIs were related to surgical site infections (857 representing 46.6 percent) followed by pneumonia (representing 15.1 percent) and blood stream infections (representing 14.6 percent).
Table 3 Methicillin Resistant Staphylococcus aureus
Healthcare-Associated Infections in Pennsylvania - 2011
Infection Type Total Count MRSA Count Percent
Bone and Joint (BJ) 27 5 18.51
Blood Stream Infection (BSI) 2,479 268 10.81 Central Nervous System (CNS) 73 5 6.85
Cardiovascular System (CVS) 103 15 14.56
Eye Ear Nose and Throat (EENT) 741 26 3.51 Gastrointestinal (GI) 3,951 18 0.46
Lower Respiratory Tract (LRI) 865 120 13.87
Pneumonia (PNEU) 2,420 278 11.49 Reproductive (REPR) 77 1 1.45
Surgical Site Infection (SSI) 6,113 857 14.02
Skin and Soft Tissue (SST) 799 177 22.15
Systemic (SYS) 2 0 0 Urinary Tract Infection (UTI) 5,063 70 1.38
Total 22,713 1,840 8.10

19
Table 3A compares the MRSA data for 2011 with the data from 2010. There has been little change in the proportion of HAIs due to MRSA by overall proportion or individual category. In 2010, 7.92 percent of HAIs were caused by MRSA, in 2011 that proportion was 8.10 percent. However, the absolute number of reported HAIs caused by MRSA declined slightly between the two years (1,869 to 1,840, a reduction of 1.5 percent.
Table 3A Comparison of Proportion of Healthcare-Associated Infections Caused by
Methicillin Resistant Staphylococcus aureus - 2010 versus 2011
Infection Type 2010 Percentage 2011 Percentage
Bone and Joint (BJ) 9.09 18.51 Blood Stream Infection (BSI) 10.11 10.81
Central Nervous System (CNS) 2.44 6.85
Cardiovascular System (CVS) 20.19 14.56 Eye Ear Nose and Throat (EENT) 5.26 3.51
Gastrointestinal (GI) 0.29 0.46
Lower Respiratory Tract (LRI) 15.76 13.87 Pneumonia (PNEU) 11.15 11.49
Reproductive (REPR) 2.02 1.45
Surgical Site Infection (SSI) 14.21 14.02 Skin and Soft Tissue (SST) 20.00 22.15
Systemic (SYS) 0 0
Urinary Tract Infection (UTI) 1.31 1.38
Total 7.92 8.10
Hospital Specific Overall Infections and Crude Rates
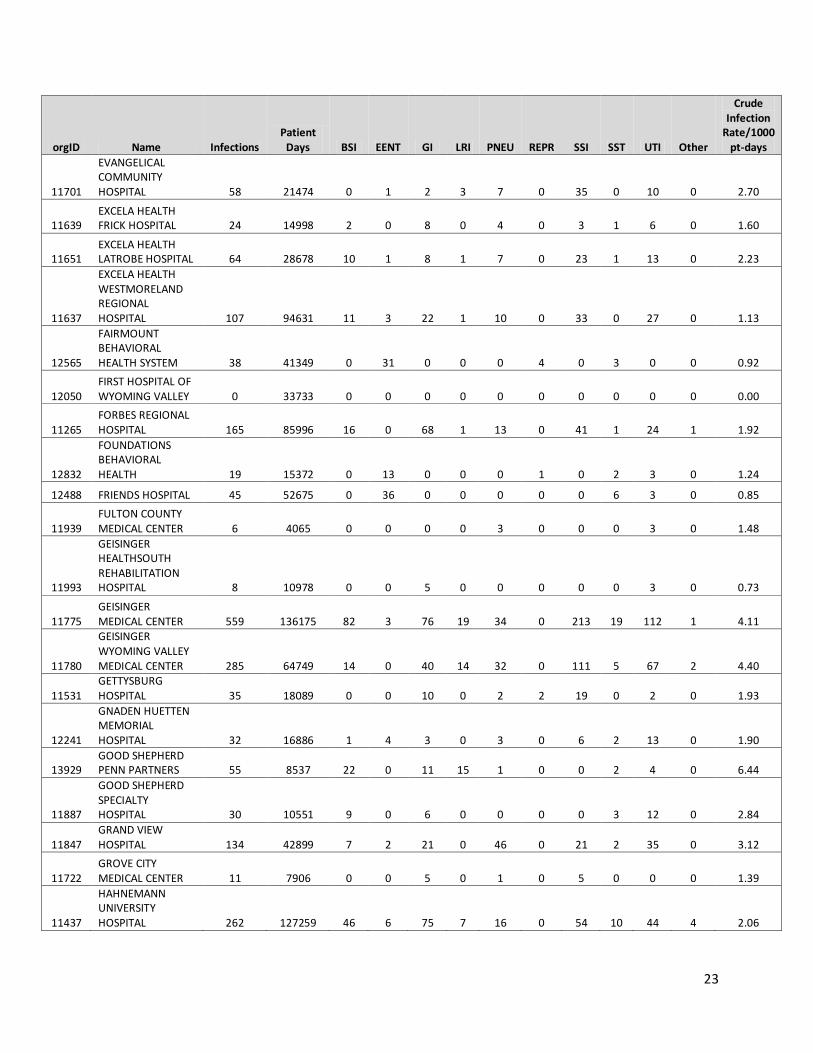
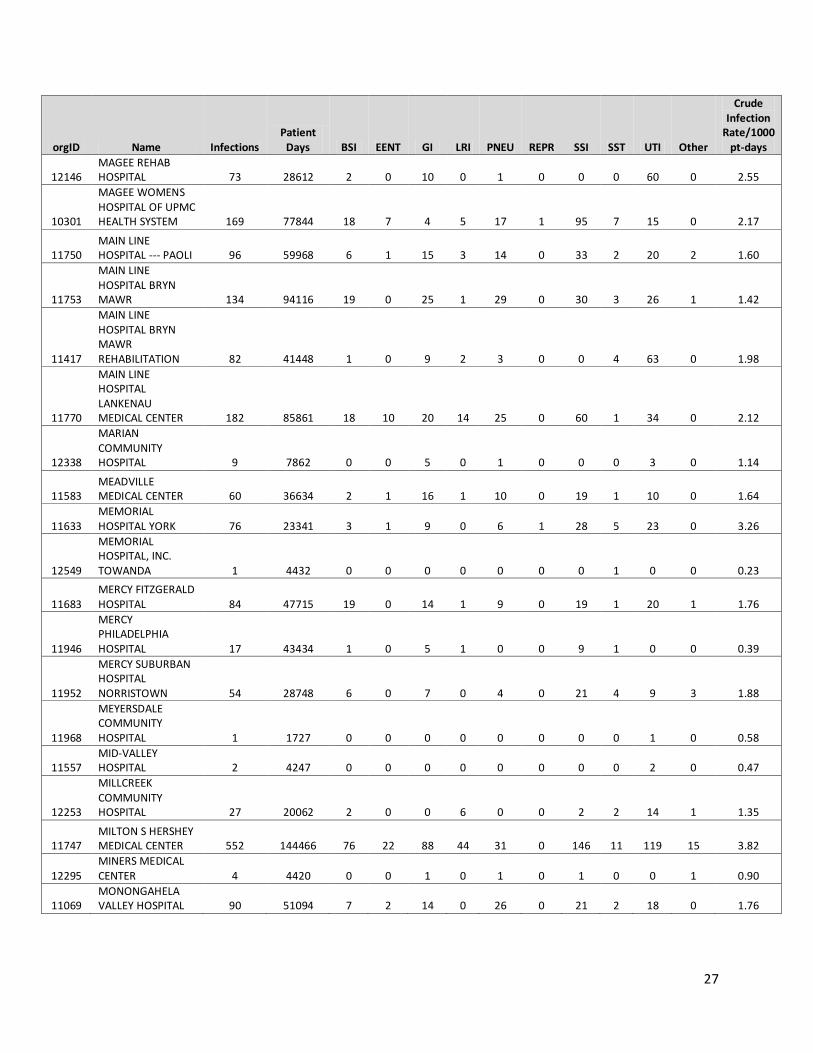
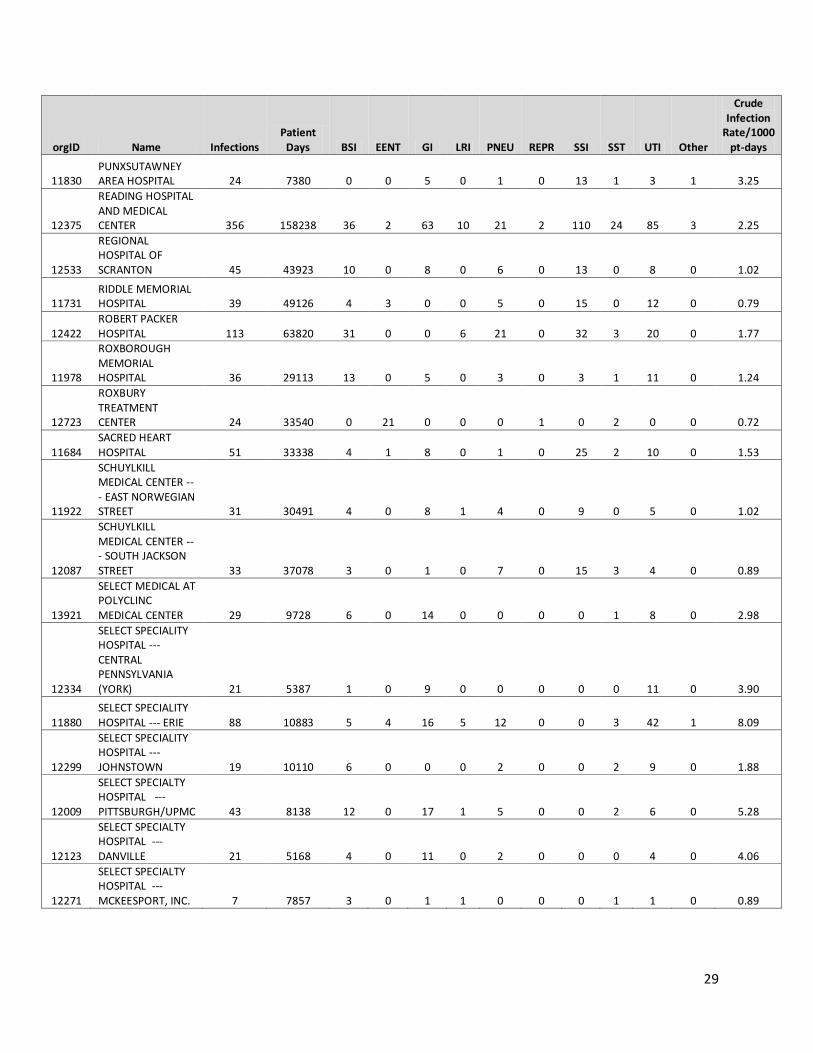
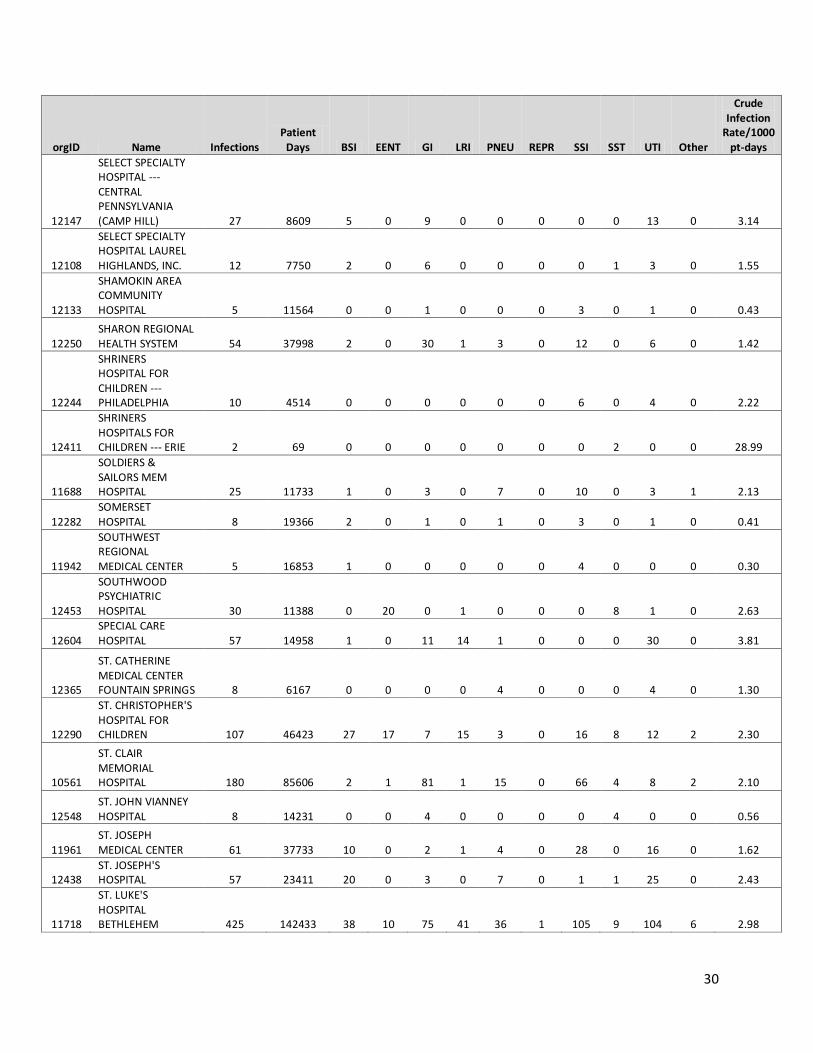
Table 4 presents the overall patterns of HAIs by hospital. Included is the organizational identifying number used by the hospital in the National Healthcare Safety Network (NHSN) system. Of note, some hospitals with separate campuses report HAI data to NHSN separately for each campus and use different NHSN numbers. Other hospitals report such data in merged fashion and use only a single, unified NHSN number. The hospital name, the number of patient days the hospital reported in 2011, the total number of HAIs, and the number of HAIs by category are also listed in Table 4. This information is followed by the crude rate of HAIs per 1,000 patient days. It is important to note that the crude rates are not risk-adjusted and therefore should not be used for hospital-to-hospital comparisons. However, unless there is a change in a hospital’s status (such as a merger, closure of hospital units, or expansion), the crude rate can be used to illustrate trends over time (changes in annual rates). Therefore, such hospital-by-hospital information is included in Appendix A of this report and should allow users of this report to evaluate hospital performance over time.

20
Table 4 2011 Healthcare Associated Infections in PA Hospitals by Type
Hospital-wide crude rate per 1,000 patient days
orgID Name Infections Patient
Days BSI EENT GI LRI PNEU REPR SSI SST UTI Other
Crude Infection
Rate/1000 pt-days
11838
ABINGTON MEMORIAL HOSPITAL 381 151539 59 1 40 4 51 0 100 5 119 2 2.51
16317
ADVANCED SURGICAL HOSPITAL 1 1116 0 0 0 0 0 0 1 0 0 0 0.90
10585 ALBERT EINSTEIN MEDICAL CENTER 308 111995 73 8 44 4 20 1 94 6 53 5 2.75
12500
ALBERT EINSTEIN MEDICAL CENTER AT ELKINS PARK 31 10601 9 0 6 0 1 0 8 1 5 1 2.92
12508
ALBERT EINSTEIN MEDICAL CENTER MOSS REHABILITATION 42 40945 2 0 7 0 1 0 0 2 30 0 1.03
10648 ALLEGHENY GENERAL HOSPITAL 688 133596 174 2 158 81 36 0 149 12 65 11 5.15
11842 ALLEGHENY VALLEY HOSPITAL 73 46228 6 6 19 0 4 0 25 3 9 1 1.58
12591
ALLIED SERVICES INSTITUTE OF REHABILITATION 19 20817 2 0 1 0 0 0 0 0 16 0 0.91
10178
ALTOONA REGIONAL HEALTH SYSTEM 102 89191 7 0 4 0 12 0 70 3 6 0 1.14
11388 ARIA HEALTH 252 115743 28 4 39 14 37 0 42 7 78 3 2.18
12057
ARMSTRONG COUNTY MEMORIAL HOSPITAL 35 34165 3 0 10 0 3 1 12 0 6 0 1.02
12037 BARIX CLINICS OF PENNSYLVANIA 1 661 0 0 0 0 0 0 1 0 0 0 1.51
12404 BARNES-KASSON COUNTY HOSPITAL 0 4251 0 0 0 0 0 0 0 0 0 0 0.00
12505
BELMONT CENTER FOR COMPREHENSIVE TREATMENT 10 47456 0 9 0 0 0 0 0 1 0 0 0.21
11442 BERWICK HOSPITAL CENTER 8 14647 2 0 0 1 2 0 1 0 2 0 0.55
12008 BLOOMSBURG HOSPITAL 7 13619 2 0 0 0 2 0 3 0 0 0 0.51
12361
BRADFORD REGIONAL MEDICAL CENTER 12 11423 0 0 3 0 2 0 3 3 1 0 1.05
11979 BRANDYWINE HOSPITAL 52 37170 4 0 6 0 12 0 19 0 11 0 1.40

21
orgID Name Infections Patient
Days BSI EENT GI LRI PNEU REPR SSI SST UTI Other
Crude Infection
Rate/1000 pt-days
12623
BROOKE GLEN BEHAVIORAL HOSPITAL 0 31602 0 0 0 0 0 0 0 0 0 0 0.00
12418 BROOKVILLE HOSPITAL 6 6425 0 0 0 0 0 1 2 0 3 0 0.93
15202
BUCKS COUNTY SPECIALTY HOSPITAL 0 739 0 0 0 0 0 0 0 0 0 0 0.00
12461 BUCKTAIL MEDICAL CENTER 1 1078 0 0 1 0 0 0 0 0 0 0 0.93
11736 BUTLER MEMORIAL HOSPITAL 116 67225 8 0 11 4 10 1 57 5 20 0 1.73
11586 CANONSBURG GENERAL HOSPITAL 21 17798 1 0 5 0 1 0 6 1 6 1 1.18
11997
CARLISLE REGIONAL MEDICAL CENTER 25 26235 1 0 1 0 0 0 21 0 2 0 0.95
15259 CH HOSPITAL OF ALLENTOWN 3 1913 0 0 0 0 0 0 2 0 1 0 1.57
11913 CHAMBERSBURG HOSPITAL 124 56846 6 0 22 0 12 0 62 1 21 0 2.18
11956
CHARLES COLE MEMORIAL HOSPITAL 10 9233 1 0 0 0 1 0 4 0 4 0 1.08
12016 CHESTER COUNTY HOSPITAL 156 59845 10 4 33 6 14 2 30 10 46 1 2.61
12304 CHESTNUT HILL HOSPITAL 27 27803 1 0 6 0 0 0 13 3 4 0 0.97
10306
CHILDREN'S HOSPITAL OF PHILADELPHIA 496 150455 97 78 73 50 24 1 68 43 45 17 3.30
11640
CHILDREN'S HOSPITAL OF PITTSBURGH OF UPMC 196 84133 62 7 26 26 11 0 40 8 11 5 2.33
12266
CHILDREN'S INSTITUTE OF PITTSBURGH 5 7631 1 0 0 0 0 0 0 4 0 0 0.66
11654 CLARION HOSPITAL 35 10903 0 0 4 0 6 0 11 2 12 0 3.21
12454
CLARION PSYCHIATRIC CENTER 29 21714 0 25 0 0 1 2 0 1 0 0 1.34
12051 CLARKS SUMMIT STATE HOSPITAL 30 67128 0 12 0 0 0 0 0 1 17 0 0.45
11843 CLEARFIELD HOSPITAL 7 16613 0 0 0 0 0 0 5 0 2 0 0.42
11914 COMMUNITY MEDICAL CENTER 58 52727 1 0 1 0 14 0 36 0 6 0 1.10
10280
CONEMAUGH VALLEY MEMORIAL HOSPITAL 330 121737 73 2 62 52 5 0 69 2 62 3 2.71

22
orgID Name Infections Patient
Days BSI EENT GI LRI PNEU REPR SSI SST UTI Other
Crude Infection
Rate/1000 pt-days
11872
COORDINATED HEALTH ORTHOPEDIC HOSPITAL, LLC 10 3107 0 0 0 0 1 0 9 0 0 0 3.22
12283 CORRY MEMORIAL HOSPITAL 3 5107 0 0 0 0 0 0 1 0 2 0 0.59
12273
CRICHTON REHABILITATION CENTER 10 9740 1 0 2 0 0 0 0 0 7 0 1.03
11839 CROZER CHESTER MEDICAL CENTER 143 88176 17 2 39 2 20 0 36 1 26 0 1.62
11851
CROZER CHESTER MEDICAL CENTER SPRINGFIELD 3 5467 0 0 2 0 0 0 0 0 1 0 0.55
11932
CROZER CHESTER MEDICAL CENTER TAYLOR 75 35178 9 0 36 0 2 0 15 2 11 0 2.13
11848 DANVILLE STATE HOSPITAL 37 60873 0 11 2 0 1 0 0 15 8 0 0.61
11972
DELAWARE COUNTY MEMORIAL HOSPITAL 56 48197 7 0 14 0 4 0 16 2 13 0 1.16
12738
DEVEREUX CHILDREN'S BEHAVIORAL HEALTH INSTITUTE 12 9054 0 12 0 0 0 0 0 0 0 0 1.33
11743
DIVINE PROVIDENCE HOSPITAL 3 6529 0 1 0 0 0 0 0 1 1 0 0.46
10190 DOYLESTOWN HOSPITAL 100 53945 0 3 31 0 15 0 27 0 24 0 1.85
11606 DUBOIS REGIONAL MEDICAL CENTER 77 41223 6 4 16 2 8 2 26 3 10 0 1.87
12965 EAGLEVILLE HOSPITAL 0 6561 0 0 0 0 0 0 0 0 0 0 0.00
12348 EASTERN REGIONAL MEDICAL CENTER 103 13007 21 1 26 5 21 0 12 1 16 0 7.92
11929 EASTON HOSPITAL 149 48864 4 3 23 7 19 0 48 7 34 4 3.05
12552
EDGEWOOD SURGICAL HOSPITAL 0 373 0 0 0 0 0 0 0 0 0 0 0.00
11859 ELK REGIONAL HEALTH CENTER 27 14320 0 6 6 0 0 0 6 7 1 1 1.89
11779 ELLWOOD CITY HOSPITAL 14 11686 0 0 1 0 5 0 1 0 7 0 1.20
11817
ENDLESS MOUNTAINS HEALTH SYSTEMS 1 3542 0 0 0 0 0 0 1 0 0 0 0.28
11764
EPHRATA COMMUNITY HOSPITAL 36 28104 1 1 3 0 8 1 15 1 6 0 1.28
23
orgID Name Infections Patient
Days BSI EENT GI LRI PNEU REPR SSI SST UTI Other
Crude Infection
Rate/1000 pt-days
11701
EVANGELICAL COMMUNITY HOSPITAL 58 21474 0 1 2 3 7 0 35 0 10 0 2.70
11639 EXCELA HEALTH FRICK HOSPITAL 24 14998 2 0 8 0 4 0 3 1 6 0 1.60
11651 EXCELA HEALTH LATROBE HOSPITAL 64 28678 10 1 8 1 7 0 23 1 13 0 2.23
11637
EXCELA HEALTH WESTMORELAND REGIONAL HOSPITAL 107 94631 11 3 22 1 10 0 33 0 27 0 1.13
12565
FAIRMOUNT BEHAVIORAL HEALTH SYSTEM 38 41349 0 31 0 0 0 4 0 3 0 0 0.92
12050 FIRST HOSPITAL OF WYOMING VALLEY 0 33733 0 0 0 0 0 0 0 0 0 0 0.00
11265 FORBES REGIONAL HOSPITAL 165 85996 16 0 68 1 13 0 41 1 24 1 1.92
12832
FOUNDATIONS BEHAVIORAL HEALTH 19 15372 0 13 0 0 0 1 0 2 3 0 1.24
12488 FRIENDS HOSPITAL 45 52675 0 36 0 0 0 0 0 6 3 0 0.85
11939 FULTON COUNTY MEDICAL CENTER 6 4065 0 0 0 0 3 0 0 0 3 0 1.48
11993
GEISINGER HEALTHSOUTH REHABILITATION HOSPITAL 8 10978 0 0 5 0 0 0 0 0 3 0 0.73
11775 GEISINGER MEDICAL CENTER 559 136175 82 3 76 19 34 0 213 19 112 1 4.11
11780
GEISINGER WYOMING VALLEY MEDICAL CENTER 285 64749 14 0 40 14 32 0 111 5 67 2 4.40
11531 GETTYSBURG HOSPITAL 35 18089 0 0 10 0 2 2 19 0 2 0 1.93
12241
GNADEN HUETTEN MEMORIAL HOSPITAL 32 16886 1 4 3 0 3 0 6 2 13 0 1.90
13929 GOOD SHEPHERD PENN PARTNERS 55 8537 22 0 11 15 1 0 0 2 4 0 6.44
11887
GOOD SHEPHERD SPECIALTY HOSPITAL 30 10551 9 0 6 0 0 0 0 3 12 0 2.84
11847 GRAND VIEW HOSPITAL 134 42899 7 2 21 0 46 0 21 2 35 0 3.12
11722 GROVE CITY MEDICAL CENTER 11 7906 0 0 5 0 1 0 5 0 0 0 1.39
11437
HAHNEMANN UNIVERSITY HOSPITAL 262 127259 46 6 75 7 16 0 54 10 44 4 2.06

24
orgID Name Infections Patient
Days BSI EENT GI LRI PNEU REPR SSI SST UTI Other
Crude Infection
Rate/1000 pt-days
11899 HANOVER HOSPITAL 82 25152 0 0 23 1 8 0 20 3 27 0 3.26
14471
HAVEN BEHAVIORAL HOSPITAL OF EASTERN PENNSYLVANIA 0 7714 0 0 0 0 0 0 0 0 0 0 0.00
11878 HAZLETON GENERAL HOSPITAL 41 33295 5 0 10 0 6 0 10 2 8 0 1.23
11727
HEALTHSOUTH HARMARVILLE REHABILITATION HOSPITAL 37 31608 2 1 5 0 0 0 0 0 29 0 1.17
11667
HEALTHSOUTH NITTANY VALLEY REHABILITATION HOSPITAL 21 11594 1 0 7 0 0 0 0 2 11 0 1.81
12139
HEALTHSOUTH READING REHABILITATION HOSPITAL 20 15204 1 0 2 0 0 0 0 0 17 0 1.32
11903
HEALTHSOUTH REHABILITATION HOSPITAL OF ALTOONA 33 23971 1 0 4 0 2 0 0 4 22 0 1.38
11810
HEALTHSOUTH REHABILITATION HOSPITAL OF ERIE 9 25219 1 0 1 0 4 0 0 0 3 0 0.36
12402
HEALTHSOUTH REHABILITATION HOSPITAL OF MECHANICSBURG 11 16976 0 0 2 0 0 0 0 0 9 0 0.65
12066
HEALTHSOUTH REHABILITATION HOSPITAL OF SEWICKLEY 16 11046 0 0 0 0 2 0 0 0 14 0 1.45
12058
HEALTHSOUTH REHABILITATION HOSPITAL OF YORK 70 20041 1 8 20 1 5 0 0 1 34 0 3.49
12571
HEART OF LANCASTER REGIONAL MEDICAL CENTER 40 10692 2 0 0 0 5 6 14 3 10 0 3.74
11831 HERITAGE VALLEY BEAVER 207 83343 24 0 46 1 20 2 37 11 64 2 2.48
10375 HERITAGE VALLEY SEWICKLEY 94 46555 8 0 28 3 8 0 29 1 17 0 2.02
11902 HIGHLANDS HOSPITAL 9 12457 1 1 0 0 0 0 6 0 1 0 0.72
11973
HOLY REDEEMER HOSPITAL AND MEDICAL CENTER 119 64189 3 0 75 0 6 1 19 5 10 0 1.85

25
orgID Name Infections Patient
Days BSI EENT GI LRI PNEU REPR SSI SST UTI Other
Crude Infection
Rate/1000 pt-days
12387 HOLY SPIRIT HOSPITAL 139 73682 12 2 32 4 8 0 36 6 38 1 1.89
12543 HORSHAM CLINIC 36 50200 0 21 0 0 0 0 0 0 15 0 0.72
12134
HOSPITAL OF FOX CHASE CANCER CENTER 86 22367 11 0 8 0 6 0 37 0 24 0 3.84
10219
HOSPITAL OF THE UNIV OF PENNSYLVANIA 1069 249501 39 52 232 103 71 2 264 60 235 11 4.28
11759 INDIANA REGIONAL MEDICAL CENTER 68 40201 3 0 23 0 14 0 12 1 15 0 1.69
11724 J C BLAIR MEMORIAL HOSP 43 9767 1 2 4 0 9 1 15 3 8 0 4.40
11954
JAMESON MEMORIAL HOSPITAL 40 38782 7 0 15 0 6 0 8 0 3 1 1.03
11459 JEANES HOSPITAL 34 41037 3 0 4 1 5 0 12 1 8 0 0.83
10237
JEFFERSON REGIONAL MEDICAL CENTER 209 83272 21 1 33 3 40 0 74 5 30 2 2.51
12337
JENNERSVILLE REGIONAL HOSPITAL 14 13563 1 0 5 0 3 0 3 0 2 0 1.03
11689 JERSEY SHORE HOSPITAL 2 5197 0 0 0 0 1 0 0 0 1 0 0.38
11861
JOHN HEINZ INSTITUTE OF REHABILITATION 37 21076 0 1 9 0 2 0 0 1 24 0 1.76
12111 KANE COMMUNITY HOSPITAL 6 5398 0 0 2 0 3 0 0 0 1 0 1.11
12609 KENSINGTON HOSPITAL 2 2751 1 0 0 0 0 0 0 0 1 0 0.73
12430
KIDSPEACE ORCHARD HILLS CAMPUS 0 25124 0 0 0 0 0 0 0 0 0 0 0.00
12504
KINDRED HOSPITAL --- DELEWARE COUNTY 46 6819 14 0 5 5 3 0 0 1 18 0 6.75
11832 KINDRED HOSPITAL --- PHILADELPHIA 111 13457 24 0 19 6 3 0 0 2 57 0 8.25
12358 KINDRED HOSPITAL --- PITTSBURGH 47 10214 12 0 4 15 1 0 0 4 11 0 4.60
12485
KINDRED HOSPITAL --- WYOMING VALLEY 66 8404 7 0 8 4 14 0 0 6 27 0 7.85
12268
KINDRED HOSPITAL AT HERITAGE VALLEY 41 8765 6 0 8 10 0 0 0 2 15 0 4.68
12007 KINDRED HOSPITAL EASTON 34 6982 8 0 12 3 1 0 0 1 9 0 4.87

26
orgID Name Infections Patient
Days BSI EENT GI LRI PNEU REPR SSI SST UTI Other
Crude Infection
Rate/1000 pt-days
12908
KINDRED HOSPITAL PHILADELPHIA --- HAVERTOWN 36 12225 11 0 7 0 0 0 0 5 13 0 2.94
12296
KINDRED HOSPITAL PITTSBURGH --- NORTH SHORE 9 8578 3 0 0 3 1 0 0 0 2 0 1.05
11940
KINDRED HOSPITAL SOUTH PHILADELPHIA 75 6625 20 2 11 9 21 0 0 2 10 0 11.32
12624 KIRKBRIDE CENTER 4 3593 0 4 0 0 0 0 0 0 0 0 1.11
10183 LANCASTER GENERAL HOSPITAL 376 161796 39 1 17 12 46 3 157 13 74 14 2.32
12335
LANCASTER REGIONAL MEDICAL CENTER 79 28792 10 0 5 0 10 0 25 2 26 1 2.74
12628
LANCASTER REHABILITATION HOSPITAL 18 17607 0 0 4 0 0 0 0 0 14 0 1.02
12032 LANSDALE HOSPITAL 24 21292 7 0 5 0 3 0 5 0 4 0 1.13
11884 LEHIGH VALLEY HOSPITAL 482 221791 105 0 84 5 47 2 124 2 104 9 2.17
11898
LEHIGH VALLEY HOSPITAL --- MUHLENBERG 84 50937 9 0 21 0 2 0 30 0 20 2 1.65
11825 LEWISTOWN HOSPITAL 40 24902 1 0 7 0 4 2 18 0 8 0 1.61
12005
LIFECARE HOSPITALS OF CHESTER COUNTY 32 8890 12 0 12 0 1 0 0 0 7 0 3.60
12388
LIFECARE HOSPITALS OF MECHANICSBURG 20 11607 5 0 2 0 1 0 0 0 12 0 1.72
11945
LIFECARE HOSPITALS OF PITTSBURGH 50 27933 19 0 19 0 6 0 0 1 5 0 1.79
18955
LIFECARE HOSPITALS OF PITTSBURGH --- ALLE-KISKI CAMPUS 15 7254 1 0 3 0 1 0 0 0 10 0 2.07
12254
LIFECARE HOSPITALS OF PITTSBURGH --- MONROEVILLE 50 14075 10 0 17 4 0 0 0 0 19 0 3.55
12385
LIFECARE HOSPITALS OF PITTSBURGH --- SUBURBAN CAMPUS 20 7155 9 0 9 0 0 0 0 0 2 0 2.80
12097 LOCK HAVEN HOSPITAL 5 4158 0 0 0 0 2 0 2 0 1 0 1.20
12390 LOWER BUCKS HOSPITAL 26 31448 1 0 0 5 2 0 13 0 5 0 0.83
27
orgID Name Infections Patient
Days BSI EENT GI LRI PNEU REPR SSI SST UTI Other
Crude Infection
Rate/1000 pt-days
12146 MAGEE REHAB HOSPITAL 73 28612 2 0 10 0 1 0 0 0 60 0 2.55
10301
MAGEE WOMENS HOSPITAL OF UPMC HEALTH SYSTEM 169 77844 18 7 4 5 17 1 95 7 15 0 2.17
11750 MAIN LINE HOSPITAL --- PAOLI 96 59968 6 1 15 3 14 0 33 2 20 2 1.60
11753
MAIN LINE HOSPITAL BRYN MAWR 134 94116 19 0 25 1 29 0 30 3 26 1 1.42
11417
MAIN LINE HOSPITAL BRYN MAWR REHABILITATION 82 41448 1 0 9 2 3 0 0 4 63 0 1.98
11770
MAIN LINE HOSPITAL LANKENAU MEDICAL CENTER 182 85861 18 10 20 14 25 0 60 1 34 0 2.12
12338
MARIAN COMMUNITY HOSPITAL 9 7862 0 0 5 0 1 0 0 0 3 0 1.14
11583 MEADVILLE MEDICAL CENTER 60 36634 2 1 16 1 10 0 19 1 10 0 1.64
11633 MEMORIAL HOSPITAL YORK 76 23341 3 1 9 0 6 1 28 5 23 0 3.26
12549
MEMORIAL HOSPITAL, INC. TOWANDA 1 4432 0 0 0 0 0 0 0 1 0 0 0.23
11683 MERCY FITZGERALD HOSPITAL 84 47715 19 0 14 1 9 0 19 1 20 1 1.76
11946
MERCY PHILADELPHIA HOSPITAL 17 43434 1 0 5 1 0 0 9 1 0 0 0.39
11952
MERCY SUBURBAN HOSPITAL NORRISTOWN 54 28748 6 0 7 0 4 0 21 4 9 3 1.88
11968
MEYERSDALE COMMUNITY HOSPITAL 1 1727 0 0 0 0 0 0 0 0 1 0 0.58
11557 MID-VALLEY HOSPITAL 2 4247 0 0 0 0 0 0 0 0 2 0 0.47
12253
MILLCREEK COMMUNITY HOSPITAL 27 20062 2 0 0 6 0 0 2 2 14 1 1.35
11747 MILTON S HERSHEY MEDICAL CENTER 552 144466 76 22 88 44 31 0 146 11 119 15 3.82
12295 MINERS MEDICAL CENTER 4 4420 0 0 1 0 1 0 1 0 0 1 0.90
11069 MONONGAHELA VALLEY HOSPITAL 90 51094 7 2 14 0 26 0 21 2 18 0 1.76

28
orgID Name Infections Patient
Days BSI EENT GI LRI PNEU REPR SSI SST UTI Other
Crude Infection
Rate/1000 pt-days
12287
MONTGOMERY COUNTY MH/MR EMERGENCY SERVICES, INC. 0 21680 0 0 0 0 0 0 0 0 0 0 0.00
11947 MONTGOMERY HOSPITAL 54 29541 7 0 8 0 1 1 25 1 11 0 1.83
11528 MOSES TAYLOR HOSPITAL 74 57390 8 4 5 0 10 2 30 4 11 0 1.29
11797 MOUNT NITTANY MEDICAL CENTER 124 51928 5 1 18 0 9 1 58 0 31 1 2.39
11748 MUNCY VALLEY HOSPITAL 15 4785 1 0 2 0 2 0 2 1 7 0 3.13
11907 NASON HOSPITAL 13 8468 0 0 1 0 1 0 9 0 2 0 1.54
11919 NAZARETH HOSPITAL 96 46634 22 4 20 0 8 0 12 2 28 0 2.06
12047 NORRISTOWN STATE HOSPITAL 129 125390 0 66 1 1 1 6 0 49 5 0 1.03
12298 OHIO VALLEY GENERAL HOSPITAL 21 21440 6 0 9 0 0 0 1 0 5 0 0.98
18467 OSS ORTHOPAEDIC HOSPITAL 20 3302 0 0 0 0 0 0 17 0 3 0 6.06
12396 PALMERTON HOSPITAL 7 11229 0 0 1 0 5 0 0 1 0 0 0.62
11814
PENN PRESBYTERIAN MEDICAL CENTER 180 65272 33 1 20 20 10 0 59 4 33 0 2.76
11915
PENN STATE HERSHEY REHABILITATION LLC 34 14130 2 0 5 0 0 0 0 1 26 0 2.41
11448
PENNSYLVANIA HOSP OF THE UNIV OF PA HEALTH SYS 413 129191 42 12 73 14 20 9 161 21 59 2 3.20
14190
PENNSYLVANIA PSYCHIATRIC INSTITUTE 3 20269 0 1 0 0 1 0 0 0 1 0 0.15
11740 PHILHAVEN HOSPITAL 0 28128 0 0 0 0 0 0 0 0 0 0 0.00
11836
PHOENIXVILLE HOSPITAL COMPANY LLC 64 34445 3 0 11 0 12 0 24 2 11 1 1.86
19630
PHYSICIANS CARE SURGICAL HOSPITAL 0 215 0 0 0 0 0 0 0 0 0 0 0.00
10122 PINNACLE HEALTH HOSPITALS 401 149719 25 5 54 0 22 1 173 18 93 10 2.68
11772 POCONO MEDICAL CENTER 81 56600 8 0 10 0 9 0 43 4 7 0 1.43
11983
POTTSTOWN MEMORIAL MEDICAL CENTER 33 43413 2 0 5 0 4 0 11 1 10 0 0.76
29
orgID Name Infections Patient
Days BSI EENT GI LRI PNEU REPR SSI SST UTI Other
Crude Infection
Rate/1000 pt-days
11830 PUNXSUTAWNEY AREA HOSPITAL 24 7380 0 0 5 0 1 0 13 1 3 1 3.25
12375
READING HOSPITAL AND MEDICAL CENTER 356 158238 36 2 63 10 21 2 110 24 85 3 2.25
12533
REGIONAL HOSPITAL OF SCRANTON 45 43923 10 0 8 0 6 0 13 0 8 0 1.02
11731 RIDDLE MEMORIAL HOSPITAL 39 49126 4 3 0 0 5 0 15 0 12 0 0.79
12422 ROBERT PACKER HOSPITAL 113 63820 31 0 0 6 21 0 32 3 20 0 1.77
11978
ROXBOROUGH MEMORIAL HOSPITAL 36 29113 13 0 5 0 3 0 3 1 11 0 1.24
12723
ROXBURY TREATMENT CENTER 24 33540 0 21 0 0 0 1 0 2 0 0 0.72
11684 SACRED HEART HOSPITAL 51 33338 4 1 8 0 1 0 25 2 10 0 1.53
11922
SCHUYLKILL MEDICAL CENTER --- EAST NORWEGIAN STREET 31 30491 4 0 8 1 4 0 9 0 5 0 1.02
12087
SCHUYLKILL MEDICAL CENTER --- SOUTH JACKSON STREET 33 37078 3 0 1 0 7 0 15 3 4 0 0.89
13921
SELECT MEDICAL AT POLYCLINC MEDICAL CENTER 29 9728 6 0 14 0 0 0 0 1 8 0 2.98
12334
SELECT SPECIALITY HOSPITAL --- CENTRAL PENNSYLVANIA (YORK) 21 5387 1 0 9 0 0 0 0 0 11 0 3.90
11880 SELECT SPECIALITY HOSPITAL --- ERIE 88 10883 5 4 16 5 12 0 0 3 42 1 8.09
12299
SELECT SPECIALITY HOSPITAL --- JOHNSTOWN 19 10110 6 0 0 0 2 0 0 2 9 0 1.88
12009
SELECT SPECIALTY HOSPITAL --- PITTSBURGH/UPMC 43 8138 12 0 17 1 5 0 0 2 6 0 5.28
12123
SELECT SPECIALTY HOSPITAL --- DANVILLE 21 5168 4 0 11 0 2 0 0 0 4 0 4.06
12271
SELECT SPECIALTY HOSPITAL --- MCKEESPORT, INC. 7 7857 3 0 1 1 0 0 0 1 1 0 0.89
30
orgID Name Infections Patient
Days BSI EENT GI LRI PNEU REPR SSI SST UTI Other
Crude Infection
Rate/1000 pt-days
12147
SELECT SPECIALTY HOSPITAL --- CENTRAL PENNSYLVANIA (CAMP HILL) 27 8609 5 0 9 0 0 0 0 0 13 0 3.14
12108
SELECT SPECIALTY HOSPITAL LAUREL HIGHLANDS, INC. 12 7750 2 0 6 0 0 0 0 1 3 0 1.55
12133
SHAMOKIN AREA COMMUNITY HOSPITAL 5 11564 0 0 1 0 0 0 3 0 1 0 0.43
12250 SHARON REGIONAL HEALTH SYSTEM 54 37998 2 0 30 1 3 0 12 0 6 0 1.42
12244
SHRINERS HOSPITAL FOR CHILDREN --- PHILADELPHIA 10 4514 0 0 0 0 0 0 6 0 4 0 2.22
12411
SHRINERS HOSPITALS FOR CHILDREN --- ERIE 2 69 0 0 0 0 0 0 0 2 0 0 28.99
11688
SOLDIERS & SAILORS MEM HOSPITAL 25 11733 1 0 3 0 7 0 10 0 3 1 2.13
12282 SOMERSET HOSPITAL 8 19366 2 0 1 0 1 0 3 0 1 0 0.41
11942
SOUTHWEST REGIONAL MEDICAL CENTER 5 16853 1 0 0 0 0 0 4 0 0 0 0.30
12453
SOUTHWOOD PSYCHIATRIC HOSPITAL 30 11388 0 20 0 1 0 0 0 8 1 0 2.63
12604 SPECIAL CARE HOSPITAL 57 14958 1 0 11 14 1 0 0 0 30 0 3.81
12365
ST. CATHERINE MEDICAL CENTER FOUNTAIN SPRINGS 8 6167 0 0 0 0 4 0 0 0 4 0 1.30
12290
ST. CHRISTOPHER'S HOSPITAL FOR CHILDREN 107 46423 27 17 7 15 3 0 16 8 12 2 2.30
10561
ST. CLAIR MEMORIAL HOSPITAL 180 85606 2 1 81 1 15 0 66 4 8 2 2.10
12548 ST. JOHN VIANNEY HOSPITAL 8 14231 0 0 4 0 0 0 0 4 0 0 0.56
11961 ST. JOSEPH MEDICAL CENTER 61 37733 10 0 2 1 4 0 28 0 16 0 1.62
12438 ST. JOSEPH'S HOSPITAL 57 23411 20 0 3 0 7 0 1 1 25 0 2.43
11718
ST. LUKE'S HOSPITAL BETHLEHEM 425 142433 38 10 75 41 36 1 105 9 104 6 2.98

31
orgID Name Infections Patient
Days BSI EENT GI LRI PNEU REPR SSI SST UTI Other
Crude Infection
Rate/1000 pt-days
11784
ST. LUKE'S MINERS MEMORIAL HOSPITAL 5 6390 0 0 0 0 0 0 2 0 3 0 0.78
11711
ST. LUKE'S QUAKERTOWN HOSPITAL 17 15057 0 0 4 0 2 0 7 1 3 0 1.13
11885 ST. MARY MEDICAL CENTER 165 99643 15 0 27 1 19 0 30 7 64 2 1.66
12483 ST. MARY MEDICAL CENTER REHAB 17 8745 0 0 2 0 0 0 0 0 15 0 1.94
11699 ST. VINCENT HEALTH CENTER 265 83108 11 3 48 7 30 0 93 7 63 3 3.19
12105
SUNBURY COMMUNITY HOSPITAL 12 7897 0 3 1 0 6 0 2 0 0 0 1.52
12535
SURGICAL INSTITUTE OF READING 4 2646 0 0 0 0 0 0 3 0 1 0 1.51
12382
TEMPLE UNIVERSITY HOSPITAL 330 145364 62 3 46 16 65 0 60 9 69 0 2.27
12336
THE CHILDREN'S HOME OF PITTSBURGH 11 4665 5 3 0 0 0 0 0 3 0 0 2.36
11712
THE GOOD SAMARITAN HOSPITAL 77 42849 4 1 16 2 9 0 14 5 25 1 1.80
11896
THE GOOD SHEPHERD REHABILITATION HOSPITAL 37 29920 4 1 3 0 1 0 0 4 24 0 1.24
12156
THE MEADOWS PSYCHIATRIC CENTER 32 34542 0 21 0 3 1 0 0 2 5 0 0.93
11460 THE WASHINGTON HOSPITAL 106 62228 3 0 22 1 21 0 31 0 28 0 1.70
11864
THE WESTERN PENNSYLVANIA HOSPITAL 97 41736 32 1 24 11 1 0 17 1 10 0 2.32
12017
THOMAS JEFFERSON UNIV HOSP - METHODIST 181 46785 28 1 29 2 55 0 17 7 42 0 3.87
11506
THOMAS JEFFERSON UNIV HOSPITAL 715 192353 56 1 130 0 64 0 253 6 203 2 3.72
11738 TITUSVILLE AREA HOSPITAL 7 7822 0 0 0 0 0 0 5 2 0 0 0.89
12091 TORRANCE STATE HOSPITAL 43 109720 0 7 1 0 1 1 0 20 12 1 0.39
12018 TROY COMMUNITY HOSPITAL 12 7358 1 0 1 2 1 0 1 2 4 0 1.63
11829 TYLER MEMORIAL HOSPITAL 18 6054 0 0 0 1 3 0 4 2 8 0 2.97

32
orgID Name Infections Patient
Days BSI EENT GI LRI PNEU REPR SSI SST UTI Other
Crude Infection
Rate/1000 pt-days
12717 TYRONE HOSPITAL 5 2672 0 0 0 0 0 0 4 1 0 0 1.87
10441 UNIONTOWN HOSPITAL 87 42132 3 0 32 1 10 0 29 1 11 0 2.06
11680 UPMC BEDFORD 9 6685 0 0 0 0 0 0 6 0 3 0 1.35
11725 UPMC HAMOT 244 87580 13 4 33 2 38 0 105 5 43 1 2.79
11675 UPMC HORIZON 68 34976 2 0 2 0 30 0 24 4 6 0 1.94
11707 UPMC MCKEESPORT 129 64473 6 0 24 0 30 1 26 6 36 0 2.00
10384 UPMC MERCY 299 144046 12 1 28 7 57 0 93 4 93 4 2.08
11837 UPMC NORTHWEST 47 35676 2 0 7 0 4 0 13 0 21 0 1.32
11242 UPMC PASSAVANT 355 105433 15 0 67 8 48 0 138 5 74 0 3.37
10348
UPMC PRESBYTERIAN SHADYSIDE --- PRESBYTERIAN 1021 224769 95 13 150 27 198 0 315 17 193 13 4.54
10118
UPMC PRESBYTERIAN SHADYSIDE --- SHADYSIDE 667 170109 38 15 189 6 114 0 183 15 99 8 3.92
13702
UPMC PRESBYTERIAN SHADYSIDE --- WPIC 48 102650 3 14 3 0 3 0 0 5 20 0 0.47
11561 UPMC ST MARGARET 143 79022 12 1 19 1 23 0 59 3 25 0 1.81
12029
VALLEY FORGE MEDICAL CENTER AND HOSPITAL 0 17024 0 0 0 0 0 0 0 0 0 0 0.00
12216 WARREN GENERAL HOSPITAL 24 13033 2 0 8 0 4 0 8 0 2 0 1.84
12081 WARREN STATE HOSPITAL 0 5042 0 0 0 0 0 0 0 0 0 0 0.00
12004 WAYNE MEMORIAL HOSPITAL 34 15942 1 1 3 0 11 0 13 0 5 0 2.13
11642 WAYNESBORO HOSPITAL 4 9729 0 0 0 0 2 0 1 0 1 0 0.41
12368 WERNERSVILLE STATE HOSPITAL 36 97823 0 12 1 0 0 0 0 15 8 0 0.37
12487 WESTFIELD HOSPITAL 2 2004 0 0 0 0 0 0 2 0 0 0 1.00
11916 WILKES-BARRE GENERAL HOSPITAL 235 84294 32 3 25 5 37 2 56 5 67 3 2.79
11732
WILLIAMSPORT REGIONAL MEDICAL CENTER 164 54085 7 10 21 4 15 1 47 9 48 2 3.03
12031 WINDBER HOSPITAL 9 7878 0 0 0 0 1 0 6 0 2 0 1.14
10108 YORK HOSPITAL 519 175653 17 7 89 30 85 8 147 19 112 5 2.95
Total 22713 10212208 2479 741 3951 865 2420 77 6113 799 5063 205 2.22

33
Catheter-Associated Urinary Tract Infections (CAUTIs)
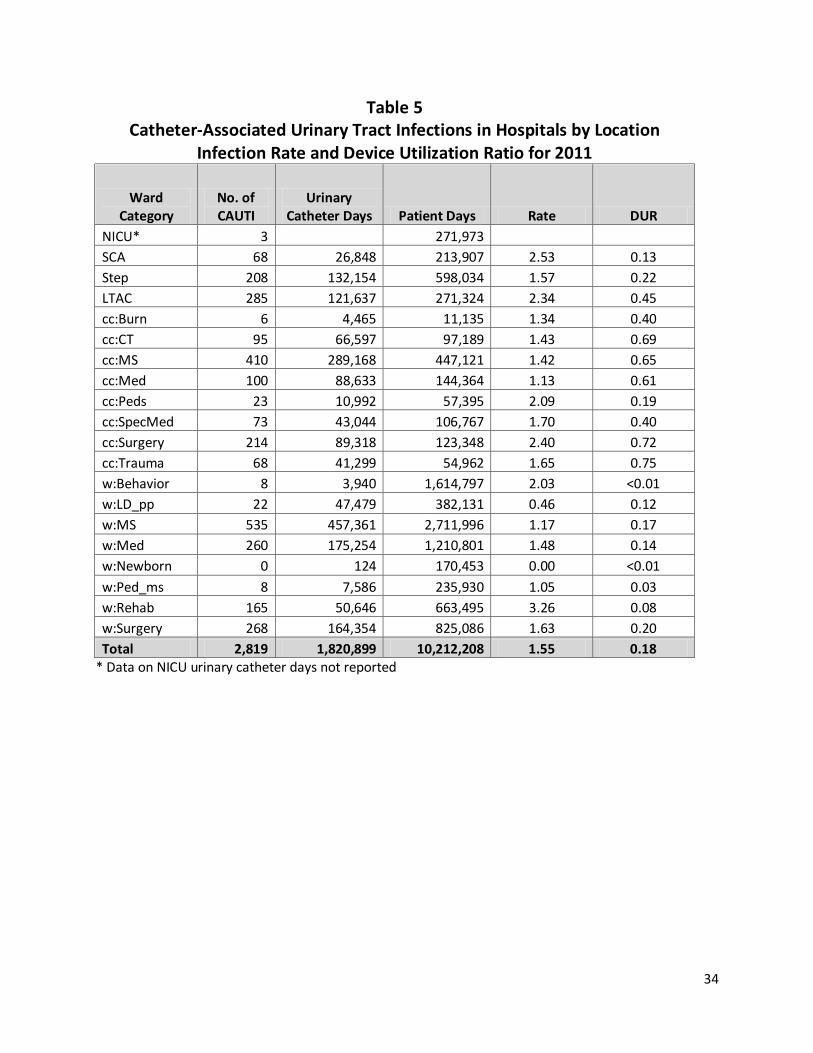
In 2011, urinary tract infections constituted the second most commonly reported category of HAIs in Pennsylvania, with 5,063 (22.3 percent) occurrences. More than half (2,819, or 55.7 percent) of the UTIs were associated with the use of urinary catheters, which are one of the more commonly used medical devices in hospital settings. In 2011, a total of 1,820,899 urinary catheter days were reported by 234 Pennsylvania hospitals (urinary catheter days ranged from a low of 4 for the year to a high of 80,086 among the 234 hospitals). The number of hospitals that reported using urinary catheters in 2011 represents 92.1 percent of the 254 hospitals that reported data through NHSN. The 20 hospitals with no reported use of urinary catheters are mostly psychiatric or drug and alcohol rehabilitation facilities and can be found before Table 9. The number of urinary catheter days reported in 2011 produces a device utilization ratio of 0.18, meaning that a urinary catheter was used 18 percent of the time in Pennsylvania’s hospitalized patients (Table 5). As expected, urinary catheter use is highest in critical care units where the sickest patients are receiving care. Catheter use was highest in trauma critical care units (75 percent of the time), in surgical intensive care units (72 percent of the time), and in cardiothoracic critical care units (69 percent of the time). Among the 234 hospitals that reported any use of urinary catheters, 191 (81.6 percent) of them reported at least one CAUTI while the other 43 (18.4 percent) reported no identified CAUTIs. Pennsylvania’s CAUTI rate for 2011 was 1.55 CAUTIs per 1,000 urinary catheter days (Table 5). This compares to a CAUTI rate in 2010 of 1.71 CAUTIs per 1,000 urinary catheter days (Table 5A), representing a reduction of 9.4 percent. When compared to the baseline year of 2009, the decline is 21.3 percent, translating to 1,256 fewer CAUTIs than would have otherwise occurred if the 2009 rate persisted into 2011. The risk of a CAUTI varies substantially in the different areas of the hospital (Table 5). The highest rate seen in 2011 among the hospital locations was in rehabilitation wards (3.26 CAUTIs per 1,000 urinary catheter days), followed by specialty care units (2.53 CAUTIs) and surgical intensive care units (2.40 CAUTIs). The lowest rates (for locations with at least 1,000 urinary catheter days) were seen in labor/deliver post-partum (0.46 CAUTIs per 1,000 urinary catheter days), pediatric medical-surgical wards (1.05 CAUTIs per 1,000 urinary catheter days) and medical intensive care units (1.13 CAUTIs per 1,000 urinary catheter days).
Catheter-Associated Urinary Tract Infections by Year in Pennsylvania
Year No. of CAUTIs
No. of Catheter
Days
No. of Patient Days
Device Utilization
Ratio
Rate per 1,000 Catheter Days
Percent Decline (prior year/ cumulative)
2009 3,935 1,995,114 10,920,596 0.20 1.97
2010 3,245 1,894,709 10,289,079 0.18 1.71 13.2/13.2 2011 2,819 1,820,899 10,212,208 0.18 1.55 9.4/21.3
34
Table 5 Catheter-Associated Urinary Tract Infections in Hospitals by Location
Infection Rate and Device Utilization Ratio for 2011
Ward Category
No. of CAUTI
Urinary Catheter Days Patient Days Rate DUR
NICU* 3 271,973 SCA 68 26,848 213,907 2.53 0.13
Step 208 132,154 598,034 1.57 0.22
LTAC 285 121,637 271,324 2.34 0.45
cc:Burn 6 4,465 11,135 1.34 0.40
cc:CT 95 66,597 97,189 1.43 0.69
cc:MS 410 289,168 447,121 1.42 0.65
cc:Med 100 88,633 144,364 1.13 0.61
cc:Peds 23 10,992 57,395 2.09 0.19
cc:SpecMed 73 43,044 106,767 1.70 0.40
cc:Surgery 214 89,318 123,348 2.40 0.72
cc:Trauma 68 41,299 54,962 1.65 0.75
w:Behavior 8 3,940 1,614,797 2.03 <0.01
w:LD_pp 22 47,479 382,131 0.46 0.12
w:MS 535 457,361 2,711,996 1.17 0.17
w:Med 260 175,254 1,210,801 1.48 0.14
w:Newborn 0 124 170,453 0.00 <0.01
w:Ped_ms 8 7,586 235,930 1.05 0.03
w:Rehab 165 50,646 663,495 3.26 0.08
w:Surgery 268 164,354 825,086 1.63 0.20
Total 2,819 1,820,899 10,212,208 1.55 0.18 * Data on NICU urinary catheter days not reported

35
Table 5A Catheter-Associated Urinary Tract Infections in Hospitals by Location
Comparison of 2010 and 2011 Rates and Device Utilization Ratios
Ward Category 2010 Rate 2011 Rate 2010 DUR 2011 DUR
NICU*
SCA 1.81 2.53 0.14 0.13
Step 1.73 1.57 0.22 0.22
LTAC 2.37 2.34 0.46 0.45
cc:Burn 1.66 1.34 0.39 0.40
cc:CT 1.64 1.43 0.68 0.69
cc:MS 1.40 1.42 0.65 0.65
cc:Med 1.58 1.13 0.61 0.61
cc:Peds 2.71 2.09 0.21 0.19
cc:SpecMed 1.96 1.70 0.46 0.40
cc:Surgery 2.44 2.40 0.75 0.72
cc:Trauma 1.42 1.65 0.79 0.75
w:Behavior 1.91 2.03 <0.01 <0.01
w:LD_pp 0.62 0.46 0.14 0.12
w:MS 1.56 1.17 0.17 0.17
w:Med 1.70 1.48 0.16 0.14
w:Newborn 0.00 0.00 <0.01 <0.01
w:Ped_ms 1.19 1.05 0.04 0.03
w:Rehab 3.30 3.26 0.08 0.08
w:Surgery 1.64 1.63 0.22 0.20
Total 1.71 1.55 0.18 0.18
36
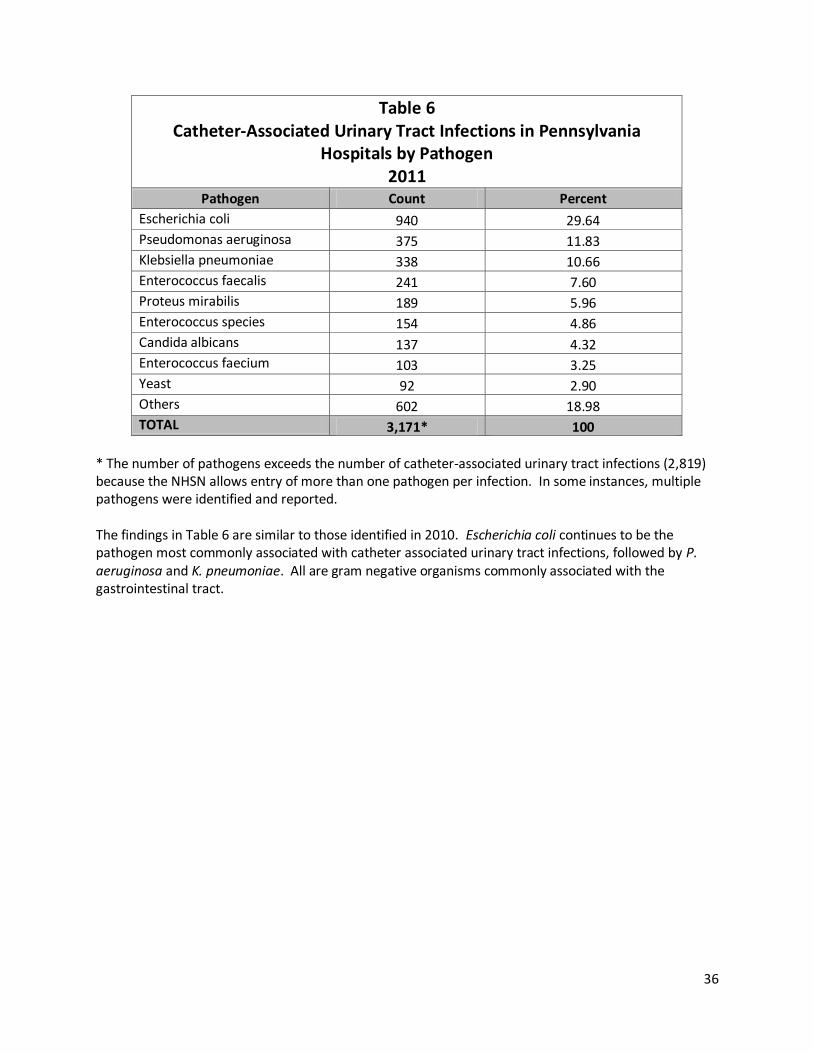
Table 6 Catheter-Associated Urinary Tract Infections in Pennsylvania
Hospitals by Pathogen 2011
Pathogen Count Percent
Escherichia coli 940 29.64
Pseudomonas aeruginosa 375 11.83
Klebsiella pneumoniae 338 10.66
Enterococcus faecalis 241 7.60
Proteus mirabilis 189 5.96
Enterococcus species 154 4.86
Candida albicans 137 4.32 Enterococcus faecium 103 3.25 Yeast 92 2.90 Others 602 18.98 TOTAL 3,171* 100
* The number of pathogens exceeds the number of catheter-associated urinary tract infections (2,819) because the NHSN allows entry of more than one pathogen per infection. In some instances, multiple pathogens were identified and reported. The findings in Table 6 are similar to those identified in 2010. Escherichia coli continues to be the pathogen most commonly associated with catheter associated urinary tract infections, followed by P. aeruginosa and K. pneumoniae. All are gram negative organisms commonly associated with the gastrointestinal tract.
37
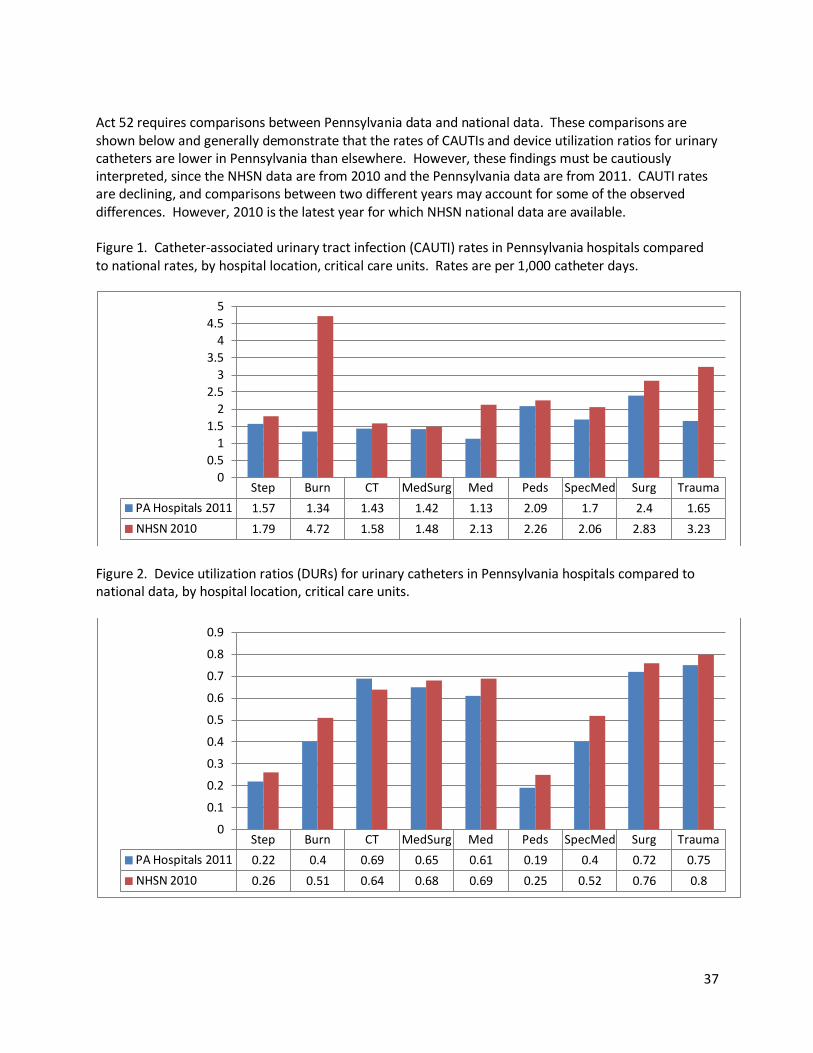
Act 52 requires comparisons between Pennsylvania data and national data. These comparisons are shown below and generally demonstrate that the rates of CAUTIs and device utilization ratios for urinary catheters are lower in Pennsylvania than elsewhere. However, these findings must be cautiously interpreted, since the NHSN data are from 2010 and the Pennsylvania data are from 2011. CAUTI rates are declining, and comparisons between two different years may account for some of the observed differences. However, 2010 is the latest year for which NHSN national data are available. Figure 1. Catheter-associated urinary tract infection (CAUTI) rates in Pennsylvania hospitals compared to national rates, by hospital location, critical care units. Rates are per 1,000 catheter days.
Figure 2. Device utilization ratios (DURs) for urinary catheters in Pennsylvania hospitals compared to national data, by hospital location, critical care units.
Step Burn CT MedSurg Med Peds SpecMed Surg Trauma
PA Hospitals 2011 1.57 1.34 1.43 1.42 1.13 2.09 1.7 2.4 1.65
NHSN 2010 1.79 4.72 1.58 1.48 2.13 2.26 2.06 2.83 3.23
0
0.5
1
1.5
2
2.5
3
3.5
4
4.5
5
Step Burn CT MedSurg Med Peds SpecMed Surg Trauma
PA Hospitals 2011 0.22 0.4 0.69 0.65 0.61 0.19 0.4 0.72 0.75
NHSN 2010 0.26 0.51 0.64 0.68 0.69 0.25 0.52 0.76 0.8
0
0.1
0.2
0.3
0.4
0.5
0.6
0.7
0.8
0.9

38
Figure 3. Catheter-associated urinary tract infection (CAUTI) rates in Pennsylvania hospitals compared to national rates, by hospital location, non-critical care locations. Rates are per 1,000 catheter days.
Figure 4. Device utilization ratios (DURs) for urinary catheters in Pennsylvania hospitals compared to national data, by hospital location, non-critical care units.
Source for 2010 NHSN data: Dudeck MA, et al. National Healthcare Safety Network (NHSN) Report, data summary for 2010, device-associated module. Am J Infect Control 2011;39:798-816.
SCA LTAC Behavior LaborDel MedSurg Med Newborn PedsMS Rehab Surg
PA Hospitals 2011 2.53 2.34 2.03 0.46 1.17 1.48 0 1.05 3.26 1.63
NHSN 2010 1.93 2.62 1.94 0.5 1.47 1.52 0 1.36 3.16 1.49
0
0.5
1
1.5
2
2.5
3
3.5
SCA LTAC Behavior LaborDel MedSurg Med Newborn PedMS Rehab Surg
PA Hospitals 2011 0.13 0.45 0.01 0.12 0.17 0.14 0.01 0.03 0.08 0.2
2010 NHSN 0.15 0.5 0.03 0.16 0.19 0.19 0.19 0.06 0.08 0.25
0
0.1
0.2
0.3
0.4
0.5
0.6
39
Facility Specific Catheter-Associated Urinary Tract Infection Findings Among the 234 hospitals that reported using urinary catheters in 2011, a total of 141 (60.3 percent) had a standardized infection ratio (SIR) that was <1.00, meaning they reported fewer CAUTIs than predicted by PADOH based on the statewide rate of CAUTIs. For 43 of these hospitals (18.4 percent of hospitals using urinary catheters), the SIR was 0.00 as they reported no CAUTIs in 2011. There were 92 hospitals (39.3 percent) that had an SIR that was >1.00, meaning they reported a greater number of CAUTIs than predicted by PADOH based on the statewide CAUTI rate. One hospital had exactly the same number of CAUTIs as predicted, producing an SIR of 1.00. For many of the hospitals, the difference between the number of CAUTIs reported in NHSN and the number predicted by PADOH is not statistically meaningful. This occurs in situations where the hospital’s use of urinary catheters is low or when the difference between the observed number and predicted number is relatively small. As an example, for 39 (16.7 percent) hospitals, the number of predicted CAUTIs was <1. Data from such hospitals is considered statistically unreliable, and the level of confidence in the reported results is low. For hospitals where the difference between the observed and predicted was not statistically different than expected, their reported CAUTI rates are considered “the same as” the statewide rate. In the accompanying tables, the confidence intervals for these hospitals are shaded in yellow. However, there were 28 hospitals (12.0 percent) where the reported number of CAUTIs was significantly better than predicted by PADOH. These hospitals are listed in Table 7 in alphabetical order and their confidence intervals are shaded in green in Table 10. There were also 28 hospitals (12.0 percent) where the reported number of CAUTIs was significantly worse than predicted by PADOH. These hospitals are listed in Table 8 in alphabetical order and their confidence intervals are shaded in red in Table 10. The SIR tables (Table 9 and 10) divide the list of hospitals based on their number of predicted infections into different tiers. This is because hospitals with similar numbers of predicted infections are generally in the same size range. The categories used in the 2011 report are similar to those previous used: hospitals with <1 predicted CAUTI, 1-2.99 predicted CAUTIs, 3-7.49 predicted CAUTIs, 7.50-14.99 predicted CAUTIs, 15.00-29.99 predicted CAUTIs, and 30+ predicted CAUTIs. Within each tier, hospitals are listed in order from best to worst SIR.

40
Table 7 Pennsylvania Hospitals with a Significantly Better than Predicted Number of Catheter-Associated Urinary Tract Infections in 2011
ALLEGHENY GENERAL HOSPITAL MERCY PHILADELPHIA HOSPITAL
ALTOONA REGIONAL HEALTH SYSTEM PINNACLE HEALTH HOSPITALS
CARLISLE REGIONAL MEDICAL CENTER REGIONAL HOSPITAL OF SCRANTON
COMMUNITY MEDICAL CENTER RIDDLE MEMORIAL HOSPITAL
CROZER CHESTER MEDICAL CENTER ROBERT PACKER HOSPITAL
CROZER CHESTER MEDICAL CENTER TAYLOR SELECT SPECIALTY HOSPITAL LAUREL HIGHLANDS, INC.
EXCELA HEALTH LATROBE HOSPITAL SHARON REGIONAL HEALTH SYSTEM
EXCELA HEALTH WESTMORELAND REGIONAL HOSPITAL SOMERSET HOSPITAL
HAZLETON GENERAL HOSPITAL ST. CLAIR MEMORIAL HOSPITAL
HOLY REDEEMER HOSPITAL AND MEDICAL CENTER THE GOOD SAMARITAN HOSPITAL
JAMESON MEMORIAL HOSPITAL THE WESTERN PENNSYLVANIA HOSPITAL
JEANES HOSPITAL UNIONTOWN HOSPITAL
KINDRED HOSPITAL PITTSBURGH --- NORTH SHORE UPMC PRESBYTERIAN SHADYSIDE --- SHADYSIDE (10118)
MAGEE WOMENS HOSPITAL OF UPMC HEALTH SYSTEM UPMC ST MARGARET
Table 8 Pennsylvania Hospitals with a Significantly Worse than Predicted Number of Catheter-Associated Urinary Tract Infections in 2011
ABINGTON MEMORIAL HOSPITAL MILTON S HERSHEY MEDICAL CENTER
ARIA HEALTH OSS ORTHOPAEDIC HOSPITAL
CHESTER COUNTY HOSPITAL SELECT SPECIALTY HOSPITAL – CENTRAL PENNSYLVANIA (CAMP HILL)
GEISINGER MEDICAL CENTER SELECT SPECIALTY HOSPITAL – CENTRAL PENNSYLVANIA (YORK)
GEISINGER WYOMING VALLEY MEDICAL CENTER SELECT SPECIALTY HOSPITAL – ERIE
HEALTHSOUTH REHABILITATION HOSPITAL OF YORK SPECIAL CARE HOSPITAL
HOSPITAL OF FOX CHASE CANCER CENTER ST. CHRISTOPHER’S HOSPITAL FOR CHILDREN
HOSPITAL OF THE UNIVERSITY OF PENNSYLVANIA ST. JOSEPH’S HOSPITAL
KINDRED HOSPITAL – DELAWARE COUNTY ST. MARY MEDICAL CENTER
KINDRED HOSPITAL - PHILADELPHIA THOMAS JEFFERSON UNIVERSITY HOSPITAL – METHODIST
KINDRED HOSPITAL - SOUTH PHILADEPHIA THOMAS JEFFERSON UNIVERSITY HOSPITAL
KINDRED HOSPITAL – WYOMING VALLEY TYLER MEMORIAL HOSPITAL
LANCASTER REGIONAL MEDICAL CENTER WILKES-BARRE GENERAL HOSPITAL
MAGEE REHABILITATION HOSPITAL YORK HOSPITAL

41
Hospitals Omitted From Tables 9 & 10 Due to No Reported Urinary Catheter Use By Name and NHSN ID Number
(N=20)
BELMONT CENTER FOR COMPREHENSIVE TREATMENT (12505) BROOKE GLEN BEHAVIORAL HOSPITAL (12623)
CLARION PSYCHIATRIC CENTER (12454) DEVEREUX CHILDREN'S BEHAVIORAL HEALTH INSTITUTE (12738)
FAIRMOUNT BEHAVIORAL HEALTH SYSTEM (12565) FIRST HOSPITAL OF WYOMING VALLEY (12050) FOUNDATIONS BEHAVIORAL HEALTH (12832)
HAVEN BEHAVIORAL HOSPITAL OF EASTERN PENNSYLVANIA (14471) HORSHAM CLINIC (12543)
KIDSPEACE ORCHARD HILLS CAMPUS (12430) KIRKBRIDE CENTER (12624)
MONTGOMERY COUNTY MH/MR EMERGENCY SERVICES, INC. (12287) PHILHAVEN HOSPITAL (11740)
ROXBURY TREATMENT CENTER (12723) SOUTHWOOD PSYCHIATRIC HOSPITAL (12453)
ST. JOHN VIANNEY HOSPITAL (12548) THE CHILDREN'S HOME OF PITTSBURGH (12336)
THE MEADOWS PSYCHIATRIC CENTER (12156) VALLEY FORGE MEDICAL CENTER AND HOSPITAL (12029)
WARREN STATE HOSPITAL (12081)
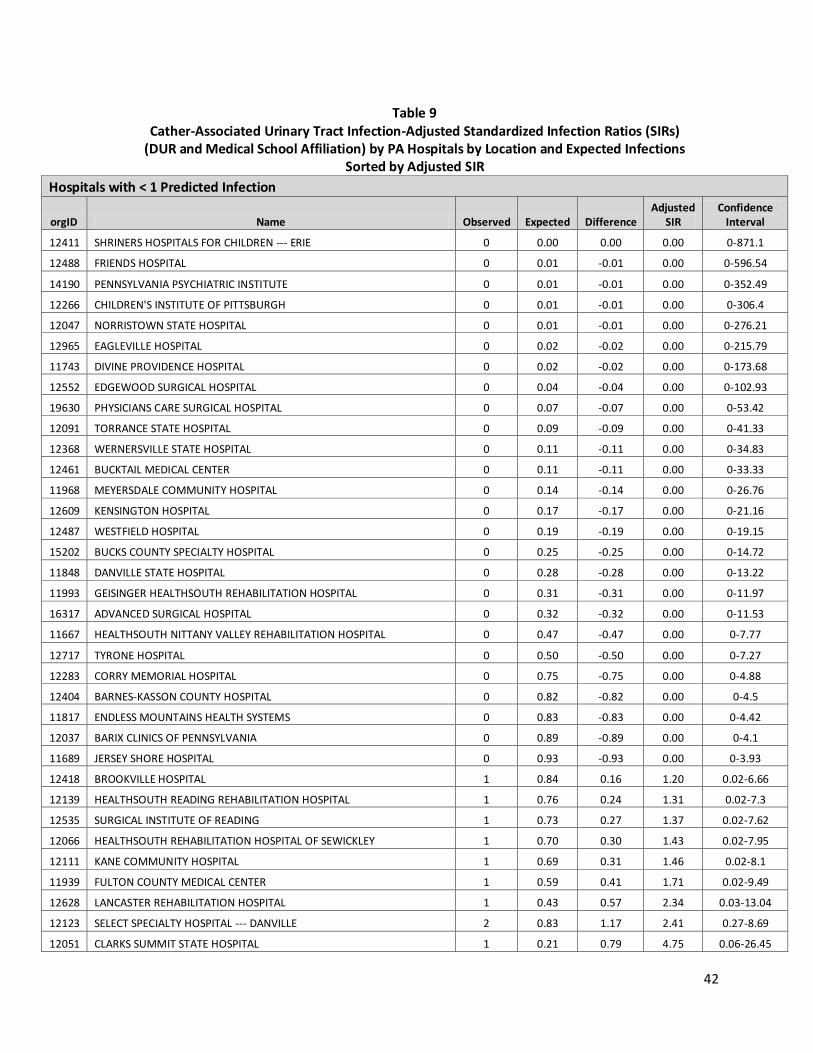
42
Table 9 Cather-Associated Urinary Tract Infection-Adjusted Standardized Infection Ratios (SIRs)
(DUR and Medical School Affiliation) by PA Hospitals by Location and Expected Infections Sorted by Adjusted SIR
Hospitals with < 1 Predicted Infection
orgID Name Observed Expected Difference Adjusted
SIR Confidence
Interval
12411 SHRINERS HOSPITALS FOR CHILDREN --- ERIE 0 0.00 0.00 0.00 0-871.1
12488 FRIENDS HOSPITAL 0 0.01 -0.01 0.00 0-596.54
14190 PENNSYLVANIA PSYCHIATRIC INSTITUTE 0 0.01 -0.01 0.00 0-352.49
12266 CHILDREN'S INSTITUTE OF PITTSBURGH 0 0.01 -0.01 0.00 0-306.4
12047 NORRISTOWN STATE HOSPITAL 0 0.01 -0.01 0.00 0-276.21
12965 EAGLEVILLE HOSPITAL 0 0.02 -0.02 0.00 0-215.79
11743 DIVINE PROVIDENCE HOSPITAL 0 0.02 -0.02 0.00 0-173.68
12552 EDGEWOOD SURGICAL HOSPITAL 0 0.04 -0.04 0.00 0-102.93
19630 PHYSICIANS CARE SURGICAL HOSPITAL 0 0.07 -0.07 0.00 0-53.42
12091 TORRANCE STATE HOSPITAL 0 0.09 -0.09 0.00 0-41.33
12368 WERNERSVILLE STATE HOSPITAL 0 0.11 -0.11 0.00 0-34.83
12461 BUCKTAIL MEDICAL CENTER 0 0.11 -0.11 0.00 0-33.33
11968 MEYERSDALE COMMUNITY HOSPITAL 0 0.14 -0.14 0.00 0-26.76
12609 KENSINGTON HOSPITAL 0 0.17 -0.17 0.00 0-21.16
12487 WESTFIELD HOSPITAL 0 0.19 -0.19 0.00 0-19.15
15202 BUCKS COUNTY SPECIALTY HOSPITAL 0 0.25 -0.25 0.00 0-14.72
11848 DANVILLE STATE HOSPITAL 0 0.28 -0.28 0.00 0-13.22
11993 GEISINGER HEALTHSOUTH REHABILITATION HOSPITAL 0 0.31 -0.31 0.00 0-11.97
16317 ADVANCED SURGICAL HOSPITAL 0 0.32 -0.32 0.00 0-11.53
11667 HEALTHSOUTH NITTANY VALLEY REHABILITATION HOSPITAL 0 0.47 -0.47 0.00 0-7.77
12717 TYRONE HOSPITAL 0 0.50 -0.50 0.00 0-7.27
12283 CORRY MEMORIAL HOSPITAL 0 0.75 -0.75 0.00 0-4.88
12404 BARNES-KASSON COUNTY HOSPITAL 0 0.82 -0.82 0.00 0-4.5
11817 ENDLESS MOUNTAINS HEALTH SYSTEMS 0 0.83 -0.83 0.00 0-4.42
12037 BARIX CLINICS OF PENNSYLVANIA 0 0.89 -0.89 0.00 0-4.1
11689 JERSEY SHORE HOSPITAL 0 0.93 -0.93 0.00 0-3.93
12418 BROOKVILLE HOSPITAL 1 0.84 0.16 1.20 0.02-6.66
12139 HEALTHSOUTH READING REHABILITATION HOSPITAL 1 0.76 0.24 1.31 0.02-7.3
12535 SURGICAL INSTITUTE OF READING 1 0.73 0.27 1.37 0.02-7.62
12066 HEALTHSOUTH REHABILITATION HOSPITAL OF SEWICKLEY 1 0.70 0.30 1.43 0.02-7.95
12111 KANE COMMUNITY HOSPITAL 1 0.69 0.31 1.46 0.02-8.1
11939 FULTON COUNTY MEDICAL CENTER 1 0.59 0.41 1.71 0.02-9.49
12628 LANCASTER REHABILITATION HOSPITAL 1 0.43 0.57 2.34 0.03-13.04
12123 SELECT SPECIALTY HOSPITAL --- DANVILLE 2 0.83 1.17 2.41 0.27-8.69
12051 CLARKS SUMMIT STATE HOSPITAL 1 0.21 0.79 4.75 0.06-26.45

43
orgID Name Observed Expected Difference Adjusted
SIR Confidence
Interval
12483 ST. MARY MEDICAL CENTER REHAB 2 0.41 1.59 4.84 0.54-17.49
11748 MUNCY VALLEY HOSPITAL 3 0.60 2.40 4.98 1-14.54
18467 OSS ORTHOPAEDIC HOSPITAL 3 0.45 2.55 6.66 1.34-19.45
13702 UPMC PRESBYTERIAN SHADYSIDE --- WPIC 2 0.29 1.71 6.95 0.78-25.1
Hospitals with 1 - 2.99 Predicted Infections
orgID Name Observed Expected Difference Adjusted
SIR Confidence
Interval
12097 LOCK HAVEN HOSPITAL 0 1.05 -1.05 0.00 0-3.51
12295 MINERS MEDICAL CENTER 0 1.07 -1.07 0.00 0-3.43
15259 CH HOSPITAL OF ALLENTOWN 0 1.10 -1.10 0.00 0-3.34
11810 HEALTHSOUTH REHABILITATION HOSPITAL OF ERIE 0 1.15 -1.15 0.00 0-3.2
11738 TITUSVILLE AREA HOSPITAL 0 1.29 -1.29 0.00 0-2.84
12396 PALMERTON HOSPITAL 0 1.35 -1.35 0.00 0-2.72
12105 SUNBURY COMMUNITY HOSPITAL 0 1.54 -1.54 0.00 0-2.39
11722 GROVE CITY MEDICAL CENTER 0 1.61 -1.61 0.00 0-2.27
12549 MEMORIAL HOSPITAL, INC. TOWANDA 0 1.88 -1.88 0.00 0-1.95
11872 COORDINATED HEALTH ORTHOPEDIC HOSPITAL, LLC 0 2.03 -2.03 0.00 0-1.81
11942 SOUTHWEST REGIONAL MEDICAL CENTER 0 2.25 -2.25 0.00 0-1.63
12008 BLOOMSBURG HOSPITAL 0 2.67 -2.67 0.00 0-1.37
12361 BRADFORD REGIONAL MEDICAL CENTER 0 2.95 -2.95 0.00 0-1.24
12133 SHAMOKIN AREA COMMUNITY HOSPITAL 1 2.69 -1.69 0.37 0-2.07
12402 HEALTHSOUTH REHABILITATION HOSPITAL OF MECHANICSBURG 1 2.15 -1.15 0.46 0.01-2.58
11642 WAYNESBORO HOSPITAL 1 2.13 -1.13 0.47 0.01-2.61
11851 CROZER CHESTER MEDICAL CENTER SPRINGFIELD 1 2.03 -1.03 0.49 0.01-2.74
12244 SHRINERS HOSPITAL FOR CHILDREN --- PHILADELPHIA 1 1.73 -0.73 0.58 0.01-3.22
11903 HEALTHSOUTH REHABILITATION HOSPITAL OF ALTOONA 1 1.45 -0.45 0.69 0.01-3.83
12365 ST. CATHERINE MEDICAL CENTER FOUNTAIN SPRINGS 1 1.41 -0.41 0.71 0.01-3.94
12253 MILLCREEK COMMUNITY HOSPITAL 2 2.78 -0.78 0.72 0.08-2.6
12216 WARREN GENERAL HOSPITAL 2 2.37 -0.37 0.84 0.09-3.04
11907 NASON HOSPITAL 2 2.20 -0.20 0.91 0.1-3.28
11902 HIGHLANDS HOSPITAL 1 1.10 -0.10 0.91 0.01-5.07
12018 TROY COMMUNITY HOSPITAL 2 2.15 -0.15 0.93 0.1-3.37
11688 SOLDIERS & SAILORS MEM HOSPITAL 2 2.10 -0.10 0.95 0.11-3.44
12338 MARIAN COMMUNITY HOSPITAL 2 2.04 -0.04 0.98 0.11-3.53
11830 PUNXSUTAWNEY AREA HOSPITAL 2 1.90 0.10 1.05 0.12-3.81
13929 GOOD SHEPHERD PENN PARTNERS 2 1.87 0.13 1.07 0.12-3.86
11956 CHARLES COLE MEMORIAL HOSPITAL 2 1.76 0.24 1.14 0.13-4.11
11779 ELLWOOD CITY HOSPITAL 2 1.64 0.36 1.22 0.14-4.39
11784 ST. LUKE'S MINERS MEMORIAL HOSPITAL 3 2.25 0.75 1.33 0.27-3.9
12591 ALLIED SERVICES INSTITUTE OF REHABILITATION 2 1.44 0.56 1.39 0.16-5.01
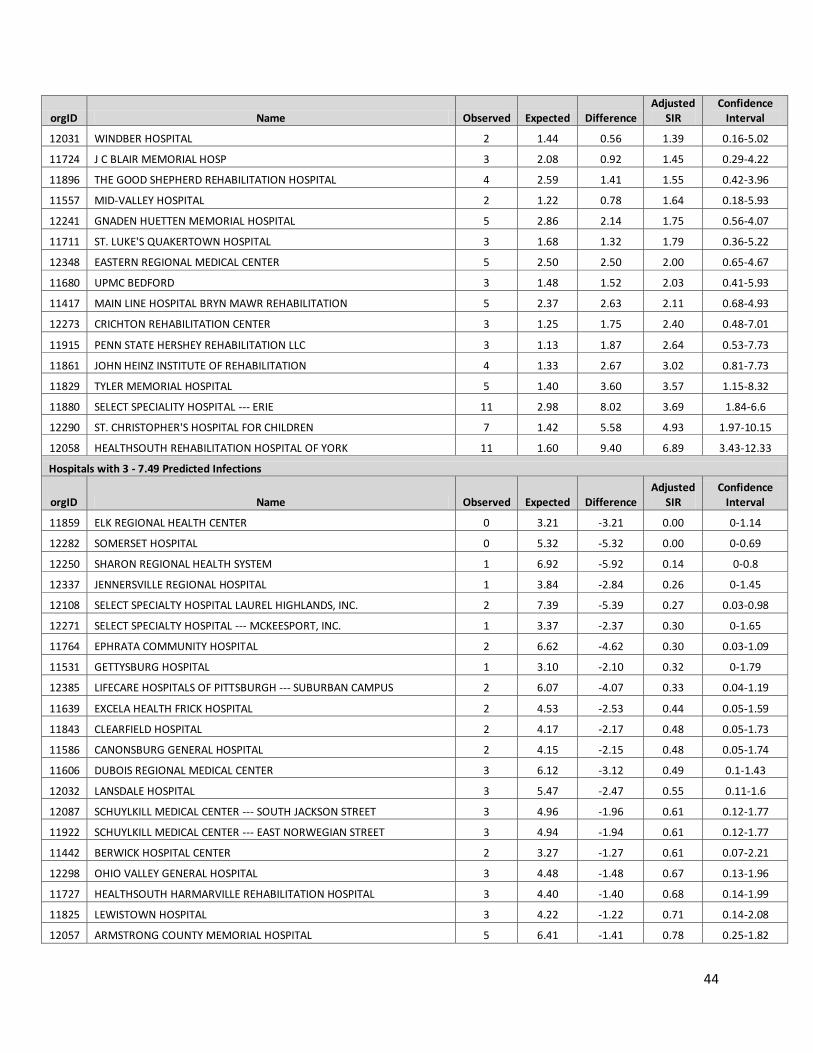
44
orgID Name Observed Expected Difference Adjusted
SIR Confidence
Interval
12031 WINDBER HOSPITAL 2 1.44 0.56 1.39 0.16-5.02
11724 J C BLAIR MEMORIAL HOSP 3 2.08 0.92 1.45 0.29-4.22
11896 THE GOOD SHEPHERD REHABILITATION HOSPITAL 4 2.59 1.41 1.55 0.42-3.96
11557 MID-VALLEY HOSPITAL 2 1.22 0.78 1.64 0.18-5.93
12241 GNADEN HUETTEN MEMORIAL HOSPITAL 5 2.86 2.14 1.75 0.56-4.07
11711 ST. LUKE'S QUAKERTOWN HOSPITAL 3 1.68 1.32 1.79 0.36-5.22
12348 EASTERN REGIONAL MEDICAL CENTER 5 2.50 2.50 2.00 0.65-4.67
11680 UPMC BEDFORD 3 1.48 1.52 2.03 0.41-5.93
11417 MAIN LINE HOSPITAL BRYN MAWR REHABILITATION 5 2.37 2.63 2.11 0.68-4.93
12273 CRICHTON REHABILITATION CENTER 3 1.25 1.75 2.40 0.48-7.01
11915 PENN STATE HERSHEY REHABILITATION LLC 3 1.13 1.87 2.64 0.53-7.73
11861 JOHN HEINZ INSTITUTE OF REHABILITATION 4 1.33 2.67 3.02 0.81-7.73
11829 TYLER MEMORIAL HOSPITAL 5 1.40 3.60 3.57 1.15-8.32
11880 SELECT SPECIALITY HOSPITAL --- ERIE 11 2.98 8.02 3.69 1.84-6.6
12290 ST. CHRISTOPHER'S HOSPITAL FOR CHILDREN 7 1.42 5.58 4.93 1.97-10.15
12058 HEALTHSOUTH REHABILITATION HOSPITAL OF YORK 11 1.60 9.40 6.89 3.43-12.33
Hospitals with 3 - 7.49 Predicted Infections
orgID Name Observed Expected Difference Adjusted
SIR Confidence
Interval
11859 ELK REGIONAL HEALTH CENTER 0 3.21 -3.21 0.00 0-1.14
12282 SOMERSET HOSPITAL 0 5.32 -5.32 0.00 0-0.69
12250 SHARON REGIONAL HEALTH SYSTEM 1 6.92 -5.92 0.14 0-0.8
12337 JENNERSVILLE REGIONAL HOSPITAL 1 3.84 -2.84 0.26 0-1.45
12108 SELECT SPECIALTY HOSPITAL LAUREL HIGHLANDS, INC. 2 7.39 -5.39 0.27 0.03-0.98
12271 SELECT SPECIALTY HOSPITAL --- MCKEESPORT, INC. 1 3.37 -2.37 0.30 0-1.65
11764 EPHRATA COMMUNITY HOSPITAL 2 6.62 -4.62 0.30 0.03-1.09
11531 GETTYSBURG HOSPITAL 1 3.10 -2.10 0.32 0-1.79
12385 LIFECARE HOSPITALS OF PITTSBURGH --- SUBURBAN CAMPUS 2 6.07 -4.07 0.33 0.04-1.19
11639 EXCELA HEALTH FRICK HOSPITAL 2 4.53 -2.53 0.44 0.05-1.59
11843 CLEARFIELD HOSPITAL 2 4.17 -2.17 0.48 0.05-1.73
11586 CANONSBURG GENERAL HOSPITAL 2 4.15 -2.15 0.48 0.05-1.74
11606 DUBOIS REGIONAL MEDICAL CENTER 3 6.12 -3.12 0.49 0.1-1.43
12032 LANSDALE HOSPITAL 3 5.47 -2.47 0.55 0.11-1.6
12087 SCHUYLKILL MEDICAL CENTER --- SOUTH JACKSON STREET 3 4.96 -1.96 0.61 0.12-1.77
11922 SCHUYLKILL MEDICAL CENTER --- EAST NORWEGIAN STREET 3 4.94 -1.94 0.61 0.12-1.77
11442 BERWICK HOSPITAL CENTER 2 3.27 -1.27 0.61 0.07-2.21
12298 OHIO VALLEY GENERAL HOSPITAL 3 4.48 -1.48 0.67 0.13-1.96
11727 HEALTHSOUTH HARMARVILLE REHABILITATION HOSPITAL 3 4.40 -1.40 0.68 0.14-1.99
11825 LEWISTOWN HOSPITAL 3 4.22 -1.22 0.71 0.14-2.08
12057 ARMSTRONG COUNTY MEMORIAL HOSPITAL 5 6.41 -1.41 0.78 0.25-1.82
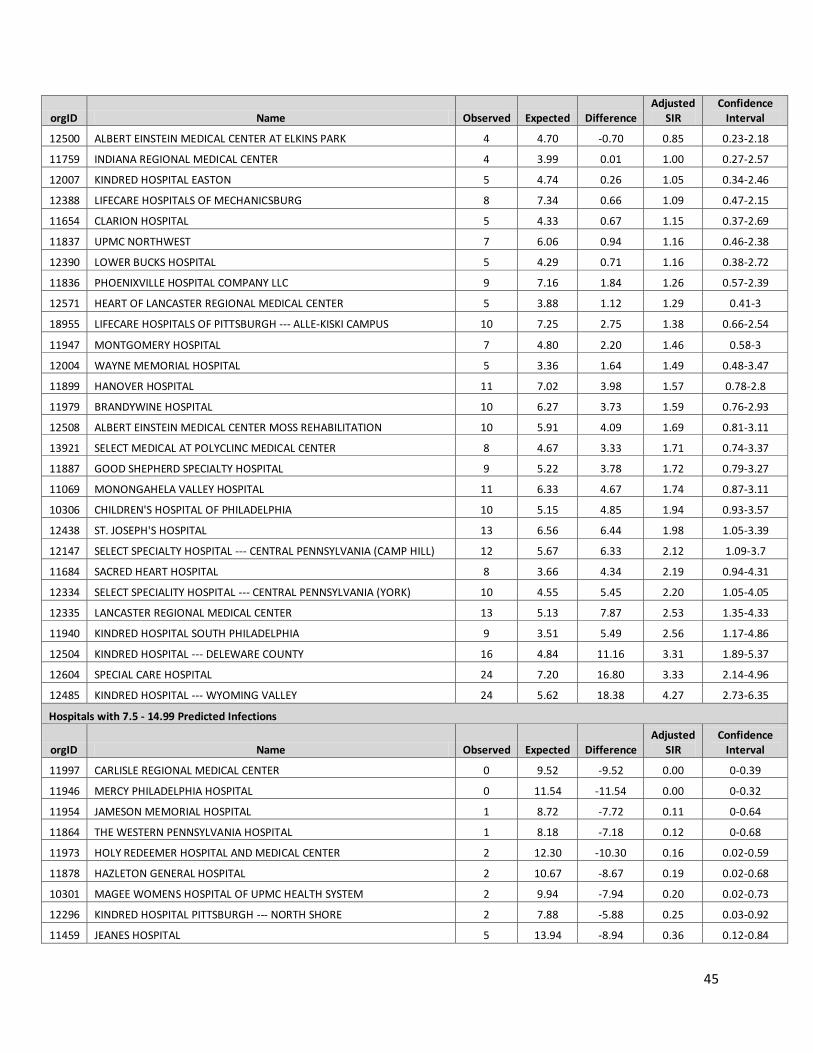
45
orgID Name Observed Expected Difference Adjusted
SIR Confidence
Interval
12500 ALBERT EINSTEIN MEDICAL CENTER AT ELKINS PARK 4 4.70 -0.70 0.85 0.23-2.18
11759 INDIANA REGIONAL MEDICAL CENTER 4 3.99 0.01 1.00 0.27-2.57
12007 KINDRED HOSPITAL EASTON 5 4.74 0.26 1.05 0.34-2.46
12388 LIFECARE HOSPITALS OF MECHANICSBURG 8 7.34 0.66 1.09 0.47-2.15
11654 CLARION HOSPITAL 5 4.33 0.67 1.15 0.37-2.69
11837 UPMC NORTHWEST 7 6.06 0.94 1.16 0.46-2.38
12390 LOWER BUCKS HOSPITAL 5 4.29 0.71 1.16 0.38-2.72
11836 PHOENIXVILLE HOSPITAL COMPANY LLC 9 7.16 1.84 1.26 0.57-2.39
12571 HEART OF LANCASTER REGIONAL MEDICAL CENTER 5 3.88 1.12 1.29 0.41-3
18955 LIFECARE HOSPITALS OF PITTSBURGH --- ALLE-KISKI CAMPUS 10 7.25 2.75 1.38 0.66-2.54
11947 MONTGOMERY HOSPITAL 7 4.80 2.20 1.46 0.58-3
12004 WAYNE MEMORIAL HOSPITAL 5 3.36 1.64 1.49 0.48-3.47
11899 HANOVER HOSPITAL 11 7.02 3.98 1.57 0.78-2.8
11979 BRANDYWINE HOSPITAL 10 6.27 3.73 1.59 0.76-2.93
12508 ALBERT EINSTEIN MEDICAL CENTER MOSS REHABILITATION 10 5.91 4.09 1.69 0.81-3.11
13921 SELECT MEDICAL AT POLYCLINC MEDICAL CENTER 8 4.67 3.33 1.71 0.74-3.37
11887 GOOD SHEPHERD SPECIALTY HOSPITAL 9 5.22 3.78 1.72 0.79-3.27
11069 MONONGAHELA VALLEY HOSPITAL 11 6.33 4.67 1.74 0.87-3.11
10306 CHILDREN'S HOSPITAL OF PHILADELPHIA 10 5.15 4.85 1.94 0.93-3.57
12438 ST. JOSEPH'S HOSPITAL 13 6.56 6.44 1.98 1.05-3.39
12147 SELECT SPECIALTY HOSPITAL --- CENTRAL PENNSYLVANIA (CAMP HILL) 12 5.67 6.33 2.12 1.09-3.7
11684 SACRED HEART HOSPITAL 8 3.66 4.34 2.19 0.94-4.31
12334 SELECT SPECIALITY HOSPITAL --- CENTRAL PENNSYLVANIA (YORK) 10 4.55 5.45 2.20 1.05-4.05
12335 LANCASTER REGIONAL MEDICAL CENTER 13 5.13 7.87 2.53 1.35-4.33
11940 KINDRED HOSPITAL SOUTH PHILADELPHIA 9 3.51 5.49 2.56 1.17-4.86
12504 KINDRED HOSPITAL --- DELEWARE COUNTY 16 4.84 11.16 3.31 1.89-5.37
12604 SPECIAL CARE HOSPITAL 24 7.20 16.80 3.33 2.14-4.96
12485 KINDRED HOSPITAL --- WYOMING VALLEY 24 5.62 18.38 4.27 2.73-6.35
Hospitals with 7.5 - 14.99 Predicted Infections
orgID Name Observed Expected Difference Adjusted
SIR Confidence
Interval
11997 CARLISLE REGIONAL MEDICAL CENTER 0 9.52 -9.52 0.00 0-0.39
11946 MERCY PHILADELPHIA HOSPITAL 0 11.54 -11.54 0.00 0-0.32
11954 JAMESON MEMORIAL HOSPITAL 1 8.72 -7.72 0.11 0-0.64
11864 THE WESTERN PENNSYLVANIA HOSPITAL 1 8.18 -7.18 0.12 0-0.68
11973 HOLY REDEEMER HOSPITAL AND MEDICAL CENTER 2 12.30 -10.30 0.16 0.02-0.59
11878 HAZLETON GENERAL HOSPITAL 2 10.67 -8.67 0.19 0.02-0.68
10301 MAGEE WOMENS HOSPITAL OF UPMC HEALTH SYSTEM 2 9.94 -7.94 0.20 0.02-0.73
12296 KINDRED HOSPITAL PITTSBURGH --- NORTH SHORE 2 7.88 -5.88 0.25 0.03-0.92
11459 JEANES HOSPITAL 5 13.94 -8.94 0.36 0.12-0.84
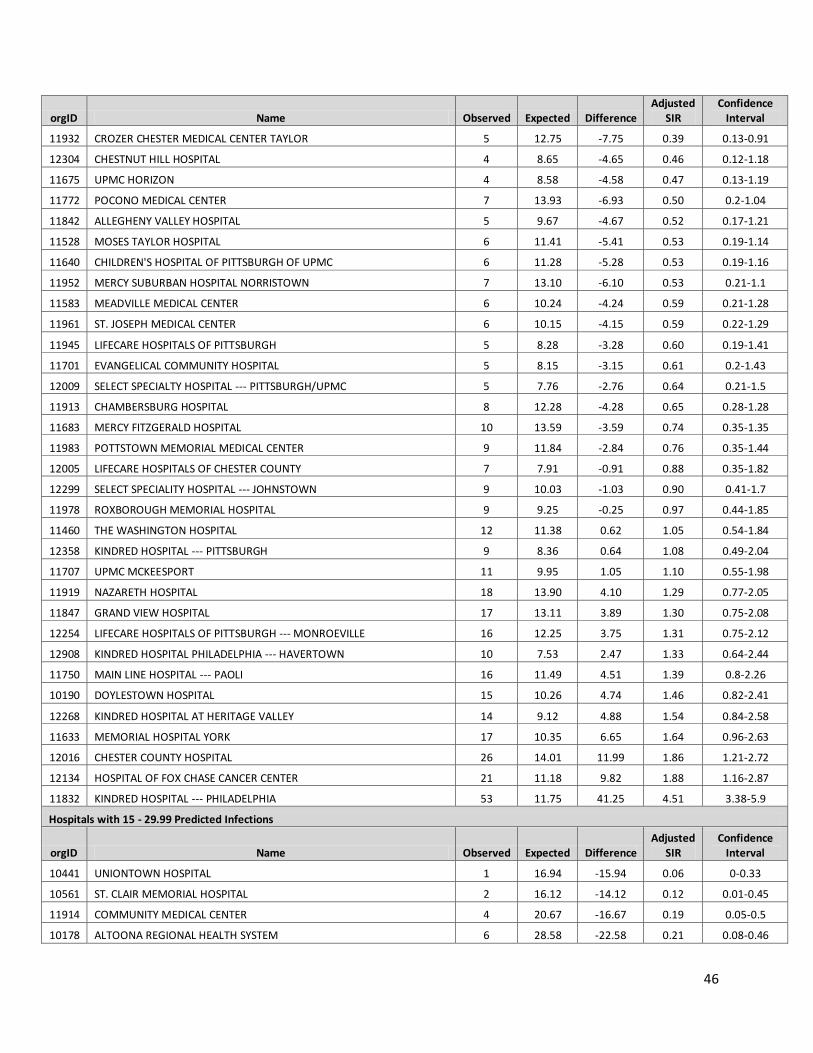
46
orgID Name Observed Expected Difference Adjusted
SIR Confidence
Interval
11932 CROZER CHESTER MEDICAL CENTER TAYLOR 5 12.75 -7.75 0.39 0.13-0.91
12304 CHESTNUT HILL HOSPITAL 4 8.65 -4.65 0.46 0.12-1.18
11675 UPMC HORIZON 4 8.58 -4.58 0.47 0.13-1.19
11772 POCONO MEDICAL CENTER 7 13.93 -6.93 0.50 0.2-1.04
11842 ALLEGHENY VALLEY HOSPITAL 5 9.67 -4.67 0.52 0.17-1.21
11528 MOSES TAYLOR HOSPITAL 6 11.41 -5.41 0.53 0.19-1.14
11640 CHILDREN'S HOSPITAL OF PITTSBURGH OF UPMC 6 11.28 -5.28 0.53 0.19-1.16
11952 MERCY SUBURBAN HOSPITAL NORRISTOWN 7 13.10 -6.10 0.53 0.21-1.1
11583 MEADVILLE MEDICAL CENTER 6 10.24 -4.24 0.59 0.21-1.28
11961 ST. JOSEPH MEDICAL CENTER 6 10.15 -4.15 0.59 0.22-1.29
11945 LIFECARE HOSPITALS OF PITTSBURGH 5 8.28 -3.28 0.60 0.19-1.41
11701 EVANGELICAL COMMUNITY HOSPITAL 5 8.15 -3.15 0.61 0.2-1.43
12009 SELECT SPECIALTY HOSPITAL --- PITTSBURGH/UPMC 5 7.76 -2.76 0.64 0.21-1.5
11913 CHAMBERSBURG HOSPITAL 8 12.28 -4.28 0.65 0.28-1.28
11683 MERCY FITZGERALD HOSPITAL 10 13.59 -3.59 0.74 0.35-1.35
11983 POTTSTOWN MEMORIAL MEDICAL CENTER 9 11.84 -2.84 0.76 0.35-1.44
12005 LIFECARE HOSPITALS OF CHESTER COUNTY 7 7.91 -0.91 0.88 0.35-1.82
12299 SELECT SPECIALITY HOSPITAL --- JOHNSTOWN 9 10.03 -1.03 0.90 0.41-1.7
11978 ROXBOROUGH MEMORIAL HOSPITAL 9 9.25 -0.25 0.97 0.44-1.85
11460 THE WASHINGTON HOSPITAL 12 11.38 0.62 1.05 0.54-1.84
12358 KINDRED HOSPITAL --- PITTSBURGH 9 8.36 0.64 1.08 0.49-2.04
11707 UPMC MCKEESPORT 11 9.95 1.05 1.10 0.55-1.98
11919 NAZARETH HOSPITAL 18 13.90 4.10 1.29 0.77-2.05
11847 GRAND VIEW HOSPITAL 17 13.11 3.89 1.30 0.75-2.08
12254 LIFECARE HOSPITALS OF PITTSBURGH --- MONROEVILLE 16 12.25 3.75 1.31 0.75-2.12
12908 KINDRED HOSPITAL PHILADELPHIA --- HAVERTOWN 10 7.53 2.47 1.33 0.64-2.44
11750 MAIN LINE HOSPITAL --- PAOLI 16 11.49 4.51 1.39 0.8-2.26
10190 DOYLESTOWN HOSPITAL 15 10.26 4.74 1.46 0.82-2.41
12268 KINDRED HOSPITAL AT HERITAGE VALLEY 14 9.12 4.88 1.54 0.84-2.58
11633 MEMORIAL HOSPITAL YORK 17 10.35 6.65 1.64 0.96-2.63
12016 CHESTER COUNTY HOSPITAL 26 14.01 11.99 1.86 1.21-2.72
12134 HOSPITAL OF FOX CHASE CANCER CENTER 21 11.18 9.82 1.88 1.16-2.87
11832 KINDRED HOSPITAL --- PHILADELPHIA 53 11.75 41.25 4.51 3.38-5.9
Hospitals with 15 - 29.99 Predicted Infections
orgID Name Observed Expected Difference Adjusted
SIR Confidence
Interval
10441 UNIONTOWN HOSPITAL 1 16.94 -15.94 0.06 0-0.33
10561 ST. CLAIR MEMORIAL HOSPITAL 2 16.12 -14.12 0.12 0.01-0.45
11914 COMMUNITY MEDICAL CENTER 4 20.67 -16.67 0.19 0.05-0.5
10178 ALTOONA REGIONAL HEALTH SYSTEM 6 28.58 -22.58 0.21 0.08-0.46

47
orgID Name Observed Expected Difference Adjusted
SIR Confidence
Interval
12533 REGIONAL HOSPITAL OF SCRANTON 6 21.41 -15.41 0.28 0.1-0.61
12422 ROBERT PACKER HOSPITAL 6 20.60 -14.60 0.29 0.11-0.63
11731 RIDDLE MEMORIAL HOSPITAL 8 23.58 -15.58 0.34 0.15-0.67
11651 EXCELA HEALTH LATROBE HOSPITAL 8 19.60 -11.60 0.41 0.18-0.8
11712 THE GOOD SAMARITAN HOSPITAL 8 17.99 -9.99 0.44 0.19-0.88
11972 DELAWARE COUNTY MEMORIAL HOSPITAL 11 18.07 -7.07 0.61 0.3-1.09
10375 HERITAGE VALLEY SEWICKLEY 11 16.65 -5.65 0.66 0.33-1.18
11814 PENN PRESBYTERIAN MEDICAL CENTER 13 18.71 -5.71 0.69 0.37-1.19
10237 JEFFERSON REGIONAL MEDICAL CENTER 14 19.69 -5.69 0.71 0.39-1.19
11736 BUTLER MEMORIAL HOSPITAL 12 15.60 -3.60 0.77 0.4-1.34
11437 HAHNEMANN UNIVERSITY HOSPITAL 23 28.37 -5.37 0.81 0.51-1.22
11753 MAIN LINE HOSPITAL BRYN MAWR 13 15.85 -2.85 0.82 0.44-1.4
11898 LEHIGH VALLEY HOSPITAL --- MUHLENBERG 16 19.06 -3.06 0.84 0.48-1.36
11770 MAIN LINE HOSPITAL LANKENAU MEDICAL CENTER 23 26.22 -3.22 0.88 0.56-1.32
11265 FORBES REGIONAL HOSPITAL 18 20.30 -2.30 0.89 0.53-1.4
11797 MOUNT NITTANY MEDICAL CENTER 21 21.95 -0.95 0.96 0.59-1.46
12387 HOLY SPIRIT HOSPITAL 24 21.31 2.69 1.13 0.72-1.68
11732 WILLIAMSPORT REGIONAL MEDICAL CENTER 20 15.40 4.60 1.30 0.79-2.01
11929 EASTON HOSPITAL 27 17.86 9.14 1.51 1-2.2
11780 GEISINGER WYOMING VALLEY MEDICAL CENTER 47 27.27 19.73 1.72 1.27-2.29
12017 THOMAS JEFFERSON UNIV HOSP - METHODIST 30 17.12 12.88 1.75 1.18-2.5
11885 ST. MARY MEDICAL CENTER 31 17.43 13.57 1.78 1.21-2.52
12146 MAGEE REHAB HOSPITAL 60 15.26 44.74 3.93 3-5.06
Hospitals with 30+ Predicted Infections
orgID Name Observed Expected Difference Adjusted
SIR Confidence
Interval
11637 EXCELA HEALTH WESTMORELAND REGIONAL HOSPITAL 17 35.56 -18.56 0.48 0.28-0.77
11561 UPMC ST MARGARET 15 30.87 -15.87 0.49 0.27-0.8
10648 ALLEGHENY GENERAL HOSPITAL 41 79.89 -38.89 0.51 0.37-0.7
11839 CROZER CHESTER MEDICAL CENTER 18 30.45 -12.45 0.59 0.35-0.93
10118 UPMC PRESBYTERIAN SHADYSIDE --- SHADYSIDE 49 78.23 -29.23 0.63 0.46-0.83
10122 PINNACLE HEALTH HOSPITALS 50 71.13 -21.13 0.70 0.52-0.93
11242 UPMC PASSAVANT 30 41.16 -11.16 0.73 0.49-1.04
10280 CONEMAUGH VALLEY MEMORIAL HOSPITAL 42 53.52 -11.52 0.78 0.57-1.06
11725 UPMC HAMOT 30 37.01 -7.01 0.81 0.55-1.16
10384 UPMC MERCY 33 40.08 -7.08 0.82 0.57-1.16
12375 READING HOSPITAL AND MEDICAL CENTER 32 37.74 -5.74 0.85 0.58-1.2
10348 UPMC PRESBYTERIAN SHADYSIDE --- PRESBYTERIAN 124 145.16 -21.16 0.85 0.71-1.02
10183 LANCASTER GENERAL HOSPITAL 33 37.89 -4.89 0.87 0.6-1.22
12382 TEMPLE UNIVERSITY HOSPITAL 48 54.57 -6.57 0.88 0.65-1.17
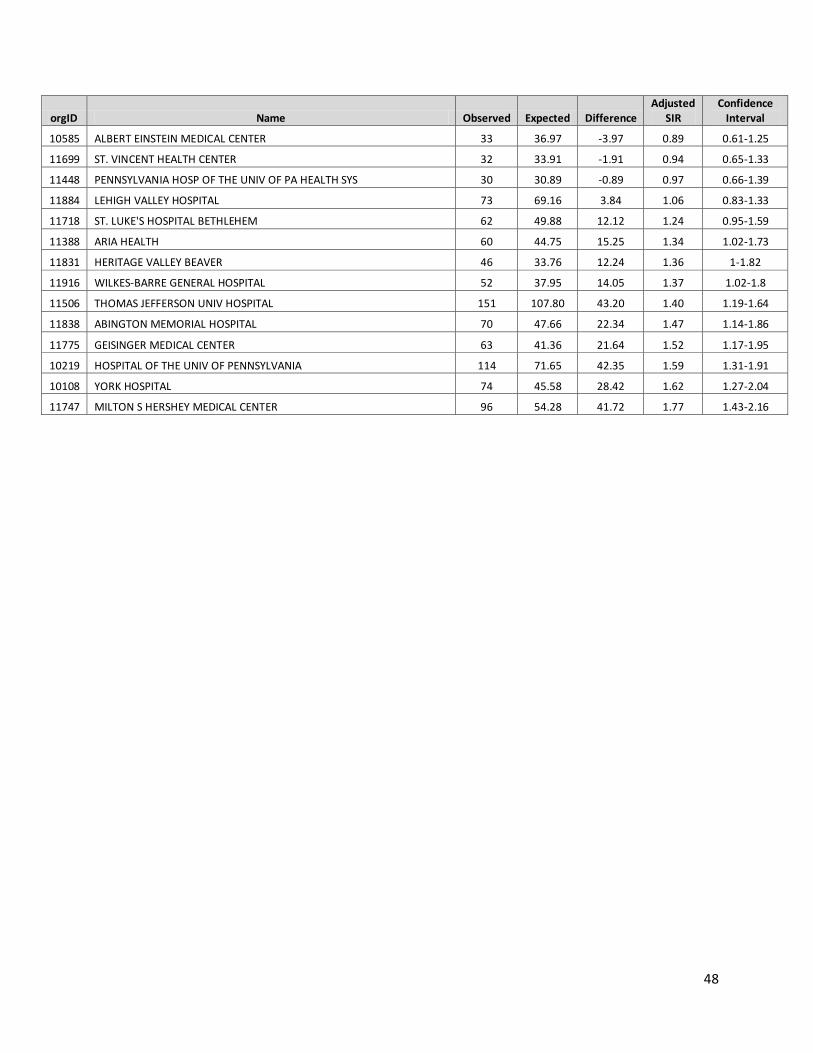
48
orgID Name Observed Expected Difference Adjusted
SIR Confidence
Interval
10585 ALBERT EINSTEIN MEDICAL CENTER 33 36.97 -3.97 0.89 0.61-1.25
11699 ST. VINCENT HEALTH CENTER 32 33.91 -1.91 0.94 0.65-1.33
11448 PENNSYLVANIA HOSP OF THE UNIV OF PA HEALTH SYS 30 30.89 -0.89 0.97 0.66-1.39
11884 LEHIGH VALLEY HOSPITAL 73 69.16 3.84 1.06 0.83-1.33
11718 ST. LUKE'S HOSPITAL BETHLEHEM 62 49.88 12.12 1.24 0.95-1.59
11388 ARIA HEALTH 60 44.75 15.25 1.34 1.02-1.73
11831 HERITAGE VALLEY BEAVER 46 33.76 12.24 1.36 1-1.82
11916 WILKES-BARRE GENERAL HOSPITAL 52 37.95 14.05 1.37 1.02-1.8
11506 THOMAS JEFFERSON UNIV HOSPITAL 151 107.80 43.20 1.40 1.19-1.64
11838 ABINGTON MEMORIAL HOSPITAL 70 47.66 22.34 1.47 1.14-1.86
11775 GEISINGER MEDICAL CENTER 63 41.36 21.64 1.52 1.17-1.95
10219 HOSPITAL OF THE UNIV OF PENNSYLVANIA 114 71.65 42.35 1.59 1.31-1.91
10108 YORK HOSPITAL 74 45.58 28.42 1.62 1.27-2.04
11747 MILTON S HERSHEY MEDICAL CENTER 96 54.28 41.72 1.77 1.43-2.16

49
Table 10 - Hospitals with <1 Predicted Infections

50
Table 10 - Hospitals with <1 Predicted Infections
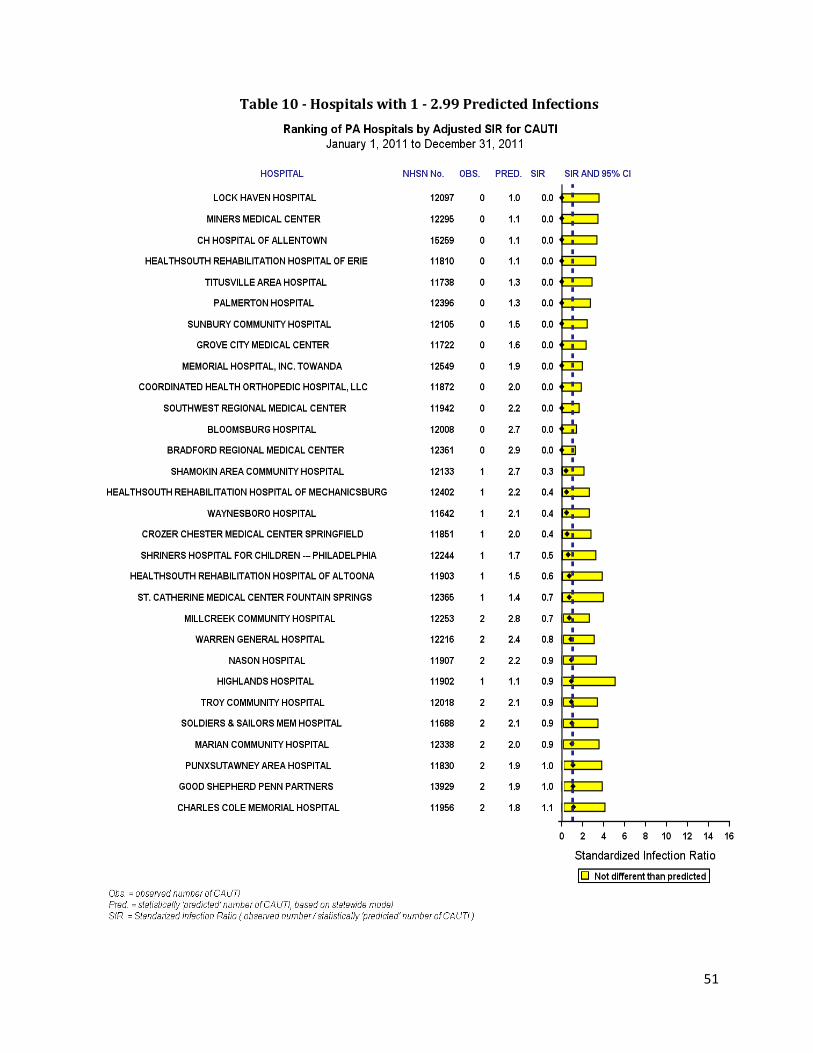
51
Table 10 - Hospitals with 1 - 2.99 Predicted Infections
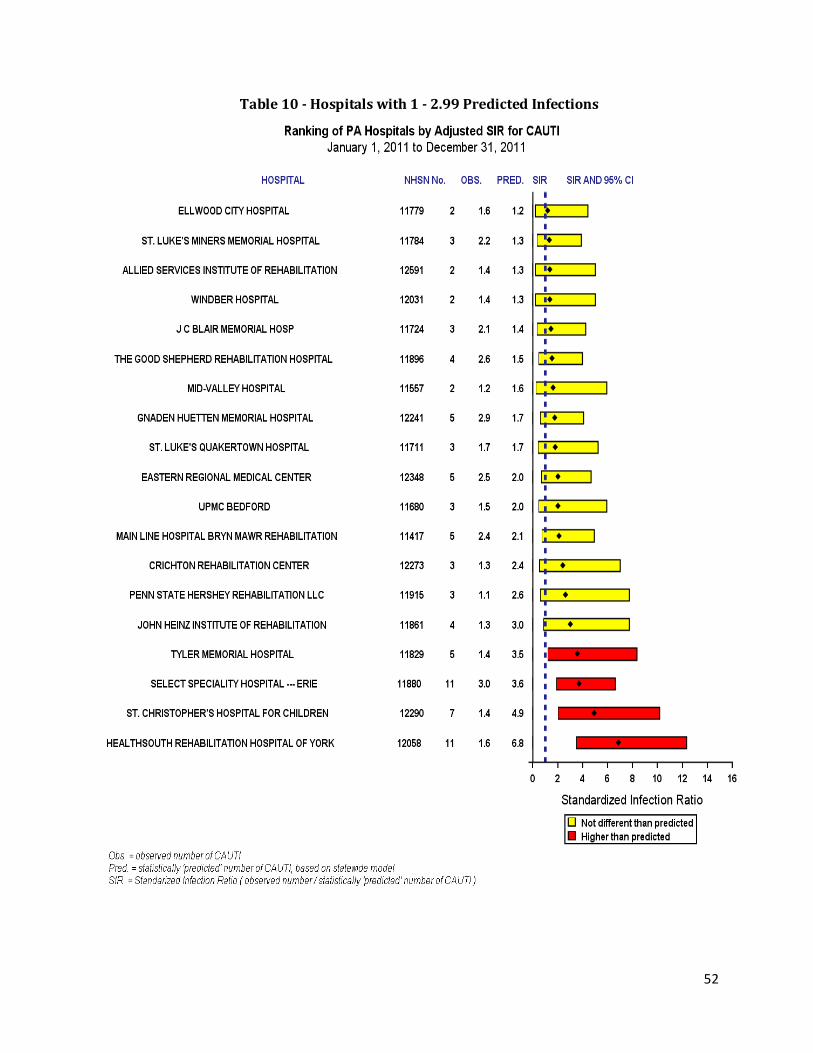
52
Table 10 - Hospitals with 1 - 2.99 Predicted Infections

53
Table 10 - Hospitals with 3 - 7.49 Predicted Infections

54
Table 10 - Hospitals with 3 - 7.49 Predicted Infections

55
Table 10 - Hospitals with 7.5 - 14.99 Predicted Infections

56
Table 10 - Hospitals with 7.5 - 14.99 Predicted Infections

57
Table 10 - Hospitals with 15 - 29.99 Predicted Infections

58
Table 10 - Hospitals with 30+ Predicted Infections
59
Central Line-Associated Bloodstream Infections (CLABSIs)
Central lines (also known as central venous catheters) are those catheters that are inserted into the large blood vessels of the body and usually end in proximity to the heart. They are generally used for the purposes of administering intravenous medications or to more closely monitor a patient’s cardiac function and stability. If micro-organisms are inadvertently introduced through the central line, or the line becomes infected through improper care, a bloodstream infection is the usual result. Such infections, known as central line-associated bloodstream infections, are particularly severe because the infecting pathogen travels throughout the body and causes sepsis, and because patients with central lines usually have significant underlying health problems that place them at increased risk for poor outcomes from complications. CLABSIs are associated with prolonged hospital stays, high additional health care costs, and high mortality. Therefore CLABSIs are often the focus for infection prevention and control measures, and they are the single category of HAIs most often monitored by hospitals and health departments. Several different types of central lines are used in medical care. These include central lines that are temporarily inserted, those that are permanently inserted, and central lines that are inserted through the umbilicus for use in infants. In previous reports, these line types were reported separately. However, changes were made to NHSN in 2011, and now the line type is only reported in specialty care areas. Similar to previous annual reports, in the present report the CLABSI tables are separated into several different locations in the hospital, including neonatal intensive care units (NICUs) and specialty care areas (SCAs), following CDC convention. All other critical care and ward locations are combined into a category known as ICU/other - a category that includes the bulk of central line days and data. CLABSI data are also reported separately for long term acute care facilities (LTACs), since studies have shown CLABSI rates can be different in LTAC settings. Since Act 52 was signed into law, Pennsylvania has seen a substantial decline in the incidence of CLABSIs of more than 20 percent per year. While the findings in 2011 show continued declines in the incidence of CLABSIs, the decline is considerably smaller than seen the previous two years. In 2011, a total of 222 (87.4 percent) of the 254 Pennsylvania hospitals using NHSN reported use of central lines in any of their hospital locations. The 32 hospitals not reporting any use of central lines are mostly psychiatric, drug and alcohol rehabilitation centers or specialty hospital. These are listed before Table 15. Among the hospitals using central lines, 193 used them in the ICU and/or other ward locations, 27 were long term care facilities, and two used central lines only in specialty care areas. There were 20 hospitals that reported use of central lines in specialty care areas (for a total of 22 hospitals with SCAs) in addition to ICU/ward locations, and there were 43 hospitals that used central lines in a neonatal intensive care unit (NICU). All NICU hospitals also used central lines in non-NICU locations. Of the 222 hospitals that used central lines, in 2011 a total of 147 (66.2 percent) reported at least one CLABSI. During 2011, there were a total of 1,540 CLABSIs reported (Table 11). Of the 1,540 CLABSIs, 95 (6.2 percent) occurred in the NICU, 205 (13.3 percent) occurred in LTACs, 151 (9.8 percent) occurred in SCAs, 516 (33.5 percent) occurred in ward locations, and 573 (37.2 percent) occurred in critical care units (other than the NICU) (Figure 5).

60
Figure 5. Central line-associated bloodstream infections (CLABSIs) by unit type, Pennsylvania hospitals 2011 (N = 1,540)
These CLABSIs occurred over a total of 1,729,770 central line days. The range of central line days reported by hospitals in 2011 was a low of 1 central line day to a high of 103,214 central line days. The absolute number of CLABSIs reported in 2011 is 4.1 percent lower than in 2010 and the number of central line days reported in 2011 is 0.2 percent lower than in 2010. The CLABSI rate for 2011 is 0.89 CLABSIs per 1,000 central line days. This compares to a rate of 0.93 CLABSIs per 1,000 central line days in 2010 (Table 11A). This difference in rates represents a 4.3 percent decline. The rate is 27.6 percent lower than the rate seen in the baseline year of 2009. This translates to 1,113 fewer CLABSIs in Pennsylvania than would have occurred if the 2009 CLABSI rate had persisted into 2011.
Central Line-Associated Bloodstream Infections by Year in Pennsylvania
Year No. of
CLABSIs
No. of Central Line
Days
No. of Patient Days
Device Utilization
Ratio
Rate per 1,000 Central Line
Days
Percent Decline (prior year/ cumulative)
2009 2,175 1,763,902 10,920,596 0.16 1.23 2010 1,606 1,732,994 10,289,079 0.17 0.93 24.4/24.4
2011 1,540 1,729,770 10,212,208 0.17 0.89 4.3/27.6
As would be expected, CLABSI rates varied by location in the hospital (Table 11). The highest rate was seen in critical care burn units (2.58 CLABSIs per 1,000 central line days) followed by neonatal intensive care units (1.53 CLABSIs per 1,000 central line days) and pediatric critical care units (1.52 CLABSIs per 1,000 central line days). The lowest rates for locations with at least 1,000 central line days occurred in rehabilitation units (0.48 CLABSIs per 1,000 central line days) followed by surgical wards (0.57 CLABSIs per 1,000 central line days) and medical wards (0.58 CLABSIs per 1,000 central line days).
573, 37%
516, 34%
95, 6%
151, 10%
205, 13%
Critical Care
Non-CCU Wards
NICU
SCA
LTAC
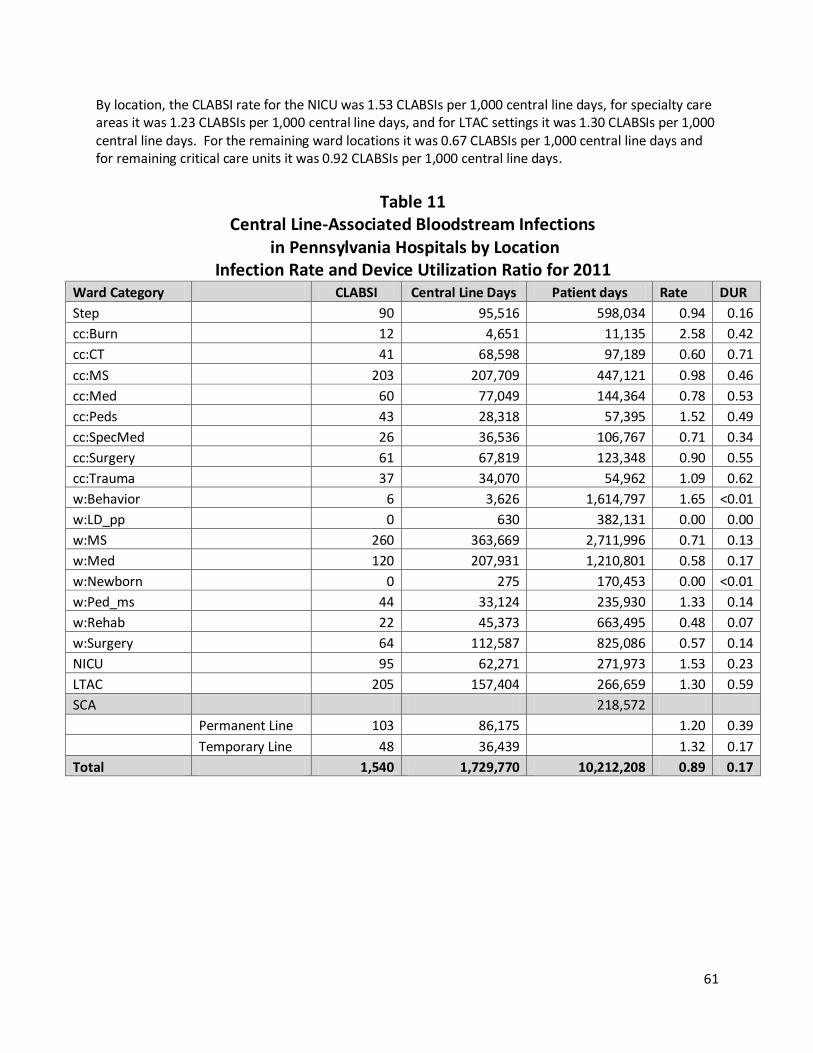
61
By location, the CLABSI rate for the NICU was 1.53 CLABSIs per 1,000 central line days, for specialty care areas it was 1.23 CLABSIs per 1,000 central line days, and for LTAC settings it was 1.30 CLABSIs per 1,000 central line days. For the remaining ward locations it was 0.67 CLABSIs per 1,000 central line days and for remaining critical care units it was 0.92 CLABSIs per 1,000 central line days.
Table 11
Central Line-Associated Bloodstream Infections in Pennsylvania Hospitals by Location
Infection Rate and Device Utilization Ratio for 2011 Ward Category CLABSI Central Line Days Patient days Rate DUR
Step 90 95,516 598,034 0.94 0.16
cc:Burn 12 4,651 11,135 2.58 0.42
cc:CT 41 68,598 97,189 0.60 0.71
cc:MS 203 207,709 447,121 0.98 0.46
cc:Med 60 77,049 144,364 0.78 0.53
cc:Peds 43 28,318 57,395 1.52 0.49
cc:SpecMed 26 36,536 106,767 0.71 0.34
cc:Surgery 61 67,819 123,348 0.90 0.55
cc:Trauma 37 34,070 54,962 1.09 0.62
w:Behavior 6 3,626 1,614,797 1.65 <0.01
w:LD_pp 0 630 382,131 0.00 0.00
w:MS 260 363,669 2,711,996 0.71 0.13
w:Med 120 207,931 1,210,801 0.58 0.17
w:Newborn 0 275 170,453 0.00 <0.01
w:Ped_ms 44 33,124 235,930 1.33 0.14
w:Rehab 22 45,373 663,495 0.48 0.07
w:Surgery 64 112,587 825,086 0.57 0.14
NICU 95 62,271 271,973 1.53 0.23
LTAC 205 157,404 266,659 1.30 0.59
SCA 218,572
Permanent Line 103 86,175 1.20 0.39
Temporary Line 48 36,439 1.32 0.17
Total 1,540 1,729,770 10,212,208 0.89 0.17
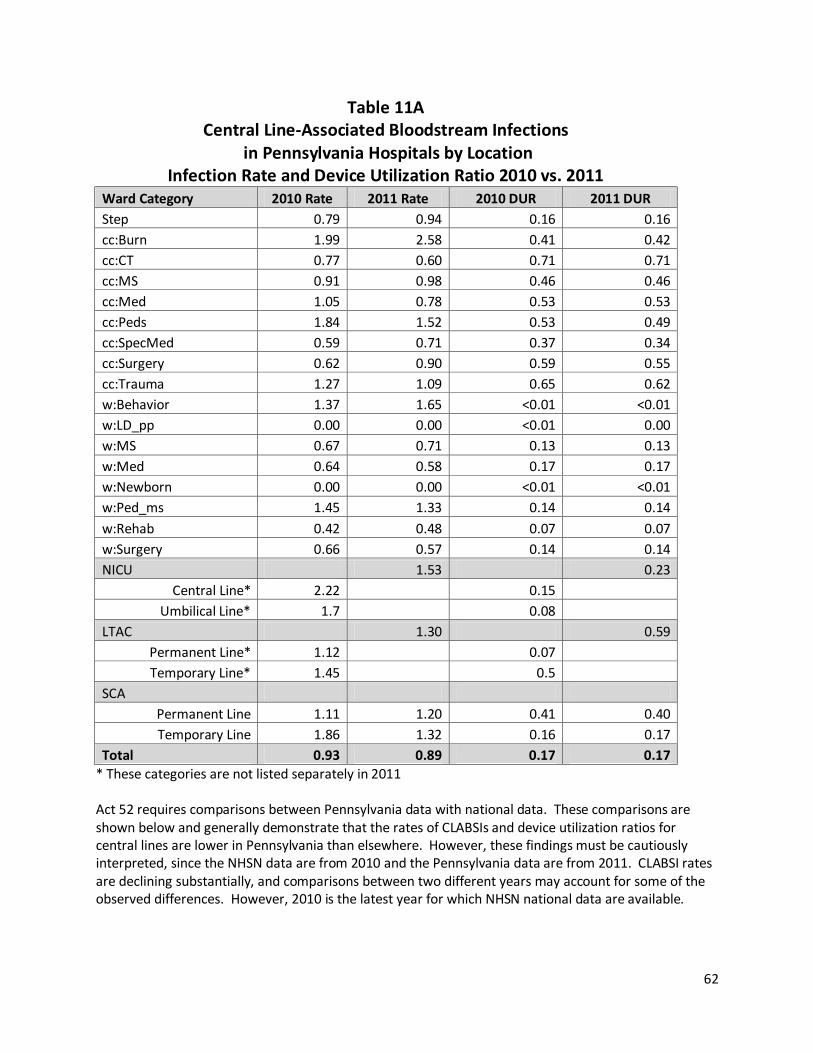
62
Table 11A Central Line-Associated Bloodstream Infections
in Pennsylvania Hospitals by Location Infection Rate and Device Utilization Ratio 2010 vs. 2011
Ward Category 2010 Rate 2011 Rate 2010 DUR 2011 DUR
Step 0.79 0.94 0.16 0.16
cc:Burn 1.99 2.58 0.41 0.42
cc:CT 0.77 0.60 0.71 0.71
cc:MS 0.91 0.98 0.46 0.46
cc:Med 1.05 0.78 0.53 0.53
cc:Peds 1.84 1.52 0.53 0.49
cc:SpecMed 0.59 0.71 0.37 0.34
cc:Surgery 0.62 0.90 0.59 0.55
cc:Trauma 1.27 1.09 0.65 0.62
w:Behavior 1.37 1.65 <0.01 <0.01
w:LD_pp 0.00 0.00 <0.01 0.00
w:MS 0.67 0.71 0.13 0.13
w:Med 0.64 0.58 0.17 0.17
w:Newborn 0.00 0.00 <0.01 <0.01
w:Ped_ms 1.45 1.33 0.14 0.14
w:Rehab 0.42 0.48 0.07 0.07
w:Surgery 0.66 0.57 0.14 0.14
NICU 1.53 0.23
Central Line* 2.22 0.15
Umbilical Line* 1.7 0.08
LTAC 1.30 0.59
Permanent Line* 1.12 0.07
Temporary Line* 1.45 0.5
SCA
Permanent Line 1.11 1.20 0.41 0.40
Temporary Line 1.86 1.32 0.16 0.17
Total 0.93 0.89 0.17 0.17
* These categories are not listed separately in 2011 Act 52 requires comparisons between Pennsylvania data with national data. These comparisons are shown below and generally demonstrate that the rates of CLABSIs and device utilization ratios for central lines are lower in Pennsylvania than elsewhere. However, these findings must be cautiously interpreted, since the NHSN data are from 2010 and the Pennsylvania data are from 2011. CLABSI rates are declining substantially, and comparisons between two different years may account for some of the observed differences. However, 2010 is the latest year for which NHSN national data are available.

63
Figure 6. Central line-associated bloodstream infection (CLABSI) rates in Pennsylvania hospitals compared to national rates, by hospital location, critical care units. Rates are per 1,000 central line days.
Figure 7. Central line device utilization ratios in Pennsylvania hospitals compared to national device utilization ratios, by hospital location, critical care units.
Step Burn CT MedSurg Med Peds SpecMed Surg Trauma
2011 PA Hospitals 0.94 2.58 0.6 0.98 0.78 1.52 0.71 0.9 1.09
NHSN 2010 1.04 3.5 1.08 1.12 1.47 1.78 1.03 1.24 1.92
0
0.5
1
1.5
2
2.5
3
3.5
4
Step Burn CT MedSurg Med Peds SpecMed Surg Trauma
2011 PA Hospitals 0.16 0.42 0.71 0.46 0.53 0.49 0.34 0.55 0.62
NHSN 2010 0.2 0.45 0.68 0.45 0.47 0.48 0.54 0.54 0.56
0
0.1
0.2
0.3
0.4
0.5
0.6
0.7
0.8
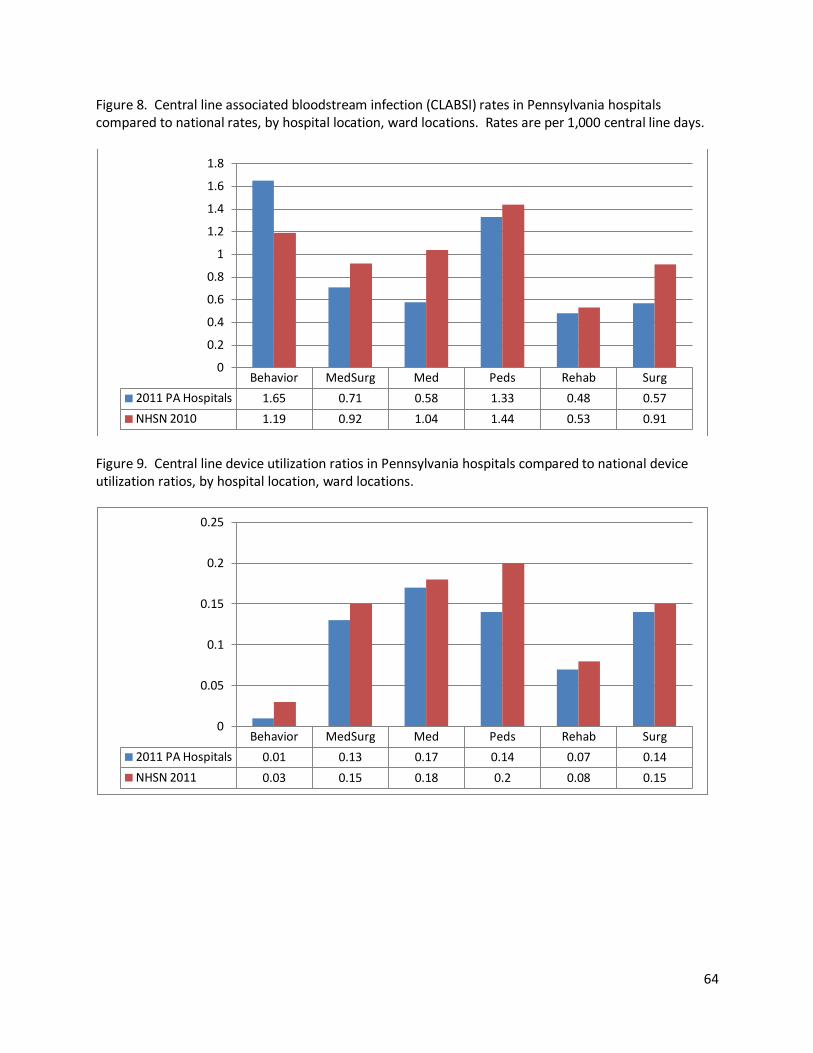
64
Figure 8. Central line associated bloodstream infection (CLABSI) rates in Pennsylvania hospitals compared to national rates, by hospital location, ward locations. Rates are per 1,000 central line days.
Figure 9. Central line device utilization ratios in Pennsylvania hospitals compared to national device utilization ratios, by hospital location, ward locations.
Behavior MedSurg Med Peds Rehab Surg
2011 PA Hospitals 1.65 0.71 0.58 1.33 0.48 0.57
NHSN 2010 1.19 0.92 1.04 1.44 0.53 0.91
0
0.2
0.4
0.6
0.8
1
1.2
1.4
1.6
1.8
Behavior MedSurg Med Peds Rehab Surg
2011 PA Hospitals 0.01 0.13 0.17 0.14 0.07 0.14
NHSN 2011 0.03 0.15 0.18 0.2 0.08 0.15
0
0.05
0.1
0.15
0.2
0.25

65
Figure 10. Central line-associated bloodstream infection (CLABSI) rates in Pennsylvania hospitals compared to national rates, by hospital location, non-general care locations. Rates are per 1,000 central line days.
Figure 11. Central line device utilization ratios in Pennsylvania hospitals compared to national device utilization ratios, by hospital location, non-general care locations.
Source for 2010 NHSN data: Dudeck MA, et al. National Healthcare Safety Network (NHSN) Report, data summary for 2010, device-associated module. Am J Infect Control 2011;39:798-816.
NICU LTAC SCA-Perm SCA-Temp
2011 PA Hospitals 1.53 1.3 1.2 1.32
NHSN 1.63 1.33 1.73 2.22
0
0.5
1
1.5
2
2.5
NICU LTAC SCA-Perm SCA-Temp
2011 PA Hospitals 0.23 0.59 0.39 0.17
NHSN 2010 0.28 0.58 0.42 0.3
0
0.1
0.2
0.3
0.4
0.5
0.6
0.7

66
Pathogen Distribution The table below shows the distribution of pathogens responsible for central line-associated bloodstream infections in Pennsylvania. The total number (1,740) is larger than the number of CLABSIs (1,540) because in some instances multiple pathogens were identified. S. aureus remains the most common organism associated with CLABSIs, and collectively Staphylococcus species are found in almost a third of the reported CLABSIs. The patterns seen in 2011 are not substantially different than those in 2010.
Table 12 Central Line-Associated Bloodstream Infections in Pennsylvania
Hospitals by Pathogen 2011
Pathogen Count Percent
Staphylococcus aureus 312 17.93
Enterococcus faecalis 157 9.02
Klebsiella pneumoniae 143 8.22
Staphylococcus coagulase negative 141 8.10
Candida albicans 105 6.03
Enterococcus faecium 95 5.46
Pseudomonas aeruginosa 92 5.29
Staphylooccus epidermidis 91 5.23
Escherichia coli 65 3.74
Enterobacter cloacae 55 3.16
Others 484 27.82
TOTAL 1,740 100
67
Facility-specific Central Line-Associated Bloodstream Infection Findings Among the 193 hospitals that used central lines in intensive care or general ward units (the ICU-other category), 135 (69.9 percent) had a standardized infection ratio (SIR) <1.00, meaning the hospital reported fewer CLABSIs than predicted based on statewide rates; 57 hospitals (29.5 percent) had an SIR >1.00, meaning the hospital reported more CLABSIs than predicted, and one hospital had an SIR of 1.00, meaning the hospital reported the same number as expected. For many of the hospitals, the difference between the observed (number reported by the hospital) number of infections and predicted number of infections was not statistically meaningful. This occurs either when the hospital has a small number of patients with central lines in place or when the difference between the observed and predicted number is small. In such circumstances, the reliability (as demonstrated by the wide confidence intervals in the tables) is lower, and the “true” SIR may be either <1.00 or >1.00. As one example of this problem, a total of 72 (37.3 percent) of the hospitals had a predicted number of CLABSIs in their ICUs and wards that was <1. Findings for hospitals with such a low number of predicted infections are considered to be statistically unreliable, and the findings should be very cautiously interpreted and used. Among the 193 hospitals in the ICU-other category, 13 (6.7 percent) hospitals had a reported number of central line-associated bloodstream infections that was significantly better than predicted. These hospitals are listed below in Table 13 in alphabetical order and are designated in green in Table 16. In contrast, 14 (7.3 percent) hospitals had a reported number of CLABSIs that was significantly worse than predicted. These hospitals are listed below in Table 14 and are designated in red in Table 16. All other hospitals are considered to have an incidence of CLABSIs in their critical care units and ward locations that are within (or no different from) the number predicted based on statewide rates of CLABSIs. Among the other CLABSI-related locations (NICU, SCA, and LTAC), one (2.3 percent) of the 43 NICUs had an observed number of infections that was significantly worse than predicted; the remainder were no different than predicted. For specialty care areas, there were two (9.1 percent) that had an observed number of infections that was significantly better than expected, and two (9.1 percent) that had an observed number of infections that was significantly worse than expected. For long term-acute care hospitals, there were three (11.1 percent) facilities that had an observed number of infections that was significantly better than predicted and three (11.1 percent) that were significantly worse than predicted. In order to categorize and compare hospitals that are similar, the next tables divide the hospitals based on the number of predicted infections. The categories that are used include hospitals with <1 predicted CLABSI, 1-2.99 predicted CLABSIs, 3-7.49 predicted CLABSIs, 7.5-14.99 predicted CLABSIs, 15-29.99 predicted CLABSIs and 30+ predicted CLABSIs. Within each tier, hospitals are listed in order by SIR from best to worst. There are separate sections for CCU-other, NICUs, SCAs, and LTACs.
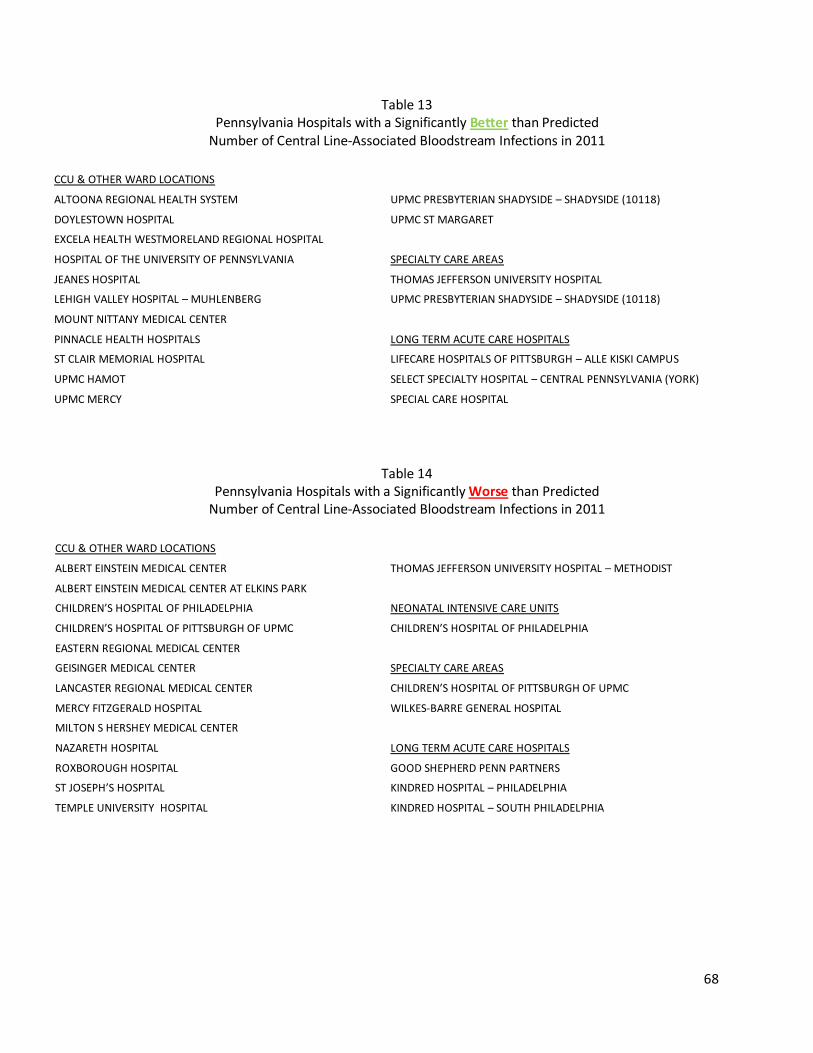
68
Table 13 Pennsylvania Hospitals with a Significantly Better than Predicted
Number of Central Line-Associated Bloodstream Infections in 2011
CCU & OTHER WARD LOCATIONS ALTOONA REGIONAL HEALTH SYSTEM UPMC PRESBYTERIAN SHADYSIDE – SHADYSIDE (10118)
DOYLESTOWN HOSPITAL UPMC ST MARGARET
EXCELA HEALTH WESTMORELAND REGIONAL HOSPITAL HOSPITAL OF THE UNIVERSITY OF PENNSYLVANIA SPECIALTY CARE AREAS
JEANES HOSPITAL THOMAS JEFFERSON UNIVERSITY HOSPITAL
LEHIGH VALLEY HOSPITAL – MUHLENBERG UPMC PRESBYTERIAN SHADYSIDE – SHADYSIDE (10118)
MOUNT NITTANY MEDICAL CENTER PINNACLE HEALTH HOSPITALS LONG TERM ACUTE CARE HOSPITALS
ST CLAIR MEMORIAL HOSPITAL LIFECARE HOSPITALS OF PITTSBURGH – ALLE KISKI CAMPUS
UPMC HAMOT SELECT SPECIALTY HOSPITAL – CENTRAL PENNSYLVANIA (YORK)
UPMC MERCY SPECIAL CARE HOSPITAL
Table 14
Pennsylvania Hospitals with a Significantly Worse than Predicted Number of Central Line-Associated Bloodstream Infections in 2011
CCU & OTHER WARD LOCATIONS
ALBERT EINSTEIN MEDICAL CENTER THOMAS JEFFERSON UNIVERSITY HOSPITAL – METHODIST
ALBERT EINSTEIN MEDICAL CENTER AT ELKINS PARK CHILDREN’S HOSPITAL OF PHILADELPHIA NEONATAL INTENSIVE CARE UNITS
CHILDREN’S HOSPITAL OF PITTSBURGH OF UPMC CHILDREN’S HOSPITAL OF PHILADELPHIA
EASTERN REGIONAL MEDICAL CENTER GEISINGER MEDICAL CENTER SPECIALTY CARE AREAS
LANCASTER REGIONAL MEDICAL CENTER CHILDREN’S HOSPITAL OF PITTSBURGH OF UPMC
MERCY FITZGERALD HOSPITAL WILKES-BARRE GENERAL HOSPITAL
MILTON S HERSHEY MEDICAL CENTER NAZARETH HOSPITAL LONG TERM ACUTE CARE HOSPITALS
ROXBOROUGH HOSPITAL GOOD SHEPHERD PENN PARTNERS
ST JOSEPH’S HOSPITAL KINDRED HOSPITAL – PHILADELPHIA
TEMPLE UNIVERSITY HOSPITAL KINDRED HOSPITAL – SOUTH PHILADELPHIA

69
Hospitals Omitted from Tables 15-19 Due to No Reported Central Line Use By Name and NHSN ID Number
(N = 32)
BARIX CLINICS OF PENNSYLVANIA (12037) BELMONT CENTER FOR COMPREHENSIVE TREATMENT (12505)
BROOKE GLEN BEHAVIORAL HOSPITAL (12623) BUCKS COUNTY SPECIALTY HOSPITAL (15202)
CLARION PSYCHIATRIC CENTER (12454) CLARKS SUMMIT STATE HOSPITAL (12051)
DANVILLE STATE HOSPITAL (11848) DEVEREAUX CHILDREN’S BEHAVIORAL HEALTH INSTITUTE (12738)
DIVINE PROVIDENCE HOSPITAL (11743) EDGEWOOD SURGICAL HOSPITAL (12552)
FAIRMOUNT BEHAVIORAL HEALTH SYSTEM (12565) FIRST HOSPITAL OF WYOMING VALLEY (12050) FOUNDATIONS BEHAVIORAL HEALTH (12832)
FRIENDS HOSPITAL (12488) HAVEN BEHAVIORAL HOSPITAL OF EASTERN PENNSYLVANIA (14471)
HORSHAM CLINIC (12543) KIDSPEACE ORCHARD HILLS CAMPUS (12430)
KIRKBRIDE CENTER (12624) MEYERSDALE COMMUNITY HOSPITAL (11968)
MONTGOMERY COUNTY MH/MR EMERGENCY SERVICES, INC. (12287) NORRISTOWN STATE HOSPITAL (12047) OSS ORTHOPAEDIC HOSPITAL (18467)
PHILHAVEN HOSPITAL (11740) ROXBURY TREATMENT CENTER (12723)
ST JOHN VIANNEY HOSPITAL (12548) SHRINERS HOSPITAL FOR CHILDREN – ERIE (12411)
SOUTHWOOD PSYCHIATRIC HOSPITAL (12453) SURGICAL INSTITUTE OF READING (12535)
THE MEADOWS PSYCHIATRIC CENTER (12156) TORRANCE STATE HOSPITAL (12091) WARREN STATE HOSPITAL (12081)
WERNERSVILLE STATE HOSPITAL (12368)
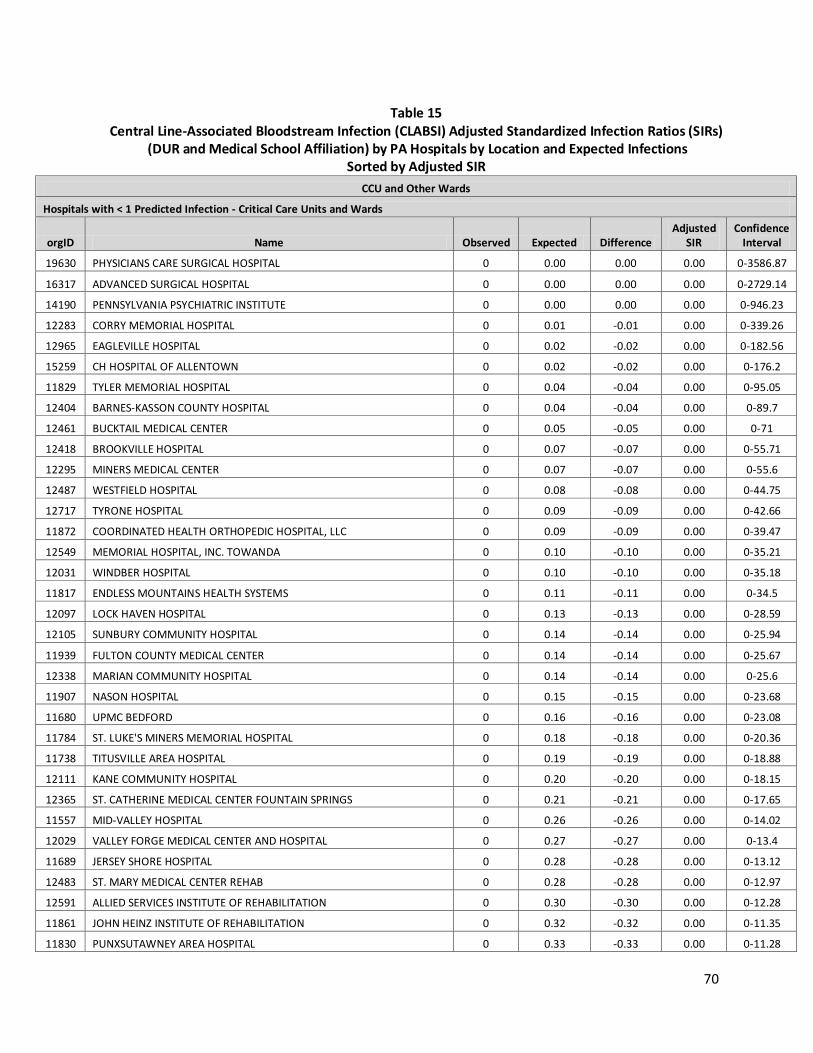
70
Table 15 Central Line-Associated Bloodstream Infection (CLABSI) Adjusted Standardized Infection Ratios (SIRs)
(DUR and Medical School Affiliation) by PA Hospitals by Location and Expected Infections Sorted by Adjusted SIR
CCU and Other Wards
Hospitals with < 1 Predicted Infection - Critical Care Units and Wards
orgID Name Observed Expected Difference Adjusted
SIR Confidence
Interval
19630 PHYSICIANS CARE SURGICAL HOSPITAL 0 0.00 0.00 0.00 0-3586.87
16317 ADVANCED SURGICAL HOSPITAL 0 0.00 0.00 0.00 0-2729.14
14190 PENNSYLVANIA PSYCHIATRIC INSTITUTE 0 0.00 0.00 0.00 0-946.23
12283 CORRY MEMORIAL HOSPITAL 0 0.01 -0.01 0.00 0-339.26
12965 EAGLEVILLE HOSPITAL 0 0.02 -0.02 0.00 0-182.56
15259 CH HOSPITAL OF ALLENTOWN 0 0.02 -0.02 0.00 0-176.2
11829 TYLER MEMORIAL HOSPITAL 0 0.04 -0.04 0.00 0-95.05
12404 BARNES-KASSON COUNTY HOSPITAL 0 0.04 -0.04 0.00 0-89.7
12461 BUCKTAIL MEDICAL CENTER 0 0.05 -0.05 0.00 0-71
12418 BROOKVILLE HOSPITAL 0 0.07 -0.07 0.00 0-55.71
12295 MINERS MEDICAL CENTER 0 0.07 -0.07 0.00 0-55.6
12487 WESTFIELD HOSPITAL 0 0.08 -0.08 0.00 0-44.75
12717 TYRONE HOSPITAL 0 0.09 -0.09 0.00 0-42.66
11872 COORDINATED HEALTH ORTHOPEDIC HOSPITAL, LLC 0 0.09 -0.09 0.00 0-39.47
12549 MEMORIAL HOSPITAL, INC. TOWANDA 0 0.10 -0.10 0.00 0-35.21
12031 WINDBER HOSPITAL 0 0.10 -0.10 0.00 0-35.18
11817 ENDLESS MOUNTAINS HEALTH SYSTEMS 0 0.11 -0.11 0.00 0-34.5
12097 LOCK HAVEN HOSPITAL 0 0.13 -0.13 0.00 0-28.59
12105 SUNBURY COMMUNITY HOSPITAL 0 0.14 -0.14 0.00 0-25.94
11939 FULTON COUNTY MEDICAL CENTER 0 0.14 -0.14 0.00 0-25.67
12338 MARIAN COMMUNITY HOSPITAL 0 0.14 -0.14 0.00 0-25.6
11907 NASON HOSPITAL 0 0.15 -0.15 0.00 0-23.68
11680 UPMC BEDFORD 0 0.16 -0.16 0.00 0-23.08
11784 ST. LUKE'S MINERS MEMORIAL HOSPITAL 0 0.18 -0.18 0.00 0-20.36
11738 TITUSVILLE AREA HOSPITAL 0 0.19 -0.19 0.00 0-18.88
12111 KANE COMMUNITY HOSPITAL 0 0.20 -0.20 0.00 0-18.15
12365 ST. CATHERINE MEDICAL CENTER FOUNTAIN SPRINGS 0 0.21 -0.21 0.00 0-17.65
11557 MID-VALLEY HOSPITAL 0 0.26 -0.26 0.00 0-14.02
12029 VALLEY FORGE MEDICAL CENTER AND HOSPITAL 0 0.27 -0.27 0.00 0-13.4
11689 JERSEY SHORE HOSPITAL 0 0.28 -0.28 0.00 0-13.12
12483 ST. MARY MEDICAL CENTER REHAB 0 0.28 -0.28 0.00 0-12.97
12591 ALLIED SERVICES INSTITUTE OF REHABILITATION 0 0.30 -0.30 0.00 0-12.28
11861 JOHN HEINZ INSTITUTE OF REHABILITATION 0 0.32 -0.32 0.00 0-11.35
11830 PUNXSUTAWNEY AREA HOSPITAL 0 0.33 -0.33 0.00 0-11.28

71
orgID Name Observed Expected Difference Adjusted
SIR Confidence
Interval
11667 HEALTHSOUTH NITTANY VALLEY REHABILITATION HOSPITAL 0 0.33 -0.33 0.00 0-11.17
11722 GROVE CITY MEDICAL CENTER 0 0.34 -0.34 0.00 0-10.83
12273 CRICHTON REHABILITATION CENTER 0 0.36 -0.36 0.00 0-10.3
12396 PALMERTON HOSPITAL 0 0.37 -0.37 0.00 0-9.91
11993 GEISINGER HEALTHSOUTH REHABILITATION HOSPITAL 0 0.38 -0.38 0.00 0-9.76
11748 MUNCY VALLEY HOSPITAL 0 0.39 -0.39 0.00 0-9.43
11724 J C BLAIR MEMORIAL HOSP 0 0.41 -0.41 0.00 0-8.93
12628 LANCASTER REHABILITATION HOSPITAL 0 0.41 -0.41 0.00 0-8.89
11851 CROZER CHESTER MEDICAL CENTER SPRINGFIELD 0 0.41 -0.41 0.00 0-8.87
12361 BRADFORD REGIONAL MEDICAL CENTER 0 0.43 -0.43 0.00 0-8.56
12133 SHAMOKIN AREA COMMUNITY HOSPITAL 0 0.43 -0.43 0.00 0-8.53
11843 CLEARFIELD HOSPITAL 0 0.44 -0.44 0.00 0-8.27
12244 SHRINERS HOSPITAL FOR CHILDREN --- PHILADELPHIA 0 0.46 -0.46 0.00 0-7.94
11859 ELK REGIONAL HEALTH CENTER 0 0.46 -0.46 0.00 0-7.91
11779 ELLWOOD CITY HOSPITAL 0 0.54 -0.54 0.00 0-6.81
12066 HEALTHSOUTH REHABILITATION HOSPITAL OF SEWICKLEY 0 0.54 -0.54 0.00 0-6.78
12058 HEALTHSOUTH REHABILITATION HOSPITAL OF YORK 0 0.54 -0.54 0.00 0-6.77
11642 WAYNESBORO HOSPITAL 0 0.58 -0.58 0.00 0-6.32
12571 HEART OF LANCASTER REGIONAL MEDICAL CENTER 0 0.65 -0.65 0.00 0-5.66
11711 ST. LUKE'S QUAKERTOWN HOSPITAL 0 0.66 -0.66 0.00 0-5.58
12241 GNADEN HUETTEN MEMORIAL HOSPITAL 0 0.69 -0.69 0.00 0-5.28
11903 HEALTHSOUTH REHABILITATION HOSPITAL OF ALTOONA 0 0.79 -0.79 0.00 0-4.62
11531 GETTYSBURG HOSPITAL 0 0.99 -0.99 0.00 0-3.7
12004 WAYNE MEMORIAL HOSPITAL 1 0.93 0.07 1.08 0.01-6.01
12139 HEALTHSOUTH READING REHABILITATION HOSPITAL 1 0.73 0.27 1.36 0.02-7.58
12253 MILLCREEK COMMUNITY HOSPITAL 1 0.73 0.27 1.38 0.02-7.66
12337 JENNERSVILLE REGIONAL HOSPITAL 1 0.72 0.28 1.38 0.02-7.69
11942 SOUTHWEST REGIONAL MEDICAL CENTER 1 0.71 0.29 1.40 0.02-7.8
11997 CARLISLE REGIONAL MEDICAL CENTER 1 0.71 0.29 1.40 0.02-7.81
12609 KENSINGTON HOSPITAL 1 0.69 0.31 1.46 0.02-8.1
12266 CHILDREN'S INSTITUTE OF PITTSBURGH 1 0.57 0.43 1.77 0.02-9.85
11902 HIGHLANDS HOSPITAL 1 0.48 0.52 2.08 0.03-11.59
11688 SOLDIERS & SAILORS MEM HOSPITAL 1 0.44 0.56 2.28 0.03-12.68
11956 CHARLES COLE MEMORIAL HOSPITAL 1 0.39 0.61 2.55 0.03-14.2
11442 BERWICK HOSPITAL CENTER 1 0.39 0.61 2.59 0.03-14.43
12216 WARREN GENERAL HOSPITAL 2 0.36 1.64 5.55 0.62-20.04
12008 BLOOMSBURG HOSPITAL 2 0.30 1.70 6.74 0.76-24.32
12348 EASTERN REGIONAL MEDICAL CENTER 2 0.11 1.89 17.68 1.99-63.85
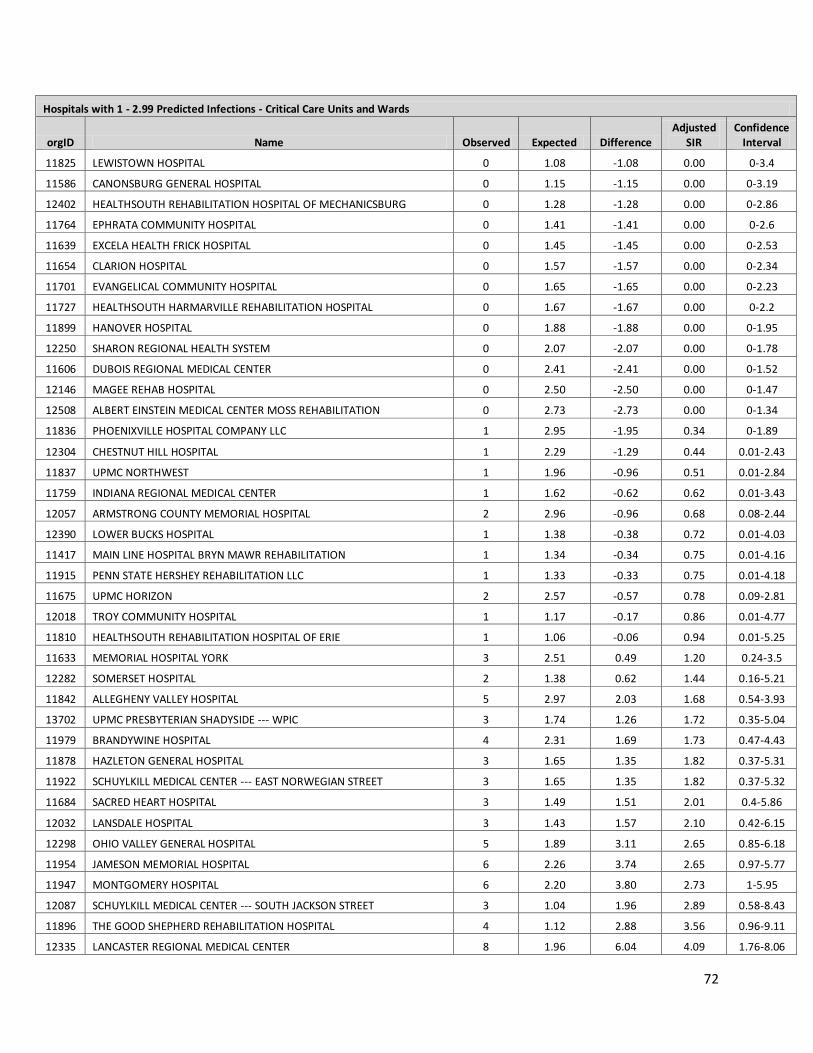
72
Hospitals with 1 - 2.99 Predicted Infections - Critical Care Units and Wards
orgID Name Observed Expected Difference Adjusted
SIR Confidence
Interval
11825 LEWISTOWN HOSPITAL 0 1.08 -1.08 0.00 0-3.4
11586 CANONSBURG GENERAL HOSPITAL 0 1.15 -1.15 0.00 0-3.19
12402 HEALTHSOUTH REHABILITATION HOSPITAL OF MECHANICSBURG 0 1.28 -1.28 0.00 0-2.86
11764 EPHRATA COMMUNITY HOSPITAL 0 1.41 -1.41 0.00 0-2.6
11639 EXCELA HEALTH FRICK HOSPITAL 0 1.45 -1.45 0.00 0-2.53
11654 CLARION HOSPITAL 0 1.57 -1.57 0.00 0-2.34
11701 EVANGELICAL COMMUNITY HOSPITAL 0 1.65 -1.65 0.00 0-2.23
11727 HEALTHSOUTH HARMARVILLE REHABILITATION HOSPITAL 0 1.67 -1.67 0.00 0-2.2
11899 HANOVER HOSPITAL 0 1.88 -1.88 0.00 0-1.95
12250 SHARON REGIONAL HEALTH SYSTEM 0 2.07 -2.07 0.00 0-1.78
11606 DUBOIS REGIONAL MEDICAL CENTER 0 2.41 -2.41 0.00 0-1.52
12146 MAGEE REHAB HOSPITAL 0 2.50 -2.50 0.00 0-1.47
12508 ALBERT EINSTEIN MEDICAL CENTER MOSS REHABILITATION 0 2.73 -2.73 0.00 0-1.34
11836 PHOENIXVILLE HOSPITAL COMPANY LLC 1 2.95 -1.95 0.34 0-1.89
12304 CHESTNUT HILL HOSPITAL 1 2.29 -1.29 0.44 0.01-2.43
11837 UPMC NORTHWEST 1 1.96 -0.96 0.51 0.01-2.84
11759 INDIANA REGIONAL MEDICAL CENTER 1 1.62 -0.62 0.62 0.01-3.43
12057 ARMSTRONG COUNTY MEMORIAL HOSPITAL 2 2.96 -0.96 0.68 0.08-2.44
12390 LOWER BUCKS HOSPITAL 1 1.38 -0.38 0.72 0.01-4.03
11417 MAIN LINE HOSPITAL BRYN MAWR REHABILITATION 1 1.34 -0.34 0.75 0.01-4.16
11915 PENN STATE HERSHEY REHABILITATION LLC 1 1.33 -0.33 0.75 0.01-4.18
11675 UPMC HORIZON 2 2.57 -0.57 0.78 0.09-2.81
12018 TROY COMMUNITY HOSPITAL 1 1.17 -0.17 0.86 0.01-4.77
11810 HEALTHSOUTH REHABILITATION HOSPITAL OF ERIE 1 1.06 -0.06 0.94 0.01-5.25
11633 MEMORIAL HOSPITAL YORK 3 2.51 0.49 1.20 0.24-3.5
12282 SOMERSET HOSPITAL 2 1.38 0.62 1.44 0.16-5.21
11842 ALLEGHENY VALLEY HOSPITAL 5 2.97 2.03 1.68 0.54-3.93
13702 UPMC PRESBYTERIAN SHADYSIDE --- WPIC 3 1.74 1.26 1.72 0.35-5.04
11979 BRANDYWINE HOSPITAL 4 2.31 1.69 1.73 0.47-4.43
11878 HAZLETON GENERAL HOSPITAL 3 1.65 1.35 1.82 0.37-5.31
11922 SCHUYLKILL MEDICAL CENTER --- EAST NORWEGIAN STREET 3 1.65 1.35 1.82 0.37-5.32
11684 SACRED HEART HOSPITAL 3 1.49 1.51 2.01 0.4-5.86
12032 LANSDALE HOSPITAL 3 1.43 1.57 2.10 0.42-6.15
12298 OHIO VALLEY GENERAL HOSPITAL 5 1.89 3.11 2.65 0.85-6.18
11954 JAMESON MEMORIAL HOSPITAL 6 2.26 3.74 2.65 0.97-5.77
11947 MONTGOMERY HOSPITAL 6 2.20 3.80 2.73 1-5.95
12087 SCHUYLKILL MEDICAL CENTER --- SOUTH JACKSON STREET 3 1.04 1.96 2.89 0.58-8.43
11896 THE GOOD SHEPHERD REHABILITATION HOSPITAL 4 1.12 2.88 3.56 0.96-9.11
12335 LANCASTER REGIONAL MEDICAL CENTER 8 1.96 6.04 4.09 1.76-8.06

73
orgID Name Observed Expected Difference Adjusted
SIR Confidence
Interval
11978 ROXBOROUGH MEMORIAL HOSPITAL 10 2.42 7.58 4.14 1.98-7.61
12500 ALBERT EINSTEIN MEDICAL CENTER AT ELKINS PARK 7 1.24 5.76 5.63 2.26-11.6
Hospitals with 3 - 7.49 Predicted Infections - Critical Care Units and Wards
orgID Name Observed Expected Difference Adjusted
SIR Confidence
Interval
10190 DOYLESTOWN HOSPITAL 0 4.56 -4.56 0.00 0-0.8
11459 JEANES HOSPITAL 0 5.89 -5.89 0.00 0-0.62
11797 MOUNT NITTANY MEDICAL CENTER 0 6.28 -6.28 0.00 0-0.58
10178 ALTOONA REGIONAL HEALTH SYSTEM 1 7.16 -6.16 0.14 0-0.78
11946 MERCY PHILADELPHIA HOSPITAL 1 5.15 -4.15 0.19 0-1.08
11914 COMMUNITY MEDICAL CENTER 1 4.73 -3.73 0.21 0-1.18
11583 MEADVILLE MEDICAL CENTER 1 3.15 -2.15 0.32 0-1.77
11864 THE WESTERN PENNSYLVANIA HOSPITAL 1 3.07 -2.07 0.33 0-1.81
11929 EASTON HOSPITAL 2 6.00 -4.00 0.33 0.04-1.2
11847 GRAND VIEW HOSPITAL 2 4.75 -2.75 0.42 0.05-1.52
11732 WILLIAMSPORT REGIONAL MEDICAL CENTER 3 6.68 -3.68 0.45 0.09-1.31
11973 HOLY REDEEMER HOSPITAL AND MEDICAL CENTER 2 3.96 -1.96 0.51 0.06-1.82
11460 THE WASHINGTON HOSPITAL 3 5.23 -2.23 0.57 0.12-1.68
11983 POTTSTOWN MEMORIAL MEDICAL CENTER 2 3.44 -1.44 0.58 0.07-2.1
11707 UPMC MCKEESPORT 4 6.70 -2.70 0.60 0.16-1.53
11972 DELAWARE COUNTY MEMORIAL HOSPITAL 4 6.05 -2.05 0.66 0.18-1.69
10301 MAGEE WOMENS HOSPITAL OF UPMC HEALTH SYSTEM 5 6.99 -1.99 0.72 0.23-1.67
10441 UNIONTOWN HOSPITAL 3 4.16 -1.16 0.72 0.15-2.11
11750 MAIN LINE HOSPITAL --- PAOLI 3 3.84 -0.84 0.78 0.16-2.28
11731 RIDDLE MEMORIAL HOSPITAL 4 4.66 -0.66 0.86 0.23-2.2
11528 MOSES TAYLOR HOSPITAL 4 4.23 -0.23 0.95 0.25-2.42
11736 BUTLER MEMORIAL HOSPITAL 5 4.89 0.11 1.02 0.33-2.39
12533 REGIONAL HOSPITAL OF SCRANTON 6 5.24 0.76 1.15 0.42-2.49
11913 CHAMBERSBURG HOSPITAL 5 4.18 0.82 1.20 0.39-2.79
11772 POCONO MEDICAL CENTER 6 5.00 1.00 1.20 0.44-2.61
11069 MONONGAHELA VALLEY HOSPITAL 4 3.29 0.71 1.21 0.33-3.11
11712 THE GOOD SAMARITAN HOSPITAL 4 3.18 0.82 1.26 0.34-3.22
10237 JEFFERSON REGIONAL MEDICAL CENTER 8 6.06 1.94 1.32 0.57-2.6
11932 CROZER CHESTER MEDICAL CENTER TAYLOR 7 5.14 1.86 1.36 0.55-2.8
11952 MERCY SUBURBAN HOSPITAL NORRISTOWN 6 4.24 1.76 1.42 0.52-3.08
12387 HOLY SPIRIT HOSPITAL 10 6.73 3.27 1.49 0.71-2.73
10375 HERITAGE VALLEY SEWICKLEY 5 3.18 1.82 1.57 0.51-3.67
11651 EXCELA HEALTH LATROBE HOSPITAL 6 3.65 2.35 1.64 0.6-3.57
12290 ST. CHRISTOPHER'S HOSPITAL FOR CHILDREN 7 4.21 2.79 1.66 0.67-3.43
11683 MERCY FITZGERALD HOSPITAL 13 6.31 6.69 2.06 1.1-3.52
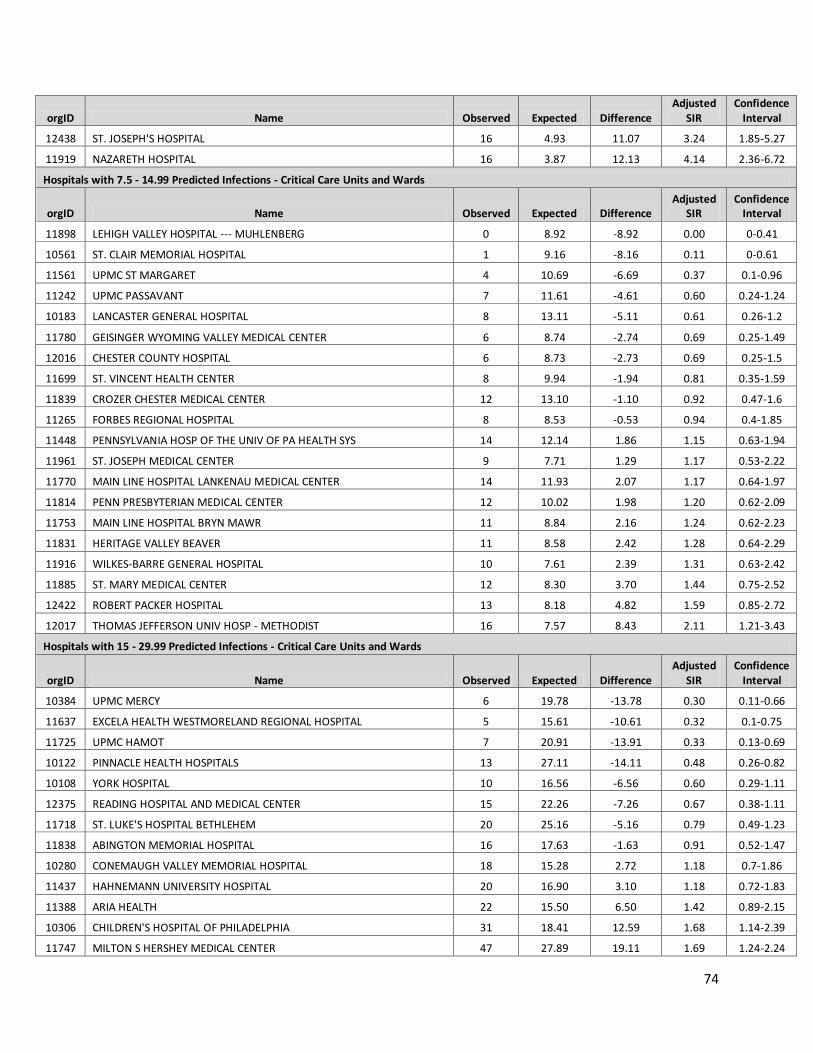
74
orgID Name Observed Expected Difference Adjusted
SIR Confidence
Interval
12438 ST. JOSEPH'S HOSPITAL 16 4.93 11.07 3.24 1.85-5.27
11919 NAZARETH HOSPITAL 16 3.87 12.13 4.14 2.36-6.72
Hospitals with 7.5 - 14.99 Predicted Infections - Critical Care Units and Wards
orgID Name Observed Expected Difference Adjusted
SIR Confidence
Interval
11898 LEHIGH VALLEY HOSPITAL --- MUHLENBERG 0 8.92 -8.92 0.00 0-0.41
10561 ST. CLAIR MEMORIAL HOSPITAL 1 9.16 -8.16 0.11 0-0.61
11561 UPMC ST MARGARET 4 10.69 -6.69 0.37 0.1-0.96
11242 UPMC PASSAVANT 7 11.61 -4.61 0.60 0.24-1.24
10183 LANCASTER GENERAL HOSPITAL 8 13.11 -5.11 0.61 0.26-1.2
11780 GEISINGER WYOMING VALLEY MEDICAL CENTER 6 8.74 -2.74 0.69 0.25-1.49
12016 CHESTER COUNTY HOSPITAL 6 8.73 -2.73 0.69 0.25-1.5
11699 ST. VINCENT HEALTH CENTER 8 9.94 -1.94 0.81 0.35-1.59
11839 CROZER CHESTER MEDICAL CENTER 12 13.10 -1.10 0.92 0.47-1.6
11265 FORBES REGIONAL HOSPITAL 8 8.53 -0.53 0.94 0.4-1.85
11448 PENNSYLVANIA HOSP OF THE UNIV OF PA HEALTH SYS 14 12.14 1.86 1.15 0.63-1.94
11961 ST. JOSEPH MEDICAL CENTER 9 7.71 1.29 1.17 0.53-2.22
11770 MAIN LINE HOSPITAL LANKENAU MEDICAL CENTER 14 11.93 2.07 1.17 0.64-1.97
11814 PENN PRESBYTERIAN MEDICAL CENTER 12 10.02 1.98 1.20 0.62-2.09
11753 MAIN LINE HOSPITAL BRYN MAWR 11 8.84 2.16 1.24 0.62-2.23
11831 HERITAGE VALLEY BEAVER 11 8.58 2.42 1.28 0.64-2.29
11916 WILKES-BARRE GENERAL HOSPITAL 10 7.61 2.39 1.31 0.63-2.42
11885 ST. MARY MEDICAL CENTER 12 8.30 3.70 1.44 0.75-2.52
12422 ROBERT PACKER HOSPITAL 13 8.18 4.82 1.59 0.85-2.72
12017 THOMAS JEFFERSON UNIV HOSP - METHODIST 16 7.57 8.43 2.11 1.21-3.43
Hospitals with 15 - 29.99 Predicted Infections - Critical Care Units and Wards
orgID Name Observed Expected Difference Adjusted
SIR Confidence
Interval
10384 UPMC MERCY 6 19.78 -13.78 0.30 0.11-0.66
11637 EXCELA HEALTH WESTMORELAND REGIONAL HOSPITAL 5 15.61 -10.61 0.32 0.1-0.75
11725 UPMC HAMOT 7 20.91 -13.91 0.33 0.13-0.69
10122 PINNACLE HEALTH HOSPITALS 13 27.11 -14.11 0.48 0.26-0.82
10108 YORK HOSPITAL 10 16.56 -6.56 0.60 0.29-1.11
12375 READING HOSPITAL AND MEDICAL CENTER 15 22.26 -7.26 0.67 0.38-1.11
11718 ST. LUKE'S HOSPITAL BETHLEHEM 20 25.16 -5.16 0.79 0.49-1.23
11838 ABINGTON MEMORIAL HOSPITAL 16 17.63 -1.63 0.91 0.52-1.47
10280 CONEMAUGH VALLEY MEMORIAL HOSPITAL 18 15.28 2.72 1.18 0.7-1.86
11437 HAHNEMANN UNIVERSITY HOSPITAL 20 16.90 3.10 1.18 0.72-1.83
11388 ARIA HEALTH 22 15.50 6.50 1.42 0.89-2.15
10306 CHILDREN'S HOSPITAL OF PHILADELPHIA 31 18.41 12.59 1.68 1.14-2.39
11747 MILTON S HERSHEY MEDICAL CENTER 47 27.89 19.11 1.69 1.24-2.24
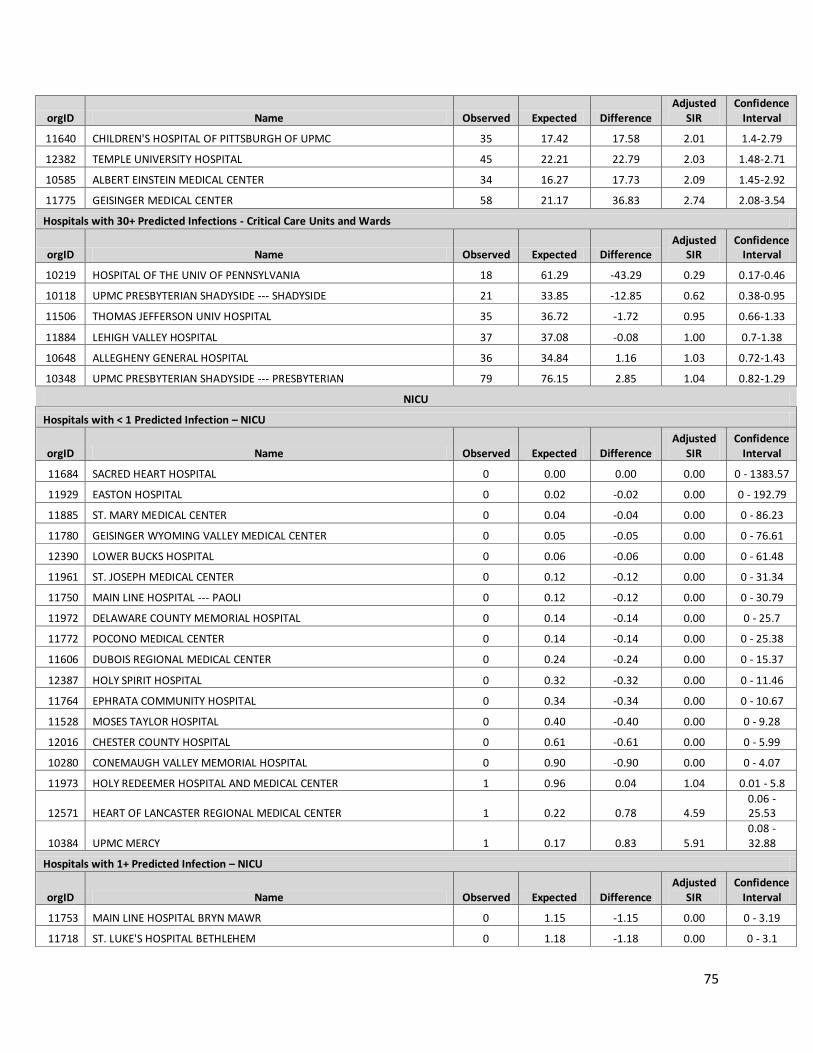
75
orgID Name Observed Expected Difference Adjusted
SIR Confidence
Interval
11640 CHILDREN'S HOSPITAL OF PITTSBURGH OF UPMC 35 17.42 17.58 2.01 1.4-2.79
12382 TEMPLE UNIVERSITY HOSPITAL 45 22.21 22.79 2.03 1.48-2.71
10585 ALBERT EINSTEIN MEDICAL CENTER 34 16.27 17.73 2.09 1.45-2.92
11775 GEISINGER MEDICAL CENTER 58 21.17 36.83 2.74 2.08-3.54
Hospitals with 30+ Predicted Infections - Critical Care Units and Wards
orgID Name Observed Expected Difference Adjusted
SIR Confidence
Interval
10219 HOSPITAL OF THE UNIV OF PENNSYLVANIA 18 61.29 -43.29 0.29 0.17-0.46
10118 UPMC PRESBYTERIAN SHADYSIDE --- SHADYSIDE 21 33.85 -12.85 0.62 0.38-0.95
11506 THOMAS JEFFERSON UNIV HOSPITAL 35 36.72 -1.72 0.95 0.66-1.33
11884 LEHIGH VALLEY HOSPITAL 37 37.08 -0.08 1.00 0.7-1.38
10648 ALLEGHENY GENERAL HOSPITAL 36 34.84 1.16 1.03 0.72-1.43
10348 UPMC PRESBYTERIAN SHADYSIDE --- PRESBYTERIAN 79 76.15 2.85 1.04 0.82-1.29
NICU
Hospitals with < 1 Predicted Infection – NICU
orgID Name Observed Expected Difference Adjusted
SIR Confidence
Interval
11684 SACRED HEART HOSPITAL 0 0.00 0.00 0.00 0 - 1383.57
11929 EASTON HOSPITAL 0 0.02 -0.02 0.00 0 - 192.79
11885 ST. MARY MEDICAL CENTER 0 0.04 -0.04 0.00 0 - 86.23
11780 GEISINGER WYOMING VALLEY MEDICAL CENTER 0 0.05 -0.05 0.00 0 - 76.61
12390 LOWER BUCKS HOSPITAL 0 0.06 -0.06 0.00 0 - 61.48
11961 ST. JOSEPH MEDICAL CENTER 0 0.12 -0.12 0.00 0 - 31.34
11750 MAIN LINE HOSPITAL --- PAOLI 0 0.12 -0.12 0.00 0 - 30.79
11972 DELAWARE COUNTY MEMORIAL HOSPITAL 0 0.14 -0.14 0.00 0 - 25.7
11772 POCONO MEDICAL CENTER 0 0.14 -0.14 0.00 0 - 25.38
11606 DUBOIS REGIONAL MEDICAL CENTER 0 0.24 -0.24 0.00 0 - 15.37
12387 HOLY SPIRIT HOSPITAL 0 0.32 -0.32 0.00 0 - 11.46
11764 EPHRATA COMMUNITY HOSPITAL 0 0.34 -0.34 0.00 0 - 10.67
11528 MOSES TAYLOR HOSPITAL 0 0.40 -0.40 0.00 0 - 9.28
12016 CHESTER COUNTY HOSPITAL 0 0.61 -0.61 0.00 0 - 5.99
10280 CONEMAUGH VALLEY MEMORIAL HOSPITAL 0 0.90 -0.90 0.00 0 - 4.07
11973 HOLY REDEEMER HOSPITAL AND MEDICAL CENTER 1 0.96 0.04 1.04 0.01 - 5.8
12571 HEART OF LANCASTER REGIONAL MEDICAL CENTER 1 0.22 0.78 4.59 0.06 - 25.53
10384 UPMC MERCY 1 0.17 0.83 5.91 0.08 - 32.88
Hospitals with 1+ Predicted Infection – NICU
orgID Name Observed Expected Difference Adjusted
SIR Confidence
Interval
11753 MAIN LINE HOSPITAL BRYN MAWR 0 1.15 -1.15 0.00 0 - 3.19
11718 ST. LUKE'S HOSPITAL BETHLEHEM 0 1.18 -1.18 0.00 0 - 3.1
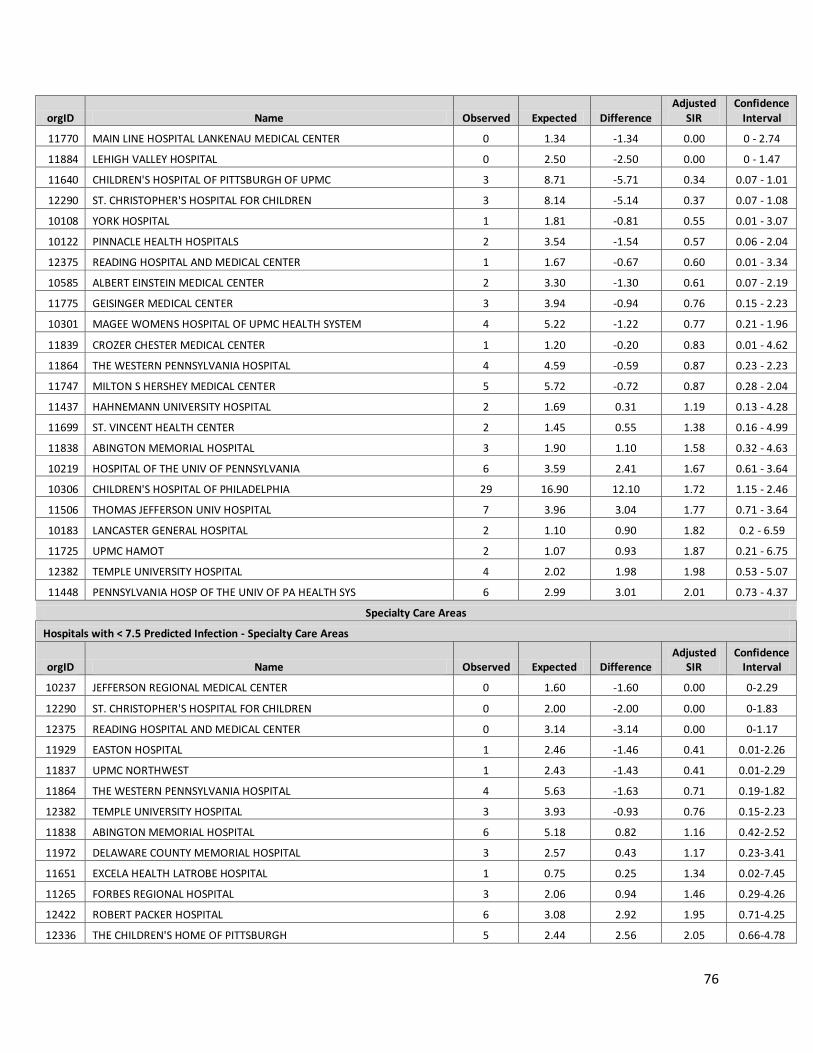
76
orgID Name Observed Expected Difference Adjusted
SIR Confidence
Interval
11770 MAIN LINE HOSPITAL LANKENAU MEDICAL CENTER 0 1.34 -1.34 0.00 0 - 2.74
11884 LEHIGH VALLEY HOSPITAL 0 2.50 -2.50 0.00 0 - 1.47
11640 CHILDREN'S HOSPITAL OF PITTSBURGH OF UPMC 3 8.71 -5.71 0.34 0.07 - 1.01
12290 ST. CHRISTOPHER'S HOSPITAL FOR CHILDREN 3 8.14 -5.14 0.37 0.07 - 1.08
10108 YORK HOSPITAL 1 1.81 -0.81 0.55 0.01 - 3.07
10122 PINNACLE HEALTH HOSPITALS 2 3.54 -1.54 0.57 0.06 - 2.04
12375 READING HOSPITAL AND MEDICAL CENTER 1 1.67 -0.67 0.60 0.01 - 3.34
10585 ALBERT EINSTEIN MEDICAL CENTER 2 3.30 -1.30 0.61 0.07 - 2.19
11775 GEISINGER MEDICAL CENTER 3 3.94 -0.94 0.76 0.15 - 2.23
10301 MAGEE WOMENS HOSPITAL OF UPMC HEALTH SYSTEM 4 5.22 -1.22 0.77 0.21 - 1.96
11839 CROZER CHESTER MEDICAL CENTER 1 1.20 -0.20 0.83 0.01 - 4.62
11864 THE WESTERN PENNSYLVANIA HOSPITAL 4 4.59 -0.59 0.87 0.23 - 2.23
11747 MILTON S HERSHEY MEDICAL CENTER 5 5.72 -0.72 0.87 0.28 - 2.04
11437 HAHNEMANN UNIVERSITY HOSPITAL 2 1.69 0.31 1.19 0.13 - 4.28
11699 ST. VINCENT HEALTH CENTER 2 1.45 0.55 1.38 0.16 - 4.99
11838 ABINGTON MEMORIAL HOSPITAL 3 1.90 1.10 1.58 0.32 - 4.63
10219 HOSPITAL OF THE UNIV OF PENNSYLVANIA 6 3.59 2.41 1.67 0.61 - 3.64
10306 CHILDREN'S HOSPITAL OF PHILADELPHIA 29 16.90 12.10 1.72 1.15 - 2.46
11506 THOMAS JEFFERSON UNIV HOSPITAL 7 3.96 3.04 1.77 0.71 - 3.64
10183 LANCASTER GENERAL HOSPITAL 2 1.10 0.90 1.82 0.2 - 6.59
11725 UPMC HAMOT 2 1.07 0.93 1.87 0.21 - 6.75
12382 TEMPLE UNIVERSITY HOSPITAL 4 2.02 1.98 1.98 0.53 - 5.07
11448 PENNSYLVANIA HOSP OF THE UNIV OF PA HEALTH SYS 6 2.99 3.01 2.01 0.73 - 4.37
Specialty Care Areas
Hospitals with < 7.5 Predicted Infection - Specialty Care Areas
orgID Name Observed Expected Difference Adjusted
SIR Confidence
Interval
10237 JEFFERSON REGIONAL MEDICAL CENTER 0 1.60 -1.60 0.00 0-2.29
12290 ST. CHRISTOPHER'S HOSPITAL FOR CHILDREN 0 2.00 -2.00 0.00 0-1.83
12375 READING HOSPITAL AND MEDICAL CENTER 0 3.14 -3.14 0.00 0-1.17
11929 EASTON HOSPITAL 1 2.46 -1.46 0.41 0.01-2.26
11837 UPMC NORTHWEST 1 2.43 -1.43 0.41 0.01-2.29
11864 THE WESTERN PENNSYLVANIA HOSPITAL 4 5.63 -1.63 0.71 0.19-1.82
12382 TEMPLE UNIVERSITY HOSPITAL 3 3.93 -0.93 0.76 0.15-2.23
11838 ABINGTON MEMORIAL HOSPITAL 6 5.18 0.82 1.16 0.42-2.52
11972 DELAWARE COUNTY MEMORIAL HOSPITAL 3 2.57 0.43 1.17 0.23-3.41
11651 EXCELA HEALTH LATROBE HOSPITAL 1 0.75 0.25 1.34 0.02-7.45
11265 FORBES REGIONAL HOSPITAL 3 2.06 0.94 1.46 0.29-4.26
12422 ROBERT PACKER HOSPITAL 6 3.08 2.92 1.95 0.71-4.25
12336 THE CHILDREN'S HOME OF PITTSBURGH 5 2.44 2.56 2.05 0.66-4.78
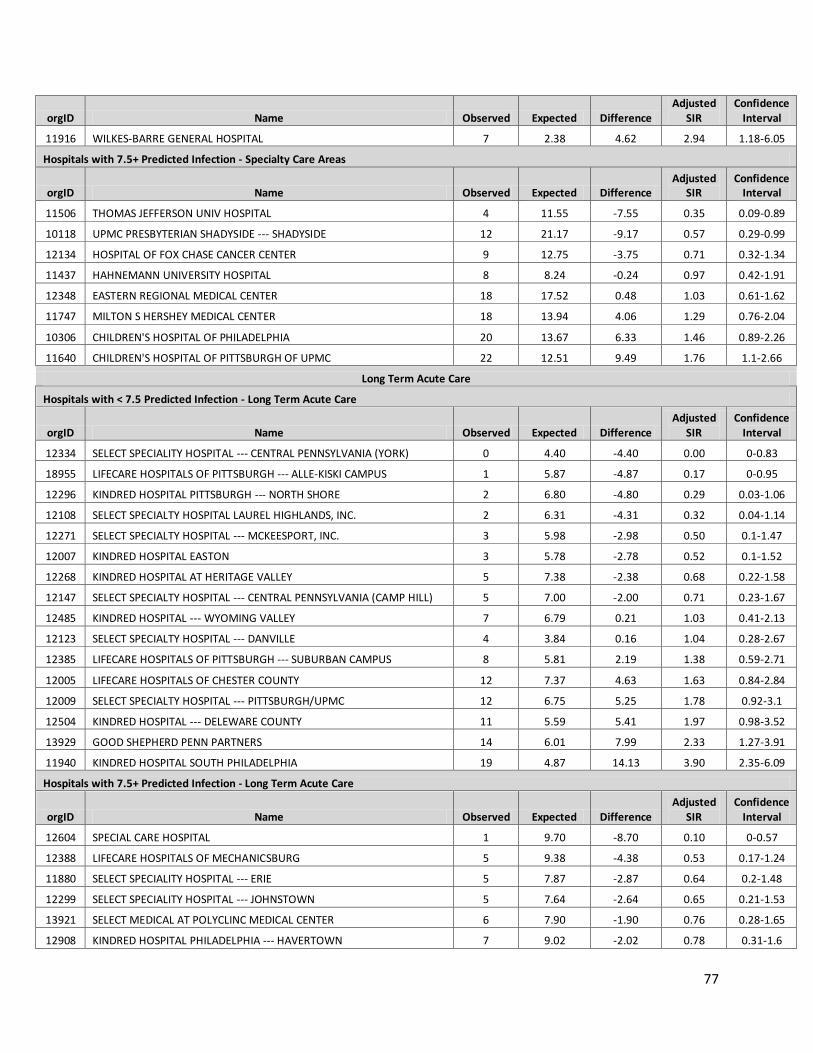
77
orgID Name Observed Expected Difference Adjusted
SIR Confidence
Interval
11916 WILKES-BARRE GENERAL HOSPITAL 7 2.38 4.62 2.94 1.18-6.05
Hospitals with 7.5+ Predicted Infection - Specialty Care Areas
orgID Name Observed Expected Difference Adjusted
SIR Confidence
Interval
11506 THOMAS JEFFERSON UNIV HOSPITAL 4 11.55 -7.55 0.35 0.09-0.89
10118 UPMC PRESBYTERIAN SHADYSIDE --- SHADYSIDE 12 21.17 -9.17 0.57 0.29-0.99
12134 HOSPITAL OF FOX CHASE CANCER CENTER 9 12.75 -3.75 0.71 0.32-1.34
11437 HAHNEMANN UNIVERSITY HOSPITAL 8 8.24 -0.24 0.97 0.42-1.91
12348 EASTERN REGIONAL MEDICAL CENTER 18 17.52 0.48 1.03 0.61-1.62
11747 MILTON S HERSHEY MEDICAL CENTER 18 13.94 4.06 1.29 0.76-2.04
10306 CHILDREN'S HOSPITAL OF PHILADELPHIA 20 13.67 6.33 1.46 0.89-2.26
11640 CHILDREN'S HOSPITAL OF PITTSBURGH OF UPMC 22 12.51 9.49 1.76 1.1-2.66
Long Term Acute Care
Hospitals with < 7.5 Predicted Infection - Long Term Acute Care
orgID Name Observed Expected Difference Adjusted
SIR Confidence
Interval
12334 SELECT SPECIALITY HOSPITAL --- CENTRAL PENNSYLVANIA (YORK) 0 4.40 -4.40 0.00 0-0.83
18955 LIFECARE HOSPITALS OF PITTSBURGH --- ALLE-KISKI CAMPUS 1 5.87 -4.87 0.17 0-0.95
12296 KINDRED HOSPITAL PITTSBURGH --- NORTH SHORE 2 6.80 -4.80 0.29 0.03-1.06
12108 SELECT SPECIALTY HOSPITAL LAUREL HIGHLANDS, INC. 2 6.31 -4.31 0.32 0.04-1.14
12271 SELECT SPECIALTY HOSPITAL --- MCKEESPORT, INC. 3 5.98 -2.98 0.50 0.1-1.47
12007 KINDRED HOSPITAL EASTON 3 5.78 -2.78 0.52 0.1-1.52
12268 KINDRED HOSPITAL AT HERITAGE VALLEY 5 7.38 -2.38 0.68 0.22-1.58
12147 SELECT SPECIALTY HOSPITAL --- CENTRAL PENNSYLVANIA (CAMP HILL) 5 7.00 -2.00 0.71 0.23-1.67
12485 KINDRED HOSPITAL --- WYOMING VALLEY 7 6.79 0.21 1.03 0.41-2.13
12123 SELECT SPECIALTY HOSPITAL --- DANVILLE 4 3.84 0.16 1.04 0.28-2.67
12385 LIFECARE HOSPITALS OF PITTSBURGH --- SUBURBAN CAMPUS 8 5.81 2.19 1.38 0.59-2.71
12005 LIFECARE HOSPITALS OF CHESTER COUNTY 12 7.37 4.63 1.63 0.84-2.84
12009 SELECT SPECIALTY HOSPITAL --- PITTSBURGH/UPMC 12 6.75 5.25 1.78 0.92-3.1
12504 KINDRED HOSPITAL --- DELEWARE COUNTY 11 5.59 5.41 1.97 0.98-3.52
13929 GOOD SHEPHERD PENN PARTNERS 14 6.01 7.99 2.33 1.27-3.91
11940 KINDRED HOSPITAL SOUTH PHILADELPHIA 19 4.87 14.13 3.90 2.35-6.09
Hospitals with 7.5+ Predicted Infection - Long Term Acute Care
orgID Name Observed Expected Difference Adjusted
SIR Confidence
Interval
12604 SPECIAL CARE HOSPITAL 1 9.70 -8.70 0.10 0-0.57
12388 LIFECARE HOSPITALS OF MECHANICSBURG 5 9.38 -4.38 0.53 0.17-1.24
11880 SELECT SPECIALITY HOSPITAL --- ERIE 5 7.87 -2.87 0.64 0.2-1.48
12299 SELECT SPECIALITY HOSPITAL --- JOHNSTOWN 5 7.64 -2.64 0.65 0.21-1.53
13921 SELECT MEDICAL AT POLYCLINC MEDICAL CENTER 6 7.90 -1.90 0.76 0.28-1.65
12908 KINDRED HOSPITAL PHILADELPHIA --- HAVERTOWN 7 9.02 -2.02 0.78 0.31-1.6

78
orgID Name Observed Expected Difference Adjusted
SIR Confidence
Interval
12254 LIFECARE HOSPITALS OF PITTSBURGH --- MONROEVILLE 10 10.84 -0.84 0.92 0.44-1.7
11945 LIFECARE HOSPITALS OF PITTSBURGH 18 18.88 -0.88 0.95 0.56-1.51
11887 GOOD SHEPHERD SPECIALTY HOSPITAL 9 8.64 0.36 1.04 0.48-1.98
12358 KINDRED HOSPITAL --- PITTSBURGH 10 8.43 1.57 1.19 0.57-2.18
11832 KINDRED HOSPITAL --- PHILADELPHIA 21 10.17 10.83 2.06 1.28-3.16
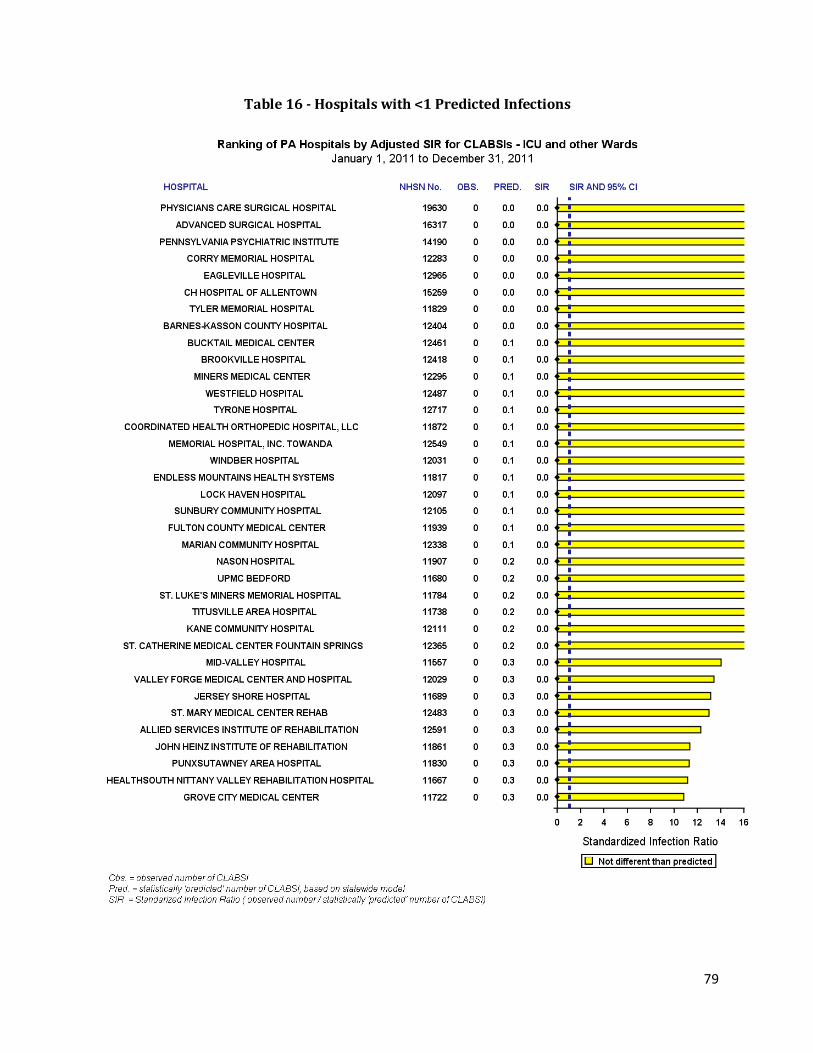
79
Table 16 - Hospitals with <1 Predicted Infections

80
Table 16 - Hospitals with <1 Predicted Infections

81
Table 16 - Hospitals with 1 - 2.99 Predicted Infections
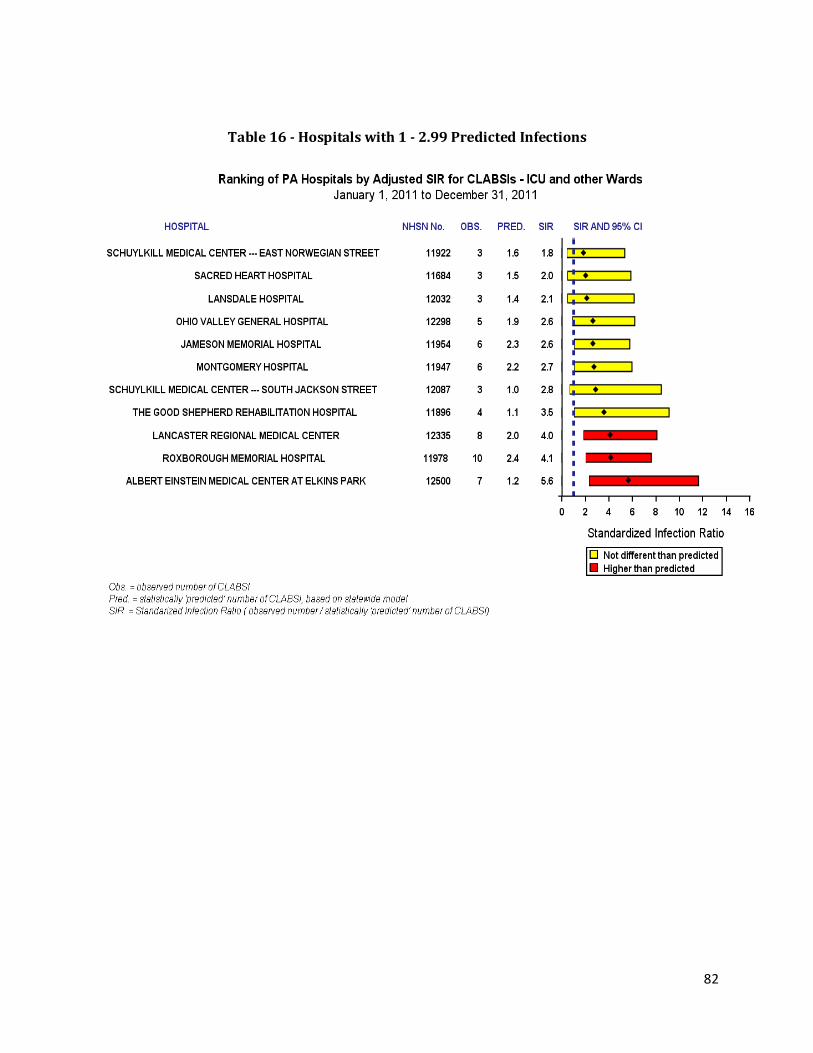
82
Table 16 - Hospitals with 1 - 2.99 Predicted Infections
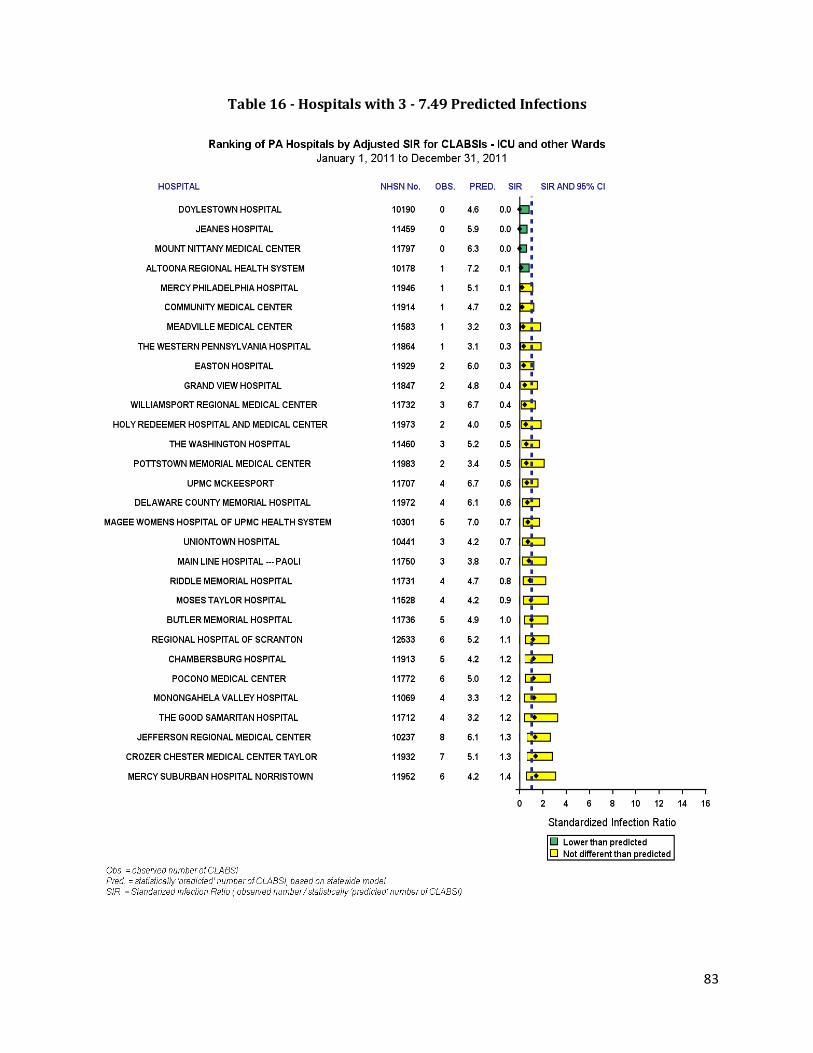
83
Table 16 - Hospitals with 3 - 7.49 Predicted Infections

84
Table 16 - Hospitals with 3 - 7.49 Predicted Infections
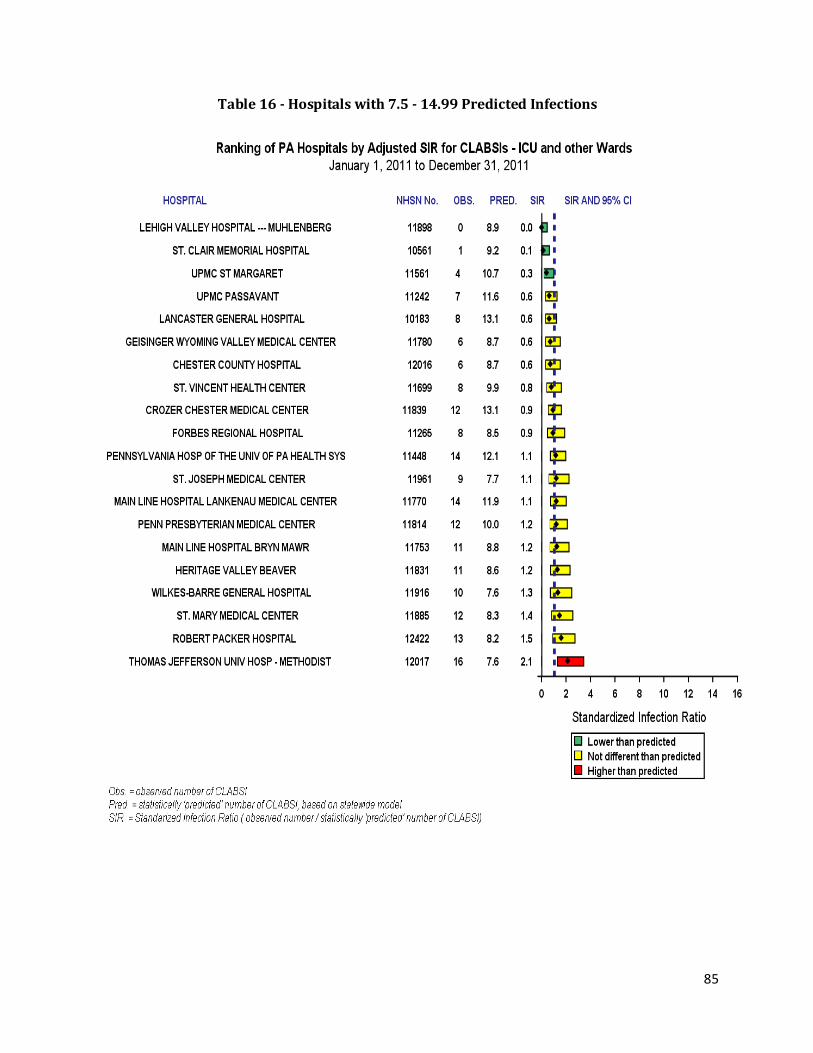
85
Table 16 - Hospitals with 7.5 - 14.99 Predicted Infections
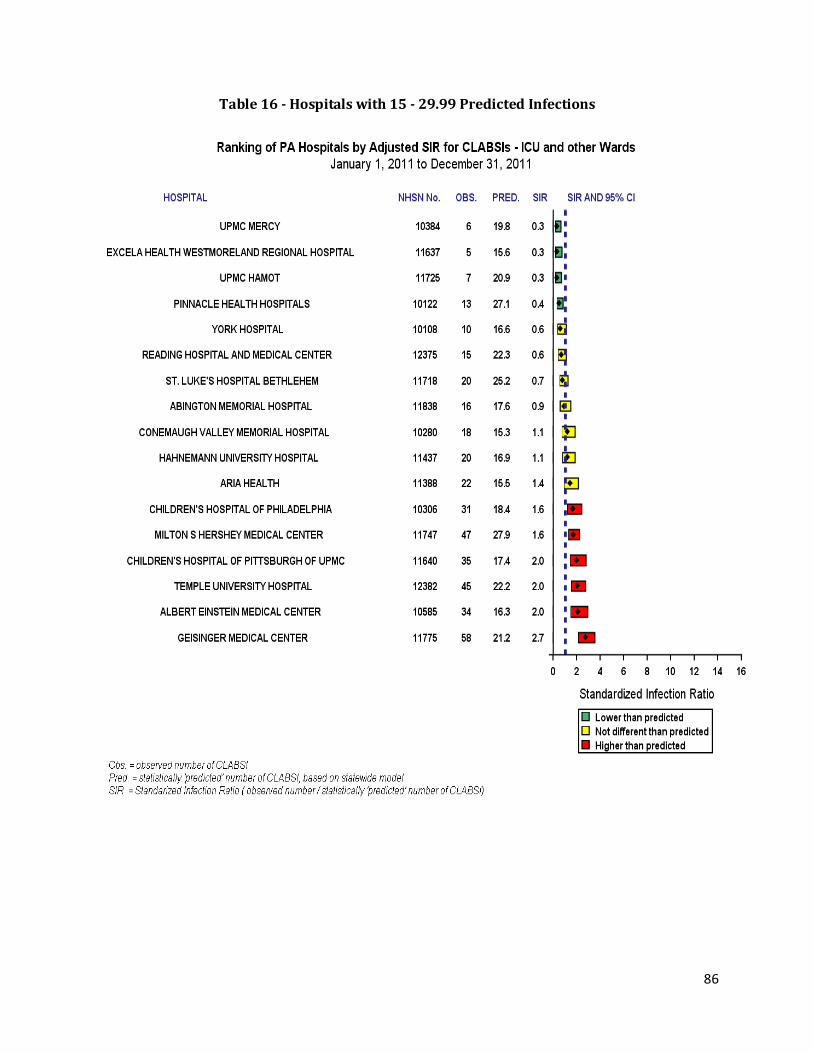
86
Table 16 - Hospitals with 15 - 29.99 Predicted Infections
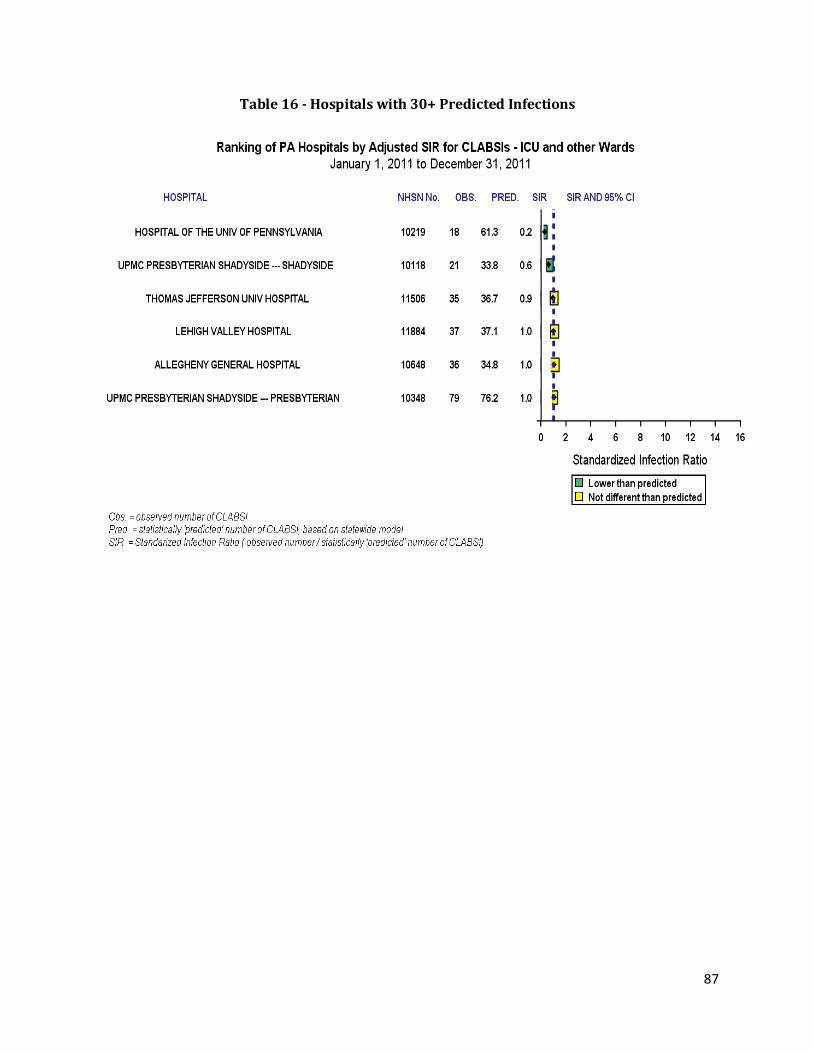
87
Table 16 - Hospitals with 30+ Predicted Infections

88
Table 17 - Hospitals with <1 Predicted Infections
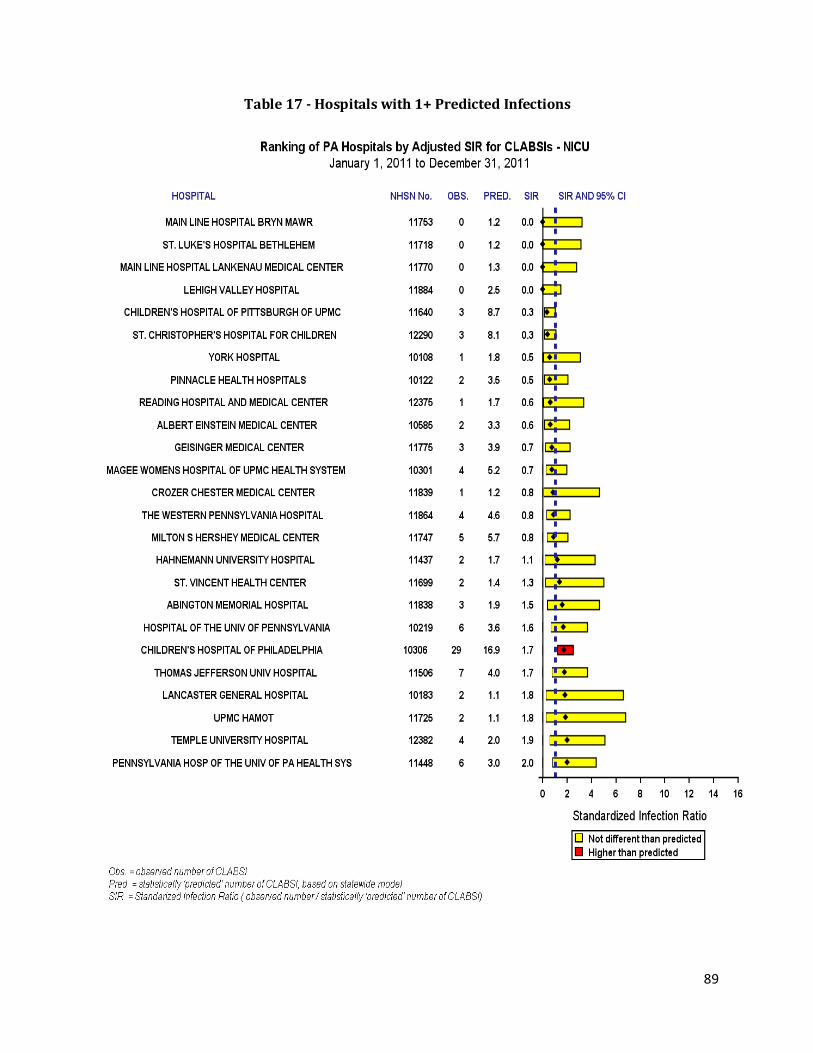
89
Table 17 - Hospitals with 1+ Predicted Infections

90
Table 18 - Hospitals with <7.5 Predicted Infections
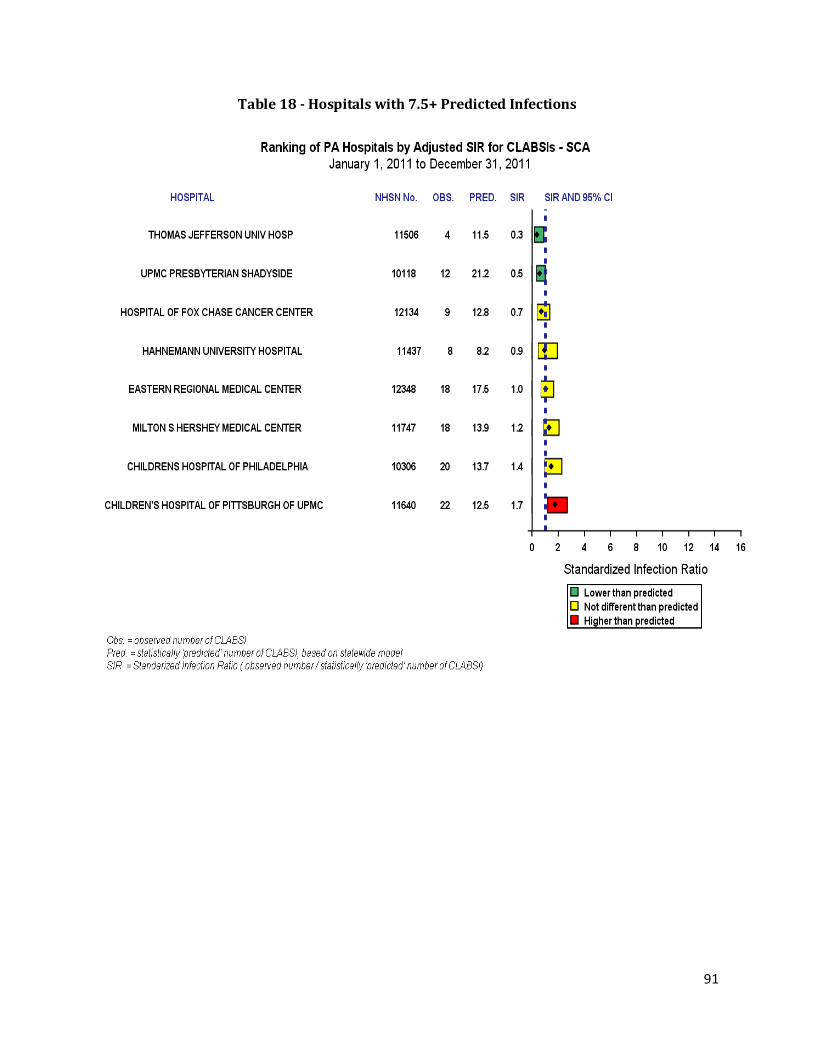
91
Table 18 - Hospitals with 7.5+ Predicted Infections

92
Table 19 - Hospitals with <7.5 Predicted Infections
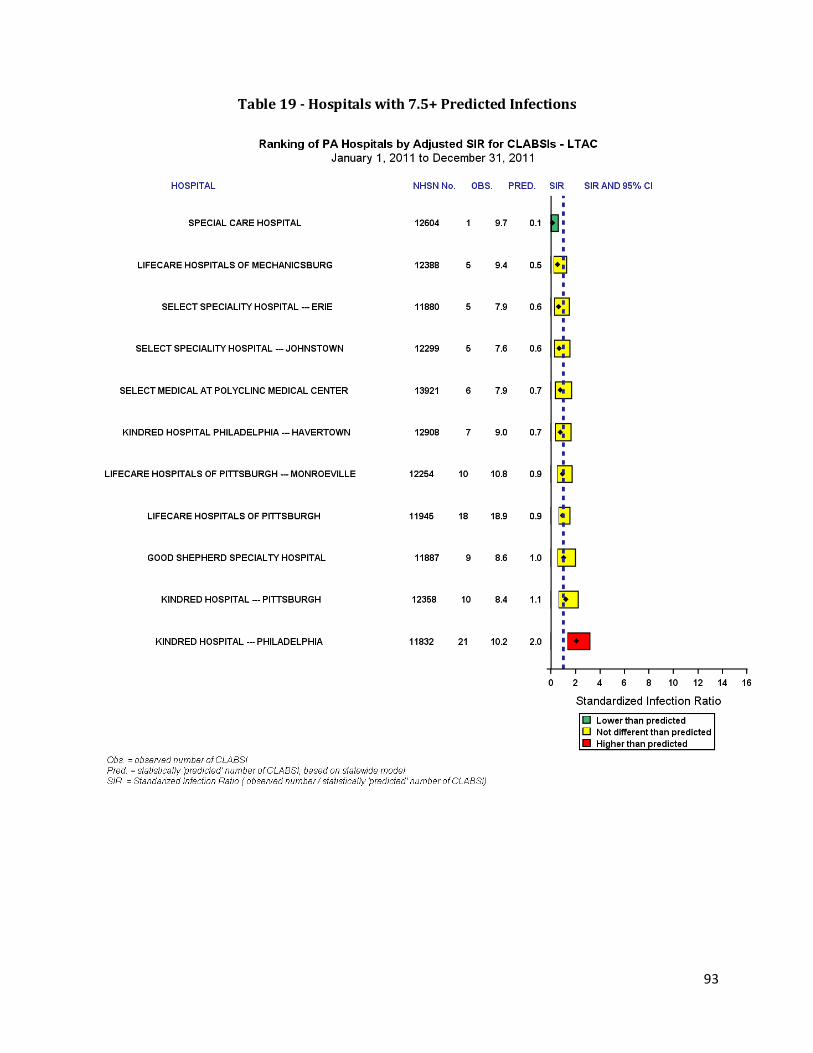
93
Table 19 - Hospitals with 7.5+ Predicted Infections

94
Surgical Site Infections (SSIs)
Surgical site infections (SSIs) are those HAIs that occur in association with an in-patient operation that involves at least one skin incision and complete closure of the incision site before the patient leaves the operating theater. Pennsylvania data show that SSIs are the single most common category of HAIs, and as other categories have declined in incidence, the proportion of HAIs in the SSI category has actually grown. SSIs are a substantial problem in the hospital, as they are very costly, are linked to excess deaths, increase the length of hospitalization, lead to hospital readmissions, and produce long-term consequences. There is a growing body of evidence that SSIs can be prevented through the use of science-based measures. These include the use of peri-operative prophylactic antibiotics, preparation of the surgical site (especially hair removal techniques and pre-operative skin disinfection) and post-operative wound care. A number of factors have been associated with the likelihood an SSI will develop. These include the type of surgical procedure, the underlying health status of the patient, whether the procedure is done emergently or electively, the condition and circumstances of the operative site (e.g., the cleanliness of the wound), duration of the surgical procedure, and the surgeon who performs the procedure. This report focuses on those surgical procedures that have been selected in Pennsylvania for the purpose of benchmarking cardiac surgery (procedures on the valves or septum of the heart – CARD), coronary artery bypass graft (with two incision sites – the chest and donor site – CBGB, and with one incision site – the chest – CBGC), knee arthroplasty (prosthesis – KPRO), hip arthroplasty (prosthesis – HPRO) and abdominal hysterectomy (removal of the uterus through the abdomen – HYST). All but the last procedure can involve the use of implants (tissue implants or a mechanical device). Implant-associated infections have distinct features from other types of SSIs; they are often indolent and difficult to recognize. Therefore, the NHSN protocol requires a follow-up period of 12-months to identify an SSI for a patient undergoing an implant-associated procedure. For patients undergoing procedures in December 2010, this period ended in December 2011. This report therefore covers surgeries performed in 2010, a year earlier than all other data presented in the current report. Beginning in 2012, the federal Centers for Medicare and Medicaid Services (CMS) required hospitals participating in the Inpatient Prospective Payment System (IPPS) to submit information on SSIs associated with abdominal hysterectomies and colon surgeries. Examination of Pennsylvania data shows that colon surgery is the procedure type most frequently reported with an SSI. In order to better categorize the performance of Pennsylvania hospitals with respect to SSIs and to align reporting requirements with those of CMS, in the fall of 2011 PADOH announced that colon surgery would be added as a seventh SSI for benchmarking purposes beginning in 2012. Colon surgery-related SSI data will be included in future annual reports. Composite Data During 2010, a total of 95,034 benchmark procedure in-patient operations were performed by 164 different Pennsylvania hospitals. This represents a 0.9 percent increase in the overall number of these six types of surgical procedures from the overall number in the previous year. Among the 164 hospitals performing at least one of these procedures, there were 54 (32.9 percent) that performed all six of them, seven (4.3 percent) that performed five of the six operations, three (1.8 percent) that performed four, 73 (44.5 percent) that performed three (usually hip and knee replacements and abdominal hysterectomies) of the operations, 19 (11.6 percent) that performed two of the operations and eight
95
(4.9 percent) that performed only one procedure type. For each procedure type, the total number of hospitals performing that procedure is shown in Table 20. Among the 95,034 benchmark procedures, by the end of 2011 a total of 1,206 SSIs were identified and reported (Table 20). This represents a 5.0 percent decline from the number in 2010 (1,269) and results in an overall SSI rate for the six procedures of 1.27 infections per 100 procedures (a pooled infection rate of 1.27 percent) (Table 21). Combined with the increase in the number of procedures performed in 2010, this rate translates to an overall decline of 5.9 percent in the rate of SSIs compared to the previous year. The decline means there were 77 fewer SSIs in Pennsylvania than would have been the case if the 2009 baseline rate had persisted into 2010. Table 20 shows the SSI rate for each of the six procedure types; the rates ranged from a low of 0.88 SSIs per 100 cardiac surgeries and per 100 knee arthroplasties to a high of 2.02 SSIs per 100 dual-incision cardiac bypass graft (CBGB) surgeries. Table 21 displays the side-by-side rates for 2009 and 2010 by procedure, and the percent change by procedure between the two time periods.
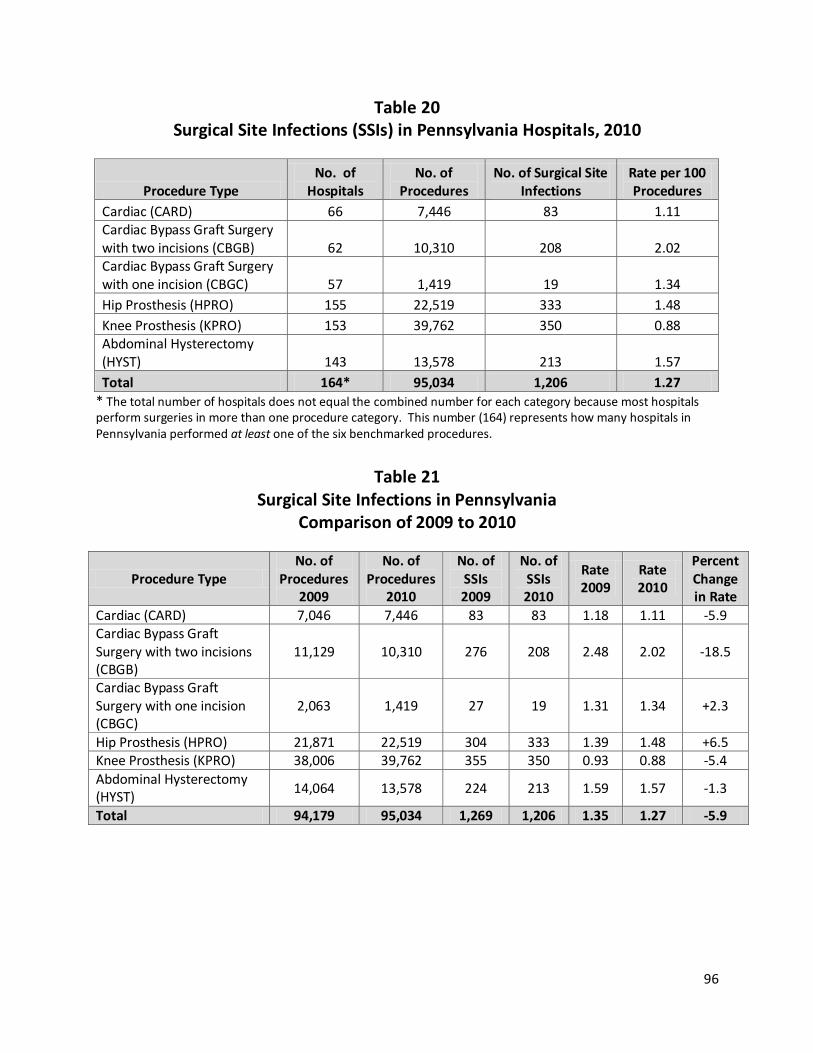
96
Table 20 Surgical Site Infections (SSIs) in Pennsylvania Hospitals, 2010
Procedure Type No. of
Hospitals No. of
Procedures No. of Surgical Site
Infections Rate per 100 Procedures
Cardiac (CARD) 66 7,446 83 1.11 Cardiac Bypass Graft Surgery with two incisions (CBGB) 62 10,310 208 2.02 Cardiac Bypass Graft Surgery with one incision (CBGC) 57 1,419 19 1.34
Hip Prosthesis (HPRO) 155 22,519 333 1.48
Knee Prosthesis (KPRO) 153 39,762 350 0.88 Abdominal Hysterectomy (HYST) 143 13,578 213 1.57
Total 164* 95,034 1,206 1.27
* The total number of hospitals does not equal the combined number for each category because most hospitals perform surgeries in more than one procedure category. This number (164) represents how many hospitals in Pennsylvania performed at least one of the six benchmarked procedures.
Table 21
Surgical Site Infections in Pennsylvania Comparison of 2009 to 2010
Procedure Type No. of
Procedures 2009
No. of Procedures
2010
No. of SSIs 2009
No. of SSIs 2010
Rate 2009
Rate 2010
Percent Change in Rate
Cardiac (CARD) 7,046 7,446 83 83 1.18 1.11 -5.9 Cardiac Bypass Graft Surgery with two incisions (CBGB)
11,129 10,310 276 208 2.48 2.02 -18.5
Cardiac Bypass Graft Surgery with one incision (CBGC)
2,063 1,419 27 19 1.31 1.34 +2.3
Hip Prosthesis (HPRO) 21,871 22,519 304 333 1.39 1.48 +6.5 Knee Prosthesis (KPRO) 38,006 39,762 355 350 0.93 0.88 -5.4
Abdominal Hysterectomy (HYST)
14,064 13,578 224 213 1.59 1.57 -1.3
Total 94,179 95,034 1,269 1,206 1.35 1.27 -5.9
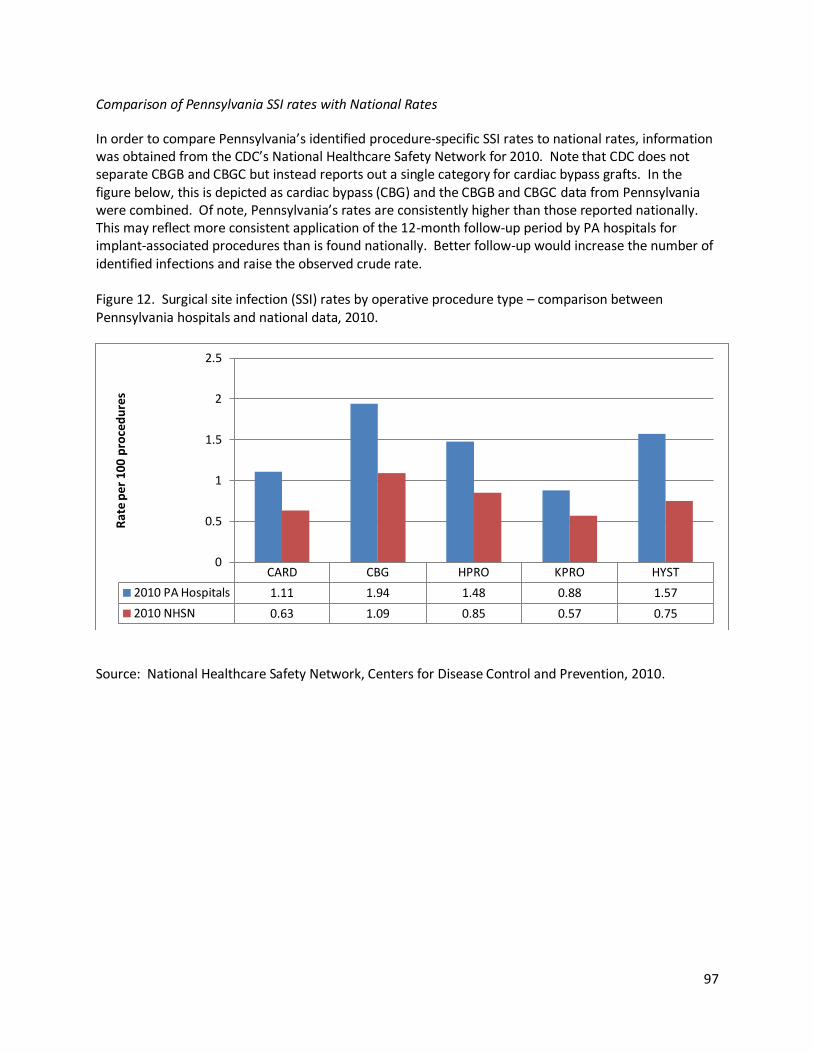
97
Comparison of Pennsylvania SSI rates with National Rates
In order to compare Pennsylvania’s identified procedure-specific SSI rates to national rates, information was obtained from the CDC’s National Healthcare Safety Network for 2010. Note that CDC does not separate CBGB and CBGC but instead reports out a single category for cardiac bypass grafts. In the figure below, this is depicted as cardiac bypass (CBG) and the CBGB and CBGC data from Pennsylvania were combined. Of note, Pennsylvania’s rates are consistently higher than those reported nationally. This may reflect more consistent application of the 12-month follow-up period by PA hospitals for implant-associated procedures than is found nationally. Better follow-up would increase the number of identified infections and raise the observed crude rate. Figure 12. Surgical site infection (SSI) rates by operative procedure type – comparison between Pennsylvania hospitals and national data, 2010.
Source: National Healthcare Safety Network, Centers for Disease Control and Prevention, 2010.
CARD CBG HPRO KPRO HYST
2010 PA Hospitals 1.11 1.94 1.48 0.88 1.57
2010 NHSN 0.63 1.09 0.85 0.57 0.75
0
0.5
1
1.5
2
2.5
Rat
e p
er 1
00 p
roce
du
res

98
Pathogen Data Table 22 shows the pathogen data for surgical site infections occurring in 2010. The information is for all six procedures combined, and is not broken down by procedure as the number of SSIs is small for individual procedure categories. However, S. aureus was the most commonly reported pathogen in each procedure category. The total number is greater than the number of SSIs, as NHSN allows for reporting of more than one pathogen per infection.
Table 22 Six Benchmark Surgical Site Infections (Combined) by Pathogen
2010
Pathogen Count Percent
Staphylococcus aureus 495 37.50 Staphylococcus coagulase negative 99 7.50 Pseudomonas aeruginosa 72 5.45 Escherichia coli 72 5.45 Enterococcus faecalis 57 4.32
Proteus mirabilis 56 4.24
Others 469 35.53
TOTAL 1,320 100
99
Risk-adjusted rates Since information is collected on all patients undergoing the benchmark operative procedures, it is possible to calculate SSI rates for patient characteristics that are used for SSI risk adjustment purposes. For this report, rates are adjusted by the risk index. The risk index is comprised of:
American Society of Anesthesiology (ASA) score (a measure of the overall health of the patient)
Wound classification (clean vs. unclean)
Operative duration (below or above the median) Each patient is assigned a risk index (RI) score of 0 to 3, with a possible single point given for each of the three criteria. For instance, a patient with a low ASA score (meaning they are a low-risk patient for surgical complications – i.e., they are in good health), a clean wound and a short operative duration would have a risk index of 0. A patient with a high ASA score (a person at high risk of surgical complications due to poor health), a contaminated operative site and long procedure duration would have a risk index score of 3. Patients can therefore have an assigned risk index of 0, 1, 2, or 3 based on whether or not a point is assigned for each factor that comprises the risk index. Studies have shown that, in general, the SSI rate increases in concert with an increasing risk index. In general, this is true for the six benchmark procedures in Pennsylvania. However, as shown in Table 24, this is not always the case. This usually results because the number of procedures and/or SSIs in some of the risk index strata is small. For instance, in 2010, only five cardiac bypass (two incisions) procedures were done on patients with a risk index of 0, and a similar small number (seven procedures) were done on patients with a risk index of 3. Table 23 demonstrates the SSI rate for each benchmark procedure by risk index category in 2010. To determine the risk-adjusted standardized infection ratio (SIR) for each hospital, the hospital’s SSI rate for each risk index category (e.g. for their patients with a risk index of 0, 1, 2, and 3) is compared to the overall statewide rate for each risk index stratum. The number of predicted SSIs for each hospital is calculated based on the number of procedures they reported performing within each risk index category and the statewide rate for that stratum. The predicted number is then compared to the observed number. This is done for each risk index category to produce an overall predicted SSI number, and this is compared to the overall observed number to produce the risk adjusted SIR for each procedure. As with CAUTIs and CLABSIs, the confidence interval (CI) is then calculated to determine if the number of SSIs reported by the hospital is significantly better or worse than predicted, in comparison to the statewide rate. Hospitals with significantly better or worse than predicted SIRs are found in Tables 25 and 26.

100
Table 23
Surgical Site Infection Rates by Risk Index Category
Procedure Type Risk
Index
No. of SSIs in 2010
No. of procedures
2010 SSI rate per 100 procedures 2010
Cardiac (CARD) 0 2 125 1.60
1 57 5,435 1.05
2 24 1,854 1.29
3 0 32 0.00
Total 83 7,446 1.11
Cardiac Bypass -two incisions (CBGB) 0 1 56 1.79
1 139 7,952 1.75
2 68 2,288 2.97
3 0 14 0.00
Total 208 10,310 2.02
Cardiac Bypass – one incision (CBGC) 0 0 12 0.00
1 15 1,089 1.38
2 4 314 1.27
3 0 4 0.00
Total 19 1,419 1.34
Hip Prosthesis (HPRO) 0 71 7,983 0.89
1 181 11,965 1.51
2 81 2,512 3.22
3 0 58 0.00
Total 333 22,519 1.48
Knee Prosthesis (KPRO) 0 73 16,171 0.45
1 197 19,853 0.99
2 78 3,684 2.12
3 2 54 3.70
Total 350 39,762 0.88
Abdominal Hysterectomy (HYST) 0 75 7,088 1.08
1 96 5,104 1.88
2 42 1,361 3.09
3 0 25 0.00
Total 213 13,578 1.57
Total
1,206 95,034 1.27

101
Results The SIRs by for each of the benchmark procedures by hospital are presented in Table 27. In this table, the hospitals are listed sequentially from lowest standardized infection ratio (SIR) to highest SIR. Table 28 presents the same information in alphabetical order by hospital. This enables the user to review a specific hospital’s SIRs for each procedure together. Cardiac Surgical Procedures In 2010, among the 66 hospitals that performed cardiac surgery, the median number of reported SSIs was 0. In that year, 34 (51.5 percent) of these hospitals reported no cardiac surgery-related SSIs, and 38 (57.6 percent) had a predicted number of infections that was <1.00. Information regarding hospitals with <1 predicted cardiac surgical site infection is considered statistically unreliable (as evidenced by the extremely wide confidence intervals in the tables for these facilities). During 2010, 44 (66.7 percent) of the hospitals performing cardiac surgery had an adjusted SIR that was <1.00 (meaning the number of reported cardiac surgery-related SSIs was lower than predicted), while the remaining 22 (33.3 percent) had an SIR >1.00 (the number reported was higher than predicted). None of the hospitals had a significantly lower number of cardiac surgery-related SSIs than predicted, and only two hospitals (3.0 percent) had a significantly higher number than predicted. These hospitals are listed in Table 26. Cardiac Bypass Graft – Two Incision Procedures (CBGB) In 2010, among the 62 hospitals that performed two-incision (chest and donor site) cardiac bypass grafts, the median number of SSIs was 3, and 8 (12.9 percent) reported no CBGB-related SSIs. Among these hospitals, only 4 (6.5 percent) had <1 predicted infection. In 2010, there were 34 (54.8 percent) hospitals performing CBGBs that had a lower number of SSIs than predicted (their adjusted SIR was <1.00), 27 (43.5 percent) had a higher number of SSIs than predicted (SIR >1.00) and one (1.6 percent) had the same number as predicted (an SIR of 1.00). Among the 62 hospitals, none reported a significantly lower number of observed infections than predicted, while 3 (4.8 percent) reported a significantly higher number of infections than predicted. These hospitals are listed in Table 26. Cardiac Bypass Graft – Single Incision Procedures (CBGC) In 2010, among the 57 hospitals that reported performing single (chest) incision cardiac bypass grafts (CBGC), the median number of post-surgical SSIs was 0, and only 15 (26.3 percent) of the hospitals reported any CBGC-related SSIs. The remaining 42 (73.7 percent) reported none. In addition, 53 (93.0 percent) of the hospitals had <1 predicted infection in the CBGC category; for these hospitals the findings are considered to be statistically unreliable. Among all hospitals, 45 (78.9 percent) of the hospitals performing CBGCs had a reported number of SSIs that was less than predicted (an SIR <1.00) and only 12 (21.0 percent) reported more SSIs (an SIR >1.00) than predicted; none had significantly better SIRs than predicted while one (1.8 percent) had a significantly worse SIR than predicted. This hospital is listed in Table 26. Hip Prostheses (HPRO) In 2010, among the 155 hospitals performing hip arthroplasties (prostheses), the median number of SSIs was 1; a total of 60 (38.7 percent) reported no SSIs in this procedure category, and 68 (43.9 percent) had a predicted number of infections that was <1 (meaning the findings for these hospitals are statistically

102
unreliable). In 2010, there were 93 (60.0 percent) that had a fewer number (SIR <1.00) of SSIs reported than predicted, while the remaining 62 (40.0 percent) had a greater number (SIR >1.00) of SSIs reported than predicted. None of the hospitals had a significantly lower number of infections reported than predicted, but eight (5.2 percent) hospitals had a significantly higher (or worse) number of hip prosthesis-related SSIs than predicted. The eight hospitals with a significantly higher number of infections than predicted can be found in Table 26. Knee Prostheses (KPRO) In 2010, the median number of SSIs among the 153 hospitals performing knee arthroplasties (prostheses) was 1; a total of 58 (37.9 percent) reported no SSIs in this procedure category. Among the 153 hospitals, 64 (41.8 percent) had a predicted number of infections that was <1; for these hospitals the findings are considered statistically unreliable. In 2010, there were 97 (63.4 percent) that had a fewer number (SIR <1.00) of knee prosthesis-related SSIs reported than predicted, while 56 (36.6 percent) had a greater number (SIR >1.00) of SSIs reported than predicted. Only one hospital had a significantly lower number of infections reported than predicted in 2010, while six (3.9 percent) hospitals had a significantly higher number of SSIs reported than were predicted in that year. The hospitals with a significantly lower than, and higher than, predicted number of knee procedure related surgical site infections can be found in Tables 25 and 26. Abdominal Hysterectomies (HYST) In 2010, among the 143 hospitals that performed abdominal hysterectomies, the median number of SSIs was 1, and there were 66 (46.2 percent) that reported no SSIs associated with this procedure and 78 (54.5 percent) with a predicted number of SSIs that was <1 (the findings for hospitals with <1 predicted infection are considered statistically unreliable). In 2010, a total of 94 (65.7 percent) hospitals reported fewer SSIs than predicted (SIR <1.00), while the other 49 (34.3 percent) reported more SSIs than predicted (SIR >1.00). However, only one hospital had a significantly lower number of SSIs than predicted, and five (3.5 percent) hospitals had a significantly higher number of SSIs than predicted. These hospitals can be found in Tables 25 and 26.
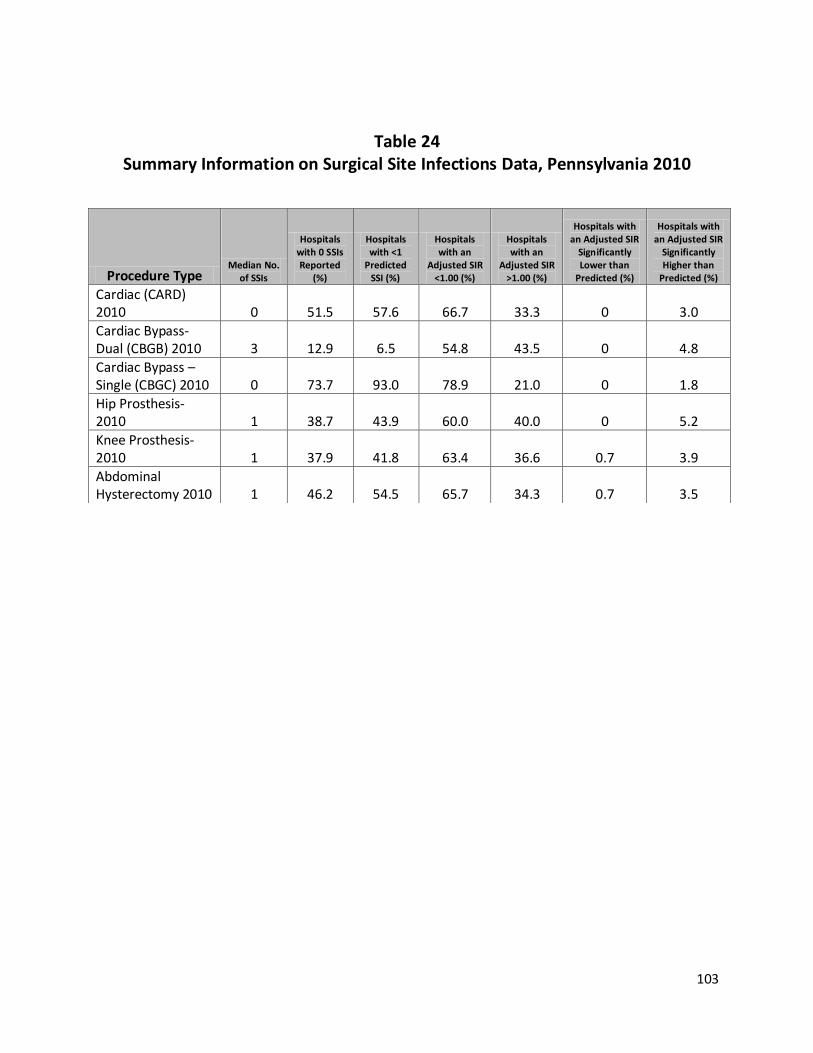
103
Table 24 Summary Information on Surgical Site Infections Data, Pennsylvania 2010
Procedure Type Median No.
of SSIs
Hospitals with 0 SSIs Reported
(%)
Hospitals with <1
Predicted SSI (%)
Hospitals with an
Adjusted SIR <1.00 (%)
Hospitals with an
Adjusted SIR >1.00 (%)
Hospitals with an Adjusted SIR
Significantly Lower than
Predicted (%)
Hospitals with an Adjusted SIR
Significantly Higher than
Predicted (%)
Cardiac (CARD) 2010 0 51.5 57.6 66.7 33.3 0 3.0
Cardiac Bypass- Dual (CBGB) 2010 3 12.9 6.5 54.8 43.5 0 4.8
Cardiac Bypass – Single (CBGC) 2010 0 73.7 93.0 78.9 21.0 0 1.8
Hip Prosthesis- 2010 1 38.7 43.9 60.0 40.0 0 5.2
Knee Prosthesis- 2010 1 37.9 41.8 63.4 36.6 0.7 3.9
Abdominal Hysterectomy 2010 1 46.2 54.5 65.7 34.3 0.7 3.5
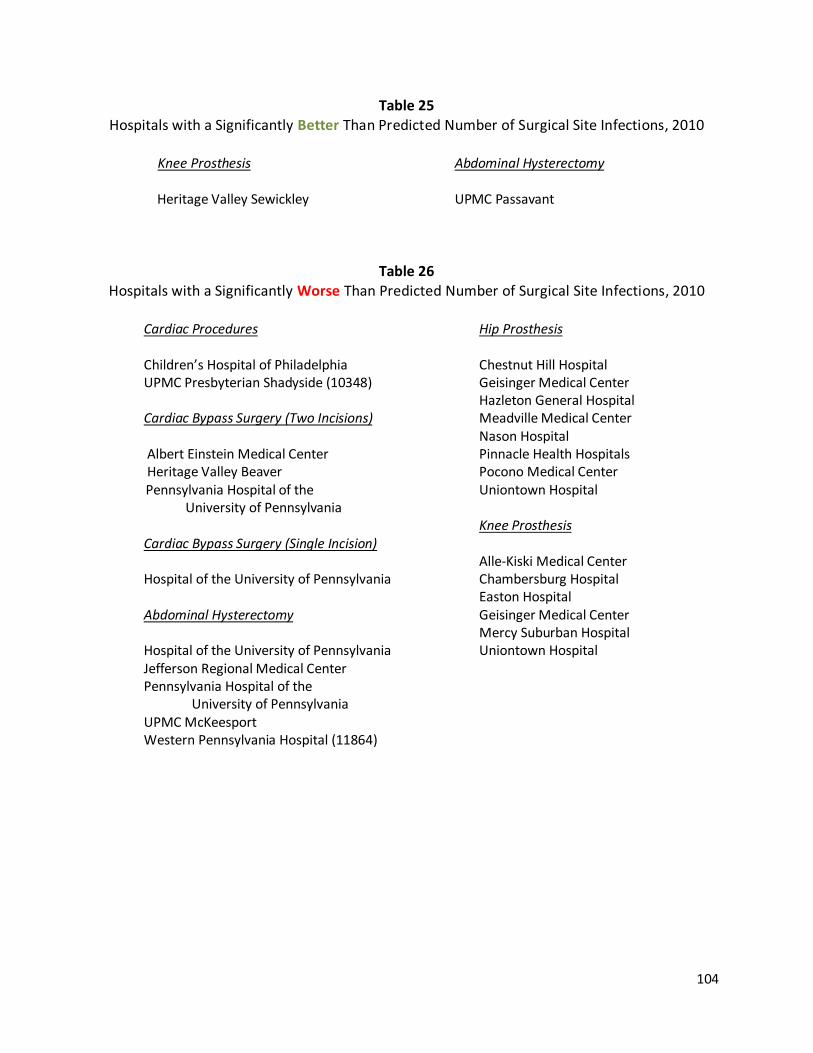
104
Table 25 Hospitals with a Significantly Better Than Predicted Number of Surgical Site Infections, 2010
Knee Prosthesis Abdominal Hysterectomy Heritage Valley Sewickley UPMC Passavant
Table 26 Hospitals with a Significantly Worse Than Predicted Number of Surgical Site Infections, 2010
Cardiac Procedures Hip Prosthesis Children’s Hospital of Philadelphia Chestnut Hill Hospital UPMC Presbyterian Shadyside (10348) Geisinger Medical Center Hazleton General Hospital Cardiac Bypass Surgery (Two Incisions) Meadville Medical Center Nason Hospital Albert Einstein Medical Center Pinnacle Health Hospitals Heritage Valley Beaver Pocono Medical Center Pennsylvania Hospital of the Uniontown Hospital University of Pennsylvania Knee Prosthesis Cardiac Bypass Surgery (Single Incision) Alle-Kiski Medical Center Hospital of the University of Pennsylvania Chambersburg Hospital Easton Hospital Abdominal Hysterectomy Geisinger Medical Center Mercy Suburban Hospital Hospital of the University of Pennsylvania Uniontown Hospital Jefferson Regional Medical Center Pennsylvania Hospital of the University of Pennsylvania UPMC McKeesport Western Pennsylvania Hospital (11864)

105
Table 27 2010 Hospital Specific Surgical Site Infection Standardized Infection Ratios (SIRs) by Procedure
Cardiac Surgical Procedures
orgID Hospital Name Observed Predicted Difference Adjusted
SIR Confidence
Interval
12298 OHIO VALLEY GENERAL HOSPITAL 0 0.01 -0.01 0.00 0-349.34
11712 THE GOOD SAMARITAN HOSPITAL 0 0.02 -0.02 0.00 0-156.76
10375 HERITAGE VALLEY SEWICKLEY 0 0.04 -0.04 0.00 0-87.34
12390 LOWER BUCKS HOSPITAL 0 0.06 -0.06 0.00 0-59.07
11979 BRANDYWINE HOSPITAL 0 0.15 -0.15 0.00 0-23.68
11914 COMMUNITY MEDICAL CENTER 0 0.23 -0.23 0.00 0-15.72
12250 SHARON REGIONAL HEALTH SYSTEM
0 0.25 -0.25 0.00 0-14.61
11683 MERCY FITZGERALD HOSPITAL 0 0.27 -0.27 0.00 0-13.69
11836 PHOENIXVILLE HOSPITAL 0 0.27 -0.27 0.00 0-13.49
11459 JEANES HOSPITAL 0 0.35 -0.35 0.00 0-10.57
11732 WILLIAMSPORT REGIONAL MEDICAL CENTER
0 0.41 -0.41 0.00 0-9.05
11265 FORBES REGIONAL HOSPITAL 0 0.49 -0.49 0.00 0-7.56
11448 PENNSYLVANIA HOSPITAL OF THE UNIVERSITY OF PENNSYLVANIA
0 0.51 -0.51 0.00 0-7.15
11606 DUBOIS REGIONAL MEDICAL CENTER
0 0.52 -0.52 0.00 0-7.06
11839 CROZER CHESTER MEDICAL CENTER
0 0.54 -0.54 0.00 0-6.85
11585 ALBERT EINSTEIN MEDICAL CENTER
0 0.54 -0.54 0.00 0-6.76
11388 ARIA HEALTH 0 0.56 -0.56 0.00 0-6.60
12016 CHESTER COUNTY HOSPITAL 0 0.60 -0.60 0.00 0-6.11
11437 HAHNEMANN UNIVERSITY HOSPITAL
0 0.65 -0.65 0.00 0-5.63
10561 ST CLAIR MEMORIAL HOSPITAL 0 0.74 -0.74 0.00 0-4.94
11898 LEHIGH VALLEY HOSPITAL - MUHLENBERG
0 0.75 -0.75 0.00 0-4.89
12375 READING HOSPITAL AND MEDICAL CENTER
0 0.87 -0.87 0.00 0-4.20
12387 HOLY SPIRIT HOSPITAL 0 0.96 -0.96 0.00 0-3.83
12382 TEMPLE UNIVERSITY HOSPITAL 0 0.98 -0.98 0.00 0-3.74
10280 CONEMAUGH VALLEY MEMORIAL HOSPITAL
0 1.10 -1.10 0.00 0-3.34
10178 ALTOONA REGIONAL HEALTH SYSTEM
0 1.16 -1.16 0.00 0-3.17
11637 EXCELA HEALTH WESTMORELAND 0 1.16 -1.16 0.00 0-3.17
11838 ABINGTON MEMORIAL HOSPITAL 0 1.19 -1.19 0.00 0-3.08
10190 DOYLESTOWN HOSPITAL 0 1.20 -1.20 0.00 0-3.07
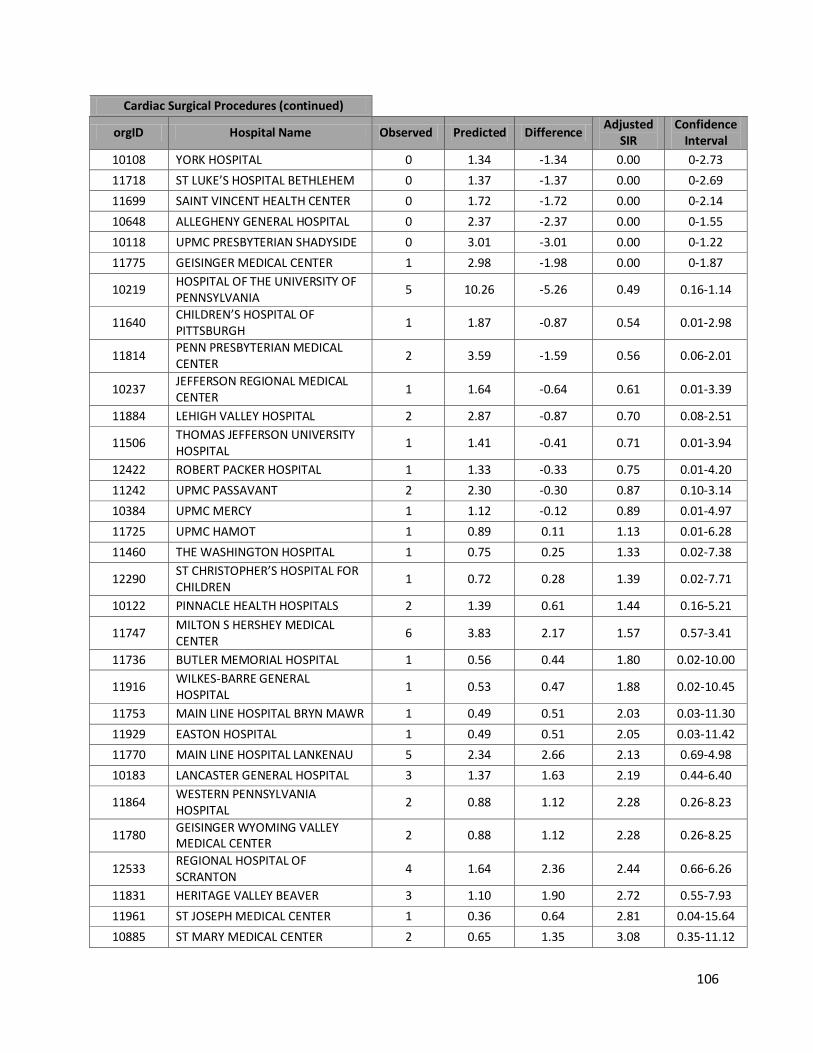
106
Cardiac Surgical Procedures (continued)
orgID Hospital Name Observed Predicted Difference Adjusted
SIR Confidence
Interval
10108 YORK HOSPITAL 0 1.34 -1.34 0.00 0-2.73
11718 ST LUKE’S HOSPITAL BETHLEHEM 0 1.37 -1.37 0.00 0-2.69
11699 SAINT VINCENT HEALTH CENTER 0 1.72 -1.72 0.00 0-2.14
10648 ALLEGHENY GENERAL HOSPITAL 0 2.37 -2.37 0.00 0-1.55
10118 UPMC PRESBYTERIAN SHADYSIDE 0 3.01 -3.01 0.00 0-1.22
11775 GEISINGER MEDICAL CENTER 1 2.98 -1.98 0.00 0-1.87
10219 HOSPITAL OF THE UNIVERSITY OF PENNSYLVANIA
5 10.26 -5.26 0.49 0.16-1.14
11640 CHILDREN’S HOSPITAL OF PITTSBURGH
1 1.87 -0.87 0.54 0.01-2.98
11814 PENN PRESBYTERIAN MEDICAL CENTER
2 3.59 -1.59 0.56 0.06-2.01
10237 JEFFERSON REGIONAL MEDICAL CENTER
1 1.64 -0.64 0.61 0.01-3.39
11884 LEHIGH VALLEY HOSPITAL 2 2.87 -0.87 0.70 0.08-2.51
11506 THOMAS JEFFERSON UNIVERSITY HOSPITAL
1 1.41 -0.41 0.71 0.01-3.94
12422 ROBERT PACKER HOSPITAL 1 1.33 -0.33 0.75 0.01-4.20
11242 UPMC PASSAVANT 2 2.30 -0.30 0.87 0.10-3.14
10384 UPMC MERCY 1 1.12 -0.12 0.89 0.01-4.97
11725 UPMC HAMOT 1 0.89 0.11 1.13 0.01-6.28
11460 THE WASHINGTON HOSPITAL 1 0.75 0.25 1.33 0.02-7.38
12290 ST CHRISTOPHER’S HOSPITAL FOR CHILDREN
1 0.72 0.28 1.39 0.02-7.71
10122 PINNACLE HEALTH HOSPITALS 2 1.39 0.61 1.44 0.16-5.21
11747 MILTON S HERSHEY MEDICAL CENTER
6 3.83 2.17 1.57 0.57-3.41
11736 BUTLER MEMORIAL HOSPITAL 1 0.56 0.44 1.80 0.02-10.00
11916 WILKES-BARRE GENERAL HOSPITAL
1 0.53 0.47 1.88 0.02-10.45
11753 MAIN LINE HOSPITAL BRYN MAWR 1 0.49 0.51 2.03 0.03-11.30
11929 EASTON HOSPITAL 1 0.49 0.51 2.05 0.03-11.42
11770 MAIN LINE HOSPITAL LANKENAU 5 2.34 2.66 2.13 0.69-4.98
10183 LANCASTER GENERAL HOSPITAL 3 1.37 1.63 2.19 0.44-6.40
11864 WESTERN PENNSYLVANIA HOSPITAL
2 0.88 1.12 2.28 0.26-8.23
11780 GEISINGER WYOMING VALLEY MEDICAL CENTER
2 0.88 1.12 2.28 0.26-8.25
12533 REGIONAL HOSPITAL OF SCRANTON
4 1.64 2.36 2.44 0.66-6.26
11831 HERITAGE VALLEY BEAVER 3 1.10 1.90 2.72 0.55-7.93
11961 ST JOSEPH MEDICAL CENTER 1 0.36 0.64 2.81 0.04-15.64
10885 ST MARY MEDICAL CENTER 2 0.65 1.35 3.08 0.35-11.12
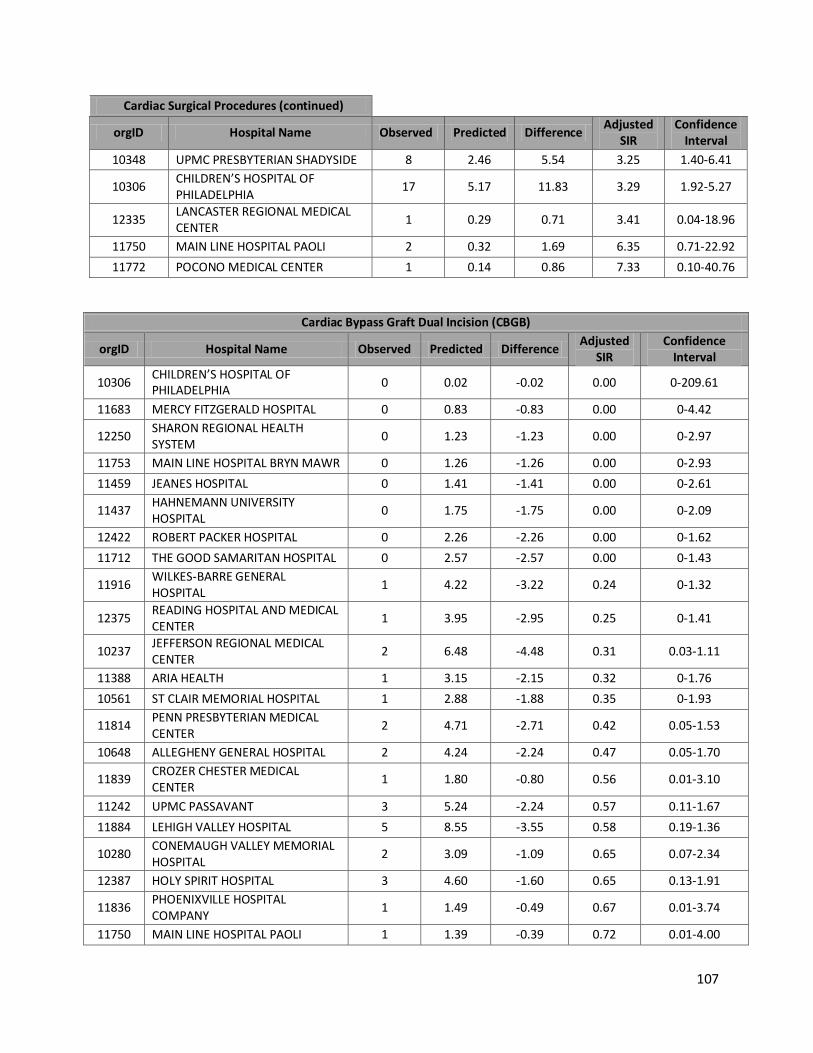
107
Cardiac Surgical Procedures (continued)
orgID Hospital Name Observed Predicted Difference Adjusted
SIR Confidence
Interval
10348 UPMC PRESBYTERIAN SHADYSIDE 8 2.46 5.54 3.25 1.40-6.41
10306 CHILDREN’S HOSPITAL OF PHILADELPHIA
17 5.17 11.83 3.29 1.92-5.27
12335 LANCASTER REGIONAL MEDICAL CENTER
1 0.29 0.71 3.41 0.04-18.96
11750 MAIN LINE HOSPITAL PAOLI 2 0.32 1.69 6.35 0.71-22.92
11772 POCONO MEDICAL CENTER 1 0.14 0.86 7.33 0.10-40.76
Cardiac Bypass Graft Dual Incision (CBGB)
orgID Hospital Name Observed Predicted Difference Adjusted
SIR Confidence
Interval
10306 CHILDREN’S HOSPITAL OF PHILADELPHIA
0 0.02 -0.02 0.00 0-209.61
11683 MERCY FITZGERALD HOSPITAL 0 0.83 -0.83 0.00 0-4.42
12250 SHARON REGIONAL HEALTH SYSTEM
0 1.23 -1.23 0.00 0-2.97
11753 MAIN LINE HOSPITAL BRYN MAWR 0 1.26 -1.26 0.00 0-2.93
11459 JEANES HOSPITAL 0 1.41 -1.41 0.00 0-2.61
11437 HAHNEMANN UNIVERSITY HOSPITAL
0 1.75 -1.75 0.00 0-2.09
12422 ROBERT PACKER HOSPITAL 0 2.26 -2.26 0.00 0-1.62
11712 THE GOOD SAMARITAN HOSPITAL 0 2.57 -2.57 0.00 0-1.43
11916 WILKES-BARRE GENERAL HOSPITAL
1 4.22 -3.22 0.24 0-1.32
12375 READING HOSPITAL AND MEDICAL CENTER
1 3.95 -2.95 0.25 0-1.41
10237 JEFFERSON REGIONAL MEDICAL CENTER
2 6.48 -4.48 0.31 0.03-1.11
11388 ARIA HEALTH 1 3.15 -2.15 0.32 0-1.76
10561 ST CLAIR MEMORIAL HOSPITAL 1 2.88 -1.88 0.35 0-1.93
11814 PENN PRESBYTERIAN MEDICAL CENTER
2 4.71 -2.71 0.42 0.05-1.53
10648 ALLEGHENY GENERAL HOSPITAL 2 4.24 -2.24 0.47 0.05-1.70
11839 CROZER CHESTER MEDICAL CENTER
1 1.80 -0.80 0.56 0.01-3.10
11242 UPMC PASSAVANT 3 5.24 -2.24 0.57 0.11-1.67
11884 LEHIGH VALLEY HOSPITAL 5 8.55 -3.55 0.58 0.19-1.36
10280 CONEMAUGH VALLEY MEMORIAL HOSPITAL
2 3.09 -1.09 0.65 0.07-2.34
12387 HOLY SPIRIT HOSPITAL 3 4.60 -1.60 0.65 0.13-1.91
11836 PHOENIXVILLE HOSPITAL COMPANY
1 1.49 -0.49 0.67 0.01-3.74
11750 MAIN LINE HOSPITAL PAOLI 1 1.39 -0.39 0.72 0.01-4.00
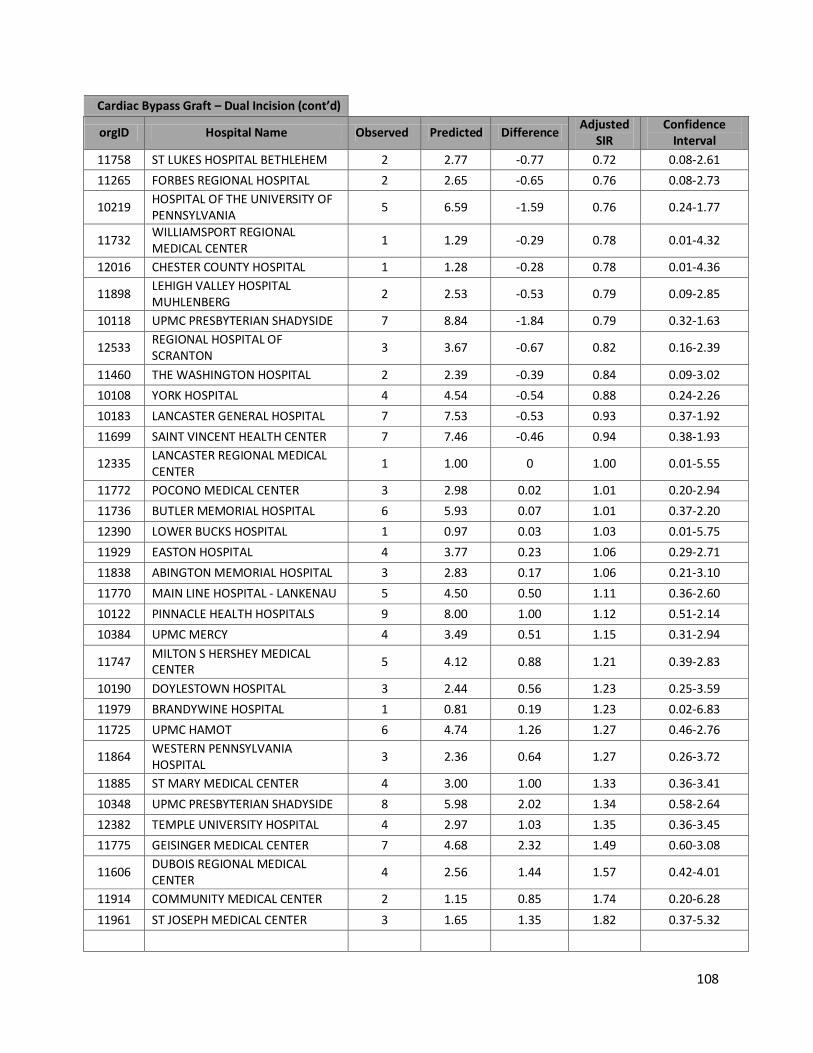
108
Cardiac Bypass Graft – Dual Incision (cont’d)
orgID Hospital Name Observed Predicted Difference Adjusted
SIR Confidence
Interval
11758 ST LUKES HOSPITAL BETHLEHEM 2 2.77 -0.77 0.72 0.08-2.61
11265 FORBES REGIONAL HOSPITAL 2 2.65 -0.65 0.76 0.08-2.73
10219 HOSPITAL OF THE UNIVERSITY OF PENNSYLVANIA
5 6.59 -1.59 0.76 0.24-1.77
11732 WILLIAMSPORT REGIONAL MEDICAL CENTER
1 1.29 -0.29 0.78 0.01-4.32
12016 CHESTER COUNTY HOSPITAL 1 1.28 -0.28 0.78 0.01-4.36
11898 LEHIGH VALLEY HOSPITAL MUHLENBERG
2 2.53 -0.53 0.79 0.09-2.85
10118 UPMC PRESBYTERIAN SHADYSIDE 7 8.84 -1.84 0.79 0.32-1.63
12533 REGIONAL HOSPITAL OF SCRANTON
3 3.67 -0.67 0.82 0.16-2.39
11460 THE WASHINGTON HOSPITAL 2 2.39 -0.39 0.84 0.09-3.02
10108 YORK HOSPITAL 4 4.54 -0.54 0.88 0.24-2.26
10183 LANCASTER GENERAL HOSPITAL 7 7.53 -0.53 0.93 0.37-1.92
11699 SAINT VINCENT HEALTH CENTER 7 7.46 -0.46 0.94 0.38-1.93
12335 LANCASTER REGIONAL MEDICAL CENTER
1 1.00 0 1.00 0.01-5.55
11772 POCONO MEDICAL CENTER 3 2.98 0.02 1.01 0.20-2.94
11736 BUTLER MEMORIAL HOSPITAL 6 5.93 0.07 1.01 0.37-2.20
12390 LOWER BUCKS HOSPITAL 1 0.97 0.03 1.03 0.01-5.75
11929 EASTON HOSPITAL 4 3.77 0.23 1.06 0.29-2.71
11838 ABINGTON MEMORIAL HOSPITAL 3 2.83 0.17 1.06 0.21-3.10
11770 MAIN LINE HOSPITAL - LANKENAU 5 4.50 0.50 1.11 0.36-2.60
10122 PINNACLE HEALTH HOSPITALS 9 8.00 1.00 1.12 0.51-2.14
10384 UPMC MERCY 4 3.49 0.51 1.15 0.31-2.94
11747 MILTON S HERSHEY MEDICAL CENTER
5 4.12 0.88 1.21 0.39-2.83
10190 DOYLESTOWN HOSPITAL 3 2.44 0.56 1.23 0.25-3.59
11979 BRANDYWINE HOSPITAL 1 0.81 0.19 1.23 0.02-6.83
11725 UPMC HAMOT 6 4.74 1.26 1.27 0.46-2.76
11864 WESTERN PENNSYLVANIA HOSPITAL
3 2.36 0.64 1.27 0.26-3.72
11885 ST MARY MEDICAL CENTER 4 3.00 1.00 1.33 0.36-3.41
10348 UPMC PRESBYTERIAN SHADYSIDE 8 5.98 2.02 1.34 0.58-2.64
12382 TEMPLE UNIVERSITY HOSPITAL 4 2.97 1.03 1.35 0.36-3.45
11775 GEISINGER MEDICAL CENTER 7 4.68 2.32 1.49 0.60-3.08
11606 DUBOIS REGIONAL MEDICAL CENTER
4 2.56 1.44 1.57 0.42-4.01
11914 COMMUNITY MEDICAL CENTER 2 1.15 0.85 1.74 0.20-6.28
11961 ST JOSEPH MEDICAL CENTER 3 1.65 1.35 1.82 0.37-5.32
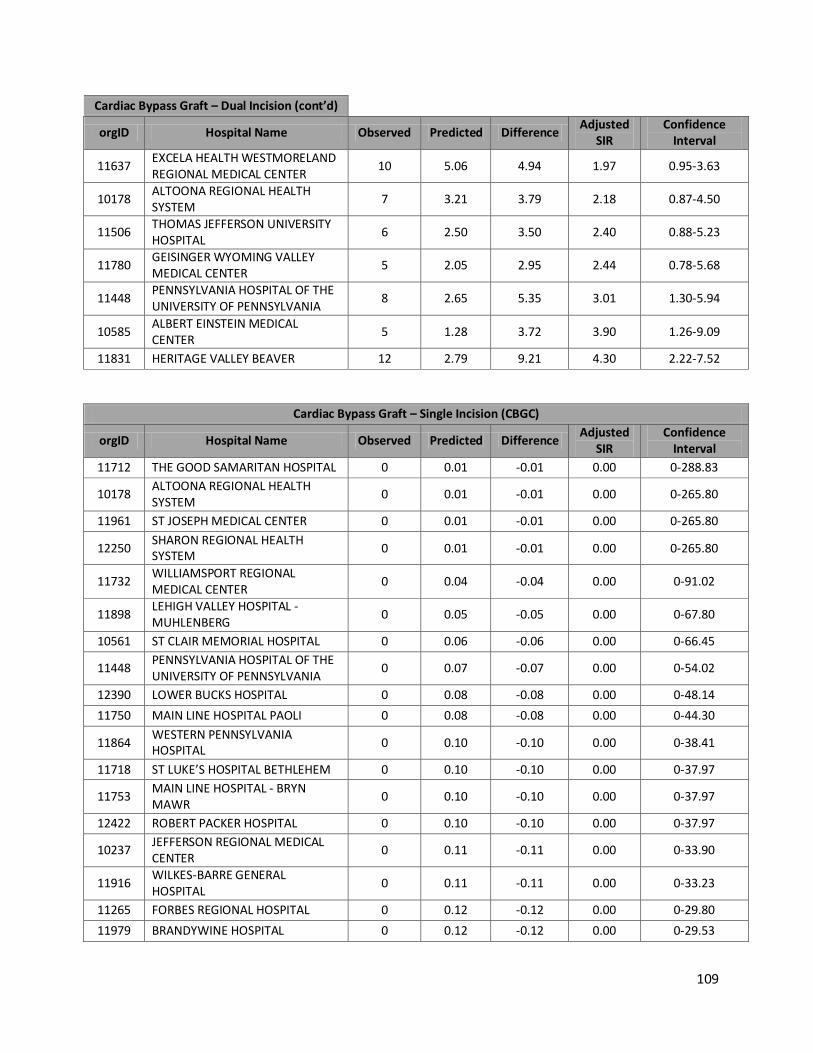
109
Cardiac Bypass Graft – Dual Incision (cont’d)
orgID Hospital Name Observed Predicted Difference Adjusted
SIR Confidence
Interval
11637 EXCELA HEALTH WESTMORELAND REGIONAL MEDICAL CENTER
10 5.06 4.94 1.97 0.95-3.63
10178 ALTOONA REGIONAL HEALTH SYSTEM
7 3.21 3.79 2.18 0.87-4.50
11506 THOMAS JEFFERSON UNIVERSITY HOSPITAL
6 2.50 3.50 2.40 0.88-5.23
11780 GEISINGER WYOMING VALLEY MEDICAL CENTER
5 2.05 2.95 2.44 0.78-5.68
11448 PENNSYLVANIA HOSPITAL OF THE UNIVERSITY OF PENNSYLVANIA
8 2.65 5.35 3.01 1.30-5.94
10585 ALBERT EINSTEIN MEDICAL CENTER
5 1.28 3.72 3.90 1.26-9.09
11831 HERITAGE VALLEY BEAVER 12 2.79 9.21 4.30 2.22-7.52
Cardiac Bypass Graft – Single Incision (CBGC)
orgID Hospital Name Observed Predicted Difference Adjusted
SIR Confidence
Interval
11712 THE GOOD SAMARITAN HOSPITAL 0 0.01 -0.01 0.00 0-288.83
10178 ALTOONA REGIONAL HEALTH SYSTEM
0 0.01 -0.01 0.00 0-265.80
11961 ST JOSEPH MEDICAL CENTER 0 0.01 -0.01 0.00 0-265.80
12250 SHARON REGIONAL HEALTH SYSTEM
0 0.01 -0.01 0.00 0-265.80
11732 WILLIAMSPORT REGIONAL MEDICAL CENTER
0 0.04 -0.04 0.00 0-91.02
11898 LEHIGH VALLEY HOSPITAL - MUHLENBERG
0 0.05 -0.05 0.00 0-67.80
10561 ST CLAIR MEMORIAL HOSPITAL 0 0.06 -0.06 0.00 0-66.45
11448 PENNSYLVANIA HOSPITAL OF THE UNIVERSITY OF PENNSYLVANIA
0 0.07 -0.07 0.00 0-54.02
12390 LOWER BUCKS HOSPITAL 0 0.08 -0.08 0.00 0-48.14
11750 MAIN LINE HOSPITAL PAOLI 0 0.08 -0.08 0.00 0-44.30
11864 WESTERN PENNSYLVANIA HOSPITAL
0 0.10 -0.10 0.00 0-38.41
11718 ST LUKE’S HOSPITAL BETHLEHEM 0 0.10 -0.10 0.00 0-37.97
11753 MAIN LINE HOSPITAL - BRYN MAWR
0 0.10 -0.10 0.00 0-37.97
12422 ROBERT PACKER HOSPITAL 0 0.10 -0.10 0.00 0-37.97
10237 JEFFERSON REGIONAL MEDICAL CENTER
0 0.11 -0.11 0.00 0-33.90
11916 WILKES-BARRE GENERAL HOSPITAL
0 0.11 -0.11 0.00 0-33.23
11265 FORBES REGIONAL HOSPITAL 0 0.12 -0.12 0.00 0-29.80
11979 BRANDYWINE HOSPITAL 0 0.12 -0.12 0.00 0-29.53

110
Cardiac Bypass Graft – Sgl Incision (cont’d)
orgID Hospital Name Observed Predicted Difference Adjusted
SIR Confidence
Interval
12382 TEMPLE UNIVERSITY HOSPITAL 0 0.12 -0.12 0.00 0-29.53
11747 MILTON S HERSHEY MEDICAL CENTER
0 0.16 -0.16 0.00 0-22.63
11780 GEISINGER WYOMING VALLEY MEDICAL CENTER
0 0.15 -0.15 0.00 0-24.89
11736 BUTLER MEMORIAL HOSPITAL 0 0.15 -0.15 0.00 0-24.52
10585 ALBERT EINSTEIN MEDICAL CENTER
0 0.16 -0.16 0.00 0-22.30
10280 CONEMAUGH VALLEY MEMORIAL HOSPITAL
0 0.17 -0.17 0.00 0-22.15
11506 THOMAS JEFFERSON UNIVERSITY HOSPITAL
0 0.18 -0.18 0.00 0-20.96
11683 MERCY FITZGERALD HOSPITAL 0 0.18 -0.18 0.00 0-20.70
11836 PHOENIXVILLE HOSPITAL COMPANY
0 0.18 -0.18 0.00 0-20.46
11437 HAHNEMANN UNIVERSITY HOSPITAL
0 0.21 -0.21 0.00 0-17.48
12375 READING HOSPITAL AND MEDICAL CENTER
0 0.21 -0.21 0.00 0-17.12
11460 THE WASHINGTON HOSPITAL 0 0.22 -0.22 0.00 0-16.78
12335 LANCASTER REGIONAL MEDICAL CENTER
0 0.23 -0.23 0.00 0-15.82
11838 ABINGTON MEMORIAL HOSPITAL 0 0.23 -0.23 0.00 0-15.78
10348 UPMC PRESBYTERIAN SHADYSIDE 0 0.35 -0.35 0.00 0-10.41
12533 REGIONAL HOSPITAL OF SCRANTON
0 0.41 -0.41 0.00 0-9.03
12387 HOLY SPIRIT HOSPITAL 0 0.45 -0.45 0.00 0-8.08
10648 ALLEGHENY GENERAL HOSPITAL 0 0.49 -0.49 0.00 0-7.50
11242 UPMC PASSAVANT 0 0.54 -0.54 0.00 0-6.75
11884 LEHIGH VALLEY HOSPITAL 0 0.64 -0.64 0.00 0-5.75
11388 ARIA HEALTH 0 0.66 -0.66 0.00 0-5.58
11831 HERITAGE VALLEY BEAVER 0 0.67 -0.67 0.00 0-5.48
11839 CROZER CHESTER MEDICAL CENTER
0 0.68 -0.68 0.00 0-5.37
10122 PINNACLE HEALTH HOSPITALS 0 0.85 -0.85 0.00 0-4.32
11914 COMMUNITY MEDICAL CENTER 1 1.94 -0.94 0.51 0.01-2.86
11770 MAIN LINE HOSPITAL LANKENAU 1 1.37 -0.37 0.73 0.01-4.07
10384 UPMC MERCY 1 1.07 -0.07 0.94 0.01-5.21
11725 UPMC HAMOT 3 1.99 1.01 1.51 0.30-4.41
10118 UPMC PRESBYTERIAN SHADYSIDE 1 0.62 0.38 1.62 0.02-8.99
12016 CHESTER COUNTY HOSPITAL 1 0.41 0.59 2.42 0.03-13.46
10183 LANCASTER GENERAL HOSPITAL 1 0.41 0.59 2.45 0.03-13.62
11775 GEISINGER MEDICAL CENTER 1 0.32 0.68 3.11 0.04-17.32

111
Cardiac Bypass Graft Sgl Incision (cont’d)
orgID Hospital Name Observed Predicted Difference Adjusted
SIR Confidence
Interval
11637 EXCELA HEALTH WESTMORELAND REGIONAL MEDICAL CENTER
1 0.23 0.77 4.32 0.06-24.05
11814 PENN PRESBYTERIAN MEDICAL CENTER
2 0.46 1.54 4.36 0.49-15.76
11885 ST MARY MEDICAL CENTER 1 0.16 0.84 6.08 0.08-33.82
11699 SAINT VINCENT MEDICAL CENTER 1 0.12 0.88 8.20 0.11-45.61
11606 DUBOIS REGIONAL MEDICAL CENTER
1 0.11 0.89 9.06 0.12-50.40
10219 HOSPITAL OF THE UNIVERSITY OF PENNSYLVANIA
2 0.19 1.81 10.72 1.20-38.70
10190 DOYLESTOWN HOSPITAL 1 0.07 0.93 14.49 0.19-80.64
Hip Prosthesis
orgID Hospital Name Observed Predicted Difference Adjusted
SIR Confidence
Interval
12097 LOCK HAVEN HOSPITAL 0 0.02 -0.02 0.00 0-242.92
12418 BROOKVILLE HOSPITAL 0 0.02 -0.02 0.00 0-206.07
11829 TYLER MEMORIAL HOSPITAL 0 0.05 -0.05 0.00 0-80.97
12365 SAINT CATHERINE MEDICAL CENTER
0 0.05 -0.05 0.00 0-80.97
11978 ROXBOROUGH HOSPITAL 0 0.06 -0.06 0.00 0-58.78
12717 TYRONE HOSPITAL 0 0.07 -0.07 0.00 0-55.75
11784 ST LUKE’S MINERS MEMORIAL HOSPITAL
0 0.09 -0.09 0.00 0-39.32
10306 CHILDREN’S HOSPITAL OF PHILADELPHIA
0 0.09 -0.09 0.00 0-38.77
11738 TITUSVILLE AREA HOSPITAL 0 0.12 -0.12 0.00 0-30.93
11680 UPMC BEDFORD 0 0.12 -0.12 0.00 0-30.75
11689 JERSEY SHORE HOSPITAL 0 0.13 -0.13 0.00 0-27.44
11902 HIGHLANDS HOSPITAL 0 0.18 -0.18 0.00 0-20.96
11942 SOUTHWEST REGIONAL MEDICAL CENTER
0 0.18 -0.18 0.00 0-20.82
11779 ELLWOOD CITY HOSPITAL 0 0.20 -0.20 0.00 0-18.01
11825 LEWISTOWN HOSPITAL 0 0.21 -0.21 0.00 0-17.78
11946 MERCY PHILADELPHIA HOSPITAL 0 0.23 -0.23 0.00 0-15.82
11830 PUNXSUTAWNEY AREA HOSPITAL 0 0.23 -0.23 0.00 0-15.68
11817 ENDLESS MOUNTAINS HEALTH SYSTEMS
0 0.27 -0.27 0.00 0-13.69
12552 EDGEWOOD SURGICAL HOSPITAL 0 0.27 -0.27 0.00 0-13.69
11688 SOLDIERS AND SAILORS MEMORIAL HOSPITAL
0 0.28 -0.28 0.00 0-13.28
12338 MARIAN COMMUNITY HOSPITAL 0 0.30 -0.30 0.00 0-12.03
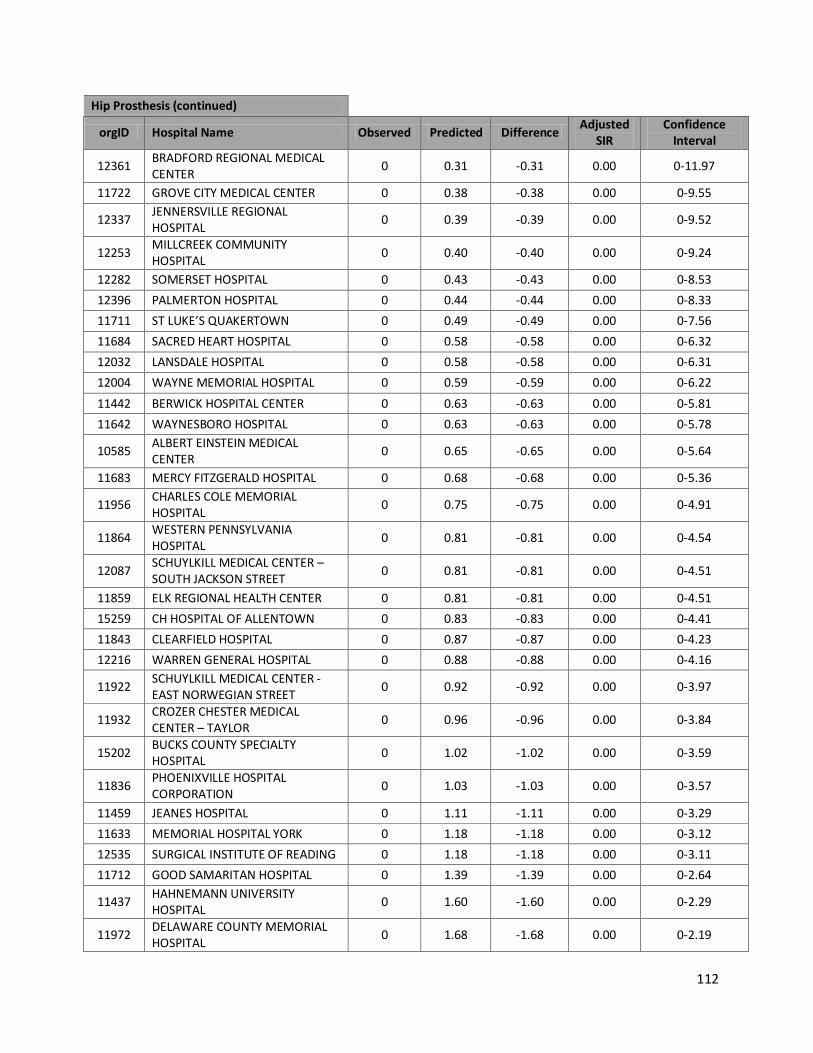
112
Hip Prosthesis (continued)
orgID Hospital Name Observed Predicted Difference Adjusted
SIR Confidence
Interval
12361 BRADFORD REGIONAL MEDICAL CENTER
0 0.31 -0.31 0.00 0-11.97
11722 GROVE CITY MEDICAL CENTER 0 0.38 -0.38 0.00 0-9.55
12337 JENNERSVILLE REGIONAL HOSPITAL
0 0.39 -0.39 0.00 0-9.52
12253 MILLCREEK COMMUNITY HOSPITAL
0 0.40 -0.40 0.00 0-9.24
12282 SOMERSET HOSPITAL 0 0.43 -0.43 0.00 0-8.53
12396 PALMERTON HOSPITAL 0 0.44 -0.44 0.00 0-8.33
11711 ST LUKE’S QUAKERTOWN 0 0.49 -0.49 0.00 0-7.56
11684 SACRED HEART HOSPITAL 0 0.58 -0.58 0.00 0-6.32
12032 LANSDALE HOSPITAL 0 0.58 -0.58 0.00 0-6.31
12004 WAYNE MEMORIAL HOSPITAL 0 0.59 -0.59 0.00 0-6.22
11442 BERWICK HOSPITAL CENTER 0 0.63 -0.63 0.00 0-5.81
11642 WAYNESBORO HOSPITAL 0 0.63 -0.63 0.00 0-5.78
10585 ALBERT EINSTEIN MEDICAL CENTER
0 0.65 -0.65 0.00 0-5.64
11683 MERCY FITZGERALD HOSPITAL 0 0.68 -0.68 0.00 0-5.36
11956 CHARLES COLE MEMORIAL HOSPITAL
0 0.75 -0.75 0.00 0-4.91
11864 WESTERN PENNSYLVANIA HOSPITAL
0 0.81 -0.81 0.00 0-4.54
12087 SCHUYLKILL MEDICAL CENTER – SOUTH JACKSON STREET
0 0.81 -0.81 0.00 0-4.51
11859 ELK REGIONAL HEALTH CENTER 0 0.81 -0.81 0.00 0-4.51
15259 CH HOSPITAL OF ALLENTOWN 0 0.83 -0.83 0.00 0-4.41
11843 CLEARFIELD HOSPITAL 0 0.87 -0.87 0.00 0-4.23
12216 WARREN GENERAL HOSPITAL 0 0.88 -0.88 0.00 0-4.16
11922 SCHUYLKILL MEDICAL CENTER - EAST NORWEGIAN STREET
0 0.92 -0.92 0.00 0-3.97
11932 CROZER CHESTER MEDICAL CENTER – TAYLOR
0 0.96 -0.96 0.00 0-3.84
15202 BUCKS COUNTY SPECIALTY HOSPITAL
0 1.02 -1.02 0.00 0-3.59
11836 PHOENIXVILLE HOSPITAL CORPORATION
0 1.03 -1.03 0.00 0-3.57
11459 JEANES HOSPITAL 0 1.11 -1.11 0.00 0-3.29
11633 MEMORIAL HOSPITAL YORK 0 1.18 -1.18 0.00 0-3.12
12535 SURGICAL INSTITUTE OF READING 0 1.18 -1.18 0.00 0-3.11
11712 GOOD SAMARITAN HOSPITAL 0 1.39 -1.39 0.00 0-2.64
11437 HAHNEMANN UNIVERSITY HOSPITAL
0 1.60 -1.60 0.00 0-2.29
11972 DELAWARE COUNTY MEMORIAL HOSPITAL
0 1.68 -1.68 0.00 0-2.19
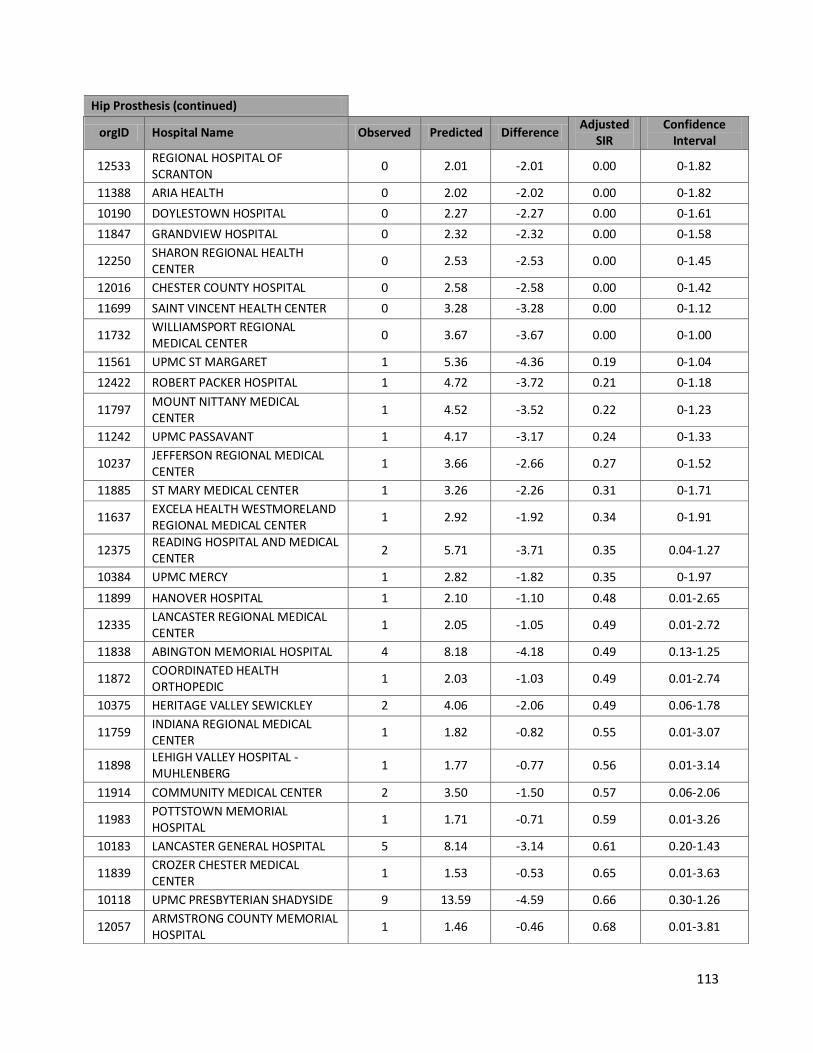
113
Hip Prosthesis (continued)
orgID Hospital Name Observed Predicted Difference Adjusted
SIR Confidence
Interval
12533 REGIONAL HOSPITAL OF SCRANTON
0 2.01 -2.01 0.00 0-1.82
11388 ARIA HEALTH 0 2.02 -2.02 0.00 0-1.82
10190 DOYLESTOWN HOSPITAL 0 2.27 -2.27 0.00 0-1.61
11847 GRANDVIEW HOSPITAL 0 2.32 -2.32 0.00 0-1.58
12250 SHARON REGIONAL HEALTH CENTER
0 2.53 -2.53 0.00 0-1.45
12016 CHESTER COUNTY HOSPITAL 0 2.58 -2.58 0.00 0-1.42
11699 SAINT VINCENT HEALTH CENTER 0 3.28 -3.28 0.00 0-1.12
11732 WILLIAMSPORT REGIONAL MEDICAL CENTER
0 3.67 -3.67 0.00 0-1.00
11561 UPMC ST MARGARET 1 5.36 -4.36 0.19 0-1.04
12422 ROBERT PACKER HOSPITAL 1 4.72 -3.72 0.21 0-1.18
11797 MOUNT NITTANY MEDICAL CENTER
1 4.52 -3.52 0.22 0-1.23
11242 UPMC PASSAVANT 1 4.17 -3.17 0.24 0-1.33
10237 JEFFERSON REGIONAL MEDICAL CENTER
1 3.66 -2.66 0.27 0-1.52
11885 ST MARY MEDICAL CENTER 1 3.26 -2.26 0.31 0-1.71
11637 EXCELA HEALTH WESTMORELAND REGIONAL MEDICAL CENTER
1 2.92 -1.92 0.34 0-1.91
12375 READING HOSPITAL AND MEDICAL CENTER
2 5.71 -3.71 0.35 0.04-1.27
10384 UPMC MERCY 1 2.82 -1.82 0.35 0-1.97
11899 HANOVER HOSPITAL 1 2.10 -1.10 0.48 0.01-2.65
12335 LANCASTER REGIONAL MEDICAL CENTER
1 2.05 -1.05 0.49 0.01-2.72
11838 ABINGTON MEMORIAL HOSPITAL 4 8.18 -4.18 0.49 0.13-1.25
11872 COORDINATED HEALTH ORTHOPEDIC
1 2.03 -1.03 0.49 0.01-2.74
10375 HERITAGE VALLEY SEWICKLEY 2 4.06 -2.06 0.49 0.06-1.78
11759 INDIANA REGIONAL MEDICAL CENTER
1 1.82 -0.82 0.55 0.01-3.07
11898 LEHIGH VALLEY HOSPITAL - MUHLENBERG
1 1.77 -0.77 0.56 0.01-3.14
11914 COMMUNITY MEDICAL CENTER 2 3.50 -1.50 0.57 0.06-2.06
11983 POTTSTOWN MEMORIAL HOSPITAL
1 1.71 -0.71 0.59 0.01-3.26
10183 LANCASTER GENERAL HOSPITAL 5 8.14 -3.14 0.61 0.20-1.43
11839 CROZER CHESTER MEDICAL CENTER
1 1.53 -0.53 0.65 0.01-3.63
10118 UPMC PRESBYTERIAN SHADYSIDE 9 13.59 -4.59 0.66 0.30-1.26
12057 ARMSTRONG COUNTY MEMORIAL HOSPITAL
1 1.46 -0.46 0.68 0.01-3.81
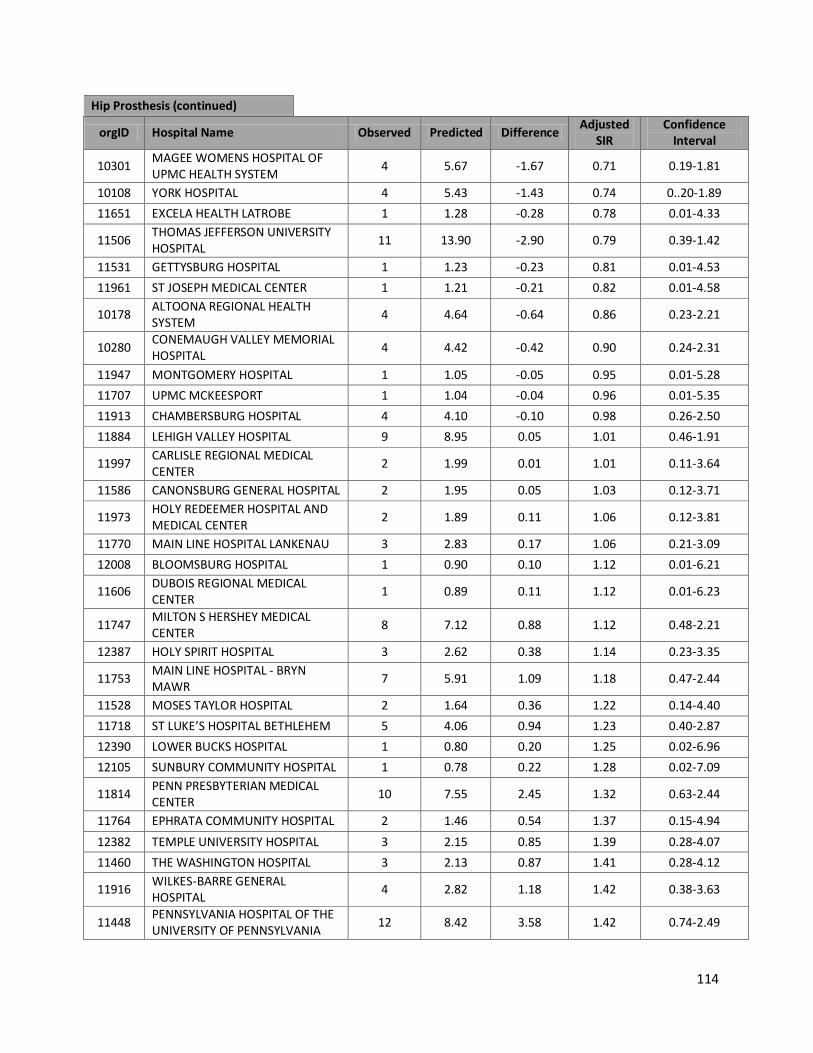
114
Hip Prosthesis (continued)
orgID Hospital Name Observed Predicted Difference Adjusted
SIR Confidence
Interval
10301 MAGEE WOMENS HOSPITAL OF UPMC HEALTH SYSTEM
4 5.67 -1.67 0.71 0.19-1.81
10108 YORK HOSPITAL 4 5.43 -1.43 0.74 0..20-1.89
11651 EXCELA HEALTH LATROBE 1 1.28 -0.28 0.78 0.01-4.33
11506 THOMAS JEFFERSON UNIVERSITY HOSPITAL
11 13.90 -2.90 0.79 0.39-1.42
11531 GETTYSBURG HOSPITAL 1 1.23 -0.23 0.81 0.01-4.53
11961 ST JOSEPH MEDICAL CENTER 1 1.21 -0.21 0.82 0.01-4.58
10178 ALTOONA REGIONAL HEALTH SYSTEM
4 4.64 -0.64 0.86 0.23-2.21
10280 CONEMAUGH VALLEY MEMORIAL HOSPITAL
4 4.42 -0.42 0.90 0.24-2.31
11947 MONTGOMERY HOSPITAL 1 1.05 -0.05 0.95 0.01-5.28
11707 UPMC MCKEESPORT 1 1.04 -0.04 0.96 0.01-5.35
11913 CHAMBERSBURG HOSPITAL 4 4.10 -0.10 0.98 0.26-2.50
11884 LEHIGH VALLEY HOSPITAL 9 8.95 0.05 1.01 0.46-1.91
11997 CARLISLE REGIONAL MEDICAL CENTER
2 1.99 0.01 1.01 0.11-3.64
11586 CANONSBURG GENERAL HOSPITAL 2 1.95 0.05 1.03 0.12-3.71
11973 HOLY REDEEMER HOSPITAL AND MEDICAL CENTER
2 1.89 0.11 1.06 0.12-3.81
11770 MAIN LINE HOSPITAL LANKENAU 3 2.83 0.17 1.06 0.21-3.09
12008 BLOOMSBURG HOSPITAL 1 0.90 0.10 1.12 0.01-6.21
11606 DUBOIS REGIONAL MEDICAL CENTER
1 0.89 0.11 1.12 0.01-6.23
11747 MILTON S HERSHEY MEDICAL CENTER
8 7.12 0.88 1.12 0.48-2.21
12387 HOLY SPIRIT HOSPITAL 3 2.62 0.38 1.14 0.23-3.35
11753 MAIN LINE HOSPITAL - BRYN MAWR
7 5.91 1.09 1.18 0.47-2.44
11528 MOSES TAYLOR HOSPITAL 2 1.64 0.36 1.22 0.14-4.40
11718 ST LUKE’S HOSPITAL BETHLEHEM 5 4.06 0.94 1.23 0.40-2.87
12390 LOWER BUCKS HOSPITAL 1 0.80 0.20 1.25 0.02-6.96
12105 SUNBURY COMMUNITY HOSPITAL 1 0.78 0.22 1.28 0.02-7.09
11814 PENN PRESBYTERIAN MEDICAL CENTER
10 7.55 2.45 1.32 0.63-2.44
11764 EPHRATA COMMUNITY HOSPITAL 2 1.46 0.54 1.37 0.15-4.94
12382 TEMPLE UNIVERSITY HOSPITAL 3 2.15 0.85 1.39 0.28-4.07
11460 THE WASHINGTON HOSPITAL 3 2.13 0.87 1.41 0.28-4.12
11916 WILKES-BARRE GENERAL HOSPITAL
4 2.82 1.18 1.42 0.38-3.63
11448 PENNSYLVANIA HOSPITAL OF THE UNIVERSITY OF PENNSYLVANIA
12 8.42 3.58 1.42 0.74-2.49

115
Hip Prosthesis (continued)
OrgID Hospital Name Observed Predicted Difference Adjusted
SIR Confidence
Interval
11654 CLARION HOSPITAL 1 0.70 0.30 1.44 0.02-8.00
11831 HERITAGE VALLEY BEAVER 4 2.75 1.25 1.45 0.39-3.72
11837 UPMC NORTHWEST 1 0.69 0.31 1.46 0.02-8.11
11701 EVANGELICAL COMMUNITY HOSPITAL
3 2.05 0.95 1.46 0.29-4.28
11675 UPMC HORIZON 3 2.00 1.00 1.50 0.30-4.38
12500 ALBERT EINSTEIN MEDICAL CENTER – ELKINS PARK
2 1.23 0.77 1.62 0.18-5.85
11265 FORBES REGIONAL HOSPITAL 5 3.07 1.93 1.63 0.52-3.80
10122 PINNACLE HEALTH HOSPITALS 21 12.83 8.17 1.64 1.01-2.50
11736 BUTLER MEMORIAL HOSPITAL 4 2.44 1.56 1.64 0.44-4.20
11731 RIDDLE MEMORIAL HOSPITAL 9 5.39 3.61 1.67 0.76-3.17
10648 ALLEGHENY GENERAL HOSPITAL 12 7.16 4.84 1.68 0.87-2.93
12017 THOMAS JEFFERSON UNIVERSITY HOSPITAL - METHODIST
1 0.57 0.44 1.77 0.02-9.85
11725 UPMC HAMOT 8 4.46 3.54 1.79 0.77-3.54
11954 JAMESON MEMORIAL HOSPITAL 2 1.11 0.89 1.81 0.20-6.53
12571 HEART OF LANCASTER REGIONAL MEDICAL CENTER
1 0.53 0.47 1.88 0.02-10.47
11842 ALLEGHENY VALLEY HOSPITAL 3 1.55 1.45 1.93 0.39-5.65
11750 MAIN LINE HOSPITAL PAOLI 6 3.08 2.92 1.95 0.71-4.24
11775 GEISINGER MEDICAL CENTER 12 5.90 6.10 2.03 1.05-3.55
11780 GEISINGER WYOMING VALLEY 7 3.38 3.62 2.07 0.83-4.27
11919 NAZARETH HOSPITAL 4 1.86 2.14 2.15 0.58-5.49
12298 OHIO VALLEY GENERAL HOSPITAL 2 0.93 1.07 2.15 0.24-7.77
10561 ST CLAIR MEMORIAL HOSPITAL 8 3.67 4.33 2.18 0.94-4.19
10348 UPMC PRESBYTERIAN SHADYSIDE 4 1.82 2.18 2.19 0.59-5.62
12133 SHAMOKIN AREA COMMUNITY HOSPITAL
1 0.45 0.55 2.24 0.03-12.48
11929 EASTON HOSPITAL 4 1.75 2.25 2.29 0.62-5.86
11069 MONONGAHELA VALLEY HOSPITAL 6 2.25 3.75 2.67 0.97-5.81
10441 UNIONTOWN HOSPITAL 7 2.52 4.48 2.78 1.11-5.73
11952 MERCY SUBURBAN HOSPITAL - NORRISTOWN
2 0.70 1.30 2.86 0.32-10.31
12241 GNADEN HUETTEN MEMORIAL HOSPITAL
1 0.33 0.67 3.06 0.04-17.00
11583 MEADVILLE MEDICAL CENTER 7 2.28 4.72 3.07 1.23-6.32
11979 BRANDYWINE HOSPITAL 3 0.91 2.09 3.29 0.66-9.63
10219 HOSPITAL OF THE UNIVERSITY OF PENNSYLVANIA
2 0.51 1.49 3.92 0.44-14.14
11878 HAZLETON GENERAL HOSPITAL 4 0.93 3.07 4.31 1.16-11.03
12304 CHESTNUT HILL HOSPITAL 3 0.54 2.46 5.58 1.12-16.30

116
Hip Prosthesis (continued)
orgID Hospital Name Observe Predicted Difference Adjusted
SIR Confidence
Interval
11772 POCONO MEDICAL CENTER 5 0.80 4.20 6.25 2.02-14.59
12295 MINERS MEDICAL CENTER 1 0.12 0.88 8.01 0.10-44.58
11907 NASON HOSPITAL 2 0.21 1.79 9.62 1.08-34.73
12348 EASTERN REGIONAL MEDICAL CENTER
1 0.09 0.91 10.57 0.14-58.81
11639 EXCELA HEALTH FRICK HOSPITAL 1 0.09 0.91 11.14 0.15-61.96
11851 CROZER CHESTER MEDICAL CENTER - SPRINGFIELD
1 0.08 0.92 12.90 0.17-71.79
12031 WINDBER HOSPITAL 1 0.06 0.94 16.03 0.21-89.16
11557 MID-VALLEY HOSPITAL 1 0.02 0.98 66.23 0.87-368.47
Knee Prosthesis
orgID Hospital Name Observed Predicted Difference Adjusted
SIR Confidence
Interval
12487 WESTFIELD HOSPITAL 0 0.01 -0.01 0.00 0-254.73
12717 TYRONE HOSPITAL 0 0.02 -0.02 0.00 0-203.78
12404 BARNES-KASSON COUNTY HOSPITAL
0 0.03 -0.03 0.00 0-117.95
11851 CROZER CHESTER MEDICAL CENTER - SPRINGFIELD
0 0.04 -0.04 0.00 0-89.47
12097 LOCK HAVEN HOSPITAL 0 0.04 -0.04 0.00 0-83.18
12295 MINERS MEDICAL CENTER 0 0.06 -0.06 0.00 0-58.97
10585 ALBERT EINSTEIN MEDICAL CENTER
0 0.07 -0.07 0.00 0-54.99
12365 ST CATHERINE MEDICAL CENTER 0 0.08 -0.08 0.00 0-44.46
11829 TYLER MEMORIAL HOSPITAL 0 0.08 -0.08 0.00 0-44.30
12337 JENNERSVILLE REGIONAL HOSPITAL
0 0.09 -0.09 0.00 0-39.32
12361 BRADFORD REGIONAL MEDICAL CENTER
0 0.10 -0.10 0.00 0-35.58
11738 TITUSVILLE AREA HOSPITAL 0 0.10 -0.10 0.00 0-35.10
12418 BROOKVILLE HOSPITAL 0 0.14 -0.14 0.00 0-27.15
11902 HIGHLANDS HOSPITAL 0 0.14 -0.14 0.00 0-26.64
11689 JERSEY SHORE HOSPITAL 0 0.15 -0.15 0.00 0-24.24
11942 SOUTHWEST REGIONAL MEDICAL CENTER
0 0.15 -0.15 0.00 0-24.24
12031 WINDBER HOSPITAL 0 0.15 -0.15 0.00 0-23.94
11639 EXCELA HEALTH FRICK 0 0.15 -0.15 0.00 0-23.76
11946 MERCY PHILADELPHIA HOSPITAL 0 0.19 -0.19 0.00 0-19,16
12304 CHESTNUT HILL HOSPITAL 0 0.25 -0.25 0.00 0-14.78
11978 ROXBOROUGH MEMORIAL HOSPITAL
0 0.26 -0.26 0.00 0-13.92

117
Knee Prosthesis (continued)
orgID Hospital Name Observed Predicted Difference Adjusted
SIR Confidence
Interval
11779 ELLWOOD CITY HOSPITAL 0 0.31 -0.31 0.00 0-11.99
11722 GROVE CITY MEDICAL CENTER 0 0.35 -0.35 0.00 0-10.37
11907 NASON HOSPITAL 0 0.37 -0.37 0.00 0-9.96
11830 PUNXSUTAWNEY AREA HOSPITAL 0 0.40 -0.40 0.00 0-9.07
11843 CLEARFIELD HOSPITAL 0 0.43 -0.43 0.00 0-8.50
12253 MILLCREEK COMMUNITY HOSPITAL
0 0.43 -0.43 0.00 0-8.47
12032 LANSDALE HOSPITAL 0 0.45 -0.45 0.00 0-8.22
11642 WAYNESBORO HOSPITAL 0 0.46 -0.46 0.00 0-8.05
12282 SOMERSET HOSPITAL 0 0.50 -0.50 0.00 0-7.41
12396 PALMERTON HOSPITAL 0 0.52 -0.52 0.00 0-7.03
12241 GNADEN HUETTEN MEMORIAL HOSPITAL
0 0.53 -0.53 0.00 0-6.89
11772 POCONO MEDICAL CENTER 0 0.54 -0.54 0.00 0-6.80
12133 SHAMOKIN AREA COMMUNITY HOSPITAL
0 0.56 -0.56 0.00 0-6.56
11878 HAZLETON GENERAL HOSPITAL 0 0.56 -0.56 0.00 0-6.53
11825 LEWISTOWN HOSPITAL 0 0.57 -0.57 0.00 0-6.46
11442 BERWICK HOSPITAL CENTER 0 0.57 -0.57 0.00 0-6.42
12338 MARIAN COMMUNITY HOSPITAL 0 0.62 -0.62 0.00 0-5.91
11817 ENDLESS MOUNTAINS HEALTH SYSTEMS
0 0.65 -0.65 0.00 0-5.65
11837 UPMC NORTHWEST SENECA 0 0.70 -0.70 0.00 0-5.22
11654 CLARION HOSPITAL 0 0.71 -0.71 0.00 0-5.18
15202 BUCKS COUNTY SPECIALTY HOSPITAL
0 0.71 -0.71 0.00 0-5.18
11932 CROZER CHESTER MEDICAL CENTER – TAYLOR
0 0.73 -0.73 0.00 0-5.05
12552 EDGEWOOD SURGICAL HOSPITAL 0 0.82 -0.82 0.00 0-4.46
12216 WARREN GENERAL HOSPITAL 0 0.86 -0.86 0.00 0-4.25
11859 ELK REGIONAL HEALTH CENTER 0 0.98 -0.98 0.00 0-3.75
11437 HAHNEMANN UNIVERSITY HOSPITAL
0 0.99 -0.98 0.00 0-3.71
12008 BLOOMSBURG HOSPITAL 0 1.20 -1.20 0.00 0-3.06
12500 ALBERT EINSTEIN MEDICAL CENTER –ELKINS PARK
0 1.26 -1.26 0.00 0-2.91
11651 EXCELA HEALTH LATROBE 0 1.29 -1.29 0.00 0-2.84
11459 JEANES HOSPITAL 0 1.43 -1.43 0.00 0-2.57
12057 ARMSTRONG COUNTY MEMORIAL HOSPITAL
0 1.79 -1.79 0.00 0-2.05
11759 INDIANA REGIONAL MEDICAL CENTER
0 2.02 -2.02 0.00 0-1.81
12535 SURGICAL INSTITUTE OF READING 0 2.13 -2.13 0.00 0-1.72

118
Knee Prosthesis (continued)
orgID Hospital Name Observed Predicted Difference Adjusted
SIR Confidence
Interval
11712 GOOD SAMARITAN HOSPITAL 0 2.35 -2.35 0.00 0-1.56
11528 MOSES TAYLOR HOSPITAL 0 2.38 -2.38 0.00 0-1.54
11637 EXCELA HEALTH WESTMORELAND 0 2.91 -2.91 0.00 0-1.26
12422 ROBERT PACKER HOSPITAL 0 3.30 -3.30 0.00 0-1.11
10375 HERITAGE VALLEY SEWICKLEY 1 5.75 -4.75 0.17 0-0.97
11770 MAIN LINE HOSPITAL LANKENAU 1 3.53 -2.53 0.28 0-1.58
11916 WILKES BARRE GENERAL HOSPITAL 1 3.33 -2.33 0.30 0-1.67
11699 SAINT VINCENT HEALTH CENTER 1 3.29 -2.29 0.30 0-1.69
11973 HOLY REDEEMER HOSPITAL & MEDICAL CENTER
1 3.15 -2.15 0.32 0-1.77
12375 READING HOSPITAL AND MEDICAL CENTER
2 5.67 -3.67 0.36 0.04-1.27
11736 BUTLER MEMORIAL HOSPITAL 1 2.65 -1.65 0.38 0-2.10
10301 MAGEE WOMENS HOSPITAL OF UPMC
2 5.27 -3.27 0.38 0.04-1.37
10280 CONEMAUGH VALLEY MEMORIAL HOSPITAL
2 5.21 -3.21 0.38 0.04-1.39
15259 CH HOSPITAL OF ALLENTOWN 1 2.49 -1.49 0.40 0.01-2.24
10190 DOYLESTOWN HOSPITAL 1 2.42 -1.42 0.41 0.01-2.30
12387 HOLY SPIRIT HOSPITAL 1 2.30 -1.30 0.43 0.01-2.42
12016 CHESTER COUNTY HOSPITAL 1 2.12 -1.12 0.47 0.01-2.62
10108 YORK HOSPITAL 2 4.14 -2.14 0.48 0.05-1.74
11242 UPMC PASSAVANT 2 4.06 -2.06 0.49 0.06-1.78
11732 WILLIAMSPORT HOSPITAL AND MEDICAL CENTER
3 5.67 -2.67 0.53 0.11-1.55
11954 JAMESON MEMORIAL HOSPITAL 1 1.78 -0.78 0.56 0.01-3.12
10118 UPMC PRESBYTERIAN SHADYSIDE 6 10.07 -4.07 0.60 0.22-1.30
11919 NAZARETH HOSPITAL 1 1.56 -0.56 0.64 0.01-3.57
10178 ALTOONA REGIONAL HEALTH SYSTEM
3 4.65 -1.65 0.65 0.13-1.89
10183 LANCASTER GENERAL HOSPITAL 7 10.45 -3.45 0.67 0.27-1.38
11838 ABINGTON MEMORIAL HOSPITAL 4 5.88 -1.88 0.68 0.18-1.74
10648 ALLEGHENY GENERAL HOSPITAL 5 7.33 -2.33 0.68 0.22-1.59
12382 TEMPLE UNIVERSITY HOSPITAL 2 2.92 -0.92 0.68 0.08-2.47
11561 UPMC ST MARGARET 5 7.19 -2.19 0.70 0.22-1.62
11531 GETTYSBURG HOSPITAL 1 1.37 -0.37 0.73 0.01-4.07
11265 FORBES REGIONAL HOSPITAL 2 2.64 -0.64 0.76 0.09-2.74
11448 PENNSYLVANIA HOSPITAL OF THE UNIVERSITY OF PENNSYLVANIA
8 10.42 -2.42 0.77 0.33-1.51
11836 PHOENIXVILLE HOSPITAL COMPANY
1 1.23 -0.23 0.81 0.01-4.51
11961 ST JOSEPH MEDICAL CENTER 1 1.22 -0.22 0.82 0.01-4.55

119
Knee Prosthesis (continued)
orgID Hospital Name Observed Predicted Difference Adjusted
SIR Confidence
Interval
11460 THE WASHINGTON HOSPITAL 2 2.43 -0.43 0.82 0.09-2.98
11780 GEISINGER WYOMING VALLEY MEDICAL CENTER
2 2.34 -0.34 0.85 0.10-3.08
11847 GRAND VIEW HOSPITAL 2 2.34 -0.34 0.86 0.10-3.09
11753 MAIN LINE HOSPITAL BRYN MAWR 6 6.97 -0.97 0.86 0.31-1.87
12250 SHARON REGIONAL HEALTH SYSTEM
2 2.32 -0.32 0.86 0.10-3.11
11784 ST LUKE’S MINERS MEMORIAL HOSPITAL
1 1.12 -0.12 0.89 0.01-4.96
11884 LEHIGH VALLEY HOSPITAL 8 8.87 -0.87 0.90 0.39-1.78
12533 REGIONAL HOSPITAL OF SCRANTON
3 3.25 -0.25 0.92 0.19-2.70
12335 LANCASTER REGIONAL MEDICAL CENTER
2 2.02 -0.02 0.99 0.11-3.57
11864 WESTERN PENNSYLVANIA HOSPITAL
1 0.94 0.06 1.06 0.01-5.89
12298 OHIO VALLEY GENERAL HOSPITAL 1 0.94 0.06 1.07 0.01-5.93
11983 POTTSTOWN MEMORIAL MEDICAL CENTER
3 2.77 0.23 1.08 0.22-3.17
10561 ST CLAIR MEMORIAL HOSPITAL 5 4.50 0.50 1.11 0.36-2.59
11914 COMMUNITY MEDICAL CENTER 5 4.48 0.52 1.12 0.36-2.60
11885 ST MARY MEDICAL CENTER 4 3.52 0.48 1.14 0.31-2.91
11872 COORDINATED HEALTH ORTHOPEDIC
5 4.37 0.63 1.15 0.37-2.67
11947 MONTGOMERY HOSPITAL 2 1.71 0.29 1.17 0.13-4.21
10122 PINACLE HEALTH HOSPITALS 17 14.51 2.49 1.17 0.68-1.88
11814 PENN PRESBYTERIAN MEDICAL CENTER
8 6.77 1.23 1.18 0.51-2.33
11718 ST LUKE’S HOSPITAL BETHLEHEM 4 3.36 0.64 1.19 0.32-3.05
11839 CROZER CHESTER MEDICAL CENTER
2 1.67 0.33 1.20 0.13-4.32
11725 UPMC HAMOT 5 4.08 0.92 1.23 0.39-2.86
11583 MEADVILLE MEDICAL CENTER 6 4.74 1.26 1.27 0.46-2.76
10237 JEFFERSON REGIONAL MEDICAL CENTER
7 5.52 1.48 1.27 0.51-2.61
11997 CARLISLE REGIONAL MEDICAL CENTER
3 2.36 0.64 1.27 0.26-3.72
12087 SCHUYLKILL MEDICAL CENTER – SOUTH JACKSON STREET
1 0.77 0.23 1.29 0.02-7.19
11633 MEMORIAL HOSPITAL YORK 2 1.52 0.48 1.32 0.15-4.75
11747 MILTON S HERSHEY MEDICAL CENTER
9 6.66 2.34 1.36 0.62-2.56
11922 SCHUYLKILL MEDICAL CENTER – EAST NORWEGIAN STREET
1 0.73 0.27 1.36 0.02-7.57
11731 RIDDLE MEMORIAL HOSPITAL 7 4.90 2.10 1.43 0.57-2.94
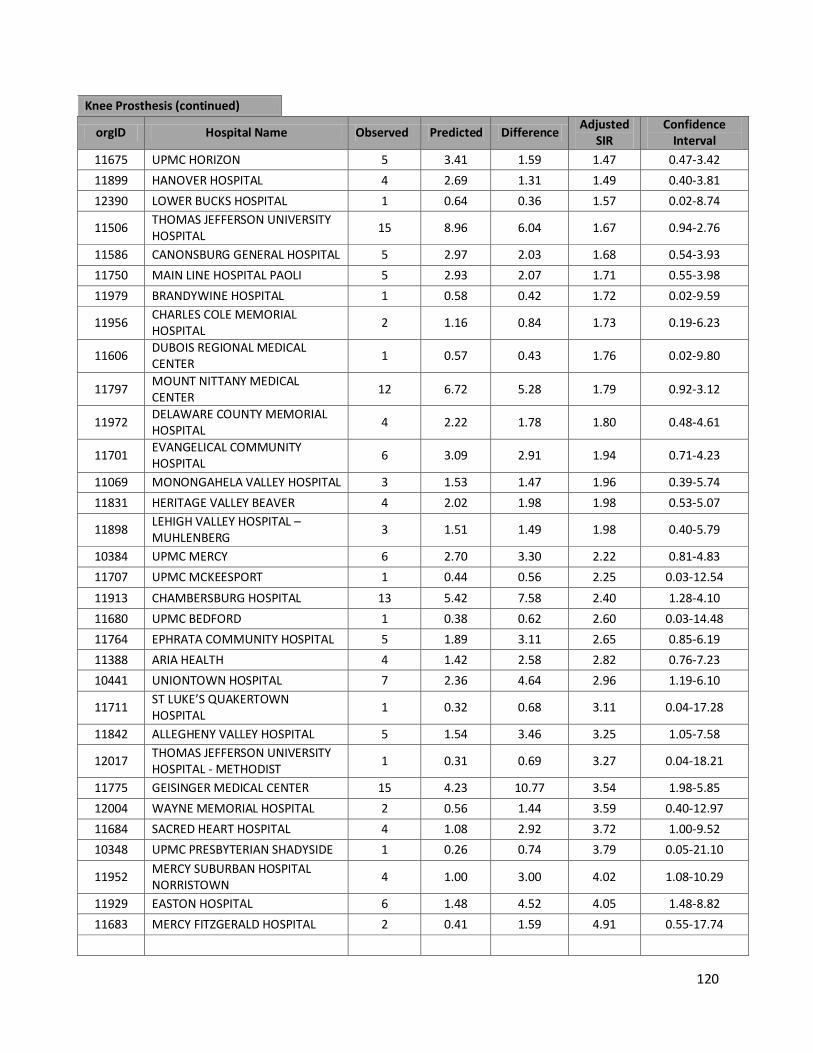
120
Knee Prosthesis (continued)
orgID Hospital Name Observed Predicted Difference Adjusted
SIR Confidence
Interval
11675 UPMC HORIZON 5 3.41 1.59 1.47 0.47-3.42
11899 HANOVER HOSPITAL 4 2.69 1.31 1.49 0.40-3.81
12390 LOWER BUCKS HOSPITAL 1 0.64 0.36 1.57 0.02-8.74
11506 THOMAS JEFFERSON UNIVERSITY HOSPITAL
15 8.96 6.04 1.67 0.94-2.76
11586 CANONSBURG GENERAL HOSPITAL 5 2.97 2.03 1.68 0.54-3.93
11750 MAIN LINE HOSPITAL PAOLI 5 2.93 2.07 1.71 0.55-3.98
11979 BRANDYWINE HOSPITAL 1 0.58 0.42 1.72 0.02-9.59
11956 CHARLES COLE MEMORIAL HOSPITAL
2 1.16 0.84 1.73 0.19-6.23
11606 DUBOIS REGIONAL MEDICAL CENTER
1 0.57 0.43 1.76 0.02-9.80
11797 MOUNT NITTANY MEDICAL CENTER
12 6.72 5.28 1.79 0.92-3.12
11972 DELAWARE COUNTY MEMORIAL HOSPITAL
4 2.22 1.78 1.80 0.48-4.61
11701 EVANGELICAL COMMUNITY HOSPITAL
6 3.09 2.91 1.94 0.71-4.23
11069 MONONGAHELA VALLEY HOSPITAL 3 1.53 1.47 1.96 0.39-5.74
11831 HERITAGE VALLEY BEAVER 4 2.02 1.98 1.98 0.53-5.07
11898 LEHIGH VALLEY HOSPITAL – MUHLENBERG
3 1.51 1.49 1.98 0.40-5.79
10384 UPMC MERCY 6 2.70 3.30 2.22 0.81-4.83
11707 UPMC MCKEESPORT 1 0.44 0.56 2.25 0.03-12.54
11913 CHAMBERSBURG HOSPITAL 13 5.42 7.58 2.40 1.28-4.10
11680 UPMC BEDFORD 1 0.38 0.62 2.60 0.03-14.48
11764 EPHRATA COMMUNITY HOSPITAL 5 1.89 3.11 2.65 0.85-6.19
11388 ARIA HEALTH 4 1.42 2.58 2.82 0.76-7.23
10441 UNIONTOWN HOSPITAL 7 2.36 4.64 2.96 1.19-6.10
11711 ST LUKE’S QUAKERTOWN HOSPITAL
1 0.32 0.68 3.11 0.04-17.28
11842 ALLEGHENY VALLEY HOSPITAL 5 1.54 3.46 3.25 1.05-7.58
12017 THOMAS JEFFERSON UNIVERSITY HOSPITAL - METHODIST
1 0.31 0.69 3.27 0.04-18.21
11775 GEISINGER MEDICAL CENTER 15 4.23 10.77 3.54 1.98-5.85
12004 WAYNE MEMORIAL HOSPITAL 2 0.56 1.44 3.59 0.40-12.97
11684 SACRED HEART HOSPITAL 4 1.08 2.92 3.72 1.00-9.52
10348 UPMC PRESBYTERIAN SHADYSIDE 1 0.26 0.74 3.79 0.05-21.10
11952 MERCY SUBURBAN HOSPITAL NORRISTOWN
4 1.00 3.00 4.02 1.08-10.29
11929 EASTON HOSPITAL 6 1.48 4.52 4.05 1.48-8.82
11683 MERCY FITZGERALD HOSPITAL 2 0.41 1.59 4.91 0.55-17.74
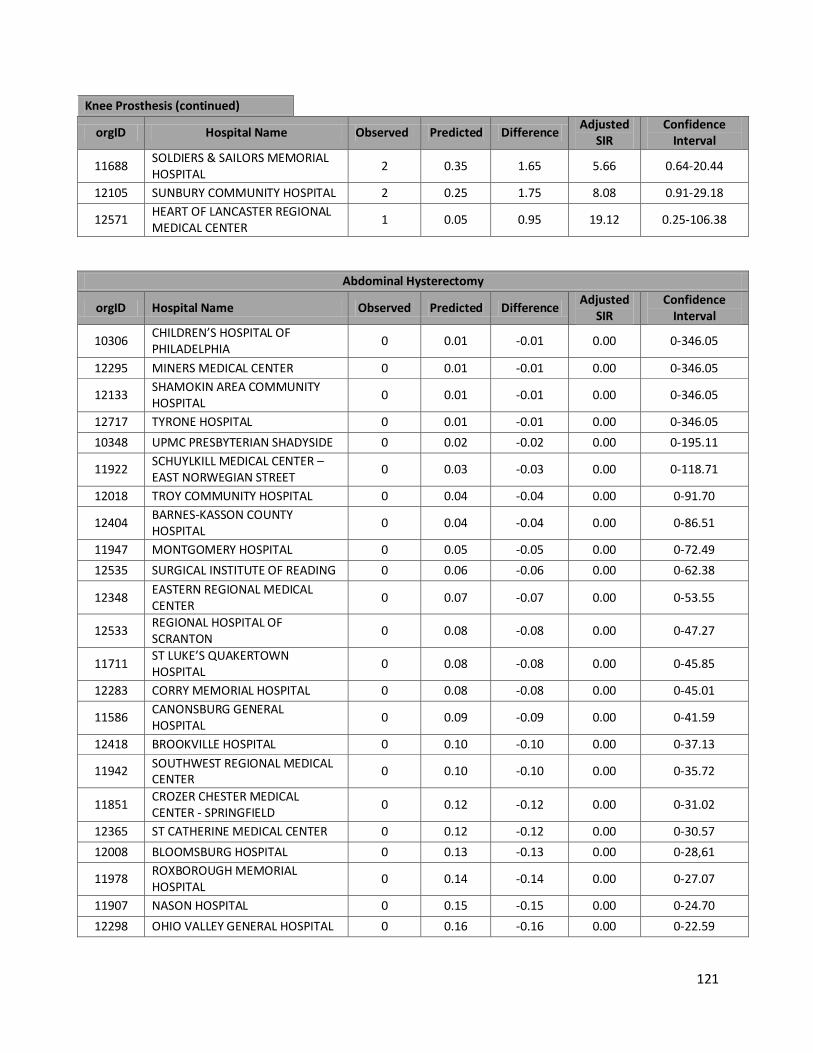
121
Knee Prosthesis (continued)
orgID Hospital Name Observed Predicted Difference Adjusted
SIR Confidence
Interval
11688 SOLDIERS & SAILORS MEMORIAL HOSPITAL
2 0.35 1.65 5.66 0.64-20.44
12105 SUNBURY COMMUNITY HOSPITAL 2 0.25 1.75 8.08 0.91-29.18
12571 HEART OF LANCASTER REGIONAL MEDICAL CENTER
1 0.05 0.95 19.12 0.25-106.38
Abdominal Hysterectomy
orgID Hospital Name Observed Predicted Difference Adjusted
SIR Confidence
Interval
10306 CHILDREN’S HOSPITAL OF PHILADELPHIA
0 0.01 -0.01 0.00 0-346.05
12295 MINERS MEDICAL CENTER 0 0.01 -0.01 0.00 0-346.05
12133 SHAMOKIN AREA COMMUNITY HOSPITAL
0 0.01 -0.01 0.00 0-346.05
12717 TYRONE HOSPITAL 0 0.01 -0.01 0.00 0-346.05
10348 UPMC PRESBYTERIAN SHADYSIDE 0 0.02 -0.02 0.00 0-195.11
11922 SCHUYLKILL MEDICAL CENTER – EAST NORWEGIAN STREET
0 0.03 -0.03 0.00 0-118.71
12018 TROY COMMUNITY HOSPITAL 0 0.04 -0.04 0.00 0-91.70
12404 BARNES-KASSON COUNTY HOSPITAL
0 0.04 -0.04 0.00 0-86.51
11947 MONTGOMERY HOSPITAL 0 0.05 -0.05 0.00 0-72.49
12535 SURGICAL INSTITUTE OF READING 0 0.06 -0.06 0.00 0-62.38
12348 EASTERN REGIONAL MEDICAL CENTER
0 0.07 -0.07 0.00 0-53.55
12533 REGIONAL HOSPITAL OF SCRANTON
0 0.08 -0.08 0.00 0-47.27
11711 ST LUKE’S QUAKERTOWN HOSPITAL
0 0.08 -0.08 0.00 0-45.85
12283 CORRY MEMORIAL HOSPITAL 0 0.08 -0.08 0.00 0-45.01
11586 CANONSBURG GENERAL HOSPITAL
0 0.09 -0.09 0.00 0-41.59
12418 BROOKVILLE HOSPITAL 0 0.10 -0.10 0.00 0-37.13
11942 SOUTHWEST REGIONAL MEDICAL CENTER
0 0.10 -0.10 0.00 0-35.72
11851 CROZER CHESTER MEDICAL CENTER - SPRINGFIELD
0 0.12 -0.12 0.00 0-31.02
12365 ST CATHERINE MEDICAL CENTER 0 0.12 -0.12 0.00 0-30.57
12008 BLOOMSBURG HOSPITAL 0 0.13 -0.13 0.00 0-28,61
11978 ROXBOROUGH MEMORIAL HOSPITAL
0 0.14 -0.14 0.00 0-27.07
11907 NASON HOSPITAL 0 0.15 -0.15 0.00 0-24.70
12298 OHIO VALLEY GENERAL HOSPITAL 0 0.16 -0.16 0.00 0-22.59

122
Abd hysterectomy (continued)
orgID Hospital Name Observed Predicted Difference Adjusted
SIR Confidence
Interval
11814 PENN PRESBYTERIAN MEDICAL CENTER
0 0.17 -0.17 0.00 0-21.54
11830 PUNXSUTAWNEY AREA HOSPITAL 0 0.17 -0.17 0.00 0-21.50
12017 THOMAS JEFFERSON UNIVERSITY HOSPITAL - METHODIST
0 0.22 -0.22 0.00 0-16.92
11784 ST LUKE’S MINERS MEMORIAL HOSPITAL
0 0.18 -0.18 0.00 0-20.79
12057 ARMSTRONG COUNTY MEMORIAL HOSPITAL
0 0.20 -0.20 0.00 0-18.42
11583 MEADVILLE MEDICAL CENTER 0 0.20 -0.20 0.00 0-18.42
12549 MEMORIAL HOSPITAL TOWANDA 0 0.21 -0.21 0.00 0-17.57
11722 GROVE CITY MEDICAL CENTER 0 0.29 -0.29 0.00 0-12.67
12337 JENNERSVILLE REGIONAL HOSPITAL
0 0.29 -0.29 0.00 0-12.49
12250 SHARON REGIONAL HEALTH SYSTEM
0 0.34 -0.34 0.00 0-10.90
12361 BRADFORD REGIONAL MEDICAL CENTER
0 0.36 -0.36 0.00 0-10.27
12031 WINDBER HOSPITAL 0 0.36 -0.36 0.00 0-10.13
11688 SOLDIERS & SAILORS MEMORIAL HOSPITAL
0 0.41 -0.41 0.00 0-8.87
12282 SOMERSET HOSPITAL 0 0.42 -0.42 0.00 0-8.83
11997 CARLISLE REGIONAL MEDICAL CENTER
0 0.42 -0.42 0.00 0-8.74
11956 CHARLES COLE MEMORIAL HOSPITAL
0 0.49 -0.49 0.00 0-7.49
12253 MILLCREEK COMMUNITY HOSPITAL
0 0.51 -0.51 0.00 0-7.21
11983 POTTSTOWN MEMORIAL MEDICAL CENTER
0 0.55 -0.55 0.00 0-6.73
11954 JAMESON MEMORIAL HOSPITAL 0 0.67 -0.67 0.00 0-5.49
11946 MERCY PHILADELPHIA HOSPITAL 0 0.67 -0.67 0.00 0-5.49
12387 HOLY SPIRIT HOSPITAL 0 0.70 -0.70 0.00 0-5.23
11764 EPHRATA COMMUNITY HOSPITAL 0 0.71 -0.71 0.00 0-5.18
11531 GETTYSBURG HOSPITAL 0 0.73 -0.73 0.00 0-5.04
11442 BERWICK HOSPITAL CENTER 0 0.75 -0.75 0.00 0-4.90
11725 UPMC HAMOT 0 0.75 -0.75 0.00 0-4.90
11837 UPMC NORTHWEST SENECA 0 0.76 -0.76 0.00 0-4.85
11759 INDIANA REGIONAL MEDICAL CENTER
0 0.78 -0.78 0.00 0-4.69
11972 DELAWARE COUNTY MEMORIAL HOSPITAL
0 0.89 -0.89 0.00 0-4.10
11712 GOOD SAMARITAN HOSPITAL 0 0.95 -0.95 0.00 0-3.86
12422 ROBERT PACKER HOSPITAL 0 1.05 -1.05 0.00 0-3.48
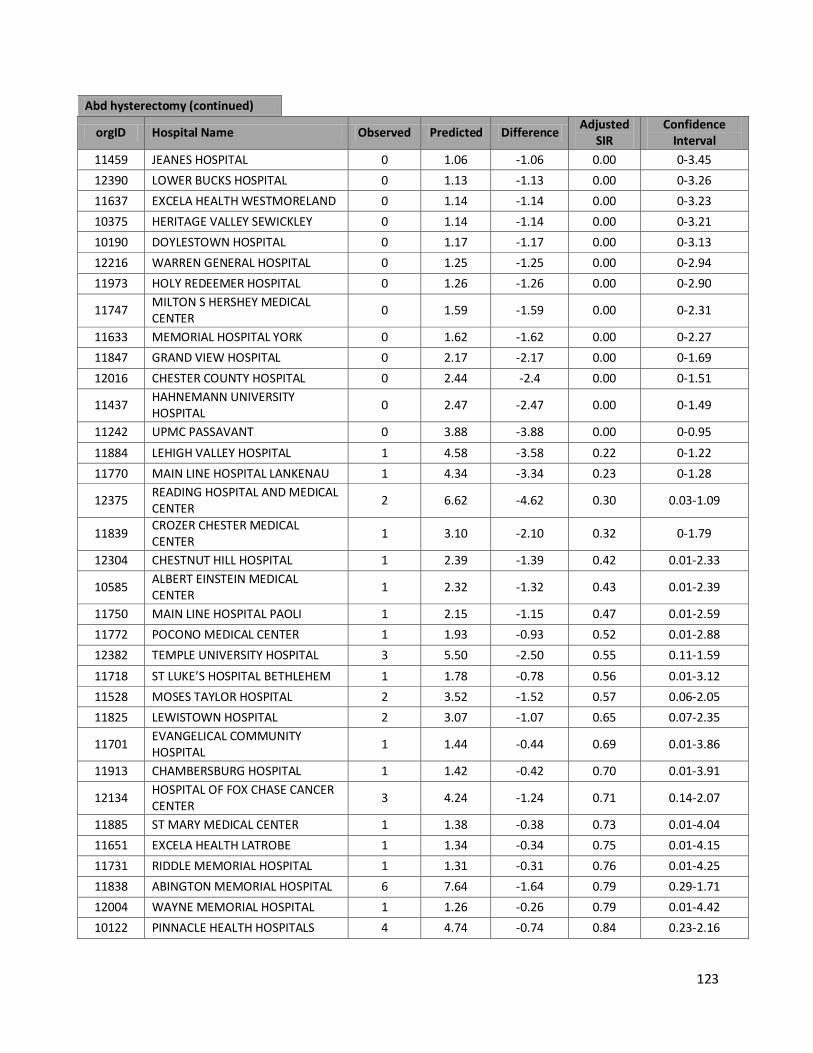
123
Abd hysterectomy (continued)
orgID Hospital Name Observed Predicted Difference Adjusted
SIR Confidence
Interval
11459 JEANES HOSPITAL 0 1.06 -1.06 0.00 0-3.45
12390 LOWER BUCKS HOSPITAL 0 1.13 -1.13 0.00 0-3.26
11637 EXCELA HEALTH WESTMORELAND 0 1.14 -1.14 0.00 0-3.23
10375 HERITAGE VALLEY SEWICKLEY 0 1.14 -1.14 0.00 0-3.21
10190 DOYLESTOWN HOSPITAL 0 1.17 -1.17 0.00 0-3.13
12216 WARREN GENERAL HOSPITAL 0 1.25 -1.25 0.00 0-2.94
11973 HOLY REDEEMER HOSPITAL 0 1.26 -1.26 0.00 0-2.90
11747 MILTON S HERSHEY MEDICAL CENTER
0 1.59 -1.59 0.00 0-2.31
11633 MEMORIAL HOSPITAL YORK 0 1.62 -1.62 0.00 0-2.27
11847 GRAND VIEW HOSPITAL 0 2.17 -2.17 0.00 0-1.69
12016 CHESTER COUNTY HOSPITAL 0 2.44 -2.4 0.00 0-1.51
11437 HAHNEMANN UNIVERSITY HOSPITAL
0 2.47 -2.47 0.00 0-1.49
11242 UPMC PASSAVANT 0 3.88 -3.88 0.00 0-0.95
11884 LEHIGH VALLEY HOSPITAL 1 4.58 -3.58 0.22 0-1.22
11770 MAIN LINE HOSPITAL LANKENAU 1 4.34 -3.34 0.23 0-1.28
12375 READING HOSPITAL AND MEDICAL CENTER
2 6.62 -4.62 0.30 0.03-1.09
11839 CROZER CHESTER MEDICAL CENTER
1 3.10 -2.10 0.32 0-1.79
12304 CHESTNUT HILL HOSPITAL 1 2.39 -1.39 0.42 0.01-2.33
10585 ALBERT EINSTEIN MEDICAL CENTER
1 2.32 -1.32 0.43 0.01-2.39
11750 MAIN LINE HOSPITAL PAOLI 1 2.15 -1.15 0.47 0.01-2.59
11772 POCONO MEDICAL CENTER 1 1.93 -0.93 0.52 0.01-2.88
12382 TEMPLE UNIVERSITY HOSPITAL 3 5.50 -2.50 0.55 0.11-1.59
11718 ST LUKE’S HOSPITAL BETHLEHEM 1 1.78 -0.78 0.56 0.01-3.12
11528 MOSES TAYLOR HOSPITAL 2 3.52 -1.52 0.57 0.06-2.05
11825 LEWISTOWN HOSPITAL 2 3.07 -1.07 0.65 0.07-2.35
11701 EVANGELICAL COMMUNITY HOSPITAL
1 1.44 -0.44 0.69 0.01-3.86
11913 CHAMBERSBURG HOSPITAL 1 1.42 -0.42 0.70 0.01-3.91
12134 HOSPITAL OF FOX CHASE CANCER CENTER
3 4.24 -1.24 0.71 0.14-2.07
11885 ST MARY MEDICAL CENTER 1 1.38 -0.38 0.73 0.01-4.04
11651 EXCELA HEALTH LATROBE 1 1.34 -0.34 0.75 0.01-4.15
11731 RIDDLE MEMORIAL HOSPITAL 1 1.31 -0.31 0.76 0.01-4.25
11838 ABINGTON MEMORIAL HOSPITAL 6 7.64 -1.64 0.79 0.29-1.71
12004 WAYNE MEMORIAL HOSPITAL 1 1.26 -0.26 0.79 0.01-4.42
10122 PINNACLE HEALTH HOSPITALS 4 4.74 -0.74 0.84 0.23-2.16
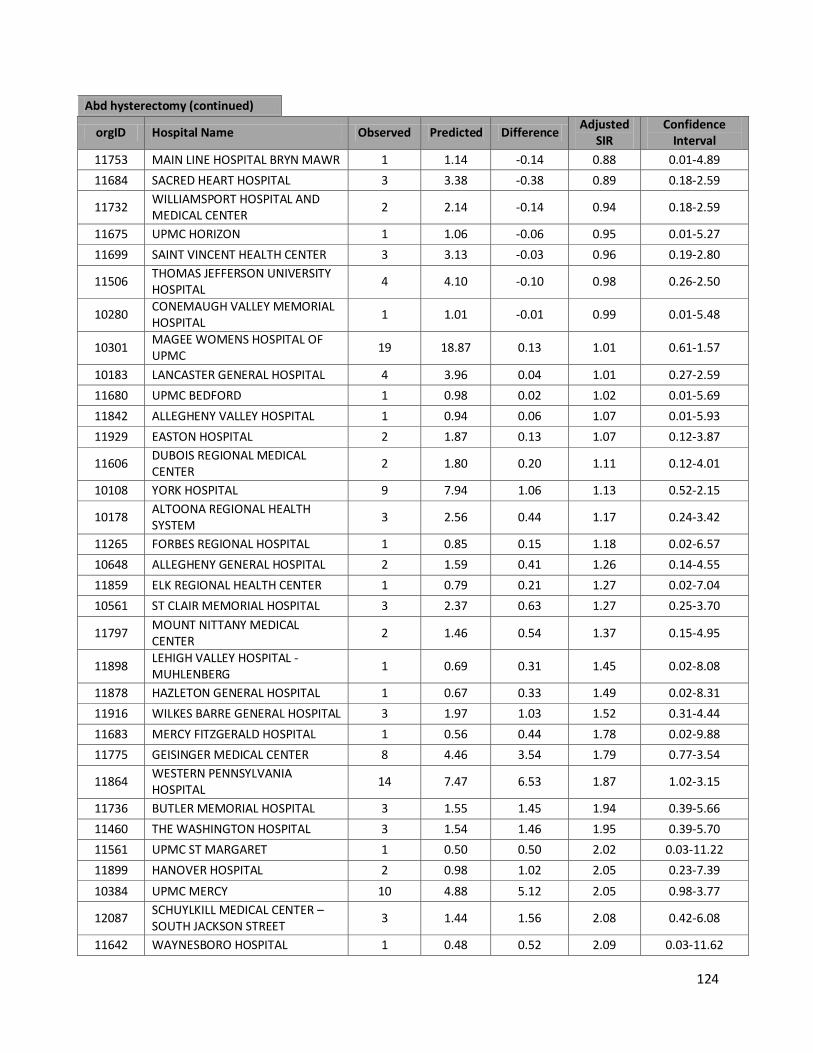
124
Abd hysterectomy (continued)
orgID Hospital Name Observed Predicted Difference Adjusted
SIR Confidence
Interval
11753 MAIN LINE HOSPITAL BRYN MAWR 1 1.14 -0.14 0.88 0.01-4.89
11684 SACRED HEART HOSPITAL 3 3.38 -0.38 0.89 0.18-2.59
11732 WILLIAMSPORT HOSPITAL AND MEDICAL CENTER
2 2.14 -0.14 0.94 0.18-2.59
11675 UPMC HORIZON 1 1.06 -0.06 0.95 0.01-5.27
11699 SAINT VINCENT HEALTH CENTER 3 3.13 -0.03 0.96 0.19-2.80
11506 THOMAS JEFFERSON UNIVERSITY HOSPITAL
4 4.10 -0.10 0.98 0.26-2.50
10280 CONEMAUGH VALLEY MEMORIAL HOSPITAL
1 1.01 -0.01 0.99 0.01-5.48
10301 MAGEE WOMENS HOSPITAL OF UPMC
19 18.87 0.13 1.01 0.61-1.57
10183 LANCASTER GENERAL HOSPITAL 4 3.96 0.04 1.01 0.27-2.59
11680 UPMC BEDFORD 1 0.98 0.02 1.02 0.01-5.69
11842 ALLEGHENY VALLEY HOSPITAL 1 0.94 0.06 1.07 0.01-5.93
11929 EASTON HOSPITAL 2 1.87 0.13 1.07 0.12-3.87
11606 DUBOIS REGIONAL MEDICAL CENTER
2 1.80 0.20 1.11 0.12-4.01
10108 YORK HOSPITAL 9 7.94 1.06 1.13 0.52-2.15
10178 ALTOONA REGIONAL HEALTH SYSTEM
3 2.56 0.44 1.17 0.24-3.42
11265 FORBES REGIONAL HOSPITAL 1 0.85 0.15 1.18 0.02-6.57
10648 ALLEGHENY GENERAL HOSPITAL 2 1.59 0.41 1.26 0.14-4.55
11859 ELK REGIONAL HEALTH CENTER 1 0.79 0.21 1.27 0.02-7.04
10561 ST CLAIR MEMORIAL HOSPITAL 3 2.37 0.63 1.27 0.25-3.70
11797 MOUNT NITTANY MEDICAL CENTER
2 1.46 0.54 1.37 0.15-4.95
11898 LEHIGH VALLEY HOSPITAL - MUHLENBERG
1 0.69 0.31 1.45 0.02-8.08
11878 HAZLETON GENERAL HOSPITAL 1 0.67 0.33 1.49 0.02-8.31
11916 WILKES BARRE GENERAL HOSPITAL 3 1.97 1.03 1.52 0.31-4.44
11683 MERCY FITZGERALD HOSPITAL 1 0.56 0.44 1.78 0.02-9.88
11775 GEISINGER MEDICAL CENTER 8 4.46 3.54 1.79 0.77-3.54
11864 WESTERN PENNSYLVANIA HOSPITAL
14 7.47 6.53 1.87 1.02-3.15
11736 BUTLER MEMORIAL HOSPITAL 3 1.55 1.45 1.94 0.39-5.66
11460 THE WASHINGTON HOSPITAL 3 1.54 1.46 1.95 0.39-5.70
11561 UPMC ST MARGARET 1 0.50 0.50 2.02 0.03-11.22
11899 HANOVER HOSPITAL 2 0.98 1.02 2.05 0.23-7.39
10384 UPMC MERCY 10 4.88 5.12 2.05 0.98-3.77
12087 SCHUYLKILL MEDICAL CENTER –SOUTH JACKSON STREET
3 1.44 1.56 2.08 0.42-6.08
11642 WAYNESBORO HOSPITAL 1 0.48 0.52 2.09 0.03-11.62

125
Abd hysterectomy (continued)
orgID Hospital Name Observed Predicted Difference Adjusted
SIR Confidence
Interval
10441 UNIONTOWN HOSPITAL 5 2.39 2.61 2.09 0.67-4.88
11831 HERITAGE VALLEY BEAVER 3 1.39 1.61 2.15 0.43-6.29
11961 ST JOSEPH MEDICAL CENTER 3 1.31 1.69 2.28 0.46-6.67
11843 CLEARFIELD HOSPITAL 1 0.42 0.58 2.41 0.03-13.39
11836 PHOENIXVILLE HOSPITAL CORPORATION
2 0.78 1.22 2.56 0.29-9.25
11654 CLARION HOSPITAL 2 0.77 1.23 2.61 0.29-9.43
11448 PENNSYLVANIA HOSPITAL OF THE UNIVERSITY OF PENNSYLVANIA
7 2.55 4.45 2.74 1.10-5.65
10219 HOSPITAL OF THE UNIVERSITY OF PENNSYLVANIA
7 2.40 4.60 2.92 1.17-6.01
12571 HEART OF LANCASTER REGIONAL MEDICAL CENTER
2 0.67 1.33 2.97 0.33-10.73
10118 UPMC PRESBYTERIAN SHADYSIDE 4 1.18 2.82 3.40 0.91-8.70
11780 GEISINGER WYOMING VALLEY 4 1.14 2.86 3.50 0.94-8.97
12487 WESTFIELD HOSPITAL 1 0.27 0.73 3.68 0.05-20.47
11738 TITUSVILLE AREA HOSPITAL 2 0.51 1.49 3.93 0.44-14.20
11388 ARIA HEALTH 2 0.49 1.51 4.09 0.46-14.78
11069 MONONGAHELA VALLEY HOSPITAL 1 0.20 0.80 5.00 0.07-27.82
11952 MERCY SUBURBAN HOSPITAL NORRISTOWN
2 0.40 1.60 5.03 0.56-18.16
12335 LANCASTER REGIONAL MEDICAL CENTER
2 0.38 1.62 5.21 0.59-18.81
12097 LOCK HAVEN HOSPITAL 1 0.18 0.82 5.42 0.07-30.14
11707 UPMC MCKEESPORT 3 0.49 2.51 6.15 1.24-17.97
12438 ST JOSEPH’S HOSPITAL 2 0.31 1.69 6.37 0.72-23.00
11779 ELLWOOD CITY HOSPITAL 1 0.15 0.85 6.59 0.09-36.65
12241 GNADEN HUETTEN MEMORIAL HOSPITAL
2 0.23 1.77 8.68 0.97-31.34
10237 JEFFERSON REGIONAL MEDICAL CENTER
2 0.21 1.79 9.62 1.08-34.73

126
Table 28 2010 Hospital Specific Surgical Site Infection Standardized Infection Ratios by Facility
Org ID & Hospital Procedure Type
Observed Predicted Difference Adjusted
SIR Confidence
Interval
11838 Abington Memorial Hospital
Cardiac Procedures 0 1.19 -1.19 0.00 0-3.08
Cardiac Bypass – Dual Incision 3 2.83 0.17 1.06 0.21-3.10
Cardiac Bypass – Single Incision 0 0.23 -0.23 0.00 0-15.78
Hip Prosthesis 4 8.18 -4.18 0.49 0.13-1.25
Knee Prosthesis 4 5.88 -1.88 0.68 0.18-1.74
Abdominal Hysterectomy 6 7.64 -1.64 0.79 0.29-1.71
10585 Albert Einstein Medical Center
Cardiac Procedures 0 0.54 -0.54 0.00 0-6.76
Cardiac Bypass – Dual Incision 5 1.28 3.72 3.90 1.26-9.09
Cardiac Bypass – Single Incision 0 0.16 -0.16 0.00 0-22.30
Hip Prosthesis 0 0.65 -0.65 0.00 0-5.64
Knee Prosthesis 0 0.07 -0.07 0.00 0-54.99
Abdominal Hysterectomy 1 2.32 -1.32 0.43 0.01-2.39
12500 Albert Einstein Medical Center – Elkins Park
Hip Prosthesis 2 1.23 0.77 1.62 0.18-5.85
Knee Prosthesis 0 1.26 -1.26 0.00 0-2.91
11842 Allegheny Valley Hospital
Hip Prosthesis 3 1.55 1.45 1.93 0.39-5.65
Knee Prosthesis 5 1.54 3.46 3.25 1.05-7.58
Abdominal Hysterectomy 1 0.94 0.06 1.07 0.01-5.93
10648 Allegheny General Hospital
Cardiac Procedures 0 2.37 -2.37 0.00 0-1.55
Cardiac Bypass – Dual Incision 2 4.24 -2.24 0.47 0.05-1.70
Cardiac Bypass – Single Incision 0 0.49 -0.49 0.00 0-7.50
Hip Prosthesis 12 7.16 4.84 1.68 0.87-2.93
Knee Prosthesis 5 7.33 -2.33 0.68 0.22-1.59
Abdominal Hysterectomy 2 1.59 0.41 1.26 0.14-4.55
10178 Altoona Regional Health System
Cardiac Procedures 0 1.16 -1.16 0.00 0-3.17
Cardiac Bypass – Dual Incision 7 3.21 3.79 2.18 0.87-4.50
Cardiac Bypass – Single Incision 0 0.01 -0.01 0.00 0-265.80
Hip Prosthesis 4 4.64 -0.64 0.86 0.23-2.21
Knee Prosthesis 3 4.65 -1.65 0.65 0.13-1.89
Abdominal Hysterectomy 3 2.56 0.44 1.17 0.24-3.42

127
Org ID & Hospital Procedure Type
Observed Predicted Difference Adjusted
SIR Confidence
Interval
11388 Aria Health
Cardiac Procedures 0 0.56 -0.56 0.00 0-6.60
Cardiac Bypass – Dual Incision 1 3.15 -2.15 0.32 0-1.76
Cardiac Bypass – Single Incision 0 0.66 -0.66 0.00 0-5.58
Hip Prosthesis 0 2.02 -2.02 0.00 0-1.82
Knee Prosthesis 4 1.42 2.58 2.82 0.76-7.23
Abdominal Hysterectomy 2 0.49 1.51 4.09 0.46-14.78
12057 Armstrong County Medical Center
Hip Prosthesis 1 1.46 -0.46 0.68 0.01.3.81
Knee Prosthesis 0 1.79 -1.79 0.00 0-2.05
Abdominal Hysterectomy 0 0.20 -0.20 0.00 0-18.42
12404 Barnes Kasson County Hospital
Knee Prosthesis 0 0.03 -0.03 0.00 0-117.95
Abdominal Hysterectomy 0 0.04 -0.04 0.00 0-86.51
11442 Berwick Hospital Center
Hip Prosthesis 0 0.63 -0.63 0.00 0-5.81
Knee Prosthesis 0 0.57 -0.57 0.00 0-6.42
Abdominal Hysterectomy 0 0.75 -0.75 0.00 0-4.90
12008 Bloomsburg Hospital
Hip Prosthesis 1 0.90 0.10 1.12 0.01-6.21
Knee Prosthesis 0 1.20 -1.20 0.00 0-3.06
Abdominal Hysterectomy 0 0.36 -0.36 0.00 0-10.27
12361 Bradford Regional Medical Center
Hip Prosthesis 0 0.31 -0.31 0.00 0-11.97
Knee Prosthesis 0 0.10 -0.10 0.00 0-35.58
Abdominal Hysterectomy 0 0.29 -0.29 0.00 0-12.58
11979 Brandywine Hospital
Cardiac Procedures 0 0.15 -0.15 0.00 0-23.68
Cardiac Bypass – Dual Incision 1 0.81 0.19 1.23 0.02-6.83
Cardiac Bypass – Single Incision 0 0.12 -0.12 0.00 0-29.53
Hip Prosthesis 3 0.91 2.09 3.29 0.66-9.63
Knee Prosthesis 1 0.58 0.42 1.72 0.02-9.59
12418 Brookville Hospital
Hip Prosthesis 0 0.02 -0.02 0.00 0-206.07
Knee Prosthesis 0 0.14 -0.14 0.00 0-27.15
Abdominal Hysterectomy 0 0.10 -0.10 0.00 0-37.13
15202 Bucks County Specialty Hospital
Hip Prosthesis 0 1.02 -1.02 0.00 0-3.59
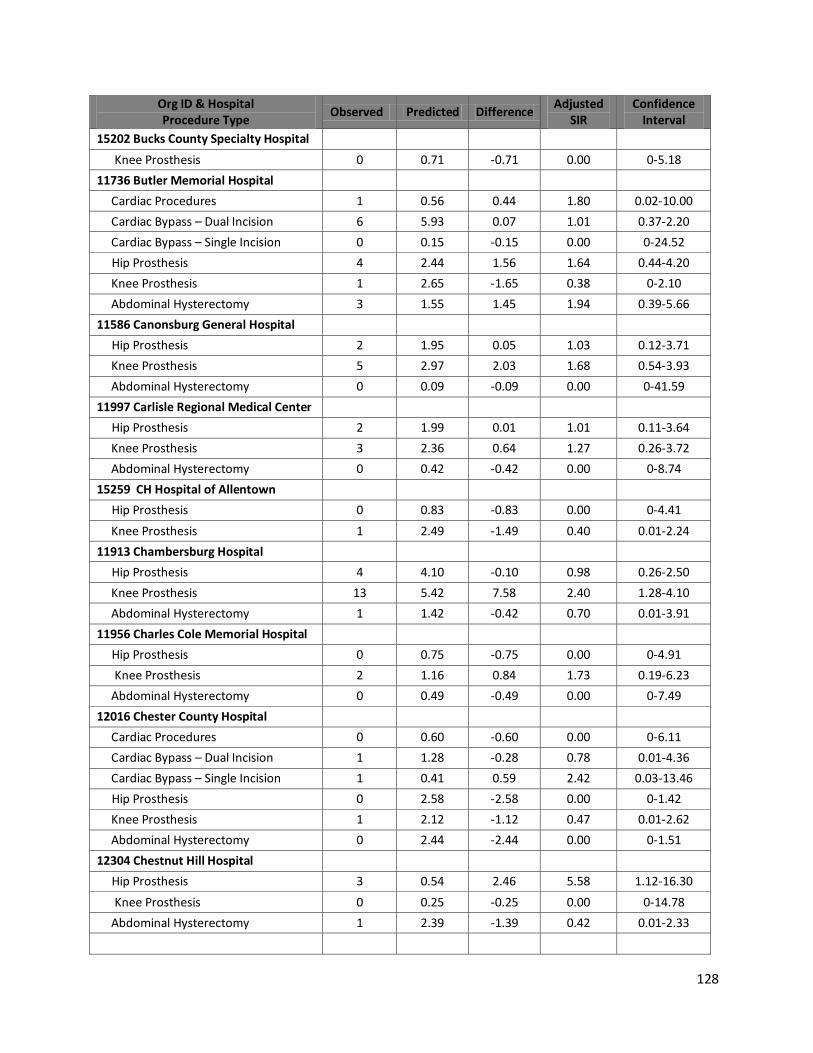
128
Org ID & Hospital Procedure Type
Observed Predicted Difference Adjusted
SIR Confidence
Interval
15202 Bucks County Specialty Hospital
Knee Prosthesis 0 0.71 -0.71 0.00 0-5.18
11736 Butler Memorial Hospital
Cardiac Procedures 1 0.56 0.44 1.80 0.02-10.00
Cardiac Bypass – Dual Incision 6 5.93 0.07 1.01 0.37-2.20
Cardiac Bypass – Single Incision 0 0.15 -0.15 0.00 0-24.52
Hip Prosthesis 4 2.44 1.56 1.64 0.44-4.20
Knee Prosthesis 1 2.65 -1.65 0.38 0-2.10
Abdominal Hysterectomy 3 1.55 1.45 1.94 0.39-5.66
11586 Canonsburg General Hospital
Hip Prosthesis 2 1.95 0.05 1.03 0.12-3.71
Knee Prosthesis 5 2.97 2.03 1.68 0.54-3.93
Abdominal Hysterectomy 0 0.09 -0.09 0.00 0-41.59
11997 Carlisle Regional Medical Center
Hip Prosthesis 2 1.99 0.01 1.01 0.11-3.64
Knee Prosthesis 3 2.36 0.64 1.27 0.26-3.72
Abdominal Hysterectomy 0 0.42 -0.42 0.00 0-8.74
15259 CH Hospital of Allentown
Hip Prosthesis 0 0.83 -0.83 0.00 0-4.41
Knee Prosthesis 1 2.49 -1.49 0.40 0.01-2.24
11913 Chambersburg Hospital
Hip Prosthesis 4 4.10 -0.10 0.98 0.26-2.50
Knee Prosthesis 13 5.42 7.58 2.40 1.28-4.10
Abdominal Hysterectomy 1 1.42 -0.42 0.70 0.01-3.91
11956 Charles Cole Memorial Hospital
Hip Prosthesis 0 0.75 -0.75 0.00 0-4.91
Knee Prosthesis 2 1.16 0.84 1.73 0.19-6.23
Abdominal Hysterectomy 0 0.49 -0.49 0.00 0-7.49
12016 Chester County Hospital
Cardiac Procedures 0 0.60 -0.60 0.00 0-6.11
Cardiac Bypass – Dual Incision 1 1.28 -0.28 0.78 0.01-4.36
Cardiac Bypass – Single Incision 1 0.41 0.59 2.42 0.03-13.46
Hip Prosthesis 0 2.58 -2.58 0.00 0-1.42
Knee Prosthesis 1 2.12 -1.12 0.47 0.01-2.62
Abdominal Hysterectomy 0 2.44 -2.44 0.00 0-1.51
12304 Chestnut Hill Hospital
Hip Prosthesis 3 0.54 2.46 5.58 1.12-16.30
Knee Prosthesis 0 0.25 -0.25 0.00 0-14.78
Abdominal Hysterectomy 1 2.39 -1.39 0.42 0.01-2.33
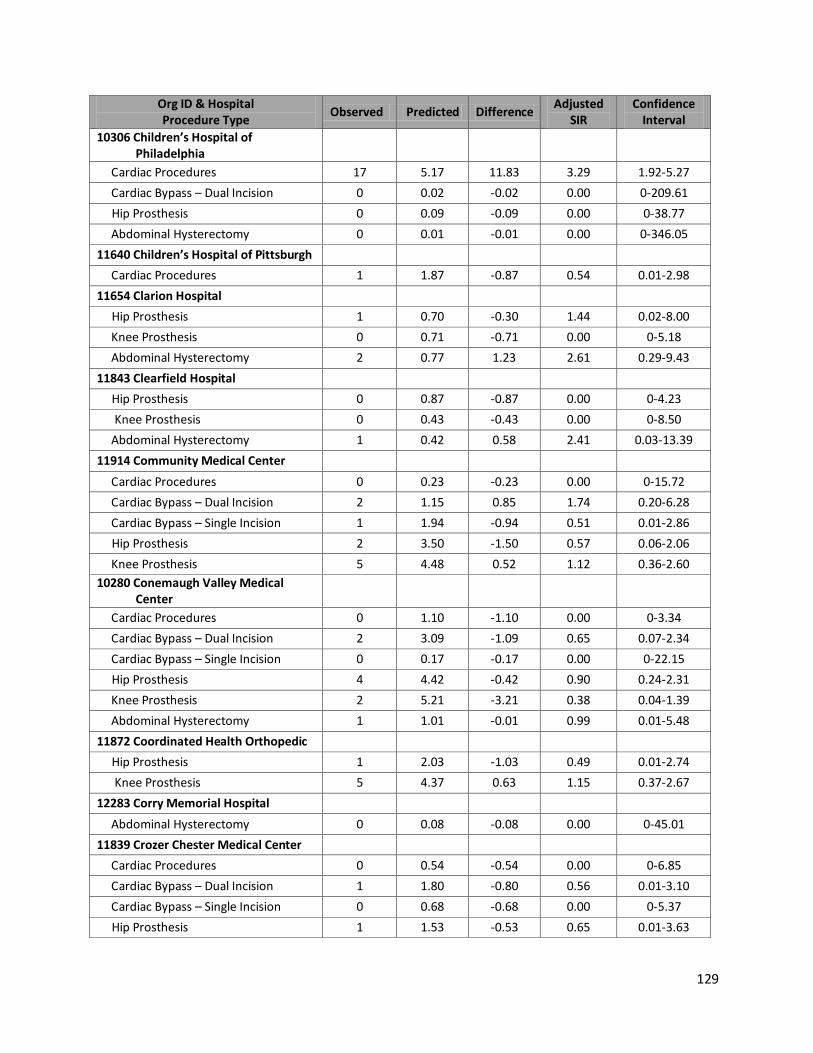
129
Org ID & Hospital Procedure Type
Observed Predicted Difference Adjusted
SIR Confidence
Interval
10306 Children’s Hospital of Philadelphia
Cardiac Procedures 17 5.17 11.83 3.29 1.92-5.27
Cardiac Bypass – Dual Incision 0 0.02 -0.02 0.00 0-209.61
Hip Prosthesis 0 0.09 -0.09 0.00 0-38.77
Abdominal Hysterectomy 0 0.01 -0.01 0.00 0-346.05
11640 Children’s Hospital of Pittsburgh
Cardiac Procedures 1 1.87 -0.87 0.54 0.01-2.98
11654 Clarion Hospital
Hip Prosthesis 1 0.70 -0.30 1.44 0.02-8.00
Knee Prosthesis 0 0.71 -0.71 0.00 0-5.18
Abdominal Hysterectomy 2 0.77 1.23 2.61 0.29-9.43
11843 Clearfield Hospital
Hip Prosthesis 0 0.87 -0.87 0.00 0-4.23
Knee Prosthesis 0 0.43 -0.43 0.00 0-8.50
Abdominal Hysterectomy 1 0.42 0.58 2.41 0.03-13.39
11914 Community Medical Center
Cardiac Procedures 0 0.23 -0.23 0.00 0-15.72
Cardiac Bypass – Dual Incision 2 1.15 0.85 1.74 0.20-6.28
Cardiac Bypass – Single Incision 1 1.94 -0.94 0.51 0.01-2.86
Hip Prosthesis 2 3.50 -1.50 0.57 0.06-2.06
Knee Prosthesis 5 4.48 0.52 1.12 0.36-2.60
10280 Conemaugh Valley Medical Center
Cardiac Procedures 0 1.10 -1.10 0.00 0-3.34
Cardiac Bypass – Dual Incision 2 3.09 -1.09 0.65 0.07-2.34
Cardiac Bypass – Single Incision 0 0.17 -0.17 0.00 0-22.15
Hip Prosthesis 4 4.42 -0.42 0.90 0.24-2.31
Knee Prosthesis 2 5.21 -3.21 0.38 0.04-1.39
Abdominal Hysterectomy 1 1.01 -0.01 0.99 0.01-5.48
11872 Coordinated Health Orthopedic
Hip Prosthesis 1 2.03 -1.03 0.49 0.01-2.74
Knee Prosthesis 5 4.37 0.63 1.15 0.37-2.67
12283 Corry Memorial Hospital
Abdominal Hysterectomy 0 0.08 -0.08 0.00 0-45.01
11839 Crozer Chester Medical Center
Cardiac Procedures 0 0.54 -0.54 0.00 0-6.85
Cardiac Bypass – Dual Incision 1 1.80 -0.80 0.56 0.01-3.10
Cardiac Bypass – Single Incision 0 0.68 -0.68 0.00 0-5.37
Hip Prosthesis 1 1.53 -0.53 0.65 0.01-3.63
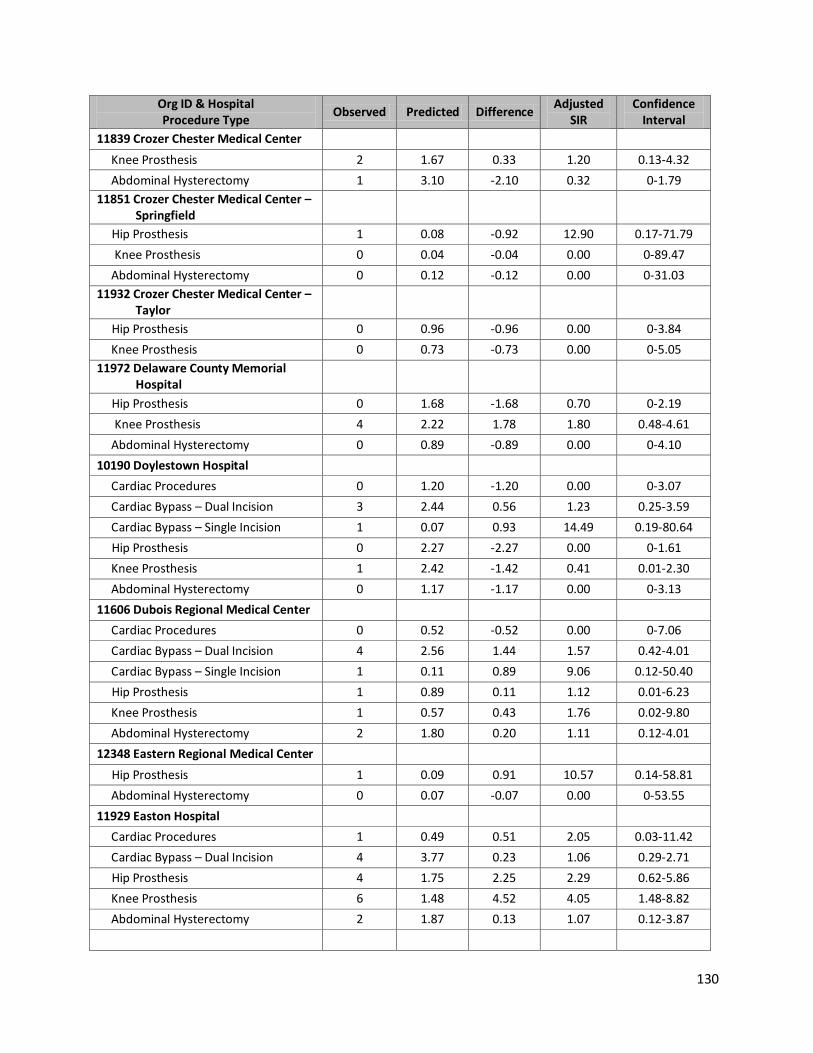
130
Org ID & Hospital Procedure Type
Observed Predicted Difference Adjusted
SIR Confidence
Interval
11839 Crozer Chester Medical Center
Knee Prosthesis 2 1.67 0.33 1.20 0.13-4.32
Abdominal Hysterectomy 1 3.10 -2.10 0.32 0-1.79
11851 Crozer Chester Medical Center – Springfield
Hip Prosthesis 1 0.08 -0.92 12.90 0.17-71.79
Knee Prosthesis 0 0.04 -0.04 0.00 0-89.47
Abdominal Hysterectomy 0 0.12 -0.12 0.00 0-31.03
11932 Crozer Chester Medical Center – Taylor
Hip Prosthesis 0 0.96 -0.96 0.00 0-3.84
Knee Prosthesis 0 0.73 -0.73 0.00 0-5.05
11972 Delaware County Memorial Hospital
Hip Prosthesis 0 1.68 -1.68 0.70 0-2.19
Knee Prosthesis 4 2.22 1.78 1.80 0.48-4.61
Abdominal Hysterectomy 0 0.89 -0.89 0.00 0-4.10
10190 Doylestown Hospital
Cardiac Procedures 0 1.20 -1.20 0.00 0-3.07
Cardiac Bypass – Dual Incision 3 2.44 0.56 1.23 0.25-3.59
Cardiac Bypass – Single Incision 1 0.07 0.93 14.49 0.19-80.64
Hip Prosthesis 0 2.27 -2.27 0.00 0-1.61
Knee Prosthesis 1 2.42 -1.42 0.41 0.01-2.30
Abdominal Hysterectomy 0 1.17 -1.17 0.00 0-3.13
11606 Dubois Regional Medical Center
Cardiac Procedures 0 0.52 -0.52 0.00 0-7.06
Cardiac Bypass – Dual Incision 4 2.56 1.44 1.57 0.42-4.01
Cardiac Bypass – Single Incision 1 0.11 0.89 9.06 0.12-50.40
Hip Prosthesis 1 0.89 0.11 1.12 0.01-6.23
Knee Prosthesis 1 0.57 0.43 1.76 0.02-9.80
Abdominal Hysterectomy 2 1.80 0.20 1.11 0.12-4.01
12348 Eastern Regional Medical Center
Hip Prosthesis 1 0.09 0.91 10.57 0.14-58.81
Abdominal Hysterectomy 0 0.07 -0.07 0.00 0-53.55
11929 Easton Hospital
Cardiac Procedures 1 0.49 0.51 2.05 0.03-11.42
Cardiac Bypass – Dual Incision 4 3.77 0.23 1.06 0.29-2.71
Hip Prosthesis 4 1.75 2.25 2.29 0.62-5.86
Knee Prosthesis 6 1.48 4.52 4.05 1.48-8.82
Abdominal Hysterectomy 2 1.87 0.13 1.07 0.12-3.87
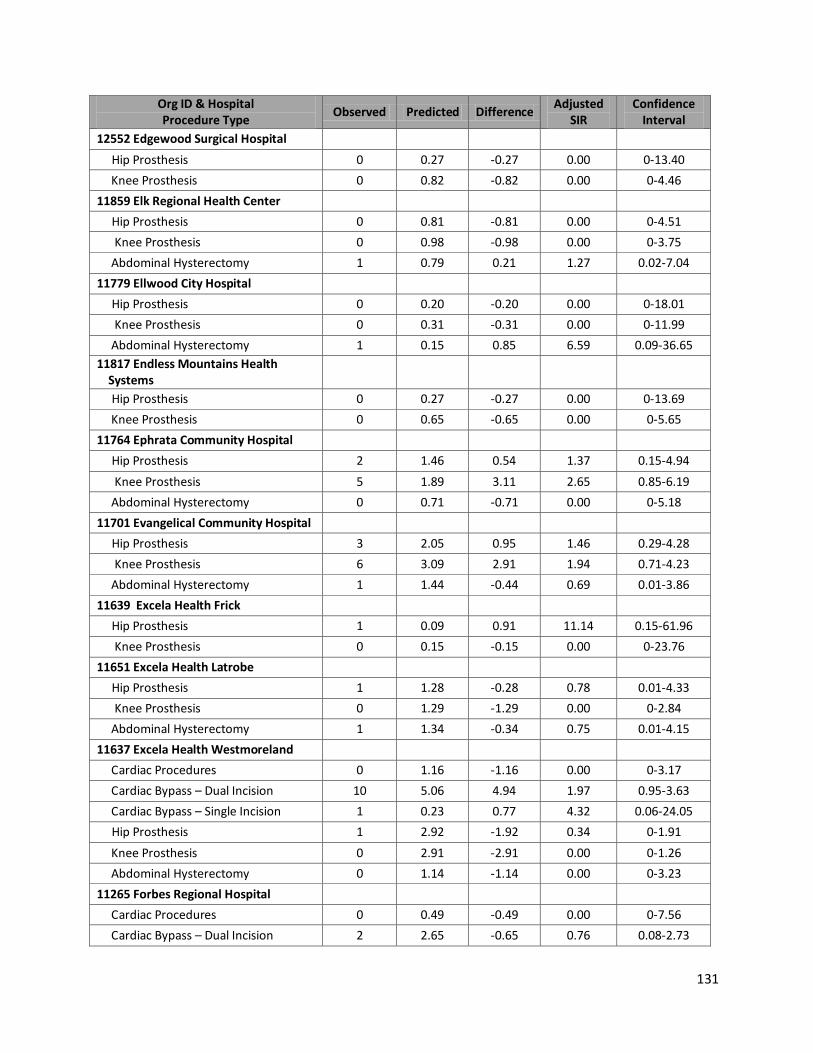
131
Org ID & Hospital Procedure Type
Observed Predicted Difference Adjusted
SIR Confidence
Interval
12552 Edgewood Surgical Hospital
Hip Prosthesis 0 0.27 -0.27 0.00 0-13.40
Knee Prosthesis 0 0.82 -0.82 0.00 0-4.46
11859 Elk Regional Health Center
Hip Prosthesis 0 0.81 -0.81 0.00 0-4.51
Knee Prosthesis 0 0.98 -0.98 0.00 0-3.75
Abdominal Hysterectomy 1 0.79 0.21 1.27 0.02-7.04
11779 Ellwood City Hospital
Hip Prosthesis 0 0.20 -0.20 0.00 0-18.01
Knee Prosthesis 0 0.31 -0.31 0.00 0-11.99
Abdominal Hysterectomy 1 0.15 0.85 6.59 0.09-36.65
11817 Endless Mountains Health Systems
Hip Prosthesis 0 0.27 -0.27 0.00 0-13.69
Knee Prosthesis 0 0.65 -0.65 0.00 0-5.65
11764 Ephrata Community Hospital
Hip Prosthesis 2 1.46 0.54 1.37 0.15-4.94
Knee Prosthesis 5 1.89 3.11 2.65 0.85-6.19
Abdominal Hysterectomy 0 0.71 -0.71 0.00 0-5.18
11701 Evangelical Community Hospital
Hip Prosthesis 3 2.05 0.95 1.46 0.29-4.28
Knee Prosthesis 6 3.09 2.91 1.94 0.71-4.23
Abdominal Hysterectomy 1 1.44 -0.44 0.69 0.01-3.86
11639 Excela Health Frick
Hip Prosthesis 1 0.09 0.91 11.14 0.15-61.96
Knee Prosthesis 0 0.15 -0.15 0.00 0-23.76
11651 Excela Health Latrobe
Hip Prosthesis 1 1.28 -0.28 0.78 0.01-4.33
Knee Prosthesis 0 1.29 -1.29 0.00 0-2.84
Abdominal Hysterectomy 1 1.34 -0.34 0.75 0.01-4.15
11637 Excela Health Westmoreland
Cardiac Procedures 0 1.16 -1.16 0.00 0-3.17
Cardiac Bypass – Dual Incision 10 5.06 4.94 1.97 0.95-3.63
Cardiac Bypass – Single Incision 1 0.23 0.77 4.32 0.06-24.05
Hip Prosthesis 1 2.92 -1.92 0.34 0-1.91
Knee Prosthesis 0 2.91 -2.91 0.00 0-1.26
Abdominal Hysterectomy 0 1.14 -1.14 0.00 0-3.23
11265 Forbes Regional Hospital
Cardiac Procedures 0 0.49 -0.49 0.00 0-7.56
Cardiac Bypass – Dual Incision 2 2.65 -0.65 0.76 0.08-2.73
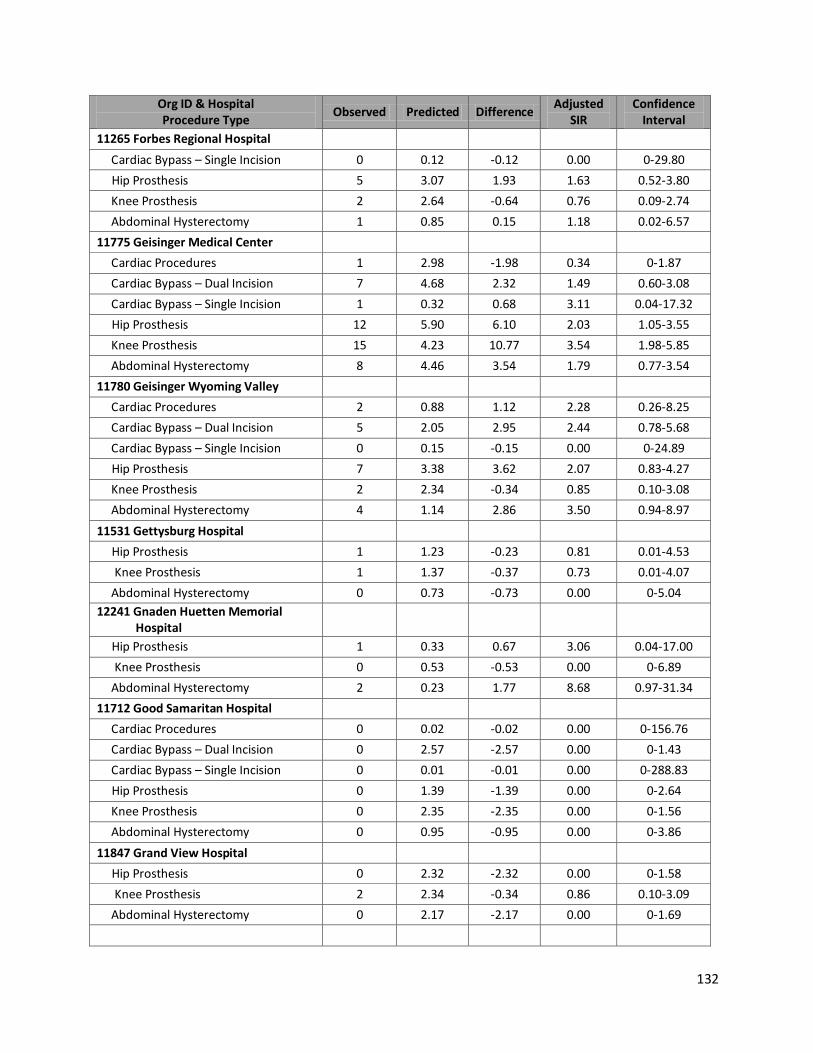
132
Org ID & Hospital Procedure Type
Observed Predicted Difference Adjusted
SIR Confidence
Interval
11265 Forbes Regional Hospital
Cardiac Bypass – Single Incision 0 0.12 -0.12 0.00 0-29.80
Hip Prosthesis 5 3.07 1.93 1.63 0.52-3.80
Knee Prosthesis 2 2.64 -0.64 0.76 0.09-2.74
Abdominal Hysterectomy 1 0.85 0.15 1.18 0.02-6.57
11775 Geisinger Medical Center
Cardiac Procedures 1 2.98 -1.98 0.34 0-1.87
Cardiac Bypass – Dual Incision 7 4.68 2.32 1.49 0.60-3.08
Cardiac Bypass – Single Incision 1 0.32 0.68 3.11 0.04-17.32
Hip Prosthesis 12 5.90 6.10 2.03 1.05-3.55
Knee Prosthesis 15 4.23 10.77 3.54 1.98-5.85
Abdominal Hysterectomy 8 4.46 3.54 1.79 0.77-3.54
11780 Geisinger Wyoming Valley
Cardiac Procedures 2 0.88 1.12 2.28 0.26-8.25
Cardiac Bypass – Dual Incision 5 2.05 2.95 2.44 0.78-5.68
Cardiac Bypass – Single Incision 0 0.15 -0.15 0.00 0-24.89
Hip Prosthesis 7 3.38 3.62 2.07 0.83-4.27
Knee Prosthesis 2 2.34 -0.34 0.85 0.10-3.08
Abdominal Hysterectomy 4 1.14 2.86 3.50 0.94-8.97
11531 Gettysburg Hospital
Hip Prosthesis 1 1.23 -0.23 0.81 0.01-4.53
Knee Prosthesis 1 1.37 -0.37 0.73 0.01-4.07
Abdominal Hysterectomy 0 0.73 -0.73 0.00 0-5.04
12241 Gnaden Huetten Memorial Hospital
Hip Prosthesis 1 0.33 0.67 3.06 0.04-17.00
Knee Prosthesis 0 0.53 -0.53 0.00 0-6.89
Abdominal Hysterectomy 2 0.23 1.77 8.68 0.97-31.34
11712 Good Samaritan Hospital
Cardiac Procedures 0 0.02 -0.02 0.00 0-156.76
Cardiac Bypass – Dual Incision 0 2.57 -2.57 0.00 0-1.43
Cardiac Bypass – Single Incision 0 0.01 -0.01 0.00 0-288.83
Hip Prosthesis 0 1.39 -1.39 0.00 0-2.64
Knee Prosthesis 0 2.35 -2.35 0.00 0-1.56
Abdominal Hysterectomy 0 0.95 -0.95 0.00 0-3.86
11847 Grand View Hospital
Hip Prosthesis 0 2.32 -2.32 0.00 0-1.58
Knee Prosthesis 2 2.34 -0.34 0.86 0.10-3.09
Abdominal Hysterectomy 0 2.17 -2.17 0.00 0-1.69

133
Org ID & Hospital Procedure Type
Observed Predicted Difference Adjusted
SIR Confidence
Interval
11722 Grove City Medical Center
Hip Prosthesis 0 0.38 -0.38 0.00 0-9.55
Knee Prosthesis 0 0.35 -0.35 0.00 0-10.37
Abdominal Hysterectomy 0 0.29 -0.29 0.00 0-12.67
11437 Hahnemann University Hospital
Cardiac Procedures 0 0.65 -0.65 0.00 0-5.63
Cardiac Bypass – Dual Incision 0 1.75 -1.75 0.00 0-2.09
Cardiac Bypass – Single Incision 0 0.21 -0.21 0.00 0-17.48
Hip Prosthesis 0 1.60 -1.60 0.00 0-2.29
Knee Prosthesis 0 0.99 -0.99 0.00 0-3.71
Abdominal Hysterectomy 0 2.47 -2.47 0.00 0-1.49
11899 Hanover Hospital
Hip Prosthesis 1 2.10 -1.10 0.48 0.01-2.65
Knee Prosthesis 4 2.69 1.31 1.49 0.40-3.81
Abdominal Hysterectomy 2 0.98 1.02 2.05 0.23-7.39
11878 Hazleton General Hospital
Hip Prosthesis 4 0.93 3.07 4.31 1.16-11.03
Knee Prosthesis 0 0.56 -0.56 0.00 0-6.53
Abdominal Hysterectomy 1 0.67 0.33 1.49 0.02-8.31
12571 Heart of Lancaster Regional Medical Center
Hip Prosthesis 1 0.53 0.47 1.88 0.02-10.47
Knee Prosthesis 1 0.05 0.95 19.12 0.25-106.38
Abdominal Hysterectomy 2 0.67 1.33 2.97 0.33-10.73
11831 Heritage Valley Beaver
Cardiac Procedures 3 1.10 1.90 2.72 0.55-7.93
Cardiac Bypass – Dual Incision 12 2.79 9.21 4.30 2.22-7.52
Cardiac Bypass – Single Incision 0 0.67 -0.67 0.00 0-5.48
Hip Prosthesis 4 2.75 1.25 1.45 0.39-3.72
Knee Prosthesis 4 2.02 1.98 1.98 0.53-5.07
Abdominal Hysterectomy 3 1.39 1.61 2.15 0.43-6.29
10375 Heritage Valley Sewickley
Cardiac Procedures 0 0.04 -0.04 0.00 0-87.34
Hip Prosthesis 2 4.06 -2.06 0.49 0.06-1.78
Knee Prosthesis 1 5.75 -4.75 0.17 0-0.97
Abdominal Hysterectomy 0 1.14 -1.14 0.00 0-3.21
11902 Highlands Hospital
Hip Prosthesis 0 0.18 -0.18 0.00 0-20.96
Knee Prosthesis 0 0.14 -0.14 0.00 0-26.64
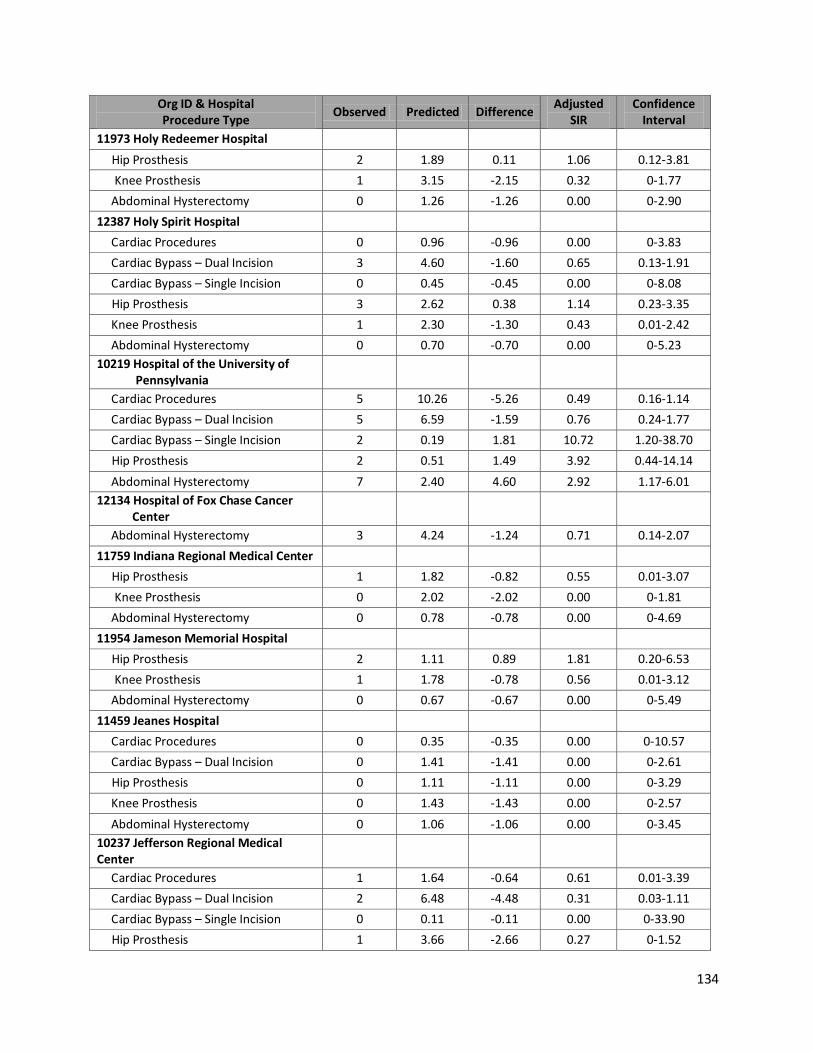
134
Org ID & Hospital Procedure Type
Observed Predicted Difference Adjusted
SIR Confidence
Interval
11973 Holy Redeemer Hospital
Hip Prosthesis 2 1.89 0.11 1.06 0.12-3.81
Knee Prosthesis 1 3.15 -2.15 0.32 0-1.77
Abdominal Hysterectomy 0 1.26 -1.26 0.00 0-2.90
12387 Holy Spirit Hospital
Cardiac Procedures 0 0.96 -0.96 0.00 0-3.83
Cardiac Bypass – Dual Incision 3 4.60 -1.60 0.65 0.13-1.91
Cardiac Bypass – Single Incision 0 0.45 -0.45 0.00 0-8.08
Hip Prosthesis 3 2.62 0.38 1.14 0.23-3.35
Knee Prosthesis 1 2.30 -1.30 0.43 0.01-2.42
Abdominal Hysterectomy 0 0.70 -0.70 0.00 0-5.23
10219 Hospital of the University of Pennsylvania
Cardiac Procedures 5 10.26 -5.26 0.49 0.16-1.14
Cardiac Bypass – Dual Incision 5 6.59 -1.59 0.76 0.24-1.77
Cardiac Bypass – Single Incision 2 0.19 1.81 10.72 1.20-38.70
Hip Prosthesis 2 0.51 1.49 3.92 0.44-14.14
Abdominal Hysterectomy 7 2.40 4.60 2.92 1.17-6.01
12134 Hospital of Fox Chase Cancer Center
Abdominal Hysterectomy 3 4.24 -1.24 0.71 0.14-2.07
11759 Indiana Regional Medical Center
Hip Prosthesis 1 1.82 -0.82 0.55 0.01-3.07
Knee Prosthesis 0 2.02 -2.02 0.00 0-1.81
Abdominal Hysterectomy 0 0.78 -0.78 0.00 0-4.69
11954 Jameson Memorial Hospital
Hip Prosthesis 2 1.11 0.89 1.81 0.20-6.53
Knee Prosthesis 1 1.78 -0.78 0.56 0.01-3.12
Abdominal Hysterectomy 0 0.67 -0.67 0.00 0-5.49
11459 Jeanes Hospital
Cardiac Procedures 0 0.35 -0.35 0.00 0-10.57
Cardiac Bypass – Dual Incision 0 1.41 -1.41 0.00 0-2.61
Hip Prosthesis 0 1.11 -1.11 0.00 0-3.29
Knee Prosthesis 0 1.43 -1.43 0.00 0-2.57
Abdominal Hysterectomy 0 1.06 -1.06 0.00 0-3.45
10237 Jefferson Regional Medical Center
Cardiac Procedures 1 1.64 -0.64 0.61 0.01-3.39
Cardiac Bypass – Dual Incision 2 6.48 -4.48 0.31 0.03-1.11
Cardiac Bypass – Single Incision 0 0.11 -0.11 0.00 0-33.90
Hip Prosthesis 1 3.66 -2.66 0.27 0-1.52

135
Org ID & Hospital Procedure Type
Observed Predicted Difference Adjusted
SIR Confidence
Interval
10237 Jefferson Regional Medical Center
Knee Prosthesis 7 5.52 1.48 1.27 0.51-2.61
Abdominal Hysterectomy 2 0.21 1.79 9.62 1.08-34.73
12337 Jennersville Regional Hospital
Hip Prosthesis 0 0.39 -0.39 0.00 0-9.52
Knee Prosthesis 0 0.09 -0.09 0.00 0-39.32
Abdominal Hysterectomy 0 0.29 -0.29 0.00 0-12.49
11689 Jersey Shore Hospital
Hip Prosthesis 0 0.13 -0.13 0.00 0-27.44
Knee Prosthesis 0 0.15 -0.15 0.00 0-24.24
10183 Lancaster General Hospital
Cardiac Procedures 3 1.37 1.63 2.19 0.44-6.40
Cardiac Bypass – Dual Incision 7 7.53 -0.53 0.93 0.37-1.92
Cardiac Bypass – Single Incision 1 0.41 0.59 2.45 0.03-13.62
Hip Prosthesis 5 8.14 -3.14 0.61 0.20-1.43
Knee Prosthesis 7 10.45 -3.45 0.67 0.27-1.38
Abdominal Hysterectomy 4 3.96 0.04 1.01 0.27-2.59
12335 Lancaster Regional Medical Center
Cardiac Procedures 1 0.29 0.71 3.41 0.04-18.96
Cardiac Bypass – Dual Incision 1 1.00 0 1.00 0.01-5.55
Cardiac Bypass – Single Incision 0 0.23 -0.23 0.00 0-15.82
Hip Prosthesis 1 2.05 -1.05 0.49 0.01-2.72
Knee Prosthesis 2 2.02 -0.02 0.99 0.11-3.57
Abdominal Hysterectomy 2 0.38 1.62 5.21 0.59-18.81
12032 Lansdale Hospital
Hip Prosthesis 0 0.58 -0.58 0.00 0-6.31
Knee Prosthesis 0 0.45 -0.45 0.00 0-8.22
11884 Lehigh Valley Hospital
Cardiac Procedures 2 2.87 -0.87 0.70 0.08-2.51
Cardiac Bypass – Dual Incision 5 8.55 -3.55 0.58 0.19-1.36
Cardiac Bypass – Single Incision 0 0.64 -0.64 0.00 0-5.75
Hip Prosthesis 9 8.95 0.05 1.01 0.46-1.91
Knee Prosthesis 8 8.87 -0.87 0.90 0.39-1.78
Abdominal Hysterectomy 1 4.58 -3.58 0.22 0-1.22
11898 Lehigh Valley Hospital – Muhlenberg
Cardiac Procedures 0 0.75 -0.75 0.00 0-4.89
Cardiac Bypass – Dual Incision 2 2.53 -0.53 0.79 0.09-2.85
Cardiac Bypass – Single Incision 0 0.05 -0.05 0.00 0-67.80
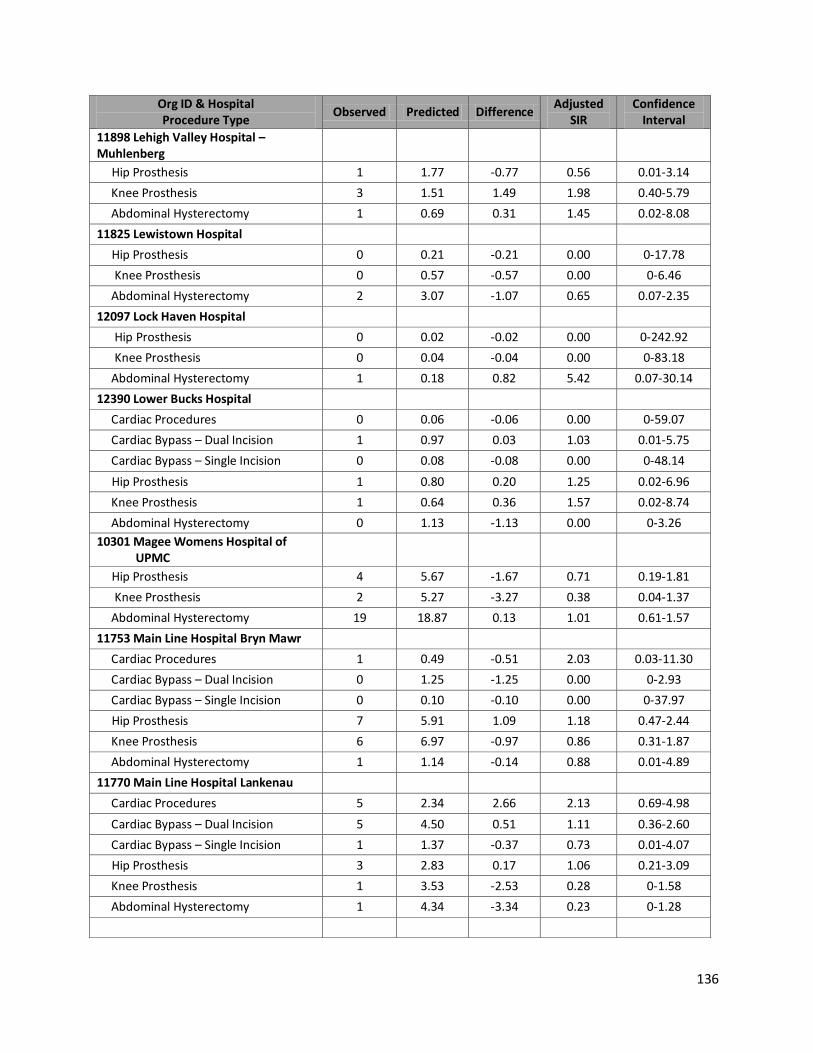
136
Org ID & Hospital Procedure Type
Observed Predicted Difference Adjusted
SIR Confidence
Interval
11898 Lehigh Valley Hospital – Muhlenberg
Hip Prosthesis 1 1.77 -0.77 0.56 0.01-3.14
Knee Prosthesis 3 1.51 1.49 1.98 0.40-5.79
Abdominal Hysterectomy 1 0.69 0.31 1.45 0.02-8.08
11825 Lewistown Hospital
Hip Prosthesis 0 0.21 -0.21 0.00 0-17.78
Knee Prosthesis 0 0.57 -0.57 0.00 0-6.46
Abdominal Hysterectomy 2 3.07 -1.07 0.65 0.07-2.35
12097 Lock Haven Hospital
Hip Prosthesis 0 0.02 -0.02 0.00 0-242.92
Knee Prosthesis 0 0.04 -0.04 0.00 0-83.18
Abdominal Hysterectomy 1 0.18 0.82 5.42 0.07-30.14
12390 Lower Bucks Hospital
Cardiac Procedures 0 0.06 -0.06 0.00 0-59.07
Cardiac Bypass – Dual Incision 1 0.97 0.03 1.03 0.01-5.75
Cardiac Bypass – Single Incision 0 0.08 -0.08 0.00 0-48.14
Hip Prosthesis 1 0.80 0.20 1.25 0.02-6.96
Knee Prosthesis 1 0.64 0.36 1.57 0.02-8.74
Abdominal Hysterectomy 0 1.13 -1.13 0.00 0-3.26
10301 Magee Womens Hospital of UPMC
Hip Prosthesis 4 5.67 -1.67 0.71 0.19-1.81
Knee Prosthesis 2 5.27 -3.27 0.38 0.04-1.37
Abdominal Hysterectomy 19 18.87 0.13 1.01 0.61-1.57
11753 Main Line Hospital Bryn Mawr
Cardiac Procedures 1 0.49 -0.51 2.03 0.03-11.30
Cardiac Bypass – Dual Incision 0 1.25 -1.25 0.00 0-2.93
Cardiac Bypass – Single Incision 0 0.10 -0.10 0.00 0-37.97
Hip Prosthesis 7 5.91 1.09 1.18 0.47-2.44
Knee Prosthesis 6 6.97 -0.97 0.86 0.31-1.87
Abdominal Hysterectomy 1 1.14 -0.14 0.88 0.01-4.89
11770 Main Line Hospital Lankenau
Cardiac Procedures 5 2.34 2.66 2.13 0.69-4.98
Cardiac Bypass – Dual Incision 5 4.50 0.51 1.11 0.36-2.60
Cardiac Bypass – Single Incision 1 1.37 -0.37 0.73 0.01-4.07
Hip Prosthesis 3 2.83 0.17 1.06 0.21-3.09
Knee Prosthesis 1 3.53 -2.53 0.28 0-1.58
Abdominal Hysterectomy 1 4.34 -3.34 0.23 0-1.28

137
Org ID & Hospital Procedure Type
Observed Predicted Difference Adjusted
SIR Confidence
Interval
11750 Main Line Hospital Paoli
Cardiac Procedures 2 0.32 1.69 6.35 0.71-22.92
Cardiac Bypass – Dual Incision 1 1.39 -0.39 0.72 0.01-4.00
Cardiac Bypass – Single Incision 0 0.08 -0.08 0.00 0-44.30
Hip Prosthesis 6 3.08 2.92 1.95 0.71-4.24
Knee Prosthesis 5 2.93 2.07 1.71 0.55-3.98
Abdominal Hysterectomy 1 2.15 -1.15 0.47 0.01-2.59
12338 Marian Community Hospital
Hip Prosthesis 0 0.30 -0.30 0.00 0-12.03
Knee Prosthesis 0 0.62 -0.62 0.00 0-5.91
11583 Meadville Medical Center
Hip Prosthesis 7 2.28 4.72 3.07 1.23-6.32
Knee Prosthesis 6 4.74 1.26 1.27 0.46-2.76
Abdominal Hysterectomy 0 0.20 -0.20 0.00 0-18.42
12549 Memorial Hospital Towanda
Abdominal Hysterectomy 0 0.21 -0.21 0.00 0-17.57
11633 Memorial Hospital York
Hip Prosthesis 0 1.18 -1.18 0.00 0-3.12
Knee Prosthesis 2 1.52 0.48 1.32 0.15-4.75
Abdominal Hysterectomy 0 1.62 -1.62 0.00 0-2.27
11683 Mercy Fitzgerald Hospital
Cardiac Procedures 0 0.27 -0.27 0.00 0-13.69
Cardiac Bypass – Dual Incision 0 0.83 -0.83 0.00 0-4.42
Cardiac Bypass – Single Incision 0 0.18 -0.18 0.00 0-20.70
Hip Prosthesis 0 0.68 -0.68 0.00 0-5.36
Knee Prosthesis 2 0.41 1.59 4.91 0.55-17.74
Abdominal Hysterectomy 1 0.56 0.44 1.78 0.02-9.88
11946 Mercy Philadelphia Hospital
Hip Prosthesis 0 0.23 -0.23 0.00 0-15.82
Knee Prosthesis 0 0.19 -0.19 0.00 0-19.16
Abdominal Hysterectomy 0 0.67 -0.67 0.00 0-5.49
11952 Mercy Suburban Hospital – Norristown
Hip Prosthesis 2 0.70 1.30 2.86 0.32-10.31
Knee Prosthesis 4 1.00 3.00 4.02 1.08-10.29
Abdominal Hysterectomy 2 0.40 1.60 5.03 0.56-18.16
11557 Mid-Valley Hospital
Hip Prosthesis 1 0.02 0.98 66.23 0.87-368.47
12253 Millcreek Community Hospital
Hip Prosthesis 0 0.40 -0.40 0.00 0-9.24

138
Org ID & Hospital Procedure Type
Observed Predicted Difference Adjusted
SIR Confidence
Interval
12253 Millcreek Community Hospital
Knee Prosthesis 0 0.43 -0.43 0.00 0-8.47
Abdominal Hysterectomy 0 0.51 -0.51 0.00 0-7.21
11747 Milton S Hershey Medical Center
Cardiac Procedures 6 3.83 2.17 1.57 0.57-3.41
Cardiac Bypass – Dual Incision 5 4.12 0.86 1.21 0.39-2.83
Cardiac Bypass – Single Incision 0 0.13 -0.13 0.00 0-27.23
Hip Prosthesis 8 7.12 0.88 1.12 0.48-2.21
Knee Prosthesis 9 6.66 2.34 1.35 0.62-2.56
Abdominal Hysterectomy 0 1.59 -1.59 0.00 0-2.31
12295 Miners Medical Center
Hip Prosthesis 1 0.12 0.88 8.01 0.10-44.58
Knee Prosthesis 0 0.06 -0.06 0.00 0-58.97
Abdominal Hysterectomy 0 0.01 -0.01 0.00 0-346.05
11069 Monongahela Valley Hospital
Hip Prosthesis 6 2.25 3.75 2.67 0.97-5.81
Knee Prosthesis 3 1.53 1.47 1.96 0.39-5.74
Abdominal Hysterectomy 1 0.20 0.80 5.00 0.07-27.82
11947 Montgomery Hospital
Hip Prosthesis 1 1.05 -0.05 0.95 0.01-5.28
Knee Prosthesis 2 1.71 0.29 1.17 0.13-4.21
Abdominal Hysterectomy 0 0.05 -0.05 0.00 0-72.49
11528 Moses Taylor Hospital
Hip Prosthesis 2 1.64 0.36 1.22 0.14-4.40
Knee Prosthesis 0 2.38 -2.38 0.00 0-1.54
Abdominal Hysterectomy 2 3.52 -1.52 0.57 0.06-2.05
11797 Mount Nittany Medical Center
Hip Prosthesis 1 4.52 -3.52 0.22 0-1.23
Knee Prosthesis 12 6.72 5.28 1.79 0.92-3.12
Abdominal Hysterectomy 2 1.46 0.54 1.37 0.15-4.95
11907 Nason Hospital
Hip Prosthesis 2 0.21 1.79 9.62 1.08-34.73
Knee Prosthesis 0 0.37 -0.37 0.00 0-9.96
Abdominal Hysterectomy 0 0.15 -0.15 0.00 0-24.70
11919 Nazareth Hospital
Hip Prosthesis 4 1.86 2.14 2.15 0.58-5.49
Knee Prosthesis 1 1.56 -0.56 0.64 0.01-3.57
12298 Ohio Valley General Hospital
Cardiac Procedures 0 0.01 -0.01 0.00 0-349.34
Hip Prosthesis 2 0.93 1.07 2.15 0.24-7.77

139
Org ID & Hospital Procedure Type
Observed Predicted Difference Adjusted
SIR Confidence
Interval
12298 Ohio Valley General Hospital
Knee Prosthesis 1 0.94 0.06 1.07 0.01-5.93
Abdominal Hysterectomy 0 0.16 -0.16 0.00 0-22.59
12396 Palmerton Hospital
Hip Prosthesis 0 0.44 -0.44 0.00 0-8.33
Knee Prosthesis 0 0.52 -0.52 0.00 0-7.03
11814 Penn Presbyterian Medical Center
Cardiac Procedures 2 3.59 -1.59 0.56 0.06-2.01
Cardiac Bypass – Dual Incision 2 4.71 -2.71 0.42 0.05-1.53
Cardiac Bypass – Single Incision 2 0.46 1.54 4.36 0.49-15.76
Hip Prosthesis 10 7.55 2.45 1.32 0.63-2.44
Knee Prosthesis 8 6.77 1.23 1.18 0.51-2.33
Abdominal Hysterectomy 0 0.17 -0.17 0.00 0-21.54
11448 Pennsylvania Hospital of the University of Pennsylvania
Cardiac Procedures 0 0.51 -0.51 0.00 0-7.15
Cardiac Bypass – Dual Incision 8 2.65 5.35 3.01 1.30-5.94
Cardiac Bypass – Single Incision 0 0.07 -0.07 0.00 0-54.02
Hip Prosthesis 12 8.42 3.58 1.42 0.74-2.49
Knee Prosthesis 8 10.42 -2.42 0.77 0.33-1.51
Abdominal Hysterectomy 7 2.55 4.45 2.74 1.10-5.65
11836 Phoenixville Hospital Company
Cardiac Procedures 0 0.27 -0.27 0.00 0-13.49
Cardiac Bypass – Dual Incision 1 1.49 -0.49 0.67 0.01-3.74
Cardiac Bypass – Single Incision 0 0.18 -0.18 0.00 0-20.45
Hip Prosthesis 0 1.03 -1.03 0.00 0-3.57
Knee Prosthesis 1 1.23 -0.23 0.81 0.01-4.51
Abdominal Hysterectomy 2 0.78 1.22 2.56 0.29-9.25
10122 Pinnacle Health Hospital
Cardiac Procedures 2 1.39 0.61 1.44 0.16-5.21
Cardiac Bypass – Dual Incision 9 8.00 1.00 1.12 0.51-2.14
Cardiac Bypass – Single Incision 0 0.85 -0.85 0.00 0-4.32
Hip Prosthesis 21 12.83 8.17 1.64 1.01-2.50
Knee Prosthesis 17 14.51 2.49 1.17 0.68-1.88
Abdominal Hysterectomy 4 4.74 -0.74 0.84 0.23-2.16
11772 Pocono Medical Center
Cardiac Procedures 1 0.14 0.86 7.33 0.10-40.76
Cardiac Bypass – Dual Incision 3 2.98 0.02 1.01 0.20-2.94
Hip Prosthesis 5 0.80 4.20 6.25 2.02-14.59
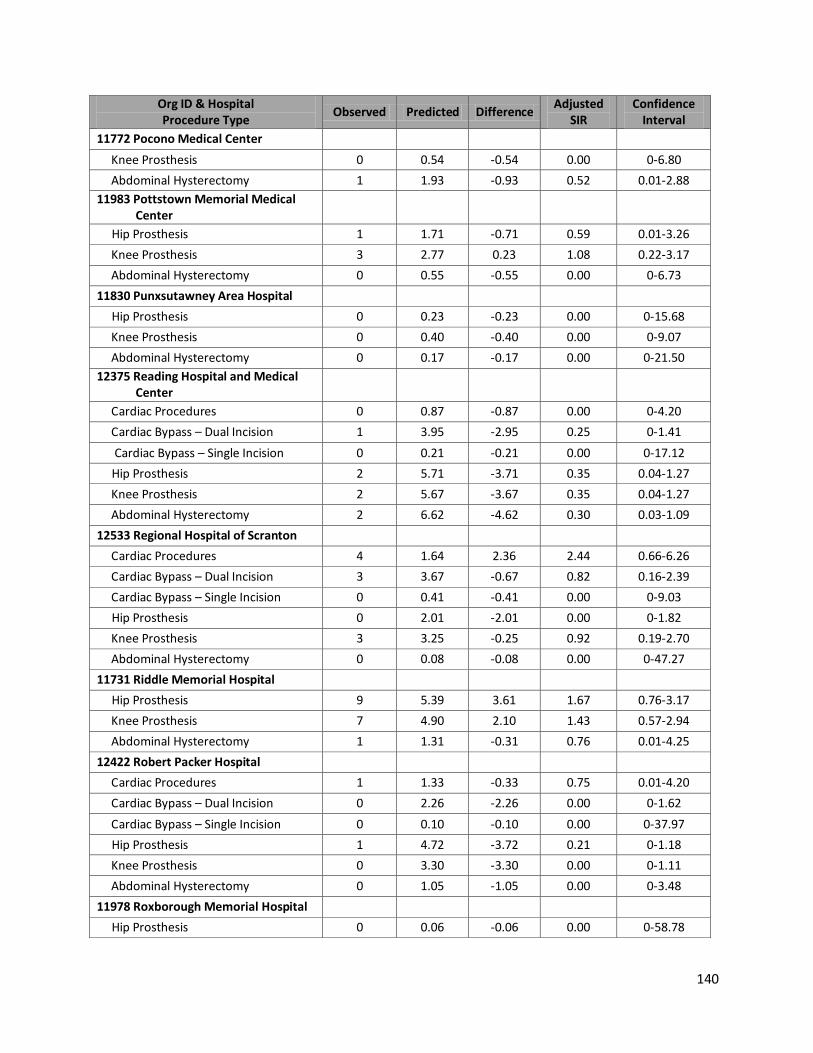
140
Org ID & Hospital Procedure Type
Observed Predicted Difference Adjusted
SIR Confidence
Interval
11772 Pocono Medical Center
Knee Prosthesis 0 0.54 -0.54 0.00 0-6.80
Abdominal Hysterectomy 1 1.93 -0.93 0.52 0.01-2.88
11983 Pottstown Memorial Medical Center
Hip Prosthesis 1 1.71 -0.71 0.59 0.01-3.26
Knee Prosthesis 3 2.77 0.23 1.08 0.22-3.17
Abdominal Hysterectomy 0 0.55 -0.55 0.00 0-6.73
11830 Punxsutawney Area Hospital
Hip Prosthesis 0 0.23 -0.23 0.00 0-15.68
Knee Prosthesis 0 0.40 -0.40 0.00 0-9.07
Abdominal Hysterectomy 0 0.17 -0.17 0.00 0-21.50
12375 Reading Hospital and Medical Center
Cardiac Procedures 0 0.87 -0.87 0.00 0-4.20
Cardiac Bypass – Dual Incision 1 3.95 -2.95 0.25 0-1.41
Cardiac Bypass – Single Incision 0 0.21 -0.21 0.00 0-17.12
Hip Prosthesis 2 5.71 -3.71 0.35 0.04-1.27
Knee Prosthesis 2 5.67 -3.67 0.35 0.04-1.27
Abdominal Hysterectomy 2 6.62 -4.62 0.30 0.03-1.09
12533 Regional Hospital of Scranton
Cardiac Procedures 4 1.64 2.36 2.44 0.66-6.26
Cardiac Bypass – Dual Incision 3 3.67 -0.67 0.82 0.16-2.39
Cardiac Bypass – Single Incision 0 0.41 -0.41 0.00 0-9.03
Hip Prosthesis 0 2.01 -2.01 0.00 0-1.82
Knee Prosthesis 3 3.25 -0.25 0.92 0.19-2.70
Abdominal Hysterectomy 0 0.08 -0.08 0.00 0-47.27
11731 Riddle Memorial Hospital
Hip Prosthesis 9 5.39 3.61 1.67 0.76-3.17
Knee Prosthesis 7 4.90 2.10 1.43 0.57-2.94
Abdominal Hysterectomy 1 1.31 -0.31 0.76 0.01-4.25
12422 Robert Packer Hospital
Cardiac Procedures 1 1.33 -0.33 0.75 0.01-4.20
Cardiac Bypass – Dual Incision 0 2.26 -2.26 0.00 0-1.62
Cardiac Bypass – Single Incision 0 0.10 -0.10 0.00 0-37.97
Hip Prosthesis 1 4.72 -3.72 0.21 0-1.18
Knee Prosthesis 0 3.30 -3.30 0.00 0-1.11
Abdominal Hysterectomy 0 1.05 -1.05 0.00 0-3.48
11978 Roxborough Memorial Hospital
Hip Prosthesis 0 0.06 -0.06 0.00 0-58.78

141
Org ID & Hospital Procedure Type
Observed Predicted Difference Adjusted
SIR Confidence
Interval
11978 Roxborough Memorial Hospital
Knee Prosthesis 0 0.26 -0.26 0.00 0-13.92
Abdominal Hysterectomy 0 0.14 -0.14 0.00 0-27.07
11684 Sacred Heart Hospital
Hip Prosthesis 0 0.58 -0.58 0.00 0-6.32
Knee Prosthesis 4 1.08 2.92 3.72 1.00-9.52
Abdominal Hysterectomy 3 3.38 -0.38 0.89 0.18-2.59
12365 St Catherine Medical Center
Hip Prosthesis 0 0.05 -0.05 0.00 0-80.97
Knee Prosthesis 0 0.08 -0.08 0.00 0-44.46
Abdominal Hysterectomy 0 0.12 -0.12 0.00 0-30.57
10561 St Clair Memorial Hospital
Cardiac Procedures 0 0.74 -0.74 0.00 0-4.94
Cardiac Bypass – Dual Incision 1 2.88 -1.88 0.35 0-1.93
Cardiac Bypass – Single Incision 0 0.06 -0.06 0.00 0-66.45
Hip Prosthesis 8 3.67 4.33 2.18 0.94-4.29
Knee Prosthesis 5 4.50 0.50 1.11 0.36-2.59
Abdominal Hysterectomy 3 2.37 0.63 1.27 0.25-3.70
12290 St Christopher’s Hospital for Children
Cardiac Procedures 1 0.72 0.28 1.39 0.02-7.71
11961 St Joseph Medical Center
Cardiac Procedures 1 0.36 0.64 2.81 0.04-15.64
Cardiac Bypass – Dual Incision 3 1.65 1.35 1.82 0.37-5.32
Cardiac Bypass – Single Incision 0 0.01 -0.01 0.00 0-265.80
Hip Prosthesis 1 1.21 -0.21 0.82 0.01-4.58
Knee Prosthesis 1 1.22 -0.22 0.82 0.01-4.55
Abdominal Hysterectomy 3 1.31 1.69 2.28 0.46-6.67
12438 St Joseph’s Hospital
Abdominal Hysterectomy 2 0.31 1.69 6.37 0.72-23.00
11718 St Luke’s Hospital Bethlehem
Cardiac Procedures 0 1.37 -1.37 0.00 0-2.69
Cardiac Bypass – Dual Incision 2 2.77 -0.77 0.72 0.08-2.61
Cardiac Bypass – Single Incision 0 0.10 -0.10 0.00 0-37.97
Hip Prosthesis 5 4.06 0.94 1.23 0.40-2.87
Knee Prosthesis 4 3.36 0.64 1.19 0.32-3.05
Abdominal Hysterectomy 1 1.78 -0.78 0.56 0.01-3.12
11784 St Luke’s Miners Memorial Hospital
Hip Prosthesis 0 0.09 -0.09 0.00 0-39.32

142
Org ID & Hospital Procedure Type
Observed Predicted Difference Adjusted
SIR Confidence
Interval
11784 St Luke’s Miners Memorial Hospital
Knee Prosthesis 1 1.12 -0.12 0.89 0.01-4.96
Abdominal Hysterectomy 0 0.18 -0.18 0.00 0-20.79
11711 St Luke’s Quakertown
Hip Prosthesis 0 0.49 -0.49 0.00 0-7.56
Knee Prosthesis 1 0.32 0.66 3.11 0.04-17.28
Abdominal Hysterectomy 0 0.08 -0.08 0.00 0-45.85
11885 St Mary Medical Center
Cardiac Procedures 2 0.65 1.35 3.08 0.35-11.12
Cardiac Bypass – Dual Incision 4 3.00 1.00 1.33 0.36-3.41
Cardiac Bypass – Single Incision 1 0.16 0.84 6.08 0.08-33.82
Hip Prosthesis 1 3.26 -2.26 0.31 0-1.71
Knee Prosthesis 4 3.52 0.48 1.14 0.31-2.91
Abdominal Hysterectomy 1 1.38 -0.38 0.73 0.01-4.04
11699 Saint Vincent Health Center
Cardiac Procedures 0 1.72 -1.72 0.00 0-2.14
Cardiac Bypass – Dual Incision 7 7.46 -0.46 0.94 0.38-1.93
Cardiac Bypass – Single Incision 1 0.12 0.88 8.20 0.11-45.61
Hip Prosthesis 0 3.28 -3.28 0.00 0-1.12
Knee Prosthesis 1 3.29 -2.29 0.30 0-1.69
Abdominal Hysterectomy 3 3.13 -0.13 0.96 0.19-2.80
11922 Schuylkill Medical Center – East Norwegian Street
Hip Prosthesis 0 0.92 -0.92 0.00 0-3.97
Knee Prosthesis 1 0.73 0.27 1.36 0.02-7.57
Abdominal Hysterectomy 0 0.03 -0.03 0.00 0-118.71
12087 Schuylkill Medical Center – South Jackson Street
Hip Prosthesis 0 0.81 -0.81 0.00 0-4.51
Knee Prosthesis 1 0.77 0.23 1.29 0.02-7.19
Abdominal Hysterectomy 3 1.44 1.56 2.08 0.42-6.08
12133 Shamokin Area Community Hospital
Hip Prosthesis 1 0.45 0.55 2.24 0.03-12.48
Knee Prosthesis 0 0.56 -0.56 0.00 0-6.56
Abdominal Hysterectomy 0 0.01 -0.01 0.00 0-346.05
12250 Sharon Regional Health System
Cardiac Procedures 0 0.25 -0.25 0.00 0-14.61
Cardiac Bypass – Dual Incision 0 1.23 -1.23 0.00 0-2.97
Cardiac Bypass – Single Incision 0 0.01 -0.01 0.00 0-265.80

143
Org ID & Hospital Procedure Type
Observed Predicted Difference Adjusted
SIR Confidence
Interval
12250 Sharon Regional Health System
Hip Prosthesis 0 2.53 -2.53 0.00 0-1.45
Knee Prosthesis 2 2.32 -0.32 0.86 0.10-3.11
Abdominal Hysterectomy 0 0.34 -0.34 0.00 0-10.90
11688 Soldiers & Sailors Memorial Hospital
Hip Prosthesis 0 0.28 -0.28 0.00 0-13.28
Knee Prosthesis 2 0.35 1.65 5.66 0.64-20.44
Abdominal Hysterectomy 0 0.41 -0.41 0.00 0-8.87
12282 Somerset Hospital
Hip Prosthesis 0 0.43 -0.43 0.00 0-8.52
Knee Prosthesis 0 0.50 -0.50 0.00 0-7.41
Abdominal Hysterectomy 0 0.42 -0.42 0.00 0-8.83
11942 Southwest Regional Medical Center
Hip Prosthesis 0 0.18 -0.18 0.00 0-20.82
Knee Prosthesis 0 0.15 -0.15 0.00 0-24.24
Abdominal Hysterectomy 0 0.10 -0.10 0.00 0-35.72
12105 Sunbury Community Hospital
Hip Prosthesis 1 0.78 0.22 1.28 0.02-7.09
Knee Prosthesis 2 0.25 1.75 8.08 0.91-29.18
12535 Surgical Institute of Reading
Hip Prosthesis 0 1.18 -1.18 0.00 0-3.11
Knee Prosthesis 0 2.13 -2.13 0.00 0-1.72
Abdominal Hysterectomy 0 0.06 -0.06 0.00 0-62.38
12382 Temple University Hospital
Cardiac Procedures 0 0.98 -0.98 0.00 0-3.74
Cardiac Bypass – Dual Incision 4 2.97 1.03 1.35 0.36-3.45
Cardiac Bypass – Single Incision 0 0.12 -0.12 0.00 0-29.53
Hip Prosthesis 3 2.15 0.85 1.39 0.28-4.07
Knee Prosthesis 2 2.92 -0.92 0.68 0.08-2.47
Abdominal Hysterectomy 3 5.50 -2.50 0.55 0.11-1.59
11506 Thomas Jefferson University Hospital
Cardiac Procedures 1 1.41 -0.41 0.71 0.01-3.94
Cardiac Bypass – Dual Incision 6 2.50 3.50 2.40 0.88-5.23
Cardiac Bypass – Single Incision 0 0.18 -0.18 0.00 0-20.96
Hip Prosthesis 11 13.90 -2.90 0.79 0.39-1.42
Knee Prosthesis 15 8.96 6.04 1.67 0.94-2.76
Abdominal Hysterectomy 4 4.10 -0.10 0.98 0.26-2.50

144
Org ID & Hospital Procedure Type
Observed Predicted Difference Adjusted
SIR Confidence
Interval
12017 Thomas Jefferson University Hospital - Methodist
Hip Prosthesis 1 0.57 0.44 1.77 0.02-9.85
Knee Prosthesis 1 0.31 0.69 3.27 0.04-18.21
Abdominal Hysterectomy 0 0.17 -0.17 0.00 0-21.20
11738 Titusville Area Hospital
Hip Prosthesis 0 0.12 -0.12 0.00 0-30.93
Knee Prosthesis 0 0.10 -0.10 0.00 0-35.10
Abdominal Hysterectomy 2 0.51 1.49 3.93 0.44-14.20
12018 Troy Community Hospital
Abdominal Hysterectomy 0 0.04 -0.04 0.00 0-91.70
11829 Tyler Memorial Hospital
Hip Prosthesis 0 0.05 -0.05 0.00 0-80.97
Knee Prosthesis 0 0.08 -0.08 0.00 0-44.30
12717 Tyrone Hospital
Hip Prosthesis 0 0.07 -0.07 0.00 0-55.75
Knee Prosthesis 0 0.02 -0.02 0.00 0-203.78
Abdominal Hysterectomy 0 0.01 -0.01 0.00 0-346.05
10441 Uniontown Hospital
Hip Prosthesis 7 2.52 4.48 2.78 1.11-5.73
Knee Prosthesis 7 2.36 4.64 2.96 1.19-6.10
Abdominal Hysterectomy 5 2.39 2.61 2.09 0.67-4.88
11680 UPMC Bedford
Hip Prosthesis 0 0.12 -0.12 0.00 0-30.75
Knee Prosthesis 1 0.38 0.62 2.60 0.03-14.48
Abdominal Hysterectomy 1 0.98 0.02 1.02 0.01-5.69
11725 UPMC Hamot
Cardiac Procedures 1 0.89 0.11 1.13 0.01-6.28
Cardiac Bypass – Dual Incision 6 4.74 1.26 1.27 0.46-2.76
Cardiac Bypass – Single Incision 3 1.99 1.01 1.51 0.30-4.41
Hip Prosthesis 8 4.46 3.54 1.79 0.77-3.54
Knee Prosthesis 5 4.08 0.92 1.23 0.39-2.86
Abdominal Hysterectomy 0 0.75 -0.75 0.00 0-4.90
11675 UPMC Horizon
Hip Prosthesis 3 2.00 1.00 1.50 0.30-4.38
Knee Prosthesis 5 3.41 1.59 1.47 0.47-3.42
Abdominal Hysterectomy 1 1.06 -0.06 0.95 0.01-5.27
11707 UPMC McKeesport
Hip Prosthesis 1 1.04 -0.04 0.96 0.01-5.35
Knee Prosthesis 1 0.44 0.56 2.25 0.03-12.54
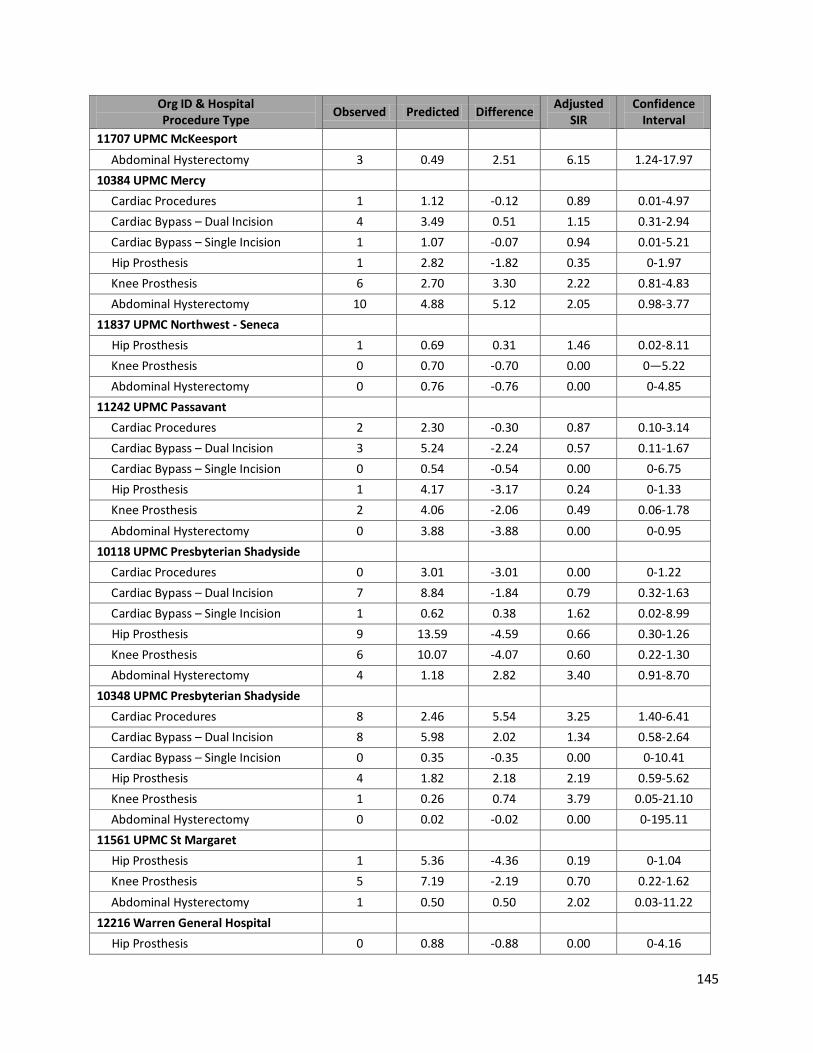
145
Org ID & Hospital Procedure Type
Observed Predicted Difference Adjusted
SIR Confidence
Interval
11707 UPMC McKeesport
Abdominal Hysterectomy 3 0.49 2.51 6.15 1.24-17.97
10384 UPMC Mercy
Cardiac Procedures 1 1.12 -0.12 0.89 0.01-4.97
Cardiac Bypass – Dual Incision 4 3.49 0.51 1.15 0.31-2.94
Cardiac Bypass – Single Incision 1 1.07 -0.07 0.94 0.01-5.21
Hip Prosthesis 1 2.82 -1.82 0.35 0-1.97
Knee Prosthesis 6 2.70 3.30 2.22 0.81-4.83
Abdominal Hysterectomy 10 4.88 5.12 2.05 0.98-3.77
11837 UPMC Northwest - Seneca
Hip Prosthesis 1 0.69 0.31 1.46 0.02-8.11
Knee Prosthesis 0 0.70 -0.70 0.00 0—5.22
Abdominal Hysterectomy 0 0.76 -0.76 0.00 0-4.85
11242 UPMC Passavant
Cardiac Procedures 2 2.30 -0.30 0.87 0.10-3.14
Cardiac Bypass – Dual Incision 3 5.24 -2.24 0.57 0.11-1.67
Cardiac Bypass – Single Incision 0 0.54 -0.54 0.00 0-6.75
Hip Prosthesis 1 4.17 -3.17 0.24 0-1.33
Knee Prosthesis 2 4.06 -2.06 0.49 0.06-1.78
Abdominal Hysterectomy 0 3.88 -3.88 0.00 0-0.95
10118 UPMC Presbyterian Shadyside
Cardiac Procedures 0 3.01 -3.01 0.00 0-1.22
Cardiac Bypass – Dual Incision 7 8.84 -1.84 0.79 0.32-1.63
Cardiac Bypass – Single Incision 1 0.62 0.38 1.62 0.02-8.99
Hip Prosthesis 9 13.59 -4.59 0.66 0.30-1.26
Knee Prosthesis 6 10.07 -4.07 0.60 0.22-1.30
Abdominal Hysterectomy 4 1.18 2.82 3.40 0.91-8.70
10348 UPMC Presbyterian Shadyside
Cardiac Procedures 8 2.46 5.54 3.25 1.40-6.41
Cardiac Bypass – Dual Incision 8 5.98 2.02 1.34 0.58-2.64
Cardiac Bypass – Single Incision 0 0.35 -0.35 0.00 0-10.41
Hip Prosthesis 4 1.82 2.18 2.19 0.59-5.62
Knee Prosthesis 1 0.26 0.74 3.79 0.05-21.10
Abdominal Hysterectomy 0 0.02 -0.02 0.00 0-195.11
11561 UPMC St Margaret
Hip Prosthesis 1 5.36 -4.36 0.19 0-1.04
Knee Prosthesis 5 7.19 -2.19 0.70 0.22-1.62
Abdominal Hysterectomy 1 0.50 0.50 2.02 0.03-11.22
12216 Warren General Hospital
Hip Prosthesis 0 0.88 -0.88 0.00 0-4.16
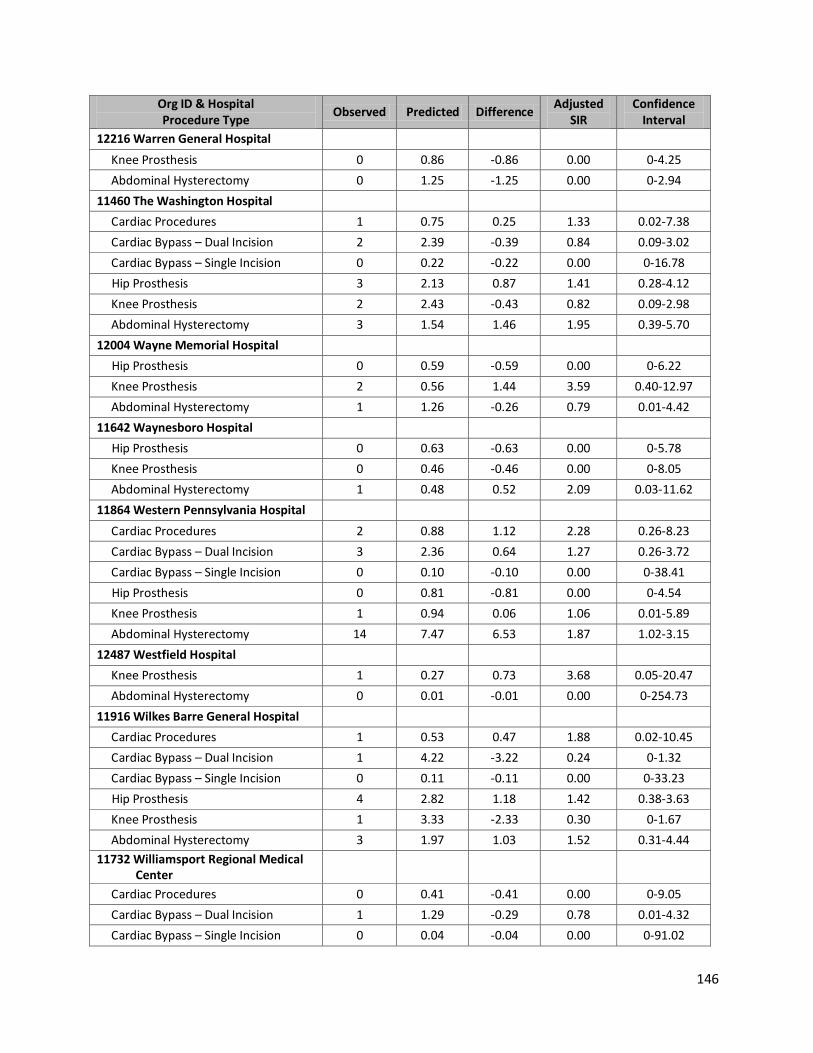
146
Org ID & Hospital Procedure Type
Observed Predicted Difference Adjusted
SIR Confidence
Interval
12216 Warren General Hospital
Knee Prosthesis 0 0.86 -0.86 0.00 0-4.25
Abdominal Hysterectomy 0 1.25 -1.25 0.00 0-2.94
11460 The Washington Hospital
Cardiac Procedures 1 0.75 0.25 1.33 0.02-7.38
Cardiac Bypass – Dual Incision 2 2.39 -0.39 0.84 0.09-3.02
Cardiac Bypass – Single Incision 0 0.22 -0.22 0.00 0-16.78
Hip Prosthesis 3 2.13 0.87 1.41 0.28-4.12
Knee Prosthesis 2 2.43 -0.43 0.82 0.09-2.98
Abdominal Hysterectomy 3 1.54 1.46 1.95 0.39-5.70
12004 Wayne Memorial Hospital
Hip Prosthesis 0 0.59 -0.59 0.00 0-6.22
Knee Prosthesis 2 0.56 1.44 3.59 0.40-12.97
Abdominal Hysterectomy 1 1.26 -0.26 0.79 0.01-4.42
11642 Waynesboro Hospital
Hip Prosthesis 0 0.63 -0.63 0.00 0-5.78
Knee Prosthesis 0 0.46 -0.46 0.00 0-8.05
Abdominal Hysterectomy 1 0.48 0.52 2.09 0.03-11.62
11864 Western Pennsylvania Hospital
Cardiac Procedures 2 0.88 1.12 2.28 0.26-8.23
Cardiac Bypass – Dual Incision 3 2.36 0.64 1.27 0.26-3.72
Cardiac Bypass – Single Incision 0 0.10 -0.10 0.00 0-38.41
Hip Prosthesis 0 0.81 -0.81 0.00 0-4.54
Knee Prosthesis 1 0.94 0.06 1.06 0.01-5.89
Abdominal Hysterectomy 14 7.47 6.53 1.87 1.02-3.15
12487 Westfield Hospital
Knee Prosthesis 1 0.27 0.73 3.68 0.05-20.47
Abdominal Hysterectomy 0 0.01 -0.01 0.00 0-254.73
11916 Wilkes Barre General Hospital
Cardiac Procedures 1 0.53 0.47 1.88 0.02-10.45
Cardiac Bypass – Dual Incision 1 4.22 -3.22 0.24 0-1.32
Cardiac Bypass – Single Incision 0 0.11 -0.11 0.00 0-33.23
Hip Prosthesis 4 2.82 1.18 1.42 0.38-3.63
Knee Prosthesis 1 3.33 -2.33 0.30 0-1.67
Abdominal Hysterectomy 3 1.97 1.03 1.52 0.31-4.44
11732 Williamsport Regional Medical Center
Cardiac Procedures 0 0.41 -0.41 0.00 0-9.05
Cardiac Bypass – Dual Incision 1 1.29 -0.29 0.78 0.01-4.32
Cardiac Bypass – Single Incision 0 0.04 -0.04 0.00 0-91.02
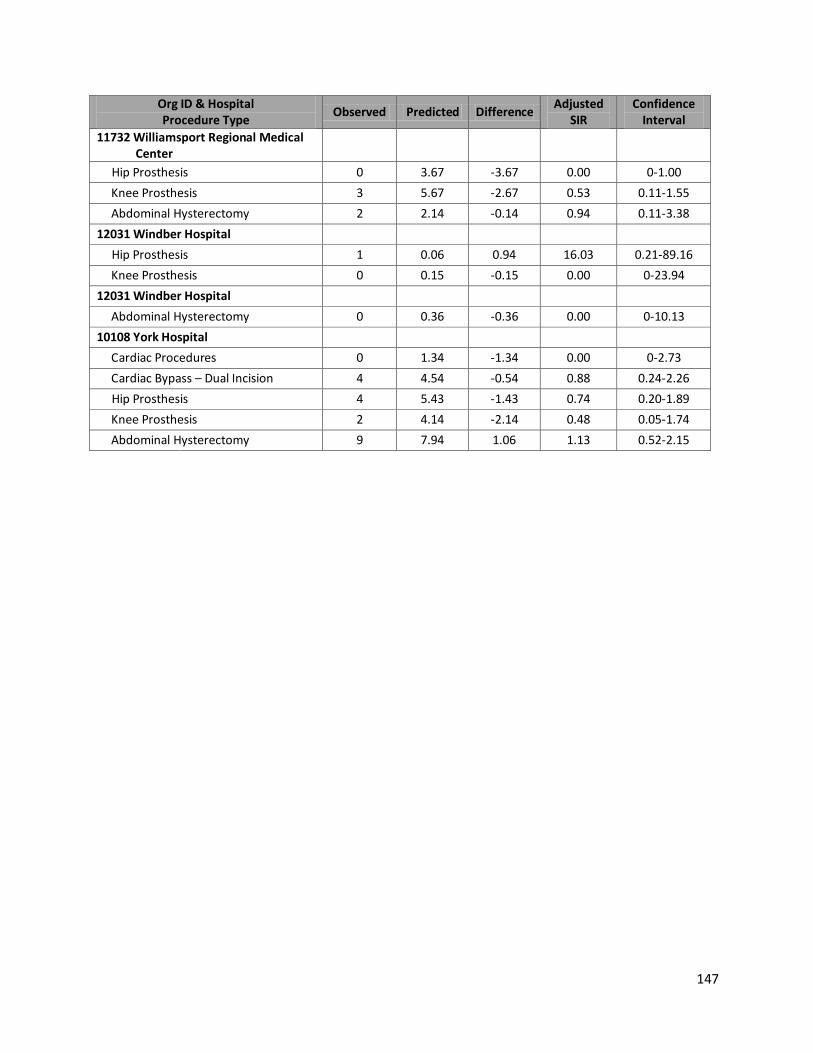
147
Org ID & Hospital Procedure Type
Observed Predicted Difference Adjusted
SIR Confidence
Interval
11732 Williamsport Regional Medical Center
Hip Prosthesis 0 3.67 -3.67 0.00 0-1.00
Knee Prosthesis 3 5.67 -2.67 0.53 0.11-1.55
Abdominal Hysterectomy 2 2.14 -0.14 0.94 0.11-3.38
12031 Windber Hospital
Hip Prosthesis 1 0.06 0.94 16.03 0.21-89.16
Knee Prosthesis 0 0.15 -0.15 0.00 0-23.94
12031 Windber Hospital
Abdominal Hysterectomy 0 0.36 -0.36 0.00 0-10.13
10108 York Hospital
Cardiac Procedures 0 1.34 -1.34 0.00 0-2.73
Cardiac Bypass – Dual Incision 4 4.54 -0.54 0.88 0.24-2.26
Hip Prosthesis 4 5.43 -1.43 0.74 0.20-1.89
Knee Prosthesis 2 4.14 -2.14 0.48 0.05-1.74
Abdominal Hysterectomy 9 7.94 1.06 1.13 0.52-2.15

148
Influenza Vaccination of Healthcare Providers Vaccination of healthcare personnel (HCP) against influenza is an important indicator and measure of institutional commitment to patient safety. Influenza vaccination is the single most effective way of preventing influenza. Influenza vaccination keeps HCP healthy, protects their families and likely reduces the risk of transmission in healthcare settings. Vaccinating HCP against influenza protects patients by not exposing them to infected personnel, decreasing absenteeism, and promoting a healthy workforce to care for those who tend to be most at risk. Initiatives to promote universal influenza vaccination HCP are strongly encouraged for all hospitals in Pennsylvania to achieve the Healthy People 2020 goal of at least 90 percent coverage. PADOH has decided to publish in its annual report hospital-specific levels of influenza vaccination coverage to disseminate information on this important measure of institutional commitment to patient safety. Act 52 does not require hospitals to provide this information. The information provided in this section is voluntarily provided by the hospitals, and the hospitals will not be benchmarked by PADOH in this category. However, federal initiatives and changes to Joint Commission Accreditation Standards make it critical for healthcare institutions to have effective healthcare personnel influenza vaccination programs in place:
Healthcare personnel influenza vaccination rates will be tied to Medicare reimbursement. On August 18, 2011, the Centers for Medicare & Medicaid Services (CMS) published a final rule requiring acute care hospitals to report healthcare personnel influenza vaccination rates through CDC's National Healthcare Safety Network (NHSN). Fiscal year 2015 payments under Medicare's inpatient prospective payment system (IPPS) will be reduced by two percent if acute care hospitals fail to report required quality measures starting in January 2013. Quality data also are made publicly available on CMS’s Hospital Compare website.
The Joint Commission has issued accreditation standards to encourage influenza vaccination rates among healthcare personnel to achieve vaccination of healthcare personnel of 90 percent or better. In addition to hospitals (including critical access hospitals), these standards will apply to ambulatory, behavioral, home care, laboratory, long-term care, and office-based surgery facilities.
In the spring of 2012, PADOH, with the assistance of the Pennsylvania Healthcare Quality Alliance (PHCQA), conducted a web-based survey of inpatient facilities in Pennsylvania to assess the patterns and levels of influenza vaccination among the healthcare workforce in the state. PADOH also conducted a number of trainings to increase facilities' ability to meet CMS and JC influenza vaccination reporting requirements. The survey assessed HCP influenza vaccination rates in inpatient facilities during the 2011-2012 influenza season. The following definitions were used, consistent with National Quality Forum (NQF) metric. Numerator HCP who during the time from Oct. 1 (or when the vaccine became available), 2011 through March 31, 2012:
149
received influenza vaccine administered at the healthcare facility, or reported in writing (paper or electronic) or provided documentation that influenza vaccination was received elsewhere, or
were determined to have a medical contraindication/condition of severe allergic reaction to eggs or to other component(s) of the vaccine, or history of Guillain-Barre Syndrome within 6 weeks after a previous influenza vaccination, or
declined influenza vaccination, or
had unknown vaccination status or did not fall into the other categories above.
Numbers are calculated separately for each of the above groups. Denominator Number of HCP who worked in the healthcare facility for at least 30 working days between October 1, 2011 and March 31, 2012, irrespective of clinical responsibility or patient contact. Denominators are calculated separately for:
Employees: all persons who receive a direct paycheck from the reporting facility (i.e., on the facility's payroll).
Licensed independent practitioners (LIP): include physicians (MD, DO), advanced practice nurses, and physician assistants only who are affiliated with the reporting facility but do not receive a direct paycheck from the reporting facility.
Adult students/trainees and volunteers (STV): include all adult students/trainees and volunteers who do not receive a direct paycheck from the reporting facility.
PADOH provided additional guidance for the survey as follows: For each group, persons who worked at the facility for at least 30 days between Oct. 1, 2011 (or whenever the vaccine first became available at your facility) and March 31, 2012 should be included. If the facility does not know if an individual worked at the facility for 30 days or more during the period, they should be included in the count as if they did. This may result in persons being included in counts for multiple facilities, particularly in health systems where persons have privileges in multiple facilities. While the Joint Commission also recommends including a category for contractors, at the time of the survey many hospitals did not have access to this type of information. This type of information may be collected in the future. Findings Among the 254 Pennsylvania hospitals that reported data to NHSN in 2011, 236 (93%) voluntarily participated in the survey. Overall participation and reported employee vaccination rates by facility size (number of beds) and facility type (e.g., Children's Hospital) from PADOH administrative records, and facility ownership description (e.g., not-for-profit), and medical school affiliation from NHSN data are found in Table 29.
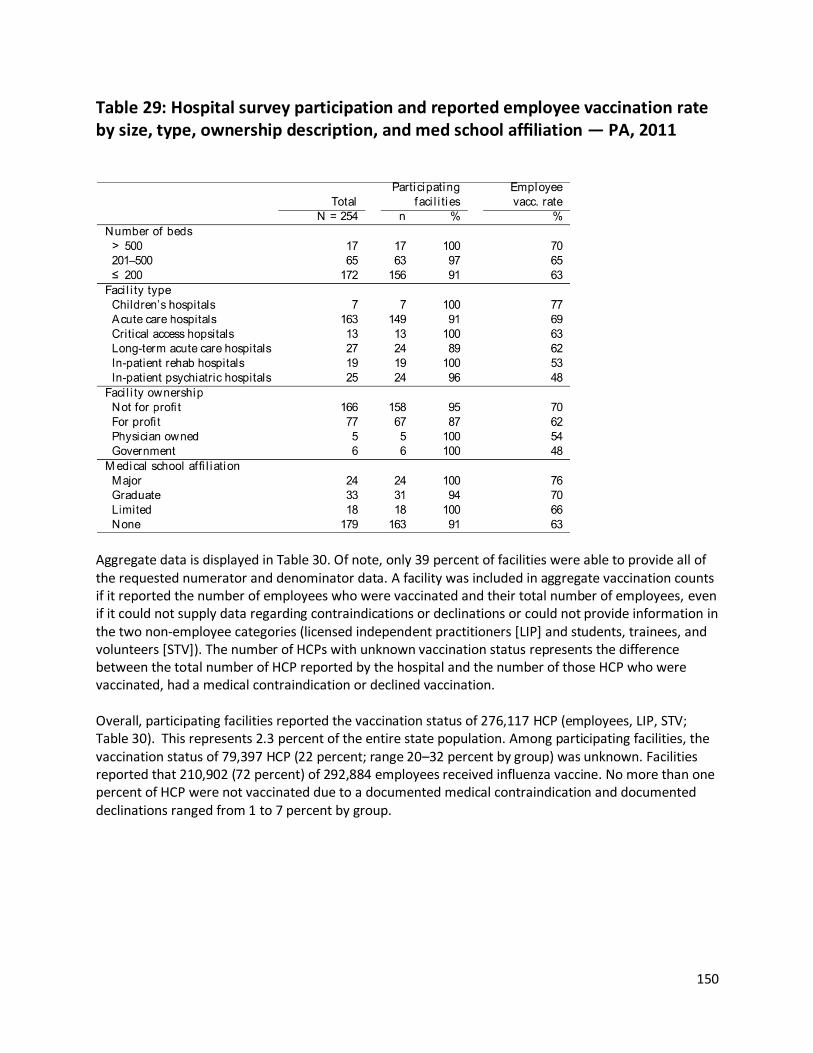
150
Table 29: Hospital survey participation and reported employee vaccination rate by size, type, ownership description, and med school affiliation — PA, 2011
Aggregate data is displayed in Table 30. Of note, only 39 percent of facilities were able to provide all of the requested numerator and denominator data. A facility was included in aggregate vaccination counts if it reported the number of employees who were vaccinated and their total number of employees, even if it could not supply data regarding contraindications or declinations or could not provide information in the two non-employee categories (licensed independent practitioners [LIP] and students, trainees, and volunteers [STV]). The number of HCPs with unknown vaccination status represents the difference between the total number of HCP reported by the hospital and the number of those HCP who were vaccinated, had a medical contraindication or declined vaccination. Overall, participating facilities reported the vaccination status of 276,117 HCP (employees, LIP, STV; Table 30). This represents 2.3 percent of the entire state population. Among participating facilities, the vaccination status of 79,397 HCP (22 percent; range 20–32 percent by group) was unknown. Facilities reported that 210,902 (72 percent) of 292,884 employees received influenza vaccine. No more than one percent of HCP were not vaccinated due to a documented medical contraindication and documented declinations ranged from 1 to 7 percent by group.

151
Table 30: Vaccination status of health care personnel by personnel type among all participating facilities (N=236) — PA, 2011
The median employee vaccination rate for the 236 participating hospitals was 65 percent. However, employee vaccination rates varied substantially between facilities (Figure 13). Among the 236 participating hospitals, 44 (19 percent) achieved an employee vaccination rate of 90 percent or better and only six (3 percent) achieved a 90 percent or better rate among all three targeted groups (employees, LIPs and STVs; Table 31). The six hospitals that achieved 90 percent coverage in all groups are shown with an asterisk in Table 31.
Figure 13: Distribution of facility employee vaccination rates — PA, 2011

152
Table 31: Facilities achieving an employee vaccination rate of 90% or better Pennsylvania 2011 (N = 44)
*Facilities that achieved vaccination rates of 90% or better among employees, LIPs, and STVs

153
Conclusions
The 2011 report on healthcare-associated infections (HAIs) in Pennsylvania provides evidence that hospitals across the commonwealth continue to make steady progress in reducing these medical complications. Since the baseline year of 2009, the overall rate of HAIs has declined by 3-4 percent annually in each subsequent year of data collection. Although this rate of decline may appear modest, given the volume of in-patient care in a large state like Pennsylvania, it represents a decrease of thousands of HAIs. This is a significant achievement with a substantial impact on patient care. This is due to the high mortality associated with HAIs, the increased duration of hospitalization, and the need for re-hospitalization, and the significant additional healthcare costs. It has been estimated* that the average cost of any type of HAI is between $14,000-15,000, considering only direct medical costs. HAIs such as bloodstream infections and surgical site infections are known to be much costlier. Using conservative estimates, the reductions seen in just the past two years in Pennsylvania have saved a minimum of $34 million in the direct health care costs that would have been associated with those HAIs. Reductions in the benchmarking categories of CAUTIs (9.4 percent), CLABSIs (4.3 percent) and SSIs (5.9 percent), were also noted in the current report, as they were in previous years. However, the >20 percent declines in CLABSIs reported in both 2009 and 2010 are considerably greater than the decline seen in 2011. The reasons for this “leveling-off” in the decline are unclear. Some CLABSIs may be easier to prevent than others, as the underlying health status of the patient or the complexity of care being administered may vary. It is also possible that current prevention strategies curtail the occurrence of some CLABSIs more successfully than others, and the proportion of infections that are preventable using current interventions may be reached. The validity of this assertion, and whether or not the small decline seen in 2011 is an aberration, can only be determined by analyzing additional data in the years to come. As found in the sections on CAUTIs and CLABSIs, there has been virtually no change over time in the utilization of urinary catheters and central lines in Pennsylvania hospitals, as noted by the device utilization ratio (DUR). This is noteworthy, as strategies to reduce the occurrence of CAUTIs and CLABSIs include removal of the devices as soon as feasible through the use of automated reminders and daily assessments. This suggests that other factors (such as improved line maintenance or catheter care) may be related to the remarkable declines in incidence seen in the past two years. It also suggests that excessive use of these devices may not be occurring in Pennsylvania. The reductions seen in Pennsylvania are the result of a concerted effort on the part of the infection prevention community to address the problem of HAIs. Some of the factors that have contributed to the favorable trends are the increased spotlight on HAIs by the public; public reporting of data; implementation of prevention strategies by infection preventionists, health care providers and health care systems; participation in prevention collaboratives; increased scrutiny by hospital administration; and federal efforts to link incentive payments to successful control of HAIs. As seen in the appendix attached to this report, there is significant variation in the rates of HAIs among
154
*Scott RD II, et al. The Direct Medical Costs of Healthcare Associated Infections in US Hospitals and the Benefits of Prevention, CDC 2009 which is available at http://www.cdc.gov/hai/pdfs/hai/scott_costpaper.pdf the 254 hospitals in Pennsylvania. The major reason for these differences is the wide variation in the type of care being provided, the intensity of care, and the patient population being served. Larger tertiary referral centers would be expected to provide more intensive care for sicker patients who are at greater risk for developing an HAI. The analyses presented in this report recognize these differences through the use of risk adjustments methods for the CAUTI, CLABSI and SSI standardized infection ratios. However, these risk adjustment methods are imperfect and cannot fully account for all of these differences between hospitals. It is important to keep this in mind when using the information contained in this report. The HAI rate is only one factor that should be used when making decisions about where to receive health care; it should not necessarily be construed that hospitals with higher rates or SIRs provide “worse” care and hospitals with lower rates and SIRs provide “better” care. Appendix A does allow the user to gauge hospital performance over time, especially whether rates are improving, remaining steady or declining. The information in the appendix is not risk adjusted, as the hospital is only being compared to itself. Unless there is a major change in the hospital (e.g., a change in size, types of procedures or activities) the HAI risk should not vary in the hospital over time. Therefore, changes in rates as noted in the appendix should reflect the hospital’s efforts and commitment to prevent HAIs. However, the information in the appendix should be interpreted with caution for small hospitals. In smaller hospitals, the occurrence of even a single HAI can produce a very high rate for that year (since these hospitals use few central lines or urinary catheters). A small hospital that has only 100 central line days will have a rate of 0.00 if no CLABSIs were recognized that year, but a rate of 10.00 if only a single CLABSI occurs. The section of the 2011 report dealing with healthcare personnel influenza vaccination provides an alternative metric in measuring hospital commitment to patient safety and HAI prevention. It demonstrates that 72 percent of employees received influenza vaccine in the 2011-12 flu season and that the median level of employee vaccination among the 236 reporting hospitals is 65 percent. While these numbers appear slightly better than those that have been reported previously, they are far short of the Healthy People 2020 goal, and there are 54 hospitals that have vaccination rates below 50 percent. There is widespread agreement in the healthcare community that healthcare workers ought to be vaccinated against influenza to protect their own health and to protect the health of their patients. Universal influenza vaccination of the healthcare workforce (generally defined as 90+ percent vaccination coverage) is endorsed by major medical organizations and federal recommendations. As the report demonstrates, almost 20 percent of Pennsylvania’s hospitals have achieved 90+ percent coverage of their employees; far fewer have done so for other groups of personnel providing care in their facility. The hospitals with the highest vaccination coverage have done so through mandatory vaccination policies as a condition of employment. This policy is the only one that has been shown to consistently result in high levels of vaccination (often greater than 98 percent coverage)*. Other methods can also be successful, but generally require a great deal of effort to promote vaccination and encourage personnel to receive the vaccine; they have also been difficult to sustain over time. Hospitals are encouraged to consider mandatory vaccination policies in order to achieve the Healthy People 2020 goal, especially since the Centers for Medicare and Medical Services (CMS) will require submission of vaccination coverage data beginning in 2013. This is especially important for hospitals in the current report with very low vaccination coverage, or hospitals that are unable to document the vaccination coverage of many of their employees.

155
Talbot, et al. Revised SHEA Position Paper: Influenza Vaccination of Healthcare Personnel. Infect Control and Hosp Epidemiol 2010;31:987-95 accessed at http://www.jstor.org/stable/10.1086/656558 In 2013, the National Healthcare Safety Network (NHSN) will be implementing a series of revisions to the criteria used to determine the presence of an HAI. The changes are especially noteworthy for CLABSIs, SSIs, and a category of HAIs not currently used for benchmarking in Pennsylvania, ventilator-associated pneumonia (VAP). These changes will not impact the next HAI report that covers 2012 data, but are likely to produce changes in case counts beginning in 2013. Some of the changes are likely to reduce the number of counted CLABIs and VAPs. Some SSI changes will reduce SSI counts and others will increase them. These will have to be taken into account while assessing trends over time. The Department of Health will continue to work with its partner agencies, the Patient Safety Authority and the Pennsylvania Health Care Cost Containment Council, with outside organizations, and with the infection prevention community to collect data on the occurrence of HAIs and to recommend methods to reduce their occurrence. An important role is to continue to validate the accuracy of data submitted by the hospitals to assure the accuracy of the reported rates and standardized infection ratios. This will be done through continuous inspection of the submitted reports and through on-site validation. PADOH is committed to ensuring useful and useable data on HAIs for the healthcare community and the public. The information can then be used by all stakeholders to continue to reduce the occurrence of HAIs with a goal of eventually eliminating them.


