39
PHC215 By Dr. Khaled Ouanes Ph.D. E-mail: [email protected] Twitter: @khaled_ouanes INTRODUCTION TO HEALTHCARE RESEARCH METHODS
| Date post: | 16-Jul-2015 |
| Category: |
Education |
| Upload: | dr-khaled-ouanes |
| View: | 232 times |
| Download: | 1 times |

PHC215
By Dr. Khaled Ouanes Ph.D.
E-mail: [email protected]
Twitter: @khaled_ouanes
INTRODUCTION TO
HEALTHCARE RESEARCH
METHODS

Primary Studies:Selecting a Sample Population

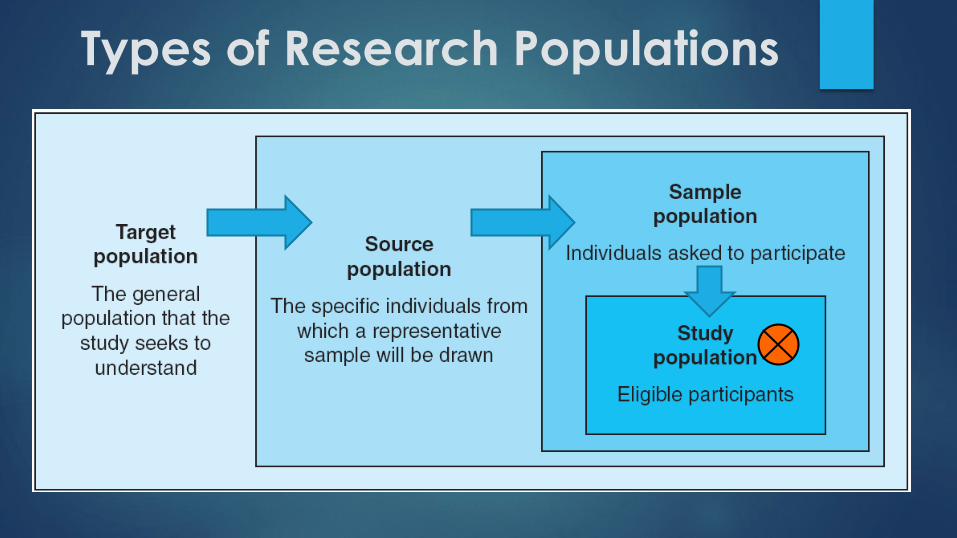
Types of Research Populations
At least 4 different types of populations must be
considered when preparing to collect data:
1. The results of the study should be applicable to the target
population
2. The source population is a well-defined subset of individuals
from the target population
3. The sample population is the individuals from the source
population who are asked to participate
4. The study population is the members of the sample population
who actually participate in the study
Types of Research Populations

Target Populations
A well-defined study question identifies a target population to which the results of the study should apply.
A target population might be quite narrow (like one wing of a long-term acute care hospital) or relatively large (like a whole country).
Unless the target population is very small, measuring the entire target population or even randomly sampling from it may be impossible.

Source Populations
A source population (AKA sampling frame) consists of an enumerated list of population members.
Example:
All students of the same faculty/College
All women with a breast cancer diagnosis in the past 5 years who are indexed in a particular cancer registry
All members of a professional sports league
All households within 2 miles of a particular nuclear power plant

Sample Populations
A source population is often much larger than
the sample size required for a study. In this
situation, only a portion of the source population
is selected to serve as a sample population.
A variety of probability-based samplingtechniques can be used to select a samplepopulation.

Examples of Types of
Probability Sampling

Sometimes a non-probability-based convenience
population can be selected based on the ease of access
to those individuals, schools, or communities.
However, convenience sampling must always be used
with caution. Convenient sample populations are often
systematically different than the communities they are
intended to represent.
Sample Populations

Study Populations
The study population will consist of the members of
the sample population who can be located, who
consent to participation, and who meet all eligibility
criteria.
A 100% participation rate is extremely rare.
A low response rate may result in nonresponse bias
if the members of the sample population who agree
to be in the study are systematically different from
nonparticipants.
Study Populations
A less than 100% participation rate is usually not a
problem as long as the researcher:
Uses suitable and carefully explained sampling
methods
Takes appropriate steps to maximize the participation
rate
Recruits an adequately large sample size
Cross-Sectional Surveys
The goal of most cross-sectional surveys is to
describe a specific target population accurately.
Convenience samples rarely result in a study
population that is representative of the target
population.
Ideally, the researcher needs some way to confirm
that the source population is similar to the target
population and that the sample population is similar
to the source population.
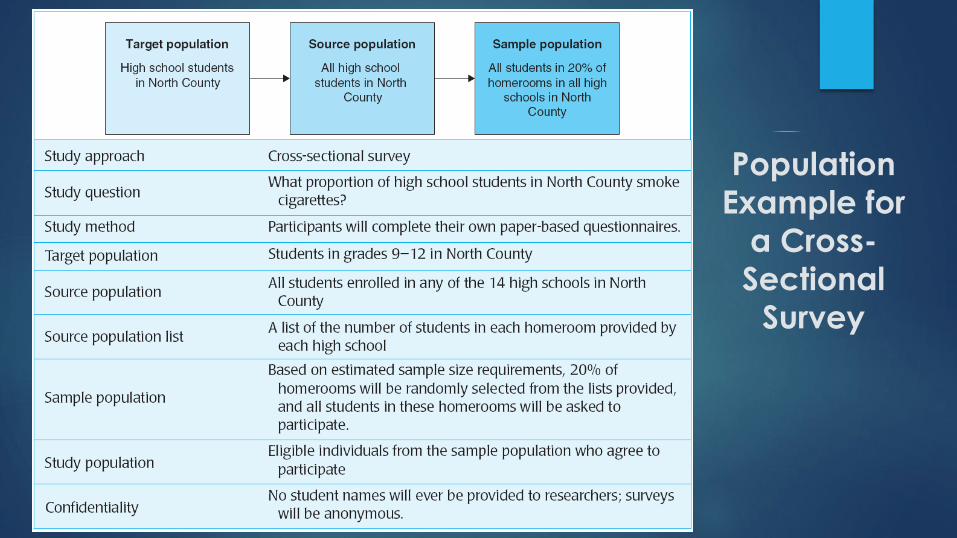
Population
Example for
a Cross-
Sectional
Survey

Case-Control Studies
All cases must have the same disease,
disability, or other health-related condition.
The controls must be similar to the cases in
every way except for their disease status, so
cases and controls should be drawn from
populations with similar demographics.

Population
Example for
a Case-
Control
Study

Cohort Studies
Longitudinal cohort studies: the participants should berepresentative of the source and target populations Therequirements for longitudinal studies are similar to those forcross-sectional studies, since both study designs recruitpopulation-based samples.
Prospective / retrospective cohort studies: the exposed andunexposed should be drawn from similar populations Therecruitment of exposed and unexposed for cohort studies is likethe recruitment of the cases and controls for case-controlstudies.

Population
Example for a
Cohort Study

Experimental Studies
Experimental studies require a source population
that is reasonably representative of the target
population.
Safety is always the top priority in designing an
experimental study. The risk of harm to participants
can be reduced by selecting an appropriate source
population and defining strict inclusion and
exclusion criteria.
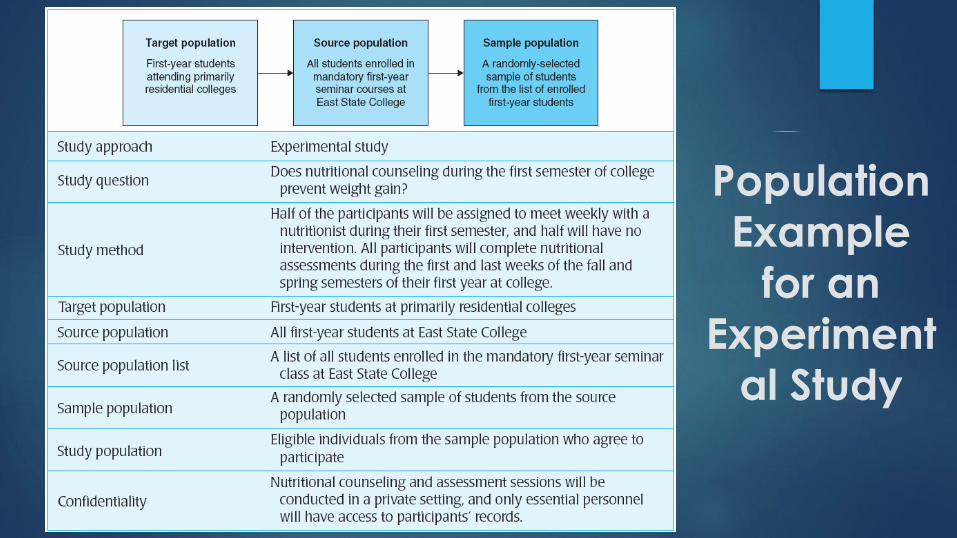
Population
Example
for an
Experiment
al Study

Vulnerable Populations
Vulnerable populations in health research include some
people with poor health, some people with limited decision-
making capacity, and members of some socially
marginalized groups, among others.
Despite the potential risks of including members of these
populations in research studies, including them is the only
way to study health issues in these groups.Example: The health of prisoners can only be studied by conducting research in
prisons.

Research conducted with members of vulnerable
populations requires extra consideration of the
potential risks of research to participants.
The ability of every participant to provide informed
consent free from coercion must be assured.
Concerns about the increased risks of adverse
effects from study participation must be addressed.
Vulnerable Populations

Community Involvement
Some studies benefit from or require the participation and/or support of whole geographic, cultural, or social communities and their leaders.
Community-based studies often work best when they use methods such as those developed for Community-Based Participatory Research.

Primary Studies:Estimating Sample Size

Importance of Sample Size
An adequate number of study
participants is required to achieve valid
and significant results
Importance of Sample Size

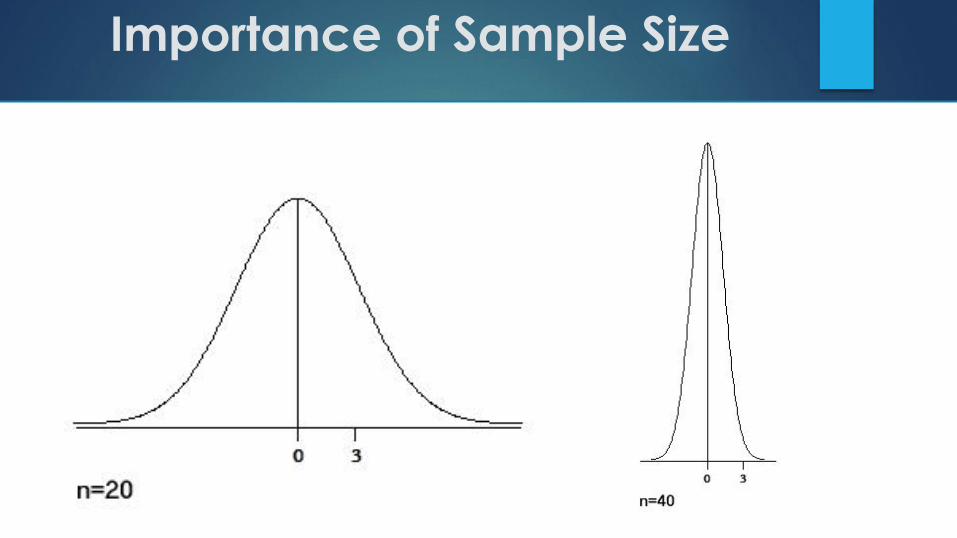
Importance of Sample Size
What you saw in the previous slide are 2 distributions of possible sample means
for 20 people (n=20) and 40 people (n=40), both drawn from the same
population. On each we have superimposed a sample mean weight change of
3kg. The curves are both centered on zero to indicate a null hypothesis of "no
difference" (ie. that the diet has no effect). It is more likely to be significant when
n=40 because the distribution curve is narrower and 3kg is more extreme in
relation to it than it is in the n=20 scenario, which points to how you can increase
the power of your experiment. The reason the n=40 curve is spikier is because of
something called the standard error of the mean.
Essentially, the larger the sample sizes, the more accurately the
sample will reflect the population it was drawn from, so it is
distributed more closely around the population mean. (Except
for some genetics studies)

Sample Size and Means

Bigger Samples Are Better
Large samples from a population are usually better than small ones at yielding a sample mean close to the true population value.

When the sample size is small, the sample mean may be quite far from the mean in the total population from which the sample was drawn. This is represented by a wide confidence interval that reaches far from the sample mean.
When the sample size is large, the sample mean is expected to be close to the population mean, and the confidence interval will be narrower.
Bigger Samples Are Better

Larger Samples from a Population Have a
Narrower 95% Confidence Interval Than Smaller
Samples

So, the goal is to recruit just the right number ofparticipants based on statistical estimations of howmany people are required to answer the studyquestion with a specified level of certainty.
If more participants are recruited than arestatistically required, resources are wasted.
If too few participants are recruited, the whole studywill be almost worthless because there will not beenough statistical power to answer the studyquestion.
Importance of Sample Size

Sample Size Estimation
A sample size calculator – more accurately called a sample size estimator – should be used to identify an appropriate sample size goal.
Sample size estimators suggest an appropriate minimum sample size based on a series of “best guesses” the researcher makes about the expectedcharacteristics of the sample population.
When in doubt, err on the size of a larger sample!

Examples of
Sample Size
Calculation
Power Estimation
Another way to check for sample size requirements is
to work backward from the number of participants
likely to be recruited to see whether that sample size
provides adequate statistical power for the study
design.
Statistical power is the ability of a statistical test to
detect significant differences in a population when
differences really do exist.

Sometimes a sample population does not capture the
true experience of the population:
Type 1 errors (α) occur when a study population
yields a significant statistical test result when one
does not exist in the source population.
Type 2 errors (β) occur when a statistical test of data
from the study population finds no significant result
when one actually exists in the source population.
Power = 1 – β
Power Estimation

Power
and
Errors
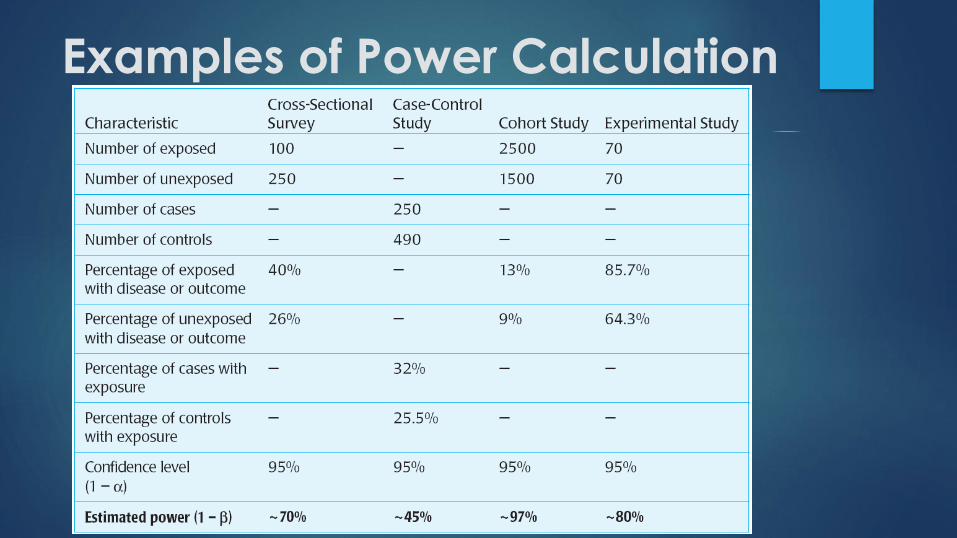
Examples of Power Calculation

Refining the Study Approach
Be prepared to rethink the study question, study approach, and/or target and source populations if the power for the estimated number of participants is
not sufficient.

PHC215
By Dr. Khaled Ouanes Ph.D.
E-mail: [email protected]
Twitter: @khaled_ouanes
HEALTHCARE RESEARCH METHODS
Based on the textbook of introduction to health research methods – K.H. Jacobsen


