102
Leading Causes of Death in Chicago, 2007-2009 1 Leading Causes of Death in Chicago, 2007-2009 September 2013 Rahm Emanuel Mayor Bechara Choucair, M.D. Commissioner HEALTHY CHICAGO REPORTS
| Date post: | 27-Apr-2018 |
| Category: |
Documents |
| Upload: | phungtuyen |
| View: | 216 times |
| Download: | 2 times |

HEALTHY CHICAGO REPORTS
Leading Causes of Death in Chicago, 2007-2009 1
Leading Causes of Death in Chicago, 2007-2009September 2013
Rahm EmanuelMayor
Bechara Choucair, M.D.Commissioner
HEALTHY CHICAGO REPORTS

HEALTHY CHICAGO REPORTS
Leading Causes of Death in Chicago, 2007-2009

HEALTHY CHICAGO REPORTS
Leading Causes of Death in Chicago, 2007-2009
overall infant mortality rate by 10%. Th ese goals will be accomplished through the collaborative eff orts between CDPH and our many community partners. Eff orts that include obesity prevention, improving access to quality breast cancer screening and treatment, creating and updating policies to address tobacco use, and ensuring women receive preconception, interconceptional and prenatal care.
Th e data in this report will assist CDPH and our community partners in tracking progress and developing the targeted policies, programs and public education necessary to reach the goals set forth in Healthy Chicago. I look forward to working with all public health stakeholders to build on our successes and ensure the health and well-being of all Chicagoans.
Bechara Choucair, M.D.Commissioner of Public Health
Improving the health and well-being of Chicagoans through the strategies set forth in Healthy Chicago is essential to becoming our nation’s healthiest city. Successfully developing and implementing these strategies requires relevant, comprehensive data on the challenges facing our residents. Leading Causes of Death, 2007-2009 tracks Chicago’s progress in chronic and infectious disease, and points to areas in need of improvement. Th is report provides a comprehensive analysis of mortality between 2007 and 2009. Th e data demonstrate that Chicago has made progress in many areas, including HIV and infant mortality. Despite these successes, disparities exist among racial-ethnic groups.
Th rough the strategies outlined in Healthy Chicago, the Chicago Department of Public Health (CDPH) is committed to reducing breast cancer mortality disparities between non-Hispanic black and white females by 50%, decreasing the stroke mortality rate by 20% and reducing the

HEALTHY CHICAGO REPORTS
Leading Causes of Death in Chicago, 2007-2009

HEALTHY CHICAGO REPORTS
Leading Causes of Death in Chicago, 2007-2009
TABLE OF CONTENTS
Highlights ................................................................................................. 1
List of Detailed Tables ................................................................................ 8
List of Detailed Figures ............................................................................ 16
Leading Causes of Death Tables ............................................................... 17
All Ages ........................................................................................... 17
By Sex .................................................................................... 18
By Race-Ethnicity ................................................................... 20
By Race-Ethnicity and Sex ...................................................... 24
By Community Area ............................................................... 32
Age Group: 1-14 Years ..................................................................... 47
By Sex .................................................................................... 48
By Race-Ethnicity ................................................................... 48
By Race-Ethnicity and Sex ...................................................... 49
Age Group: 15-24 Years ................................................................... 50
By Sex .................................................................................... 51
By Race-Ethnicity ................................................................... 51
By Race-Ethnicity and Sex ...................................................... 52
Age Group: 25-34 Years ................................................................... 53
By Sex .................................................................................... 54
By Race-Ethnicity ................................................................... 55
By Race-Ethnicity and Sex ...................................................... 56
Age Group: 35-44 Years ................................................................... 58
By Sex .................................................................................... 59
By Race-Ethnicity ................................................................... 59
By Race-Ethnicity and Sex ...................................................... 60
Age Group: 45-54 Years ................................................................... 62
By Sex .................................................................................... 63
By Race-Ethnicity ................................................................... 63
By Race-Ethnicity and Sex ...................................................... 64

HEALTHY CHICAGO REPORTS
Leading Causes of Death in Chicago, 2007-2009
Age Group: 55-64 Years ................................................................... 66
By Sex .................................................................................... 67
By Race-Ethnicity ................................................................... 68
By Race-Ethnicity and Sex ...................................................... 68
Age Group: 65-74 Years ................................................................... 70
By Sex .................................................................................... 71
By Race-Ethnicity ................................................................... 72
By Race-Ethnicity and Sex ...................................................... 72
Age Group: 75-84 Years ................................................................... 74
By Sex .................................................................................... 75
By Race-Ethnicity ................................................................... 76
By Race-Ethnicity and Sex ...................................................... 77
Age Group: 85 Years and Older ....................................................... 78
By Sex .................................................................................... 79
By Race-Ethnicity ................................................................... 80
By Race-Ethnicity and Sex ...................................................... 81
Leading Causes of Infant Death Tables .................................................... 82
Infant Mortality .............................................................................. 82
By Race-Ethnicity ................................................................... 84
Neonatal Mortality .......................................................................... 85
By Race-Ethnicity ................................................................... 86
Postneonatal Mortality .................................................................... 87
By Race-Ethnicity ................................................................... 88
Technical Notes ....................................................................................... 89

HEALTHY CHICAGO REPORTS
Leading Causes of Death in Chicago, 2007-2009 1
HIGHLIGHTS
Th is epidemiologic report presents statistics related to leading causes of death in Chicago over the 3-year period 2007-2009. Counts, rates and percentages are given by decedent demographic characteristics, such as age, sex, race-ethnicity and community area of residence. Th e tables and fi gures are intended to support members of the public health and healthcare community, local organizations, and Chicago residents concerned with promoting health and well-being throughout the lifespan. It is hoped that the data will assist in policy and program development, grant writing, advocacy, and the generation of hypotheses for local research.
Annual deaths among Chicagoans have steadily decreased. In the early 1970s, more than 35,000 Chicago deaths were reported each year, while in 2007 the number fell to below 20,000. In 2009, 19,114 deaths were reported in Chicago residents. Th is is a 4% decrease from 2008, and the lowest count in several decades.
While the number of deaths has declined, the leading causes of death have remained relatively stable over time. In 2009, the top 10 leading causes of death were the same as those in the preceding two years. Heart disease, cancer (i.e., malignant neoplasms), stroke (i.e., cerebrovascular disease) and accidents were ranked 1 through 4, while the rankings for causes 5 through 10 varied slightly by year. Heart disease and cancer together accounted for more than half of all deaths (see Figure 1). Th e only leading cause of death in the top 10 whose count increased was kidney disease (i.e., nephritis, nephrotic syndrome and nephrosis), which went from 520 (a ranking of 9th) in 2008, to 559 (a ranking of 7th) in 2009.
Chicago had 8 of the top 10 leading causes of death in common with the United States as a whole in 2009. Notable diff erences were that septicemia (ranked 8th) and homicide (10th) were on Chicago’s top 10 list, but not on the U.S. list; Alzheimer’s disease (6th) and suicide (10th) were on the U.S. list but not Chicago’s. Chronic lower respiratory diseases (ranked 3rd in the U.S. and 5th in Chicago) accounted for a larger proportion of deaths and higher crude death rate in the U.S. compared to Chicago (5.6% and 44.7 per 100,000 in the U.S. vs. 3.7% and 26.3 per 100,000 in Chicago). Also, although crude death rates were similar for heart disease – the top-ranked cause in both the U.S. and Chicago – the percentage of deaths caused by heart disease was almost 3 percentage points higher in Chicago (27.3% vs. 24.6%).1
Th ere are few diff erences between the leading causes of death in 2009 and those reported for 1999.2 One important diff erence, though, is the decline of HIV disease as a leading cause of death. Th e decrease in deaths due to HIV disease has been observed nationally over a two-decade span.3 Th e ranking of HIV disease as a leading cause of death fell from 4th in 1999
for Chicagoans aged 25-34, 35-44 and 45-54 years old to 7th, 5th and 7th, respectively in 2009. Th e number of HIV disease deaths in these age groups decreased from 325 in 1999 to 110 in 2009.
Despite the number of homicide deaths decreasing from 161 in 1999 to 122 in 2009 in the 25-35 year old age group, homicide replaced accidents as the top-ranked leading cause of death in this age group. In this same age group, the ranking for suicide moved from 6th in 1999 to 4th in 2009. In the 55-64 year old age group, the number of deaths due to accidents increased from 78 in 1999 to 102 in 2009, with the ranking for this cause going from 7th to 4th.
More Chicago males than females died in 2009, and in general, the deaths occurred at younger ages. Th is resulted in an age-adjusted death rate that was 47% higher for males. Homicide was the 5th-ranked leading cause of death in males, but did not rank in the top 10 for females. Accidents accounted for 5.4% of deaths and ranked 3rd for males, but for females it caused just 2.3% of deaths and ranked 10th. Notably, more than one-third of the accidental deaths in males resulted from drug overdoses. Alzheimer’s disease was the 8th leading cause for females but was not in the top 10 for males. For both sexes, heart disease and cancer consistently ranked 1st and 2nd across the 3 years examined.
Th ere were variations in the leading causes of death when viewed in terms of Chicago’s predominant racial-ethnic groups. Heart disease and cancer accounted for 39% of deaths in Hispanics and up to 54% of deaths in non-Hispanic whites in 2009 (see Figure 1). Stroke was the 3rd-ranked leading cause in the 3 major non-Hispanic race groups, but for Hispanics, accidents were 3rd and accounted for 6.5% of deaths. Homicide was not among the top 10 causes in non-Hispanic Asian/Pacifi c Islanders or non-Hispanic whites, but ranked 5th in non-Hispanic blacks (accounting for 3.8% of all deaths) and 6th in Hispanics (4.4%).
Although Hispanics comprise approximately 29% of Chicago’s population,4 this racial-ethnic group accounted for just 10% of 2009 deaths. Th is “Hispanic mortality advantage” is not unique to Chicago, having been observed on a national level with several theories put forth to explain it. Th ese include factors related to social support, acculturation, the “healthy migrant eff ect,” return migration (i.e., the “salmon hypothesis”) and misclassifi cation of ethnicity on death certifi cates.5,6
More generally, the age-adjusted death rate due to all causes in non-Hispanic blacks was more than double the rates of non-Hispanic Asian/Pacifi c Islanders and Hispanics, and 37% higher than the non-Hispanic white rate. Th e causes of death that contribute to this disparity are evident across the age group stratifi cations provided in this report – higher rates of infant mortality, more homicide deaths in young people, the

HEALTHY CHICAGO REPORTS
Leading Causes of Death in Chicago, 2007-2009 2
Figure 1. Percent distribution of the 10 leading causes of death by race-ethnicity, Chicago, 2009
Chronic liver disease and cirrhosis
Hispanic
Cancer
19.9
Heart disease
19.4
Other
26.4
6.5
5.74.7
4.4
3.8
3.4
3.0
2.8
Accidents
DiabetesStroke
Homicide
Kidney disease
Septicemia
Infl uenza and pneumonia
Infl uenza and pneumonia
Non-Hispanic Asian/Pacifi c Islander
Cancer
24.7
Heart disease
23.7
Other
22.5
Stroke
Kidney disease
Diabetes
Septicemia
Accidents
Chronic lowerrespiratory diseases
7.0
4.6
4.2
3.6
3.4
2.6
2.0
Alzheimer’s disease 1.8
Non-Hispanic White
Cancer
23.7
Heart disease
30.3
Other
21.3
Stroke
Chronic lowerrespiratory diseases
Accidents
Infl uenza and pneumonia
Diabetes
Septicemia
Alzheimer’s disease 2.3
Kidney disease 2.2
2.3
2.9
4.9
4.4
3.4
2.3
Non-Hispanic Black
Cancer
23.1
Heart disease
26.8
Other
22.4
StrokeAccidents
Homicide
Diabetes
Chronic lowerrespiratory diseases
Kidney disease
Septicemia
Infl uenza and pneumonia
2.2
3.0
3.4
3.8
4.73.8
3.4
3.4
3.7
All Race-Ethnicities
Cancer
23.1
Heart disease
27.3Other
23.4
Stroke
Accidents
Chronic lowerrespiratory diseases
Diabetes
Kidney disease
Septicemia
Infl uenza and pneumonia
Homicide
4.93.9
3.2
2.9
2.7
2.6
2.3

HEALTHY CHICAGO REPORTS
Leading Causes of Death in Chicago, 2007-2009 3
persistence of HIV disease as a cause of death in adulthood and deaths due to heart disease, cancer and stroke at younger ages in non-Hispanic blacks than in Chicago’s other racial-ethnic groups.
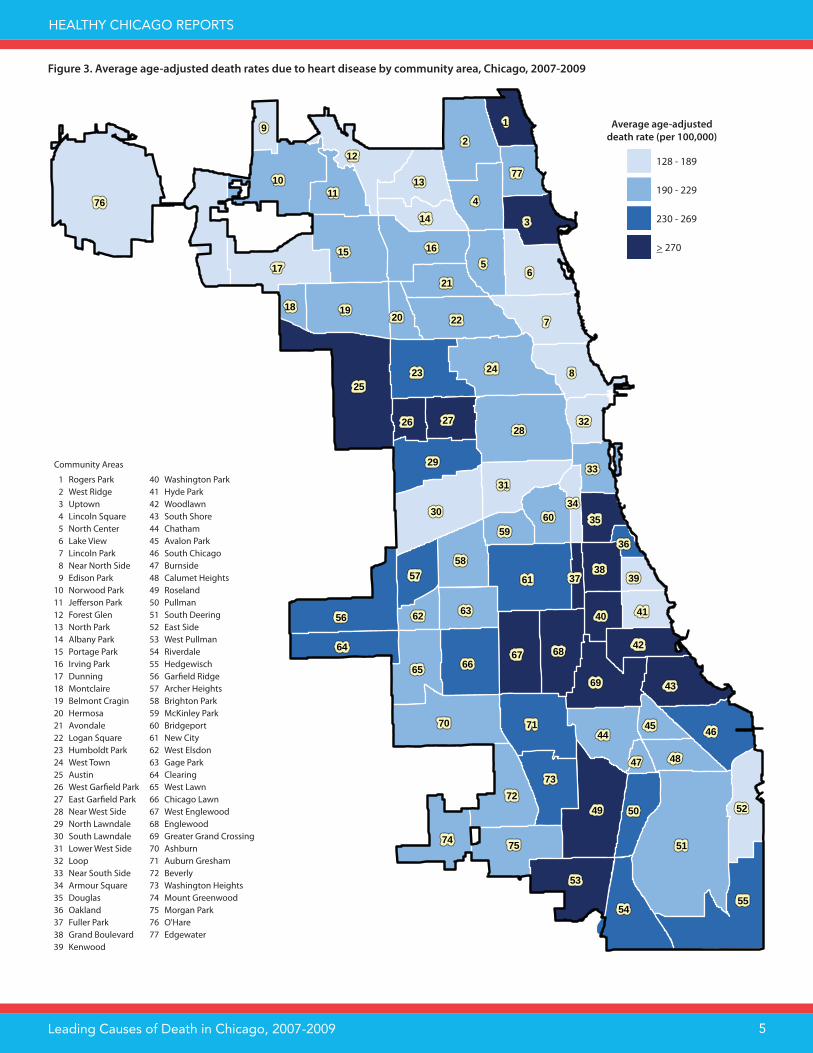
Heart disease and cancer are the top 2 leading causes of death in all of Chicago’s 77 community areas. Th e age-adjusted death rates for heart disease and cancer, as well as for all causes combined, varied substantially across community areas. For the years 2007-2009, the age-adjusted death rates for all causes ranged from 511 per 100,000 in the Loop to 1,310 in West Garfi eld Park (see Figure 2); for heart disease the rates ranged from 129 in Armour Square to 361 in West Garfi eld Park (see Figure 3); and for cancer, the lowest rate was 118 in the Loop and the highest was 288 in Washington Park (see Figure 4). By community area, the most common 3rd-ranked cause of death was stroke (62%), followed by accidents (18%) and chronic lower respiratory diseases (9%). Homicide was the 3rd-ranked cause in 3 community areas: South Lawndale, Washington Park and New City. Additional community area-level statistics on leading causes of death are available on the City of Chicago Data Portal.7
Infant mortality is considered an indicator of population health. In Chicago, the infant mortality rate remained at about 8 infant deaths per year over the 3-year period examined. Although this infant mortality rate is higher than the U.S. rate (6.4 per 1,000 in 2009), Chicago’s rate has decreased by more than 30% since 1999. Despite this decline, disparities in infant mortality rates persist in Chicago and nationally.8,9 Th e infant mortality rate for non-Hispanic blacks was 3 times higher than for non-Hispanic whites, and more than twice as high as for Hispanics in Chicago during 2007-2009. Moreover, infant mortality rates vary by community area (see Figure 5).Th e top 2 leading causes of infant death, disorders related to short gestation and low birth weight, not elsewhere classifi ed (ranked 1st) and congenital malformations, deformations and chromosomal abnormalities (2nd), were the same for all race-ethnicities and Chicago overall. Th ese 2 causes accounted for approximately 40% of all infant deaths.
To address the risk factors associated with the leading causes of death identifi ed in this report, the Chicago Department of Public Health has outlined policies, programs and public education strategies in Healthy Chicago, the fi rst-ever comprehensive plan for public health put forth by the City. Among the priorities in Healthy Chicago are strategies related to tobacco use, exposure to second hand smoke, prevention and control of obesity and related chronic conditions, prevention of HIV infection, elimination of racial disparities in breast cancer mortality and improvement in the health and well-being of mothers and infants.10
References1. Heron M. Deaths: Leading causes for 2009. National vital
statistics reports; vol 61 no 7. Hyattsville, MD: National Center for Health Statistics. 2012.
2. Harper DM, Th omas SD. Leading Causes of Death in Chicago, 1989-1999. Chicago, Illinois: Chicago Department of Public Health Epidemiology Program. 2002.
3. National Center for Health Statistics. Health, United States, 2012: With Special Feature on Emergency Care. Hysattsville, MD. 2013.
4. United States Census Bureau; Census 2010, Summary File 1, Table QT-P3. Available at http://factfi nder2.census.gov, Accessed on September 6, 2013.
5. Arias E, Eschbach K, Schauman WS, et al. Th e Hispanic Mortality Advantage and Ethnic Misclassifi cation on US Death Certifi cates. Am J Public Health. 2010;100:S171-S177.
6. Ruiz JM, Steff en P, Smith TB. Hispanic Mortality Paradox: A Systematic Review and Meta-Analysis of the Longitudinal Literature. Am J Public Health. 2013;103:e52-e60.
7. Chicago Department of Public Health. Get Statistics Related to Public Health in Chicago. http://www.cityofchicago.org/city/en/depts/cdph/provdrs/pol_plan_report/svcs/office_of_epidemiologydataanalysisrequests.html. Accessed on September 6, 2013.
8. MacDorman MF, Hoyert DL, Mathews TJ. Recent declines in infant mortality in the United States, 2005-2011. NCHS data brief, no 120. Hyattsville, MD: National Center for Health Statistics, 2013.
9. Singh GK, Yu SM. Infant Mortality in the United States: Trends, Diff erentials, and Projections, 1950 through 2010. Am J Public Health. 1995;85:957-964.
10. Chicago Department of Public Health. Healthy Chicago: Transforming the Health of Our City. http://www.cityofchicago.org/content/city/en/depts/cdph/provdrs/healthychicago.html. Accessed on September 6, 2013.

HEALTHY CHICAGO REPORTS
Leading Causes of Death in Chicago, 2007-2009 4
76
51
25
28
2
55
61
7
70
49
6
30
24
10
56
8
15
19
4
71
17
53
23
54
22
3
69
66
46
75
16
72
12
29
67
5
68
31
52
44
6543
73
1
74
58
64
1311
63
50
60
42
21
57
27
14
33
48
77
9
38
35
41
32
40
59
26
45
62
20
39
18
47
34
37
36
Figure 2. Average age-adjusted death rates due to all causes by community area, Chicago, 2007-2009
Community Areas
1 Rogers Park 40 Washington Park2 West Ridge 41 Hyde Park3 Uptown 42 Woodlawn4 Lincoln Square 43 South Shore5 North Center 44 Chatham6 Lake View 45 Avalon Park7 Lincoln Park 46 South Chicago8 Near North Side 47 Burnside9 Edison Park 48 Calumet Heights
10 Norwood Park 49 Roseland11 Jeff erson Park 50 Pullman12 Forest Glen 51 South Deering13 North Park 52 East Side14 Albany Park 53 West Pullman15 Portage Park 54 Riverdale16 Irving Park 55 Hedgewisch17 Dunning 56 Garfi eld Ridge18 Montclaire 57 Archer Heights19 Belmont Cragin 58 Brighton Park20 Hermosa 59 McKinley Park21 Avondale 60 Bridgeport22 Logan Square 61 New City23 Humboldt Park 62 West Elsdon24 West Town 63 Gage Park25 Austin 64 Clearing26 West Garfi eld Park 65 West Lawn27 East Garfi eld Park 66 Chicago Lawn28 Near West Side 67 West Englewood29 North Lawndale 68 Englewood30 South Lawndale 69 Greater Grand Crossing31 Lower West Side 70 Ashburn32 Loop 71 Auburn Gresham33 Near South Side 72 Beverly34 Armour Square 73 Washington Heights35 Douglas 74 Mount Greenwood36 Oakland 75 Morgan Park37 Fuller Park 76 O'Hare38 Grand Boulevard 77 Edgewater39 Kenwood
Average age-adjusted
death rate (per 100,000)
511 - 699
> 1,050
850 - 1,049
700 - 849
HEALTHY CHICAGO REPORTS
Leading Causes of Death in Chicago, 2007-2009 5
76
51
25
28
2
55
61
7
70
49
6
30
24
10
56
8
15
19
4
71
17
53
23
54
22
3
69
66
46
75
16
72
12
29
67
5
68
31
52
44
6543
73
1
74
58
64
1311
63
50
60
42
21
57
27
14
33
48
77
9
38
35
41
32
40
59
26
45
62
20
39
18
47
34
37
36
Figure 3. Average age-adjusted death rates due to heart disease by community area, Chicago, 2007-2009
Community Areas
1 Rogers Park 40 Washington Park2 West Ridge 41 Hyde Park3 Uptown 42 Woodlawn4 Lincoln Square 43 South Shore5 North Center 44 Chatham6 Lake View 45 Avalon Park7 Lincoln Park 46 South Chicago8 Near North Side 47 Burnside9 Edison Park 48 Calumet Heights
10 Norwood Park 49 Roseland11 Jeff erson Park 50 Pullman12 Forest Glen 51 South Deering13 North Park 52 East Side14 Albany Park 53 West Pullman15 Portage Park 54 Riverdale16 Irving Park 55 Hedgewisch17 Dunning 56 Garfi eld Ridge18 Montclaire 57 Archer Heights19 Belmont Cragin 58 Brighton Park20 Hermosa 59 McKinley Park21 Avondale 60 Bridgeport22 Logan Square 61 New City23 Humboldt Park 62 West Elsdon24 West Town 63 Gage Park25 Austin 64 Clearing26 West Garfi eld Park 65 West Lawn27 East Garfi eld Park 66 Chicago Lawn28 Near West Side 67 West Englewood29 North Lawndale 68 Englewood30 South Lawndale 69 Greater Grand Crossing31 Lower West Side 70 Ashburn32 Loop 71 Auburn Gresham33 Near South Side 72 Beverly34 Armour Square 73 Washington Heights35 Douglas 74 Mount Greenwood36 Oakland 75 Morgan Park37 Fuller Park 76 O'Hare38 Grand Boulevard 77 Edgewater39 Kenwood
Average age-adjusted
death rate (per 100,000)
128 - 189
> 270
230 - 269
190 - 229

HEALTHY CHICAGO REPORTS
Leading Causes of Death in Chicago, 2007-2009 6
76
51
25
28
2
55
61
7
70
49
6
30
24
10
56
8
15
19
4
71
17
53
23
54
22
3
69
66
46
75
16
72
12
29
67
5
68
31
52
44
6543
73
1
74
58
64
1311
63
50
60
42
21
57
27
14
33
48
77
9
38
35
41
32
40
59
26
45
62
20
39
18
47
34
37
36
Figure 4. Average age-adjusted death rates due to cancer by community area, Chicago, 2007-2009
Community Areas
1 Rogers Park 40 Washington Park2 West Ridge 41 Hyde Park3 Uptown 42 Woodlawn4 Lincoln Square 43 South Shore5 North Center 44 Chatham6 Lake View 45 Avalon Park7 Lincoln Park 46 South Chicago8 Near North Side 47 Burnside9 Edison Park 48 Calumet Heights
10 Norwood Park 49 Roseland11 Jeff erson Park 50 Pullman12 Forest Glen 51 South Deering13 North Park 52 East Side14 Albany Park 53 West Pullman15 Portage Park 54 Riverdale16 Irving Park 55 Hedgewisch17 Dunning 56 Garfi eld Ridge18 Montclaire 57 Archer Heights19 Belmont Cragin 58 Brighton Park20 Hermosa 59 McKinley Park21 Avondale 60 Bridgeport22 Logan Square 61 New City23 Humboldt Park 62 West Elsdon24 West Town 63 Gage Park25 Austin 64 Clearing26 West Garfi eld Park 65 West Lawn27 East Garfi eld Park 66 Chicago Lawn28 Near West Side 67 West Englewood29 North Lawndale 68 Englewood30 South Lawndale 69 Greater Grand Crossing31 Lower West Side 70 Ashburn32 Loop 71 Auburn Gresham33 Near South Side 72 Beverly34 Armour Square 73 Washington Heights35 Douglas 74 Mount Greenwood36 Oakland 75 Morgan Park37 Fuller Park 76 O'Hare38 Grand Boulevard 77 Edgewater39 Kenwood
Average age-adjusted
death rate (per 100,000)
118 - 149
> 230
190 - 229
150 - 189

HEALTHY CHICAGO REPORTS
Leading Causes of Death in Chicago, 2007-2009 7
76
51
25
28
2
55
61
7
70
49
6
30
24
10
56
8
15
19
4
71
17
53
23
54
22
3
69
66
46
75
16
72
12
29
67
5
68
31
52
44
6543
73
1
74
58
64
1311
63
50
60
42
21
57
27
14
33
48
77
9
38
35
41
32
40
59
26
45
62
20
39
18
47
34
37
36
Figure 6. Average infant mortality rates by community area, Chicago, 2007-2009
Community Areas
1 Rogers Park 40 Washington Park2 West Ridge 41 Hyde Park3 Uptown 42 Woodlawn4 Lincoln Square 43 South Shore5 North Center 44 Chatham6 Lake View 45 Avalon Park7 Lincoln Park 46 South Chicago8 Near North Side 47 Burnside9 Edison Park 48 Calumet Heights
10 Norwood Park 49 Roseland11 Jeff erson Park 50 Pullman12 Forest Glen 51 South Deering13 North Park 52 East Side14 Albany Park 53 West Pullman15 Portage Park 54 Riverdale16 Irving Park 55 Hedgewisch17 Dunning 56 Garfi eld Ridge18 Montclaire 57 Archer Heights19 Belmont Cragin 58 Brighton Park20 Hermosa 59 McKinley Park21 Avondale 60 Bridgeport22 Logan Square 61 New City23 Humboldt Park 62 West Elsdon24 West Town 63 Gage Park25 Austin 64 Clearing26 West Garfi eld Park 65 West Lawn27 East Garfi eld Park 66 Chicago Lawn28 Near West Side 67 West Englewood29 North Lawndale 68 Englewood30 South Lawndale 69 Greater Grand Crossing31 Lower West Side 70 Ashburn32 Loop 71 Auburn Gresham33 Near South Side 72 Beverly34 Armour Square 73 Washington Heights35 Douglas 74 Mount Greenwood36 Oakland 75 Morgan Park37 Fuller Park 76 O'Hare38 Grand Boulevard 77 Edgewater39 Kenwood
Average infant
mortality rate
(per 1,000 births)
0 - 4
> 13
9 - 12
5 - 8

HEALTHY CHICAGO REPORTS
Leading Causes of Death in Chicago, 2007-2009 8
LIST OF DETAILED TABLES
All Ages1. Deaths, percentage of total deaths, crude death rate and age-
adjusted death rate for the 10 leading causes of death, Chicago, 2007
2. Deaths, percentage of total deaths, crude death rate and age-adjusted death rate for the 10 leading causes of death, Chicago, 2008
3. Deaths, percentage of total deaths, crude death rate and age-adjusted death rate for the 10 leading causes of death, Chicago, 2009
All Ages by Sex4. Deaths, percentage of total deaths, crude death rate and age-
adjusted death rate for the 10 leading causes of death in females, Chicago, 2007
5. Deaths, percentage of total deaths, crude death rate and age-adjusted death rate for the 10 leading causes of death in females, Chicago, 2008
6. Deaths, percentage of total deaths, crude death rate and age-adjusted death rate for the 10 leading causes of death in females, Chicago, 2009
7. Deaths, percentage of total deaths, crude death rate and age-adjusted death rate for the 10 leading causes of death in males, Chicago, 2007
8. Deaths, percentage of total deaths, crude death rate and age-adjusted death rate for the 10 leading causes of death in males, Chicago, 2008
9. Deaths, percentage of total deaths, crude death rate and age-adjusted death rate for the 10 leading causes of death in males, Chicago, 2009
All Ages by Race-Ethnicity10. Deaths, percentage of total deaths, crude death rate and
age-adjusted death rate for the 10 leading causes of death in Hispanics, Chicago, 2007
11. Deaths, percentage of total deaths, crude death rate and age-adjusted death rate for the 10 leading causes of death in Hispanics, Chicago, 2008
12. Deaths, percentage of total deaths, crude death rate and age-adjusted death rate for the 10 leading causes of death in Hispanics, Chicago, 2009
13. Deaths, percentage of total deaths, crude death rate and age-adjusted death rate for the 10 leading causes of death in non-Hispanic Asian/Pacifi c Islanders, Chicago, 2007
14. Deaths, percentage of total deaths, crude death rate and age-adjusted death rate for the 10 leading causes of death in non-Hispanic Asian/Pacifi c Islanders, Chicago, 2008
15. Deaths, percentage of total deaths, crude death rate and age-adjusted death rate for the 10 leading causes of death in non-Hispanic Asian/Pacifi c Islanders, Chicago, 2009
16. Deaths, percentage of total deaths, crude death rate and age-adjusted death rate for the 10 leading causes of death in non-Hispanic blacks, Chicago, 2007
17. Deaths, percentage of total deaths, crude death rate and age-adjusted death rate for the 10 leading causes of death in non-Hispanic blacks, Chicago, 2008
18. Deaths, percentage of total deaths, crude death rate and age-adjusted death rate for the 10 leading causes of death in non-Hispanic blacks, Chicago, 2009
19. Deaths, percentage of total deaths, crude death rate and age-adjusted death rate for the 10 leading causes of death in non-Hispanic whites, Chicago, 2007
20. Deaths, percentage of total deaths, crude death rate and age-adjusted death rate for the 10 leading causes of death in non-Hispanic whites, Chicago, 2008
21. Deaths, percentage of total deaths, crude death rate and age-adjusted death rate for the 10 leading causes of death in non-Hispanic whites, Chicago, 2009
All Ages by Race-Ethnicity and Sex22. Deaths, percentage of total deaths, crude death rate and
age-adjusted death rate for the 10 leading causes of death in Hispanic females, Chicago, 2007
23. Deaths, percentage of total deaths, crude death rate and age-adjusted death rate for the 10 leading causes of death in Hispanic females, Chicago, 2008
24. Deaths, percentage of total deaths, crude death rate and age-adjusted death rate for the 10 leading causes of death in Hispanic females, Chicago, 2009
25. Deaths, percentage of total deaths, crude death rate and age-adjusted death rate for the 5 leading causes of death in non-Hispanic Asian/Pacifi c Islander females, Chicago, 2007
26. Deaths, percentage of total deaths, crude death rate and age-adjusted death rate for the 5 leading causes of death in non-Hispanic Asian/Pacifi c Islander females, Chicago, 2008
27. Deaths, percentage of total deaths, crude death rate and age-adjusted death rate for the 5 leading causes of death in non-Hispanic Asian/Pacifi c Islander females, Chicago, 2009
28. Deaths, percentage of total deaths, crude death rate and age-adjusted death rate for the 10 leading causes of death in non-Hispanic black females, Chicago, 2007
29. Deaths, percentage of total deaths, crude death rate and age-adjusted death rate for the 10 leading causes of death in non-Hispanic black females, Chicago, 2008
30. Deaths, percentage of total deaths, crude death rate and age-adjusted death rate for the 10 leading causes of death in non-Hispanic black females, Chicago, 2009
31. Deaths, percentage of total deaths, crude death rate and age-adjusted death rate for the 10 leading causes of death in non-Hispanic white females, Chicago, 2007
32. Deaths, percentage of total deaths, crude death rate and age-adjusted death rate for the 10 leading causes of death in non-Hispanic white females, Chicago, 2008
33. Deaths, percentage of total deaths, crude death rate and age-adjusted death rate for the 10 leading causes of death in non-Hispanic white females, Chicago, 2009
34. Deaths, percentage of total deaths, crude death rate and age-adjusted death rate for the 10 leading causes of death in Hispanic males, Chicago, 2007
35. Deaths, percentage of total deaths, crude death rate and age-adjusted death rate for the 10 leading causes of death in Hispanic males, Chicago, 2008
36. Deaths, percentage of total deaths, crude death rate and age-adjusted death rate for the 10 leading causes of death in Hispanic males, Chicago, 2009
37. Deaths, percentage of total deaths, crude death rate and age-adjusted death rate for the 5 leading causes of death in non-Hispanic Asian/Pacifi c Islander males, Chicago, 2007
38. Deaths, percentage of total deaths, crude death rate and age-adjusted death rate for the 5 leading causes of death in non-Hispanic Asian/Pacifi c Islander males, Chicago, 2008
39. Deaths, percentage of total deaths, crude death rate and age-adjusted death rate for the 5 leading causes of death in non-Hispanic Asian/Pacifi c Islander males, Chicago, 2009

HEALTHY CHICAGO REPORTS
Leading Causes of Death in Chicago, 2007-2009 9
40. Deaths, percentage of total deaths, crude death rate and age-adjusted death rate for the 10 leading causes of death in non-Hispanic black males, Chicago, 2007
41. Deaths, percentage of total deaths, crude death rate and age-adjusted death rate for the 10 leading causes of death in non-Hispanic black males, Chicago, 2008
42. Deaths, percentage of total deaths, crude death rate and age-adjusted death rate for the 10 leading causes of death in non-Hispanic black males, Chicago, 2009
43. Deaths, percentage of total deaths, crude death rate and age-adjusted death rate for the 10 leading causes of death in non-Hispanic white males, Chicago, 2007
44. Deaths, percentage of total deaths, crude death rate and age-adjusted death rate for the 10 leading causes of death in non-Hispanic white males, Chicago, 2008
45. Deaths, percentage of total deaths, crude death rate and age-adjusted death rate for the 10 leading causes of death in non-Hispanic white males, Chicago, 2009
All Ages by Community Area46. Average annual deaths, cumulative deaths, percentage of
cumulative deaths, average crude rate and average age-adjusted death rate for the 3 leading causes of death in Rogers Park (Community Area 1), Chicago, 2007-2009
47. Average annual deaths, cumulative deaths, percentage of cumulative deaths, average crude rate and average age-adjusted death rate for the 3 leading causes of death in West Ridge (Community Area 2), Chicago, 2007-2009
48. Average annual deaths, cumulative deaths, percentage of cumulative deaths, average crude rate and average age-adjusted death rate for the 3 leading causes of death in Uptown (Community Area 3), Chicago, 2007-2009
49. Average annual deaths, cumulative deaths, percentage of cumulative deaths, average crude rate and average age-adjusted death rate for the 3 leading causes of death in Lincoln Square (Community Area 4), Chicago, 2007-2009
50. Average annual deaths, cumulative deaths, percentage of cumulative deaths, average crude rate and average age-adjusted death rate for the 3 leading causes of death in North Center (Community Area 5), Chicago, 2007-2009
51. Average annual deaths, cumulative deaths, percentage of cumulative deaths, average crude rate and average age-adjusted death rate for the 3 leading causes of death in Lake View (Community Area 6), Chicago, 2007-2009
52. Average annual deaths, cumulative deaths, percentage of cumulative deaths, average crude rate and average age-adjusted death rate for the 3 leading causes of death in Lincoln Park (Community Area 7), Chicago, 2007-2009
53. Average annual deaths, cumulative deaths, percentage of cumulative deaths, average crude rate and average age-adjusted death rate for the 3 leading causes of death in Near North Side (Community Area 8), Chicago, 2007-2009
54. Average annual deaths, cumulative deaths, percentage of cumulative deaths, average crude rate and average age-adjusted death rate for the 3 leading causes of death in Edison Park (Community Area 9), Chicago, 2007-2009
55. Average annual deaths, cumulative deaths, percentage of cumulative deaths, average crude rate and average age-adjusted death rate for the 3 leading causes of death in Norwood Park (Community Area 10), Chicago, 2007-2009
56. Average annual deaths, cumulative deaths, percentage of cumulative deaths, average crude rate and average age-adjusted death rate for the 3 leading causes of death in Jeff erson Park (Community Area 11), Chicago, 2007-2009
57. Average annual deaths, cumulative deaths, percentage of cumulative deaths, average crude rate and average age-adjusted death rate for the 3 leading causes of death in Forest Glen (Community Area 12), Chicago, 2007-2009
58. Average annual deaths, cumulative deaths, percentage of cumulative deaths, average crude rate and average age-adjusted death rate for the 3 leading causes of death in North Park (Community Area 13), Chicago, 2007-2009
59. Average annual deaths, cumulative deaths, percentage of cumulative deaths, average crude rate and average age-adjusted death rate for the 3 leading causes of death in Albany Park (Community Area 14), Chicago, 2007-2009
60. Average annual deaths, cumulative deaths, percentage of cumulative deaths, average crude rate and average age-adjusted death rate for the 3 leading causes of death in Portage Park (Community Area 15), Chicago, 2007-2009
61. Average annual deaths, cumulative deaths, percentage of cumulative deaths, average crude rate and average age-adjusted death rate for the 3 leading causes of death in Irving Park (Community Area 16), Chicago, 2007-2009
62. Average annual deaths, cumulative deaths, percentage of cumulative deaths, average crude rate and average age-adjusted death rate for the 3 leading causes of death in Dunning (Community Area 17), Chicago, 2007-2009
63. Average annual deaths, cumulative deaths, percentage of cumulative deaths, average crude rate and average age-adjusted death rate for the 3 leading causes of death in Montclaire (Community Area 18), Chicago, 2007-2009
64. Average annual deaths, cumulative deaths, percentage of cumulative deaths, average crude rate and average age-adjusted death rate for the 3 leading causes of death in Belmont Cragin (Community Area 19), Chicago, 2007-2009
65. Average annual deaths, cumulative deaths, percentage of cumulative deaths, average crude rate and average age-adjusted death rate for the 3 leading causes of death in Hermosa (Community Area 20), Chicago, 2007-2009
66. Average annual deaths, cumulative deaths, percentage of cumulative deaths, average crude rate and average age-adjusted death rate for the 3 leading causes of death in Avondale (Community Area 21), Chicago, 2007-2009
67. Average annual deaths, cumulative deaths, percentage of cumulative deaths, average crude rate and average age-adjusted death rate for the 3 leading causes of death in Logan Square (Community Area 22), Chicago, 2007-2009
68. Average annual deaths, cumulative deaths, percentage of cumulative deaths, average crude rate and average age-adjusted death rate for the 3 leading causes of death in Humboldt Park (Community Area 23), Chicago, 2007-2009
69. Average annual deaths, cumulative deaths, percentage of cumulative deaths, average crude rate and average age-adjusted death rate for the 3 leading causes of death in West Town (Community Area 24), Chicago, 2007-2009
70. Average annual deaths, cumulative deaths, percentage of cumulative deaths, average crude rate and average age-adjusted death rate for the 3 leading causes of death in Austin (Community Area 25), Chicago, 2007-2009

HEALTHY CHICAGO REPORTS
Leading Causes of Death in Chicago, 2007-2009 10
71. Average annual deaths, cumulative deaths, percentage of cumulative deaths, average crude rate and average age-adjusted death rate for the 3 leading causes of death in West Garfi eld Park (Community Area 26), Chicago, 2007-2009
72. Average annual deaths, cumulative deaths, percentage of cumulative deaths, average crude rate and average age-adjusted death rate for the 3 leading causes of death in East Garfi eld Park (Community Area 27), Chicago, 2007-2009
73. Average annual deaths, cumulative deaths, percentage of cumulative deaths, average crude rate and average age-adjusted death rate for the 3 leading causes of death in Near West Side (Community Area 28), Chicago, 2007-2009
74. Average annual deaths, cumulative deaths, percentage of cumulative deaths, average crude rate and average age-adjusted death rate for the 3 leading causes of death in North Lawndale (Community Area 29), Chicago, 2007-2009
75. Average annual deaths, percentage of total average deaths and average death rate for the 3 leading causes of death in South Lawndale (Community Area 30), Chicago, 2007-2009
76. Average annual deaths, cumulative deaths, percentage of cumulative deaths, average crude rate and average age-adjusted death rate for the 3 leading causes of death in Lower West Side (Community Area 31), Chicago, 2007-2009
77. Average annual deaths, cumulative deaths, percentage of cumulative deaths, average crude rate and average age-adjusted death rate for the 3 leading causes of death in Loop (Community Area 32), Chicago, 2007-2009
78. Average annual deaths, cumulative deaths, percentage of cumulative deaths, average crude rate and average age-adjusted death rate for the 3 leading causes of death in Near South Side (Community Area 33), Chicago, 2007-2009
79. Average annual deaths, cumulative deaths, percentage of cumulative deaths, average crude rate and average age-adjusted death rate for the 3 leading causes of death in Armour Square (Community Area 34), Chicago, 2007-2009
80. Average annual deaths, cumulative deaths, percentage of cumulative deaths, average crude rate and average age-adjusted death rate for the 3 leading causes of death in Douglas (Community Area 35), Chicago, 2007-2009
81. Average annual deaths, cumulative deaths, percentage of cumulative deaths, average crude rate and average age-adjusted death rate for the 3 leading causes of death in Oakland (Community Area 36), Chicago, 2007-2009
82. Average annual deaths, cumulative deaths, percentage of cumulative deaths, average crude rate and average age-adjusted death rate for the 3 leading causes of death in Fuller Park (Community Area 37), Chicago, 2007-2009
83. Average annual deaths, cumulative deaths, percentage of cumulative deaths, average crude rate and average age-adjusted death rate for the 3 leading causes of death in Grand Boulevard (Community Area 38), Chicago, 2007-2009
84. Average annual deaths, cumulative deaths, percentage of cumulative deaths, average crude rate and average age-adjusted death rate for the 3 leading causes of death in Kenwood (Community Area 39), Chicago, 2007-2009
85. Average annual deaths, cumulative deaths, percentage of cumulative deaths, average crude rate and average age-adjusted death rate for the 3 leading causes of death in Washington Park (Community Area 40), Chicago, 2007-2009
86. Average annual deaths, cumulative deaths, percentage of cumulative deaths, average crude rate and average age-adjusted death rate for the 3 leading causes of death in Hyde Park (Community Area 41), Chicago, 2007-2009
87. Average annual deaths, cumulative deaths, percentage of cumulative deaths, average crude rate and average age-adjusted death rate for the 3 leading causes of death in Woodlawn (Community Area 42), Chicago, 2007-2009
88. Average annual deaths, cumulative deaths, percentage of cumulative deaths, average crude rate and average age-adjusted death rate for the 3 leading causes of death in South Shore (Community Area 43), Chicago, 2007-2009
89. Average annual deaths, cumulative deaths, percentage of cumulative deaths, average crude rate and average age-adjusted death rate for the 3 leading causes of death in Chatham (Community Area 44), Chicago, 2007-2009
90. Average annual deaths, cumulative deaths, percentage of cumulative deaths, average crude rate and average age-adjusted death rate for the 3 leading causes of death in Avalon Park (Community Area 45), Chicago, 2007-2009
91. Average annual deaths, cumulative deaths, percentage of cumulative deaths, average crude rate and average age-adjusted death rate for the 3 leading causes of death in South Chicago (Community Area 46), Chicago, 2007-2009
92. Average annual deaths, cumulative deaths, percentage of cumulative deaths, average crude rate and average age-adjusted death rate for the 3 leading causes of death in Burnside (Community Area 47), Chicago, 2007-2009
93. Average annual deaths, cumulative deaths, percentage of cumulative deaths, average crude rate and average age-adjusted death rate for the 3 leading causes of death in Calumet Heights (Community Area 48), Chicago, 2007-2009
94. Average annual deaths, cumulative deaths, percentage of cumulative deaths, average crude rate and average age-adjusted death rate for the 3 leading causes of death in Roseland (Community Area 49), Chicago, 2007-2009
95. Average annual deaths, cumulative deaths, percentage of cumulative deaths, average crude rate and average age-adjusted death rate for the 3 leading causes of death in Pullman (Community Area 50), Chicago, 2007-2009
96. Average annual deaths, cumulative deaths, percentage of cumulative deaths, average crude rate and average age-adjusted death rate for the 3 leading causes of death in South Deering (Community Area 51), Chicago, 2007-2009
97. Average annual deaths, cumulative deaths, percentage of cumulative deaths, average crude rate and average age-adjusted death rate for the 3 leading causes of death in East Side (Community Area 52), Chicago, 2007-2009
98. Average annual deaths, cumulative deaths, percentage of cumulative deaths, average crude rate and average age-adjusted death rate for the 3 leading causes of death in West Pullman (Community Area 53), Chicago, 2007-2009
99. Average annual deaths, cumulative deaths, percentage of cumulative deaths, average crude rate and average age-adjusted death rate for the 3 leading causes of death in Riverdale (Community Area 54), Chicago, 2007-2009
100. Average annual deaths, cumulative deaths, percentage of cumulative deaths, average crude rate and average age-adjusted death rate for the 3 leading causes of death in Hedgewisch (Community Area 55), Chicago, 2007-2009
101. Average annual deaths, cumulative deaths, percentage of cumulative deaths, average crude rate and average age-adjusted death rate for the 3 leading causes of death in Garfi eld Ridge (Community Area 56), Chicago, 2007-2009

HEALTHY CHICAGO REPORTS
Leading Causes of Death in Chicago, 2007-2009 11
102. Average annual deaths, cumulative deaths, percentage of cumulative deaths, average crude rate and average age-adjusted death rate for the 3 leading causes of death in Archer Heights (Community Area 57), Chicago, 2007-2009
103. Average annual deaths, cumulative deaths, percentage of cumulative deaths, average crude rate and average age-adjusted death rate for the 3 leading causes of death in Brighton Park (Community Area 58), Chicago, 2007-2009
104. Average annual deaths, cumulative deaths, percentage of cumulative deaths, average crude rate and average age-adjusted death rate for the 3 leading causes of death in McKinley Park (Community Area 59), Chicago, 2007-2009
105. Average annual deaths, cumulative deaths, percentage of cumulative deaths, average crude rate and average age-adjusted death rate for the 3 leading causes of death in Bridgeport (Community Area 60), Chicago, 2007-2009
106. Average annual deaths, percentage of total average deaths and average death rate for the 3 leading causes of death in New City (Community Area 61), Chicago, 2007-2009
107. Average annual deaths, cumulative deaths, percentage of cumulative deaths, average crude rate and average age-adjusted death rate for the 3 leading causes of death in West Elsdon (Community Area 62), Chicago, 2007-2009
108. Average annual deaths, cumulative deaths, percentage of cumulative deaths, average crude rate and average age-adjusted death rate for the 3 leading causes of death in Gage Park (Community Area 63), Chicago, 2007-2009
109. Average annual deaths, cumulative deaths, percentage of cumulative deaths, average crude rate and average age-adjusted death rate for the 3 leading causes of death in Clearing (Community Area 64), Chicago, 2007-2009
110. Average annual deaths, cumulative deaths, percentage of cumulative deaths, average crude rate and average age-adjusted death rate for the 3 leading causes of death in West Lawn (Community Area 65), Chicago, 2007-2009
111. Average annual deaths, cumulative deaths, percentage of cumulative deaths, average crude rate and average age-adjusted death rate for the 3 leading causes of death in Chicago Lawn (Community Area 66), Chicago, 2007-2009
112. Average annual deaths, cumulative deaths, percentage of cumulative deaths, average crude rate and average age-adjusted death rate for the 3 leading causes of death in West Englewood (Community Area 67), Chicago, 2007-2009
113. Average annual deaths, cumulative deaths, percentage of cumulative deaths, average crude rate and average age-adjusted death rate for the 3 leading causes of death in Englewood (Community Area 68), Chicago, 2007-2009
114. Average annual deaths, cumulative deaths, percentage of cumulative deaths, average crude rate and average age-adjusted death rate for the 3 leading causes of death in Greater Grand Crossing (Community Area 69), Chicago, 2007-2009
115. Average annual deaths, cumulative deaths, percentage of cumulative deaths, average crude rate and average age-adjusted death rate for the 3 leading causes of death in Ashburn (Community Area 70), Chicago, 2007-2009
116. Average annual deaths, cumulative deaths, percentage of cumulative deaths, average crude rate and average age-adjusted death rate for the 3 leading causes of death in Auburn Gresham (Community Area 71), Chicago, 2007-2009
117. Average annual deaths, cumulative deaths, percentage of cumulative deaths, average crude rate and average age-adjusted death rate for the 3 leading causes of death in Beverly (Community Area 72), Chicago, 2007-2009
118. Average annual deaths, cumulative deaths, percentage of cumulative deaths, average crude rate and average age-adjusted death rate for the 3 leading causes of death in Washington Heights (Community Area 73), Chicago, 2007-2009
119. Average annual deaths, cumulative deaths, percentage of cumulative deaths, average crude rate and average age-adjusted death rate for the 3 leading causes of death in Mount Greenwood (Community Area 74), Chicago, 2007-2009
120. Average annual deaths, cumulative deaths, percentage of cumulative deaths, average crude rate and average age-adjusted death rate for the 3 leading causes of death in Morgan Park (Community Area 75), Chicago, 2007-2009
121. Average annual deaths, cumulative deaths, percentage of cumulative deaths, average crude rate and average age-adjusted death rate for the 3 leading causes of death in O’Hare (Community Area 76), Chicago, 2007-2009
122. Average annual deaths, cumulative deaths, percentage of cumulative deaths, average crude rate and average age-adjusted death rate for the 3 leading causes of death in Edgewater (Community Area 77), Chicago, 2007-2009
Age Group: 1-14 Years123. Deaths, percentage of total deaths and age-specifi c death rate
for the 3 leading causes of death in 1-14 year olds, Chicago, 2007
124. Deaths, percentage of total deaths and age-specifi c death rate for the 3 leading causes of death in 1-14 year olds, Chicago, 2008
125. Deaths, percentage of total deaths and age-specifi c death rate for the 3 leading causes of death in 1-14 year olds, Chicago, 2009
Age Group: 1-14 Years by Sex126. Average annual deaths, cumulative deaths, percentage of
cumulative deaths and average age-specifi c death rate for the 3 leading causes of death in females 1-14 years old, Chicago, 2007-2009
127. AAverage annual deaths, cumulative deaths, percentage of cumulative deaths and average age-specifi c death rate for the 3 leading causes of death in males 1-14 years old, Chicago, 2007-2009
Age Group: 1-14 Years by Race-Ethnicity128. Average annual deaths, cumulative deaths, percentage of
cumulative deaths and average age-specifi c death rate for the 3 leading causes of death in Hispanics 1-14 years old, Chicago, 2007-2009
129. Average annual deaths, cumulative deaths, percentage of cumulative deaths and average age-specifi c death rate for the 3 leading causes of death in non-Hispanic blacks 1-14 years old, Chicago, 2007-2009
130. Average annual deaths, cumulative deaths, percentage of cumulative deaths and average age-specifi c death rate for the 5 leading causes of death in non-Hispanic whites 1-14 years old, Chicago, 2007-2009
Age Group: 1-14 Years by Race-Ethnicity and Sex131. Average annual deaths, cumulative deaths, percentage of
cumulative deaths and average age-specifi c death rate for the 3 leading causes of death in Hispanic females 1-14 years old, Chicago, 2007-2009
132. Average annual deaths, cumulative deaths, percentage of cumulative deaths and average age-specifi c death rate for the 3 leading causes of death in non-Hispanic black females 1-14 years old, Chicago, 2007-2009
HEALTHY CHICAGO REPORTS
Leading Causes of Death in Chicago, 2007-2009 12
133. Average annual deaths, cumulative deaths, percentage of cumulative deaths and average age-specifi c death rate for the 3 leading causes of death in Hispanic males 1-14 years old, Chicago, 2007-2009
134. Average annual deaths, cumulative deaths, percentage of cumulative deaths and average death rate for the 3 leading causes of death in non-Hispanic black males 1-14 years old, Chicago, 2007-2009
Age Group: 15-24 Years135. Deaths, percentage of total deaths and age-specifi c death rate
for the 5 leading causes of death in 15-24 year olds, Chicago, 2007
136. Deaths, percentage of total deaths and age-specifi c death rate for the 5 leading causes of death in 15-24 year olds, Chicago, 2008
137. Deaths, percentage of total deaths and age-specifi c death rate for the 5 leading causes of death in 15-24 year olds, Chicago, 2009
Age Group: 15-24 Years by Sex138. Average annual deaths, cumulative deaths, percentage of
cumulative deaths and average age-specifi c death rate for the 5 leading causes of death in females 15-24 years old, Chicago, 2007-2009
139. Average annual deaths, cumulative deaths, percentage of cumulative deaths and average age-specifi c death rate for the 5 leading causes of death in males 15-24 years old, Chicago, 2007-2009
Age Group: 15-24 Years by Race-Ethnicity140. Average annual deaths, cumulative deaths, percentage of
cumulative deaths and average age-specifi c death rate for the 5 leading causes of death in Hispanics 15-24 years old, Chicago, 2007-2009
141. Average annual deaths, cumulative deaths, percentage of cumulative deaths and average age-specifi c death rate for the 5 leading causes of death in non-Hispanic blacks 15-24 years old, Chicago, 2007-2009
142. Average annual deaths, cumulative deaths, percentage of cumulative deaths and average age-specifi c death rate for the 3 leading causes of death in non-Hispanic whites 15-24 years old, Chicago, 2007-2009
Age Group: 15-24 Years by Race-Ethnicity and Sex143. Average annual deaths, cumulative deaths, percentage of
cumulative deaths and average age-specifi c death rate for the 3 leading causes of death in Hispanic females 15-24 years old, Chicago, 2007-2009
144. Average annual deaths, cumulative deaths, percentage of cumulative deaths and average age-specifi c death rate for the 3 leading causes of death in non-Hispanic black females 15-24 years old, Chicago, 2007-2009
145. Average annual deaths, cumulative deaths, percentage of cumulative deaths and average age-specifi c death rate for the 3 leading causes of death in non-Hispanic white females 15-24 years old, Chicago, 2007-2009
146. Average annual deaths, cumulative deaths, percentage of cumulative deaths and average age-specifi c death rate for the 3 leading causes of death in Hispanic males 15-24 years old, Chicago, 2007-2009
147. Average annual deaths, cumulative deaths, percentage of cumulative deaths and average age-specifi c death rate for the 3 leading causes of death in non-Hispanic black males 15-24 years old, Chicago, 2007-2009
148. Average annual deaths, cumulative deaths, percentage of cumulative deaths and average age-specifi c death rate for the 3 leading causes of death in non-Hispanic white males 15-24 years old, Chicago, 2007-2009
Age Group: 25-34 Years149. Deaths, percentage of total deaths and age-specifi c death rate
for the 10 leading causes of death in 25-34 year olds, Chicago, 2007
150. Deaths, percentage of total deaths and age-specifi c death rate for the 10 leading causes of death in 25-34 year olds, Chicago, 2008
151. Deaths, percentage of total deaths and age-specifi c death rate for the 10 leading causes of death in 25-34 year olds, Chicago, 2009
Age Group: 25-34 Years by Sex152. Average annual deaths, cumulative deaths, percentage of
cumulative deaths and average age-specifi c death rate for the 5 leading causes of death in females 25-34 years old, Chicago, 2007-2009
153. Average annual deaths, cumulative deaths, percentage of cumulative deaths and average age-specifi c death rate for the 5 leading causes of death in males 25-34 years old, Chicago, 2007-2009
Age Group: 25-34 Years by Race-Ethnicity154. Average annual deaths, cumulative deaths, percentage of
cumulative deaths and average age-specifi c death rate for the 5 leading causes of death in Hispanics 25-34 years old, Chicago, 2007-2009
155. Average annual deaths, cumulative deaths, percentage of cumulative deaths and average age-specifi c death rate for the 5 leading causes of death in non-Hispanic blacks 25-34 years old, Chicago, 2007-2009
156. Average annual deaths, cumulative deaths, percentage of cumulative deaths and average age-specifi c death rate for the 5 leading causes of death in non-Hispanic whites 25-34 years old, Chicago, 2007-2009
Age Group: 25-34 Years by Race-Ethnicity and Sex157. Average annual deaths, cumulative deaths, percentage of
cumulative deaths and average age-specifi c death rate for the 5 leading causes of death in Hispanic females 25-34 years old, Chicago, 2007-2009
158. Average annual deaths, cumulative deaths, percentage of cumulative deaths and average death rate for the 5 leading causes of death in non-Hispanic black females 25-34 years old, Chicago, 2007-2009
159. Average annual deaths, cumulative deaths, percentage of cumulative deaths and average age-specifi c death rate for the 5 leading causes of death in non-Hispanic white females 25-34 years old, Chicago, 2007-2009
160. Average annual deaths, cumulative deaths, percentage of cumulative deaths and average age-specifi c death rate for the 5 leading causes of death in Hispanic males 25-34 years old, Chicago, 2007-2009
161. Average annual deaths, cumulative deaths, percentage of cumulative deaths and average age-specifi c death rate for the 5 leading causes of death in non-Hispanic black males 25-34 years old, Chicago, 2007-2009
162. Average annual deaths, cumulative deaths, percentage of cumulative deaths and average age-specifi c death rate for the 5 leading causes of death in non-Hispanic white males 25-34 years old, Chicago, 2007-2009

HEALTHY CHICAGO REPORTS
Leading Causes of Death in Chicago, 2007-2009 13
Age Group: 35-44 Years163. Deaths, percentage of total deaths and age-specifi c death rate
for the 10 leading causes of death in 35-44 year olds, Chicago, 2007
164. Deaths, percentage of total deaths and age-specifi c death rate for the 10 leading causes of death in 35-44 year olds, Chicago, 2008
165. Deaths, percentage of total deaths and age-specifi c death rate for the 10 leading causes of death in 35-44 year olds, Chicago, 2009
Age Group: 35-44 Years by Sex166. Average annual deaths, cumulative deaths, percentage of
cumulative deaths and average age-specifi c death rate for the 5 leading causes of death in females 35-44 years old, Chicago, 2007-2009
167. Average annual deaths, cumulative deaths, percentage of cumulative deaths and average death rate for the 5 leading causes of death in males 35-44 years old, Chicago, 2007-2009
Age Group: 35-44 Years by Race-Ethnicity168. Average annual deaths, cumulative deaths, percentage of
cumulative deaths and average age-specifi c death rate for the 5 leading causes of death in Hispanics 35-44 years old, Chicago, 2007-2009
169. Average annual deaths, cumulative deaths, percentage of cumulative deaths and average age-specifi c death rate for the 5 leading causes of death in non-Hispanic blacks 35-44 years old, Chicago, 2007-2009
170. Average annual deaths, cumulative deaths, percentage of cumulative deaths and average age-specifi c death rate for the 5 leading causes of death in non-Hispanic whites 35-44 years old, Chicago, 2007-2009
Age Group: 35-44 Years by Race-Ethnicity and Sex171. Average annual deaths, cumulative deaths, percentage of
cumulative deaths and average death rate for the 5 leading causes of death in Hispanic females 35-44 years old, Chicago, 2007-2009
172. Average annual deaths, cumulative deaths, percentage of cumulative deaths and average age-specifi c death rate for the 5 leading causes of death in non-Hispanic black females 35-44 years old, Chicago, 2007-2009
173. Average annual deaths, cumulative deaths, percentage of cumulative deaths and average age-specifi c death rate for the 5 leading causes of death in non-Hispanic white females 35-44 years old, Chicago, 2007-2009
174. Average annual deaths, cumulative deaths, percentage of cumulative deaths and average age-specifi c death rate for the 5 leading causes of death in Hispanic males 35-44 years old, Chicago, 2007-2009
175. Average annual deaths, cumulative deaths, percentage of cumulative deaths and average death rate for the 5 leading causes of death in non-Hispanic black males 35-44 years old, Chicago, 2007-2009
176. Average annual deaths, cumulative deaths, percentage of cumulative deaths and average age-specifi c death rate for the 5 leading causes of death in non-Hispanic white males 35-44 years old, Chicago, 2007-2009
Age Group: 45-54 Years177. Deaths, percentage of total deaths and age-specifi c death rate
for the 10 leading causes of death in 45-54 year olds, Chicago, 2007
178. Deaths, percentage of total deaths and age-specifi c death rate for the 10 leading causes of death in 45-54 year olds, Chicago, 2008
179. Deaths, percentage of total deaths and age-specifi c death rate for the 10 leading causes of death in 45-54 year olds, Chicago, 2009
Age Group: 45-54 Years by Sex180. Average annual deaths, cumulative deaths, percentage of
cumulative deaths and average age-specifi c death rate for the 5 leading causes of death in females 45-54 years old, Chicago, 2007-2009
181. Average annual deaths, cumulative deaths, percentage of cumulative deaths and average age-specifi c death rate for the 5 leading causes of death in males 45-54 years old, Chicago, 2007-2009
Age Group: 45-54 Years by Race-Ethnicity182. Average annual deaths, cumulative deaths, percentage of
cumulative deaths and average age-specifi c death rate for the 5 leading causes of death in Hispanics 45-54 years old, Chicago, 2007-2009
183. Average annual deaths, cumulative deaths, percentage of cumulative deaths and average age-specifi c death rate for the 5 leading causes of death in non-Hispanic blacks 45-54 years old, Chicago, 2007-2009
184. Average annual deaths, cumulative deaths, percentage of cumulative deaths and average age-specifi c death rate for the 5 leading causes of death in non-Hispanic whites 45-54 years old, Chicago, 2007-2009
Age Group: 45-54 Years by Race-Ethnicity and Sex185. Average annual deaths, cumulative deaths, percentage of
cumulative deaths and average age-specifi c death rate for the 5 leading causes of death in Hispanic females 45-54 years old, Chicago, 2007-2009
186. Average annual deaths, cumulative deaths, percentage of cumulative deaths and average age-specifi c death rate for the 5 leading causes of death in non-Hispanic black females 45-54 years old, Chicago, 2007-2009
187. Average annual deaths, cumulative deaths, percentage of cumulative deaths and average age-specifi c death rate for the 5 leading causes of death in non-Hispanic white females 45-54 years old, Chicago, 2007-2009
188. Average annual deaths, cumulative deaths, percentage of cumulative deaths and average death rate for the 5 leading causes of death in Hispanic males 45-54 years old, Chicago, 2007-2009
189. Average annual deaths, cumulative deaths, percentage of cumulative deaths and average age-specifi c death rate for the 5 leading causes of death in non-Hispanic black males 45-54 years old, Chicago, 2007-2009
190. Average annual deaths, cumulative deaths, percentage of cumulative deaths and average age-specifi c death rate for the 5 leading causes of death in non-Hispanic white males 45-54 years old, Chicago, 2007-2009
Age Group: 55-64 Years191. Deaths, percentage of total deaths and age-specifi c death rate
for the 10 leading causes of death in 55-64 year olds, Chicago, 2007
192. Deaths, percentage of total deaths and age-specifi c death rate for the 10 leading causes of death in 55-64 year olds, Chicago, 2008

HEALTHY CHICAGO REPORTS
Leading Causes of Death in Chicago, 2007-2009 14
193. Deaths, percentage of total deaths and age-specifi c death rate for the 10 leading causes of death in 55-64 year olds, Chicago, 2009
Age Group: 55-64 Years by Sex194. Average annual deaths, cumulative deaths, percentage of
cumulative deaths and average age-specifi c death rate for the 5 leading causes of death in females 55-64 years old, Chicago, 2007-2009
195. Average annual deaths, cumulative deaths, percentage of cumulative deaths and average age-specifi c death rate for the 5 leading causes of death in males 55-64 years old, Chicago, 2007-2009
Age Group: 55-64 Years by Race-Ethnicity196. Average annual deaths, cumulative deaths, percentage of
cumulative deaths and average age-specifi c death rate for the 5 leading causes of death in Hispanics 55-64 years old, Chicago, 2007-2009
197. Average annual deaths, cumulative deaths, percentage of cumulative deaths and average age-specifi c death rate for the 5 leading causes of death in non-Hispanic blacks 55-64 years old, Chicago, 2007-2009
198. Average annual deaths, cumulative deaths, percentage of cumulative deaths and average death rate for the 5 leading causes of death in non-Hispanic whites 55-64 years old, Chicago, 2007-2009
Age Group: 55-64 Years by Race-Ethnicity and Sex199. Average annual deaths, cumulative deaths, percentage of
cumulative deaths and average age-specifi c death rate for the 5 leading causes of death in Hispanic females 55-64 years old, Chicago, 2007-2009
200. Average annual deaths, cumulative deaths, percentage of cumulative deaths and average age-specifi c death rate for the 5 leading causes of death in non-Hispanic black females 55-64 years old, Chicago, 2007-2009
201. Average annual deaths, cumulative deaths, percentage of cumulative deaths and average age-specifi c death rate for the 5 leading causes of death in non-Hispanic white females 55-64 years old, Chicago, 2007-2009
202. Average annual deaths, cumulative deaths, percentage of cumulative deaths and average age-specifi c death rate for the 5 leading causes of death in Hispanic males 55-64 years old, Chicago, 2007-2009
203. Average annual deaths, cumulative deaths, percentage of cumulative deaths and average age-specifi c death rate for the 5 leading causes of death in non-Hispanic black males 55-64 years old, Chicago, 2007-2009
204. Average annual deaths, cumulative deaths, percentage of cumulative deaths and average age-specifi c death rate for the 5 leading causes of death in non-Hispanic white males 55-64 years old, Chicago, 2007-2009
Age Group: 65-74 Years205. Deaths, percentage of total deaths and age-specifi c death rate
for the 10 leading causes of death in 65-74 year olds, Chicago, 2007
206. Deaths, percentage of total deaths and age-specifi c death rate for the 10 leading causes of death in 65-74 year olds, Chicago, 2008
207. Deaths, percentage of total deaths and age-specifi c death rate for the 10 leading causes of death in 65-74 year olds, Chicago, 2009
Age Group: 65-74 Years by Sex208. Average annual deaths, cumulative deaths, percentage of
cumulative deaths and average age-specifi c death rate for the 5 leading causes of death in females 65-74 years old, Chicago, 2007-2009
209. Average annual deaths, cumulative deaths, percentage of cumulative deaths and average age-specifi c death rate for the 5 leading causes of death in males 65-74 years old, Chicago, 2007-2009
Age Group: 65-74 Years by Race-Ethnicity210. Average annual deaths, cumulative deaths, percentage of
cumulative deaths and average age-specifi c death rate for the 5 leading causes of death in Hispanics 65-74 years old, Chicago, 2007-2009
211. Average annual deaths, cumulative deaths, percentage of cumulative deaths and average age-specifi c death rate for the 5 leading causes of death in non-Hispanic blacks 65-74 years old, Chicago, 2007-2009
212. Average annual deaths, cumulative deaths, percentage of cumulative deaths and average death rate for the 5 leading causes of death in non-Hispanic whites 65-74 years old, Chicago, 2007-2009
Age Group: 65-74 Years by Race-Ethnicity and Sex213. Average annual deaths, cumulative deaths, percentage of
cumulative deaths and average age-specifi c death rate for the 5 leading causes of death in Hispanic females 65-74 years old, Chicago, 2007-2009
214. Average annual deaths, cumulative deaths, percentage of cumulative deaths and average age-specifi c death rate for the 5 leading causes of death in non-Hispanic black females 65-74 years old, Chicago, 2007-2009
215. Average annual deaths, cumulative deaths, percentage of cumulative deaths and average age-specifi c death rate for the 5 leading causes of death in non-Hispanic white females 65-74 years old, Chicago, 2007-2009
216. Average annual deaths, cumulative deaths, percentage of cumulative deaths and average age-specifi c death rate for the 5 leading causes of death in Hispanic males 65-74 years old, Chicago, 2007-2009
217. Average annual deaths, cumulative deaths, percentage of cumulative deaths and average age-specifi c death rate for the 5 leading causes of death in non-Hispanic black males 65-74 years old, Chicago, 2007-2009
218. Average annual deaths, cumulative deaths, percentage of cumulative deaths and average age-specifi c death rate for the 5 leading causes of death in non-Hispanic white males 65-74 years old, Chicago, 2007-2009
Age Group: 75-84 Years219. Deaths, percentage of total deaths and age-specifi c death rate
for the 10 leading causes of death in 75-84 year olds, Chicago, 2007
220. Deaths, percentage of total deaths and age-specifi c death rate for the 10 leading causes of death in 75-84 year olds, Chicago, 2008
221. Deaths, percentage of total deaths and age-specifi c death rate for the 10 leading causes of death in 75-84 year olds, Chicago, 2009

HEALTHY CHICAGO REPORTS
Leading Causes of Death in Chicago, 2007-2009 15
Age Group: 75-84 Years by Sex222. Average annual deaths, cumulative deaths, percentage of
cumulative deaths and average age-specifi c death rate for the 5 leading causes of death in females 75-84 years old, Chicago, 2007-2009
223. Average annual deaths, cumulative deaths, percentage of cumulative deaths and average age-specifi c death rate for the 5 leading causes of death in males 75-84 years old, Chicago, 2007-2009
Age Group: 75-84 Years by Race-Ethnicity224. Average annual deaths, cumulative deaths, percentage of
cumulative deaths and average age-specifi c death rate for the 5 leading causes of death in Hispanics 75-84 years old, Chicago, 2007-2009
225. Average annual deaths, cumulative deaths, percentage of cumulative deaths and average age-specifi c death rate for the 5 leading causes of death in non-Hispanic blacks 75-84 years old, Chicago, 2007-2009
226. Average annual deaths, cumulative deaths, percentage of cumulative deaths and average age-specifi c death rate for the 5 leading causes of death in non-Hispanic whites 75-84 years old, Chicago, 2007-2009
Age Group: 75-84 Years by Race-Ethnicity and Sex227. Average annual deaths, cumulative deaths, percentage of
cumulative deaths and average age-specifi c death rate for the 5 leading causes of death in Hispanic females 75-84 years old, Chicago, 2007-2009
228. Average annual deaths, cumulative deaths, percentage of cumulative deaths and average age-specifi c death rate for the 5 leading causes of death in non-Hispanic black females 75-84 years old, Chicago, 2007-2009
229. Average annual deaths, cumulative deaths, percentage of cumulative deaths and average age-specifi c death rate for the 5 leading causes of death in non-Hispanic white females 75-84 years old, Chicago, 2007-2009
230. Average annual deaths, cumulative deaths, percentage of cumulative deaths and average age-specifi c death rate for the 5 leading causes of death in Hispanic males 75-84 years old, Chicago, 2007-2009
231. Average annual deaths, cumulative deaths, percentage of cumulative deaths and average death rate for the 5 leading causes of death in non-Hispanic black males 75-84 years old, Chicago, 2007-2009
232. Average annual deaths, cumulative deaths, percentage of cumulative deaths and average age-specifi c death rate for the 5 leading causes of death in non-Hispanic white males 75-84 years old, Chicago, 2007-2009
Age Group: 85 Years and Older233. Deaths, percentage of total deaths and age-specifi c death rate
for the 10 leading causes of death in 85 year olds and greater, Chicago, 2007
234. Deaths, percentage of total deaths and age-specifi c death rate for the 10 leading causes of death in 85 year olds and greater, Chicago, 2008
235. Deaths, percentage of total deaths and age-specifi c death rate for the 10 leading causes of death in 85 year olds and greater, Chicago, 2009
Age Group: 85 Years and Older by Sex236. Average annual deaths, cumulative deaths, percentage of
cumulative deaths and average age-specifi c death rate for the 5 leading causes of death in females 85 years old and greater, Chicago, 2007-2009
237. Average annual deaths, cumulative deaths, percentage of cumulative deaths and average age-specifi c death rate for the 5 leading causes of death in males 85 years old and greater, Chicago, 2007-2009
Age Group: 85 Years and Older by Race-Ethnicity238. Average annual deaths, cumulative deaths, percentage of
cumulative deaths and average age-specifi c death rate for the 5 leading causes of death in Hispanics 85 years old and greater, Chicago, 2007-2009
239. Average annual deaths, cumulative deaths, percentage of cumulative deaths and average age-specifi c death rate for the 5 leading causes of death in non-Hispanic blacks 85 years old and greater, Chicago, 2007-2009
240. Average annual deaths, cumulative deaths, percentage of cumulative deaths and average age-specifi c death rate for the 5 leading causes of death in non-Hispanic whites 85 years old and greater, Chicago, 2007-2009
Age Group: 85 Years and Older by Race-Ethnicity and Sex241. Average annual deaths, cumulative deaths, percentage of
cumulative deaths and average age-specifi c death rate for the 5 leading causes of death in Hispanic females 85 years old and greater, Chicago, 2007-2009
242. Average annual deaths, cumulative deaths, percentage of cumulative deaths and average age-specifi c death rate for the 5 leading causes of death in non-Hispanic black females 85 years old and greater, Chicago, 2007-2009
243. Average annual deaths, cumulative deaths, percentage of cumulative deaths and average age-specifi c death rate for the 5 leading causes of death in non-Hispanic white females 85 years old and greater, Chicago, 2007-2009
244. Average annual deaths, cumulative deaths, percentage of cumulative deaths and average age-specifi c death rate for the 5 leading causes of death in Hispanic males 85 years old and greater, Chicago, 2007-2009
245. Average annual deaths, cumulative deaths, percentage of cumulative deaths and average age-specifi c death rate for the 5 leading causes of death in non-Hispanic black males 85 years old and greater, Chicago, 2007-2009
246. Average annual deaths, cumulative deaths, percentage of cumulative deaths and average age-specifi c death rate for the 5 leading causes of death in non-Hispanic white males 85 years old and greater, Chicago, 2007-2009
Infant Mortality247. Infant deaths, percentage of total infant deaths and infant
mortality rate for the 10 leading causes of infant death, Chicago, 2007
248. Infant deaths, percentage of total infant deaths and infant mortality rate for the 10 leading causes of infant death, Chicago, 2008
249. Infant deaths, percentage of total infant deaths and infant mortality rate for the 10 leading causes of infant death, Chicago, 2009

HEALTHY CHICAGO REPORTS
Leading Causes of Death in Chicago, 2007-2009 16
Infant Mortality by Race-Ethnicity250. Average annual infant deaths, cumulative infant deaths,
percentage of cumulative infant deaths and average infant mortality rate for the 10 leading causes of infant death in Hispanics, Chicago, 2007-2009
251. Average annual infant deaths, cumulative infant deaths, percentage of cumulative infant deaths and average infant mortality rate for the 10 leading causes of infant death in non-Hispanic blacks, Chicago, 2007-2009
252. Average annual infant deaths, cumulative infant deaths, percentage of cumulative infant deaths and average infant mortality rate for the 5 leading causes of infant death in non-Hispanic whites, Chicago, 2007-2009
Neonatal Mortality253. Neonatal deaths and percentage of total neonatal deaths for the
10 leading causes of infant death, Chicago, 2007254. Neonatal deaths and percentage of total neonatal deaths for the
10 leading causes of infant death, Chicago, 2008255. Neonatal deaths and percentage of total neonatal deaths for the
10 leading causes of infant death, Chicago, 2009
Neonatal Mortality by Race-Ethnicity256. Average annual neonatal deaths, cumulative neonatal deaths
and percentage of cumulative neonatal deaths for the 5 leading causes of infant death in Hispanics, Chicago, 2007-2009
257. Average annual neonatal deaths, cumulative neonatal deaths and percentage of cumulative neonatal deaths for the 5 leading causes of infant death in non-Hispanic blacks, Chicago, 2007-2009
258. Average annual neonatal deaths, cumulative neonatal deaths and percentage of cumulative neonatal deaths for the 5 leading causes of infant death in non-Hispanic whites, Chicago, 2007-2009
Postneonatal Mortality259. Postneonatal deaths and percentage of total postneonatal deaths
for the 10 leading causes of infant death, Chicago, 2007260. Postneonatal deaths and percentage of total postneonatal deaths
for the 10 leading causes of infant death, Chicago, 2008261. Postneonatal deaths and percentage of total postneonatal deaths
for the 10 leading causes of infant death, Chicago, 2009
Postneonatal Mortality by Race-Ethnicity262. Average annual postneonatal deaths, cumulative postneonatal
deaths and percentage of cumulative postneonatal deaths for the 5 leading causes of infant death in Hispanics, Chicago, 2007-2009
263. Average annual postneonatal deaths, cumulative postneonatal deaths and percentage of cumulative postneonatal deaths for the 5 leading causes of infant death in non-Hispanic blacks, Chicago, 2007-2009
Cause of Death Ranking264. Rankable causes of death265. Rankable causes of infant death
LIST OF DETAILED FIGURES
1. Percent distribution of the 10 leading causes of death by race-ethnicity, Chicago, 2009
2. Average age-adjusted death rates due to all causes by community area, Chicago, 2007-2009
3. Average age-adjusted death rates due to heart disease by community area, Chicago, 2007-2009
4. Average age-adjusted death rates due to cancer by community area, Chicago, 2007-2009
5. Average age-adjusted death rates due to stroke by community area, Chicago, 2007-2009
6. Average infant mortality rates by community area, Chicago, 2007-2009
7. 1989 revision of the U.S. Standard Certifi cate of Death8. 2003 revision of the U.S. Standard Certifi cate of Death
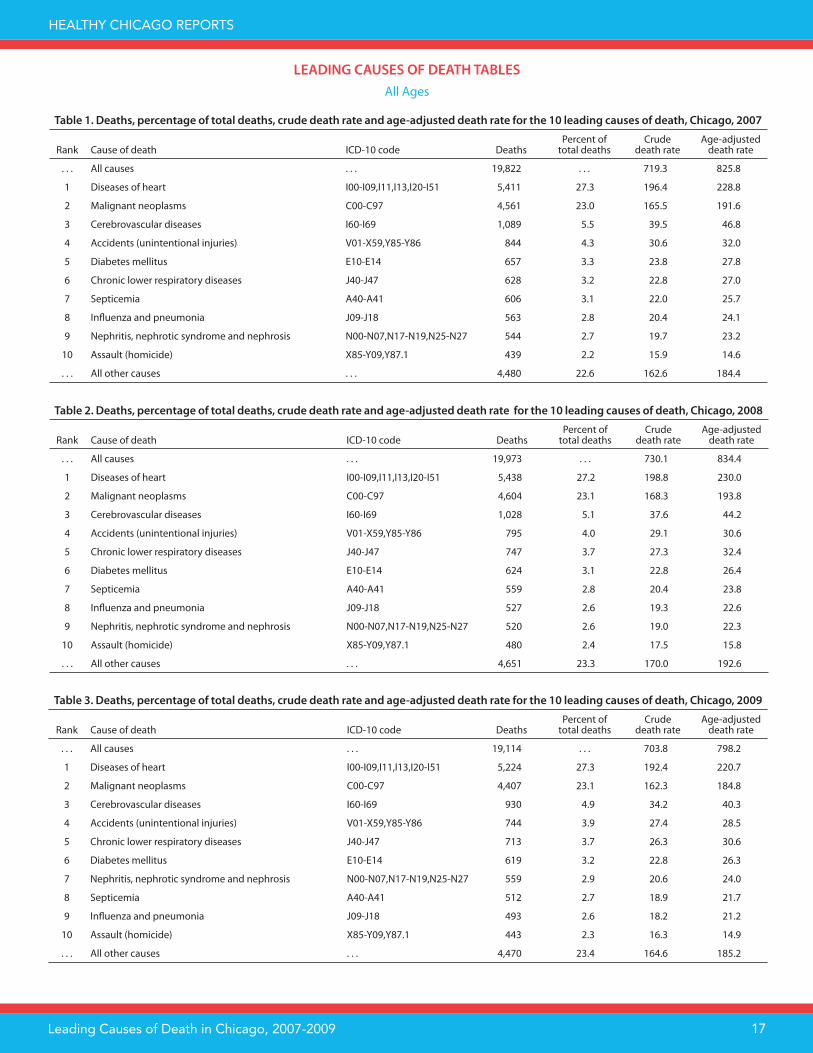
HEALTHY CHICAGO REPORTS
Leading Causes of Death in Chicago, 2007-2009 17
Table 1. Deaths, percentage of total deaths, crude death rate and age-adjusted death rate for the 10 leading causes of death, Chicago, 2007
Rank Cause of death ICD-10 code DeathsPercent of
total deathsCrude
death rateAge-adjusted
death rate
. . . All causes . . . 19,822 . . . 719.3 825.8
1 Diseases of heart I00-I09,I11,I13,I20-I51 5,411 27.3 196.4 228.8
2 Malignant neoplasms C00-C97 4,561 23.0 165.5 191.6
3 Cerebrovascular diseases I60-I69 1,089 5.5 39.5 46.8
4 Accidents (unintentional injuries) V01-X59,Y85-Y86 844 4.3 30.6 32.0
5 Diabetes mellitus E10-E14 657 3.3 23.8 27.8
6 Chronic lower respiratory diseases J40-J47 628 3.2 22.8 27.0
7 Septicemia A40-A41 606 3.1 22.0 25.7
8 Infl uenza and pneumonia J09-J18 563 2.8 20.4 24.1
9 Nephritis, nephrotic syndrome and nephrosis N00-N07,N17-N19,N25-N27 544 2.7 19.7 23.2
10 Assault (homicide) X85-Y09,Y87.1 439 2.2 15.9 14.6
. . . All other causes . . . 4,480 22.6 162.6 184.4
Table 2. Deaths, percentage of total deaths, crude death rate and age-adjusted death rate for the 10 leading causes of death, Chicago, 2008
Rank Cause of death ICD-10 code DeathsPercent of
total deathsCrude
death rateAge-adjusted
death rate
. . . All causes . . . 19,973 . . . 730.1 834.4
1 Diseases of heart I00-I09,I11,I13,I20-I51 5,438 27.2 198.8 230.0
2 Malignant neoplasms C00-C97 4,604 23.1 168.3 193.8
3 Cerebrovascular diseases I60-I69 1,028 5.1 37.6 44.2
4 Accidents (unintentional injuries) V01-X59,Y85-Y86 795 4.0 29.1 30.6
5 Chronic lower respiratory diseases J40-J47 747 3.7 27.3 32.4
6 Diabetes mellitus E10-E14 624 3.1 22.8 26.4
7 Septicemia A40-A41 559 2.8 20.4 23.8
8 Infl uenza and pneumonia J09-J18 527 2.6 19.3 22.6
9 Nephritis, nephrotic syndrome and nephrosis N00-N07,N17-N19,N25-N27 520 2.6 19.0 22.3
10 Assault (homicide) X85-Y09,Y87.1 480 2.4 17.5 15.8
. . . All other causes . . . 4,651 23.3 170.0 192.6
Table 3. Deaths, percentage of total deaths, crude death rate and age-adjusted death rate for the 10 leading causes of death, Chicago, 2009
Rank Cause of death ICD-10 code DeathsPercent of
total deathsCrude
death rateAge-adjusted
death rate
. . . All causes . . . 19,114 . . . 703.8 798.2
1 Diseases of heart I00-I09,I11,I13,I20-I51 5,224 27.3 192.4 220.7
2 Malignant neoplasms C00-C97 4,407 23.1 162.3 184.8
3 Cerebrovascular diseases I60-I69 930 4.9 34.2 40.3
4 Accidents (unintentional injuries) V01-X59,Y85-Y86 744 3.9 27.4 28.5
5 Chronic lower respiratory diseases J40-J47 713 3.7 26.3 30.6
6 Diabetes mellitus E10-E14 619 3.2 22.8 26.3
7 Nephritis, nephrotic syndrome and nephrosis N00-N07,N17-N19,N25-N27 559 2.9 20.6 24.0
8 Septicemia A40-A41 512 2.7 18.9 21.7
9 Infl uenza and pneumonia J09-J18 493 2.6 18.2 21.2
10 Assault (homicide) X85-Y09,Y87.1 443 2.3 16.3 14.9
. . . All other causes . . . 4,470 23.4 164.6 185.2
LEADING CAUSES OF DEATH TABLES
All Ages

HEALTHY CHICAGO REPORTS
Leading Causes of Death in Chicago, 2007-2009 18
Table 4. Deaths, percentage of total deaths, crude death rate and age-adjusted death rate for the 10 leading causes of death in females,
Chicago, 2007
Rank Cause of death ICD-10 code DeathsPercent of
total deathsCrude
death rateAge-adjusted
death rate
. . . All causes . . . 9,741 . . . 686.7 683.0
1 Diseases of heart I00-I09,I11,I13,I20-I51 2,605 26.7 183.6 179.5
2 Malignant neoplasms C00-C97 2,309 23.7 162.8 166.5
3 Cerebrovascular diseases I60-I69 630 6.5 44.4 43.9
4 Septicemia A40-A41 347 3.6 24.5 24.4
5 Diabetes mellitus E10-E14 337 3.5 23.8 24.3
6 Chronic lower respiratory diseases J40-J47 317 3.3 22.3 22.4
7 Infl uenza and pneumonia J09-J18 286 2.9 20.2 19.3
8 Nephritis, nephrotic syndrome and nephrosis N00-N07,N17-N19,N25-N27 270 2.8 19.0 19.1
9 Accidents (unintentional injuries) V01-X59,Y85-Y86 250 2.6 17.6 18.1
10 Alzheimer's disease G30 226 2.3 15.9 14.9
. . . All other causes . . . 2,164 22.2 152.6 150.8
Table 5. Deaths, percentage of total deaths, crude death rate and age-adjusted death rate for the 10 leading causes of death in females,
Chicago, 2008
Rank Cause of death ICD-10 code DeathsPercent of
total deathsCrude
death rateAge-adjusted
death rate
. . . All causes . . . 9,823 . . . 697.6 691.0
1 Diseases of heart I00-I09,I11,I13,I20-I51 2,618 26.7 185.9 181.0
2 Malignant neoplasms C00-C97 2,274 23.1 161.5 164.0
3 Cerebrovascular diseases I60-I69 626 6.4 44.5 43.6
4 Chronic lower respiratory diseases J40-J47 405 4.1 28.8 28.7
5 Diabetes mellitus E10-E14 312 3.2 22.2 22.4
6 Septicemia A40-A41 308 3.1 21.9 21.7
7 Alzheimer's disease G30 278 2.8 19.7 18.3
8 Infl uenza and pneumonia J09-J18 271 2.8 19.2 18.7
9 Nephritis, nephrotic syndrome and nephrosis N00-N07,N17-N19,N25-N27 268 2.7 19.0 19.2
10 Accidents (unintentional injuries) V01-X59,Y85-Y86 251 2.6 17.8 18.3
. . . All other causes . . . 2,212 22.5 157.1 155.1
Table 6. Deaths, percentage of total deaths, crude death rate and age-adjusted death rate for the 10 leading causes of death in females,
Chicago, 2009
Rank Cause of death ICD-10 code DeathsPercent of
total deathsCrude
death rateAge-adjusted
death rate
. . . All causes . . . 9,414 . . . 673.5 663.8
1 Diseases of heart I00-I09,I11,I13,I20-I51 2,492 26.5 178.3 173.1
2 Malignant neoplasms C00-C97 2,234 23.7 159.8 161.8
3 Cerebrovascular diseases I60-I69 531 5.6 38.0 37.2
4 Chronic lower respiratory diseases J40-J47 371 3.9 26.5 26.3
5 Diabetes mellitus E10-E14 328 3.5 23.5 23.5
6 Nephritis, nephrotic syndrome and nephrosis N00-N07,N17-N19,N25-N27 280 3.0 20.0 19.8
7 Septicemia A40-A41 277 2.9 19.8 19.3
8 Alzheimer's disease G30 253 2.7 18.1 16.6
9 Infl uenza and pneumonia J09-J18 252 2.7 18.0 17.7
10 Accidents (unintentional injuries) V01-X59,Y85-Y86 217 2.3 15.5 15.8
. . . All other causes . . . 2,179 23.1 155.9 152.8
All Ages by Sex

HEALTHY CHICAGO REPORTS
Leading Causes of Death in Chicago, 2007-2009 19
Table 7. Deaths, percentage of total deaths, crude death rate and age-adjusted death rate for the 10 leading causes of death in males,
Chicago, 2007
Rank Cause of death ICD-10 code DeathsPercent of
total deathsCrude
death rateAge-adjusted
death rate
. . . All causes . . . 10,078 . . . 753.7 1,016.8
1 Diseases of heart I00-I09,I11,I13,I20-I51 2,806 27.8 209.8 296.5
2 Malignant neoplasms C00-C97 2,252 22.3 168.4 233.4
3 Accidents (unintentional injuries) V01-X59,Y85-Y86 594 5.9 44.4 47.8
4 Cerebrovascular diseases I60-I69 458 4.5 34.3 50.4
5 Assault (homicide) X85-Y09,Y87.1 382 3.8 28.6 25.5
6 Diabetes mellitus E10-E14 320 3.2 23.9 32.9
7 Chronic lower respiratory diseases J40-J47 311 3.1 23.3 33.6
8 Infl uenza and pneumonia J09-J18 277 2.7 20.7 31.4
9 Nephritis, nephrotic syndrome and nephrosis N00-N07,N17-N19,N25-N27 274 2.7 20.5 29.9
10 Septicemia A40-A41 259 2.6 19.4 27.5
. . . All other causes . . . 2,145 21.3 160.4 208
Table 8. Deaths, percentage of total deaths, crude death rate and age-adjusted death rate for the 10 leading causes of death in males,
Chicago, 2008
Rank Cause of death ICD-10 code DeathsPercent of
total deathsCrude
death rateAge-adjusted
death rate
. . . All causes . . . 10,150 . . . 764.6 1,023.4
1 Diseases of heart I00-I09,I11,I13,I20-I51 2,820 27.8 212.4 296.0
2 Malignant neoplasms C00-C97 2,330 23.0 175.5 240.8
3 Accidents (unintentional injuries) V01-X59,Y85-Y86 544 5.4 41.0 44.9
4 Assault (homicide) X85-Y09,Y87.1 429 4.2 32.3 28.5
5 Cerebrovascular diseases I60-I69 402 4.0 30.3 43.9
6 Chronic lower respiratory diseases J40-J47 342 3.4 25.8 38.4
7 Diabetes mellitus E10-E14 312 3.1 23.5 32.1
8 Infl uenza and pneumonia J09-J18 256 2.5 19.3 29.1
9 Nephritis, nephrotic syndrome and nephrosis N00-N07,N17-N19,N25-N27 252 2.5 19.0 27.0
10 Septicemia A40-A41 251 2.5 18.9 26.9
. . . All other causes . . . 2,212 21.8 166.6 215.8
Table 9. Deaths, percentage of total deaths, crude death rate and age-adjusted death rate for the 10 leading causes of death in males,
Chicago, 2009
Rank Cause of death ICD-10 code DeathsPercent of
total deathsCrude
death rateAge-adjusted
death rate
. . . All causes . . . 9,700 . . . 736.1 977.0
1 Diseases of heart I00-I09,I11,I13,I20-I51 2,732 28.2 207.3 283.3
2 Malignant neoplasms C00-C97 2,173 22.4 164.9 221.8
3 Accidents (unintentional injuries) V01-X59,Y85-Y86 527 5.4 40.0 43.1
4 Cerebrovascular diseases I60-I69 399 4.1 30.3 44.8
5 Assault (homicide) X85-Y09,Y87.1 389 4.0 29.5 26.5
6 Chronic lower respiratory diseases J40-J47 342 3.5 26.0 37.6
7 Diabetes mellitus E10-E14 291 3.0 22.1 30.1
8 Nephritis, nephrotic syndrome and nephrosis N00-N07,N17-N19,N25-N27 279 2.9 21.2 30.8
9 Infl uenza and pneumonia J09-J18 241 2.5 18.3 27.2
10 Septicemia A40-A41 235 2.4 17.8 24.6
. . . All other causes . . . 2,092 21.6 158.8 207.3

HEALTHY CHICAGO REPORTS
Leading Causes of Death in Chicago, 2007-2009 20
Table 10. Deaths, percentage of total deaths, crude death rate and age-adjusted death rate for the 10 leading causes of death in Hispanics,
Chicago, 2007
Rank Cause of death ICD-10 code DeathsPercent of
total deathsCrude
death rateAge-adjusted
death rate
. . . All causes . . . 1,871 . . . 242.6 505.3
1 Diseases of heart I00-I09,I11,I13,I20-I51 401 21.4 52.0 131.5
2 Malignant neoplasms C00-C97 383 20.5 49.7 105.2
3 Accidents (unintentional injuries) V01-X59,Y85-Y86 152 8.1 19.7 22.9
4 Cerebrovascular diseases I60-I69 94 5.0 12.2 34.5
5 Diabetes mellitus E10-E14 87 4.6 11.3 29.7
6 Assault (homicide) X85-Y09,Y87.1 81 4.3 10.5 9.4
7 Chronic liver disease and cirrhosis K70,K73-K74 65 3.5 8.4 14.1
8 Septicemia A40-A41 55 2.9 7.1 19.0
9 Certain conditions originating in the perinatal period P00-P96 51 2.7 6.6 4.6
10 Nephritis, nephrotic syndrome and nephrosis N00-N07,N17-N19,N25-N27 48 2.6 6.2 14.1
. . . All other causes . . . 454 24.3 58.9 120.2
Table 11. Deaths, percentage of total deaths, crude death rate and age-adjusted death rate for the 10 leading causes of death in Hispanics,
Chicago, 2008
Rank Cause of death ICD-10 code DeathsPercent of
total deathsCrude
death rateAge-adjusted
death rate
. . . All causes . . . 1,914 . . . 247.3 508.1
1 Malignant neoplasms C00-C97 405 21.2 52.3 110.2
2 Diseases of heart I00-I09,I11,I13,I20-I51 368 19.2 47.6 115.6
3 Accidents (unintentional injuries) V01-X59,Y85-Y86 146 7.6 18.9 23.8
4 Assault (homicide) X85-Y09,Y87.1 97 5.1 12.5 10.4
5 Diabetes mellitus E10-E14 85 4.4 11.0 26.2
6 Cerebrovascular diseases I60-I69 76 4.0 9.8 25.4
7 Chronic liver disease and cirrhosis K70,K73-K74 73 3.8 9.4 17.3
8 Nephritis, nephrotic syndrome and nephrosis N00-N07,N17-N19,N25-N27 66 3.4 8.5 19.6
9 Septicemia A40-A41 58 3.0 7.5 18.7
10 Certain conditions originating in the perinatal period P00-P96 50 2.6 6.5 4.5
. . . All other causes . . . 490 25.6 63.3 136.5
Table 12. Deaths, percentage of total deaths, crude death rate and age-adjusted death rate for the 10 leading causes of death in Hispanics,
Chicago, 2009
Rank Cause of death ICD-10 code DeathsPercent of
total deathsCrude
death rateAge-adjusted
death rate
. . . All causes . . . 1,959 . . . 252.3 513.4
1 Malignant neoplasms C00-C97 390 19.9 50.2 105.1
2 Diseases of heart I00-I09,I11,I13,I20-I51 381 19.4 49.1 113.8
3 Accidents (unintentional injuries) V01-X59,Y85-Y86 127 6.5 16.4 20.4
4 Diabetes mellitus E10-E14 111 5.7 14.3 34.2
5 Cerebrovascular diseases I60-I69 92 4.7 11.9 29.4
6 Assault (homicide) X85-Y09,Y87.1 87 4.4 11.2 9.1
7 Chronic liver disease and cirrhosis K70,K73-K74 74 3.8 9.5 15.8
8 Nephritis, nephrotic syndrome and nephrosis N00-N07,N17-N19,N25-N27 66 3.4 8.5 22.1
9 Septicemia A40-A41 59 3.0 7.6 15.6
10 Infl uenza and pneumonia J09-J18 55 2.8 7.1 17.0
. . . All other causes . . . 517 26.4 66.6 130.9
All Ages by Race-Ethnicity

HEALTHY CHICAGO REPORTS
Leading Causes of Death in Chicago, 2007-2009 21
Table 13. Deaths, percentage of total deaths, crude death rate and age-adjusted death rate for the 10 leading causes of death in non-
Hispanic Asian/Pacifi c Islanders, Chicago, 2007
Rank Cause of death ICD-10 code DeathsPercent of
total deathsCrude
death rateAge-adjusted
death rate
. . . All causes . . . 425 . . . 304.8 392.7
1 Malignant neoplasms C00-C97 106 24.9 76.0 90.6
2 Diseases of heart I00-I09,I11,I13,I20-I51 89 20.9 63.8 86.6
3 Cerebrovascular diseases I60-I69 38 8.9 27.3 36.5
4 Diabetes mellitus E10-E14 24 5.6 17.2 21.5
5 Nephritis, nephrotic syndrome and nephrosis N00-N07,N17-N19,N25-N27 19 4.5 13.6 19.0
6 Infl uenza and pneumonia J09-J18 16 3.8 11.5 16.4
7 Chronic lower respiratory diseases J40-J47 15 3.5 10.8 15.3
8 Septicemia A40-A41 14 3.3 10.0 13.0
9 Accidents (unintentional injuries) V01-X59,Y85-Y86 14 3.3 10.0 12.3
10 Essential hypertension and hypertensive renal disease I10,I12,I15 10 2.4 7.2 10.0
. . . All other causes . . . 80 18.8 57.4 71.5
Table 14. Deaths, percentage of total deaths, crude death rate and age-adjusted death rate for the 10 leading causes of death in non-
Hispanic Asian/Pacifi c Islanders, Chicago, 2008
Rank Cause of death ICD-10 code DeathsPercent of
total deathsCrude
death rateAge-adjusted
death rate
. . . All causes . . . 472 . . . 333.7 421.6
1 Malignant neoplasms C00-C97 129 27.3 91.2 106.4
2 Diseases of heart I00-I09,I11,I13,I20-I51 118 25.0 83.4 108.0
3 Cerebrovascular diseases I60-I69 35 7.4 24.7 32.6
4 Chronic lower respiratory diseases J40-J47 27 5.7 19.1 27.0
5 Diabetes mellitus E10-E14 20 4.2 14.1 18.7
6 Accidents (unintentional injuries) V01-X59,Y85-Y86 18 3.8 12.7 13.9
7 Infl uenza and pneumonia J09-J18 16 3.4 11.3 14.7
8 Nephritis, nephrotic syndrome and nephrosis N00-N07,N17-N19,N25-N27 9 1.9 6.4 8.2
9 Essential hypertension and hypertensive renal disease I10,I12,I15 6 1.3 4.2 6.0
10 Pneumonitis due to solids and liquids J69 5 1.1 3.5 5.1
10 Intentional self-harm (suicide) X60-X84,Y87.0 5 1.1 3.5 2.9
. . . All other causes . . . 84 17.8 59.4 78.0
Table 15. Deaths, percentage of total deaths, crude death rate and age-adjusted death rate for the 10 leading causes of death in non-
Hispanic Asian/Pacifi c Islanders, Chicago, 2009
Rank Cause of death ICD-10 code DeathsPercent of
total deathsCrude
death rateAge-adjusted
death rate
. . . All causes . . . 502 . . . 349.9 442.4
1 Malignant neoplasms C00-C97 124 24.7 86.4 101.4
2 Diseases of heart I00-I09,I11,I13,I20-I51 119 23.7 83.0 107.6
3 Cerebrovascular diseases I60-I69 35 7.0 24.4 32.8
4 Nephritis, nephrotic syndrome and nephrosis N00-N07,N17-N19,N25-N27 23 4.6 16.0 21.5
5 Diabetes mellitus E10-E14 21 4.2 14.6 16.9
6 Chronic lower respiratory diseases J40-J47 18 3.6 12.5 16.2
7 Accidents (unintentional injuries) V01-X59,Y85-Y86 17 3.4 11.9 13.7
8 Infl uenza and pneumonia J09-J18 13 2.6 9.1 12.4
9 Septicemia A40-A41 10 2.0 7.0 9.3
10 Alzheimer's disease G30 9 1.8 6.3 8.6
. . . All other causes . . . 113 22.5 78.8 101.9

HEALTHY CHICAGO REPORTS
Leading Causes of Death in Chicago, 2007-2009 22
Table 16. Deaths, percentage of total deaths, crude death rate and age-adjusted death rate for the 10 leading causes of death in non-
Hispanic blacks, Chicago, 2007
Rank Cause of death ICD-10 code DeathsPercent of
total deathsCrude
death rateAge-adjusted
death rate
. . . All causes . . . 9,623 . . . 1,038.4 1,104.5
1 Diseases of heart I00-I09,I11,I13,I20-I51 2,410 25.0 260.1 278.8
2 Malignant neoplasms C00-C97 2,323 24.1 250.7 262.5
3 Cerebrovascular diseases I60-I69 520 5.4 56.1 60.9
4 Accidents (unintentional injuries) V01-X59,Y85-Y86 413 4.3 44.6 46.1
5 Diabetes mellitus E10-E14 339 3.5 36.6 38.5
6 Assault (homicide) X85-Y09,Y87.1 329 3.4 35.5 35.0
7 Septicemia A40-A41 326 3.4 35.2 37.8
8 Nephritis, nephrotic syndrome and nephrosis N00-N07,N17-N19,N25-N27 301 3.1 32.5 34.8
9 Chronic lower respiratory diseases J40-J47 268 2.8 28.9 31.0
10 Infl uenza and pneumonia J09-J18 243 2.5 26.2 29.4
. . . All other causes . . . 2,151 22.4 232.1 249.9
Table 17. Deaths, percentage of total deaths, crude death rate and age-adjusted death rate for the 10 leading causes of death in non-
Hispanic blacks, Chicago, 2008
Rank Cause of death ICD-10 code DeathsPercent of
total deathsCrude
death rateAge-adjusted
death rate
. . . All causes . . . 9,362 . . . 1,030.4 1,075.8
1 Diseases of heart I00-I09,I11,I13,I20-I51 2,431 26.0 267.6 280.0
2 Malignant neoplasms C00-C97 2,207 23.6 242.9 248.7
3 Cerebrovascular diseases I60-I69 499 5.3 54.9 58.1
4 Accidents (unintentional injuries) V01-X59,Y85-Y86 365 3.9 40.2 41.7
5 Assault (homicide) X85-Y09,Y87.1 348 3.7 38.3 37.2
6 Chronic lower respiratory diseases J40-J47 328 3.5 36.1 38.5
7 Diabetes mellitus E10-E14 317 3.4 34.9 36.3
8 Septicemia A40-A41 288 3.1 31.7 33.8
9 Nephritis, nephrotic syndrome and nephrosis N00-N07,N17-N19,N25-N27 263 2.8 28.9 30.5
10 Infl uenza and pneumonia J09-J18 217 2.3 23.9 25.9
. . . All other causes . . . 2,099 22.4 231.0 245.0
Table 18. Deaths, percentage of total deaths, crude death rate and age-adjusted death rate for the 10 leading causes of death in non-
Hispanic blacks, Chicago, 2009
Rank Cause of death ICD-10 code DeathsPercent of
total deathsCrude
death rateAge-adjusted
death rate
. . . All causes . . . 9,036 . . . 1,014.8 1,035.1
1 Diseases of heart I00-I09,I11,I13,I20-I51 2,418 26.8 271.6 277.2
2 Malignant neoplasms C00-C97 2,086 23.1 234.3 232.1
3 Cerebrovascular diseases I60-I69 427 4.7 48.0 50.3
4 Accidents (unintentional injuries) V01-X59,Y85-Y86 343 3.8 38.5 39.5
5 Assault (homicide) X85-Y09,Y87.1 340 3.8 38.2 38.2
6 Diabetes mellitus E10-E14 310 3.4 34.8 35.5
7 Chronic lower respiratory diseases J40-J47 310 3.4 34.8 35.9
8 Nephritis, nephrotic syndrome and nephrosis N00-N07,N17-N19,N25-N27 303 3.4 34.0 35.3
9 Septicemia A40-A41 270 3.0 30.3 31.7
10 Infl uenza and pneumonia J09-J18 202 2.2 22.7 23.7
. . . All other causes . . . 2,027 22.4 227.6 235.7

HEALTHY CHICAGO REPORTS
Leading Causes of Death in Chicago, 2007-2009 23
Table 19. Deaths, percentage of total deaths, crude death rate and age-adjusted death rate for the 10 leading causes of death in non-
Hispanic whites, Chicago, 2007
Rank Cause of death ICD-10 code DeathsPercent of
total deathsCrude
death rateAge-adjusted
death rate
. . . All causes . . . 7,864 . . . 903.4 754.4
1 Diseases of heart I00-I09,I11,I13,I20-I51 2,501 31.8 287.3 232.4
2 Malignant neoplasms C00-C97 1,741 22.1 200.0 172.9
3 Cerebrovascular diseases I60-I69 432 5.5 49.6 39.4
4 Chronic lower respiratory diseases J40-J47 318 4.0 36.5 30.8
5 Accidents (unintentional injuries) V01-X59,Y85-Y86 263 3.3 30.2 27.1
6 Infl uenza and pneumonia J09-J18 258 3.3 29.6 23.1
7 Septicemia A40-A41 211 2.7 24.2 20.4
8 Diabetes mellitus E10-E14 207 2.6 23.8 20.3
9 Nephritis, nephrotic syndrome and nephrosis N00-N07,N17-N19,N25-N27 175 2.2 20.1 16.2
10 Alzheimer's disease G30 142 1.8 16.3 12.1
. . . All other causes . . . 1,616 20.5 185.7 159.8
Table 20. Deaths, percentage of total deaths, crude death rate and age-adjusted death rate for the 10 leading causes of death in non-
Hispanic whites, Chicago, 2008
Rank Cause of death ICD-10 code DeathsPercent of
total deathsCrude
death rateAge-adjusted
death rate
. . . All causes . . . 8,200 . . . 947.8 802.2
1 Diseases of heart I00-I09,I11,I13,I20-I51 2,515 30.7 290.7 238.7
2 Malignant neoplasms C00-C97 1,855 22.6 214.4 188.5
3 Cerebrovascular diseases I60-I69 416 5.1 48.1 38.6
4 Chronic lower respiratory diseases J40-J47 352 4.3 40.7 34.7
5 Accidents (unintentional injuries) V01-X59,Y85-Y86 265 3.2 30.6 27.6
6 Infl uenza and pneumonia J09-J18 255 3.1 29.5 23.9
7 Septicemia A40-A41 210 2.6 24.3 20.3
8 Diabetes mellitus E10-E14 201 2.5 23.2 20.5
9 Alzheimer's disease G30 191 2.3 22.1 16.5
10 Nephritis, nephrotic syndrome and nephrosis N00-N07,N17-N19,N25-N27 182 2.2 21.0 17.7
. . . All other causes . . . 1,758 21.4 203.2 175.3
Table 21. Deaths, percentage of total deaths, crude death rate and age-adjusted death rate for the 10 leading causes of death in non-
Hispanic whites, Chicago, 2009
Rank Cause of death ICD-10 code DeathsPercent of
total deathsCrude
death rateAge-adjusted
death rate
. . . All causes . . . 7,596 . . . 883.3 755.8
1 Diseases of heart I00-I09,I11,I13,I20-I51 2,298 30.3 267.2 221.5
2 Malignant neoplasms C00-C97 1,802 23.7 209.5 187.8
3 Cerebrovascular diseases I60-I69 376 4.9 43.7 35.5
4 Chronic lower respiratory diseases J40-J47 338 4.4 39.3 33.5
5 Accidents (unintentional injuries) V01-X59,Y85-Y86 256 3.4 29.8 27.0
6 Infl uenza and pneumonia J09-J18 223 2.9 25.9 21.1
7 Diabetes mellitus E10-E14 177 2.3 20.6 18.1
8 Septicemia A40-A41 172 2.3 20.0 17.0
9 Alzheimer's disease G30 171 2.3 19.9 14.9
10 Nephritis, nephrotic syndrome and nephrosis N00-N07,N17-N19,N25-N27 166 2.2 19.3 16.3
. . . All other causes . . . 1,617 21.3 188.0 163.0
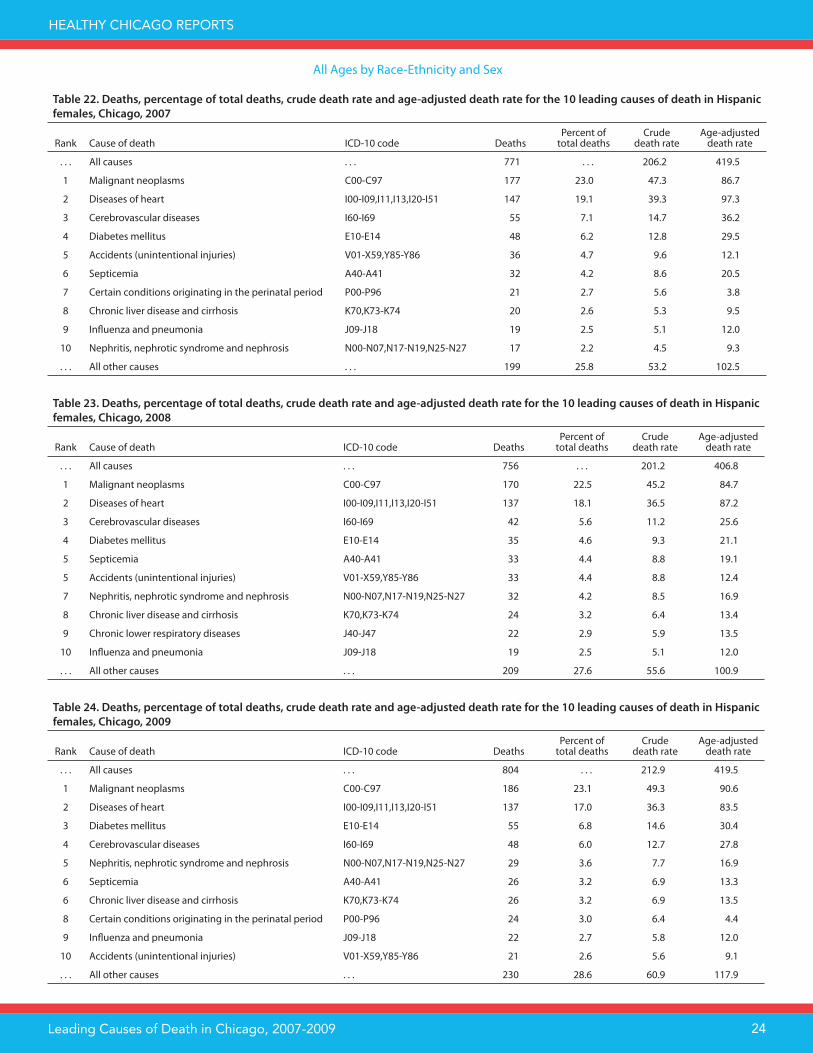
HEALTHY CHICAGO REPORTS
Leading Causes of Death in Chicago, 2007-2009 24
Table 22. Deaths, percentage of total deaths, crude death rate and age-adjusted death rate for the 10 leading causes of death in Hispanic
females, Chicago, 2007
Rank Cause of death ICD-10 code DeathsPercent of
total deathsCrude
death rateAge-adjusted
death rate
. . . All causes . . . 771 . . . 206.2 419.5
1 Malignant neoplasms C00-C97 177 23.0 47.3 86.7
2 Diseases of heart I00-I09,I11,I13,I20-I51 147 19.1 39.3 97.3
3 Cerebrovascular diseases I60-I69 55 7.1 14.7 36.2
4 Diabetes mellitus E10-E14 48 6.2 12.8 29.5
5 Accidents (unintentional injuries) V01-X59,Y85-Y86 36 4.7 9.6 12.1
6 Septicemia A40-A41 32 4.2 8.6 20.5
7 Certain conditions originating in the perinatal period P00-P96 21 2.7 5.6 3.8
8 Chronic liver disease and cirrhosis K70,K73-K74 20 2.6 5.3 9.5
9 Infl uenza and pneumonia J09-J18 19 2.5 5.1 12.0
10 Nephritis, nephrotic syndrome and nephrosis N00-N07,N17-N19,N25-N27 17 2.2 4.5 9.3
. . . All other causes . . . 199 25.8 53.2 102.5
Table 23. Deaths, percentage of total deaths, crude death rate and age-adjusted death rate for the 10 leading causes of death in Hispanic
females, Chicago, 2008
Rank Cause of death ICD-10 code DeathsPercent of
total deathsCrude
death rateAge-adjusted
death rate
. . . All causes . . . 756 . . . 201.2 406.8
1 Malignant neoplasms C00-C97 170 22.5 45.2 84.7
2 Diseases of heart I00-I09,I11,I13,I20-I51 137 18.1 36.5 87.2
3 Cerebrovascular diseases I60-I69 42 5.6 11.2 25.6
4 Diabetes mellitus E10-E14 35 4.6 9.3 21.1
5 Septicemia A40-A41 33 4.4 8.8 19.1
5 Accidents (unintentional injuries) V01-X59,Y85-Y86 33 4.4 8.8 12.4
7 Nephritis, nephrotic syndrome and nephrosis N00-N07,N17-N19,N25-N27 32 4.2 8.5 16.9
8 Chronic liver disease and cirrhosis K70,K73-K74 24 3.2 6.4 13.4
9 Chronic lower respiratory diseases J40-J47 22 2.9 5.9 13.5
10 Infl uenza and pneumonia J09-J18 19 2.5 5.1 12.0
. . . All other causes . . . 209 27.6 55.6 100.9
Table 24. Deaths, percentage of total deaths, crude death rate and age-adjusted death rate for the 10 leading causes of death in Hispanic
females, Chicago, 2009
Rank Cause of death ICD-10 code DeathsPercent of
total deathsCrude
death rateAge-adjusted
death rate
. . . All causes . . . 804 . . . 212.9 419.5
1 Malignant neoplasms C00-C97 186 23.1 49.3 90.6
2 Diseases of heart I00-I09,I11,I13,I20-I51 137 17.0 36.3 83.5
3 Diabetes mellitus E10-E14 55 6.8 14.6 30.4
4 Cerebrovascular diseases I60-I69 48 6.0 12.7 27.8
5 Nephritis, nephrotic syndrome and nephrosis N00-N07,N17-N19,N25-N27 29 3.6 7.7 16.9
6 Septicemia A40-A41 26 3.2 6.9 13.3
6 Chronic liver disease and cirrhosis K70,K73-K74 26 3.2 6.9 13.5
8 Certain conditions originating in the perinatal period P00-P96 24 3.0 6.4 4.4
9 Infl uenza and pneumonia J09-J18 22 2.7 5.8 12.0
10 Accidents (unintentional injuries) V01-X59,Y85-Y86 21 2.6 5.6 9.1
. . . All other causes . . . 230 28.6 60.9 117.9
All Ages by Race-Ethnicity and Sex

HEALTHY CHICAGO REPORTS
Leading Causes of Death in Chicago, 2007-2009 25
Table 25. Deaths, percentage of total deaths, crude death rate and age-adjusted death rate for the 5 leading causes of death in non-
Hispanic Asian/Pacifi c Islander females, Chicago, 2007
Rank Cause of death ICD-10 code DeathsPercent of
total deathsCrude
death rateAge-adjusted
death rate
. . . All causes . . . 199 . . . 275.6 315.4
1 Malignant neoplasms C00-C97 47 23.6 65.1 70.1
2 Diseases of heart I00-I09,I11,I13,I20-I51 42 21.1 58.2 69.5
3 Cerebrovascular diseases I60-I69 19 9.5 26.3 30.8
4 Diabetes mellitus E10-E14 12 6.0 16.6 18.4
5 Septicemia A40-A41 8 4.0 11.1 11.7
5 Infl uenza and pneumonia J09-J18 8 4.0 11.1 13.6
. . . All other causes . . . 63 31.7 87.2 101.4
Table 26. Deaths, percentage of total deaths, crude death rate and age-adjusted death rate for the 5 leading causes of death in non-
Hispanic Asian/Pacifi c Islander females, Chicago, 2008
Rank Cause of death ICD-10 code DeathsPercent of
total deathsCrude
death rateAge-adjusted
death rate
. . . All causes . . . 215 . . . 292.9 333.0
1 Malignant neoplasms C00-C97 63 29.3 85.8 90.1
2 Diseases of heart I00-I09,I11,I13,I20-I51 54 25.1 73.6 86.2
3 Cerebrovascular diseases I60-I69 18 8.4 24.5 27.5
4 Infl uenza and pneumonia J09-J18 11 5.1 15.0 17.2
4 Chronic lower respiratory diseases J40-J47 11 5.1 15.0 18.3
. . . All other causes . . . 58 27 79.0 93.8
Table 27. Deaths, percentage of total deaths, crude death rate and age-adjusted death rate for the 5 leading causes of death in non-Hispan-
ic Asian/Pacifi c Islander females, Chicago, 2009
Rank Cause of death ICD-10 code DeathsPercent of
total deathsCrude
death rateAge-adjusted
death rate
. . . All causes . . . 243 . . . 325.8 367.0
1 Diseases of heart I00-I09,I11,I13,I20-I51 61 25.1 81.8 94.3
2 Malignant neoplasms C00-C97 55 22.6 73.7 77.5
3 Cerebrovascular diseases I60-I69 19 7.8 25.5 30.3
4 Diabetes mellitus E10-E14 12 4.9 16.1 16.9
4 Nephritis, nephrotic syndrome and nephrosis N00-N07,N17-N19,N25-N27 12 4.9 16.1 18.6
. . . All other causes . . . 84 34.6 112.6 129.3

HEALTHY CHICAGO REPORTS
Leading Causes of Death in Chicago, 2007-2009 26
Table 29. Deaths, percentage of total deaths, crude death rate and age-adjusted death rate for the 10 leading causes of death in non-
Hispanic black females, Chicago, 2008
Rank Cause of death ICD-10 code DeathsPercent of
total deathsCrude
death rateAge-adjusted
death rate
. . . All causes . . . 4,571 . . . 920.8 863.9
1 Diseases of heart I00-I09,I11,I13,I20-I51 1,150 25.2 231.7 215.9
2 Malignant neoplasms C00-C97 1,092 23.9 220.0 203.4
3 Cerebrovascular diseases I60-I69 293 6.4 59.0 55.2
4 Diabetes mellitus E10-E14 173 3.8 34.9 32.1
5 Chronic lower respiratory diseases J40-J47 168 3.7 33.8 31.5
6 Septicemia A40-A41 163 3.6 32.8 30.8
7 Nephritis, nephrotic syndrome and nephrosis N00-N07,N17-N19,N25-N27 144 3.2 29.0 27.0
8 Accidents (unintentional injuries) V01-X59,Y85-Y86 125 2.7 25.2 25.3
9 Infl uenza and pneumonia J09-J18 121 2.6 24.4 22.9
10 Alzheimer's disease G30 118 2.6 23.8 22.0
. . . All other causes . . . 1,024 22.4 206.3 197.7
Table 30. Deaths, percentage of total deaths, crude death rate and age-adjusted death rate for the 10 leading causes of death in non-
Hispanic black females, Chicago, 2009
Rank Cause of death ICD-10 code DeathsPercent of
total deathsCrude
death rateAge-adjusted
death rate
. . . All causes . . . 4,426 . . . 909.6 834.4
1 Diseases of heart I00-I09,I11,I13,I20-I51 1,125 25.4 231.2 210.6
2 Malignant neoplasms C00-C97 1,080 24.4 221.9 200.6
3 Cerebrovascular diseases I60-I69 237 5.4 48.7 44.6
4 Diabetes mellitus E10-E14 170 3.8 34.9 31.6
5 Nephritis, nephrotic syndrome and nephrosis N00-N07,N17-N19,N25-N27 161 3.6 33.1 30.0
6 Septicemia A40-A41 156 3.5 32.1 28.9
7 Chronic lower respiratory diseases J40-J47 153 3.5 31.4 28.6
8 Accidents (unintentional injuries) V01-X59,Y85-Y86 116 2.6 23.8 23.7
9 Infl uenza and pneumonia J09-J18 112 2.5 23.0 21.2
10 Alzheimer's disease G30 110 2.5 22.6 20.4
. . . All other causes . . . 1,006 22.7 206.7 194.2
Table 28. Deaths, percentage of total deaths, crude death rate and age-adjusted death rate for the 10 leading causes of death in non-
Hispanic black females, Chicago, 2007
Rank Cause of death ICD-10 code DeathsPercent of
total deathsCrude
death rateAge-adjusted
death rate
. . . All causes . . . 4,682 . . . 924.9 886.8
1 Malignant neoplasms C00-C97 1,170 25.0 231.1 219.1
2 Diseases of heart I00-I09,I11,I13,I20-I51 1,154 24.6 228.0 217.6
3 Cerebrovascular diseases I60-I69 290 6.2 57.3 54.9
4 Septicemia A40-A41 189 4.0 37.3 35.3
5 Diabetes mellitus E10-E14 171 3.7 33.8 32.1
6 Nephritis, nephrotic syndrome and nephrosis N00-N07,N17-N19,N25-N27 161 3.4 31.8 30.4
7 Accidents (unintentional injuries) V01-X59,Y85-Y86 133 2.8 26.3 26.7
8 Chronic lower respiratory diseases J40-J47 127 2.7 25.1 23.8
9 Infl uenza and pneumonia J09-J18 122 2.6 24.1 23.3
10 Alzheimer's disease G30 105 2.2 20.7 19.8
. . . All other causes . . . 1,060 22.6 209.4 203.8

HEALTHY CHICAGO REPORTS
Leading Causes of Death in Chicago, 2007-2009 27
Table 32. Deaths, percentage of total deaths, crude death rate and age-adjusted death rate for the 10 leading causes of death in non-
Hispanic white females, Chicago, 2008
Rank Cause of death ICD-10 code DeathsPercent of
total deathsCrude
death rateAge-adjusted
death rate
. . . All causes . . . 4,269 . . . 973.7 671.0
1 Diseases of heart I00-I09,I11,I13,I20-I51 1,276 29.9 291.0 185.3
2 Malignant neoplasms C00-C97 943 22.1 215.1 165.3
3 Cerebrovascular diseases I60-I69 272 6.4 62.0 39.6
4 Chronic lower respiratory diseases J40-J47 204 4.8 46.5 33.0
5 Alzheimer's disease G30 142 3.3 32.4 18.0
6 Infl uenza and pneumonia J09-J18 120 2.8 27.4 17.5
7 Septicemia A40-A41 110 2.6 25.1 17.1
8 Diabetes mellitus E10-E14 99 2.3 22.6 16.6
9 Accidents (unintentional injuries) V01-X59,Y85-Y86 91 2.1 20.8 16.9
10 Nephritis, nephrotic syndrome and nephrosis N00-N07,N17-N19,N25-N27 87 2.0 19.8 13.8
. . . All other causes . . . 925 21.7 211.0 148.1
Table 33. Deaths, percentage of total deaths, crude death rate and age-adjusted death rate for the 10 leading causes of death in non-
Hispanic white females, Chicago, 2009
Rank Cause of death ICD-10 code DeathsPercent of
total deathsCrude
death rateAge-adjusted
death rate
. . . All causes . . . 3,931 . . . 903.0 627.3
1 Diseases of heart I00-I09,I11,I13,I20-I51 1,165 29.6 267.6 171.6
2 Malignant neoplasms C00-C97 911 23.2 209.3 164.2
3 Cerebrovascular diseases I60-I69 227 5.8 52.1 33.0
4 Chronic lower respiratory diseases J40-J47 197 5.0 45.3 32.0
5 Alzheimer's disease G30 127 3.2 29.2 16.1
6 Infl uenza and pneumonia J09-J18 109 2.8 25.0 16.0
7 Diabetes mellitus E10-E14 91 2.3 20.9 15.0
8 Septicemia A40-A41 88 2.2 20.2 13.7
9 Nephritis, nephrotic syndrome and nephrosis N00-N07,N17-N19,N25-N27 78 2.0 17.9 12.0
10 Accidents (unintentional injuries) V01-X59,Y85-Y86 76 1.9 17.5 14.3
. . . All other causes . . . 862 21.9 198.0 139.4
Table 31. Deaths, percentage of total deaths, crude death rate and age-adjusted death rate for the 10 leading causes of death in non-
Hispanic white females, Chicago, 2007
Rank Cause of death ICD-10 code DeathsPercent of
total deathsCrude
death rateAge-adjusted
death rate
. . . All causes . . . 4,067 . . . 921.1 618.1
1 Diseases of heart I00-I09,I11,I13,I20-I51 1,257 30.9 284.7 176.5
2 Malignant neoplasms C00-C97 909 22.4 205.9 154.5
3 Cerebrovascular diseases I60-I69 262 6.4 59.3 36.4
4 Chronic lower respiratory diseases J40-J47 176 4.3 39.9 27.3
5 Infl uenza and pneumonia J09-J18 135 3.3 30.6 17.9
6 Septicemia A40-A41 118 2.9 26.7 18.7
7 Diabetes mellitus E10-E14 106 2.6 24.0 17.3
7 Alzheimer's disease G30 106 2.6 24.0 13.3
9 Nephritis, nephrotic syndrome and nephrosis N00-N07,N17-N19,N25-N27 85 2.1 19.3 12.0
10 Accidents (unintentional injuries) V01-X59,Y85-Y86 76 1.9 17.2 14.1
. . . All other causes . . . 837 20.6 189.6 130.0
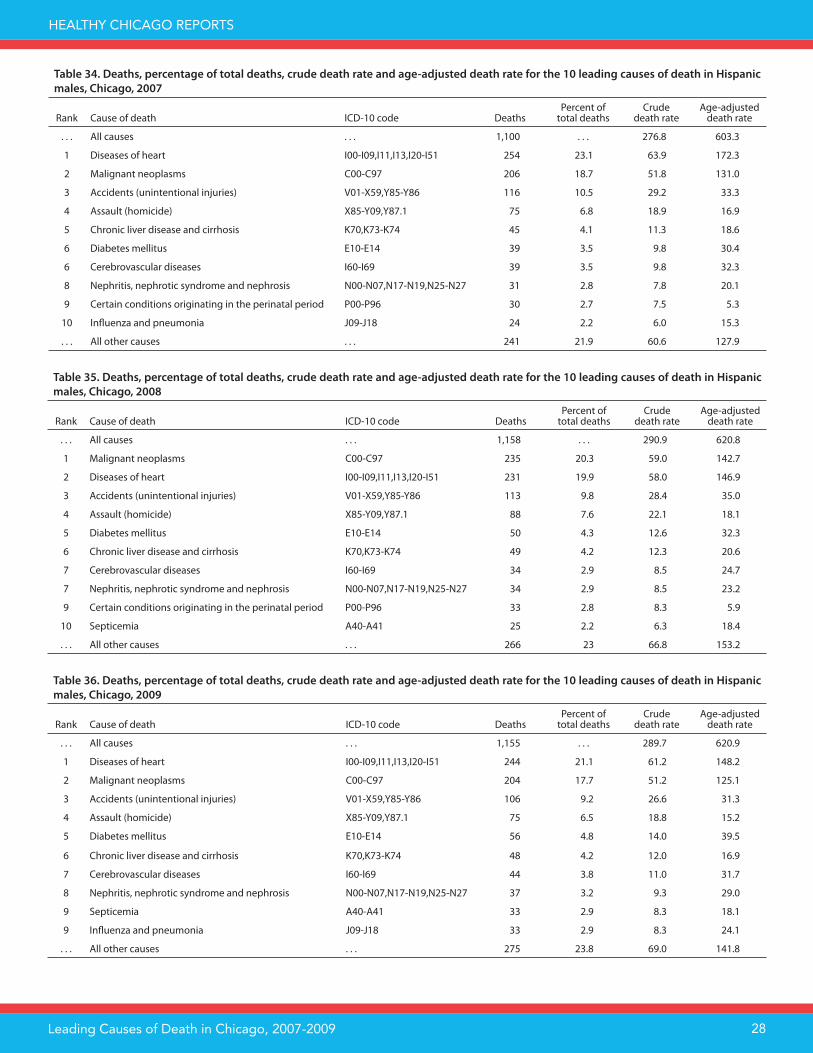
HEALTHY CHICAGO REPORTS
Leading Causes of Death in Chicago, 2007-2009 28
Table 35. Deaths, percentage of total deaths, crude death rate and age-adjusted death rate for the 10 leading causes of death in Hispanic
males, Chicago, 2008
Rank Cause of death ICD-10 code DeathsPercent of
total deathsCrude
death rateAge-adjusted
death rate
. . . All causes . . . 1,158 . . . 290.9 620.8
1 Malignant neoplasms C00-C97 235 20.3 59.0 142.7
2 Diseases of heart I00-I09,I11,I13,I20-I51 231 19.9 58.0 146.9
3 Accidents (unintentional injuries) V01-X59,Y85-Y86 113 9.8 28.4 35.0
4 Assault (homicide) X85-Y09,Y87.1 88 7.6 22.1 18.1
5 Diabetes mellitus E10-E14 50 4.3 12.6 32.3
6 Chronic liver disease and cirrhosis K70,K73-K74 49 4.2 12.3 20.6
7 Cerebrovascular diseases I60-I69 34 2.9 8.5 24.7
7 Nephritis, nephrotic syndrome and nephrosis N00-N07,N17-N19,N25-N27 34 2.9 8.5 23.2
9 Certain conditions originating in the perinatal period P00-P96 33 2.8 8.3 5.9
10 Septicemia A40-A41 25 2.2 6.3 18.4
. . . All other causes . . . 266 23 66.8 153.2
Table 36. Deaths, percentage of total deaths, crude death rate and age-adjusted death rate for the 10 leading causes of death in Hispanic
males, Chicago, 2009
Rank Cause of death ICD-10 code DeathsPercent of
total deathsCrude
death rateAge-adjusted
death rate
. . . All causes . . . 1,155 . . . 289.7 620.9
1 Diseases of heart I00-I09,I11,I13,I20-I51 244 21.1 61.2 148.2
2 Malignant neoplasms C00-C97 204 17.7 51.2 125.1
3 Accidents (unintentional injuries) V01-X59,Y85-Y86 106 9.2 26.6 31.3
4 Assault (homicide) X85-Y09,Y87.1 75 6.5 18.8 15.2
5 Diabetes mellitus E10-E14 56 4.8 14.0 39.5
6 Chronic liver disease and cirrhosis K70,K73-K74 48 4.2 12.0 16.9
7 Cerebrovascular diseases I60-I69 44 3.8 11.0 31.7
8 Nephritis, nephrotic syndrome and nephrosis N00-N07,N17-N19,N25-N27 37 3.2 9.3 29.0
9 Septicemia A40-A41 33 2.9 8.3 18.1
9 Infl uenza and pneumonia J09-J18 33 2.9 8.3 24.1
. . . All other causes . . . 275 23.8 69.0 141.8
Table 34. Deaths, percentage of total deaths, crude death rate and age-adjusted death rate for the 10 leading causes of death in Hispanic
males, Chicago, 2007
Rank Cause of death ICD-10 code DeathsPercent of
total deathsCrude
death rateAge-adjusted
death rate
. . . All causes . . . 1,100 . . . 276.8 603.3
1 Diseases of heart I00-I09,I11,I13,I20-I51 254 23.1 63.9 172.3
2 Malignant neoplasms C00-C97 206 18.7 51.8 131.0
3 Accidents (unintentional injuries) V01-X59,Y85-Y86 116 10.5 29.2 33.3
4 Assault (homicide) X85-Y09,Y87.1 75 6.8 18.9 16.9
5 Chronic liver disease and cirrhosis K70,K73-K74 45 4.1 11.3 18.6
6 Diabetes mellitus E10-E14 39 3.5 9.8 30.4
6 Cerebrovascular diseases I60-I69 39 3.5 9.8 32.3
8 Nephritis, nephrotic syndrome and nephrosis N00-N07,N17-N19,N25-N27 31 2.8 7.8 20.1
9 Certain conditions originating in the perinatal period P00-P96 30 2.7 7.5 5.3
10 Infl uenza and pneumonia J09-J18 24 2.2 6.0 15.3
. . . All other causes . . . 241 21.9 60.6 127.9

HEALTHY CHICAGO REPORTS
Leading Causes of Death in Chicago, 2007-2009 29
Table 38. Deaths, percentage of total deaths, crude death rate and age-adjusted death rate for the 5 leading causes of death in non-
Hispanic Asian/Pacifi c Islander males, Chicago, 2008
Rank Cause of death ICD-10 code DeathsPercent of
total deathsCrude
death rateAge-adjusted
death rate
. . . All causes . . . 257 . . . 377.7 541.0
1 Malignant neoplasms C00-C97 66 25.7 97.0 130.3
2 Diseases of heart I00-I09,I11,I13,I20-I51 64 24.9 94.0 132.9
3 Cerebrovascular diseases I60-I69 17 6.6 25.0 40.1
3 Accidents (unintentional injuries) V01-X59,Y85-Y86 17 6.6 25.0 30.8
5 Chronic lower respiratory diseases J40-J47 16 6.2 23.5 38.4
. . . All other causes . . . 77 30.0 113.2 168.5
Table 39. Deaths, percentage of total deaths, crude death rate and age-adjusted death rate for the 5 leading causes of death in non-Hispanic
Asian/Pacifi c Islander males, Chicago, 2009
Rank Cause of death ICD-10 code DeathsPercent of
total deathsCrude
death rateAge-adjusted
death rate
. . . All causes . . . 259 . . . 376.1 541.0
1 Malignant neoplasms C00-C97 69 26.6 100.2 138.1
2 Diseases of heart I00-I09,I11,I13,I20-I51 58 22.4 84.2 120.6
3 Cerebrovascular diseases I60-I69 16 6.2 23.2 34.8
4 Chronic lower respiratory diseases J40-J47 14 5.4 20.3 32.2
5 Accidents (unintentional injuries) V01-X59,Y85-Y86 13 5.0 18.9 24.5
. . . All other causes . . . 89 34.4 129.2 190.7
Table 37. Deaths, percentage of total deaths, crude death rate and age-adjusted death rate for the 5 leading causes of death in non-Hispanic
Asian/Pacifi c Islander males, Chicago, 2007
Rank Cause of death ICD-10 code DeathsPercent of
total deathsCrude
death rateAge-adjusted
death rate
. . . All causes . . . 226 . . . 336.2 504.6
1 Malignant neoplasms C00-C97 59 26.1 87.8 120.6
2 Diseases of heart I00-I09,I11,I13,I20-I51 47 20.8 69.9 109.8
3 Cerebrovascular diseases I60-I69 19 8.4 28.3 45.0
4 Diabetes mellitus E10-E14 12 5.3 17.8 26.9
4 Chronic lower respiratory diseases J40-J47 12 5.3 17.8 30.6
4 Nephritis, nephrotic syndrome and nephrosis N00-N07,N17-N19,N25-N27 12 5.3 17.8 29.4
. . . All other causes . . . 65 28.8 96.7 142.4
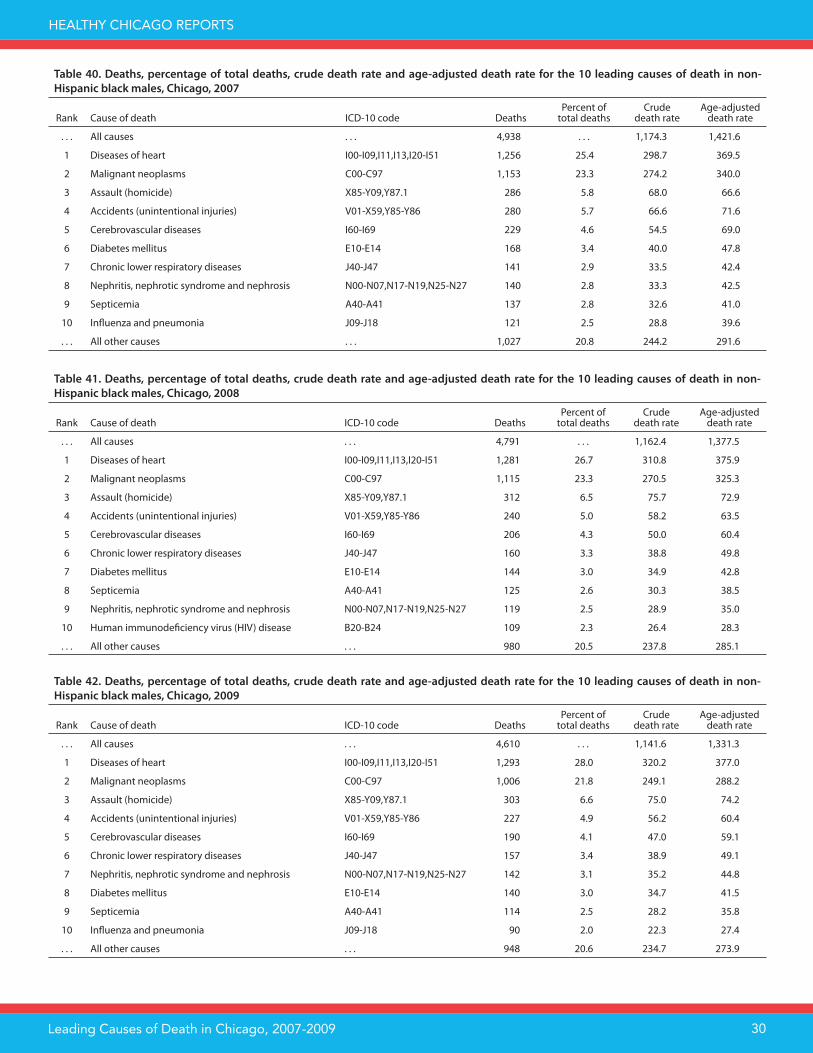
HEALTHY CHICAGO REPORTS
Leading Causes of Death in Chicago, 2007-2009 30
Table 41. Deaths, percentage of total deaths, crude death rate and age-adjusted death rate for the 10 leading causes of death in non-
Hispanic black males, Chicago, 2008
Rank Cause of death ICD-10 code DeathsPercent of
total deathsCrude
death rateAge-adjusted
death rate
. . . All causes . . . 4,791 . . . 1,162.4 1,377.5
1 Diseases of heart I00-I09,I11,I13,I20-I51 1,281 26.7 310.8 375.9
2 Malignant neoplasms C00-C97 1,115 23.3 270.5 325.3
3 Assault (homicide) X85-Y09,Y87.1 312 6.5 75.7 72.9
4 Accidents (unintentional injuries) V01-X59,Y85-Y86 240 5.0 58.2 63.5
5 Cerebrovascular diseases I60-I69 206 4.3 50.0 60.4
6 Chronic lower respiratory diseases J40-J47 160 3.3 38.8 49.8
7 Diabetes mellitus E10-E14 144 3.0 34.9 42.8
8 Septicemia A40-A41 125 2.6 30.3 38.5
9 Nephritis, nephrotic syndrome and nephrosis N00-N07,N17-N19,N25-N27 119 2.5 28.9 35.0
10 Human immunodefi ciency virus (HIV) disease B20-B24 109 2.3 26.4 28.3
. . . All other causes . . . 980 20.5 237.8 285.1
Table 42. Deaths, percentage of total deaths, crude death rate and age-adjusted death rate for the 10 leading causes of death in non-
Hispanic black males, Chicago, 2009
Rank Cause of death ICD-10 code DeathsPercent of
total deathsCrude
death rateAge-adjusted
death rate
. . . All causes . . . 4,610 . . . 1,141.6 1,331.3
1 Diseases of heart I00-I09,I11,I13,I20-I51 1,293 28.0 320.2 377.0
2 Malignant neoplasms C00-C97 1,006 21.8 249.1 288.2
3 Assault (homicide) X85-Y09,Y87.1 303 6.6 75.0 74.2
4 Accidents (unintentional injuries) V01-X59,Y85-Y86 227 4.9 56.2 60.4
5 Cerebrovascular diseases I60-I69 190 4.1 47.0 59.1
6 Chronic lower respiratory diseases J40-J47 157 3.4 38.9 49.1
7 Nephritis, nephrotic syndrome and nephrosis N00-N07,N17-N19,N25-N27 142 3.1 35.2 44.8
8 Diabetes mellitus E10-E14 140 3.0 34.7 41.5
9 Septicemia A40-A41 114 2.5 28.2 35.8
10 Infl uenza and pneumonia J09-J18 90 2.0 22.3 27.4
. . . All other causes . . . 948 20.6 234.7 273.9
Table 40. Deaths, percentage of total deaths, crude death rate and age-adjusted death rate for the 10 leading causes of death in non-
Hispanic black males, Chicago, 2007
Rank Cause of death ICD-10 code DeathsPercent of
total deathsCrude
death rateAge-adjusted
death rate
. . . All causes . . . 4,938 . . . 1,174.3 1,421.6
1 Diseases of heart I00-I09,I11,I13,I20-I51 1,256 25.4 298.7 369.5
2 Malignant neoplasms C00-C97 1,153 23.3 274.2 340.0
3 Assault (homicide) X85-Y09,Y87.1 286 5.8 68.0 66.6
4 Accidents (unintentional injuries) V01-X59,Y85-Y86 280 5.7 66.6 71.6
5 Cerebrovascular diseases I60-I69 229 4.6 54.5 69.0
6 Diabetes mellitus E10-E14 168 3.4 40.0 47.8
7 Chronic lower respiratory diseases J40-J47 141 2.9 33.5 42.4
8 Nephritis, nephrotic syndrome and nephrosis N00-N07,N17-N19,N25-N27 140 2.8 33.3 42.5
9 Septicemia A40-A41 137 2.8 32.6 41.0
10 Infl uenza and pneumonia J09-J18 121 2.5 28.8 39.6
. . . All other causes . . . 1,027 20.8 244.2 291.6

HEALTHY CHICAGO REPORTS
Leading Causes of Death in Chicago, 2007-2009 31
Table 44. Deaths, percentage of total deaths, crude death rate and age-adjusted death rate for the 10 leading causes of death in non-
Hispanic white males, Chicago, 2008
Rank Cause of death ICD-10 code DeathsPercent of
total deathsCrude
death rateAge-adjusted
death rate
. . . All causes . . . 3,931 . . . 921.1 972.9
1 Diseases of heart I00-I09,I11,I13,I20-I51 1,239 31.5 290.3 307.8
2 Malignant neoplasms C00-C97 912 23.2 213.7 225.9
3 Accidents (unintentional injuries) V01-X59,Y85-Y86 174 4.4 40.8 39.0
4 Chronic lower respiratory diseases J40-J47 148 3.8 34.7 38.5
5 Cerebrovascular diseases I60-I69 144 3.7 33.7 36.8
6 Infl uenza and pneumonia J09-J18 135 3.4 31.6 34.3
7 Diabetes mellitus E10-E14 102 2.6 23.9 25.4
8 Septicemia A40-A41 100 2.5 23.4 25.1
9 Nephritis, nephrotic syndrome and nephrosis N00-N07,N17-N19,N25-N27 95 2.4 22.3 24.1
9 Intentional self-harm (suicide) X60-X84,Y87.0 95 2.4 22.3 20.3
. . . All other causes . . . 787 20.0 184.4 195.7
Table 45. Deaths, percentage of total deaths, crude death rate and age-adjusted death rate for the 10 leading causes of death in non-
Hispanic white males, Chicago, 2009
Rank Cause of death ICD-10 code DeathsPercent of
total deathsCrude
death rateAge-adjusted
death rate
. . . All causes . . . 3,665 . . . 863.1 918.3
1 Diseases of heart I00-I09,I11,I13,I20-I51 1,133 30.9 266.8 283.3
2 Malignant neoplasms C00-C97 891 24.3 209.8 222.2
3 Accidents (unintentional injuries) V01-X59,Y85-Y86 180 4.9 42.4 40.9
4 Cerebrovascular diseases I60-I69 149 4.1 35.1 39.1
5 Chronic lower respiratory diseases J40-J47 141 3.8 33.2 36.2
6 Infl uenza and pneumonia J09-J18 114 3.1 26.8 29.7
7 Nephritis, nephrotic syndrome and nephrosis N00-N07,N17-N19,N25-N27 88 2.4 20.7 22.8
8 Diabetes mellitus E10-E14 86 2.3 20.3 21.4
9 Septicemia A40-A41 84 2.3 19.8 21.0
10 Intentional self-harm (suicide) X60-X84,Y87.0 82 2.2 19.3 18.0
. . . All other causes . . . 717 19.6 168.9 183.7
Table 43. Deaths, percentage of total deaths, crude death rate and age-adjusted death rate for the 10 leading causes of death in non-
Hispanic white males, Chicago, 2007
Rank Cause of death ICD-10 code DeathsPercent of
total deathsCrude
death rateAge-adjusted
death rate
. . . All causes . . . 3,797 . . . 885.3 932.7
1 Diseases of heart I00-I09,I11,I13,I20-I51 1,244 32.8 290.0 306.7
2 Malignant neoplasms C00-C97 832 21.9 194.0 203.5
3 Accidents (unintentional injuries) V01-X59,Y85-Y86 187 4.9 43.6 40.8
4 Cerebrovascular diseases I60-I69 170 4.5 39.6 43.0
5 Chronic lower respiratory diseases J40-J47 142 3.7 33.1 35.5
6 Infl uenza and pneumonia J09-J18 123 3.2 28.7 30.8
7 Diabetes mellitus E10-E14 101 2.7 23.5 24.6
8 Septicemia A40-A41 93 2.4 21.7 23.4
9 Nephritis, nephrotic syndrome and nephrosis N00-N07,N17-N19,N25-N27 90 2.4 21.0 22.8
10 Intentional self-harm (suicide) X60-X84,Y87.0 77 2.0 18.0 17.1
. . . All other causes . . . 738 19.4 172.1 184.5
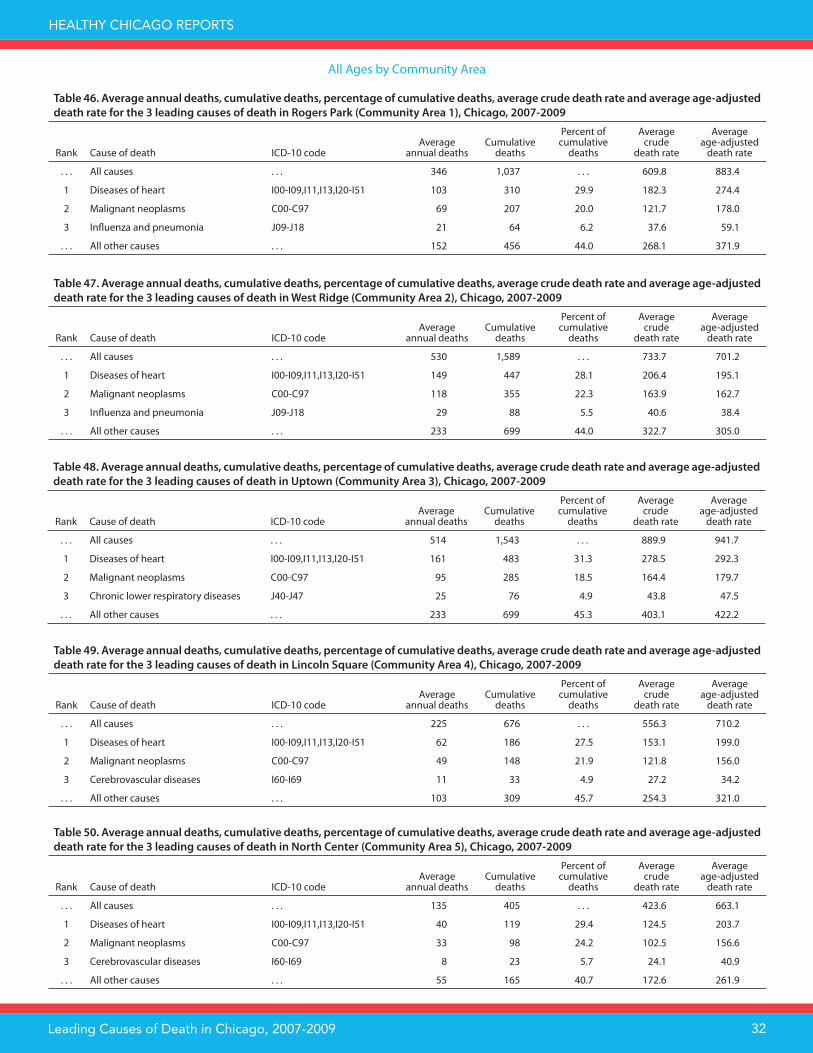
HEALTHY CHICAGO REPORTS
Leading Causes of Death in Chicago, 2007-2009 32
Table 48. Average annual deaths, cumulative deaths, percentage of cumulative deaths, average crude death rate and average age-adjusted
death rate for the 3 leading causes of death in Uptown (Community Area 3), Chicago, 2007-2009
Rank Cause of death ICD-10 codeAverage
annual deathsCumulative
deaths
Percent of cumulative
deaths
Averagecrude
death rate
Average age-adjusted
death rate
. . . All causes . . . 514 1,543 . . . 889.9 941.7
1 Diseases of heart I00-I09,I11,I13,I20-I51 161 483 31.3 278.5 292.3
2 Malignant neoplasms C00-C97 95 285 18.5 164.4 179.7
3 Chronic lower respiratory diseases J40-J47 25 76 4.9 43.8 47.5
. . . All other causes . . . 233 699 45.3 403.1 422.2
Table 49. Average annual deaths, cumulative deaths, percentage of cumulative deaths, average crude death rate and average age-adjusted
death rate for the 3 leading causes of death in Lincoln Square (Community Area 4), Chicago, 2007-2009
Rank Cause of death ICD-10 codeAverage
annual deathsCumulative
deaths
Percent of cumulative
deaths
Averagecrude
death rate
Average age-adjusted
death rate
. . . All causes . . . 225 676 . . . 556.3 710.2
1 Diseases of heart I00-I09,I11,I13,I20-I51 62 186 27.5 153.1 199.0
2 Malignant neoplasms C00-C97 49 148 21.9 121.8 156.0
3 Cerebrovascular diseases I60-I69 11 33 4.9 27.2 34.2
. . . All other causes . . . 103 309 45.7 254.3 321.0
Table 47. Average annual deaths, cumulative deaths, percentage of cumulative deaths, average crude death rate and average age-adjusted
death rate for the 3 leading causes of death in West Ridge (Community Area 2), Chicago, 2007-2009
Rank Cause of death ICD-10 codeAverage
annual deathsCumulative
deaths
Percent of cumulative
deaths
Averagecrude
death rate
Average age-adjusted
death rate
. . . All causes . . . 530 1,589 . . . 733.7 701.2
1 Diseases of heart I00-I09,I11,I13,I20-I51 149 447 28.1 206.4 195.1
2 Malignant neoplasms C00-C97 118 355 22.3 163.9 162.7
3 Infl uenza and pneumonia J09-J18 29 88 5.5 40.6 38.4
. . . All other causes . . . 233 699 44.0 322.7 305.0
Table 46. Average annual deaths, cumulative deaths, percentage of cumulative deaths, average crude death rate and average age-adjusted
death rate for the 3 leading causes of death in Rogers Park (Community Area 1), Chicago, 2007-2009
Rank Cause of death ICD-10 codeAverage
annual deathsCumulative
deaths
Percent of cumulative
deaths
Averagecrude
death rate
Average age-adjusted
death rate
. . . All causes . . . 346 1,037 . . . 609.8 883.4
1 Diseases of heart I00-I09,I11,I13,I20-I51 103 310 29.9 182.3 274.4
2 Malignant neoplasms C00-C97 69 207 20.0 121.7 178.0
3 Infl uenza and pneumonia J09-J18 21 64 6.2 37.6 59.1
. . . All other causes . . . 152 456 44.0 268.1 371.9
Table 50. Average annual deaths, cumulative deaths, percentage of cumulative deaths, average crude death rate and average age-adjusted
death rate for the 3 leading causes of death in North Center (Community Area 5), Chicago, 2007-2009
Rank Cause of death ICD-10 codeAverage
annual deathsCumulative
deaths
Percent of cumulative
deaths
Averagecrude
death rate
Average age-adjusted
death rate
. . . All causes . . . 135 405 . . . 423.6 663.1
1 Diseases of heart I00-I09,I11,I13,I20-I51 40 119 29.4 124.5 203.7
2 Malignant neoplasms C00-C97 33 98 24.2 102.5 156.6
3 Cerebrovascular diseases I60-I69 8 23 5.7 24.1 40.9
. . . All other causes . . . 55 165 40.7 172.6 261.9
All Ages by Community Area

HEALTHY CHICAGO REPORTS
Leading Causes of Death in Chicago, 2007-2009 33
Table 52. Average annual deaths, cumulative deaths, percentage of cumulative deaths, average crude death rate and average age-adjusted
death rate for the 3 leading causes of death in Lincoln Park (Community Area 7), Chicago, 2007-2009
Rank Cause of death ICD-10 codeAverage
annual deathsCumulative
deaths
Percent of cumulative
deaths
Averagecrude
death rate
Average age-adjusted
death rate
. . . All causes . . . 280 840 . . . 436.4 684.7
1 Diseases of heart I00-I09,I11,I13,I20-I51 78 234 27.9 121.6 188.3
2 Malignant neoplasms C00-C97 59 178 21.2 92.5 148.9
3 Cerebrovascular diseases I60-I69 13 39 4.6 20.3 34.5
. . . All other causes . . . 130 389 46.3 202.1 313.0
Table 51. Average annual deaths, cumulative deaths, percentage of cumulative deaths, average crude death rate and average age-adjusted
death rate for the 3 leading causes of death in Lake View (Community Area 6), Chicago, 2007-2009
Rank Cause of death ICD-10 codeAverage
annual deathsCumulative
deaths
Percent of cumulative
deaths
Averagecrude
death rate
Average age-adjusted
death rate
. . . All causes . . . 377 1,130 . . . 398.8 586.9
1 Diseases of heart I00-I09,I11,I13,I20-I51 108 323 28.6 114.0 171.8
2 Malignant neoplasms C00-C97 77 232 20.5 81.9 128.2
3 Accidents (unintentional injuries) V01-X59,Y85-Y86 19 56 5.0 19.8 23.5
. . . All other causes . . . 173 519 45.9 183.2 263.4
Table 53. Average annual deaths, cumulative deaths, percentage of cumulative deaths, average crude death rate and average age-adjusted
death rate for the 3 leading causes of death in Near North Side (Community Area 8), Chicago, 2007-2009
Rank Cause of death ICD-10 codeAverage
annual deathsCumulative
deaths
Percent of cumulative
deaths
Averagecrude
death rate
Average age-adjusted
death rate
. . . All causes . . . 410 1,230 . . . 519.3 520.3
1 Malignant neoplasms C00-C97 111 332 27.0 140.2 137.5
2 Diseases of heart I00-I09,I11,I13,I20-I51 107 320 26.0 135.1 132.2
3 Cerebrovascular diseases I60-I69 16 49 4.0 20.7 21.2
. . . All other causes . . . 176 529 43.0 223.3 229.4
Table 54. Average annual deaths, cumulative deaths, percentage of cumulative deaths, average crude death rate and average age-adjusted
death rate for the 3 leading causes of death in Edison Park (Community Area 9), Chicago, 2007-2009
Rank Cause of death ICD-10 codeAverage
annual deathsCumulative
deaths
Percent of cumulative
deaths
Averagecrude
death rate
Average age-adjusted
death rate
. . . All causes . . . 103 309 . . . 919.5 645.4
1 Malignant neoplasms C00-C97 30 91 29.4 270.8 203.2
2 Diseases of heart I00-I09,I11,I13,I20-I51 26 78 25.2 232.1 151.7
3 Cerebrovascular diseases I60-I69 7 20 6.5 59.5 39.6
. . . All other causes . . . 40 120 38.8 357.1 250.8
Table 55. Average annual deaths, cumulative deaths, percentage of cumulative deaths, average crude death rate and average age-adjusted
death rate for the 3 leading causes of death in Norwood Park (Community Area 10), Chicago, 2007-2009
Rank Cause of death ICD-10 codeAverage
annual deathsCumulative
deaths
Percent of cumulative
deaths
Averagecrude
death rate
Average age-adjusted
death rate
. . . All causes . . . 484 1,452 . . . 1,302.7 718.6
1 Diseases of heart I00-I09,I11,I13,I20-I51 156 469 32.3 420.8 211.8
2 Malignant neoplasms C00-C97 108 325 22.4 291.6 183.5
3 Cerebrovascular diseases I60-I69 32 97 6.7 87.0 42.7
. . . All other causes . . . 187 561 38.6 503.3 280.6

HEALTHY CHICAGO REPORTS
Leading Causes of Death in Chicago, 2007-2009 34
Table 56. Average annual deaths, cumulative deaths, percentage of cumulative deaths, average crude death rate and average age-adjusted
death rate for the 3 leading causes of death in Jeff erson Park (Community Area 11), Chicago, 2007-2009
Rank Cause of death ICD-10 codeAverage
annual deathsCumulative
deaths
Percent of cumulative
deaths
Averagecrude
death rate
Average age-adjusted
death rate
. . . All causes . . . 247 740 . . . 966.2 762.3
1 Diseases of heart I00-I09,I11,I13,I20-I51 74 221 29.9 288.5 220.1
2 Malignant neoplasms C00-C97 68 205 27.7 267.7 214.6
3 Cerebrovascular diseases I60-I69 16 47 6.4 61.4 45.7
. . . All other causes . . . 89 267 36.1 348.6 281.9
Table 57. Average annual deaths, cumulative deaths, percentage of cumulative deaths, average crude death rate and average age-adjusted
death rate for the 3 leading causes of death in Forest Glen (Community Area 12), Chicago, 2007-2009
Rank Cause of death ICD-10 codeAverage
annual deathsCumulative
deaths
Percent of cumulative
deaths
Averagecrude
death rate
Average age-adjusted
death rate
. . . All causes . . . 140 420 . . . 759.2 552.3
1 Diseases of heart I00-I09,I11,I13,I20-I51 37 110 26.2 198.9 139.2
2 Malignant neoplasms C00-C97 33 99 23.6 179.0 131.3
3 Cerebrovascular diseases I60-I69 8 23 5.5 41.6 29.1
. . . All other causes . . . 63 188 44.8 339.9 252.7
Table 58. Average annual deaths, cumulative deaths, percentage of cumulative deaths, average crude death rate and average age-adjusted
death rate for the 3 leading causes of death in North Park (Community Area 13), Chicago, 2007-2009
Rank Cause of death ICD-10 codeAverage
annual deathsCumulative
deaths
Percent of cumulative
deaths
Averagecrude
death rate
Average age-adjusted
death rate
. . . All causes . . . 143 429 . . . 792.3 566.5
1 Diseases of heart I00-I09,I11,I13,I20-I51 44 131 30.5 242.0 168.5
2 Malignant neoplasms C00-C97 31 92 21.4 169.9 127.1
3 Infl uenza and pneumonia J09-J18 7 21 4.9 38.8 24.1
. . . All other causes . . . 62 185 43.1 341.7 246.8
Table 59. Average annual deaths, cumulative deaths, percentage of cumulative deaths, average crude death rate and average age-adjusted
death rate for the 3 leading causes of death in Albany Park (Community Area 14), Chicago, 2007-2009
Rank Cause of death ICD-10 codeAverage
annual deathsCumulative
deaths
Percent of cumulative
deaths
Averagecrude
death rate
Average age-adjusted
death rate
. . . All causes . . . 248 744 . . . 470.0 676.1
1 Diseases of heart I00-I09,I11,I13,I20-I51 63 189 25.4 119.4 178.8
2 Malignant neoplasms C00-C97 59 176 23.7 111.2 159.9
3 Cerebrovascular diseases I60-I69 13 38 5.1 24.0 35.8
. . . All other causes . . . 114 341 45.8 215.4 301.6
Table 60. Average annual deaths, cumulative deaths, percentage of cumulative deaths, average crude death rate and average age-adjusted
death rate for the 3 leading causes of death in Portage Park (Community Area 15), Chicago, 2007-2009
Rank Cause of death ICD-10 codeAverage
annual deathsCumulative
deaths
Percent of cumulative
deaths
Averagecrude
death rate
Average age-adjusted
death rate
. . . All causes . . . 428 1,284 . . . 664.9 671.1
1 Diseases of heart I00-I09,I11,I13,I20-I51 140 419 32.6 217.0 218.1
2 Malignant neoplasms C00-C97 103 308 24.0 159.5 161.9
3 Cerebrovascular diseases I60-I69 23 70 5.5 36.3 36.7
. . . All other causes . . . 162 487 37.9 252.2 254.3

HEALTHY CHICAGO REPORTS
Leading Causes of Death in Chicago, 2007-2009 35
Table 61. Average annual deaths, cumulative deaths, percentage of cumulative deaths, average crude death rate and average age-adjusted
death rate for the 3 leading causes of death in Irving Park (Community Area 16), Chicago, 2007-2009
Rank Cause of death ICD-10 codeAverage
annual deathsCumulative
deaths
Percent of cumulative
deaths
Averagecrude
death rate
Average age-adjusted
death rate
. . . All causes . . . 311 934 . . . 572.1 750.1
1 Diseases of heart I00-I09,I11,I13,I20-I51 87 261 27.9 159.9 214.1
2 Malignant neoplasms C00-C97 68 203 21.7 124.4 160.0
3 Cerebrovascular diseases I60-I69 16 48 5.1 29.4 41.2
. . . All other causes . . . 141 422 45.2 258.5 334.9
Table 62. Average annual deaths, cumulative deaths, percentage of cumulative deaths, average crude death rate and average age-adjusted
death rate for the 3 leading causes of death in Dunning (Community Area 17), Chicago, 2007-2009
Rank Cause of death ICD-10 codeAverage
annual deathsCumulative
deaths
Percent of cumulative
deaths
Averagecrude
death rate
Average age-adjusted
death rate
. . . All causes . . . 359 1,078 . . . 856.0 664.5
1 Diseases of heart I00-I09,I11,I13,I20-I51 104 313 29.0 248.5 185.9
2 Malignant neoplasms C00-C97 100 299 27.7 237.4 186.2
3 Cerebrovascular diseases I60-I69 16 49 4.5 38.9 28.6
. . . All other causes . . . 139 417 38.7 331.1 263.8
Table 63. Average annual deaths, cumulative deaths, percentage of cumulative deaths, average crude death rate and average age-adjusted
death rate for the 3 leading causes of death in Montclaire (Community Area 18), Chicago, 2007-2009
Rank Cause of death ICD-10 codeAverage
annual deathsCumulative
deaths
Percent of cumulative
deaths
Averagecrude
death rate
Average age-adjusted
death rate
. . . All causes . . . 113 338 . . . 849.0 732.9
1 Diseases of heart I00-I09,I11,I13,I20-I51 36 107 31.7 268.8 223.7
2 Malignant neoplasms C00-C97 21 62 18.3 155.7 141.6
3 Chronic lower respiratory diseases J40-J47 6 18 5.3 45.2 37.4
. . . All other causes . . . 50 151 44.7 379.3 330.2
Table 64. Average annual deaths, cumulative deaths, percentage of cumulative deaths, average crude death rate and average age-adjusted
death rate for the 3 leading causes of death in Belmont Cragin (Community Area 19), Chicago, 2007-2009
Rank Cause of death ICD-10 codeAverage
annual deathsCumulative
deaths
Percent of cumulative
deaths
Averagecrude
death rate
Average age-adjusted
death rate
. . . All causes . . . 367 1,101 . . . 466.8 689.4
1 Diseases of heart I00-I09,I11,I13,I20-I51 115 346 31.4 146.7 224.9
2 Malignant neoplasms C00-C97 78 234 21.3 99.2 148.3
3 Accidents (unintentional injuries) V01-X59,Y85-Y86 19 57 5.2 24.2 28.1
. . . All other causes . . . 155 464 42.1 196.7 288.1
Table 65. Average annual deaths, cumulative deaths, percentage of cumulative deaths, average crude death rate and average age-adjusted
death rate for the 3 leading causes of death in Hermosa (Community Area 20), Chicago, 2007-2009
Rank Cause of death ICD-10 codeAverage
annual deathsCumulative
deaths
Percent of cumulative
deaths
Averagecrude
death rate
Average age-adjusted
death rate
. . . All causes . . . 100 301 . . . 395.2 694.0
1 Diseases of heart I00-I09,I11,I13,I20-I51 29 87 28.9 114.2 219.1
2 Malignant neoplasms C00-C97 19 56 18.6 73.5 130.3
3 Accidents (unintentional injuries) V01-X59,Y85-Y86 6 18 6.0 23.6 25.3
. . . All other causes . . . 47 140 46.5 183.8 319.3

HEALTHY CHICAGO REPORTS
Leading Causes of Death in Chicago, 2007-2009 36
Table 66. Average annual deaths, cumulative deaths, percentage of cumulative deaths, average crude death rate and average age-adjusted
death rate for the 3 leading causes of death in Avondale (Community Area 21), Chicago, 2007-2009
Rank Cause of death ICD-10 codeAverage
annual deathsCumulative
deaths
Percent of cumulative
deaths
Averagecrude
death rate
Average age-adjusted
death rate
. . . All causes . . . 195 584 . . . 486.4 745.5
1 Diseases of heart I00-I09,I11,I13,I20-I51 56 168 28.8 139.9 224.5
2 Malignant neoplasms C00-C97 39 118 20.2 98.3 156.7
3 Accidents (unintentional injuries) V01-X59,Y85-Y86 11 34 5.8 28.3 27.9
. . . All other causes . . . 88 264 45.2 219.9 336.4
Table 67. Average annual deaths, cumulative deaths, percentage of cumulative deaths, average crude death rate and average age-adjusted
death rate for the 3 leading causes of death in Logan Square (Community Area 22), Chicago, 2007-2009
Rank Cause of death ICD-10 codeAverage
annual deathsCumulative
deaths
Percent of cumulative
deaths
Averagecrude
death rate
Average age-adjusted
death rate
. . . All causes . . . 292 876 . . . 390.5 715.2
1 Diseases of heart I00-I09,I11,I13,I20-I51 81 244 27.9 108.8 218.7
2 Malignant neoplasms C00-C97 58 175 20.0 78.0 138.9
3 Accidents (unintentional injuries) V01-X59,Y85-Y86 17 51 5.8 22.7 26.3
. . . All other causes . . . 135 406 46.3 181 331.3
Table 68. Average annual deaths, cumulative deaths, percentage of cumulative deaths, average crude death rate and average age-adjusted
death rate for the 3 leading causes of death in Humboldt Park (Community Area 23), Chicago, 2007-2009
Rank Cause of death ICD-10 codeAverage
annual deathsCumulative
deaths
Percent of cumulative
deaths
Averagecrude
death rate
Average age-adjusted
death rate
. . . All causes . . . 357 1,071 . . . 613.1 936.8
1 Diseases of heart I00-I09,I11,I13,I20-I51 90 269 25.1 154.0 244.2
2 Malignant neoplasms C00-C97 71 214 20.0 122.5 191.7
3 Accidents (unintentional injuries) V01-X59,Y85-Y86 26 79 7.4 45.2 53.6
. . . All other causes . . . 170 509 47.5 291.4 447.3
Table 69. Average annual deaths, cumulative deaths, percentage of cumulative deaths, average crude death rate and average age-adjusted
death rate for the 3 leading causes of death in West Town (Community Area 24), Chicago, 2007-2009
Rank Cause of death ICD-10 codeAverage
annual deathsCumulative
deaths
Percent of cumulative
deaths
Averagecrude
death rate
Average age-adjusted
death rate
. . . All causes . . . 368 1,103 . . . 441.5 756.0
1 Diseases of heart I00-I09,I11,I13,I20-I51 106 318 28.8 127.3 229.9
2 Malignant neoplasms C00-C97 63 189 17.1 75.7 132.8
3 Diabetes mellitus E10-E14 20 61 5.5 24.4 46.2
. . . All other causes . . . 178 535 48.5 214.1 347.0
Table 70. Average annual deaths, cumulative deaths, percentage of cumulative deaths, average crude death rate and average age-adjusted
death rate for the 3 leading causes of death in Austin (Community Area 25), Chicago, 2007-2009
Rank Cause of death ICD-10 codeAverage
annual deathsCumulative
deaths
Percent of cumulative
deaths
Averagecrude
death rate
Average age-adjusted
death rate
. . . All causes . . . 930 2,790 . . . 908.9 1,074.1
1 Malignant neoplasms C00-C97 232 695 24.9 226.4 254.6
1 Diseases of heart I00-I09,I11,I13,I20-I51 232 695 24.9 226.4 277.8
3 Cerebrovascular diseases I60-I69 47 140 5.0 45.6 57.6
. . . All other causes . . . 420 1,260 45.2 410.5 484.1

HEALTHY CHICAGO REPORTS
Leading Causes of Death in Chicago, 2007-2009 37
Table 71. Average annual deaths, cumulative deaths, percentage of cumulative deaths, average crude death rate and average age-adjusted
death rate for the 3 leading causes of death in West Garfi eld (Community Area 26), Chicago, 2007-2009
Rank Cause of death ICD-10 codeAverage
annual deathsCumulative
deaths
Percent of cumulative
deaths
Averagecrude
death rate
Average age-adjusted
death rate
. . . All causes . . . 207 622 . . . 1,091.0 1,309.8
1 Diseases of heart I00-I09,I11,I13,I20-I51 57 170 27.3 298.2 360.5
2 Malignant neoplasms C00-C97 42 126 20.3 221.0 265.5
3 Accidents (unintentional injuries) V01-X59,Y85-Y86 13 40 6.4 70.2 75.5
. . . All other causes . . . 95 286 46.0 501.6 608.3
Table 72. Average annual deaths, cumulative deaths, percentage of cumulative deaths, average crude death rate and average age-adjusted
death rate for the 3 leading causes of death in East Garfi eld Park (Community Area 27), Chicago, 2007-2009
Rank Cause of death ICD-10 codeAverage
annual deathsCumulative
deaths
Percent of cumulative
deaths
Averagecrude
death rate
Average age-adjusted
death rate
. . . All causes . . . 192 577 . . . 932.3 1,125.9
1 Diseases of heart I00-I09,I11,I13,I20-I51 52 155 26.9 250.4 311.9
2 Malignant neoplasms C00-C97 38 115 19.9 185.8 226.2
3 Accidents (unintentional injuries) V01-X59,Y85-Y86 11 33 5.7 53.3 57.2
. . . All other causes . . . 91 274 47.5 442.7 530.7
Table 73. Average annual deaths, cumulative deaths, percentage of cumulative deaths, average crude death rate and average age-adjusted
death rate for the 3 leading causes of death in Near West Side (Community Area 28), Chicago, 2007-2009
Rank Cause of death ICD-10 codeAverage
annual deathsCumulative
deaths
Percent of cumulative
deaths
Averagecrude
death rate
Average age-adjusted
death rate
. . . All causes . . . 253 758 . . . 475.0 784.6
1 Diseases of heart I00-I09,I11,I13,I20-I51 66 197 26.0 123.5 215.4
2 Malignant neoplasms C00-C97 65 194 25.6 121.6 205.8
3 Cerebrovascular diseases I60-I69 13 38 5.0 23.8 42.5
3 Accidents (unintentional injuries) V01-X59,Y85-Y86 13 38 5.0 23.8 28.9
. . . All other causes . . . 97 291 38.4 182.4 291.9
Table 74. Average annual deaths, cumulative deaths, percentage of cumulative deaths, average crude death rate and average age-adjusted
death rate for the 3 leading causes of death in North Lawndale (Community Area 29), Chicago, 2007-2009
Rank Cause of death ICD-10 codeAverage
annual deathsCumulative
deaths
Percent of cumulative
deaths
Averagecrude
death rate
Average age-adjusted
death rate
. . . All causes . . . 314 941 . . . 845.8 1,044.3
1 Malignant neoplasms C00-C97 78 234 24.9 210.3 264.6
2 Diseases of heart I00-I09,I11,I13,I20-I51 70 210 22.3 188.8 244.3
3 Cerebrovascular diseases I60-I69 20 60 6.4 53.9 70.7
. . . All other causes . . . 146 437 46.4 392.8 464.6
Table 75. Average annual deaths, cumulative deaths, percentage of cumulative deaths, average crude death rate and average age-adjusted
death rate for the 3 leading causes of death in South Lawndale (Community Area 30), Chicago, 2007-2009
Rank Cause of death ICD-10 codeAverage
annual deathsCumulative
deaths
Percent of cumulative
deaths
Averagecrude
death rate
Average age-adjusted
death rate
. . . All causes . . . 242 726 . . . 296.4 599.5
1 Malignant neoplasms C00-C97 49 148 20.4 60.4 125.1
2 Diseases of heart I00-I09,I11,I13,I20-I51 49 147 20.2 60.0 141.3
3 Assault (homicide) X85-Y09,Y87.1 14 41 5.6 16.7 13.1
. . . All other causes . . . 130 390 53.7 159.2 320.0

HEALTHY CHICAGO REPORTS
Leading Causes of Death in Chicago, 2007-2009 38
Table 76. Average annual deaths, cumulative deaths, percentage of cumulative deaths, average crude death rate and average age-adjusted
death rate for the 3 leading causes of death in Lower West Side (Community Area 31), Chicago, 2007-2009
Rank Cause of death ICD-10 codeAverage
annual deathsCumulative
deaths
Percent of cumulative
deaths
Averagecrude
death rate
Average age-adjusted
death rate
. . . All causes . . . 149 447 . . . 398.2 649.6
1 Diseases of heart I00-I09,I11,I13,I20-I51 33 100 22.4 89.1 162.1
2 Malignant neoplasms C00-C97 32 95 21.3 84.6 143.6
3 Accidents (unintentional injuries) V01-X59,Y85-Y86 11 33 7.4 29.4 32.9
. . . All other causes . . . 73 219 49.0 195.1 311.0
Table 77. Average annual deaths, cumulative deaths, percentage of cumulative deaths, average crude death rate and average age-adjusted
death rate for the 3 leading causes of death in Loop (Community Area 32), Chicago, 2007-2009
Rank Cause of death ICD-10 codeAverage
annual deathsCumulative
deaths
Percent of cumulative
deaths
Averagecrude
death rate
Average age-adjusted
death rate
. . . All causes . . . 87 262 . . . 327.0 511.2
1 Diseases of heart I00-I09,I11,I13,I20-I51 23 70 26.7 87.4 142.0
2 Malignant neoplasms C00-C97 22 66 25.2 82.4 118.2
3 Chronic lower respiratory diseases J40-J47 5 15 5.7 18.7 34.6
. . . All other causes . . . 37 111 42.4 138.6 216.4
Table 78. Average annual deaths, cumulative deaths, percentage of cumulative deaths, average crude death rate and average age-adjusted
death rate for the 3 leading causes of death in Near South Side (Community Area 33), Chicago, 2007-2009
Rank Cause of death ICD-10 codeAverage
annual deathsCumulative
deaths
Percent of cumulative
deaths
Averagecrude
death rate
Average age-adjusted
death rate
. . . All causes . . . 113 339 . . . 594.3 751.1
1 Diseases of heart I00-I09,I11,I13,I20-I51 30 91 26.8 159.5 203.2
2 Malignant neoplasms C00-C97 23 68 20.1 119.2 143.8
3 Cerebrovascular diseases I60-I69 8 25 7.4 43.8 59.5
. . . All other causes . . . 52 155 45.7 271.7 344.6
Table 79. Average annual deaths, cumulative deaths, percentage of cumulative deaths, average crude death rate and average age-adjusted
death rate for the 3 leading causes of death in Armour Square (Community Area 34), Chicago, 2007-2009
Rank Cause of death ICD-10 codeAverage
annual deathsCumulative
deaths
Percent of cumulative
deaths
Averagecrude
death rate
Average age-adjusted
death rate
. . . All causes . . . 107 321 . . . 815.6 580.0
1 Malignant neoplasms C00-C97 31 94 29.3 238.8 165.0
2 Diseases of heart I00-I09,I11,I13,I20-I51 24 72 22.4 182.9 128.6
3 Cerebrovascular diseases I60-I69 8 23 7.2 58.4 40.3
. . . All other causes . . . 44 132 41.1 335.4 246.1
Table 80. Average annual deaths, cumulative deaths, percentage of cumulative deaths, average crude death rate and average age-adjusted
death rate for the 3 leading causes of death in Douglas (Community Area 35), Chicago, 2007-2009
Rank Cause of death ICD-10 codeAverage
annual deathsCumulative
deaths
Percent of cumulative
deaths
Averagecrude
death rate
Average age-adjusted
death rate
. . . All causes . . . 263 788 . . . 1,321.0 1,148.9
1 Diseases of heart I00-I09,I11,I13,I20-I51 73 220 27.9 368.8 304.5
2 Malignant neoplasms C00-C97 56 169 21.4 283.3 252.5
3 Cerebrovascular diseases I60-I69 16 47 6.0 78.8 65.4
. . . All other causes . . . 117 352 44.7 590.1 526.5

HEALTHY CHICAGO REPORTS
Leading Causes of Death in Chicago, 2007-2009 39
Table 81. Average annual deaths, cumulative deaths, percentage of cumulative deaths, average crude death rate and average age-adjusted
death rate for the 3 leading causes of death in Oakland (Community Area 36), Chicago, 2007-2009
Rank Cause of death ICD-10 codeAverage
annual deathsCumulative
deaths
Percent of cumulative
deaths
Averagecrude
death rate
Average age-adjusted
death rate
. . . All causes . . . 41 123 . . . 688.3 892.3
1 Diseases of heart I00-I09,I11,I13,I20-I51 12 35 28.5 195.9 258.3
2 Malignant neoplasms C00-C97 6 18 14.6 100.7 134.0
3 Cerebrovascular diseases I60-I69 2 7 5.7 39.2 54.6
. . . All other causes . . . 21 63 51.2 352.6 445.4
Table 82. Average annual deaths, cumulative deaths, percentage of cumulative deaths, average crude death rate and average age-adjusted
death rate for the 3 leading causes of death in Fuller Park (Community Area 37), Chicago, 2007-2009
Rank Cause of death ICD-10 codeAverage
annual deathsCumulative
deaths
Percent of cumulative
deaths
Averagecrude
death rate
Average age-adjusted
death rate
. . . All causes . . . 42 126 . . . 1,407.2 1,171.1
1 Diseases of heart I00-I09,I11,I13,I20-I51 13 38 30.2 424.4 340.9
2 Malignant neoplasms C00-C97 8 24 19.0 268.0 210.3
3 Cerebrovascular diseases I60-I69 3 10 7.9 111.7 94.0
. . . All other causes . . . 18 54 42.9 603.1 525.9
Table 83. Average annual deaths, cumulative deaths, percentage of cumulative deaths, average crude death rate and average age-adjusted
death rate for the 3 leading causes of death in Grand Boulevard (Community Area 38), Chicago, 2007-2009
Rank Cause of death ICD-10 codeAverage
annual deathsCumulative
deaths
Percent of cumulative
deaths
Averagecrude
death rate
Average age-adjusted
death rate
. . . All causes . . . 248 745 . . . 1,073.0 1,028.5
1 Diseases of heart I00-I09,I11,I13,I20-I51 74 223 29.9 321.2 303.0
2 Malignant neoplasms C00-C97 52 155 20.8 223.2 216.0
3 Cerebrovascular diseases I60-I69 11 33 4.4 47.5 44.3
. . . All other causes . . . 111 334 44.8 481.0 465.2
Table 84. Average annual deaths, cumulative deaths, percentage of cumulative deaths, average crude death rate and average age-adjusted
death rate for the 3 leading causes of death in Kenwood (Community Area 39), Chicago, 2007-2009
Rank Cause of death ICD-10 codeAverage
annual deathsCumulative
deaths
Percent of cumulative
deaths
Averagecrude
death rate
Average age-adjusted
death rate
. . . All causes . . . 137 410 . . . 761.6 643.9
1 Malignant neoplasms C00-C97 41 123 30.0 228.5 191.4
2 Diseases of heart I00-I09,I11,I13,I20-I51 33 100 24.4 185.7 152.1
3 Cerebrovascular diseases I60-I69 7 21 5.1 39.0 32.1
. . . All other causes . . . 55 166 40.5 308.3 268.2
Table 85. Average annual deaths, cumulative deaths, percentage of cumulative deaths, average crude death rate and average age-adjusted
death rate for the 3 leading causes of death in Washington Park (Community Area 40), Chicago, 2007-2009
Rank Cause of death ICD-10 codeAverage
annual deathsCumulative
deaths
Percent of cumulative
deaths
Averagecrude
death rate
Average age-adjusted
death rate
. . . All causes . . . 110 330 . . . 901.4 1,253.1
1 Diseases of heart I00-I09,I11,I13,I20-I51 29 86 26.1 234.9 345.8
2 Malignant neoplasms C00-C97 24 72 21.8 196.7 288.2
3 Assault (homicide) X85-Y09,Y87.1 7 20 6.1 54.6 49.3
. . . All other causes . . . 51 152 46.1 415.2 569.9

HEALTHY CHICAGO REPORTS
Leading Causes of Death in Chicago, 2007-2009 40
Table 86. Average annual deaths, cumulative deaths, percentage of cumulative deaths, average crude death rate and average age-adjusted
death rate for the 3 leading causes of death in Hyde Park (Community Area 41), Chicago, 2007-2009
Rank Cause of death ICD-10 codeAverage
annual deathsCumulative
deaths
Percent of cumulative
deaths
Averagecrude
death rate
Average age-adjusted
death rate
. . . All causes . . . 161 483 . . . 606.9 607.4
1 Malignant neoplasms C00-C97 44 131 27.1 164.6 165.7
2 Diseases of heart I00-I09,I11,I13,I20-I51 41 123 25.5 154.5 149.3
3 Cerebrovascular diseases I60-I69 7 20 4.1 25.1 23.5
3 Chronic lower respiratory diseases J40-J47 7 20 4.1 25.1 24.0
. . . All other causes . . . 63 189 39.1 237.5 245.0
Table 87. Average annual deaths, cumulative deaths, percentage of cumulative deaths, average crude death rate and average age-adjusted
death rate for the 3 leading causes of death in Woodlawn (Community Area 42), Chicago, 2007-2009
Rank Cause of death ICD-10 codeAverage
annual deathsCumulative
deaths
Percent of cumulative
deaths
Averagecrude
death rate
Average age-adjusted
death rate
. . . All causes . . . 229 687 . . . 938.2 1,034.0
1 Diseases of heart I00-I09,I11,I13,I20-I51 63 189 27.5 258.1 286.0
2 Malignant neoplasms C00-C97 47 142 20.7 193.9 216.2
3 Cerebrovascular diseases I60-I69 11 33 4.8 45.1 50.0
. . . All other causes . . . 108 323 47.0 441.1 481.7
Table 88. Average annual deaths, cumulative deaths, percentage of cumulative deaths, average crude death rate and average age-adjusted
death rate for the 3 leading causes of death in South Shore (Community Area 43), Chicago, 2007-2009
Rank Cause of death ICD-10 codeAverage
annual deathsCumulative
deaths
Percent of cumulative
deaths
Averagecrude
death rate
Average age-adjusted
death rate
. . . All causes . . . 594 1,783 . . . 1,102.3 1,080.8
1 Diseases of heart I00-I09,I11,I13,I20-I51 175 526 29.5 325.2 316.0
2 Malignant neoplasms C00-C97 133 400 22.4 247.3 238.5
3 Cerebrovascular diseases I60-I69 30 91 5.1 56.3 57.8
. . . All other causes . . . 255 766 43.0 473.5 468.4
Table 89. Average annual deaths, cumulative deaths, percentage of cumulative deaths, average crude death rate and average age-adjusted
death rate for the 3 leading causes of death in Chatham (Community Area 44), Chicago, 2007-2009
Rank Cause of death ICD-10 codeAverage
annual deathsCumulative
deaths
Percent of cumulative
deaths
Averagecrude
death rate
Average age-adjusted
death rate
. . . All causes . . . 381 1,144 . . . 1,181.4 905.3
1 Diseases of heart I00-I09,I11,I13,I20-I51 100 301 26.3 310.8 227.2
2 Malignant neoplasms C00-C97 91 274 24.0 283.0 211.0
3 Diabetes mellitus E10-E14 19 56 4.9 57.8 44.7
. . . All other causes . . . 171 513 44.8 529.8 422.3
Table 90. Average annual deaths, cumulative deaths, percentage of cumulative deaths, average crude death rate and average age-adjusted
death rate for the 3 leading causes of death in Avalon Park (Community Area 45), Chicago, 2007-2009
Rank Cause of death ICD-10 codeAverage
annual deathsCumulative
deaths
Percent of cumulative
deaths
Averagecrude
death rate
Average age-adjusted
death rate
. . . All causes . . . 115 345 . . . 1,108.2 828.4
1 Malignant neoplasms C00-C97 30 91 26.4 292.3 209.5
2 Diseases of heart I00-I09,I11,I13,I20-I51 29 87 25.2 279.5 203.4
3 Cerebrovascular diseases I60-I69 6 18 5.2 57.8 41.2
. . . All other causes . . . 50 149 43.2 478.6 374.3

HEALTHY CHICAGO REPORTS
Leading Causes of Death in Chicago, 2007-2009 41
Table 91. Average annual deaths, cumulative deaths, percentage of cumulative deaths, average crude death rate and average age-adjusted
death rate for the 3 leading causes of death in South Chicago (Community Area 46), Chicago, 2007-2009
Rank Cause of death ICD-10 codeAverage
annual deathsCumulative
deaths
Percent of cumulative
deaths
Averagecrude
death rate
Average age-adjusted
death rate
. . . All causes . . . 310 930 . . . 948.7 1,000.8
1 Diseases of heart I00-I09,I11,I13,I20-I51 79 237 25.5 241.8 262.4
2 Malignant neoplasms C00-C97 78 234 25.2 238.7 243.8
3 Cerebrovascular diseases I60-I69 15 46 4.9 46.9 50.4
. . . All other causes . . . 138 413 44.4 421.3 444.3
Table 92. Average annual deaths, cumulative deaths, percentage of cumulative deaths, average crude death rate and average age-adjusted
death rate for the 3 leading causes of death in Burnside (Community Area 47), Chicago, 2007-2009
Rank Cause of death ICD-10 codeAverage
annual deathsCumulative
deaths
Percent of cumulative
deaths
Averagecrude
death rate
Average age-adjusted
death rate
. . . All causes . . . 33 99 . . . 1,103.1 1,005.4
1 Diseases of heart I00-I09,I11,I13,I20-I51 8 23 23.2 256.3 228.9
2 Malignant neoplasms C00-C97 7 20 20.2 222.8 186.1
3 Cerebrovascular diseases I60-I69 4 12 12.1 133.7 127.5
. . . All other causes . . . 15 44 44.4 490.3 462.8
Table 93. Average annual deaths, cumulative deaths, percentage of cumulative deaths, average crude death rate and average age-adjusted
death rate for the 3 leading causes of death in Calumet Heights (Community Area 48), Chicago, 2007-2009
Rank Cause of death ICD-10 codeAverage
annual deathsCumulative
deaths
Percent of cumulative
deaths
Averagecrude
death rate
Average age-adjusted
death rate
. . . All causes . . . 172 516 . . . 1,207.5 890.3
1 Malignant neoplasms C00-C97 45 136 26.4 318.3 215.2
2 Diseases of heart I00-I09,I11,I13,I20-I51 42 126 24.4 294.9 210.7
3 Diabetes mellitus E10-E14 9 28 5.4 65.5 49.0
. . . All other causes . . . 75 226 43.8 528.9 415.4
Table 94. Average annual deaths, cumulative deaths, percentage of cumulative deaths, average crude death rate and average age-adjusted
death rate for the 3 leading causes of death in Roseland (Community Area 49), Chicago, 2007-2009
Rank Cause of death ICD-10 codeAverage
annual deathsCumulative
deaths
Percent of cumulative
deaths
Averagecrude
death rate
Average age-adjusted
death rate
. . . All causes . . . 577 1,731 . . . 1,247.8 1,093.6
1 Diseases of heart I00-I09,I11,I13,I20-I51 151 452 26.1 325.8 281.6
2 Malignant neoplasms C00-C97 138 414 23.9 298.4 252.6
3 Cerebrovascular diseases I60-I69 30 91 5.3 65.6 55.2
. . . All other causes . . . 258 774 44.7 558.0 504.2
Table 95. Average annual deaths, cumulative deaths, percentage of cumulative deaths, average crude death rate and average age-adjusted
death rate for the 3 leading causes of death in Pullman (Community Area 50), Chicago, 2007-2009
Rank Cause of death ICD-10 codeAverage
annual deathsCumulative
deaths
Percent of cumulative
deaths
Averagecrude
death rate
Average age-adjusted
death rate
. . . All causes . . . 72 216 . . . 941.9 957.0
1 Malignant neoplasms C00-C97 19 58 26.9 252.9 242.0
2 Diseases of heart I00-I09,I11,I13,I20-I51 19 57 26.4 248.6 259.2
3 Cerebrovascular diseases I60-I69 5 15 6.9 65.4 71.8
. . . All other causes . . . 29 86 39.8 375.0 383.9

HEALTHY CHICAGO REPORTS
Leading Causes of Death in Chicago, 2007-2009 42
Table 96. Average annual deaths, cumulative deaths, percentage of cumulative deaths, average crude death rate and average age-adjusted
death rate for the 3 leading causes of death in South Deering (Community Area 51), Chicago, 2007-2009
Rank Cause of death ICD-10 codeAverage
annual deathsCumulative
deaths
Percent of cumulative
deaths
Averagecrude
death rate
Average age-adjusted
death rate
. . . All causes . . . 143 430 . . . 925.6 914.9
1 Diseases of heart I00-I09,I11,I13,I20-I51 35 104 24.2 223.9 223.7
2 Malignant neoplasms C00-C97 34 103 24.0 221.7 208.7
3 Cerebrovascular diseases I60-I69 10 30 7.0 64.6 65.5
. . . All other causes . . . 64 193 44.9 415.5 417.0
Table 97. Average annual deaths, cumulative deaths, percentage of cumulative deaths, average crude death rate and average age-adjusted
death rate for the 3 leading causes of death in East Side (Community Area 52), Chicago, 2007-2009
Rank Cause of death ICD-10 codeAverage
annual deathsCumulative
deaths
Percent of cumulative
deaths
Averagecrude
death rate
Average age-adjusted
death rate
. . . All causes . . . 155 465 . . . 669.1 763.8
1 Diseases of heart I00-I09,I11,I13,I20-I51 37 111 23.9 159.7 182.8
2 Malignant neoplasms C00-C97 36 109 23.4 156.9 182.1
3 Accidents (unintentional injuries) V01-X59,Y85-Y86 8 23 4.9 33.1 36.3
. . . All other causes . . . 74 222 47.7 319.5 362.6
Table 99. Average annual deaths, cumulative deaths, percentage of cumulative deaths, average crude death rate and average age-adjusted
death rate for the 3 leading causes of death in Riverdale (Community Area 54), Chicago, 2007-2009
Rank Cause of death ICD-10 codeAverage
annual deathsCumulative
deaths
Percent of cumulative
deaths
Averagecrude
death rate
Average age-adjusted
death rate
. . . All causes . . . 42 127 . . . 592.3 990.7
1 Diseases of heart I00-I09,I11,I13,I20-I51 10 31 24.4 144.6 256.2
2 Malignant neoplasms C00-C97 9 28 22.0 130.6 228.5
3 Cerebrovascular diseases I60-I69 3 8 6.3 37.3 80.3
3 Chronic lower respiratory diseases J40-J47 3 8 6.3 37.3 57.9
. . . All other causes . . . 17 52 40.9 242.5 367.8
Table 98. Average annual deaths, cumulative deaths, percentage of cumulative deaths, average crude death rate and average age-adjusted
death rate for the 3 leading causes of death in West Pullman (Community Area 53), Chicago, 2007-2009
Rank Cause of death ICD-10 codeAverage
annual deathsCumulative
deaths
Percent of cumulative
deaths
Averagecrude
death rate
Average age-adjusted
death rate
. . . All causes . . . 314 943 . . . 1,012.3 1,134.8
1 Diseases of heart I00-I09,I11,I13,I20-I51 82 246 26.1 264.1 294.3
2 Malignant neoplasms C00-C97 76 229 24.3 245.8 256.1
3 Cerebrovascular diseases I60-I69 18 53 5.6 56.9 69.4
. . . All other causes . . . 138 415 44.0 445.5 515.0
Table 100. Average annual deaths, cumulative deaths, percentage of cumulative deaths, average crude death rate and average age-adjust-
ed death rate for the 3 leading causes of death in Hedgewisch (Community Area 55), Chicago, 2007-2009
Rank Cause of death ICD-10 codeAverage
annual deathsCumulative
deaths
Percent of cumulative
deaths
Averagecrude
death rate
Average age-adjusted
death rate
. . . All causes . . . 98 294 . . . 1,031.9 839.3
1 Diseases of heart I00-I09,I11,I13,I20-I51 29 86 29.3 301.8 236.7
2 Malignant neoplasms C00-C97 23 69 23.5 242.2 196.5
3 Cerebrovascular diseases I60-I69 4 13 4.4 45.6 38.5
. . . All other causes . . . 42 126 42.9 442.2 367.7

HEALTHY CHICAGO REPORTS
Leading Causes of Death in Chicago, 2007-2009 43
Table 101. Average annual deaths, cumulative deaths, percentage of cumulative deaths, average crude death rate and average age-
adjusted death rate for the 3 leading causes of death in Garfi eld Ridge (Community Area 56), Chicago, 2007-2009
Rank Cause of death ICD-10 codeAverage
annual deathsCumulative
deaths
Percent of cumulative
deaths
Averagecrude
death rate
Average age-adjusted
death rate
. . . All causes . . . 410 1,230 . . . 1,177.1 905.7
1 Diseases of heart I00-I09,I11,I13,I20-I51 121 364 29.6 348.4 255.1
2 Malignant neoplasms C00-C97 101 304 24.7 290.9 229.2
3 Cerebrovascular diseases I60-I69 21 64 5.2 61.2 43.1
. . . All other causes . . . 166 498 40.5 476.6 378.4
Table 102. Average annual deaths, cumulative deaths, percentage of cumulative deaths, average crude death rate and average age-adjusted
death rate for the 3 leading causes of death in Archer Heights (Community Area 57), Chicago, 2007-2009
Rank Cause of death ICD-10 codeAverage
annual deathsCumulative
deaths
Percent of cumulative
deaths
Averagecrude
death rate
Average age-adjusted
death rate
. . . All causes . . . 92 276 . . . 694.7 805.4
1 Diseases of heart I00-I09,I11,I13,I20-I51 27 82 29.7 206.4 241.0
2 Malignant neoplasms C00-C97 18 55 19.9 138.4 166.6
3 Cerebrovascular diseases I60-I69 5 16 5.8 40.3 48.1
3 Accidents (unintentional injuries) V01-X59,Y85-Y86 5 16 5.8 40.3 42.9
. . . All other causes . . . 36 107 38.8 269.3 306.8
Table 103. Average annual deaths, cumulative deaths, percentage of cumulative deaths, average crude death rate and average age-adjusted
death rate for the 3 leading causes of death in Brighton Park (Community Area 58), Chicago, 2007-2009
Rank Cause of death ICD-10 codeAverage
annual deathsCumulative
deaths
Percent of cumulative
deaths
Averagecrude
death rate
Average age-adjusted
death rate
. . . All causes . . . 176 528 . . . 388.7 657.1
1 Diseases of heart I00-I09,I11,I13,I20-I51 48 145 27.5 106.8 195.5
2 Malignant neoplasms C00-C97 37 110 20.8 81.0 142.1
3 Cerebrovascular diseases I60-I69 10 29 5.5 21.4 40.7
. . . All other causes . . . 81 244 46.2 179.6 278.8
Table 104. Average annual deaths, cumulative deaths, percentage of cumulative deaths, average crude death rate and average age-adjusted
death rate for the 3 leading causes of death in McKinley Park (Community Area 59), Chicago, 2007-2009
Rank Cause of death ICD-10 codeAverage
annual deathsCumulative
deaths
Percent of cumulative
deaths
Averagecrude
death rate
Average age-adjusted
death rate
. . . All causes . . . 88 263 . . . 559.0 754.7
1 Diseases of heart I00-I09,I11,I13,I20-I51 25 76 28.9 161.5 219.5
2 Malignant neoplasms C00-C97 17 51 19.4 108.4 144.1
3 Cerebrovascular diseases I60-I69 6 18 6.8 38.3 53.2
. . . All other causes . . . 39 118 44.9 250.8 337.9
Table 105. Average annual deaths, cumulative deaths, percentage of cumulative deaths, average crude death rate and average age-adjust-
ed death rate for the 3 leading causes of death in Bridgeport (Community Area 60), Chicago, 2007-2009
Rank Cause of death ICD-10 codeAverage
annual deathsCumulative
deaths
Percent of cumulative
deaths
Averagecrude
death rate
Average age-adjusted
death rate
. . . All causes . . . 204 612 . . . 631.2 719.8
1 Diseases of heart I00-I09,I11,I13,I20-I51 55 164 26.8 169.1 196.3
2 Malignant neoplasms C00-C97 52 155 25.3 159.9 179.1
3 Accidents (unintentional injuries) V01-X59,Y85-Y86 11 32 5.2 33.0 34.6
. . . All other causes . . . 87 261 42.6 269.2 309.7

HEALTHY CHICAGO REPORTS
Leading Causes of Death in Chicago, 2007-2009 44
Table 106. Average annual deaths, cumulative deaths, percentage of cumulative deaths, average crude death rate and average age-
adjusted death rate for the 3 leading causes of death in New City (Community Area 61), Chicago, 2007-2009
Rank Cause of death ICD-10 codeAverage
annual deathsCumulative
deaths
Percent of cumulative
deaths
Averagecrude
death rate
Average age-adjusted
death rate
. . . All causes . . . 267 801 . . . 582.4 964.3
1 Diseases of heart I00-I09,I11,I13,I20-I51 63 189 23.6 137.4 256.7
2 Malignant neoplasms C00-C97 62 185 23.1 134.5 228.4
3 Accidents (unintentional injuries) V01-X59,Y85-Y86 14 43 5.4 31.3 37.1
3 Assault (homicide) X85-Y09,Y87.1 14 43 5.4 31.3 28.1
. . . All other causes . . . 114 341 42.6 247.9 414.0
Table 107. Average annual deaths, cumulative deaths, percentage of cumulative deaths, average crude death rate and average age-adjusted
death rate for the 3 leading causes of death in West Elsdon (Community Area 62), Chicago, 2007-2009
Rank Cause of death ICD-10 codeAverage
annual deathsCumulative
deaths
Percent of cumulative
deaths
Averagecrude
death rate
Average age-adjusted
death rate
. . . All causes . . . 102 306 . . . 577.2 684.4
1 Diseases of heart I00-I09,I11,I13,I20-I51 31 92 30.1 173.5 204.5
2 Malignant neoplasms C00-C97 23 69 22.5 130.2 165.7
3 Cerebrovascular diseases I60-I69 7 20 6.5 37.7 44.3
. . . All other causes . . . 42 125 40.8 235.8 270.0
Table 108. Average annual deaths, cumulative deaths, percentage of cumulative deaths, average crude death rate and average age-adjusted
death rate for the 3 leading causes of death in Gage Park (Community Area 63), Chicago, 2007-2009
Rank Cause of death ICD-10 codeAverage
annual deathsCumulative
deaths
Percent of cumulative
deaths
Averagecrude
death rate
Average age-adjusted
death rate
. . . All causes . . . 145 436 . . . 365.6 712.5
1 Diseases of heart I00-I09,I11,I13,I20-I51 34 103 23.6 86.4 194.0
2 Malignant neoplasms C00-C97 32 97 22.2 81.3 163.9
3 Accidents (unintentional injuries) V01-X59,Y85-Y86 12 36 8.3 30.2 37.2
. . . All other causes . . . 67 200 45.9 167.7 317.4
Table 109. Average annual deaths, cumulative deaths, percentage of cumulative deaths, average crude death rate and average age-
adjusted death rate for the 3 leading causes of death in Clearing (Community Area 64), Chicago, 2007-2009
Rank Cause of death ICD-10 codeAverage
annual deathsCumulative
deaths
Percent of cumulative
deaths
Averagecrude
death rate
Average age-adjusted
death rate
. . . All causes . . . 203 610 . . . 884.9 830.7
1 Diseases of heart I00-I09,I11,I13,I20-I51 59 176 28.9 255.3 235.2
2 Malignant neoplasms C00-C97 45 134 22.0 194.4 183.6
3 Cerebrovascular diseases I60-I69 14 42 6.9 60.9 56.3
. . . All other causes . . . 86 258 42.3 374.3 355.5
Table 110. Average annual deaths, cumulative deaths, percentage of cumulative deaths, average crude death rate and average age-
adjusted death rate for the 3 leading causes of death in West Lawn (Community Area 65), Chicago, 2007-2009
Rank Cause of death ICD-10 codeAverage
annual deathsCumulative
deaths
Percent of cumulative
deaths
Averagecrude
death rate
Average age-adjusted
death rate
. . . All causes . . . 176 529 . . . 542.0 680.1
1 Diseases of heart I00-I09,I11,I13,I20-I51 56 169 31.9 173.2 221.2
2 Malignant neoplasms C00-C97 36 108 20.4 110.7 142.9
3 Cerebrovascular diseases I60-I69 10 30 5.7 30.7 40.7
. . . All other causes . . . 74 222 42.0 227.5 275.3

HEALTHY CHICAGO REPORTS
Leading Causes of Death in Chicago, 2007-2009 45
Table 111. Average annual deaths, cumulative deaths, percentage of cumulative deaths, average crude death rate and average age-
adjusted death rate for the 3 leading causes of death in Chicago Lawn (Community Area 66), Chicago, 2007-2009
Rank Cause of death ICD-10 codeAverage
annual deathsCumulative
deaths
Percent of cumulative
deaths
Averagecrude
death rate
Average age-adjusted
death rate
. . . All causes . . . 330 989 . . . 580.6 897.4
1 Diseases of heart I00-I09,I11,I13,I20-I51 86 257 26.0 150.9 260.6
2 Malignant neoplasms C00-C97 67 200 20.2 117.4 180.9
3 Cerebrovascular diseases I60-I69 19 56 5.7 32.9 56.5
. . . All other causes . . . 159 476 48.1 279.4 399.3
Table 112. Average annual deaths, cumulative deaths, percentage of cumulative deaths, average crude death rate and average age-
adjusted death rate for the 3 leading causes of death in West Englewood (Community Area 67), Chicago, 2007-2009
Rank Cause of death ICD-10 codeAverage
annual deathsCumulative
deaths
Percent of cumulative
deaths
Averagecrude
death rate
Average age-adjusted
death rate
. . . All causes . . . 386 1,158 . . . 1,030.4 1,134.2
1 Diseases of heart I00-I09,I11,I13,I20-I51 95 285 24.6 253.6 281.0
2 Malignant neoplasms C00-C97 91 272 23.5 242.0 257.5
3 Cerebrovascular diseases I60-I69 23 68 5.9 60.5 68.4
. . . All other causes . . . 178 533 46.0 474.3 527.3
Table 113. Average annual deaths, cumulative deaths, percentage of cumulative deaths, average crude death rate and average age-
adjusted death rate for the 3 leading causes of death in Englewood (Community Area 68), Chicago, 2007-2009
Rank Cause of death ICD-10 codeAverage
annual deathsCumulative
deaths
Percent of cumulative
deaths
Averagecrude
death rate
Average age-adjusted
death rate
. . . All causes . . . 347 1,041 . . . 1,065.5 1,153.0
1 Diseases of heart I00-I09,I11,I13,I20-I51 89 267 25.6 273.3 299.7
2 Malignant neoplasms C00-C97 78 235 22.6 240.5 260.4
3 Cerebrovascular diseases I60-I69 21 63 6.1 64.5 70.0
. . . All other causes . . . 159 476 45.7 487.2 522.8
Table 114. Average annual deaths, cumulative deaths, percentage of cumulative deaths, average crude death rate and average age-
adjusted death rate for the 3 leading causes of death in Greater Grand Crossing (Community Area 69), Chicago, 2007-2009
Rank Cause of death ICD-10 codeAverage
annual deathsCumulative
deaths
Percent of cumulative
deaths
Averagecrude
death rate
Average age-adjusted
death rate
. . . All causes . . . 415 1,245 . . . 1,227.6 1,109.3
1 Malignant neoplasms C00-C97 105 314 25.2 309.6 282.0
1 Diseases of heart I00-I09,I11,I13,I20-I51 105 314 25.2 309.6 278.9
3 Cerebrovascular diseases I60-I69 19 56 4.5 55.2 49.7
. . . All other causes . . . 187 561 45.1 553.2 498.7
Table 115. Average annual deaths, cumulative deaths, percentage of cumulative deaths, average crude death rate and average age-adjusted
death rate for the 3 leading causes of death in Ashburn (Community Area 70), Chicago, 2007-2009
Rank Cause of death ICD-10 codeAverage
annual deathsCumulative
deaths
Percent of cumulative
deaths
Averagecrude
death rate
Average age-adjusted
death rate
. . . All causes . . . 313 939 . . . 767.5 862.3
1 Malignant neoplasms C00-C97 85 256 27.3 209.2 236.7
2 Diseases of heart I00-I09,I11,I13,I20-I51 73 218 23.2 178.2 198.5
3 Chronic lower respiratory diseases J40-J47 14 42 4.5 34.3 39.9
. . . All other causes . . . 141 423 45.0 345.7 387.2

HEALTHY CHICAGO REPORTS
Leading Causes of Death in Chicago, 2007-2009 46
Table 116. Average annual deaths, cumulative deaths, percentage of cumulative deaths, average crude death rate and average age-
adjusted death rate for the 3 leading causes of death in Auburn Gresham (Community Area 71), Chicago, 2007-2009
Rank Cause of death ICD-10 codeAverage
annual deathsCumulative
deaths
Percent of cumulative
deaths
Averagecrude
death rate
Average age-adjusted
death rate
. . . All causes . . . 538 1,613 . . . 1,071.5 996.2
1 Diseases of heart I00-I09,I11,I13,I20-I51 141 422 26.2 280.3 255.3
2 Malignant neoplasms C00-C97 130 390 24.2 259.1 229.8
3 Cerebrovascular diseases I60-I69 36 107 6.6 71.1 67.2
. . . All other causes . . . 231 694 43.0 461.0 443.9
Table 117. Average annual deaths, cumulative deaths, percentage of cumulative deaths, average crude death rate and average age-
adjusted death rate for the 3 leading causes of death in Beverly (Community Area 72), Chicago, 2007-2009
Rank Cause of death ICD-10 codeAverage
annual deathsCumulative
deaths
Percent of cumulative
deaths
Averagecrude
death rate
Average age-adjusted
death rate
. . . All causes . . . 154 463 . . . 755.6 763.1
1 Diseases of heart I00-I09,I11,I13,I20-I51 40 120 25.9 195.8 200.7
2 Malignant neoplasms C00-C97 38 115 24.8 187.7 180.8
3 Cerebrovascular diseases I60-I69 11 34 7.3 55.5 58.6
. . . All other causes . . . 65 194 41.9 316.6 323.0
Table 118. Average annual deaths, cumulative deaths, percentage of cumulative deaths, average crude death rate and average age-
adjusted death rate for the 3 leading causes of death in Washington Heights (Community Area 73), Chicago, 2007-2009
Rank Cause of death ICD-10 codeAverage
annual deathsCumulative
deaths
Percent of cumulative
deaths
Averagecrude
death rate
Average age-adjusted
death rate
. . . All causes . . . 354 1,062 . . . 1,303.2 1,031.2
1 Malignant neoplasms C00-C97 96 288 27.1 353.4 264.4
2 Diseases of heart I00-I09,I11,I13,I20-I51 90 269 25.3 330.1 253.5
3 Cerebrovascular diseases I60-I69 19 56 5.3 68.7 51.2
. . . All other causes . . . 150 449 42.3 551.0 462.0
Table 119. Average annual deaths, cumulative deaths, percentage of cumulative deaths, average crude death rate and average age-adjusted
death rate for the 3 leading causes of death in Mount Greenwood (Community Area 74), Chicago, 2007-2009
Rank Cause of death ICD-10 codeAverage
annual deathsCumulative
deaths
Percent of cumulative
deaths
Averagecrude
death rate
Average age-adjusted
death rate
. . . All causes . . . 145 436 . . . 763.4 722.3
1 Diseases of heart I00-I09,I11,I13,I20-I51 45 136 31.2 238.1 220.9
2 Malignant neoplasms C00-C97 36 109 25.0 190.8 185.0
3 Chronic lower respiratory diseases J40-J47 8 25 5.7 43.8 42.4
. . . All other causes . . . 55 166 38.1 290.6 274.0
Table 120. Average annual deaths, cumulative deaths, percentage of cumulative deaths, average crude death rate and average age-adjusted
death rate for the 3 leading causes of death in Morgan Park (Community Area 75), Chicago, 2007-2009
Rank Cause of death ICD-10 codeAverage
annual deathsCumulative
deaths
Percent of cumulative
deaths
Averagecrude
death rate
Average age-adjusted
death rate
. . . All causes . . . 247 740 . . . 1,068.7 852.1
1 Diseases of heart I00-I09,I11,I13,I20-I51 69 206 27.8 297.5 225.4
2 Malignant neoplasms C00-C97 61 183 24.7 264.3 214.5
3 Cerebrovascular diseases I60-I69 13 40 5.4 57.8 44.2
. . . All other causes . . . 104 311 42.0 449.2 367.9

HEALTHY CHICAGO REPORTS
Leading Causes of Death in Chicago, 2007-2009 47
Table 121. Average annual deaths, cumulative deaths, percentage of cumulative deaths, average crude death rate and average age-
adjusted death rate for the 3 leading causes of death in O’Hare (Community Area 76), Chicago, 2007-2009
Rank Cause of death ICD-10 codeAverage
annual deathsCumulative
deaths
Percent of cumulative
deaths
Averagecrude
death rate
Average age-adjusted
death rate
. . . All causes . . . 86 257 . . . 680.1 611.1
1 Diseases of heart I00-I09,I11,I13,I20-I51 24 73 28.4 193.2 167.7
2 Malignant neoplasms C00-C97 20 61 23.7 161.4 144.2
3 Cerebrovascular diseases I60-I69 5 16 6.2 42.3 36.9
. . . All other causes . . . 36 107 41.6 283.2 262.3
Table 122. Average annual deaths, cumulative deaths, percentage of cumulative deaths, average crude death rate and average age-
adjusted death rate for the 3 leading causes of death in Edgewater (Community Area 77), Chicago, 2007-2009
Rank Cause of death ICD-10 codeAverage
annual deathsCumulative
deaths
Percent of cumulative
deaths
Averagecrude
death rate
Average age-adjusted
death rate
. . . All causes . . . 395 1,184 . . . 684.5 670.1
1 Diseases of heart I00-I09,I11,I13,I20-I51 124 371 31.3 214.5 206.7
2 Malignant neoplasms C00-C97 91 274 23.1 158.4 158.2
3 Cerebrovascular diseases I60-I69 19 57 4.8 33.0 32.9
. . . All other causes . . . 161 482 40.7 278.7 272.4
Table 123. Deaths, percentage of total deaths and age-specifi c death rate for the 3 leading causes of death in 1-14 year olds, Chicago, 2007
Rank Cause of death ICD-10 code DeathsPercent of
total deathsAge-specifi cdeath rate
. . . All causes . . . 122 . . . 78.9
1 Accidents (unintentional injuries) V01-X59,Y85-Y86 31 25.4 20.1
2 Assault (homicide) X85-Y09,Y87.1 21 17.2 13.6
3 Malignant neoplasms C00-C97 13 10.7 8.4
. . . All other causes . . . 57 46.7 36.9
Table 124. Deaths, percentage of total deaths and age-specifi c death rate for the 3 leading causes of death in 1-14 year olds, Chicago, 2008
Rank Cause of death ICD-10 code DeathsPercent of
total deathsAge-specifi cdeath rate
. . . All causes . . . 102 . . . 67.2
1 Accidents (unintentional injuries) V01-X59,Y85-Y86 22 21.6 14.5
2 Congenital malformations, deformations and chromosomal abnormalities
Q00-Q99 13 12.7 8.6
3 Assault (homicide) X85-Y09,Y87.1 12 11.8 7.9
. . . All other causes . . . 55 53.9 36.2
Table 125. Deaths, percentage of total deaths and age-specifi c death rate for the 3 leading causes of death in 1-14 year olds, Chicago, 2009
Rank Cause of death ICD-10 code DeathsPercent of
total deathsAge-specifi cdeath rate
. . . All causes . . . 94 . . . 63
1 Accidents (unintentional injuries) V01-X59,Y85-Y86 20 21.3 13.4
2 Congenital malformations, deformations and chromosomal abnormalities
Q00-Q99 19 20.2 12.7
3 Malignant neoplasms C00-C97 13 13.8 8.7
. . . All other causes . . . 42 44.7 28.2
Age Group: 1-14 Years

HEALTHY CHICAGO REPORTS
Leading Causes of Death in Chicago, 2007-2009 48
Table 126. Average annual deaths, cumulative deaths, percentage of cumulative deaths and average age-specifi c death rate for the 3
leading causes of death in females 1-14 years old, Chicago, 2007-2009
Rank Cause of death ICD-10 codeAverage
annual deathsCumulative
deaths
Percent of cumulative
deaths
Averageage-specifi cdeath rate
. . . All causes . . . 44 131 . . . 58.3
1 Accidents (unintentional injuries) V01-X59,Y85-Y86 9 27 20.6 12.0
2 Congenital malformations, deformations and chromosomal abnormalities
Q00-Q99 8 23 17.6 10.2
3 Malignant neoplasms C00-C97 6 19 14.5 8.5
. . . All other causes . . . 21 62 47.3 27.6
Table 127. Average annual deaths, cumulative deaths, percentage of cumulative deaths and average age-specifi c death rate for the 3
leading causes of death in males 1-14 years old, Chicago, 2007-2009
Rank Cause of death ICD-10 codeAverage
annual deathsCumulative
deaths
Percent of cumulative
deaths
Averageage-specifi cdeath rate
. . . All causes . . . 62 187 . . . 81.0
1 Accidents (unintentional injuries) V01-X59,Y85-Y86 15 46 24.6 19.9
2 Assault (homicide) X85-Y09,Y87.1 10 31 16.6 13.4
3 Congenital malformations, deformations and chromosomal abnormalities
Q00-Q99 7 21 11.2 9.1
. . . All other causes . . . 30 89 47.6 38.5
Table 129. Average annual deaths, cumulative deaths, percentage of cumulative deaths and average age-specifi c death rate for the 3
leading causes of death in non-Hispanic blacks 1-14 years old, Chicago, 2007-2009
Rank Cause of death ICD-10 codeAverage
annual deathsCumulative
deaths
Percent of cumulative
deaths
Averageage-specifi cdeath rate
. . . All causes . . . 62 186 . . . 121.0
1 Accidents (unintentional injuries) V01-X59,Y85-Y86 15 46 24.7 29.9
2 Assault (homicide) X85-Y09,Y87.1 11 33 17.7 21.5
3 Congenital malformations, deformations and chromosomal abnormalities
Q00-Q99 9 27 14.5 17.6
. . . All other causes 27 80 43.0 52.0
Table 128. Average annual deaths, cumulative deaths, percentage of cumulative deaths and average age-specifi c death rate for the 3
leading causes of death in Hispanics 1-14 years old, Chicago, 2007-2009
Rank Cause of death ICD-10 codeAverage
annual deathsCumulative
deaths
Percent of cumulative
deaths
Averageage-specifi cdeath rate
. . . All causes . . . 32 96 . . . 52.1
1 Accidents (unintentional injuries) V01-X59,Y85-Y86 7 20 20.8 10.9
2 Malignant neoplasms C00-C97 5 14 14.6 7.6
3 Congenital malformations, deformations and chromosomal abnormalities
Q00-Q99 4 11 11.5 6.0
. . . All other causes . . . 17 51 53.1 27.7
Age Group: 1-14 Years by Sex
Age Group: 1-14 Years by Race-Ethnicity

HEALTHY CHICAGO REPORTS
Leading Causes of Death in Chicago, 2007-2009 49
Table 130. Average annual deaths, cumulative deaths, percentage of cumulative deaths and average age-specifi c death rate for the 3
leading causes of death in non-Hispanic whites 1-14 years old, Chicago, 2007-2009
Rank Cause of death ICD-10 codeAverage
annual deathsCumulative
deaths
Percent of cumulative
deaths
Averageage-specifi cdeath rate
. . . All causes . . . 11 32 . . . 36.4
1 Accidents (unintentional injuries) V01-X59,Y85-Y86 2 7 21.9 8.0
2 Malignant neoplasms C00-C97 -- -- -- --
3 Congenital malformations, deformations and chromosomal abnormalities
Q00-Q99 -- -- -- --
. . . All other causes . . . 6 17 53.1 19.3
Table 131. Average annual deaths, cumulative deaths, percentage of cumulative deaths and average age-specifi c death rate for the 3
leading causes of death in Hispanic females 1-14 years old, Chicago, 2007-2009
Rank Cause of death ICD-10 codeAverage
annual deathsCumulative
deaths
Percent of cumulative
deaths
Averageage-specifi cdeath rate
. . . All causes . . . 15 46 . . . 50.7
1 Congenital malformations, deformations and chromosomal abnormalities
Q00-Q99 3 9 19.6 9.9
2 Accidents (unintentional injuries) V01-X59,Y85-Y86 3 8 17.4 8.8
3 Malignant neoplasms C00-C97 2 7 15.2 7.7
. . . All other causes . . . 7 22 47.8 24.3
Table 132. Average annual deaths, cumulative deaths, percentage of cumulative deaths and average age-specifi c death rate for the 3
leading causes of death in non-Hispanic black females 1-14 years old, Chicago, 2007-2009
Rank Cause of death ICD-10 codeAverage
annual deathsCumulative
deaths
Percent of cumulative
deaths
Averageage-specifi cdeath rate
. . . All causes . . . 23 69 . . . 90.5
1 Accidents (unintentional injuries) V01-X59,Y85-Y86 5 16 23.2 21.0
2 Congenital malformations, deformations and chromosomal abnormalities
Q00-Q99 4 11 15.9 14.4
3 Malignant neoplasms C00-C97 3 10 14.5 13.1
3 Assault (homicide) X85-Y09,Y87.1 3 10 14.5 13.1
. . . All other causes . . . 7 22 31.9 28.8
Table 133. Average annual deaths, cumulative deaths, percentage of cumulative deaths and average age-specifi c death rate for the 3
leading causes of death in Hispanic males 1-14 years old, Chicago, 2007-2009
Rank Cause of death ICD-10 codeAverage
annual deathsCumulative
deaths
Percent of cumulative
deaths
Averageage-specifi cdeath rate
. . . All causes . . . 17 50 . . . 53.5
1 Accidents (unintentional injuries) V01-X59,Y85-Y86 4 12 24.0 12.8
2 Assault (homicide) X85-Y09,Y87.1 3 8 16.0 8.6
3 Malignant neoplasms C00-C97 2 7 14.0 7.5
. . . All other causes . . . 8 23 46.0 24.6
Age Group: 1-14 Years by Race-Ethnicity and Sex

HEALTHY CHICAGO REPORTS
Leading Causes of Death in Chicago, 2007-2009 50
Table 134. Average annual deaths, cumulative deaths, percentage of cumulative deaths and average age-specifi c death rate for the 3
leading causes of death in non-Hispanic black males 1-14 years old, Chicago, 2007-2009
Rank Cause of death ICD-10 codeAverage
annual deathsCumulative
deaths
Percent of cumulative
deaths
Averageage-specifi cdeath rate
. . . All causes . . . 39 117 . . . 151.0
1 Accidents (unintentional injuries) V01-X59,Y85-Y86 10 30 25.6 38.7
2 Assault (homicide) X85-Y09,Y87.1 8 23 19.7 29.7
3 Congenital malformations, deformations and chromosomal abnormalities
Q00-Q99 5 16 13.7 20.7
. . . All other causes . . . 16 48 41 62.0
Table 135. Deaths, percentage of total deaths and age-specifi c death rate for the 5 leading causes of death in 15-24 year olds, Chicago, 2007
Rank Cause of death ICD-10 code DeathsPercent of
total deathsAge-specifi cdeath rate
. . . All causes . . . 385 . . . 92.5
1 Assault (homicide) X85-Y09,Y87.1 169 43.9 40.6
2 Accidents (unintentional injuries) V01-X59,Y85-Y86 100 26.0 24.0
3 Intentional self-harm (suicide) X60-X84,Y87.0 26 6.8 6.2
4 Malignant neoplasms C00-C97 15 3.9 3.6
5 Diseases of heart I00-I09,I11,I13,I20-I51 11 2.9 2.6
. . . All other causes . . . 64 16.6 15.4
Table 136. Deaths, percentage of total deaths and age-specifi c death rate for the 5 leading causes of death in 15-24 year olds, Chicago, 2008
Rank Cause of death ICD-10 code DeathsPercent of
total deathsAge-specifi cdeath rate
. . . All causes . . . 382 . . . 92.5
1 Assault (homicide) X85-Y09,Y87.1 213 55.8 51.6
2 Accidents (unintentional injuries) V01-X59,Y85-Y86 66 17.3 16.0
3 Malignant neoplasms C00-C97 18 4.7 4.4
4 Intentional self-harm (suicide) X60-X84,Y87.0 16 4.2 3.9
5 Diseases of heart I00-I09,I11,I13,I20-I51 13 3.4 3.1
. . . All other causes . . . 56 14.7 13.6
Table 137. Deaths, percentage of total deaths and age-specifi c death rate for the 5 leading causes of death in 15-24 year olds, Chicago, 2009
Rank Cause of death ICD-10 code DeathsPercent of
total deathsAge-specifi cdeath rate
. . . All causes . . . 365 . . . 89.2
1 Assault (homicide) X85-Y09,Y87.1 207 56.7 50.6
2 Accidents (unintentional injuries) V01-X59,Y85-Y86 50 13.7 12.2
3 Intentional self-harm (suicide) X60-X84,Y87.0 20 5.5 4.9
4 Malignant neoplasms C00-C97 19 5.2 4.6
5 Diseases of heart I00-I09,I11,I13,I20-I51 16 4.4 3.9
. . . All other causes . . . 53 14.5 12.9
Age Group: 15-24 Years

HEALTHY CHICAGO REPORTS
Leading Causes of Death in Chicago, 2007-2009 51
Table 140. Average annual deaths, cumulative deaths, percentage of cumulative deaths and average age-specifi c death rate for the 5
leading causes of death in Hispanics 15-24 years old, Chicago, 2007-2009
Rank Cause of death ICD-10 codeAverage
annual deathsCumulative
deaths
Percent of cumulative
deaths
Averageage-specifi cdeath rate
. . . All causes . . . 94 282 . . . 69.4
1 Assault (homicide) X85-Y09,Y87.1 47 142 50.4 35.0
2 Accidents (unintentional injuries) V01-X59,Y85-Y86 24 71 25.2 17.5
3 Malignant neoplasms C00-C97 5 15 5.3 3.7
4 Intentional self-harm (suicide) X60-X84,Y87.0 4 11 3.9 2.7
5 Diseases of heart I00-I09,I11,I13,I20-I51 3 9 3.2 2.2
. . . All other causes . . . 11 34 12.1 8.4
Table 141. Average annual deaths, cumulative deaths, percentage of cumulative deaths and average age-specifi c death rate for the 5
leading causes of death in non-Hispanic blacks 15-24 years old, Chicago, 2007-2009
Rank Cause of death ICD-10 codeAverage
annual deathsCumulative
deaths
Percent of cumulative
deaths
Averageage-specifi cdeath rate
. . . All causes . . . 235 704 . . . 164.9
1 Assault (homicide) X85-Y09,Y87.1 142 425 60.4 99.5
2 Accidents (unintentional injuries) V01-X59,Y85-Y86 30 89 12.6 20.8
3 Malignant neoplasms C00-C97 9 26 3.7 6.1
4 Diseases of heart I00-I09,I11,I13,I20-I51 8 25 3.6 5.9
5 Intentional self-harm (suicide) X60-X84,Y87.0 8 24 3.4 5.6
. . . All other causes . . . 38 115 16.3 26.9
Table 139. Average annual deaths, cumulative deaths, percentage of cumulative deaths and average age-specifi c death rate for the 5
leading causes of death in males 15-24 years old, Chicago, 2007-2009
Rank Cause of death ICD-10 codeAverage
annual deathsCumulative
deaths
Percent of cumulative
deaths
Averageage-specifi cdeath rate
. . . All causes . . . 310 929 . . . 151.8
1 Assault (homicide) X85-Y09,Y87.1 181 544 58.6 88.9
2 Accidents (unintentional injuries) V01-X59,Y85-Y86 57 172 18.5 28.1
3 Intentional self-harm (suicide) X60-X84,Y87.0 18 53 5.7 8.7
4 Malignant neoplasms C00-C97 9 26 2.8 4.2
4 Diseases of heart I00-I09,I11,I13,I20-I51 9 26 2.8 4.2
. . . All other causes . . . 36 108 11.6 17.6
Table 138. Average annual deaths, cumulative deaths, percentage of cumulative deaths and average age-specifi c death rate for the 5
leading causes of death in females 15-24 years old, Chicago, 2007-2009
Rank Cause of death ICD-10 codeAverage
annual deathsCumulative
deaths
Percent of cumulative
deaths
Averageage-specifi cdeath rate
. . . All causes . . . 68 203 . . . 32.4
1 Assault (homicide) X85-Y09,Y87.1 15 45 22.2 7.2
2 Accidents (unintentional injuries) V01-X59,Y85-Y86 15 44 21.7 7.0
3 Malignant neoplasms C00-C97 9 26 12.8 4.2
4 Diseases of heart I00-I09,I11,I13,I20-I51 5 14 6.9 2.2
5 Intentional self-harm (suicide) X60-X84,Y87.0 3 9 4.4 1.4
. . . All other causes . . . 22 65 32 10.4
Age Group: 15-24 Years by Sex
Age Group: 15-24 Years by Race-Ethnicity

HEALTHY CHICAGO REPORTS
Leading Causes of Death in Chicago, 2007-2009 52
Table 143. Average annual deaths, cumulative deaths, percentage of cumulative deaths and average age-specifi c death rate for the 3
leading causes of death in Hispanic females 15-24 years old, Chicago, 2007-2009
Rank Cause of death ICD-10 codeAverage
annual deathsCumulative
deaths
Percent of cumulative
deaths
Averageage-specifi cdeath rate
. . . All causes . . . 15 46 . . . 23.7
1 Accidents (unintentional injuries) V01-X59,Y85-Y86 5 14 30.4 7.2
2 Assault (homicide) X85-Y09,Y87.1 3 9 19.6 4.6
3 Malignant neoplasms C00-C97 3 8 17.4 4.1
. . . All other causes . . . 5 15 32.6 7.7
Table 144. Average annual deaths, cumulative deaths, percentage of cumulative deaths and average age-specifi c death rate for the 3
leading causes of death in non-Hispanic black females 15-24 years old, Chicago, 2007-2009
Rank Cause of death ICD-10 codeAverage
annual deathsCumulative
deaths
Percent of cumulative
deaths
Averageage-specifi cdeath rate
. . . All causes . . . 41 124 . . . 56.2
1 Assault (homicide) X85-Y09,Y87.1 11 34 27.4 15.4
2 Accidents (unintentional injuries) V01-X59,Y85-Y86 7 20 16.1 9.1
3 Diseases of heart I00-I09,I11,I13,I20-I51 4 13 10.5 5.9
. . . All other causes . . . 19 57 46.0 25.9
Table 145. Average annual deaths, cumulative deaths, percentage of cumulative deaths and average age-specifi c death rate for the 3
leading causes of death in non-Hispanic white females 15-24 years old, Chicago, 2007-2009
Rank Cause of death ICD-10 codeAverage
annual deathsCumulative
deaths
Percent of cumulative
deaths
Averageage-specifi cdeath rate
. . . All causes . . . 10 31 . . . 18.5
1 Accidents (unintentional injuries) V01-X59,Y85-Y86 3 10 32.3 6.0
2 Intentional self-harm (suicide) X60-X84,Y87.0 2 6 19.4 3.6
3 Malignant neoplasms C00-C97 2 5 16.1 3.0
. . . All other causes . . . 3 10 32.3 6.0
Table 142. Average annual deaths, cumulative deaths, percentage of cumulative deaths and average age-specifi c death rate for the 3
leading causes of death in non-Hispanic whites 15-24 years old, Chicago, 2007-2009
Rank Cause of death ICD-10 codeAverage
annual deathsCumulative
deaths
Percent of cumulative
deaths
Averageage-specifi cdeath rate
. . . All causes . . . 44 132 . . . 41.5
1 Accidents (unintentional injuries) V01-X59,Y85-Y86 17 52 39.4 16.3
2 Intentional self-harm (suicide) X60-X84,Y87.0 8 23 17.4 7.2
3 Assault (homicide) X85-Y09,Y87.1 7 20 15.2 6.3
. . . All other causes . . . 12 37 28.0 11.6
Age Group: 15-24 Years by Race-Ethnicity and Sex
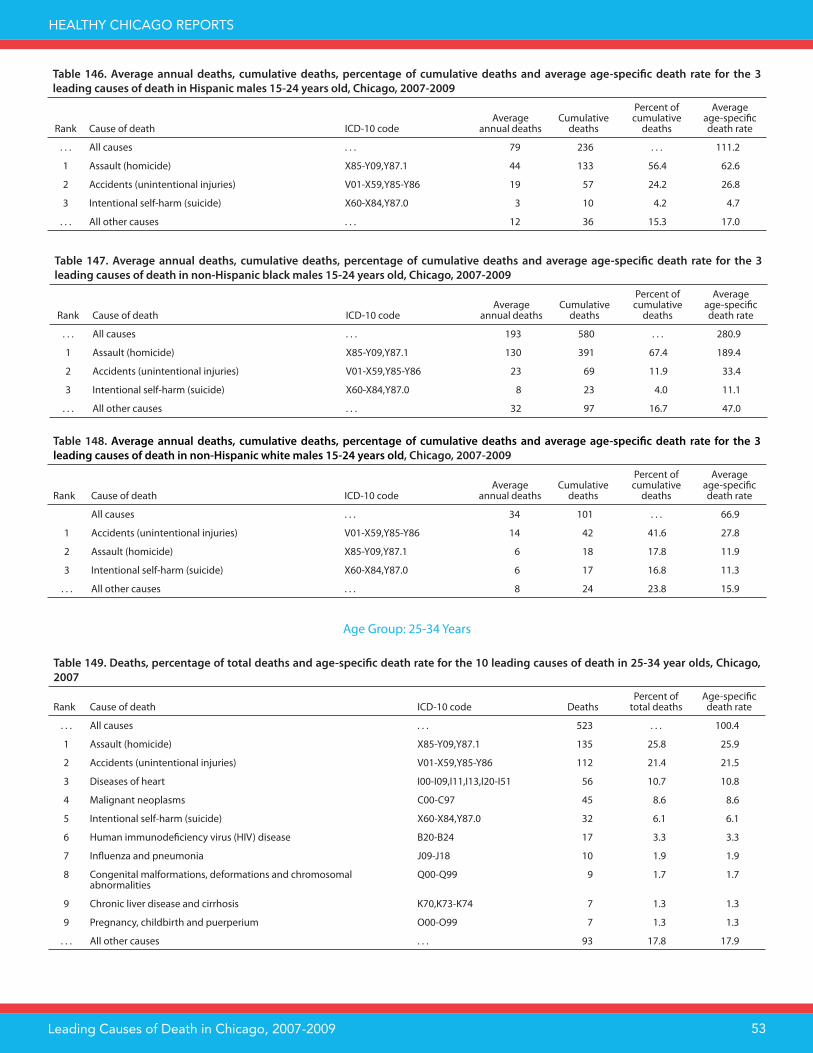
HEALTHY CHICAGO REPORTS
Leading Causes of Death in Chicago, 2007-2009 53
Table 149. Deaths, percentage of total deaths and age-specifi c death rate for the 10 leading causes of death in 25-34 year olds, Chicago,
2007
Rank Cause of death ICD-10 code DeathsPercent of
total deathsAge-specifi cdeath rate
. . . All causes . . . 523 . . . 100.4
1 Assault (homicide) X85-Y09,Y87.1 135 25.8 25.9
2 Accidents (unintentional injuries) V01-X59,Y85-Y86 112 21.4 21.5
3 Diseases of heart I00-I09,I11,I13,I20-I51 56 10.7 10.8
4 Malignant neoplasms C00-C97 45 8.6 8.6
5 Intentional self-harm (suicide) X60-X84,Y87.0 32 6.1 6.1
6 Human immunodefi ciency virus (HIV) disease B20-B24 17 3.3 3.3
7 Infl uenza and pneumonia J09-J18 10 1.9 1.9
8 Congenital malformations, deformations and chromosomal abnormalities
Q00-Q99 9 1.7 1.7
9 Chronic liver disease and cirrhosis K70,K73-K74 7 1.3 1.3
9 Pregnancy, childbirth and puerperium O00-O99 7 1.3 1.3
. . . All other causes . . . 93 17.8 17.9
Table 148. Average annual deaths, cumulative deaths, percentage of cumulative deaths and average age-specifi c death rate for the 3
leading causes of death in non-Hispanic white males 15-24 years old, Chicago, 2007-2009
Rank Cause of death ICD-10 codeAverage
annual deathsCumulative
deaths
Percent of cumulative
deaths
Averageage-specifi cdeath rate
All causes . . . 34 101 . . . 66.9
1 Accidents (unintentional injuries) V01-X59,Y85-Y86 14 42 41.6 27.8
2 Assault (homicide) X85-Y09,Y87.1 6 18 17.8 11.9
3 Intentional self-harm (suicide) X60-X84,Y87.0 6 17 16.8 11.3
. . . All other causes . . . 8 24 23.8 15.9
Table 147. Average annual deaths, cumulative deaths, percentage of cumulative deaths and average age-specifi c death rate for the 3
leading causes of death in non-Hispanic black males 15-24 years old, Chicago, 2007-2009
Rank Cause of death ICD-10 codeAverage
annual deathsCumulative
deaths
Percent of cumulative
deaths
Averageage-specifi cdeath rate
. . . All causes . . . 193 580 . . . 280.9
1 Assault (homicide) X85-Y09,Y87.1 130 391 67.4 189.4
2 Accidents (unintentional injuries) V01-X59,Y85-Y86 23 69 11.9 33.4
3 Intentional self-harm (suicide) X60-X84,Y87.0 8 23 4.0 11.1
. . . All other causes . . . 32 97 16.7 47.0
Table 146. Average annual deaths, cumulative deaths, percentage of cumulative deaths and average age-specifi c death rate for the 3
leading causes of death in Hispanic males 15-24 years old, Chicago, 2007-2009
Rank Cause of death ICD-10 codeAverage
annual deathsCumulative
deaths
Percent of cumulative
deaths
Averageage-specifi cdeath rate
. . . All causes . . . 79 236 . . . 111.2
1 Assault (homicide) X85-Y09,Y87.1 44 133 56.4 62.6
2 Accidents (unintentional injuries) V01-X59,Y85-Y86 19 57 24.2 26.8
3 Intentional self-harm (suicide) X60-X84,Y87.0 3 10 4.2 4.7
. . . All other causes . . . 12 36 15.3 17.0
Age Group: 25-34 Years

HEALTHY CHICAGO REPORTS
Leading Causes of Death in Chicago, 2007-2009 54
Table 150. Deaths, percentage of total deaths and age-specifi c death rate for the 10 leading causes of death in 25-34 year olds, Chicago,
2008
Rank Cause of death ICD-10 code DeathsPercent of
total deathsAge-specifi cdeath rate
. . . All causes . . . 545 . . . 105.0
1 Assault (homicide) X85-Y09,Y87.1 142 26.1 27.4
2 Accidents (unintentional injuries) V01-X59,Y85-Y86 105 19.3 20.2
3 Diseases of heart I00-I09,I11,I13,I20-I51 62 11.4 11.9
4 Intentional self-harm (suicide) X60-X84,Y87.0 44 8.1 8.5
5 Malignant neoplasms C00-C97 39 7.2 7.5
6 Human immunodefi ciency virus (HIV) disease B20-B24 16 2.9 3.1
7 Chronic lower respiratory diseases J40-J47 11 2.0 2.1
8 Septicemia A40-A41 8 1.5 1.5
9 Cerebrovascular diseases I60-I69 8 1.5 1.5
10 Diabetes mellitus E10-E14 7 1.3 1.3
. . . All other causes . . . 103 18.9 19.8
Table 151. Deaths, percentage of total deaths and age-specifi c death rate for the 10 leading causes of death in 25-34 year olds, Chicago,
2009
Rank Cause of death ICD-10 code DeathsPercent of
total deathsAge-specifi cdeath rate
. . . All causes . . . 500 . . . 96.7
1 Assault (homicide) X85-Y09,Y87.1 122 24.4 23.6
2 Accidents (unintentional injuries) V01-X59,Y85-Y86 99 19.8 19.1
3 Diseases of heart I00-I09,I11,I13,I20-I51 69 13.8 13.3
4 Intentional self-harm (suicide) X60-X84,Y87.0 42 8.4 8.1
5 Malignant neoplasms C00-C97 40 8.0 7.7
6 Septicemia A40-A41 12 2.4 2.3
7 Human immunodefi ciency virus (HIV) disease B20-B24 11 2.2 2.1
8 Chronic lower respiratory diseases J40-J47 10 2.0 1.9
9 Infl uenza and pneumonia J09-J18 8 1.6 1.5
9 Chronic liver disease and cirrhosis K70,K73-K74 8 1.6 1.5
9 Congenital malformations, deformations and chromosomal abnormalities
Q00-Q99 8 1.6 1.5
. . . All other causes . . . 71 14.2 13.7
Table 152. Average annual deaths, cumulative deaths, percentage of cumulative deaths and average age-specifi c death rate for the 5
leading causes of death in females 25-34 years old, Chicago, 2007-2009
Rank Cause of death ICD-10 codeAverage
annual deathsCumulative
deaths
Percent of cumulative
deaths
Averageage-specifi cdeath rate
. . . All causes . . . 136 409 . . . 52.1
1 Diseases of heart I00-I09,I11,I13,I20-I51 21 62 15.2 7.9
2 Malignant neoplasms C00-C97 20 61 14.9 7.8
3 Accidents (unintentional injuries) V01-X59,Y85-Y86 17 51 12.5 6.5
4 Assault (homicide) X85-Y09,Y87.1 11 34 8.3 4.3
5 Intentional self-harm (suicide) X60-X84,Y87.0 10 30 7.3 3.8
. . . All other causes . . . 57 171 41.8 21.8
Age Group: 25-34 Years by Sex

HEALTHY CHICAGO REPORTS
Leading Causes of Death in Chicago, 2007-2009 55
Table 153. Average annual deaths, cumulative deaths, percentage of cumulative deaths and average age-specifi c death rate for the 5
leading causes of death in males 25-34 years old, Chicago, 2007-2009
Rank Cause of death ICD-10 codeAverage
annual deathsCumulative
deaths
Percent of cumulative
deaths
Averageage-specifi cdeath rate
. . . All causes . . . 386 1,159 . . . 150.1
1 Assault (homicide) X85-Y09,Y87.1 122 365 31.5 47.3
2 Accidents (unintentional injuries) V01-X59,Y85-Y86 88 265 22.9 34.3
3 Diseases of heart I00-I09,I11,I13,I20-I51 42 125 10.8 16.2
4 Intentional self-harm (suicide) X60-X84,Y87.0 29 88 7.6 11.4
5 Malignant neoplasms C00-C97 21 63 5.4 8.2
. . . All other causes . . . 84 253 21.8 32.8
Table 155. Average annual deaths, cumulative deaths, percentage of cumulative deaths and average age-specifi c death rate for the 5
leading causes of death in non-Hispanic blacks 25-34 years old, Chicago, 2007-2009
Rank Cause of death ICD-10 codeAverage
annual deathsCumulative
deaths
Percent of cumulative
deaths
Averageage-specifi cdeath rate
. . . All causes . . . 287 860 . . . 241.4
1 Assault (homicide) X85-Y09,Y87.1 101 304 35.3 85.3
2 Diseases of heart I00-I09,I11,I13,I20-I51 40 121 14.1 34.0
3 Accidents (unintentional injuries) V01-X59,Y85-Y86 37 110 12.8 30.9
4 Malignant neoplasms C00-C97 16 48 5.6 13.5
5 Human immunodefi ciency virus (HIV) disease B20-B24 13 39 4.5 10.9
. . . All other causes . . . 79 238 27.7 66.8
Table 156. Average annual deaths, cumulative deaths, percentage of cumulative deaths and average age-specifi c death rate for the 5
leading causes of death in non-Hispanic whites 25-34 years old, Chicago, 2007-2009
Rank Cause of death ICD-10 codeAverage
annual deathsCumulative
deaths
Percent of cumulative
deaths
Averageage-specifi cdeath rate
. . . All causes . . . 114 343 . . . 53.7
1 Accidents (unintentional injuries) V01-X59,Y85-Y86 34 103 30.0 16.1
2 Intentional self-harm (suicide) X60-X84,Y87.0 20 60 17.5 9.4
3 Diseases of heart I00-I09,I11,I13,I20-I51 14 42 12.2 6.6
4 Malignant neoplasms C00-C97 12 37 10.8 5.8
5 Assault (homicide) X85-Y09,Y87.1 8 24 7.0 3.8
. . . All other causes . . . 26 77 22.4 12.1
Table 154. Average annual deaths, cumulative deaths, percentage of cumulative deaths and average age-specifi c death rate for the 5
leading causes of death in Hispanics 25-34 years old, Chicago, 2007-2009
Rank Cause of death ICD-10 codeAverage
annual deathsCumulative
deaths
Percent of cumulative
deaths
Averageage-specifi cdeath rate
. . . All causes . . . 111 334 . . . 78.0
1 Accidents (unintentional injuries) V01-X59,Y85-Y86 33 98 29.3 22.9
2 Assault (homicide) X85-Y09,Y87.1 24 71 21.3 16.6
3 Malignant neoplasms C00-C97 10 30 9.0 7.0
4 Diseases of heart I00-I09,I11,I13,I20-I51 8 23 6.9 5.4
5 Intentional self-harm (suicide) X60-X84,Y87.0 7 22 6.6 5.1
. . . All other causes . . . 30 90 26.9 21.0
Age Group: 25-34 Years by Race-Ethnicity

HEALTHY CHICAGO REPORTS
Leading Causes of Death in Chicago, 2007-2009 56
Table 157. Average annual deaths, cumulative deaths, percentage of cumulative deaths and average age-specifi c death rate for the 5
leading causes of death in Hispanic females 25-34 years old, Chicago, 2007-2009
Rank Cause of death ICD-10 codeAverage
annual deathsCumulative
deaths
Percent of cumulative
deaths
Averageage-specifi cdeath rate
. . . All causes . . . 23 68 . . . 33.7
1 Malignant neoplasms C00-C97 4 13 19.1 6.4
2 Assault (homicide) X85-Y09,Y87.1 4 11 16.2 5.5
3 Accidents (unintentional injuries) V01-X59,Y85-Y86 3 10 14.7 5.0
4 Diseases of heart I00-I09,I11,I13,I20-I51 2 5 7.4 2.5
5 Diabetes mellitus E10-E14 -- -- -- --
5 Infl uenza and pneumonia J09-J18 -- -- -- --
5 Chronic liver disease and cirrhosis K70,K73-K74 -- -- -- --
5 Pregnancy, childbirth and puerperium O00-O99 -- -- -- --
. . . All other causes . . . 7 21 30.9 10.4
Table 159. Average annual deaths, cumulative deaths, percentage of cumulative deaths and average age-specifi c death rate for the 5
leading causes of death in non-Hispanic white females 25-34 years old, Chicago, 2007-2009
Rank Cause of death ICD-10 codeAverage
annual deathsCumulative
deaths
Percent of cumulative
deaths
Averageage-specifi cdeath rate
. . . All causes . . . 34 102 . . . 32.3
1 Intentional self-harm (suicide) X60-X84,Y87.0 7 21 20.6 6.6
2 Accidents (unintentional injuries) V01-X59,Y85-Y86 6 17 16.7 5.4
3 Malignant neoplasms C00-C97 5 16 15.7 5.1
4 Diseases of heart I00-I09,I11,I13,I20-I51 5 15 14.7 4.7
5 Assault (homicide) X85-Y09,Y87.1 2 6 5.9 1.9
. . . All other causes . . . 9 27 26.5 8.5
Table 158. Average annual deaths, cumulative deaths, percentage of cumulative deaths and average age-specifi c death rate for the 5
leading causes of death in non-Hispanic black females 25-34 years old, Chicago, 2007-2009
Rank Cause of death ICD-10 codeAverage
annual deathsCumulative
deaths
Percent of cumulative
deaths
Averageage-specifi cdeath rate
. . . All causes . . . 77 231 . . . 116.4
1 Diseases of heart I00-I09,I11,I13,I20-I51 14 42 18.2 21.2
2 Malignant neoplasms C00-C97 9 28 12.1 14.1
3 Accidents (unintentional injuries) V01-X59,Y85-Y86 8 24 10.4 12.1
4 Human immunodefi ciency virus (HIV) disease B20-B24 6 17 7.4 8.6
4 Assault (homicide) X85-Y09,Y87.1 6 17 7.4 8.6
. . . All other causes . . . 34 103 44.6 51.9
Age Group: 25-34 Years by Race-Ethnicity and Sex

HEALTHY CHICAGO REPORTS
Leading Causes of Death in Chicago, 2007-2009 57
Table 161. Average annual deaths, cumulative deaths, percentage of cumulative deaths and average age-specifi c death rate for the 5
leading causes of death in non-Hispanic black males 25-34 years old, Chicago, 2007-2009
Rank Cause of death ICD-10 codeAverage
annual deathsCumulative
deaths
Percent of cumulative
deaths
Averageage-specifi cdeath rate
. . . All causes . . . 210 629 . . . 398.6
1 Assault (homicide) X85-Y09,Y87.1 96 287 45.6 181.9
2 Accidents (unintentional injuries) V01-X59,Y85-Y86 29 86 13.7 54.5
3 Diseases of heart I00-I09,I11,I13,I20-I51 26 79 12.6 50.1
4 Intentional self-harm (suicide) X60-X84,Y87.0 8 24 3.8 15.2
5 Human immunodefi ciency virus (HIV) disease B20-B24 7 22 3.5 13.9
. . . All other causes . . . 44 131 20.8 83.0
Table 162. Average annual deaths, cumulative deaths, percentage of cumulative deaths and average age-specifi c death rate for the 5 leading causes of death in non-Hispanic white males 25-34 years old, Chicago, 2007-2009
Rank Cause of death ICD-10 codeAverage
annual deathsCumulative
deaths
Percent of cumulative
deaths
Averageage-specifi cdeath rate
. . . All causes . . . 80 241 . . . 74.8
1 Accidents (unintentional injuries) V01-X59,Y85-Y86 29 86 35.7 26.7
2 Intentional self-harm (suicide) X60-X84,Y87.0 13 39 16.2 12.1
3 Diseases of heart I00-I09,I11,I13,I20-I51 9 27 11.2 8.4
4 Malignant neoplasms C00-C97 7 21 8.7 6.5
5 Assault (homicide) X85-Y09,Y87.1 6 18 7.5 5.6
. . . All other causes . . . 17 50 20.7 15.5
Table 160. Average annual deaths, cumulative deaths, percentage of cumulative deaths and average age-specifi c death rate for the 5
leading causes of death in Hispanic males 25-34 years old, Chicago, 2007-2009
Rank Cause of death ICD-10 codeAverage
annual deathsCumulative
deaths
Percent of cumulative
deaths
Averageage-specifi cdeath rate
. . . All causes . . . 89 266 . . . 117.3
1 Accidents (unintentional injuries) V01-X59,Y85-Y86 29 88 33.1 38.8
2 Assault (homicide) X85-Y09,Y87.1 20 60 22.6 26.5
3 Intentional self-harm (suicide) X60-X84,Y87.0 7 21 7.9 9.3
4 Diseases of heart I00-I09,I11,I13,I20-I51 6 18 6.8 7.9
5 Malignant neoplasms C00-C97 6 17 6.4 7.5
. . . All other causes . . . 21 62 23.3 27.3

HEALTHY CHICAGO REPORTS
Leading Causes of Death in Chicago, 2007-2009 58
Table 164. Deaths, percentage of total deaths and age-specifi c death rate for the 10 leading causes of death in 35-44 year olds, Chicago,
2008
Rank Cause of death ICD-10 code DeathsPercent of
total deathsAge-specifi cdeath rate
. . . All causes . . . 857 . . . 220.2
1 Accidents (unintentional injuries) V01-X59,Y85-Y86 154 18.0 39.6
2 Diseases of heart I00-I09,I11,I13,I20-I51 134 15.6 34.4
3 Malignant neoplasms C00-C97 127 14.8 32.6
4 Human immunodefi ciency virus (HIV) disease B20-B24 59 6.9 15.2
5 Assault (homicide) X85-Y09,Y87.1 47 5.5 12.1
6 Intentional self-harm (suicide) X60-X84,Y87.0 38 4.4 9.8
7 Chronic liver disease and cirrhosis K70,K73-K74 29 3.4 7.5
8 Diabetes mellitus E10-E14 24 2.8 6.2
9 Chronic lower respiratory diseases J40-J47 22 2.6 5.7
10 Cerebrovascular diseases I60-I69 21 2.5 5.4
. . . All other causes . . . 202 23.6 51.9
Table 165. Deaths, percentage of total deaths and age-specifi c death rate for the 10 leading causes of death in 35-44 year olds, Chicago,
2009
Rank Cause of death ICD-10 code DeathsPercent of
total deathsAge-specifi cdeath rate
. . . All causes . . . 818 . . . 213.2
1 Diseases of heart I00-I09,I11,I13,I20-I51 148 18.1 38.6
2 Accidents (unintentional injuries) V01-X59,Y85-Y86 145 17.7 37.8
3 Malignant neoplasms C00-C97 118 14.4 30.8
4 Assault (homicide) X85-Y09,Y87.1 62 7.6 16.2
5 Human immunodefi ciency virus (HIV) disease B20-B24 41 5.0 10.7
6 Intentional self-harm (suicide) X60-X84,Y87.0 32 3.9 8.3
7 Chronic liver disease and cirrhosis K70,K73-K74 30 3.7 7.8
8 Chronic lower respiratory diseases J40-J47 22 2.7 5.7
9 Cerebrovascular diseases I60-I69 21 2.6 5.5
10 Nephritis, nephrotic syndrome and nephrosis N00-N07,N17-N19,N25-N27 19 2.3 5.0
. . . All other causes . . . 180 22.0 46.9
Table 163. Deaths, percentage of total deaths and age-specifi c death rate for the 10 leading causes of death in 35-44 year olds, Chicago,
2007
Rank Cause of death ICD-10 code DeathsPercent of
total deathsAge-specifi cdeath rate
. . . All causes . . . 897 . . . 227.3
1 Diseases of heart I00-I09,I11,I13,I20-I51 160 17.8 40.5
2 Accidents (unintentional injuries) V01-X59,Y85-Y86 157 17.5 39.8
3 Malignant neoplasms C00-C97 127 14.2 32.2
4 Human immunodefi ciency virus (HIV) disease B20-B24 65 7.2 16.5
5 Assault (homicide) X85-Y09,Y87.1 47 5.2 11.9
6 Intentional self-harm (suicide) X60-X84,Y87.0 37 4.1 9.4
7 Chronic liver disease and cirrhosis K70,K73-K74 31 3.5 7.9
8 Cerebrovascular diseases I60-I69 26 2.9 6.6
9 Diabetes mellitus E10-E14 21 2.3 5.3
10 Infl uenza and pneumonia J09-J18 20 2.2 5.1
. . . All other causes . . . 206 23.0 52.2
Age Group: 35-44 Years

HEALTHY CHICAGO REPORTS
Leading Causes of Death in Chicago, 2007-2009 59
Table 167. Average annual deaths, cumulative deaths, percentage of cumulative deaths and average age-specifi c death rate for the 5
leading causes of death in males 35-44 years old, Chicago, 2007-2009
Rank Cause of death ICD-10 codeAverage
annual deathsCumulative
deaths
Percent of cumulative
deaths
Averageage-specifi cdeath rate
. . . All causes . . . 545 1,635 . . . 278.3
1 Accidents (unintentional injuries) V01-X59,Y85-Y86 110 330 20.2 56.2
2 Diseases of heart I00-I09,I11,I13,I20-I51 101 302 18.5 51.4
3 Malignant neoplasms C00-C97 47 141 8.6 24.0
4 Assault (homicide) X85-Y09,Y87.1 45 136 8.3 23.2
5 Human immunodefi ciency virus (HIV) disease B20-B24 43 130 8.0 22.1
. . . All other causes . . . 199 596 36.5 101.5
Table 168. Average annual deaths, cumulative deaths, percentage of cumulative deaths and average age-specifi c death rate for the 5
leading causes of death in Hispanics 35-44 years old, Chicago, 2007-2009
Rank Cause of death ICD-10 codeAverage
annual deathsCumulative
deaths
Percent of cumulative
deaths
Averageage-specifi cdeath rate
. . . All causes . . . 141 423 . . . 124.1
1 Accidents (unintentional injuries) V01-X59,Y85-Y86 31 93 22.0 27.3
2 Malignant neoplasms C00-C97 24 73 17.3 21.4
3 Diseases of heart I00-I09,I11,I13,I20-I51 14 41 9.7 12.0
4 Chronic liver disease and cirrhosis K70,K73-K74 10 29 6.9 8.5
5 Assault (homicide) X85-Y09,Y87.1 10 29 6.9 8.5
. . . All other causes . . . 53 158 37.4 46.4
Table 169. Average annual deaths, cumulative deaths, percentage of cumulative deaths and average age-specifi c death rate for the 5
leading causes of death in non-Hispanic blacks 35-44 years old, Chicago, 2007-2009
Rank Cause of death ICD-10 codeAverage
annual deathsCumulative
deaths
Percent of cumulative
deaths
Averageage-specifi cdeath rate
. . . All causes . . . 491 1,474 . . . 415.4
1 Diseases of heart I00-I09,I11,I13,I20-I51 97 291 19.7 82.0
2 Accidents (unintentional injuries) V01-X59,Y85-Y86 76 227 15.4 64.0
3 Malignant neoplasms C00-C97 63 190 12.9 53.5
4 Human immunodefi ciency virus (HIV) disease B20-B24 41 123 8.3 34.7
5 Assault (homicide) X85-Y09,Y87.1 38 114 7.7 32.1
. . . All other causes . . . 176 529 35.9 149.1
Table 166. Average annual deaths, cumulative deaths, percentage of cumulative deaths and average age-specifi c death rate for the 5
leading causes of death in females 35-44 years old, Chicago, 2007-2009
Rank Cause of death ICD-10 codeAverage
annual deathsCumulative
deaths
Percent of cumulative
deaths
Averageage-specifi cdeath rate
. . . All causes . . . 312 937 . . . 161.5
1 Malignant neoplasms C00-C97 77 231 24.7 39.8
2 Diseases of heart I00-I09,I11,I13,I20-I51 47 140 14.9 24.1
3 Accidents (unintentional injuries) V01-X59,Y85-Y86 42 126 13.4 21.7
4 Human immunodefi ciency virus (HIV) disease B20-B24 12 35 3.7 6.0
5 Cerebrovascular diseases I60-I69 11 32 3.4 5.5
. . . All other causes . . . 124 373 39.8 64.3
Age Group: 35-44 Years by Sex
Age Group: 35-44 Years by Race-Ethnicity
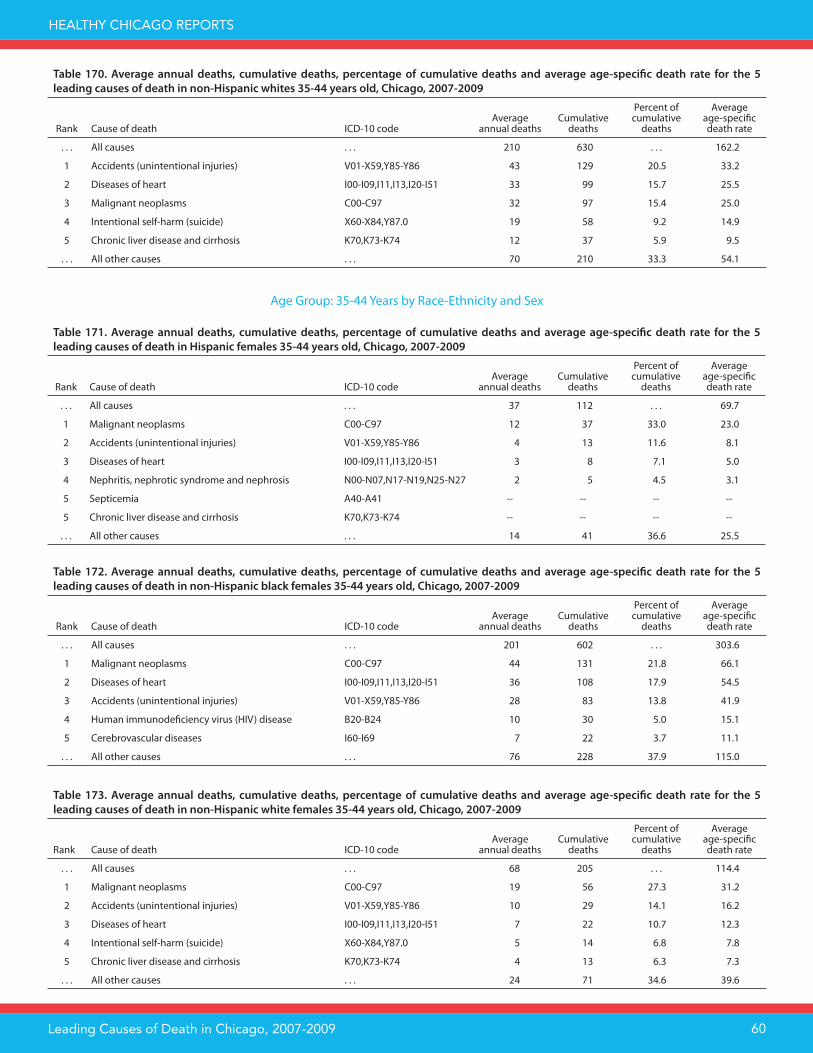
HEALTHY CHICAGO REPORTS
Leading Causes of Death in Chicago, 2007-2009 60
Table 171. Average annual deaths, cumulative deaths, percentage of cumulative deaths and average age-specifi c death rate for the 5
leading causes of death in Hispanic females 35-44 years old, Chicago, 2007-2009
Rank Cause of death ICD-10 codeAverage
annual deathsCumulative
deaths
Percent of cumulative
deaths
Averageage-specifi cdeath rate
. . . All causes . . . 37 112 . . . 69.7
1 Malignant neoplasms C00-C97 12 37 33.0 23.0
2 Accidents (unintentional injuries) V01-X59,Y85-Y86 4 13 11.6 8.1
3 Diseases of heart I00-I09,I11,I13,I20-I51 3 8 7.1 5.0
4 Nephritis, nephrotic syndrome and nephrosis N00-N07,N17-N19,N25-N27 2 5 4.5 3.1
5 Septicemia A40-A41 -- -- -- --
5 Chronic liver disease and cirrhosis K70,K73-K74 -- -- -- --
. . . All other causes . . . 14 41 36.6 25.5
Table 172. Average annual deaths, cumulative deaths, percentage of cumulative deaths and average age-specifi c death rate for the 5
leading causes of death in non-Hispanic black females 35-44 years old, Chicago, 2007-2009
Rank Cause of death ICD-10 codeAverage
annual deathsCumulative
deaths
Percent of cumulative
deaths
Averageage-specifi cdeath rate
. . . All causes . . . 201 602 . . . 303.6
1 Malignant neoplasms C00-C97 44 131 21.8 66.1
2 Diseases of heart I00-I09,I11,I13,I20-I51 36 108 17.9 54.5
3 Accidents (unintentional injuries) V01-X59,Y85-Y86 28 83 13.8 41.9
4 Human immunodefi ciency virus (HIV) disease B20-B24 10 30 5.0 15.1
5 Cerebrovascular diseases I60-I69 7 22 3.7 11.1
. . . All other causes . . . 76 228 37.9 115.0
Table 173. Average annual deaths, cumulative deaths, percentage of cumulative deaths and average age-specifi c death rate for the 5
leading causes of death in non-Hispanic white females 35-44 years old, Chicago, 2007-2009
Rank Cause of death ICD-10 codeAverage
annual deathsCumulative
deaths
Percent of cumulative
deaths
Averageage-specifi cdeath rate
. . . All causes . . . 68 205 . . . 114.4
1 Malignant neoplasms C00-C97 19 56 27.3 31.2
2 Accidents (unintentional injuries) V01-X59,Y85-Y86 10 29 14.1 16.2
3 Diseases of heart I00-I09,I11,I13,I20-I51 7 22 10.7 12.3
4 Intentional self-harm (suicide) X60-X84,Y87.0 5 14 6.8 7.8
5 Chronic liver disease and cirrhosis K70,K73-K74 4 13 6.3 7.3
. . . All other causes . . . 24 71 34.6 39.6
Table 170. Average annual deaths, cumulative deaths, percentage of cumulative deaths and average age-specifi c death rate for the 5
leading causes of death in non-Hispanic whites 35-44 years old, Chicago, 2007-2009
Rank Cause of death ICD-10 codeAverage
annual deathsCumulative
deaths
Percent of cumulative
deaths
Averageage-specifi cdeath rate
. . . All causes . . . 210 630 . . . 162.2
1 Accidents (unintentional injuries) V01-X59,Y85-Y86 43 129 20.5 33.2
2 Diseases of heart I00-I09,I11,I13,I20-I51 33 99 15.7 25.5
3 Malignant neoplasms C00-C97 32 97 15.4 25.0
4 Intentional self-harm (suicide) X60-X84,Y87.0 19 58 9.2 14.9
5 Chronic liver disease and cirrhosis K70,K73-K74 12 37 5.9 9.5
. . . All other causes . . . 70 210 33.3 54.1
Age Group: 35-44 Years by Race-Ethnicity and Sex

HEALTHY CHICAGO REPORTS
Leading Causes of Death in Chicago, 2007-2009 61
Table 175. Average annual deaths, cumulative deaths, percentage of cumulative deaths and average age-specifi c death rate for the 5
leading causes of death in non-Hispanic black males 35-44 years old, Chicago, 2007-2009
Rank Cause of death ICD-10 codeAverage
annual deathsCumulative
deaths
Percent of cumulative
deaths
Averageage-specifi cdeath rate
. . . All causes . . . 291 872 . . . 557.1
1 Diseases of heart I00-I09,I11,I13,I20-I51 61 183 21.0 116.9
2 Accidents (unintentional injuries) V01-X59,Y85-Y86 48 144 16.5 92.0
3 Assault (homicide) X85-Y09,Y87.1 33 100 11.5 63.9
4 Human immunodefi ciency virus (HIV) disease B20-B24 31 93 10.7 59.4
5 Malignant neoplasms C00-C97 20 59 6.8 37.7
. . . All other causes . . . 98 293 33.6 187.2
Table 176. Average annual deaths, cumulative deaths, percentage of cumulative deaths and average age-specifi c death rate for the 5
leading causes of death in non-Hispanic white males 35-44 years old, Chicago, 2007-2009
Rank Cause of death ICD-10 codeAverage
annual deathsCumulative
deaths
Percent of cumulative
deaths
Averageage-specifi cdeath rate
. . . All causes . . . 142 425 . . . 203.1
1 Accidents (unintentional injuries) V01-X59,Y85-Y86 33 100 23.5 47.8
2 Diseases of heart I00-I09,I11,I13,I20-I51 26 77 18.1 36.8
3 Intentional self-harm (suicide) X60-X84,Y87.0 15 44 10.4 21.0
4 Malignant neoplasms C00-C97 14 41 9.6 19.6
5 Chronic liver disease and cirrhosis K70,K73-K74 8 24 5.6 11.5
. . . All other causes . . . 46 139 32.7 66.4
Table 174. Average annual deaths, cumulative deaths, percentage of cumulative deaths and average age-specifi c death rate for the 5
leading causes of death in Hispanic males 35-44 years old, Chicago, 2007-2009
Rank Cause of death ICD-10 codeAverage
annual deathsCumulative
deaths
Percent of cumulative
deaths
Averageage-specifi cdeath rate
. . . All causes . . . 104 311 . . . 172.6
1 Accidents (unintentional injuries) V01-X59,Y85-Y86 27 80 25.7 44.4
2 Malignant neoplasms C00-C97 12 36 11.6 20.0
3 Diseases of heart I00-I09,I11,I13,I20-I51 11 33 10.6 18.3
4 Assault (homicide) X85-Y09,Y87.1 9 28 9.0 15.5
5 Chronic liver disease and cirrhosis K70,K73-K74 -- -- -- --
. . . All other causes . . . 36 109 35.0 60.5

HEALTHY CHICAGO REPORTS
Leading Causes of Death in Chicago, 2007-2009 62
Table 178. Deaths, percentage of total deaths and age-specifi c death rate for the 10 leading causes of death in 45-54 year olds, Chicago,
2008
Rank Cause of death ICD-10 code DeathsPercent of
total deathsAge-specifi cdeath rate
. . . All causes . . . 2,106 . . . 624.8
1 Diseases of heart I00-I09,I11,I13,I20-I51 545 25.9 161.7
2 Malignant neoplasms C00-C97 514 24.4 152.5
3 Accidents (unintentional injuries) V01-X59,Y85-Y86 179 8.5 53.1
4 Chronic liver disease and cirrhosis K70,K73-K74 85 4.0 25.2
5 Cerebrovascular diseases I60-I69 81 3.8 24.0
6 Human immunodefi ciency virus (HIV) disease B20-B24 74 3.5 22.0
7 Diabetes mellitus E10-E14 70 3.3 20.8
8 Nephritis, nephrotic syndrome and nephrosis N00-N07,N17-N19,N25-N27 51 2.4 15.1
9 Septicemia A40-A41 49 2.3 14.5
10 Intentional self-harm (suicide) X60-X84,Y87.0 43 2.0 12.8
. . . All other causes . . . 415 19.7 123.1
Table 179. Deaths, percentage of total deaths and age-specifi c death rate for the 10 leading causes of death in 45-54 year olds, Chicago,
2009
Rank Cause of death ICD-10 code DeathsPercent of
total deathsAge-specifi cdeath rate
. . . All causes . . . 1,949 . . . 576.8
1 Diseases of heart I00-I09,I11,I13,I20-I51 536 27.5 158.6
2 Malignant neoplasms C00-C97 468 24.0 138.5
3 Accidents (unintentional injuries) V01-X59,Y85-Y86 154 7.9 45.6
4 Chronic liver disease and cirrhosis K70,K73-K74 73 3.7 21.6
5 Diabetes mellitus E10-E14 70 3.6 20.7
6 Cerebrovascular diseases I60-I69 68 3.5 20.1
7 Human immunodefi ciency virus (HIV) disease B20-B24 58 3.0 17.2
8 Chronic lower respiratory diseases J40-J47 44 2.3 13.0
9 Infl uenza and pneumonia J09-J18 43 2.2 12.7
10 Intentional self-harm (suicide) X60-X84,Y87.0 41 2.1 12.1
. . . All other causes . . . 394 20.2 116.6
Table 177. Deaths, percentage of total deaths and age-specifi c death rate for the 10 leading causes of death in 45-54 year olds, Chicago,
2007
Rank Cause of death (ICD-10) ICD-10 code DeathsPercent of
total deathsAge-specifi cdeath rate
. . . All causes . . . 2,081 . . . 618.9
1 Diseases of heart I00-I09,I11,I13,I20-I51 541 26.0 160.9
2 Malignant neoplasms C00-C97 485 23.3 144.2
3 Accidents (unintentional injuries) V01-X59,Y85-Y86 180 8.6 53.5
4 Chronic liver disease and cirrhosis K70,K73-K74 95 4.6 28.3
5 Cerebrovascular diseases I60-I69 90 4.3 26.8
6 Human immunodefi ciency virus (HIV) disease B20-B24 70 3.4 20.8
7 Diabetes mellitus E10-E14 64 3.1 19.0
8 Nephritis, nephrotic syndrome and nephrosis N00-N07,N17-N19,N25-N27 59 2.8 17.5
9 Intentional self-harm (suicide) X60-X84,Y87.0 41 2.0 12.2
10 Chronic lower respiratory diseases J40-J47 40 1.9 11.9
. . . All other causes . . . 416 20.0 123.7
Age Group: 45-54 Years
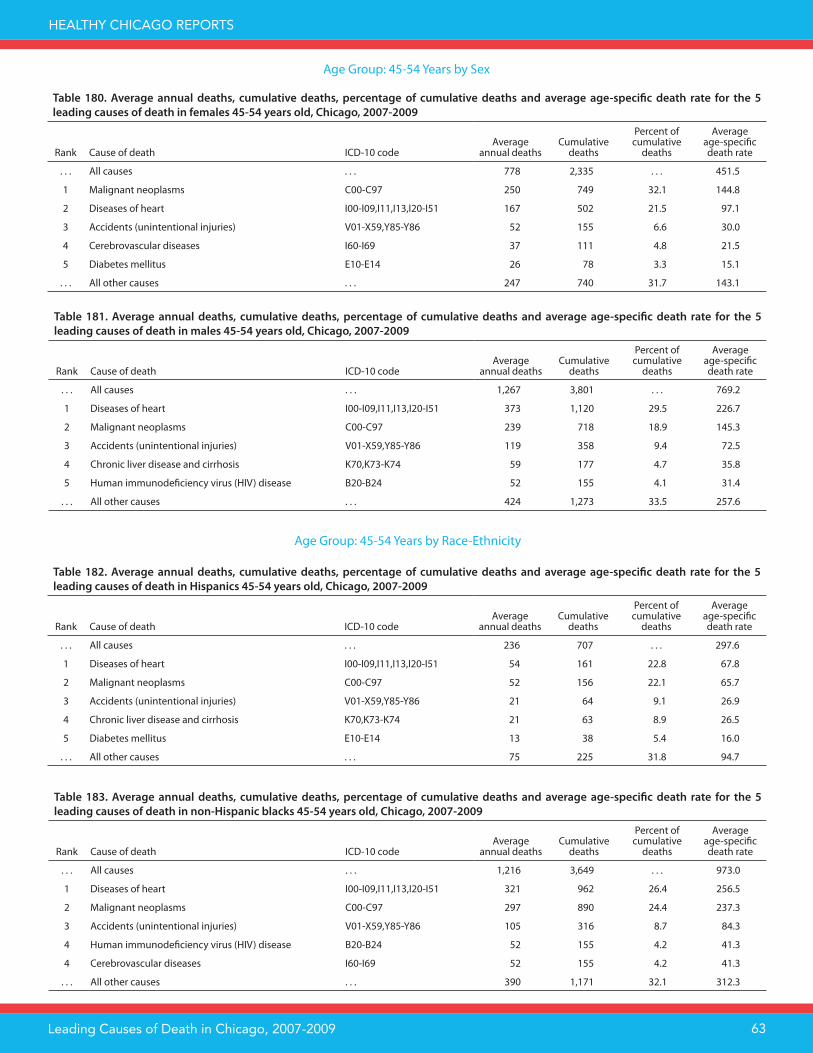
HEALTHY CHICAGO REPORTS
Leading Causes of Death in Chicago, 2007-2009 63
Table 181. Average annual deaths, cumulative deaths, percentage of cumulative deaths and average age-specifi c death rate for the 5
leading causes of death in males 45-54 years old, Chicago, 2007-2009
Rank Cause of death ICD-10 codeAverage
annual deathsCumulative
deaths
Percent of cumulative
deaths
Averageage-specifi cdeath rate
. . . All causes . . . 1,267 3,801 . . . 769.2
1 Diseases of heart I00-I09,I11,I13,I20-I51 373 1,120 29.5 226.7
2 Malignant neoplasms C00-C97 239 718 18.9 145.3
3 Accidents (unintentional injuries) V01-X59,Y85-Y86 119 358 9.4 72.5
4 Chronic liver disease and cirrhosis K70,K73-K74 59 177 4.7 35.8
5 Human immunodefi ciency virus (HIV) disease B20-B24 52 155 4.1 31.4
. . . All other causes . . . 424 1,273 33.5 257.6
Table 182. Average annual deaths, cumulative deaths, percentage of cumulative deaths and average age-specifi c death rate for the 5
leading causes of death in Hispanics 45-54 years old, Chicago, 2007-2009
Rank Cause of death ICD-10 codeAverage
annual deathsCumulative
deaths
Percent of cumulative
deaths
Averageage-specifi cdeath rate
. . . All causes . . . 236 707 . . . 297.6
1 Diseases of heart I00-I09,I11,I13,I20-I51 54 161 22.8 67.8
2 Malignant neoplasms C00-C97 52 156 22.1 65.7
3 Accidents (unintentional injuries) V01-X59,Y85-Y86 21 64 9.1 26.9
4 Chronic liver disease and cirrhosis K70,K73-K74 21 63 8.9 26.5
5 Diabetes mellitus E10-E14 13 38 5.4 16.0
. . . All other causes . . . 75 225 31.8 94.7
Table 183. Average annual deaths, cumulative deaths, percentage of cumulative deaths and average age-specifi c death rate for the 5
leading causes of death in non-Hispanic blacks 45-54 years old, Chicago, 2007-2009
Rank Cause of death ICD-10 codeAverage
annual deathsCumulative
deaths
Percent of cumulative
deaths
Averageage-specifi cdeath rate
. . . All causes . . . 1,216 3,649 . . . 973.0
1 Diseases of heart I00-I09,I11,I13,I20-I51 321 962 26.4 256.5
2 Malignant neoplasms C00-C97 297 890 24.4 237.3
3 Accidents (unintentional injuries) V01-X59,Y85-Y86 105 316 8.7 84.3
4 Human immunodefi ciency virus (HIV) disease B20-B24 52 155 4.2 41.3
4 Cerebrovascular diseases I60-I69 52 155 4.2 41.3
. . . All other causes . . . 390 1,171 32.1 312.3
Table 180. Average annual deaths, cumulative deaths, percentage of cumulative deaths and average age-specifi c death rate for the 5
leading causes of death in females 45-54 years old, Chicago, 2007-2009
Rank Cause of death ICD-10 codeAverage
annual deathsCumulative
deaths
Percent of cumulative
deaths
Averageage-specifi cdeath rate
. . . All causes . . . 778 2,335 . . . 451.5
1 Malignant neoplasms C00-C97 250 749 32.1 144.8
2 Diseases of heart I00-I09,I11,I13,I20-I51 167 502 21.5 97.1
3 Accidents (unintentional injuries) V01-X59,Y85-Y86 52 155 6.6 30.0
4 Cerebrovascular diseases I60-I69 37 111 4.8 21.5
5 Diabetes mellitus E10-E14 26 78 3.3 15.1
. . . All other causes . . . 247 740 31.7 143.1
Age Group: 45-54 Years by Sex
Age Group: 45-54 Years by Race-Ethnicity

HEALTHY CHICAGO REPORTS
Leading Causes of Death in Chicago, 2007-2009 64
Table 185. Average annual deaths, cumulative deaths, percentage of cumulative deaths and average age-specifi c death rate for the 5
leading causes of death in Hispanic females 45-54 years old, Chicago, 2007-2009
Rank Cause of death ICD-10 codeAverage
annual deathsCumulative
deaths
Percent of cumulative
deaths
Averageage-specifi cdeath rate
. . . All causes . . . 80 240 . . . 207.7
1 Malignant neoplasms C00-C97 28 83 34.6 71.8
2 Diseases of heart I00-I09,I11,I13,I20-I51 13 39 16.3 33.8
3 Cerebrovascular diseases I60-I69 6 18 7.5 15.6
4 Diabetes mellitus E10-E14 5 16 6.7 13.8
5 Accidents (unintentional injuries) V01-X59,Y85-Y86 5 14 5.8 12.1
. . . All other causes . . . 23 70 29.2 60.6
Table 186. Average annual deaths, cumulative deaths, percentage of cumulative deaths and average age-specifi c death rate for the 5
leading causes of death in non-Hispanic black females 45-54 years old, Chicago, 2007-2009
Rank Cause of death ICD-10 codeAverage
annual deathsCumulative
deaths
Percent of cumulative
deaths
Averageage-specifi cdeath rate
. . . All causes . . . 522 1,565 . . . 755.0
1 Malignant neoplasms C00-C97 157 472 30.2 227.7
2 Diseases of heart I00-I09,I11,I13,I20-I51 123 369 23.6 178.0
3 Accidents (unintentional injuries) V01-X59,Y85-Y86 36 108 6.9 52.1
4 Cerebrovascular diseases I60-I69 25 75 4.8 36.2
5 Diabetes mellitus E10-E14 16 49 3.1 23.6
. . . All other causes . . . 164 492 31.4 237.4
Table 187. Average annual deaths, cumulative deaths, percentage of cumulative deaths and average age-specifi c death rate for the 5
leading causes of death in non-Hispanic white females 45-54 years old, Chicago, 2007-2009
Rank Cause of death ICD-10 codeAverage
annual deathsCumulative
deaths
Percent of cumulative
deaths
Averageage-specifi cdeath rate
. . . All causes . . . 166 498 . . . 307.6
1 Malignant neoplasms C00-C97 59 176 35.3 108.7
2 Diseases of heart I00-I09,I11,I13,I20-I51 30 89 17.9 55.0
3 Chronic liver disease and cirrhosis K70,K73-K74 11 32 6.4 19.8
4 Accidents (unintentional injuries) V01-X59,Y85-Y86 10 30 6.0 18.5
5 Intentional self-harm (suicide) X60-X84,Y87.0 7 22 4.4 13.6
. . . All other causes . . . 50 149 29.9 92.0
Table 184. Average annual deaths, cumulative deaths, percentage of cumulative deaths and average age-specifi c death rate for the 5
leading causes of death in non-Hispanic whites 45-54 years old, Chicago, 2007-2009
Rank Cause of death ICD-10 codeAverage
annual deathsCumulative
deaths
Percent of cumulative
deaths
Averageage-specifi cdeath rate
. . . All causes . . . 559 1,677 . . . 497.4
1 Diseases of heart I00-I09,I11,I13,I20-I51 157 472 28.1 140.0
2 Malignant neoplasms C00-C97 130 389 23.2 115.4
3 Accidents (unintentional injuries) V01-X59,Y85-Y86 42 126 7.5 37.4
4 Chronic liver disease and cirrhosis K70,K73-K74 37 112 6.7 33.2
5 Intentional self-harm (suicide) X60-X84,Y87.0 32 95 5.7 28.2
. . . All other causes . . . 161 483 28.8 143.3
Age Group: 45-54 Years by Race-Ethnicity and Sex

HEALTHY CHICAGO REPORTS
Leading Causes of Death in Chicago, 2007-2009 65
Table 189. Average annual deaths, cumulative deaths, percentage of cumulative deaths and average age-specifi c death rate for the 5
leading causes of death in non-Hispanic black males 45-54 years old, Chicago, 2007-2009
Rank Cause of death ICD-10 codeAverage
annual deathsCumulative
deaths
Percent of cumulative
deaths
Averageage-specifi cdeath rate
. . . All causes . . . 695 2,084 . . . 1,242.5
1 Diseases of heart I00-I09,I11,I13,I20-I51 198 593 28.5 353.6
2 Malignant neoplasms C00-C97 139 418 20.1 249.2
3 Accidents (unintentional injuries) V01-X59,Y85-Y86 69 208 10.0 124.0
4 Human immunodefi ciency virus (HIV) disease B20-B24 39 116 5.6 69.2
5 Cerebrovascular diseases I60-I69 27 80 3.8 47.7
. . . All other causes 223 669 32.1 398.9
Table 190. Average annual deaths, cumulative deaths, percentage of cumulative deaths and average age-specifi c death rate for the 5
leading causes of death in non-Hispanic white males 45-54 years old, Chicago, 2007-2009
Rank Cause of death ICD-10 codeAverage
annual deathsCumulative
deaths
Percent of cumulative
deaths
Averageage-specifi cdeath rate
. . . All causes . . . 393 1,179 . . . 672.7
1 Diseases of heart I00-I09,I11,I13,I20-I51 128 383 32.5 218.5
2 Malignant neoplasms C00-C97 71 213 18.1 121.5
3 Accidents (unintentional injuries) V01-X59,Y85-Y86 32 96 8.1 54.8
4 Chronic liver disease and cirrhosis K70,K73-K74 27 80 6.8 45.6
5 Intentional self-harm (suicide) X60-X84,Y87.0 24 73 6.2 41.7
. . . All other causes . . . 111 334 28.3 190.6
Table 188. Average annual deaths, cumulative deaths, percentage of cumulative deaths and average age-specifi c death rate for the 5
leading causes of death in Hispanic males 45-54 years old, Chicago, 2007-2009
Rank Cause of death ICD-10 codeAverage
annual deathsCumulative
deaths
Percent of cumulative
deaths
Averageage-specifi cdeath rate
. . . All causes . . . 156 467 . . . 382.8
1 Diseases of heart I00-I09,I11,I13,I20-I51 41 122 26.1 100.0
2 Malignant neoplasms C00-C97 24 73 15.6 59.8
3 Chronic liver disease and cirrhosis K70,K73-K74 17 51 10.9 41.8
4 Accidents (unintentional injuries) V01-X59,Y85-Y86 17 50 10.7 41.0
5 Diabetes mellitus E10-E14 7 22 4.7 18.0
. . . All other causes . . . 50 149 31.9 122.2
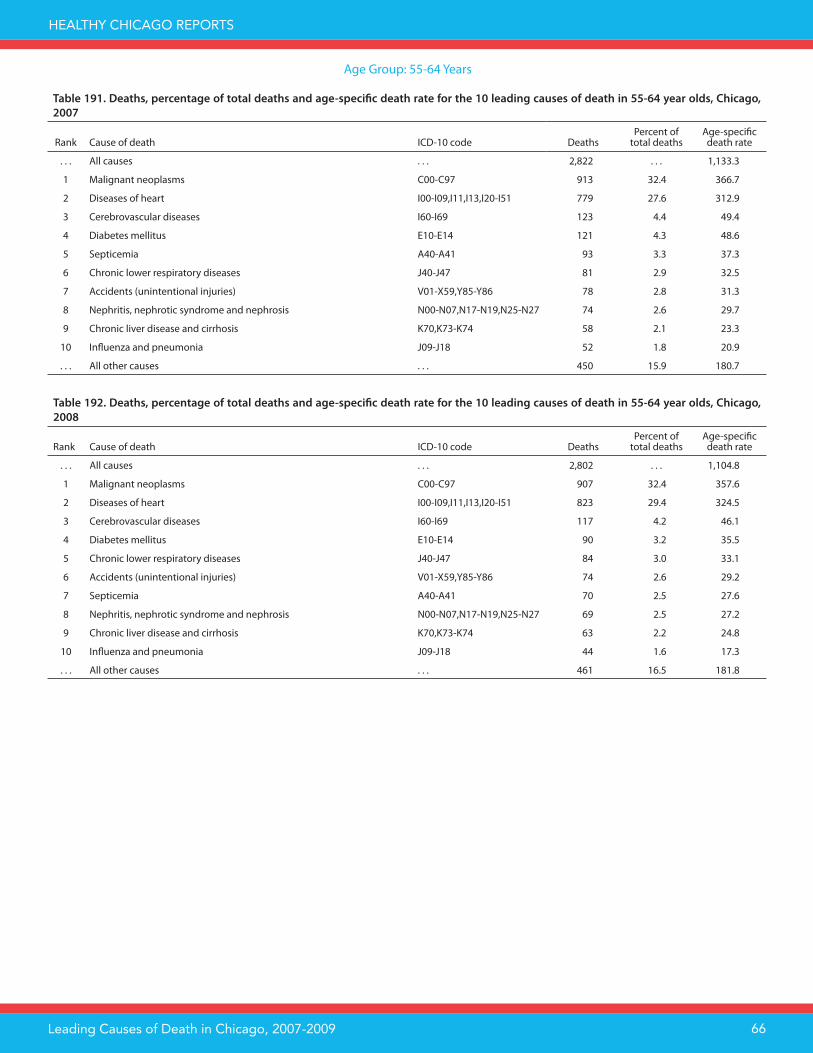
HEALTHY CHICAGO REPORTS
Leading Causes of Death in Chicago, 2007-2009 66
Table 192. Deaths, percentage of total deaths and age-specifi c death rate for the 10 leading causes of death in 55-64 year olds, Chicago,
2008
Rank Cause of death ICD-10 code DeathsPercent of
total deathsAge-specifi cdeath rate
. . . All causes . . . 2,802 . . . 1,104.8
1 Malignant neoplasms C00-C97 907 32.4 357.6
2 Diseases of heart I00-I09,I11,I13,I20-I51 823 29.4 324.5
3 Cerebrovascular diseases I60-I69 117 4.2 46.1
4 Diabetes mellitus E10-E14 90 3.2 35.5
5 Chronic lower respiratory diseases J40-J47 84 3.0 33.1
6 Accidents (unintentional injuries) V01-X59,Y85-Y86 74 2.6 29.2
7 Septicemia A40-A41 70 2.5 27.6
8 Nephritis, nephrotic syndrome and nephrosis N00-N07,N17-N19,N25-N27 69 2.5 27.2
9 Chronic liver disease and cirrhosis K70,K73-K74 63 2.2 24.8
10 Infl uenza and pneumonia J09-J18 44 1.6 17.3
. . . All other causes . . . 461 16.5 181.8
Table 191. Deaths, percentage of total deaths and age-specifi c death rate for the 10 leading causes of death in 55-64 year olds, Chicago,
2007
Rank Cause of death ICD-10 code DeathsPercent of
total deathsAge-specifi cdeath rate
. . . All causes . . . 2,822 . . . 1,133.3
1 Malignant neoplasms C00-C97 913 32.4 366.7
2 Diseases of heart I00-I09,I11,I13,I20-I51 779 27.6 312.9
3 Cerebrovascular diseases I60-I69 123 4.4 49.4
4 Diabetes mellitus E10-E14 121 4.3 48.6
5 Septicemia A40-A41 93 3.3 37.3
6 Chronic lower respiratory diseases J40-J47 81 2.9 32.5
7 Accidents (unintentional injuries) V01-X59,Y85-Y86 78 2.8 31.3
8 Nephritis, nephrotic syndrome and nephrosis N00-N07,N17-N19,N25-N27 74 2.6 29.7
9 Chronic liver disease and cirrhosis K70,K73-K74 58 2.1 23.3
10 Infl uenza and pneumonia J09-J18 52 1.8 20.9
. . . All other causes . . . 450 15.9 180.7
Age Group: 55-64 Years

HEALTHY CHICAGO REPORTS
Leading Causes of Death in Chicago, 2007-2009 67
Table 195. Average annual deaths, cumulative deaths, percentage of cumulative deaths and average age-specifi c death rate for the 5
leading causes of death in males 55-64 years old, Chicago, 2007-2009
Rank Cause of death ICD-10 codeAverage
annual deathsCumulative
deaths
Percent of cumulative
deaths
Averageage-specifi cdeath rate
. . . All causes . . . 1,669 5,006 . . . 1,412.3
1 Diseases of heart I00-I09,I11,I13,I20-I51 536 1,609 32.1 453.9
2 Malignant neoplasms C00-C97 485 1,456 29.1 410.8
3 Cerebrovascular diseases I60-I69 62 185 3.7 52.2
4 Accidents (unintentional injuries) V01-X59,Y85-Y86 62 185 3.7 52.2
5 Diabetes mellitus E10-E14 56 169 3.4 47.7
. . . All other causes . . . 467 1,402 28.0 395.5
Table 194. Average annual deaths, cumulative deaths, percentage of cumulative deaths and average age-specifi c death rate for the 5
leading causes of death in females 55-64 years old, Chicago, 2007-2009
Rank Cause of death ICD-10 codeAverage
annual deathsCumulative
deaths
Percent of cumulative
deaths
Averageage-specifi cdeath rate
. . . All causes . . . 1,153 3,460 . . . 851.4
1 Malignant neoplasms C00-C97 434 1,302 37.6 320.4
2 Diseases of heart I00-I09,I11,I13,I20-I51 262 786 22.7 193.4
3 Diabetes mellitus E10-E14 48 145 4.2 35.7
4 Cerebrovascular diseases I60-I69 48 145 4.2 35.7
5 Chronic lower respiratory diseases J40-J47 41 122 3.5 30.0
. . . All other causes . . . 320 960 27.7 236.2
Table 193. Deaths, percentage of total deaths and age-specifi c death rate for the 10 leading causes of death in 55-64 year olds, Chicago,
2009
Rank Cause of death ICD-10 code DeathsPercent of
total deathsAge-specifi cdeath rate
. . . All causes . . . 2,842 . . . 1,100.6
1 Malignant neoplasms C00-C97 938 33.0 363.2
2 Diseases of heart I00-I09,I11,I13,I20-I51 793 27.9 307.1
3 Diabetes mellitus E10-E14 103 3.6 39.9
4 Accidents (unintentional injuries) V01-X59,Y85-Y86 102 3.6 39.5
5 Chronic lower respiratory diseases J40-J47 91 3.2 35.2
6 Cerebrovascular diseases I60-I69 90 3.2 34.9
7 Septicemia A40-A41 77 2.7 29.8
8 Nephritis, nephrotic syndrome and nephrosis N00-N07,N17-N19,N25-N27 72 2.5 27.9
9 Chronic liver disease and cirrhosis K70,K73-K74 64 2.3 24.8
10 Human immunodefi ciency virus (HIV) disease B20-B24 37 1.3 14.3
10 Infl uenza and pneumonia J09-J18 37 1.3 14.3
. . . All other causes . . . 438 15.4 169.6
Age Group: 55-64 Years by Sex

HEALTHY CHICAGO REPORTS
Leading Causes of Death in Chicago, 2007-2009 68
Table 197. Average annual deaths, cumulative deaths, percentage of cumulative deaths and average age-specifi c death rate for the 5
leading causes of death in non-Hispanic blacks 55-64 years old, Chicago, 2007-2009
Rank Cause of death ICD-10 codeAverage
annual deathsCumulative
deaths
Percent of cumulative
deaths
Averageage-specifi cdeath rate
. . . All causes . . . 1,597 4,791 . . . 1,690.1
1 Malignant neoplasms C00-C97 496 1,489 31.1 525.3
2 Diseases of heart I00-I09,I11,I13,I20-I51 459 1,376 28.7 485.4
3 Cerebrovascular diseases I60-I69 73 220 4.6 77.6
4 Diabetes mellitus E10-E14 59 178 3.7 62.8
5 Chronic lower respiratory diseases J40-J47 49 146 3.0 51.5
. . . All other causes . . . 461 1,382 28.8 487.5
Table 198. Average annual deaths, cumulative deaths, percentage of cumulative deaths and average age-specifi c death rate for the 5
leading causes of death in non-Hispanic whites 55-64 years old, Chicago, 2007-2009
Rank Cause of death ICD-10 codeAverage
annual deathsCumulative
deaths
Percent of cumulative
deaths
Averageage-specifi cdeath rate
. . . All causes . . . 881 2,644 . . . 940.0
1 Malignant neoplasms C00-C97 304 912 34.5 324.2
2 Diseases of heart I00-I09,I11,I13,I20-I51 264 793 30.0 281.9
3 Chronic lower respiratory diseases J40-J47 32 95 3.6 33.8
3 Accidents (unintentional injuries) V01-X59,Y85-Y86 32 95 3.6 33.8
5 Diabetes mellitus E10-E14 27 82 3.1 29.2
. . . All other causes . . . 222 667 25.2 237.1
Table 196. Average annual deaths, cumulative deaths, percentage of cumulative deaths and average age-specifi c death rate for the 5
leading causes of death in Hispanics 55-64 years old, Chicago, 2007-2009
Rank Cause of death ICD-10 codeAverage
annual deathsCumulative
deaths
Percent of cumulative
deaths
Averageage-specifi cdeath rate
. . . All causes . . . 283 850 . . . 583.0
1 Malignant neoplasms C00-C97 93 279 32.8 191.4
2 Diseases of heart I00-I09,I11,I13,I20-I51 63 190 22.4 130.3
3 Diabetes mellitus E10-E14 13 39 4.6 26.8
4 Chronic liver disease and cirrhosis K70,K73-K74 13 38 4.5 26.1
5 Septicemia A40-A41 12 37 4.4 25.4
. . . All other causes . . . 89 267 31.4 183.1
Age Group: 55-64 Years by Race-Ethnicity
Table 199. Average annual deaths, cumulative deaths, percentage of cumulative deaths and average age-specifi c death rate for the 5
leading causes of death in Hispanic females 55-64 years old, Chicago, 2007-2009
Rank Cause of death ICD-10 codeAverage
annual deathsCumulative
deaths
Percent of cumulative
deaths
Averageage-specifi cdeath rate
. . . All causes . . . 110 330 . . . 450.3
1 Malignant neoplasms C00-C97 42 127 38.5 173.3
2 Diseases of heart I00-I09,I11,I13,I20-I51 16 47 14.2 64.1
3 Septicemia A40-A41 6 18 5.5 24.6
4 Diabetes mellitus E10-E14 5 16 4.8 21.8
4 Cerebrovascular diseases I60-I69 5 16 4.8 21.8
. . . All other causes . . . 35 106 32.1 144.6
Age Group: 55-64 Years by Race-Ethnicity and Sex

HEALTHY CHICAGO REPORTS
Leading Causes of Death in Chicago, 2007-2009 69
Table 200. Average annual deaths, cumulative deaths, percentage of cumulative deaths and average age-specifi c death rate for the 5
leading causes of death in non-Hispanic black females 55-64 years old, Chicago, 2007-2009
Rank Cause of death ICD-10 codeAverage
annual deathsCumulative
deaths
Percent of cumulative
deaths
Averageage-specifi cdeath rate
. . . All causes . . . 679 2,037 . . . 1,253.2
1 Malignant neoplasms C00-C97 234 702 34.5 431.9
2 Diseases of heart I00-I09,I11,I13,I20-I51 162 487 23.9 299.6
3 Cerebrovascular diseases I60-I69 31 93 4.6 57.2
4 Diabetes mellitus E10-E14 31 92 4.5 56.6
5 Septicemia A40-A41 26 77 3.8 47.4
. . . All other causes . . . 195 586 28.8 360.5
Table 201. Average annual deaths, cumulative deaths, percentage of cumulative deaths and average age-specifi c death rate for the 5
leading causes of death in non-Hispanic white females 55-64 years old, Chicago, 2007-2009
Rank Cause of death ICD-10 codeAverage
annual deathsCumulative
deaths
Percent of cumulative
deaths
Averageage-specifi cdeath rate
. . . All causes . . . 339 1,018 . . . 711.8
1 Malignant neoplasms C00-C97 145 434 42.6 303.5
2 Diseases of heart I00-I09,I11,I13,I20-I51 81 242 23.8 169.2
3 Chronic lower respiratory diseases J40-J47 15 45 4.4 31.5
4 Cerebrovascular diseases I60-I69 11 32 3.1 22.4
5 Diabetes mellitus E10-E14 10 31 3.0 21.7
. . . All other causes . . . 78 234 23.0 163.6
Table 202. Average annual deaths, cumulative deaths, percentage of cumulative deaths and average age-specifi c death rate for the 5
leading causes of death in Hispanic males 55-64 years old, Chicago, 2007-2009
Rank Cause of death ICD-10 codeAverage
annual deathsCumulative
deaths
Percent of cumulative
deaths
Averageage-specifi cdeath rate
. . . All causes . . . 173 520 . . . 717.2
1 Malignant neoplasms C00-C97 51 152 29.2 209.6
2 Diseases of heart I00-I09,I11,I13,I20-I51 48 143 27.5 197.2
3 Chronic liver disease and cirrhosis K70,K73-K74 10 30 5.8 41.4
4 Diabetes mellitus E10-E14 8 23 4.4 31.7
5 Septicemia A40-A41 6 19 3.7 26.2
5 Nephritis, nephrotic syndrome and nephrosis N00-N07,N17-N19,N25-N27 6 19 3.7 26.2
. . . All other causes . . . 45 134 25.8 184.8
Table 203. Average annual deaths, cumulative deaths, percentage of cumulative deaths and average age-specifi c death rate for the 5
leading causes of death in non-Hispanic black males 55-64 years old, Chicago, 2007-2009
Rank Cause of death ICD-10 codeAverage
annual deathsCumulative
deaths
Percent of cumulative
deaths
Averageage-specifi cdeath rate
. . . All causes . . . 918 2,754 . . . 2,277.4
1 Diseases of heart I00-I09,I11,I13,I20-I51 296 889 32.3 735.1
2 Malignant neoplasms C00-C97 262 787 28.6 650.8
3 Cerebrovascular diseases I60-I69 42 127 4.6 105.0
4 Accidents (unintentional injuries) V01-X59,Y85-Y86 31 92 3.3 76.1
5 Diabetes mellitus E10-E14 29 86 3.1 71.1
. . . All other causes . . . 258 773 28.1 639.2

HEALTHY CHICAGO REPORTS
Leading Causes of Death in Chicago, 2007-2009 70
Table 204. Average annual deaths, cumulative deaths, percentage of cumulative deaths and average age-specifi c death rate for the 5
leading causes of death in non-Hispanic white males 55-64 years old, Chicago, 2007-2009
Rank Cause of death ICD-10 codeAverage
annual deathsCumulative
deaths
Percent of cumulative
deaths
Averageage-specifi cdeath rate
. . . All causes . . . 542 1,626 . . . 1,176.0
1 Diseases of heart I00-I09,I11,I13,I20-I51 184 551 33.9 398.5
2 Malignant neoplasms C00-C97 159 478 29.4 345.7
3 Accidents (unintentional injuries) V01-X59,Y85-Y86 25 75 4.6 54.2
4 Diabetes mellitus E10-E14 17 51 3.1 36.9
5 Chronic lower respiratory diseases J40-J47 17 50 3.1 36.2
. . . All other causes . . . 140 421 25.9 304.5
Table 205. Deaths, percentage of total deaths and age-specifi c death rate for the 10 leading causes of death in 65-74 year olds, Chicago,
2007
Rank Cause of death ICD-10 code DeathsPercent of
total deathsAge-specifi cdeath rate
. . . All causes . . . 3,345 . . . 2,175.7
1 Malignant neoplasms C00-C97 1,107 33.1 720.0
2 Diseases of heart I00-I09,I11,I13,I20-I51 898 26.8 584.1
3 Cerebrovascular diseases I60-I69 177 5.3 115.1
4 Diabetes mellitus E10-E14 158 4.7 102.8
5 Chronic lower respiratory diseases J40-J47 146 4.4 95.0
6 Septicemia A40-A41 126 3.8 82.0
7 Nephritis, nephrotic syndrome and nephrosis N00-N07,N17-N19,N25-N27 109 3.3 70.9
8 Accidents (unintentional injuries) V01-X59,Y85-Y86 63 1.9 41.0
9 Infl uenza and pneumonia J09-J18 57 1.7 37.1
10 Chronic liver disease and cirrhosis K70,K73-K74 48 1.4 31.2
. . . All other causes . . . 456 13.6 296.6
Age Group: 65-74 Years
Table 206. Deaths, percentage of total deaths and age-specifi c death rate for the 10 leading causes of death in 65-74 year olds, Chicago,
2008
Rank Cause of death ICD-10 code DeathsPercent of
total deathsAge-specifi cdeath rate
. . . All causes . . . 3,385 . . . 2,214.5
1 Malignant neoplasms C00-C97 1,140 33.7 745.8
2 Diseases of heart I00-I09,I11,I13,I20-I51 905 26.7 592.0
3 Cerebrovascular diseases I60-I69 167 4.9 109.3
4 Diabetes mellitus E10-E14 150 4.4 98.1
5 Chronic lower respiratory diseases J40-J47 144 4.3 94.2
6 Nephritis, nephrotic syndrome and nephrosis N00-N07,N17-N19,N25-N27 110 3.2 72.0
7 Septicemia A40-A41 98 2.9 64.1
8 Infl uenza and pneumonia J09-J18 78 2.3 51.0
9 Chronic liver disease and cirrhosis K70,K73-K74 47 1.4 30.7
9 Accidents (unintentional injuries) V01-X59,Y85-Y86 47 1.4 30.7
. . . All other causes . . . 499 14.7 326.4

HEALTHY CHICAGO REPORTS
Leading Causes of Death in Chicago, 2007-2009 71
Table 207. Deaths, percentage of total deaths and age-specifi c death rate for the 10 leading causes of death in 65-74 year olds, Chicago,
2009
Rank Cause of death ICD-10 code DeathsPercent of
total deathsAge-specifi cdeath rate
. . . All causes . . . 3,238 . . . 2,130.6
1 Malignant neoplasms C00-C97 1,113 34.4 732.3
2 Diseases of heart I00-I09,I11,I13,I20-I51 881 27.2 579.7
3 Diabetes mellitus E10-E14 141 4.4 92.8
4 Cerebrovascular diseases I60-I69 136 4.2 89.5
5 Chronic lower respiratory diseases J40-J47 131 4.0 86.2
6 Nephritis, nephrotic syndrome and nephrosis N00-N07,N17-N19,N25-N27 111 3.4 73.0
7 Septicemia A40-A41 95 2.9 62.5
8 Infl uenza and pneumonia J09-J18 70 2.2 46.1
9 Accidents (unintentional injuries) V01-X59,Y85-Y86 51 1.6 33.6
10 Chronic liver disease and cirrhosis K70,K73-K74 43 1.3 28.3
. . . All other causes . . . 466 14.4 306.6
Table 208. Average annual deaths, cumulative deaths, percentage of cumulative deaths and average age-specifi c death rate for the 5
leading causes of death in females 65-74 years old, Chicago, 2007-2009
Rank Cause of death ICD-10 codeAverage
annual deathsCumulative
deaths
Percent of cumulative
deaths
Averageage-specifi cdeath rate
. . . All causes . . . 1,491 4,473 . . . 1,717.6
1 Malignant neoplasms C00-C97 526 1,579 35.3 606.3
2 Diseases of heart I00-I09,I11,I13,I20-I51 339 1,018 22.8 390.9
3 Cerebrovascular diseases I60-I69 73 220 4.9 84.5
4 Diabetes mellitus E10-E14 72 216 4.8 82.9
5 Chronic lower respiratory diseases J40-J47 71 214 4.8 82.2
. . . All other causes . . . 409 1,226 27.4 470.8
Age Group: 65-74 Years by Sex
Table 209. Average annual deaths, cumulative deaths, percentage of cumulative deaths and average age-specifi c death rate for the 5
leading causes of death in males 65-74 years old, Chicago, 2007-2009
Rank Cause of death ICD-10 codeAverage
annual deathsCumulative
deaths
Percent of cumulative
deaths
Averageage-specifi cdeath rate
. . . All causes . . . 1,831 5,494 . . . 2,772.6
1 Malignant neoplasms C00-C97 594 1,781 32.4 898.8
2 Diseases of heart I00-I09,I11,I13,I20-I51 555 1,666 30.3 840.8
3 Cerebrovascular diseases I60-I69 86 259 4.7 130.7
4 Diabetes mellitus E10-E14 78 233 4.2 117.6
5 Chronic lower respiratory diseases J40-J47 69 207 3.8 104.5
. . . All other causes . . . 449 1,348 24.5 680.3

HEALTHY CHICAGO REPORTS
Leading Causes of Death in Chicago, 2007-2009 72
Table 210. Average annual deaths, cumulative deaths, percentage of cumulative deaths and average age-specifi c death rate for the 5
leading causes of death in Hispanics 65-74 years old, Chicago, 2007-2009
Rank Cause of death ICD-10 codeAverage
annual deathsCumulative
deaths
Percent of cumulative
deaths
Averageage-specifi cdeath rate
. . . All causes . . . 316 949 . . . 1,345.4
1 Malignant neoplasms C00-C97 90 271 28.6 384.2
2 Diseases of heart I00-I09,I11,I13,I20-I51 77 231 24.3 327.5
3 Diabetes mellitus E10-E14 22 65 6.8 92.2
4 Cerebrovascular diseases I60-I69 16 48 5.1 68.0
5 Septicemia A40-A41 16 47 5.0 66.6
. . . All other causes . . . 96 287 30.2 406.9
Table 211. Average annual deaths, cumulative deaths, percentage of cumulative deaths and average age-specifi c death rate for the 5
leading causes of death in non-Hispanic blacks 65-74 years old, Chicago, 2007-2009
Rank Cause of death ICD-10 codeAverage
annual deathsCumulative
deaths
Percent of cumulative
deaths
Averageage-specifi cdeath rate
. . . All causes . . . 1,754 5,263 . . . 2,861.1
1 Malignant neoplasms C00-C97 582 1,745 33.2 948.6
2 Diseases of heart I00-I09,I11,I13,I20-I51 478 1,434 27.2 779.6
3 Cerebrovascular diseases I60-I69 101 302 5.7 164.2
4 Diabetes mellitus E10-E14 84 252 4.8 137.0
5 Nephritis, nephrotic syndrome and nephrosis N00-N07,N17-N19,N25-N27 71 214 4.1 116.3
. . . All other causes . . . 439 1,316 25.0 715.4
Table 212. Average annual deaths, cumulative deaths, percentage of cumulative deaths and average age-specifi c death rate for the 5
leading causes of death in non-Hispanic whites 65-74, Chicago, 2007-2009
Rank Cause of death ICD-10 codeAverage
annual deathsCumulative
deaths
Percent of cumulative
deaths
Averageage-specifi cdeath rate
. . . All causes . . . 1,151 3,453 . . . 1,989.1
1 Malignant neoplasms C00-C97 412 1,235 35.8 711.4
2 Diseases of heart I00-I09,I11,I13,I20-I51 318 953 27.6 549.0
3 Chronic lower respiratory diseases J40-J47 66 199 5.8 114.6
4 Diabetes mellitus E10-E14 40 119 3.4 68.5
5 Cerebrovascular diseases I60-I69 39 116 3.4 66.8
. . . All other causes . . . 277 831 24.1 478.7
Age Group: 65-74 Years by Race-Ethnicity
Table 213. Average annual deaths, cumulative deaths, percentage of cumulative deaths and average age-specifi c death rate for the 5
leading causes of death in Hispanic females 65-74 years old, Chicago, 2007-2009
Rank Cause of death ICD-10 codeAverage
annual deathsCumulative
deaths
Percent of cumulative
deaths
Averageage-specifi cdeath rate
. . . All causes . . . 134 401 . . . 1,049.8
1 Malignant neoplasms C00-C97 36 107 26.7 280.1
2 Diseases of heart I00-I09,I11,I13,I20-I51 24 72 18.0 188.5
3 Diabetes mellitus E10-E14 11 34 8.5 89.0
4 Septicemia A40-A41 9 28 7.0 73.3
5 Cerebrovascular diseases I60-I69 8 23 5.7 60.2
. . . All other causes . . . 46 137 34.2 358.6
Age Group: 65-74 Years by Race-Ethnicity and Sex

HEALTHY CHICAGO REPORTS
Leading Causes of Death in Chicago, 2007-2009 73
Table 214. Average annual deaths, cumulative deaths, percentage of cumulative deaths and average age-specifi c death rate for the 5
leading causes of death in non-Hispanic black females 65-74 years old, Chicago, 2007-2009
Rank Cause of death ICD-10 codeAverage
annual deathsCumulative
deaths
Percent of cumulative
deaths
Averageage-specifi cdeath rate
. . . All causes . . . 825 2,474 . . . 2,246.1
1 Malignant neoplasms C00-C97 278 835 33.8 758.1
2 Diseases of heart I00-I09,I11,I13,I20-I51 193 578 23.4 524.7
3 Cerebrovascular diseases I60-I69 48 144 5.8 130.7
4 Diabetes mellitus E10-E14 44 131 5.3 118.9
5 Nephritis, nephrotic syndrome and nephrosis N00-N07,N17-N19,N25-N27 35 106 4.3 96.2
. . . All other causes . . . 227 680 27.5 617.4
Table 215. Average annual deaths, cumulative deaths, percentage of cumulative deaths and average age-specifi c death rate for the 5
leading causes of death in non-Hispanic white females 65-74 years old, Chicago, 2007-2009
Rank Cause of death ICD-10 codeAverage
annual deathsCumulative
deaths
Percent of cumulative
deaths
Averageage-specifi cdeath rate
. . . All causes . . . 490 1,470 . . . 1,547.8
1 Malignant neoplasms C00-C97 196 589 40.1 620.2
2 Diseases of heart I00-I09,I11,I13,I20-I51 114 342 23.3 360.1
3 Chronic lower respiratory diseases J40-J47 35 105 7.1 110.6
4 Cerebrovascular diseases I60-I69 16 47 3.2 49.5
5 Diabetes mellitus E10-E14 15 45 3.1 47.4
. . . All other causes . . . 114 342 23.3 360.1
Table 216. Average annual deaths, cumulative deaths, percentage of cumulative deaths and average age-specifi c death rate for the 5
leading causes of death in Hispanic males 65-74 years old, Chicago, 2007-2009
Rank Cause of death ICD-10 codeAverage
annual deathsCumulative
deaths
Percent of cumulative
deaths
Averageage-specifi cdeath rate
. . . All causes . . . 183 548 . . . 1,694.6
1 Malignant neoplasms C00-C97 55 164 29.9 507.1
2 Diseases of heart I00-I09,I11,I13,I20-I51 53 159 29.0 491.7
3 Diabetes mellitus E10-E14 10 31 5.7 95.9
4 Cerebrovascular diseases I60-I69 8 25 4.6 77.3
5 Chronic liver disease and cirrhosis K70,K73-K74 7 21 3.8 64.9
. . . All other causes . . . 49 148 27.0 457.7
Table 217. Average annual deaths, cumulative deaths, percentage of cumulative deaths and average age-specifi c death rate for the 5
leading causes of death in non-Hispanic black males 65-74 years old, Chicago, 2007-2009
Rank Cause of death ICD-10 codeAverage
annual deathsCumulative
deaths
Percent of cumulative
deaths
Averageage-specifi cdeath rate
. . . All causes . . . 929 2,788 . . . 3,777.7
1 Malignant neoplasms C00-C97 303 910 32.6 1,233.0
2 Diseases of heart I00-I09,I11,I13,I20-I51 285 856 30.7 1,159.9
3 Cerebrovascular diseases I60-I69 52 157 5.6 212.7
4 Diabetes mellitus E10-E14 40 121 4.3 164.0
5 Nephritis, nephrotic syndrome and nephrosis N00-N07,N17-N19,N25-N27 36 108 3.9 146.3
. . . All other causes . . . 212 636 22.8 861.8

HEALTHY CHICAGO REPORTS
Leading Causes of Death in Chicago, 2007-2009 74
Table 218. Average annual deaths, cumulative deaths, percentage of cumulative deaths and average age-specifi c death rate for the 5
leading causes of death in non-Hispanic white males 65-74 years old, Chicago, 2007-2009
Rank Cause of death ICD-10 codeAverage
annual deathsCumulative
deaths
Percent of cumulative
deaths
Averageage-specifi cdeath rate
. . . All causes . . . 661 1,983 . . . 2,522.1
1 Malignant neoplasms C00-C97 215 646 32.6 821.6
2 Diseases of heart I00-I09,I11,I13,I20-I51 204 611 30.8 777.1
3 Chronic lower respiratory diseases J40-J47 31 94 4.7 119.6
4 Diabetes mellitus E10-E14 25 74 3.7 94.1
5 Cerebrovascular diseases I60-I69 23 69 3.5 87.8
. . . All other causes . . . 163 489 24.7 621.9
Table 219. Deaths, percentage of total deaths and age-specifi c death rate for the 10 leading causes of death in 75-84 year olds, Chicago,
2007
Rank Cause of death ICD-10 code DeathsPercent of
total deathsAge-specifi cdeath rate
. . . All causes . . . 4,718 . . . 5,020.3
1 Diseases of heart I00-I09,I11,I13,I20-I51 1,336 28.3 1,421.6
2 Malignant neoplasms C00-C97 1,221 25.9 1,299.2
3 Cerebrovascular diseases I60-I69 318 6.7 338.4
4 Diabetes mellitus E10-E14 193 4.1 205.4
5 Chronic lower respiratory diseases J40-J47 193 4.1 205.4
6 Septicemia A40-A41 175 3.7 186.2
7 Infl uenza and pneumonia J09-J18 162 3.4 172.4
8 Nephritis, nephrotic syndrome and nephrosis N00-N07,N17-N19,N25-N27 147 3.1 156.4
9 Alzheimer's disease G30 94 2.0 100.0
10 Accidents (unintentional injuries) V01-X59,Y85-Y86 56 1.2 59.6
. . . All other causes . . . 823 17.4 875.7
Age Group: 75-84 Years
Table 220. Deaths, percentage of total deaths and age-specifi c death rate for the 10 leading causes of death in 75-84 year olds, Chicago,
2008
Rank Cause of death ICD-10 code DeathsPercent of
total deathsAge-specifi cdeath rate
. . . All causes . . . 4,705 . . . 5,081.7
1 Diseases of heart I00-I09,I11,I13,I20-I51 1,339 28.5 1,446.2
2 Malignant neoplasms C00-C97 1,178 25.0 1,272.3
3 Cerebrovascular diseases I60-I69 291 6.2 314.3
4 Chronic lower respiratory diseases J40-J47 267 5.7 288.4
5 Diabetes mellitus E10-E14 157 3.3 169.6
6 Nephritis, nephrotic syndrome and nephrosis N00-N07,N17-N19,N25-N27 150 3.2 162.0
7 Septicemia A40-A41 149 3.2 160.9
8 Infl uenza and pneumonia J09-J18 137 2.9 148.0
9 Alzheimer's disease G30 105 2.2 113.4
10 Accidents (unintentional injuries) V01-X59,Y85-Y86 58 1.2 62.6
. . . All other causes . . . 874 18.6 944

HEALTHY CHICAGO REPORTS
Leading Causes of Death in Chicago, 2007-2009 75
Table 221. Deaths, percentage of total deaths and age-specifi c death rate for the 10 leading causes of death in 75-84 year olds, Chicago,
2009
Rank Cause of death ICD-10 code DeathsPercent of
total deathsAge-specifi cdeath rate
. . . All causes . . . 4,266 . . . 4,677.8
1 Diseases of heart I00-I09,I11,I13,I20-I51 1,209 28.3 1,325.7
2 Malignant neoplasms C00-C97 1,065 25.0 1,167.8
3 Cerebrovascular diseases I60-I69 279 6.5 305.9
4 Chronic lower respiratory diseases J40-J47 208 4.9 228.1
5 Diabetes mellitus E10-E14 165 3.9 180.9
6 Nephritis, nephrotic syndrome and nephrosis N00-N07,N17-N19,N25-N27 151 3.5 165.6
7 Infl uenza and pneumonia J09-J18 137 3.2 150.2
8 Septicemia A40-A41 129 3.0 141.5
9 Alzheimer's disease G30 94 2.2 103.1
10 Accidents (unintentional injuries) V01-X59,Y85-Y86 54 1.3 59.2
. . . All other causes . . . 775 18.2 849.8
Table 222. Average annual deaths, cumulative deaths, percentage of cumulative deaths and average age-specifi c death rate for the 5
leading causes of death in females 75-84 years old, Chicago, 2007-2009
Rank Cause of death ICD-10 codeAverage
annual deathsCumulative
deaths
Percent of cumulative
deaths
Averageage-specifi cdeath rate
. . . All causes . . . 2,439 7,316 . . . 4,290.3
1 Diseases of heart I00-I09,I11,I13,I20-I51 666 1,998 27.3 1,171.7
2 Malignant neoplasms C00-C97 578 1,733 23.7 1,016.3
3 Cerebrovascular diseases I60-I69 182 546 7.5 320.2
4 Chronic lower respiratory diseases J40-J47 113 339 4.6 198.8
5 Diabetes mellitus E10-E14 98 294 4.0 172.4
. . . All other causes . . . 802 2,406 32.9 1,410.9
Age Group: 75-84 Years by Sex
Table 223. Average annual deaths, cumulative deaths, percentage of cumulative deaths and average age-specifi c death rate for the 5
leading causes of death in males 75-84 years old, Chicago, 2007-2009
Rank Cause of death ICD-10 codeAverage
annual deathsCumulative
deaths
Percent of cumulative
deaths
Averageage-specifi cdeath rate
. . . All causes . . . 2,124 6,373 . . . 5,942.9
1 Diseases of heart I00-I09,I11,I13,I20-I51 629 1,886 29.6 1,758.7
2 Malignant neoplasms C00-C97 577 1,731 27.2 1,614.2
3 Cerebrovascular diseases I60-I69 114 342 5.4 318.9
4 Chronic lower respiratory diseases J40-J47 110 329 5.2 306.8
5 Diabetes mellitus E10-E14 74 221 3.5 206.1
. . . All other causes . . . 621 1,864 29.2 1,738.2
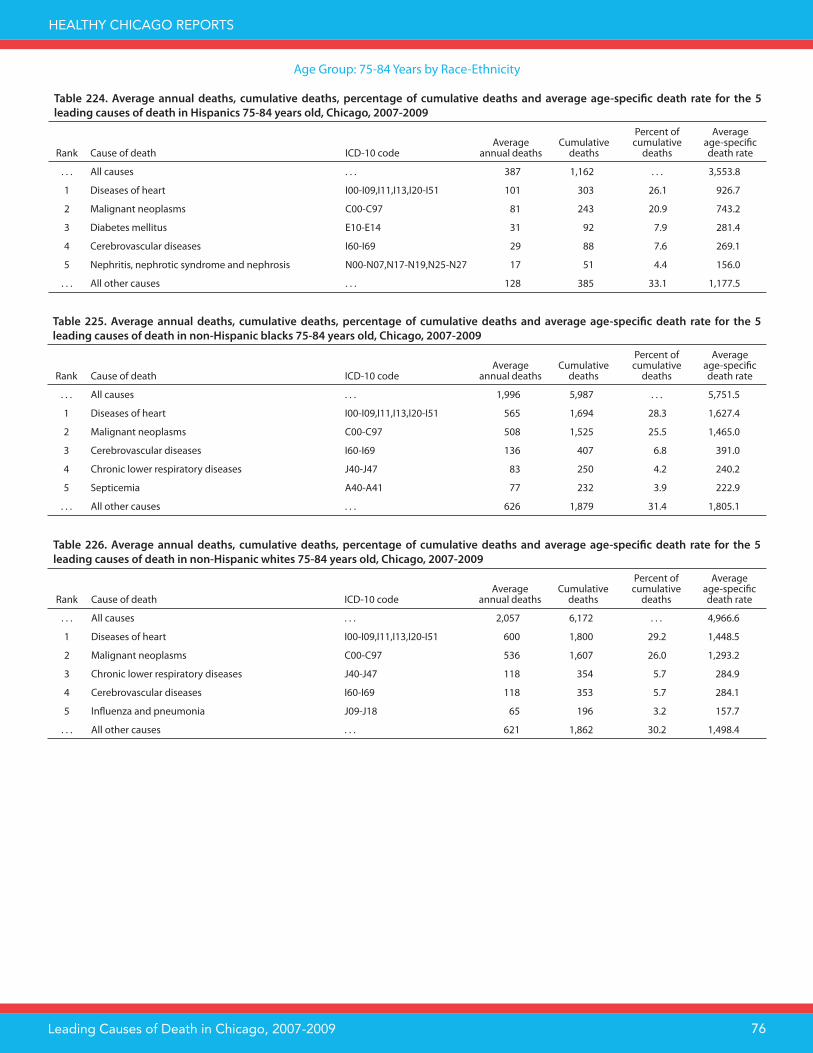
HEALTHY CHICAGO REPORTS
Leading Causes of Death in Chicago, 2007-2009 76
Table 224. Average annual deaths, cumulative deaths, percentage of cumulative deaths and average age-specifi c death rate for the 5
leading causes of death in Hispanics 75-84 years old, Chicago, 2007-2009
Rank Cause of death ICD-10 codeAverage
annual deathsCumulative
deaths
Percent of cumulative
deaths
Averageage-specifi cdeath rate
. . . All causes . . . 387 1,162 . . . 3,553.8
1 Diseases of heart I00-I09,I11,I13,I20-I51 101 303 26.1 926.7
2 Malignant neoplasms C00-C97 81 243 20.9 743.2
3 Diabetes mellitus E10-E14 31 92 7.9 281.4
4 Cerebrovascular diseases I60-I69 29 88 7.6 269.1
5 Nephritis, nephrotic syndrome and nephrosis N00-N07,N17-N19,N25-N27 17 51 4.4 156.0
. . . All other causes . . . 128 385 33.1 1,177.5
Table 225. Average annual deaths, cumulative deaths, percentage of cumulative deaths and average age-specifi c death rate for the 5
leading causes of death in non-Hispanic blacks 75-84 years old, Chicago, 2007-2009
Rank Cause of death ICD-10 codeAverage
annual deathsCumulative
deaths
Percent of cumulative
deaths
Averageage-specifi cdeath rate
. . . All causes . . . 1,996 5,987 . . . 5,751.5
1 Diseases of heart I00-I09,I11,I13,I20-I51 565 1,694 28.3 1,627.4
2 Malignant neoplasms C00-C97 508 1,525 25.5 1,465.0
3 Cerebrovascular diseases I60-I69 136 407 6.8 391.0
4 Chronic lower respiratory diseases J40-J47 83 250 4.2 240.2
5 Septicemia A40-A41 77 232 3.9 222.9
. . . All other causes . . . 626 1,879 31.4 1,805.1
Table 226. Average annual deaths, cumulative deaths, percentage of cumulative deaths and average age-specifi c death rate for the 5
leading causes of death in non-Hispanic whites 75-84 years old, Chicago, 2007-2009
Rank Cause of death ICD-10 codeAverage
annual deathsCumulative
deaths
Percent of cumulative
deaths
Averageage-specifi cdeath rate
. . . All causes . . . 2,057 6,172 . . . 4,966.6
1 Diseases of heart I00-I09,I11,I13,I20-I51 600 1,800 29.2 1,448.5
2 Malignant neoplasms C00-C97 536 1,607 26.0 1,293.2
3 Chronic lower respiratory diseases J40-J47 118 354 5.7 284.9
4 Cerebrovascular diseases I60-I69 118 353 5.7 284.1
5 Infl uenza and pneumonia J09-J18 65 196 3.2 157.7
. . . All other causes . . . 621 1,862 30.2 1,498.4
Age Group: 75-84 Years by Race-Ethnicity

HEALTHY CHICAGO REPORTS
Leading Causes of Death in Chicago, 2007-2009 77
Table 228. Average annual deaths, cumulative deaths, percentage of cumulative deaths and average age-specifi c death rate for the 5
leading causes of death in non-Hispanic black females 75-84 years old, Chicago, 2007-2009
Rank Cause of death ICD-10 codeAverage
annual deathsCumulative
deaths
Percent of cumulative
deaths
Averageage-specifi cdeath rate
. . . All causes . . . 1,102 3,305 . . . 4,985.6
1 Diseases of heart I00-I09,I11,I13,I20-I51 309 926 28.0 1,396.9
2 Malignant neoplasms C00-C97 260 781 23.6 1,178.1
3 Cerebrovascular diseases I60-I69 83 249 7.5 375.6
4 Septicemia A40-A41 48 145 4.4 218.7
5 Nephritis, nephrotic syndrome and nephrosis N00-N07,N17-N19,N25-N27 44 132 4.0 199.1
. . . All other causes . . . 357 1,072 32.4 1,617.1
Table 229. Average annual deaths, cumulative deaths, percentage of cumulative deaths and average age-specifi c death rate for the 5
leading causes of death in non-Hispanic white females 75-84 years old, Chicago, 2007-2009
Rank Cause of death ICD-10 codeAverage
annual deathsCumulative
deaths
Percent of cumulative
deaths
Averageage-specifi cdeath rate
. . . All causes . . . 1,088 3,265 . . . 4,320.0
1 Diseases of heart I00-I09,I11,I13,I20-I51 297 891 27.3 1,178.9
2 Malignant neoplasms C00-C97 269 807 24.7 1,067.8
3 Cerebrovascular diseases I60-I69 74 222 6.8 293.7
4 Chronic lower respiratory diseases J40-J47 65 196 6.0 259.3
5 Diabetes mellitus E10-E14 37 111 3.4 146.9
. . . All other causes . . . 346 1,038 31.8 1,373.4
Table 230. Average annual deaths, cumulative deaths, percentage of cumulative deaths and average age-specifi c death rate for the 5 lead-
ing causes of death in Hispanic males 75-84 years old, Chicago, 2007-2009
Rank Cause of death ICD-10 codeAverage
annual deathsCumulative
deaths
Percent of cumulative
deaths
Averageage-specifi cdeath rate
. . . All causes . . . 196 589 . . . 4,191.9
1 Diseases of heart I00-I09,I11,I13,I20-I51 56 167 28.4 1,188.5
2 Malignant neoplasms C00-C97 46 137 23.3 975.0
3 Diabetes mellitus E10-E14 14 42 7.1 298.9
4 Cerebrovascular diseases I60-I69 12 36 6.1 256.2
5 Nephritis, nephrotic syndrome and nephrosis N00-N07,N17-N19,N25-N27 12 35 5.9 249.1
. . . All other causes . . . 57 172 29.2 1,224.1
Table 227. Average annual deaths, cumulative deaths, percentage of cumulative deaths and average age-specifi c death rate for the 5
leading causes of death in Hispanic females 75-84 years old, Chicago, 2007-2009
Rank Cause of death ICD-10 codeAverage
annual deathsCumulative
deaths
Percent of cumulative
deaths
Averageage-specifi cdeath rate
. . . All causes . . . 191 573 . . . 3,072.9
1 Diseases of heart I00-I09,I11,I13,I20-I51 45 136 23.7 729.3
2 Malignant neoplasms C00-C97 35 106 18.5 568.5
3 Cerebrovascular diseases I60-I69 17 52 9.1 278.9
4 Diabetes mellitus E10-E14 17 50 8.7 268.1
5 Chronic lower respiratory diseases J40-J47 6 18 3.1 96.5
5 Chronic liver disease and cirrhosis K70,K73-K74 6 18 3.1 96.5
. . . All other causes . . . 64 193 33.7 1,035.0
Age Group: 75-84 Years by Race-Ethnicity and Sex

HEALTHY CHICAGO REPORTS
Leading Causes of Death in Chicago, 2007-2009 78
Table 231. Average annual deaths, cumulative deaths, percentage of cumulative deaths and average age-specifi c death rate for the 5
leading causes of death in non-Hispanic black males 75-84 years old, Chicago, 2007-2009
Rank Cause of death ICD-10 codeAverage
annual deathsCumulative
deaths
Percent of cumulative
deaths
Averageage-specifi cdeath rate
. . . All causes . . . 894 2,682 . . . 7,094.5
1 Diseases of heart I00-I09,I11,I13,I20-I51 256 768 28.6 2,031.5
2 Malignant neoplasms C00-C97 248 744 27.7 1,968.0
3 Cerebrovascular diseases I60-I69 53 158 5.9 417.9
4 Chronic lower respiratory diseases J40-J47 43 130 4.8 343.9
5 Nephritis, nephrotic syndrome and nephrosis N00-N07,N17-N19,N25-N27 31 94 3.5 248.7
. . . All other causes . . . 263 788 29.4 2,084.4
Table 232. Average annual deaths, cumulative deaths, percentage of cumulative deaths and average age-specifi c death rate for the 5
leading causes of death in non-Hispanic white males 75-84 years old, Chicago, 2007-2009
Rank Cause of death ICD-10 codeAverage
annual deathsCumulative
deaths
Percent of cumulative
deaths
Averageage-specifi cdeath rate
. . . All causes . . . 969 2,907 . . . 5,970.4
1 Diseases of heart I00-I09,I11,I13,I20-I51 303 909 31.3 1,866.9
2 Malignant neoplasms C00-C97 267 800 27.5 1,643.0
3 Chronic lower respiratory diseases J40-J47 53 158 5.4 324.5
4 Cerebrovascular diseases I60-I69 44 131 4.5 269.0
5 Infl uenza and pneumonia J09-J18 31 92 3.2 189.0
. . . All other causes . . . 272 817 28.1 1,678.0
Table 233. Deaths, percentage of total deaths and age-specifi c death rate for the 10 leading causes of death in 85 year olds and older,
Chicago, 2007
Rank Cause of death ICD-10 code DeathsPercent of
total deathsAge-specifi cdeath rate
. . . All causes . . . 4,556 . . . 12,491.1
1 Diseases of heart I00-I09,I11,I13,I20-I51 1,615 35.4 4,427.8
2 Malignant neoplasms C00-C97 632 13.9 1,732.7
3 Cerebrovascular diseases I60-I69 347 7.6 951.4
4 Infl uenza and pneumonia J09-J18 223 4.9 611.4
5 Alzheimer's disease G30 196 4.3 537.4
6 Chronic lower respiratory diseases J40-J47 150 3.3 411.3
7 Nephritis, nephrotic syndrome and nephrosis N00-N07,N17-N19,N25-N27 140 3.1 383.8
8 Septicemia A40-A41 137 3.0 375.6
9 Diabetes mellitus E10-E14 92 2.0 252.2
10 Pneumonitis due to solids and liquids J69 69 1.5 189.2
. . . All other causes . . . 955 21.0 2,618.3
Age Group: 85 Years and Older
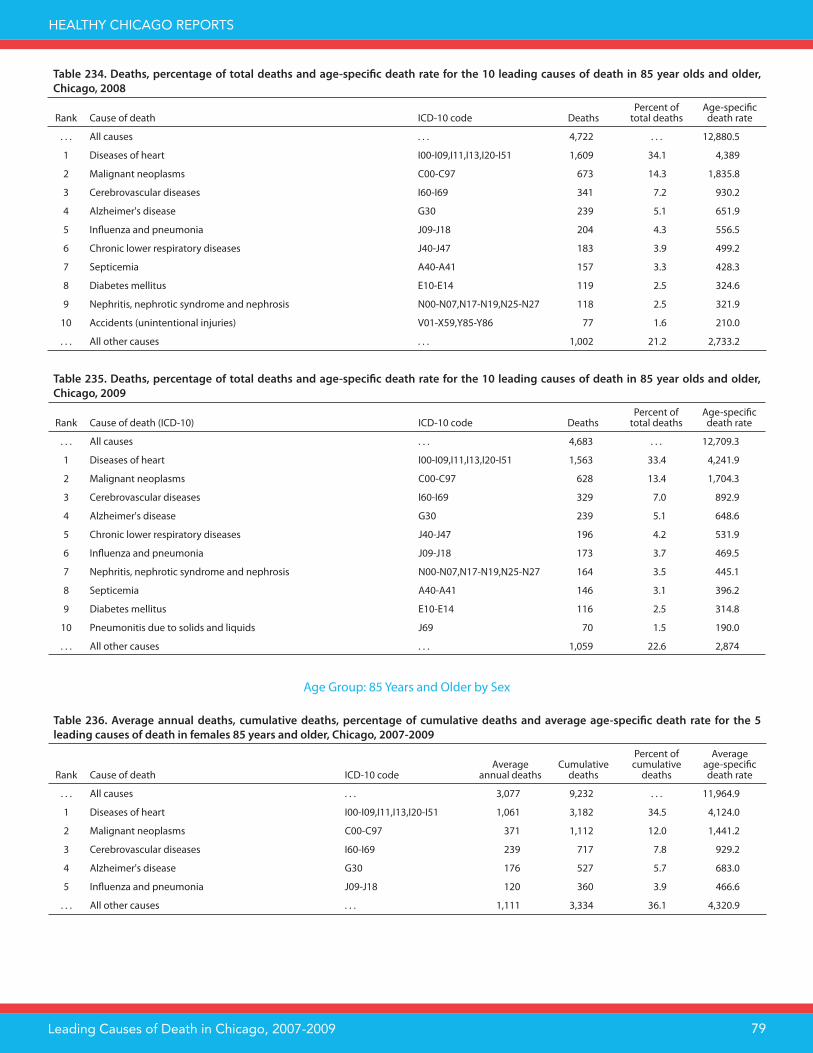
HEALTHY CHICAGO REPORTS
Leading Causes of Death in Chicago, 2007-2009 79
Table 234. Deaths, percentage of total deaths and age-specifi c death rate for the 10 leading causes of death in 85 year olds and older,
Chicago, 2008
Rank Cause of death ICD-10 code DeathsPercent of
total deathsAge-specifi cdeath rate
. . . All causes . . . 4,722 . . . 12,880.5
1 Diseases of heart I00-I09,I11,I13,I20-I51 1,609 34.1 4,389
2 Malignant neoplasms C00-C97 673 14.3 1,835.8
3 Cerebrovascular diseases I60-I69 341 7.2 930.2
4 Alzheimer's disease G30 239 5.1 651.9
5 Infl uenza and pneumonia J09-J18 204 4.3 556.5
6 Chronic lower respiratory diseases J40-J47 183 3.9 499.2
7 Septicemia A40-A41 157 3.3 428.3
8 Diabetes mellitus E10-E14 119 2.5 324.6
9 Nephritis, nephrotic syndrome and nephrosis N00-N07,N17-N19,N25-N27 118 2.5 321.9
10 Accidents (unintentional injuries) V01-X59,Y85-Y86 77 1.6 210.0
. . . All other causes . . . 1,002 21.2 2,733.2
Table 235. Deaths, percentage of total deaths and age-specifi c death rate for the 10 leading causes of death in 85 year olds and older,
Chicago, 2009
Rank Cause of death (ICD-10) ICD-10 code DeathsPercent of
total deathsAge-specifi cdeath rate
. . . All causes . . . 4,683 . . . 12,709.3
1 Diseases of heart I00-I09,I11,I13,I20-I51 1,563 33.4 4,241.9
2 Malignant neoplasms C00-C97 628 13.4 1,704.3
3 Cerebrovascular diseases I60-I69 329 7.0 892.9
4 Alzheimer's disease G30 239 5.1 648.6
5 Chronic lower respiratory diseases J40-J47 196 4.2 531.9
6 Infl uenza and pneumonia J09-J18 173 3.7 469.5
7 Nephritis, nephrotic syndrome and nephrosis N00-N07,N17-N19,N25-N27 164 3.5 445.1
8 Septicemia A40-A41 146 3.1 396.2
9 Diabetes mellitus E10-E14 116 2.5 314.8
10 Pneumonitis due to solids and liquids J69 70 1.5 190.0
. . . All other causes . . . 1,059 22.6 2,874
Table 236. Average annual deaths, cumulative deaths, percentage of cumulative deaths and average age-specifi c death rate for the 5
leading causes of death in females 85 years and older, Chicago, 2007-2009
Rank Cause of death ICD-10 codeAverage
annual deathsCumulative
deaths
Percent of cumulative
deaths
Averageage-specifi cdeath rate
. . . All causes . . . 3,077 9,232 . . . 11,964.9
1 Diseases of heart I00-I09,I11,I13,I20-I51 1,061 3,182 34.5 4,124.0
2 Malignant neoplasms C00-C97 371 1,112 12.0 1,441.2
3 Cerebrovascular diseases I60-I69 239 717 7.8 929.2
4 Alzheimer's disease G30 176 527 5.7 683.0
5 Infl uenza and pneumonia J09-J18 120 360 3.9 466.6
. . . All other causes . . . 1,111 3,334 36.1 4,320.9
Age Group: 85 Years and Older by Sex

HEALTHY CHICAGO REPORTS
Leading Causes of Death in Chicago, 2007-2009 80
Table 237. Average annual deaths, cumulative deaths, percentage of cumulative deaths and average age-specifi c death rate for the 5
leading causes of death in males 85 years and older, Chicago, 2007-2009
Rank Cause of death ICD-10 codeAverage
annual deathsCumulative
deaths
Percent of cumulative
deaths
Averageage-specifi cdeath rate
. . . All causes . . . 1,576 4,728 . . . 14,405.9
1 Diseases of heart I00-I09,I11,I13,I20-I51 535 1,605 33.9 4,890.3
2 Malignant neoplasms C00-C97 274 821 17.4 2,501.5
3 Cerebrovascular diseases I60-I69 100 300 6.3 914.1
4 Infl uenza and pneumonia J09-J18 80 240 5.1 731.3
5 Chronic lower respiratory diseases J40-J47 65 196 4.1 597.2
. . . All other causes . . . 522 1,566 33.1 4,771.5
Table 238. Average annual deaths, cumulative deaths, percentage of cumulative deaths and average age-specifi c death rate for the 5
leading causes of death in Hispanics 85 years and older, Chicago, 2007-2009
Rank Cause of death ICD-10 codeAverage
annual deathsCumulative
deaths
Percent of cumulative
deaths
Averageage-specifi cdeath rate
. . . All causes . . . 217 652 . . . 7,594.6
1 Diseases of heart I00-I09,I11,I13,I20-I51 61 183 28.1 2,131.6
2 Malignant neoplasms C00-C97 32 95 14.6 1,106.6
3 Cerebrovascular diseases I60-I69 16 49 7.5 570.8
4 Diabetes mellitus E10-E14 12 35 5.4 407.7
5 Septicemia A40-A41 11 33 5.1 384.4
. . . All other causes . . . 86 257 39.4 2,993.6
Table 239. Average annual deaths, cumulative deaths, percentage of cumulative deaths and average age-specifi c death rate for the 5
leading causes of death in non-Hispanic blacks 85 years and older, Chicago, 2007-2009
Rank Cause of death ICD-10 codeAverage
annual deathsCumulative
deaths
Percent of cumulative
deaths
Averageage-specifi cdeath rate
. . . All causes . . . 1,493 4,478 . . . 12,510.8
1 Diseases of heart I00-I09,I11,I13,I20-I51 446 1,337 29.9 3,735.4
2 Malignant neoplasms C00-C97 229 686 15.3 1,916.6
3 Cerebrovascular diseases I60-I69 102 306 6.8 854.9
4 Alzheimer's disease G30 95 285 6.4 796.2
5 Septicemia A40-A41 62 185 4.1 516.9
. . . All other causes . . . 560 1,679 37.5 4,690.9
Table 240. Average annual deaths, cumulative deaths, percentage of cumulative deaths and average age-specifi c death rate for the 5
leading causes of death in non-Hispanic whites 85 years and older, Chicago, 2007-2009
Rank Cause of death ICD-10 codeAverage
annual deathsCumulative
deaths
Percent of cumulative
deaths
Averageage-specifi cdeath rate
. . . All causes . . . 2,807 8,420 . . . 13,977.2
1 Diseases of heart I00-I09,I11,I13,I20-I51 1,049 3,147 37.4 5,224.0
2 Malignant neoplasms C00-C97 368 1,105 13.1 1,834.3
3 Cerebrovascular diseases I60-I69 208 624 7.4 1,035.8
4 Infl uenza and pneumonia J09-J18 126 378 4.5 627.5
5 Alzheimer's disease G30 119 357 4.2 592.6
. . . All other causes . . . 936 2,809 33.4 4,662.9
Age Group: 85 Years and Older by Race-Ethnicity

HEALTHY CHICAGO REPORTS
Leading Causes of Death in Chicago, 2007-2009 81
Table 241. Average annual deaths, cumulative deaths, percentage of cumulative deaths and average age-specifi c death rate for the 5
leading causes of death in Hispanic females 85 years and older, Chicago, 2007-2009
Rank Cause of death ICD-10 codeAverage
annual deathsCumulative
deaths
Percent of cumulative
deaths
Averageage-specifi cdeath rate
. . . All causes . . . 126 377 . . . 7,117.2
1 Diseases of heart I00-I09,I11,I13,I20-I51 37 111 29.4 2,095.5
2 Malignant neoplasms C00-C97 15 44 11.7 830.7
3 Cerebrovascular diseases I60-I69 10 30 8.0 566.4
4 Septicemia A40-A41 7 22 5.8 415.3
5 Diabetes mellitus E10-E14 6 17 4.5 320.9
5 Infl uenza and pneumonia J09-J18 6 17 4.5 320.9
. . . All other causes . . . 45 136 36.1 2,567.5
Table 242. Average annual deaths, cumulative deaths, percentage of cumulative deaths and average age-specifi c death rate for the 5
leading causes of death in non-Hispanic black females 85 years and older, Chicago, 2007-2009
Rank Cause of death ICD-10 codeAverage
annual deathsCumulative
deaths
Percent of cumulative
deaths
Averageage-specifi cdeath rate
. . . All causes . . . 1,002 3,007 . . . 11,710.4
1 Diseases of heart I00-I09,I11,I13,I20-I51 299 897 29.8 3,493.3
2 Malignant neoplasms C00-C97 123 369 12.3 1,437.0
3 Cerebrovascular diseases I60-I69 76 228 7.6 887.9
4 Alzheimer's disease G30 73 219 7.3 852.9
5 Septicemia A40-A41 43 129 4.3 502.4
. . . All other causes . . . 388 1,165 38.7 4,537.0
Table 243. Average annual deaths, cumulative deaths, percentage of cumulative deaths and average age-specifi c death rate for the 5
leading causes of death in non-Hispanic white females 85 years and older, Chicago, 2007-2009
Rank Cause of death ICD-10 codeAverage
annual deathsCumulative
deaths
Percent of cumulative
deaths
Averageage-specifi cdeath rate
. . . All causes . . . 1,866 5,599 . . . 13,135.2
1 Diseases of heart I00-I09,I11,I13,I20-I51 698 2,095 37.4 4,914.8
2 Malignant neoplasms C00-C97 226 677 12.1 1,588.2
3 Cerebrovascular diseases I60-I69 145 435 7.8 1,020.5
4 Alzheimer's disease G30 95 285 5.1 668.6
5 Chronic lower respiratory diseases J40-J47 73 218 3.9 511.4
. . . All other causes . . . 630 1,889 33.7 4,431.6
Table 244. Average annual deaths, cumulative deaths, percentage of cumulative deaths and average age-specifi c death rate for the 5
leading causes of death in Hispanic males 85 years and older, Chicago, 2007-2009
Rank Cause of death ICD-10 codeAverage
annual deathsCumulative
deaths
Percent of cumulative
deaths
Averageage-specifi cdeath rate
. . . All causes . . . 92 275 . . . 8,363.7
1 Diseases of heart I00-I09,I11,I13,I20-I51 24 72 26.2 2,189.8
2 Malignant neoplasms C00-C97 17 51 18.5 1,551.1
3 Cerebrovascular diseases I60-I69 6 19 6.9 577.9
4 Diabetes mellitus E10-E14 6 18 6.5 547.4
5 Infl uenza and pneumonia J09-J18 5 14 5.1 425.8
. . . All other causes . . . 34 101 36.7 3,071.8
Age Group: 85 Years and Older by Race-Ethnicity and Sex
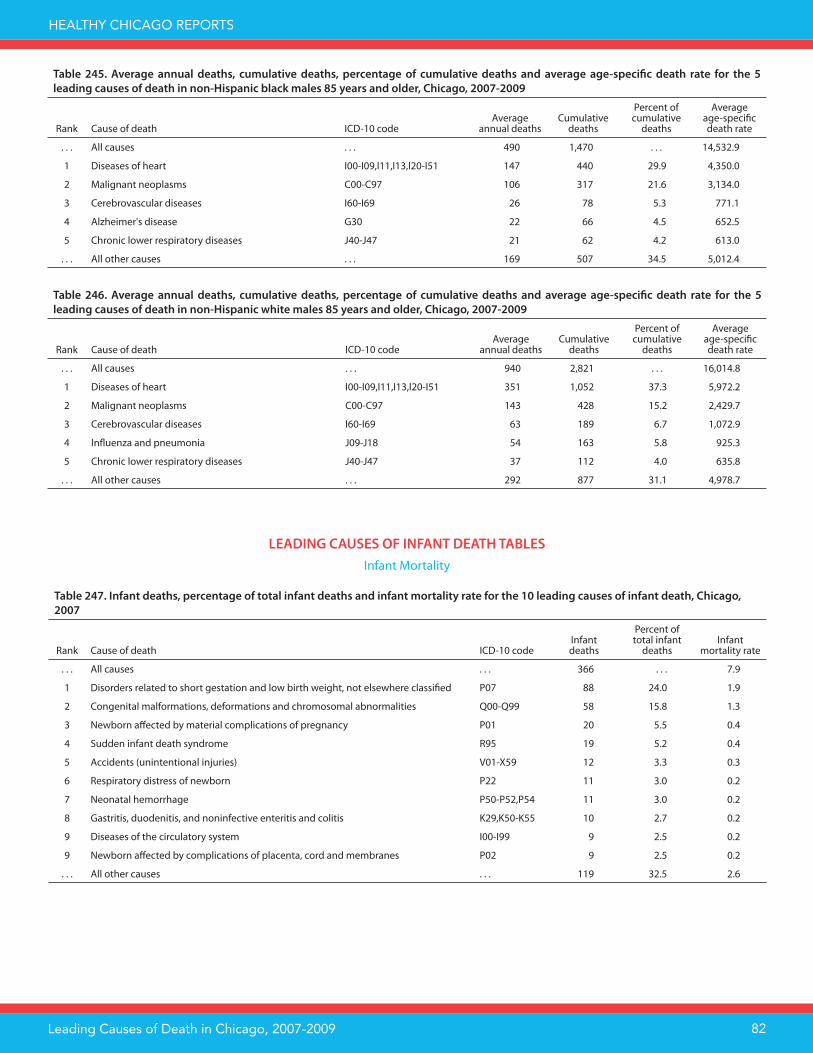
HEALTHY CHICAGO REPORTS
Leading Causes of Death in Chicago, 2007-2009 82
Table 245. Average annual deaths, cumulative deaths, percentage of cumulative deaths and average age-specifi c death rate for the 5
leading causes of death in non-Hispanic black males 85 years and older, Chicago, 2007-2009
Rank Cause of death ICD-10 codeAverage
annual deathsCumulative
deaths
Percent of cumulative
deaths
Averageage-specifi cdeath rate
. . . All causes . . . 490 1,470 . . . 14,532.9
1 Diseases of heart I00-I09,I11,I13,I20-I51 147 440 29.9 4,350.0
2 Malignant neoplasms C00-C97 106 317 21.6 3,134.0
3 Cerebrovascular diseases I60-I69 26 78 5.3 771.1
4 Alzheimer's disease G30 22 66 4.5 652.5
5 Chronic lower respiratory diseases J40-J47 21 62 4.2 613.0
. . . All other causes . . . 169 507 34.5 5,012.4
Table 246. Average annual deaths, cumulative deaths, percentage of cumulative deaths and average age-specifi c death rate for the 5
leading causes of death in non-Hispanic white males 85 years and older, Chicago, 2007-2009
Rank Cause of death ICD-10 codeAverage
annual deathsCumulative
deaths
Percent of cumulative
deaths
Averageage-specifi cdeath rate
. . . All causes . . . 940 2,821 . . . 16,014.8
1 Diseases of heart I00-I09,I11,I13,I20-I51 351 1,052 37.3 5,972.2
2 Malignant neoplasms C00-C97 143 428 15.2 2,429.7
3 Cerebrovascular diseases I60-I69 63 189 6.7 1,072.9
4 Infl uenza and pneumonia J09-J18 54 163 5.8 925.3
5 Chronic lower respiratory diseases J40-J47 37 112 4.0 635.8
. . . All other causes . . . 292 877 31.1 4,978.7
LEADING CAUSES OF INFANT DEATH TABLES
Infant Mortality
Table 247. Infant deaths, percentage of total infant deaths and infant mortality rate for the 10 leading causes of infant death, Chicago,
2007
Rank Cause of death ICD-10 codeInfantdeaths
Percent of total infant
deathsInfant
mortality rate
. . . All causes . . . 366 . . . 7.9
1 Disorders related to short gestation and low birth weight, not elsewhere classifi ed P07 88 24.0 1.9
2 Congenital malformations, deformations and chromosomal abnormalities Q00-Q99 58 15.8 1.3
3 Newborn aff ected by material complications of pregnancy P01 20 5.5 0.4
4 Sudden infant death syndrome R95 19 5.2 0.4
5 Accidents (unintentional injuries) V01-X59 12 3.3 0.3
6 Respiratory distress of newborn P22 11 3.0 0.2
7 Neonatal hemorrhage P50-P52,P54 11 3.0 0.2
8 Gastritis, duodenitis, and noninfective enteritis and colitis K29,K50-K55 10 2.7 0.2
9 Diseases of the circulatory system I00-I99 9 2.5 0.2
9 Newborn aff ected by complications of placenta, cord and membranes P02 9 2.5 0.2
. . . All other causes . . . 119 32.5 2.6

HEALTHY CHICAGO REPORTS
Leading Causes of Death in Chicago, 2007-2009 83
Table 248. Infant deaths, percentage of total infant deaths and infant mortality rate for the 10 leading causes of infant death, Chicago,
2008
Rank Cause of death ICD-10 codeInfantdeaths
Percent of total infant
deathsInfant
mortality rate
. . . All causes . . . 364 . . . 8.0
1 Disorders related to short gestation and low birth weight, not elsewhere classifi ed P07 84 23.1 1.9
2 Congenital malformations, deformations and chromosomal abnormalities Q00-Q99 63 17.3 1.4
3 Newborn aff ected by material complications of pregnancy P01 21 5.8 0.5
4 Sudden infant death syndrome R95 18 4.9 0.4
5 Accidents (unintentional injuries) V01-X59 13 3.6 0.3
6 Respiratory distress of newborn P22 12 3.3 0.3
7 Bacterial sepsis of newborn P36 11 3.0 0.2
8 Necrotizing enterocoloitis of newborn P77 10 2.7 0.2
9 Assault (homicide) X85-Y09 9 2.5 0.2
10 Newborn aff ected by complications of placenta, cord and membranes P02 7 1.9 0.2
10 Neonatal hemorrhage P50-P52,P54 7 1.9 0.2
. . . All other causes . . . 109 29.9 2.4
Table 249. Infant deaths, percentage of total infant deaths and infant mortality rate for the 10 leading causes of infant death, Chicago,
2009
Rank Cause of death ICD-10 codeInfantdeaths
Percent of total infant
deathsInfant
mortality rate
. . . All causes . . . 355 . . . 8.0
1 Disorders related to short gestation and low birth weight, not elsewhere classifi ed P07 83 23.4 1.9
2 Congenital malformations, deformations and chromosomal abnormalities Q00-Q99 52 14.6 1.2
3 Sudden infant death syndrome R95 19 5.4 0.4
4 Newborn aff ected by material complications of pregnancy P01 16 4.5 0.4
5 Respiratory distress of newborn P22 15 4.2 0.3
6 Accidents (unintentional injuries) V01-X59 13 3.7 0.3
7 Bacterial sepsis of newborn P36 12 3.4 0.3
8 Diseases of the circulatory system I00-I99 11 3.1 0.2
8 Newborn aff ected by complications of placenta, cord and membranes P02 11 3.1 0.2
10 Pulmonary hemorrhage originating in the perinatal period P26 7 2.0 0.2
. . . All other causes . . . 116 32.7 2.6

HEALTHY CHICAGO REPORTS
Leading Causes of Death in Chicago, 2007-2009 84
Table 251. Average annual infant deaths, cumulative infant deaths, percentage of cumulative infant deaths and average infant mortality
rate for the 10 leading causes of infant death in non-Hispanic blacks, Chicago, 2007-2009
Rank Cause of death ICD-10 code
Average annual infant
deathsCumulative
infant deaths
Percent of cumulative
infant deaths
Average infant
mortality rate
. . . All causes . . . 208 623 . . . 13.8
1 Disorders related to short gestation and low birth weight, not elsewhere classifi ed
P07 46 138 22.2 3.1
2 Congenital malformations, deformations and chromosomal abnormalities
Q00-Q99 24 73 11.7 1.6
3 Sudden infant death syndrome R95 12 36 5.8 0.8
4 Newborn aff ected by material complications of pregnancy P01 9 28 4.5 0.6
5 Accidents (unintentional injuries) V01-X59 9 26 4.2 0.6
6 Respiratory distress of newborn P22 8 25 4.0 0.6
7 Bacterial sepsis of newborn P36 6 19 3.0 0.4
8 Diseases of the circulatory system I00-I99 6 17 2.7 0.4
9 Assault (homicide) X85-Y09 5 16 2.6 0.4
10 Newborn aff ected by complications of placenta, cord and membranes
P02 5 15 2.4 0.3
10 Chronic respiratory disease originating in the perinatal period P27 5 15 2.4 0.3
10 Necrotizing enterocoloitis of newborn P77 5 15 2.4 0.3
. . . All other causes . . . 67 200 32.1 4.4
Table 250. Average annual infant deaths, cumulative infant deaths, percentage of cumulative infant deaths and average infant mortality
rate for the 10 leading causes of infant death in Hispanics, Chicago, 2007-2009
Rank Cause of death ICD-10 code
Average annual infant
deathsCumulative
infant deaths
Percent of cumulative
infant deaths
Average infant
mortality rate
. . . All causes . . . 96 287 . . . 5.8
1 Disorders related to short gestation and low birth weight, not elsewhere classifi ed
P07 22 66 23.0 1.3
2 Congenital malformations, deformations and chromosomal abnormalities
Q00-Q99 21 64 22.3 1.3
3 Sudden infant death syndrome R95 5 15 5.2 0.3
4 Newborn aff ected by material complications of pregnancy P01 3 10 3.5 0.2
4 Accidents (unintentional injuries) V01-X59 3 10 3.5 0.2
6 Neonatal hemorrhage P50-P52,P54 3 8 2.8 0.2
7 Diseases of the circulatory system I00-I99 2 7 2.4 0.1
7 Bacterial sepsis of newborn P36 2 7 2.4 0.1
9 Infl uenza and pneumonia J09-J18 2 6 2.1 0.1
9 Respiratory distress of newborn P22 2 6 2.1 0.1
. . . All other causes . . . 29 88 30.7 1.8
Infant Mortality by Race-Ethnicity

HEALTHY CHICAGO REPORTS
Leading Causes of Death in Chicago, 2007-2009 85
Table 252. Average annual infant deaths, cumulative infant deaths, percentage of cumulative infant deaths and average infant mortality
rate for the 5 leading causes of infant death in non-Hispanic whites, Chicago, 2007-2009
Rank Cause of death ICD-10 code
Average annual infant
deathsCumulative
infant deaths
Percent of cumulative
infant deaths
Average infant
mortality rate
. . . All causes . . . 51 153 . . . 4.6
1 Disorders related to short gestation and low birth weight, not elsewhere classifi ed
P07 14 42 27.5 1.3
2 Congenital malformations, deformations and chromosomal abnormalities
Q00-Q99 11 32 20.9 1.0
3 Newborn aff ected by material complications of pregnancy P01 6 18 11.8 0.5
4 Newborn aff ected by complications of placenta, cord and membranes
P02 3 8 5.2 0.2
5 Respiratory distress of newborn P22 2 6 3.9 0.2
. . . All other causes . . . 16 47 30.7 1.4
Table 253. Neonatal deaths and percentage of total neonatal deaths for the 5 leading causes of infant death, Chicago, 2007
Rank Cause of death ICD-10 codeNeonatal
deaths
Percent of total
neonatal deaths
. . . All causes . . . 249 . . .
1 Disorders related to short gestation and low birth weight, not elsewhere classifi ed P07 86 34.5
2 Congenital malformations, deformations and chromosomal abnormalities Q00-Q99 41 16.5
3 Newborn aff ected by material complications of pregnancy P01 20 8.0
4 Respiratory distress of newborn P22 11 4.4
4 Neonatal hemorrhage P50-P52,P54 11 4.4
. . . All other causes . . . 80 32.1
Table 254. Neonatal deaths and percentage of total neonatal deaths for the 5 leading causes of infant death, Chicago, 2008
Rank Cause of death ICD-10 codeNeonatal
deaths
Percent of total
neonatal deaths
. . . All causes . . . 235 . . .
1 Disorders related to short gestation and low birth weight, not elsewhere classifi ed P07 81 34.5
2 Congenital malformations, deformations and chromosomal abnormalities Q00-Q99 32 13.6
3 Newborn aff ected by material complications of pregnancy P01 21 8.9
4 Respiratory distress of newborn P22 12 5.1
5 Bacterial sepsis of newborn P36 11 4.7
. . . All other causes . . . 78 33.2
Table 255. Neonatal deaths and percentage of total neonatal deaths for the 5 leading causes of infant death, Chicago, 2009
Rank Cause of death ICD-10 codeNeonatal
deaths
Percent of total
neonatal deaths
. . . All causes . . . 238 . . .
1 Disorders related to short gestation and low birth weight, not elsewhere classifi ed P07 83 34.9
2 Congenital malformations, deformations and chromosomal abnormalities Q00-Q99 29 12.2
3 Newborn aff ected by material complications of pregnancy P01 16 6.7
4 Respiratory distress of newborn P22 15 6.3
5 Newborn aff ected by complications of placenta, cord and membranes P02 11 4.6
. . . All other causes . . . 84 35.3
Neonatal Mortality

HEALTHY CHICAGO REPORTS
Leading Causes of Death in Chicago, 2007-2009 86
Table 256. Average annual neonatal deaths, cumulative neonatal deaths and percentage of total neonatal deaths for 5 leading causes of
infant death in Hispanics, Chicago, 2007-2009
Rank Cause of death ICD-10 code
Average annual
neonatal deaths
Cumulative neonatal
deaths
Percent of cumulative
neonatal deaths
. . . All causes . . . 63 189 . . .
1 Disorders related to short gestation and low birth weight, not elsewhere classifi ed P07 22 65 34.4
2 Congenital malformations, deformations and chromosomal abnormalities Q00-Q99 12 36 19
3 Newborn aff ected by material complications of pregnancy P01 3 10 5.3
4 Neonatal hemorrhage P50-P52,P54 3 8 4.2
5 Bacterial sepsis of newborn P36 2 7 3.7
. . . All other causes . . . 21 63 33.3
Table 257. Average annual neonatal deaths, cumulative neonatal deaths and percentage of total neonatal deaths for 5 leading causes of
infant death in non-Hispanic blacks, Chicago, 2007-2009
Rank Cause of death ICD-10 code
Average annual
neonatal deaths
Cumulative neonatal
deaths
Percent of cumulative
neonatal deaths
. . . All causes . . . 129 388 . . .
1 Disorders related to short gestation and low birth weight, not elsewhere classifi ed P07 45 134 34.5
2 Congenital malformations, deformations and chromosomal abnormalities Q00-Q99 14 41 10.6
3 Newborn aff ected by material complications of pregnancy P01 9 28 7.2
4 Respiratory distress of newborn P22 8 25 6.4
5 Bacterial sepsis of newborn P36 5 16 4.1
. . . All other causes . . . 48 144 37.1
Table 258. Average annual neonatal deaths, cumulative neonatal deaths and percentage of total neonatal deaths for 5 leading causes of
infant death in non-Hispanic whites, Chicago, 2007-2009
Rank Cause of death ICD-10 code
Average annual
neonatal deaths
Cumulative neonatal
deaths
Percent of cumulative
neonatal deaths
. . . All causes . . . 43 128 . . .
1 Disorders related to short gestation and low birth weight, not elsewhere classifi ed P07 14 42 32.8
2 Congenital malformations, deformations and chromosomal abnormalities Q00-Q99 8 23 18.0
3 Newborn aff ected by material complications of pregnancy P01 6 18 14.1
4 Newborn aff ected by complications of placenta, cord and membranes P02 3 8 6.3
5 Respiratory distress of newborn P22 2 6 4.7
. . . All other causes . . . 10 31 24.2
Neonatal Mortality by Race-Ethnicity
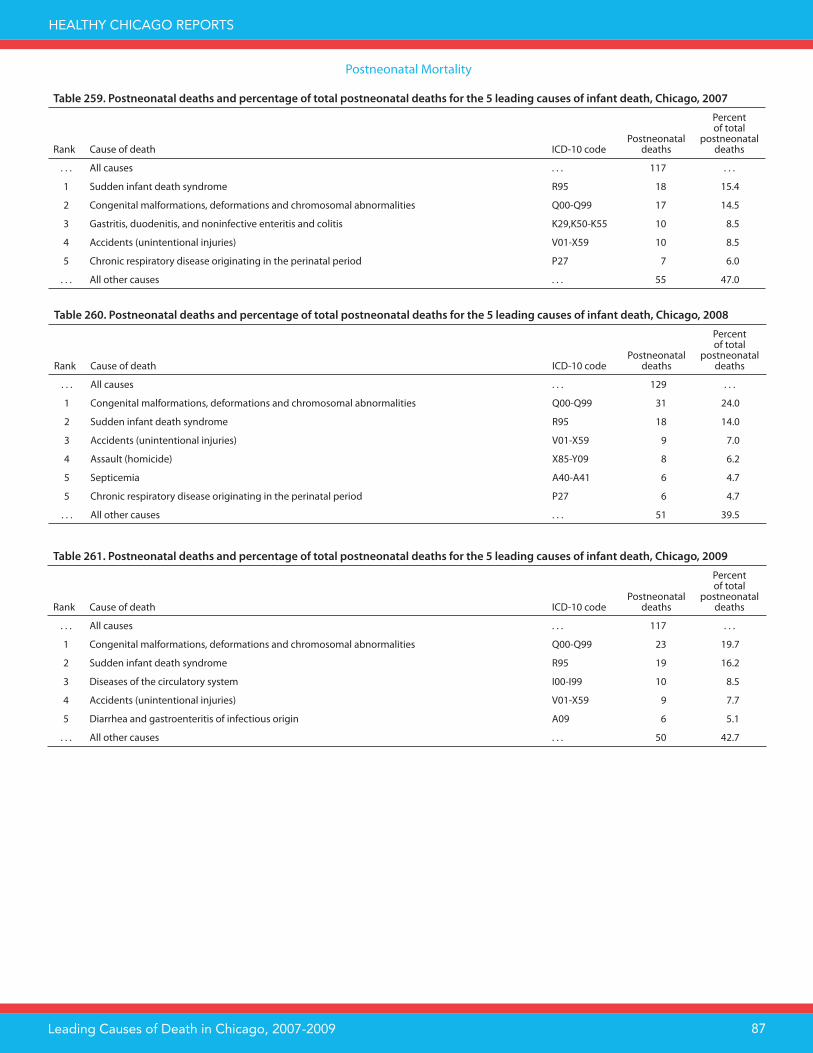
HEALTHY CHICAGO REPORTS
Leading Causes of Death in Chicago, 2007-2009 87
Table 260. Postneonatal deaths and percentage of total postneonatal deaths for the 5 leading causes of infant death, Chicago, 2008
Rank Cause of death ICD-10 codePostneonatal
deaths
Percent of total
postneonatal deaths
. . . All causes . . . 129 . . .
1 Congenital malformations, deformations and chromosomal abnormalities Q00-Q99 31 24.0
2 Sudden infant death syndrome R95 18 14.0
3 Accidents (unintentional injuries) V01-X59 9 7.0
4 Assault (homicide) X85-Y09 8 6.2
5 Septicemia A40-A41 6 4.7
5 Chronic respiratory disease originating in the perinatal period P27 6 4.7
. . . All other causes . . . 51 39.5
Table 261. Postneonatal deaths and percentage of total postneonatal deaths for the 5 leading causes of infant death, Chicago, 2009
Rank Cause of death ICD-10 codePostneonatal
deaths
Percent of total
postneonatal deaths
. . . All causes . . . 117 . . .
1 Congenital malformations, deformations and chromosomal abnormalities Q00-Q99 23 19.7
2 Sudden infant death syndrome R95 19 16.2
3 Diseases of the circulatory system I00-I99 10 8.5
4 Accidents (unintentional injuries) V01-X59 9 7.7
5 Diarrhea and gastroenteritis of infectious origin A09 6 5.1
. . . All other causes . . . 50 42.7
Table 259. Postneonatal deaths and percentage of total postneonatal deaths for the 5 leading causes of infant death, Chicago, 2007
Rank Cause of death ICD-10 codePostneonatal
deaths
Percent of total
postneonatal deaths
. . . All causes . . . 117 . . .
1 Sudden infant death syndrome R95 18 15.4
2 Congenital malformations, deformations and chromosomal abnormalities Q00-Q99 17 14.5
3 Gastritis, duodenitis, and noninfective enteritis and colitis K29,K50-K55 10 8.5
4 Accidents (unintentional injuries) V01-X59 10 8.5
5 Chronic respiratory disease originating in the perinatal period P27 7 6.0
. . . All other causes . . . 55 47.0
Postneonatal Mortality

HEALTHY CHICAGO REPORTS
Leading Causes of Death in Chicago, 2007-2009 88
Table 263. Average annual postneonatal deaths, cumulative postneonatal deaths and percentage of cumulative postneonatal deaths for 5
leading causes of infant death in non-Hispanic blacks, Chicago, 2007-2009
Rank Cause of death ICD-10 code
Average annual
postneonatal deaths
Cumulative postneonatal
deaths
Percent of cumulative
postneonatal deaths
. . . All causes . . . 78 235 . . .
1 Sudden infant death syndrome R95 12 35 14.9
2 Congenital malformations, deformations and chromosomal abnormalities Q00-Q99 11 32 13.6
3 Accidents (unintentional injuries) V01-X59 6 18 7.7
4 Assault (homicide) X85-Y09 5 15 6.4
5 Chronic respiratory disease originating in the perinatal period P27 5 14 6.0
. . . All other causes . . . 40 121 51.5
Table 262. Average annual postneonatal deaths, cumulative postneonatal deaths and percentage of cumulative postneonatal deaths for 5
leading causes of infant death in Hispanics, Chicago, 2007-2009
Rank Cause of death ICD-10 code
Average annual
postneonatal deaths
Cumulative postneonatal
deaths
Percent of cumulative
postneonatal deaths
. . . All causes . . . 33 98 . . .
1 Congenital malformations, deformations and chromosomal abnormalities Q00-Q99 9 28 28.6
2 Sudden infant death syndrome R95 5 15 15.3
3 Accidents (unintentional injuries) V01-X59 3 8 8.2
4 Diseases of the circulatory system I00-I99 2 6 6.1
4 Infl uenza and pneumonia J09-J18 2 6 6.1
. . . All other causes . . . 12 35 35.7
Postneonatal Mortality by Race-Ethnicity

HEALTHY CHICAGO REPORTS
Leading Causes of Death in Chicago, 2007-2009 89
TECHNICAL NOTES
Data SourcesTh e Chicago Department of Public Health (CDPH)
generated the tables and fi gures using geocoded annual death certifi cate and birth certifi cate datasets supplied by the Illinois Department of Public Health (IDPH). Th e death certifi cate datasets are comprised of data for registered deaths to persons who resided in Chicago at the time of death. Th e 1989 revision of the U.S. Standard Certifi cate of Death was used in Illinois in 2007 (see Figure 7). Beginning in 2008 in Illinois, the 2003 revision of the U.S. Standard Certifi cate of Death was used (see Figure 8). Th e birth certifi cate datasets are comprised of data for registered births to women who resided in Chicago at the time of birth. During 2007-2009, the 1989 revision of the U.S. Standard Certifi cate of Live Birth was used in Illinois.1
Geocoding is the process of using location data, such as street address, to determine associated geographic identifi ers, such as latitude and longitude, postal code, or community area. Approximately 1% of births and 1% of deaths per year in the birth and death certifi cate datasets are classifi ed as Chicago residents but are not geocoded to a particular community area; these records are included in citywide counts and analyses only. Births and deaths classifi ed as Chicago but for which the census tract of residence is located outside the city limits were excluded. Th e source of annual population estimates for racial-ethnic groups, specifi c age groups and Chicago community areas was a linear interpolation of counts from the 2000 and 2010 United States Census.2
Ranking Causes of Death3-5
Th e underlying cause of death is the main disease, accident or injury that caused the death, and not necessarily the fi rst medical condition listed on the death certifi cate. Death certifi cates are generally completed by a funeral director, physician, coroner or medical examiner, and then submitted to a state’s department of health or other agency. At the state agency, automated coding software is used to translate the submitted information into International Classifi cation of Diseases, Tenth Revision (ICD-10) codes, and according to set algorithms, an underlying cause of death is determined.
Lists of rankable causes of death have been developed and revised over time by the National Center for Health Statistics (NCHS) in conjunction with the ICD system and based on the recommendations from the Public Health Conference on Records and Statistics in 1951. Th ese lists standardize the reporting of mortality data, making it easier to compare data between diff erent time periods and geographic locations. Th e lists aggregate detailed categories of diseases and related health problems into appropriate groupings, as well as highlight causes of death of public health and medical importance.
Not all causes of death are considered rankable. For example, sub-categories listed on the “List of 113 Selected Causes of Death” (e.g. malignant neoplasm of breast) are not ranked, only the larger category (e.g., malignant neoplasms) is considered for ranking purposes. Other causes of death that are not considered when ranking are those considered to be in a “remainder” category. For example, “Other diseases of the respiratory system” is not ranked. For infant deaths (under 1 year), neonatal deaths (under 28 days) and postneonatal deaths (28 days through 11 months), the number of deaths from each of the rankable causes from the “List of 130 Selected Causes of Infant Death” was tabulated. For all other age groups, the number of deaths from each of the rankable causes from the “List of 113 Selected Causes of Death” was determined. Th e rankable causes from each of the aforementioned lists are found in Tables 264 and 265.
Limitations of the Death Certifi cateTh e reliability and validity of the data originating from
death certifi cates has been researched previously by comparing death certifi cate data with results from autopsy and medical record reviews as well as the National Longitudinal Mortality Study, which compared a sample of records from the National Death Index and U.S. Census.6-10 Th ese studies have demonstrated signifi cant misreporting of cause of death, especially the over-reporting of heart disease.6,9 Increasing levels of training and education of physicians responsible for completing death certifi cates and enhanced quality assurance are cited as ways to increase the reliability and validity of cause of death reporting.6,9,11-13
Reporting of race-ethnicity on the death certifi cate is subject to misclassifi cation. Unlike the Census, where individuals can self-identify as a particular race and/or ethnicity, the funeral director collects this information for the death certifi cate from family members of the deceased or uses his or her own judgement. NCHS recommends using caution when interpreting death data for American Indian, Alaskan Native, Asian, Pacifi c Islander and Hispanic populations due to estimates of misclassifi cation ranging from 5% in Hispanics to 30% for American Indians and Alaskan Natives.3,7,8,10
Race-EthnicityTh e number of death certifi cate records for which race-
ethnicity was given as other, unknown, or missing increased from 44 (0.2% of all deaths) in 2007 to 270 (1.4%) in 2008. Th is increase is thought to be the result of multiple factors including the change from using the 1989 revision of the U.S. Standard Certifi cate of Death to the 2003 revision, which changed how racial and ethnic information was recorded, and the implementation of electronic death reporting in Illinois. In the 2009 dataset, 125 records (0.7% of all deaths) had race-

HEALTHY CHICAGO REPORTS
Leading Causes of Death in Chicago, 2007-2009 90
Figure 7. 1989 revision of the U.S. Standard Certifi cate of Death

HEALTHY CHICAGO REPORTS
Leading Causes of Death in Chicago, 2007-2009 91
(continued on next page)
Figure 8. 2003 revision of the U.S. Standard Certifi cate of Death

HEALTHY CHICAGO REPORTS
Leading Causes of Death in Chicago, 2007-2009 92
Figure 8. 2003 revision of the U.S. Standard Certifi cate of Death (continued)
ethnicity given as other, unknown, or missing. To facilitate comparisons of results across years and race-
ethnicity categories, three imputation methods were used. For infant deaths, if the matching birth certifi cate was located, the maternal race-ethnicity was used for the infant. For cancer deaths, race-ethnicity recorded in the Illinois State Cancer Registry14 was used. For the remaining records, race-ethnicity was imputed by adapting a method used by NCHS for race-bridging.15 To implement this, a table was created that contained population estimates from the 2009 5-year American Community Survey (ACS) for each race category (Asian, black, Native American, Pacifi c Islander, white) and ethnicity category (Hispanic or non-Hispanic) by Chicago census tract. Th ese estimates were then joined to each record to be imputed in the death certifi cate dataset based on the decedent’s sex, age group, and reported census tract of residence at time of death. (Records without a census tract were joined to population estimates pertaining to Chicago.) Two random numbers, both between 0 and 1, were generated for each record.
One random number was used to assign the record a ethnicity value: for example, if the distribution of ethnicities in the ACS fi le for the sex, age group, and tract was 70% Hispanic and 30% non-Hispanic, and the random number for ethnicity was 0.72, the ethnicity value assigned was non-Hispanic. For records assigned a non-Hispanic ethnicity, the second random number was used to assign a race value: for example, if the distribution of races in the ACS fi le for the sex, age group, and tract was 5% Asian, 55% black, 1% Native American, 4% Pacifi c Islander, and 35% white, and the random number for race was 0.46, the race value assigned was black. In this report, 365 records (0.5% of all deaths in 2007-2009) had race-ethnicity imputed using this method.
Data ReportingFor some subgroups only the top 3 or 5 leading causes of
death are reported, rather than the top 10, for purposes of safeguarding privacy and facilitating valid comparisons. In the case of a tie, deaths are listed in order of their appearance in the ICD-10. In order to enhance the reliability of estimates and comparisons for tables stratifi ed by community area or multiple variables (e.g., specifi c age group and sex and race-ethnicity), deaths were aggregated over 2007-2009 for ranking leading causes of cumulative deaths and for calculating percentages of cumulative deaths and average death rates. For these tables, an average annual number of deaths is also provided. Cumulative death counts less than 5 and their corresponding secondary calculations were suppressed. Complimentary suppression was implemented where needed. Suppressed data is indicated by an “--” in the tables.
Defi nitionsTh e crude death rate is the total number of deaths to
persons from a specifi c geographic area (city, community area, etc.) divided by the total population for that same geographic area for a specifi ed time period, multiplied by 100,000. Crude death rates are not appropriate for comparison of diff erent populations or geographic areas due to the signifi cant impact of age in mortality data and diff ering age-distributions between populations.16
Th e age-adjusted death rate is a death rate that controls for the eff ects of diff erences in population age distributions. Th e age-adjusted rate is hypothetical, and is useful only for comparing populations, either over time, by geographic area, by sex or by racial-ethnic subgroups. Age-adjusted rates do not refl ect the absolute frequency of the event in a population in the way crude death rates do. Th e age-adjusted death rate is the

HEALTHY CHICAGO REPORTS
Leading Causes of Death in Chicago, 2007-2009 93
Table 264. Rankable causes of death
Cause of death ICD-10 code
Salmonella infections A01-A02Shigellosis and amebiasis A03,A06Tuberculosis A16-A19Whooping cough A37Scarlet fever and erysipelas A38,A46Meningococcal infection A39Septicemia A40-A41Syphilis A50-A53Acute poliomyelitis A80Arthropod-borne viral encephalitis A83-A84,A85.2Measles B05Viral hepatitis B15-B19Human immunodefi ciency virus (HIV) disease B20-B24Measles B50-B54Malignant neoplasms C00-C97In situ neoplasms, benign neoplasms and neoplasms of uncertain or unknown behavior
D00-D48
Anemias D50-D64Diabetes mellitus E10-E14Nutritional defi ciencies E40-E64Meningitis G00,G03Parkinson's disease G20-G21Alzheimer's disease G30Diseases of heart I00-I09,I11,I13,I20-I51Essential hypertension and hypertensive renal disease
I10,I12,I15
Cerebrovascular diseases I60-I69Atherosclerosis I70Aortic aneurysm and dissection I71Infl uenza and pneumonia J09-J18Acute bronchitis and bronchiolitis J20-J21Chronic lower respiratory diseases J40-J47Pneumoconioses and chemical eff ects J60-J66,J68Pneumonitis due to solids and liquids J69Peptic ulcer K25-K28Diseases of appendix K35-K38Hernia K40-K46Chronic liver disease and cirrhosis K70,K73-K74Cholelithiasis and other disorders of gallbladder
K80-K82
Nephritis, nephrotic syndrome and nephrosis N00-N07,N17-N19,N25-N27Infections of kidney N10-N12,N13.6,N15.1Hyperplasia of prostate N40Infl ammatory diseases of female pelvic organs
N70-N76
Pregnancy, childbirth and puerperium O00-O99Certain conditions originating in the perinatal period
P00-P96
Congenital malformations, deformations and chromosomal abnormalities
Q00-Q99
Accidents (unintentional injuries) V01-X59,Y85-Y86Intentional self-harm (suicide) X60-X84,Y87.0Assault (homicide) X85-Y09,Y87.1Legal intervention Y35,Y89.0Operations of war and their sequelae Y36,Y89.1Complications of medical and surgical care Y40-Y84,Y88Enterocolitis due to Clostridium diffi cile A04.7
weighted average of the age-specifi c death rates observed in a population, with the weights derived from the age distribution of an external population standard, such as the U.S. 2000 standard population. Diff erent standard populations have diff erent age distributions and the choice will aff ect the resulting age-adjusted rate. Age-adjustment was performed in this report using a slight modifi cation of the direct method to the 2000 U.S. standard million population. (Specifi cally, using standard distribution 1, the less than 1 year old and 1 – 4 years old groups were combined.)16,17 Like the crude death rate, the age-adjusted death rate is the number of deaths per 100,000.
Th e age-specifi c death rate is the total number of deaths to persons of a specifi c age or age category and from a specifi c geographic area divided by the total population for that same age or age category and geographic area for a specifi ed time period, multiplied by 100,000. Th e infant mortality rate is the number of persons from a specifi c geographic area who died before reaching the age of one year, divided by the number of live births for that same geographic area during the same specifi ed time period; this proportion is then multiplied by 1,000 to represent the approximate number of infant deaths per 1,000 live births.16,17
Rates calculated for those tables reporting leading causes of deaths from 2007-2009 combined are averages. For instance, the average crude death rate was calculated by totaling the number of deaths for 2007-2009 and dividing by sum of the population estimates for 2007, 2008 and 2009. Th e average annual number of deaths was calculated by totaling the number of deaths for 2007-2009 and dividing by three.
DisclaimersIDPH specifi cally disclaims responsibility for any analysis,
interpretations, or conclusions. Th e population counts used in the rate calculations are estimates, and this potential source of error should be taken into account when considering the precision of the indicators. Error can result from geocoding due to inaccurate or incomplete source data (e.g., the recording of a person’s residential residence does not include “North” or “South”) or discrepancies in the reference data used to match addresses to their associated geographies (e.g., a particular street segment is excluded or associated to corresponding geographies incorrectly). Th is potential source of error should be taken into account when considering the precision of community area measures. Rate and percentage estimates in which fewer than 20 deaths (or births) were reported are unreliable; this instability should also be considered when making comparisons. Methods and data sources may not be identical to those used in CDPH reports published prior to September 2013.

HEALTHY CHICAGO REPORTS
Leading Causes of Death in Chicago, 2007-2009 94
Table 265. Rankable causes of infant death
Cause of death ICD-10 code Cause of death ICD-10 code
Diarrhea and gastroenteritis of infectious origin A09 Gastritis, duodenitis, and noninfective enteritis and colitis K29,K50-K55Tuberculosis A16-A19 Hernia of the abdominal cavity and intestinal obstruction
without herniaK40-K45,K56
Tetanus A33,A35 Renal failure and other disorders of kidney N17-N19,N25,N27Diptheria A36 Newborn aff ected by maternal hypertensive disorders P00.0Whooping cough A37 Newborn aff ected by other maternal conditions which
may be unrelated to present pregnancyP00.1-P00.9
Meningococcal infection A39 Newborn aff ected by material complications of pregnancy
P01
Septicemia A40-A41 Newborn aff ected by complications of placenta, cord and membranes
P02
Congenital syphilis A50 Newborn aff ected by other complications of labor and delivery
P03
Gonococcal infection A54 Newborn aff ected by noxious infl uences transmitted via placenta or breast milk
P04
Acute poliomyelitis A80 Slow fetal growth and fetal malnutrition P05Varicella (chickenpox) B01 Disorders related to short gestation and low birth weight,
not elsewhere classifi edP07
Measles B05 Disorders related to long gestation and high birth weight P08Human immunodefi ciency virus (HIV) disease B20-B24 Birth trauma P10-P15Mumps B26 Intrauterine hypoxia and birth asphyxia P20-P21Candidiasis B37 Respiratory distress of newborn P22Malaria B50-B54 Congenital pneumonia P23Pneumocystosis B59 Neonatal aspiration syndrome P24Malignant neoplasms C00-C97 Interstitial emphysema and related conditions originating
in the perinatal periodP25
In situ neoplasms, benign neoplasms and neoplasms of uncertain or unknown behavior
D00-D48 Pulmonary hemorrhage originating in the perinatal period
P26
Diseases of the blood and blood-forming organs and certain disorders involving the immune mechanism
D50-D89 Chronic respiratory disease originating in the perinatal period
P27
Short stature, not elsewhere classifi ed E34.3 Atelectasis P28.0-P28.1Nutritional defi ciencies E40-E64 Bacterial sepsis of newborn P36Cystic fi brosis E84 Omphalitis of newborn with or without mild hemorrhage P38Volume depletion, disorders of fl uid electrolyte and acid-base balance
E86-E87 Neonatal hemorrhage P50-P52,P54
Meningitis G00,G03 Hemorrhagic disease of newborn P53Infantile spinal muscular atrophy, type I (Werdnig-Hoff man)
G12.0 Hemolytic disease of newborn due to isoimmunization and other perinatal jaundice
P55-P59
Infantile cerebral palsy G80 Hematological disorders P60-P61Anoxic brain damage, not elsewhere classifi ed G93.1 Syndrome of infant of a diabetic mother and neonatal
diabetes mellitusP70.0-P70.2
Diseases of the ear and mastoid process H60-H93 Necrotizing enterocolitis of newborn P77Diseases of the circulatory system I00-I99 Hydrops fetalis not due to hemolytic disease P83.2Acute upper respiratory infections J00-J06 Congenital malformations, deformations and
chromosomal abnormalitiesQ00-Q99
Infl uenza and pneumonia J09-J18 Sudden infant death syndrome R95Acute bronchitis and bronchiolitis J20-J21 Accidents (unintentional injuries) V01-X59Bronchitis, chronic and unspecifi ed J40-J42 Assault (homicide) X85-Y09Asthma J45-J46 Complications of medical and surgical care Y40-Y84Pneumonitis due to solids and liquids J69
References1. Bocskay KA, Harper-Jemison DM, Clark J, Paik E, Jones RC.
Births in Chicago, 1999-2009. City of Chicago, 2012. 2. Rosenberg D. Trend Analysis and Interpretation: Key Concepts
and Methods for Maternal and Child Health Professionals. Division of Science, Education and Analysis, Maternal & Child Health Bureau, Health Resources & Service Administration, Public Health Service, U.S. Department of Health & Human Services, Rockville, Maryland: December 1997.
3. Heron M. Deaths: Leading causes for 2009. National vital statistics reports; vol 61 no 7. Hyattsville, MD: National Center for Health Statistics. 2012.
4. Dimick C. Mortality Coding Marks 10 Years of ICD-10. Journal of AHIMA. 80: 30-3. 2009.
5. Harper-Jemison DM, Th omas SD, Woldemichael G. Leading causes of Death in Chicago. Health Status Index Series: Vol. XVIII No. II. Chicago, Illinois: Chicago Department of Public Health Offi ce of Epidemiology, 2009.

HEALTHY CHICAGO REPORTS
Leading Causes of Death in Chicago, 2007-2009 95
6. Agarwal R, Norton JM, Konty K, et al. Overreporting of Deaths from Coronary Heart Disease in New York City Hospitals, 2003. Prev Chronic Dis. 2010;7(3):1-9.
7. Arias E, Eschbach K, Schauman WS, et al. Th e Hispanic Mortality Advantage and Ethnic Misclassifi cation on US Death Certifi cates. Am J Public Health. 2010;100:S171-S177.
8. Arias E, Schauman ES, Eschbacj K, Sorlie PD, Backland E. Th e validity of race and Hispanic origin reporting on death certifi cates in the United States. National Center for Health Statistics. Vital Health Stat 2(148). 2008.
9. Myers KA, Farquhar RE. Improving the accuracy of death certifi cation. CMAJ. 1998;158(10):1317-23.
10. Sorlie PD, Rogot E, Johnson NJ. Validity of Demographic Characteristics on the Death Certifi cate. Epidemiology. 1992;3:181-4.
11. Madsen A, Th ihalolipavan S, Maduro G, et al. An Intervention to Improve Cause of Death Reporting in New York City Hospitals, 2009-2010. Prev Chronic Dis. 2012;9:120071.
12. Al-Samarrai T, Madsen A, Zimmerman R, et al. Impact of a Hospital-Level Intervention to Reduce Heart Disease Overreporting on Leading Causes of Death. Prev Chronic Dis. 2013;10:120210.
13. Barber JB. Improving Accuracy of Death Certifi cates. J Natl Med Assoc. 1992;84(12):1007-8.
14. Illinois Department of Public Health, Illinois State Cancer Registry. http://www.idph.state.il.us/about/epi/cancer_registry.htm. Accessed on September 6, 2013.
15. Division of Vital Statistics, National Center for Health Statistics, Centers for Disease Control and Prevention. NCHS Procedures for Multiple-Race and Hispanic Origin Data: Collection, Coding, Editing and Transmitting. May 7, 2004.
16. National Association for Public Health Statistics and Informa-tion Systems. http://www.naphsis.org/Pages/StatisticalMea-suresandDefi nitions.aspx. Accessed on September 6, 2013.
17. Klein RJ, Schoenborn CA. Age adjustment using the 2000 projected U.S. population. Healthy People Statistical Notes, no. 20. Hyattsville, Maryland: National Center for Health Statistics. January 2001.

96
LEADING CAUSES OF DEATH IN CHICAGO, 2007-2009
Chicago Department of Public HealthBechara Choucair, MDCommissioner
Epidemiology & Public Health Informatics ProgramRoderick Jones, MPHDirector of Epidemiology
REPORTED BYRoderick Jones, MPHDirector of Epidemiology
Dana Harper-JemisonEpidemiologist II
Jamyia Clark, MPHEpidemiologist II
Kirsti Bocskay, PhD, MPHEpidemiologist IV
For their contributions to the preparation of this report, we thank: Bechara Choucair, MD, Joseph Hollendoner, MSW, Brain Richardson, MBA, Chicago Department of Public Health; Lori Koch, BA, CCRP, CTR, Illinois State Cancer Registry, Illinois Department of Public Health; Bijou Hunt, MA, Sinai Urban Health Institute; Jennifer Makelarski, PhD, MPH, Roopa Seshadri, PhD, AM, University of Chicago; and Richard Barrett, PhD, Dima Qato, PharmD, MPH, PhD, University of Illinois at Chicago.
Suggested citation: Jones RC, Harper-Jemison DM, Clark J, Bocskay KA. Leading Causes of Death in Chicago, 2007-2009. City of Chicago, 2013.


