126
INFORMING EFFORTS TO ACHIEVE HEALTH EQUITY 2016 ͳ 2020 COMMUNITY HEALTH ASSESSMENT: HEALTHY CHICAGO 2.0 In coordinaƟon with the Partnership for Healthy Chicago

INFORMING EFFORTS TO ACHIEVE HEALTH EQUITY2 0 1 6 2 0 2 0
COMMUNITY HEALTH ASSESSMENT:
HEALTHY CHICAGO 2.0
In coordina on with the Partnership for Healthy Chicago

LEAD AUTHORS:Sheri Cohen, MPHNikhil Prachand, MPHKirs Bocskay, PhD, MPhil, MPHJanis Sayer, MSWTina Schuh, MPH
SUGGESTED CITATION:Cohen S, Prachand N, Bocskay K, Sayer J, Schuh T. Healthy Chicago 2.0 Community Health Assessment: Informing Eff orts to Achieve Health Equity. Chicago Department of Public Health, February 2016.

TABLE OF CONTENTSINTRODUCTION
PHASE 1: Organize for Success/Partnership Development
PHASE 2: Develop the Vision
PHASE 3: Conduct the 4 MAPP Assessments A Community Health Status
B Community Themes and Strengths
C Forces of Change
D Local Public Health System Capacity
PHASE 4: Iden fying Strategic Issues and Ac on Areas
PHASE 5: Formulate Goals, Objec ves and Strategies
ACKNOWLEDGMENTS
APPENDICES
1. Community Health Assets
2. Community Themes and Strength Assessment
A Online Neighborhood Survey
B Facilitator Guide for Community Conversa ons
C Focus Group Facilitator Guide
D Oral History Guide
3. MAPP Health Equity Supplement
HEALTHY CHICAGO 2.0
Community Health Assessment: Informing Eff orts to Achieve Health Equity
1
2
4
5
455763
72
81
82
86
87
9599
100102104

HEALTHY CHICAGO 2.0
Community Health Assessment:1
INTRODUCTIONThe Chicago Department of Public Health (CDPH) collaborated with the Partnership for Healthy Chicago (Partnership), a public-private partnership comprised of over 35 mul -sector members, to complete Healthy Chicago 2.0, a comprehensive, four-year community health assessment and community improvement plan for the city of Chicago. This report details the purpose, process and fi ndings of the assessment that led to the development of the improvement plan, Healthy Chicago 2.0: Partnering to Improve Health Equity 2016-2020.
Purpose: Conduc ng a community health assessment and developing a health improvement plan supports the mission of CDPH, “To promote and improve health by en-gaging residents, communi es and partners in establishing and implemen ng policies and services that priori ze resi-dents and communi es with the greatest need.” CDPH, the local public health authority for the city of Chicago, uses the fi ndings from the assessment to guide its work with partners toward popula ons at most risk. This is one of the components of the Ten Essen al Public Health Services framework developed by US Public Health Service agencies and other major public health organiza ons. The Healthy Chicago 2.0 assessment and plan work also adheres to CDPH’s requirements for public health accredita on by the Na onal Public Health Accredita on Board and for local health department cer fi ca on by the State of Illinois.
Inherent in CDPH’s mission is a focus on health equity, which is defi ned by the US Department of Health and Human Services’ Healthy People 2020 (HP 2020) health promo on and disease preven on ini a ve as the a ainment of the highest level of health for all people. Healthy Chicago 2.0 u lized a health equity lens for both the assessment and development of the plan through focused discussions, data collec on and broad-based par cipa on of community residents and public health stakeholders.
Process: CDPH and the Partnership u lized the Mobilizing for Ac on through Planning and Partnerships (MAPP) tool, developed by the Na onal Associa on for County and City Health Offi cials (NACCHO) in coopera on with the Centers for Disease Control & Preven on (CDC). MAPP is a community-wide strategic planning framework that assesses mul ple aspects of community health and guides development of priority ac on areas based on strategic issues.
This report documents CDPH and the Partnership’s journey through the following MAPP process and presents each phase’s purpose, process and fi ndings (as appropriate):
PHASE 1: Organize for Success/Partnership Development
PHASE 2: Develop the Vision
PHASE 3: Conduct the 4 MAPP Assessments 3a: Community Health Status 3b: Community Themes and Strengths 3c: Forces of Change 3d: Local Public Health System
PHASE 4: Iden fy Strategic Issues and Ac on Areas
PHASE 5: Formulate Goals, Objec ves and Strategies
The results of this comprehensive assessment (i.e., the ac on areas’ goals, objec ves and strategies) are detailed in the Healthy Chicago 2.0 Community Health Improvement Plan. In addi on, the plan outlines our eff orts toward health equity, Health in All Policies and becoming a trauma-informed city.
The last phase of MAPP, PHASE 6: Ac on Cycle, is an ongoing eff ort consis ng of implementa on, monitoring, evalua on and adjustment based on these fi ndings. CDPH will conduct this in collabora on with our public health partners who implement and advise the strategies. We will work with a leadership team of community experts on each priority ac on area and the Partnership for Healthy Chicago. Updates will be shared through quarterly communica ons and an annual mee ng will provide more detailed informa on on the progress of our work.

HEALTHY CHICAGO 2.0
Informing Eff orts to Achieve Health Equity 2
PHASE 1: ORGANIZE FOR SUCCESS/PARTNERSHIP DEVELOPMENT
Purpose: Community engagement and partnership development are the founda on of Healthy Chicago 2.0, an assessment and plan conducted by and implemented with community and public health stakeholders. Healthy Chicago 2.0 defi nes health broadly, encompassing social and structural determinants of health and issues of health equity, which underscore the importance of engaging a wide array of partners whose eff orts focus within these areas. Therefore, the partnership development phase engaged representa ves from diverse sectors of the public health system and the community to incorporate these unique perspec ves.
Process: One method CDPH used to engage diverse system representa ves was to work with the Partnership for Healthy Chicago (Partnership). The Partnership has a long history of working with CDPH on community health assessments and improvement plans, comple ng three plans since its forma on in 1998. The Partnership’s mission is to align stakeholders to strengthen Chicago’s public health system. The Partnership is co-chaired by CDPH and a community organiza on, staff ed by CDPH and includes representa ves from the following sectors: provider associa ons, social service agencies, policy and advocacy organiza ons, business, faith-based organiza- ons, medical-legal partnerships, academia and research,
educa on and City and other governmental agencies (see Acknowledgments Sec on).
THE PARTNERSHIP FOR
FAITH BASED
ACADEMIA/ RESEARCH
SOCIAL SERVICES
PLANNING, POLICY & ADVOCACY
OTHER GOVERNMENTBUSINESSPROVIDERS MEDICAL LEGAL
PARTNERSHIPSCITY
GOVERNMENT
Campaign for Be er Health Care
Center for Faith and Community Health Transforma on
Chicago Board of Health
Chicago CHW Local Network
Chicago Coali on for the Homeless
Chicago Department of Family & Support Services
Chicago Department of Public Health
Chicago Housing Authority
Chicago Lawyers’ Commi ee for Civil Rights Under Law, LLC
Chicago Metropolitan Agency for Planning
Chicago Park District
Chicago Police Department
Chicago Public Schools
Chicagoland Chamber of Commerce
Consor um to Lower Obesity in Chicago Children
Cook County Health & Hospitals System
EverThrive IL
Health & Medicine Policy Research Group
Heartland Alliance for Human Needs & Human Rights
Illinois Department of Public Health
Illinois Health and Hospital Associa on (formerly opera ng as the Metropolitan Chicago Healthcare Council)
Illinois Nurses Associa on
Illinois Partners for Human Service
Illinois Primary Health Care Associa on
Illinois Public Health Ins tute
Ins tute of Medicine-Chicago
Local Ini a ves Support Corpora on Chicago
Loyola University Health Jus ce Project
Mayor’s Offi ce for People with Disabili es
Metropolitan Planning Council
Metropolitan Tenants Organiza on
Northwestern University Center for Community Health
Oral Health Forum
Playworks
Public Health Ins tute of Metropolitan Chicago
Respiratory Health Associa on
Sinai Urban Health Ins tute
University of Illinois at Chicago, School of Public Health

HEALTHY CHICAGO 2.0
Community Health Assessment:3
CDPH also sought more community engagement with organiza ons and residents in all stages of the assessment and plan development. As will be further described in this report, CDPH held eight community conversa ons to solicit stakeholder and resident feedback while providing a forum for meaningful discussion; fi ve were held during the assessment phase and three were directed toward imple-menta on. CDPH also shared informa on and updates on the assessment process through our listserv, Facebook account
and posted informa on and PowerPoint presenta on on the Healthy Chicago 2.0 website. Many of these partners were ac vely involved in the assessment and planning phases, par cipa ng on the Ac on Teams that met over a four-month period to develop goals, objec ves and strategies for the ac on issues. In addi on, many of these partners agreed to take primary responsibility for strategies iden fi ed in Healthy Chicago 2.0, which will then solidify these collabora ve eff orts throughout the four-year plan and beyond.

HEALTHY CHICAGO 2.0
Informing Eff orts to Achieve Health Equity 4
PHASE 2: Develop the Vision
Purpose: The purpose of Healthy Chicago 2.0 is to improve the health and well-being for Chicago residents, with a special focus on health equity. As such, the vision needs to project these strong values. Used as an overall guide-post, the vision allowed CDPH to contrast the ideal state of health and well-being for Chicago residents to the current status that emerged from the assessments. The vision provided a consistent marker through which to focus our eff orts and maintain a strong connec on among partners.
Process: At the September 12, 2014 Partnership for Healthy Chicago mee ng, members reviewed the vision
statement developed for the 2012-2016 community health assessment and improvement plan. Members decided to start fresh and then had a mul -layered discussion on key concepts to include in the new vision. Between mee ngs, several Partnership members word smithed the statement and emailed members a dra version. Partnership members voted to adopt this vision at the December 12, 2014 mee ng:
A city with strong communi es and collabora ve stakeholders, where all residents enjoy equitable access to resources, opportuni es and environments that maximize their health and well-being.
THE VISION: A city with strong communi es and collabora ve stakeholders, where all residents enjoy equitable access to resources, opportuni es and environments that maximize their health and well-being

HEALTHY CHICAGO 2.0
Community Health Assessment:5
PHASE 3: CONDUCT THE 4 MAPP ASSESSMENTS
PHASE 3A: Community Health Status Assessment
Purpose: The Community Health Status Assessment (CHSA) answers the ques ons, “How healthy are our residents?” and “What does the health status of our community look like?” The result of this phase is a strong understanding of the community’s health status, as portrayed through quan ta ve data. Data on demographic characteris cs, socioeconomic characteris cs, health resource availability, quality of life, behavioral risk factors, environmental health indicators, social and mental health, maternal and child health, death, illness and injury, infec ous disease and sen nel events are collected and analyzed. The CHSA iden fi es specifi c health issues and high-risk popula ons. The broad range of data collected from census, surveillance, vital records and surveys serves as the founda on for analyzing and iden fying community health issues and social determinants of health.
Process: The CDPH Offi ce of Epidemiology & Public Health Informa cs worked with the Partnership for Healthy Chicago’s data commi ee to iden fy relevant data and data sources. CDPH compiled and analyzed all data on the demographics, social determinants of health and health of Chicagoans. One of the new data sources used for this assessment was the Healthy Chicago Survey (HCS), an annual telephone survey launched by CDPH in 2014 to obtain data on Chicagoan’s health status and health behaviors. With data available for several years, CDPH was able to analyze the health of the 77 Chicago community areas in many areas of health and social determinants, including discrimina on, social cohesion and neighborhood condi ons.
Highlights of fi ndings were presented to the Partnership for a Healthy Chicago at their mee ng on February 27, 2015 and are detailed in this assessment. The complete results of the data analysis were assembled into a health data compendium.
Cri cal to the development of this assessment was to: (1) expand the collec on of social determinant of health data including informa on on economic stability, educa on, social and community context, health care and neighborhood and built environment; (2) analyze data at smaller geographic levels (i.e., community area, zip code and census tract) when possible to be er refl ect the diversity of Chicago neighborhoods and (3) stra fy tradi onal health outcomes, such as infant mortality, preventable hospitaliza ons and obesity by more than age, race/ethnicity, community area and gender but by various
social determinants of health (economic, housing, educa onal, etc.) as demonstrated by the Economic Hardship Index and the Child Opportunity Index.
The Economic Hardship Index is an indicator of rela ve economic condi ons that includes six factors: dependent-age popula on, crowded housing, household poverty, household income, unemployment and educa on.1 A higher Hardship Index score signifi es that economic condi ons are worse in that neighborhood (Figure 1).
Figure 1. Economic hardship by census tract, 2013 (US Census)

HEALTHY CHICAGO 2.0
Informing Eff orts to Achieve Health Equity 6
The Child Opportunity Index is an indicator of rela ve educa onal, health and environmental and economic condi ons that includes 19 variables: adult educa onal a ainment, student (school) poverty, reading profi ciency, math profi ciency, early childhood educa on, neighborhood par cipa on pa erns, high school gradua on, retail healthy food index, housing vacancies, neighborhood foreclosures, poverty, unemployment, public assistance, volume of nearby toxic release and proximity to high-quality early childhood educa on centers, early childhood educa on centers of any type, toxic waste release sites, parks and open spaces, health care facili es and employment (Figure 2).2
Findings: The data fi ndings are presented in the following sequence:
• Demographics (popula on, race/ethnicity)
• Length and Quality of Life
• Maternal and Infant Health
• Sexually Transmi ed Infec ons
• Adolescent Health and Health Behaviors
• Behavioral Health-Adult
• Violence
• Educa on
• Access to Health Care
• Economic Stability
• Built Environment
• Conclusion
Demographics: Chicago is a diverse but segregated city, socioeconomically, racially and ethnically, which leads to a dispropor onate burden of poor health among certain communi es. Among the 100 most populous ci es in the United States, Chicago ranks as the 7th most racially/ethnically diverse at the city level and 1st as the most racially/ethnically segregated city in the na on (Figure 3).3
Residen al segrega on has been a key factor in crea ng substan al inequali es in opportunity across neighborhoods and for individuals along racial/ethnic lines. Segrega on can lead to drama c varia ons in factors conducive to the prac ce of healthy or unhealthy behaviors, which exacerbate health outcomes. Racial and economic segrega on has been shown to be posi vely associated with mortality rates and adverse health outcomes among racial minori es. Segrega on ul mately aff ects health through concentrated poverty, the quality of neighborhood environment and reduced access to services.4
Figure 3. Popula on distribu on by community area and race/ethnicity, 2008-2012 (US Census)
Figure 2. Child opportunity by census tract, 2014 (Kirwan Ins tute)

HEALTHY CHICAGO 2.0
Community Health Assessment:7
Length and Quality of Life: Self-assessed health status is a measure of whether an individual perceives his or her health as excellent, very good, good, fair or poor. Overall, 18.4% of adults in Chicago report their health as fair or poor compared to 10.3% in the U.S. In Chicago, twice as many Hispanics and three mes as many non-Hispanic blacks report fair or poor health compared to non-Hispanic whites. Self-rated health is also related to age. Adults 45 years and older are more likely to report fair or poor health than those 18-44 years old. Self-rated health status does not diff er between men and women. Community areas that have high hardship have twice as many residents who report fair or poor health status compared to community areas with low hardship.5
Between 1990 and 2010, life expectancy at birth in Chicago increased by 7.3 years to 77.8 years but s ll remains slightly below the average life expectancy in the United States (78.7 years). Community area variability exists, with a 16-year diff erence in life expectancy observed between the communi es of Near North and West Garfi eld Park (Figure 4a). Increases in life expectancy were observed between 1990 and 2010 among all race/ethnic groups, although dispari es s ll exit. Hispanics/La nos have the highest life expectancy at 84.7 years (a 3% increase from 1990), followed by non-Hispanic white at 79.2 years (an 8% increase from 1990) and non-Hispanic black at 72.4 years, a 10% increase from 1990 (Figure 4b). Life expectancy at birth is correlated with economic hardship and child opportunity at the community area level. Life expectancy is higher in community areas with lower hardship and more opportunity.6

HEALTHY CHICAGO 2.0
Informing Eff orts to Achieve Health Equity 8
Figure 4a. Life expectancy at birth by community area, 1990-2010 (IDPH, US Census)
Figure 4b. Life expectancy at birth by race/ethnicity, 1990-2010 (IDPH, US Census)
82.6
72.2
65.968.7
73.976
81.484.7
79.277.8
72.470.5

HEALTHY CHICAGO 2.0
Community Health Assessment:9
Figure 5. Years poten al life lost by race/ethnicity, 2000-2011 (IDPH, US Census)
Premature mortality or Years of Poten al Life Lost (YPLL) is defi ned as the average me a person would have lived had they had not died prematurely. This measure is used to help quan fy social and economic loss owing to premature death. Premature mortality diff ers greatly by race/ethnicity and hardship in Chicago. Overall, Chicago has declined 24.8% from 2000 to 2011. However, during the same me period, non-Hispanic whites have seen a much greater decline, 28.7%, compared to non-Hispanic blacks, 17.4% (Figure 5).
Furthermore, as hardship level increases so does the rate of premature mortality. In 2011, persons living in community areas with the highest hardship are more than twice as likely to die prematurely compared to those in the lowest hardship community areas. During the years 2007-2011, community areas on the west and south sides were dispropor onately aff ected with higher rates of premature mortality. Among the highest rates of premature mortality, West Garfi eld Park, West Englewood and Fuller Park have rates of premature mortality twice that of the city as a whole (Figure 6).7
4,5135,6987,720
13,642
3,153

HEALTHY CHICAGO 2.0
Informing Eff orts to Achieve Health Equity 10
Chronic diseases are the leading causes of morbidity and mortality. In 2011, there were a total of 401,089 inpa ent hospitaliza ons among Chicago’s residents. Approximately 20% of these were for pregnancy and childbirth and were not included in the ranking of leading causes of hospitaliza on. Excluding pregnancy and childbirth, the fi ve leading causes of hospitaliza on were heart disease, substance-related disorders (including alcohol-related), mood disorders, schizophrenic disorders and cancer. Of the ten leading causes of hospitaliza on, fi ve were due to chronic disease and include heart disease, cancer, stroke, asthma and diabetes (Figure 7).8
In 2011, the ten leading causes of death accounted for 74% of all deaths occurring in Chicago. Six of the ten leading causes of death were a ributable to chronic disease including heart disease, cancer, stroke, chronic lower respiratory disease, diabetes and kidney diseases, which account for 64% of all deaths (Figure 8).7
Figure 7. Leading causes of hospitaliza ons, 2011 (IDPH, US Census)
Cause of hospitaliza on Visits Crude Rate (per 10,000)
US Rate 2006(per 10,000) Rank
All Hospitaliza ons 401,089 1,487.9 NA --Pregnancy, childbirth and the purperium 45,723 169.6 NA --Certain condi ons origina ng in the perinatal period 40,544 150.4 NA --Heart disease 33,689 125.0 140.9 1Substance-related disorders 23,267 86.3 NA 2Mood disorders 17,778 66.0 15.4 3Schizophrenic disorders 14,730 54.6 NA 4Malignant neoplasms 11,029 40.9 40.5 5Sep cemia 9,011 33.4 17.8 6Pneumonia 8,278 30.7 41.3 7Cerebrovascular disease 8,093 30.0 29.8 8Asthma 7,325 27.2 14.9 9Diabetes mellitus 7,112 26.4 19.6 10Asthma 7,325 27.2 14.9 9Diabetes mellitus 7,112 26.4 19.6 10
Figure 6. Years poten al life lost by community area, 2007-2011 (IDPH,US Census)

HEALTHY CHICAGO 2.0
Community Health Assessment:11
Figure 8. Leading causes of death, 2011 (IDPH)Rank Cause of Death Number Percent
… All Causes 18,769 --1 Heart Disease 4,991 26.72 Cancer 4,316 23.13 Stroke 886 4.74 Chronic Lower Respiratory Diseases 717 3.85 Accidents 636 3.46 Diabetes 565 3.07 Infl uenza and Pneumonia 472 2.58 Nephri s, Nephro c Syndrome and Nephrosis 452 2.4
9 Sep cemia 413 2.210 Homicide 399 2.1… All Other Causes 4,922 25.9
Hospitaliza on and mortality rates due to disease and injury are decreasing (Figures 9 and 10). Through improved quality of care, use of blood pressure medica ons, sta n drugs, more rapid and eff ec ve treatment of heart a acks and an increased awareness of the benefi ts of healthy diet and exercise there have been marked declines in mortality and hospitaliza ons due to coronary heart disease, the most prevalent chronic disease. Despite these reduc ons, strong racial dispari es between non-Hispanic black and white Chicagoans persist. Higher rates of heart disease mortality and hospitaliza ons are consistently seen in neighborhoods with high rates of economic hardship. Diabetes hospitaliza ons have risen over 30% in the past decade, represen ng over 7,000 hospitaliza ons per year. Both hospitaliza ons and deaths from diabetes occur more o en among persons living in neighborhoods with high economic hardship and occur at twice the rate among non-Hispanic blacks compared to non-Hispanic whites in Chicago. Although rates of asthma hospitaliza on among young children (less than 5 years) have decreased over 50% in the past decade, Chicago’s hospitaliza on rate is double the na onal rate. Both non-Hispanic black and Hispanic children are hospitalized more o en than white children, as are the children living in west side commu-ni es (i.e., West and East Garfi eld Park have the highest rates compared to all other community areas). Asthma-related emergency department visits for persons under 5 years old in Chicago exceed the na onal rate (194.8 per 100,000 in Chicago compared to 138.3 per 100,000 na onally). This rate was 412.9 per 100,000 among non-Hispanic black children in Chicago, higher than all other racial/ethnic groups.7,8
Hospitaliza ons for behavioral health condi ons (mental health and alcohol/substance use) have seen marked increases in the past decade and now represent over one in six hospitaliza ons overall. Rates of mood dis-order hospitaliza ons in Chicago eclipse the na onal rate by more than four mes. Non-Hispanic black Chicagoans are hospitalized for mental health-related condi ons at two to ten mes the rate of non-Hispanic white and Hispanic Chicagoans. Residents of East and West Garfi eld Park, Uptown, Englewood, Washington Park and Woodlawn have the highest rates of hospitaliza ons due to mental health condi ons.8

HEALTHY CHICAGO 2.0
Informing Eff orts to Achieve Health Equity 12
Figure 9. Summary of hospitaliza ons, 2011 (IDPH)
Figure 10. Summary of mortality, 2011 (IDPH, US Census)
†Of all non-childbirth-related hospitaliza ons; ¥ Ra o of Chicago and US rates; *Ra o of zip code with highest age-adjusted rate and zip code with lowest rate; **Ra o of Non-Hispanic African-American or black and Non-Hispanic white rates; € Ra o of Hispanic and non-Hispanic white rates
†Of all deaths; ¥Ra o of Chicago and US rates; *Ra o of community area with highest age-adjusted rate and community area with lowest rate; **Ra o of Non-Hispanic African-American or black and Non-Hispanic white rates; €Ra o of Hispanic and non-Hispanic white rates
Homicide mortality in Chicago has decreased by over one-third between 2001 and 2011, despite the most recent rate being over 2.5 mes the na onal rate. Racial/ethnic dispar-ity is par cularly pronounced in rates of homicide mor-tality. Non-Hispanic black Chicagoans are almost 25 mes
more likely to die via homicide than non-Hispanic white Chicagoans and Hispanics are 6 mes more likely, par c-ularly those who live in areas of high economic hardship where the homicide rate is up to 80 mes higher than that of the areas in the city with low economic hardship.7
Incidence of chronic disease is increasing. Overall, 26.6% of adults in Chicago (approximately 508,000 adults) have ever been diagnosed with hypertension or high blood pressure, slightly lower than the US rate of 29.1% (Figure 11). There is a signifi cant diff erence in hypertension prevalence between racial-ethnic groups; the highest rate is observed among non-Hispanic blacks (29.3%), compared to 23.6%
among non-Hispanic whites and 18.6% among Hispanics. Increased age is associated with increased rates of hyper-tension, with prevalence at 6.5% among those aged 18-29 years and 62.2% among those aged 65+. There is no diff er-ence in rates of hypertension between men and women, or between low, medium and high hardship.5
Cause of Hospitaliza on Number Percent†Percent change
2001-2011
Chicago vs. US¥
Correla on to Hardship
(R2)
Geographic Disparity*
Black:White Disparity**
Hispanic Disparity€
Heart Disease 33,689 10.7 35% ↓ 0.9 Moderate 3.1 2.0 1.0
Substance-related Disorders 23,267 7.4 36% ↑ NA Weak 45.0 2.0 0.2
Mood Disorders 17,778 5.6 11% ↑ 4.3 Weak 6.0 2.0 0.6
Schizophrenic Disorders 14,730 4.7 6% ↓ NA None 27.7 3.6 0.6
Asthma 7,325 2.3 -- -- -- -- -- --
<5 years 663 0.2 55% ↓ 2.0 Moderate 14.0 2.3 1.3
≥ 65 years 1,299 0.4 18% ↑ 2.3 None 17.4 3.6 3.8
Diabetes 7,112 2.3 30% ↑ 1.3 Strong 4.8 2.4 1.7
Preventable Hospitaliza ons 42,642 13.5 30% ↓ NA Moderate 4.8 2.8 1.4
Cause of Death Percent†Percent Change
2000-2011
Chicago vs. US¥
Rela onship to Hardship
Geographic Disparity*
Black:White Disparity**
Hispanic Disparity€ YPLL YPLL:
NH WhiteYPLL:
Hispanic
Heart Disease 27% 30%↓ 1.2 Moderate 3.3 1.2 0.6 2,537 1,216 549
Cancer 23% 19%↓ 1.1 Moderate 2.3 1.3 0.7 2,264 1,367 648
Diabetes 3% 13%↓ 1.0 Strong 5.5 1.8 1.4 310 100 86
Stroke 5% 35%↓ 1.0 Moderate 3.2 1.7 0.8 369 127 84
Accidents 3% 37%↓ 0.6 Strong 5.2 1.3 0.8 968 582 469
Homicide 2% 34%↓ 2.5 Strong 81.1 24.9 6.0 1,775 51 479
Suicide 1% 21%↓ 0.5 Strong NA 0.7 0.4 227 282 148
YPLL -- 25%↓ 1.2 Strong 6.4 2.4 0.8 13,642 5,698 4,513
Life Expectancy -- 10%↑ 1.0 Moderate 1.2 0.9 1.1 -- -- --

HEALTHY CHICAGO 2.0
Community Health Assessment:13
Figure 11. Percentage of adults with hypertension, 2001-2011 (BRFSS), 2104 (HCS)100
80
60
40
20
02001 2002 2003 2004 2005 2006 2007 2008 2009 2010 2011 2012 2013
20.1 27.1 26.6
Prev
alan
ce (%
)
Figure 13. Percentage of adults who are obese, 2001-2011 (BRFSS), 2014 (HCS)
Figure 12. Percentage of adults with high cholesterol, 2001-2011 (BRFSS), 2014 (HCS)
The overall prevalence of high cholesterol among adults in Chicago is 28.5% (approximately 424,000 adults), similar to previous years and what is observed na onally, 31.7% (Figure 12).5,9 While there is no diff erence in high cholesterol by gender, race/ethnicity or community
hardship, higher cholesterol prevalence is related to age. Those over the age of 45 are three mes as likely to have high cholesterol compared to those 30-44 and four mes as likely as those aged 18-29.5,9
In Chicago, 28.8% of adults (approximately 552,000 adults) have a body mass index that classifi es them as obese, con nuing a gradually increasing trend in obesity observed since 2001 (Figure 13).5,9 Reducing the propor on of adults who are obese is a goal of Healthy People 2020 (HP 2020), with a na onal target of 30.5%. In Chicago, obesity is most prevalent among women (32.3%, compared to 24.9%
among men), non-Hispanic blacks (37.8%, compared to 32.1% among Hispanics and 23.7% among non-Hispanic whites) and those aged 45-64 (36.8%, compared 23.2% among those aged 18-29, 27.2% among those aged 30-44 and 24.8% among those aged 65+). Obesity is almost twice as prevalent in high hardship communi es (37.3%) as in low hardship communi es (21.0%).5,9

HEALTHY CHICAGO 2.0
Informing Eff orts to Achieve Health Equity 14
Overall, female breast cancer incidence in Chicago has increased by ten percent between 1992-1996 and 2007-2011 and rates in Chicago are 17% higher than na onally (Figure 14). Non-Hispanic white women have the highest rates of breast cancer incidence in Chicago, though incidence increased more for Hispanic and non-Hispanic black women during the study period, 20% and 17%, respec vely. Hispanic females have the lowest rates of breast cancer in Chicago. Rates are 58% higher among non-Hispanic blacks and 70% higher among non-Hispanic whites.10
Diabetes prevalence in Chicago is 9.0% (approximately 172,000 adults), similar to previous years and similar to
what is observed na onally, 9.3% (Figure 15). Dispari es in diabetes prevalence exist between racial-ethnic groups. The highest rate is among non-Hispanic blacks (12.3%), compared to Hispanics (8.6%) and non-Hispanic whites (5.8%). A signifi cant trend is observed between diabetes prevalence and age. While only 1.0% of those aged 18-29 have diabetes, this increases to 4.7% among those aged 30-44, 14.0% among those aged 45-64 and 22.1% among those over the age of 65. Men and women have similar propor ons with diabetes and diabetes is not signifi cantly associated with neighborhood hardship.5
Figure 14. Female breast cancer incidence rates by race/ethnicity, 1992-2011 (IDPH, US Census)
Figure 15. Percentage of adults with diabetes, 2001-2011 (BRFSS), 2014 (HCS)
149.9131.7128.8
78.298.0
166.5155.3146.2

HEALTHY CHICAGO 2.0
Community Health Assessment:15
Li le to no improvement has occurred in overall adult healthy behaviors. The current smoking rate among Chica-go adults is 18.4% (approximately 351,000 adults)5, similar to what is observed na onally, 17.8% (Figure 16).11 An ob-jec ve of HP 2020 is to reduce cigare e smoking by adults to 12.0%.12 In Chicago, cigare e smoking is higher among
men (21.8%) compared to women (15.4%) and is highest among non-Hispanic blacks (25.3%) compared to other racial-ethnic groups (non-Hispanic white: 13.7%; Hispanic/La no: 18.5%). Smoking is more prevalent in high hardship neighborhoods (25.4%) than in low hardship neighborhoods (11.5%).5
Overall, 29.2% of adults (approximately 554,000 adults) report ea ng fi ve or more servings of fruits and vegetables per day (Figure 17). Fruit and vegetable consump on is higher among residents who live in low hardship neighborhoods (36.1%) compared to those in medium hardship neighborhoods (29.8%) and high hardship
neighborhoods (19.5%). While there is no diff erence in fruit and vegetable consump on between men and women or between ages, rates are higher among non-Hispanic whites (41.3%) compared to Hispanics/La nos (23.6%) and non-Hispanic blacks (18.9%).5
Figure 16. Percentage of adults who are current smokers, 2001-2011 (BRFSS), 2014 (HCS)
Figure 17. Percentage of adults who eat 5 or more servings of fruit and vegetables daily, 2001-2011 (BRFSS), 2014 (HCS)
Overall, 18.3% of adults (approximately 350,000 adults) report that they did not par cipate in any physical ac vity or exercise in the past month, similar to previous years (Figure 18).5,9 While it is encouraging that the rate in Chicago is below the na onal rate and the HP 2020 target, dispari es remain between race/ethnic groups and
between neighborhoods. While 12.3% of non-Hispanic whites report no physical ac vity, this is almost doubled among Hispanics/La nos (20.3%) and non-Hispanic blacks (22.4%). In low hardship neighborhoods, 13.5% of adults report no physical ac vity compared to 25.4% in high hardship neighborhoods.5

HEALTHY CHICAGO 2.0
Informing Eff orts to Achieve Health Equity 16
The US Preven ve Services Task Force (USPSTF) recommends mammograms every two years for women between the ages of 50 and 74 years. In Chicago, 75.6% of women are mee ng this recommenda on (Figure 19)
and there are no diff erences by racial-ethnic groups or by neighborhood hardship.5 HP 2020 has set the na onal target of 81.1% of women mee ng this recommenda on.12
Figure 18. Percentage of adults who do not exercise, 2001-2011 (BRFSS), 2014 (HCS)
Figure 19. Percentage of adult females aged 50-74 years who met the breast cancer screening guideline, 2001-2008 (BRFSS), 2014 (HCS)
USPSTF recommends a Pap smear to screen for cervical cancer every three years for women aged 21 to 65 years. In Chicago, 82.9% of women are mee ng this recom-menda on (Figure 20), similar to what is observed na- onally (82.8%), although lower than the HP 2020 target
(93.0%)5,12. Younger women, aged 21 to 29 years, are less likely to have had a Pap test within the past three years (70.3%), compared to those aged 30-44 (92.6%) and aged 45-64 (82.1%).5
Figure 20. Percentage of adult females aged 21-65 years who met the cervical cancer screening guidelines, 2001-2008 (BRFSS), 2014 (HCS)

HEALTHY CHICAGO 2.0
Community Health Assessment:17
USPSTF recommends screening for colorectal cancer using high-sensi vity fecal occult blood tes ng, sigmoidoscopy, or colonoscopy beginning at age 50 and con nuing un l age 75. In Chicago, 60.5% of adults 50 to 75 years of age reported having a sigmoidoscopy or colonoscopy in the past 10 years, having a sigmoidoscopy or colonoscopy in the past 5 years along with a blood stool test in the past 3 years or having a blood stool test in the past year
(Figure 21).5 This is similar to the na onal rate, but below the objec ve set by HP 2020 (70.5%).11 In Chicago, Hispanics have screening rates (48.8%) that are signifi cantly lower than non-Hispanic blacks (60.0%) and non-Hispanic whites (64.4%). Screening rates are higher in low hardship communi es (67.5%), compared to medium hardship (60.8%) and high hardship communi es (50.6%).5
Maternal and Infant Health: Gains have been made in reducing teen births and infant mortality. Teen births decreased by 35% between 2000 and 2010 to 52.3 per 1,000 females aged 15-19, but the overall rate for Chicago remains above the na onal rate of 34.3 (Figure 22). Despite the reduc on in teen births, dispari es persist. Non-Hispanic black and Hispanic teens have four to six mes higher rates than non-Hispanic whites and non-Hispanic Asian/Pacifi c Islander mothers. Teen birth rates are higher in community areas with more economic
hardship and less child opportunity. Chicago’s teen birth rate remains 50% higher than the na onal average. Infant mortality also decreased, by 36%, between 2000 and 2010 to 7.4 infant deaths per live births (Figure 23). Overall, Chicago’s infant mortality rate is higher than the US, at 6.1. Infant mortality among non-Hispanic blacks is almost three mes higher compared to non-Hispanic whites. In addi on, community areas with high levels of economic hardship have infant mortality rates more than twice that of community areas with low hardship.13
Figure 21. Percentage of adults aged 50-75 years who reported having a sigmoidoscopy or colonoscopy in past 10 years, having a sigmoidoscopy or colonoscopy in the past 5 years and a blood stool test in past 3 years, or having a blood stool test in the past year, 2001-2008 (BRFSS), 2014 (HCS)

HEALTHY CHICAGO 2.0
Informing Eff orts to Achieve Health Equity 18
Figure 22. Teen birth rate by race/ethnicity, 2000-2010 (IDPH, US Census)
Over the past 10 years, signifi cant gains have been made in healthy natality outcomes (Figure 24). Early ini a on of prenatal care has improved across all racial/ethnic groups, although dispari es persist for non-Hispanic black and Hispanic mothers. Early prenatal care u liza on is
signifi cantly lower among areas with high economic hardship. Mothers in those areas consequently tend to have babies with low or very low birth weight more frequently than mothers who reside in low hardship communi es.13
Figure 23. Infant mortality by race/ethnicity, 2000-2010 (IDPH)

HEALTHY CHICAGO 2.0
Community Health Assessment:19
Sexually Transmi ed Infec ons: Chlamydia is the most commonly reported infec ous disease in Chicago. In 2013, almost 25,000 chlamydia infec ons were diagnosed in Chicago. Over one-third were among Chicago youth less than 19 years old. Residents of neighborhoods with high levels of economic hardship were diagnosed up to 50 mes more o en than those in low hardship neighborhoods (Figure 25). Over 8,000 cases of gonorrhea were diagnosed in Chicago in 2013, almost one-third of which were among those less than 19 years old. Gonorrhea diagnoses rates in West Garfi eld Park were over 5,000 mes the rate in Mt. Greenwood. This is the single largest geographic disparity of any health condi on in Chicago.14
Figure 24. Summary of natality, 2010 (IDPH)
¥Ra o of Chicago and US rates/percentages; *Ra o of community area with highest rate/percent and community area with lowest rate/percentage; **Ra o of Non-Hispanic African-American or black and Non-Hispanic white rates/percentages; € Ra o of Hispanic and non-Hispanic white rates/percentages
Natality Indicator Percent change 2000-2010
Chicago vs. US¥
Correla on to Hardship
Geographic Disparity*
Black:White Disparity**
Hispanic Disparity€
Early and adequate prenatal care (%) 19% ↑ 1.1 Moderate 1.7 0.8 1.0
First trimester prenatal care (%) 12% ↑ 1.2 Strong 1.5 0.8 0.9
Teen birth rate 35% ↓ 1.5 Strong 17.9 5.8 4.4
Preterm (%) 6% ↓ 0.9 Weak 3.6 1.4 1.0
Low birth weight (%) 1% ↓ 1.2 Moderate 6.5 1.9 1.0
Very low birth weight (%) 10% ↓ 1.4 Moderate 40.0 2.4 1.1
Infant mortality rate 30% ↓ 1.2 Strong 9.6 2.7 1.4
Figure 25. Chlamydia infec ons in persons less than 19 years of age by community area, 2013 (CDPH)

HEALTHY CHICAGO 2.0
Informing Eff orts to Achieve Health Equity 20
Adolescent Health and Health Behaviors: Over one-third of Chicago’s school-aged children are overweight or obese. Overweight or obesity prevalence ranges from 27% to 52%. The percentage of Chicago Public School (CPS) kindergarteners, 6th and 9th graders who are overweight or obese tend to be lowest in north and northeastern community areas and highest in northwest and southwest community areas (Figure 26).15
All race/ethnicity groups experienced an 11.4-13.7% increase in the percentage of overweight or obese students between kindergarten and 6th grade, then subsequent 2.6-5.0% decrease between 6th and 9th grades (Figures 27a-c). However, Hispanic youth enter school more likely to be overweight or obese than their non-Hispanic black and white peers (41.1% vs. 32.8% vs. 26.2% respec vely for the 2012-2013 school year) and remain the most aff ected group through all three grades. Though males are more likely to be overweight or obese than females in all grades, this is not a meaningful diff erence.15
Figure 26. Overweight or obesity in CPS kindergarteners, sixth and ninth graders by community area, 2012-2013 (CPS)

HEALTHY CHICAGO 2.0
Community Health Assessment:21
Lesbian, gay, bisexual (LGB) youth experience higher rates of health-risk behaviors than their heterosexual peers. In 2013, 13.0% of students reported being bullied on school property within the previous 12 months, no diff erence from previous years (Figure 28).16 This percentage is signifi cantly lower than the na onal percentage (19.6%)11
and HP 2020 goal (17.9%).12 Ninth graders (18.5%) report signifi cantly more bullying than 12th graders (9.0%). Students who iden fy as LGB are three mes more likely to report being bullied in the past 12 months compared to their heterosexual-iden fi ed peers (30.4% vs. 10.2% respec vely).16
Figure 27a. Obesity or overweight in CPS ninth graders, 2010-2013 (CPS)
Figure 27b. Obesity or overweight in CPS sixth graders, 2010-2013 (CPS)
Figure 27c. Obesity or overweight in CPS kindergartners, 2010-2013 (CPS)
55 55.4
49.145.5
38.4 37.6
44.848.3
54.8
48.645.2
37.9
42.2 41.136.5 35.634.1 32.8
26 26.2
41.1
35.733.426.4

HEALTHY CHICAGO 2.0
Informing Eff orts to Achieve Health Equity 22
Figure 29. Percentage of high school students repor ng a suicide a empt with injury, 2001-2013 (YRBS)
Of those students who made a suicide a empt in the last 12 months, 3.5% reported requiring medical a en on as a result of the a empt in 2013 (Figure 29). This is higher than the na onal percentage (2.7%) and the HP 2020 goal
(1.7%), but similar to previous years. Students iden fying as LGB are much more likely to report a suicide a empt resul ng in injury (11.3%) than those who iden fy as heterosexual (1.9%).16
In 2013, 32.5% of high school students reported that in the past 12 months they had felt so sad or hopeless almost every day for two weeks or more in a row that they stopped doing some usual ac vi es. This is similar to the na onal percentage (29.9%) and previous years. Females (40.7%) are almost twice as likely as males (23.5%) and LGB-iden fi ed and unsure students (55.1%) are almost twice as likely as heterosexual-iden fi ed students (28.8%) to report prolonged feelings of sadness or hopelessness. More than three percent (3.5%) of high school students reported a emp ng suicide in the past 12 months; however, among LGB youth that rate was over 11%.16
Disordered ea ng behaviors include going without food for 24 hours or more (fas ng), taking pills, powders or liquids without a doctor’s advice and vomi ng or taking laxa ves to lose or keep from gaining weight. In 2013, 18.1% of students report disordered ea ng behavior in the past 30 days. This is signifi cantly higher than the HP 2020 goal of
12.9%, but similar to previous years, including 2001 when the percentage was 19.1%. Females (22.5%) are more likely to report disordered ea ng behaviors compared to males (13.2%) and LGB-iden fi ed students (37.5%) are more than twice as likely as heterosexual-iden fi ed students (14.5%) to report disordered ea ng.16
The percentage of students repor ng smoking one or more cigare es in the past 30 days has decreased 56.7% between 2001 and 2013, from 24.7% to 10.7% (Figure 30). The current rate is lower than both the na onal average (15.7%)11 and the HP 2020 goal (16.0%).12 Students who iden fy as LGB (19.3%) are signifi cantly more likely to report current smoking than their heterosexual peers (9.0%). Non-Hispanic white and Hispanic students are more likely to be current cigare e smokers than non-Hispanic black students (18.4%, 13.1% and 5.5%, respec vely).16
Figure 28. Percentage of high school students repor ng being bullied on school property, 2001-2013 (YRBS)

HEALTHY CHICAGO 2.0
Community Health Assessment:23
Figure 31. Percentage of high school students who reported currently using marijuana, 2001-2013 (YRBS)
Figure 32. Percentage of high school students who report binge drinking, 2001-2013 (YRBS)
Figure 30. Percentage of high school students who are current smokers, 2001-2013 (YRBS)
In 2013, 28.5% of students reported having used marijuana one or more mes in the preceding 30 days (Figure 31). This is similar to the percentage in 2001 (28.7%), but higher than the na onal percentage of
23.4%.11 Heterosexual-iden fi ed youth (25.9%) are signifi cantly less likely than LGB-iden fi ed youth (42.0%) to currently use marijuana.16
Binge drinking, defi ned as having fi ve or more drinks of alcohol within a couple of hours, in the past 30 days was reported among 17.6% of high school students in 2013 (Figure 32). This is lower than the na onal percentage (20.8%), but sta s cally similar to past years. Non-Hispanic
blacks (10.9%) are half as likely as Hispanics (21.0%) and non-Hispanic whites (24.3%) to report binge drinking. Students iden fying as LGB (25.1%) are much more likely to report recent binge drinking than heterosexual-iden -fi ed students (16.0%).16
24.7

HEALTHY CHICAGO 2.0
Informing Eff orts to Achieve Health Equity 24
Behavioral Health-Adult: Mental illness is a leading cause of hospitaliza ons. Substance-related hospitaliza ons are inpa ent admissions with a principal diagnosis related to alcohol or drug use. Between 2001 and 2011, the age-adjusted rate of substance-related visits per 10,000 popula on increased from 65.4 to 89.5, with the highest rates in 2011 seen among non-Hispanic blacks (204.3),
followed by non-Hispanic whites (102.2), Hispanics (24.5) and non-Hispanic Asian/Pacifi c Islanders (5.1) (Figure 33). Rates of substance-related hospitaliza on vary greatly between Chicago’s zip codes; there is a 45-fold diff erence between the zip code with the highest rate and the zip code with the lowest rate (Figure 34).8
Figure 34. Substance-related hospitaliza ons by zip code, 2011 (IDPH, US Census)
The age-adjusted rate of hospitaliza on due to schizophrenic disorders did not change signifi cantly in Chicago between 2001 and 2011. Overall, Chicago had 54.3 admissions per 10,000 popula on in 2011, but this varied greatly by race/ethnicity (Figure 35). The rate among non-Hispanic blacks (101.4) is 3.5 mes as high as non-Hispanic whites (28.2), 6 mes as high as Hispanics (16.7) and 9 mes as high as non-Hispanic Asians/Pacifi c Islanders (11.6). While there is a 30-fold diff erence between the zip code with the highest rate and the zip code with the lowest rate, these communi es are dispersed throughout the city (Figure 36).8
Figure 33. Substance-related hospitaliza ons by race/ethnicity, 2001-2011 (IDPH, US Census)

HEALTHY CHICAGO 2.0
Community Health Assessment:25
The age-adjusted rate of hospital admissions due to mood disorders, including bipolar disorder and depression did not change signifi cantly between 2001 and 2011 (Figure 37). Overall, in 2011, there were 66.2 admissions due to mood disorders per 10,000 popula on. This rate was highest among non-Hispanic blacks (102.5), followed by non-Hispanic whites (52.0), Hispanics (31.5) and non-Hispanic Asian/Pacifi c Islanders (12.7). Zip codes with the highest rates are clustered in Chicago’s west side (Figure 38).8
Figure 35. Hospitaliza ons due to schizophrenic disorders by race/ethnicity, 2001-2011 (IDPH, US Census)
Figure 36. Hospitaliza ons due to schizophrenic disorders by zip code, 2011 (IDPH, US Census)

HEALTHY CHICAGO 2.0
Informing Eff orts to Achieve Health Equity 26
On average, Chicago adults reported 3.1 days in the past 30 days that their mental health, including stress, depres-sion and problems with emo ons was not good, similar to what is reported na onally. This represents a decrease from 2002 when the average number of mentally un-healthy days per month among Chicagoans was 9.7 (Figure 39). While there are no diff erences by age, gender or race/ethnicity, those living in medium hardship community ar-eas report the highest number of mentally unhealthy days (3.9) compared to low (2.6) or high hardship community areas (3.1). More than nine percent (9.2%) of Chicagoans reported 14 or more mentally unhealthy days, defi ned as frequent mental distress.5
Figure 38. Hospitaliza ons due to mood disorders by zip code, 2011 (IDPH, US Census)
Figure 37. Hospitaliza ons due to mood disorders by race/ethnicity, 2001-2011 (IDPH, US Census)

HEALTHY CHICAGO 2.0
Community Health Assessment:27
Figure 39. Average number of mentally unhealthy days, 2001-2011 (BRFSS), 2014 (HCS)
The Kessler-6 score (based on how o en in the past month an individual feels nervous, hopeless, restless, depressed, worthless and that everything was an eff ort) indicates that 8% of Chicagoans are currently living with mild/moderate psychological distress and 5% with serious psychologi-cal distress. Overall, 16.7% of Chicago adults report that they’ve ever been diagnosed with depression, similar to what is reported na onally. Just over ten percent (10.4%) are currently taking medica on or receiving treatment for a mental health condi on. Almost six percent (5.8%) of Chicagoans report that during the past 12 months, there was a me that they needed mental health treatment but didn’t get it, however among persons with frequent men-tal distress almost 50% were not receiving mental health treatment. Of those, the most commonly cited reason why they didn’t get the treatment they needed was that they couldn’t aff ord it (43.1%), followed by not knowing where to go for services (21.4%), health insurance doesn’t cover or pay enough for mental health treatment (16.9%), wor-ried about s gma or privacy (8.1%) and concern that they would be commi ed to a psychiatric hospital (7.5%).5
Excessive alcohol use can have nega ve consequences on one’s physical health, work and family life and mental well-being. Overall, 29.0% of Chicago adults report binge
drinking, defi ned as males having fi ve or more drinks on one occasion or females having four or more drinks on one occasion, at least once in the past month. This is higher than what is reported na onally (17.1%). Binge drinking is more common among men (38.1%, compared to 20.3% among women) and non-Hispanic whites and Hispanics (38.6% and 33.2% respec vely, compared to 18.6% among non-Hispanic blacks).5
Overall, suicides slightly decreased between 2000 and 2011 in Chicago, but only for non-Hispanic whites and non-Hispanic blacks. Non-Hispanic whites had the highest rates of suicide between 2000 and 2011 (Figure 40). In 2011, non-Hispanic whites’ suicide rate was more than three mes the rate of non-Hispanic Asian/Pacifi c Islanders, more than twice the rate of Hispanics and one-and-half mes that of non-Hispanic blacks. The suicide rate varies substan ally across Chicago’s 77 community areas. For instance, West Elsdon on the southwest side has the highest mortality rate (12.9) compared to Archer Heights on the west side which reported no suicides (Figure 41). Rates of suicide in community areas with low economic hardship are almost twice as high as those community areas with medium to low hardship.7
10.7
7.36.6
3.7
1.8 2.53.6
5.85.8
8.6
Figure 40. Suicide by race/ethnicity, 2001-2011 (IDPH, US Census)

HEALTHY CHICAGO 2.0
Informing Eff orts to Achieve Health Equity 28
Figure 41. Suicide by community area, 2007-2011 (IDPH, US Census)
Figure 42. Alcohol-induced mortality by race/ethnicity, 2000-2011 (IDPH, US Census)
8.27.67.05.5 5.8
6.67.38.4
0.00.0
Alcohol-induced mortality in Chicago decreased by four percent between 2000 and 2011. Among race/ethnicity groups, non-Hispanic whites had the highest rates of alcohol-induced mortality and non-Hispanic Asian/Pacifi c Islanders had the lowest (Figure 42). Rates for each were stable between 2000 and 2011. Alcohol-induced mortality increased by 33% between 2000 and 2011 for Hispanics and decreased for non-Hispanic blacks (24%). The alcohol-induced mortality rate varies substan ally across Chicago’s 77 community areas. For instance, Hegewisch on the far south side has the highest mortality rate (18.3), while Oakland on the south side has the lowest rate, 0.0 (Figure 43). As economic hardship in community areas increases so does the rate of alcohol-induced mortality.7

HEALTHY CHICAGO 2.0
Community Health Assessment:29
Figure 44. Violent crime, 2001-2014 (Chicago Police Department)
Figure 43. Alcohol-induced mortality by community area, 2007-2011 (IDPH, US Census)
Violence: Violent crimes are defi ned as off enses involving force or threat of force and include murder and non-negli-gent manslaughter, forcible rape, robbery and aggravated assault. Violent crime has decreased more than 50% since 2001 in Chicago (Figure 44). Rates of violent crimes are higher in community areas in the west and south sides of Chicago. The disparity of violent crime is drama c. The diff erence in community areas with the highest and lowest rates are thousands-fold (Figure 45). Violent crime rates are higher in community areas with higher levels of hard-ship.17

HEALTHY CHICAGO 2.0
Informing Eff orts to Achieve Health Equity 30
Non-fatal shoo ngs occurred citywide but were strongly concentrated on the city’s west and south sides (Figure 46). There is a strong correla on between non-fatal shoo ngs and child opportunity. Community areas with higher levels of child opportunity also exhibited the lowest rates of non-fatal shoo ngs.17
Findings from the 2014 Healthy Chicago Survey reveal that almost 20% of Chicagoans felt unsafe u lizing outdoor spaces in their neighborhood. Among residents of neighborhoods with high economic hardship, over 32% of residents felt unsafe.5
Thirteen percent (13%) of high school students in Chicago reported being bullied in the past year. Among LBG youth the rate was over 30%. Overall, almost one-third of stu-dents reported ge ng into a fi ght at school in the past year.16
Figure 45. Violent crime by community area, 2014 (Chicago Police Department)
Figure 46. Non-fatal shoo ngs by community area, 2014 (Chicago Police Department)

HEALTHY CHICAGO 2.0
Community Health Assessment:31
The homicide rate decreased by 37% between 2000 and 2011, from 20.5 to 13.5 per 100,000 (Figure 47). However, the Chicago homicide rate is two and a half mes higher than the United States. Homicide rates are highest among non-Hispanic blacks, 25 mes higher than non-Hispanic whites and four mes higher than Hispanics in 2011. Moreover, although homicide mortality ranks 10th among the leading causes of death for all Chicagoans, for non-Hispanic blacks and Hispanics, homicides ranked fourth and fi h, respec vely. In addi on, since 2006, 47% of all homicide vic ms were less than 25 years old. The ho-micide rate varies markedly across Chicago’s 77 community areas. The diff erence between community areas with the lowest and highest homicide rates is 800 percent (Figure 48). In community areas with high economic hardship, thehomicide rate is ten mes higher compared to community areas with low hardship.7
34.9
45.2
20.5
12.3
4.61.1
13.5
1.48.4
0.8
Figure 47. Homicide by race/ethnicity, 2000-2011 (IDPH, US Census)
Figure 48. Homicide by community area, 2007-2011 (IDPH, US Census)

HEALTHY CHICAGO 2.0
Informing Eff orts to Achieve Health Equity 32
Educa on: A sen nel JAMA study indicated that persons with higher educa onal a ainment have low-er rates of chronic disease compared to those with less educa on.18 The percentage of Chicagoans aged 25 years or older who have at least a Bachelor’s degree increased by 74% between 1990 and 2000. Increases were seen in non-Hispanic white, non-Hispanic black and Hispanic popula ons with varying degrees (90%, 55% and 33%, respec vely). In 2010, the percentage of non-Hispanic whites with at least a Bachelor’s degree (55%) was more than 3 mes that of non-Hispanic blacks (17%) and more than four mes that of Hispanics (12%). Community areas on the west and south sides of Chicago have dispropor on-ate rates of adults without a college diploma compared to the communi es on the north side (Figure 49). Although Chicago as a whole has about a third of adults (33.6%) with at least a college diploma, there is a large varia on by community area from 5.4% in Englewood to 82.2% in Lincoln Park.19
In the CPS ra ng system for schools, “1+” is the highest level, indica ng the best schools. When mapping the loca on of “1+” schools and the popula on of children under 18, it appears that “1+” schools tend to be located in areas with fewer school aged children (Figure 50) which suggests that educa onal opportunity is not equitably appor oned throughout the city.20
There are eight variables that comprise the Educa onal Opportunity Index: early childhood educa on par cipa on, quality and proximity, student poverty rate, reading and math profi ciency rates, high school gradua on rate and adult educa onal a ainment. Archer Heights has the lowest educa onal opportunity, while the Loop has the highest (Figure 51). There is a small correla on between educa onal opportunity and obesity among CPS kindergarteners, 6th and 9th graders. Students are slightly more likely to be obese in community areas with low educa onal opportunity.2,15
Figure 49. Percentage of popula on with at least a college degree by census tract, 2008-2012 (US Census)
Figure 50. Percentage of popula on less than 18 by census tract, 2010 (US Census) and CPS schools with 1+ quality ra ng, 2014-2015 (CPS)

HEALTHY CHICAGO 2.0
Community Health Assessment:33
Access to Health Care: In a recent publica on from the Henry J. Kaiser Family Founda on, uninsured individuals report that cost poses a major barrier to purchasing coverage. Not all workers have access to coverage through their jobs. Many uninsured workers are self-employed or work for small employers where health benefi ts are not likely to be off ered. In Chicago, one out of every fi ve adults between the ages of 18-64 is uninsured. The rate of uninsured persons is higher on the southwest and northwest sides of the city (Figure 52). More than one in three adults (36.3%) in South Lawndale is without health insurance.19
Beginning in 2014, as part of the Aff ordable Care Act (ACA), most uninsured Illinoisans became eligible for health coverage through the state’s expanded Medicaid program or through the Illinois Health Insurance Market-
place. Overall, 82% of adults in Chicago report being cov-ered by some type of health care coverage, such as private health insurance, HMOs, Medicaid, Medicare and Indian Health Services (Figure 53).5 This is similar to the na onal rate (83.1%) but s ll below the HP 2020 target of 100%.12 In Chicago, men are more likely to report being without coverage than women (77.1% vs. 86.3%), as are Hispanics (65.3%, compared to 83.3% of non-Hispanic blacks and 91.8% of non-Hispanic whites).15 The percentage of the Chicago popula on who has health coverage increases with age; while only 75.4% of those aged 18 to 29 indicate they have health coverage, 96.6% of those aged 65 years and older do. Health coverage is related to community area level hardship, 89.5% of those living in low hardship community areas reported having health coverage, compared to only 75% of those living in high hardship community areas.19
Figure 52. Percentage of popula on aged 18 to 64 years without health insurance by census tract, 2008-2012 (US Census)
Figure 51. Educa onal opportunity by census tract, 2014 (Kirwan Ins tute)

HEALTHY CHICAGO 2.0
Informing Eff orts to Achieve Health Equity 34
Overall, 80.8% of Chicago adults report they have one or more person who they think of as their personal doctor or health care provider, similar to previous years (Figure 54).5 This is also similar to what is reported na onally (77.3%) and the HP 2020 objec ve (83.9%).11,12 Women are more likely than men to have a personal doctor (88.2% compared to 72.6%, respec vely), as are non-Hispanic whites compared to other race/ethnici es (89.7%, compared to 79.4% of non-Hispanic blacks and 68.4% of Hispanics). Older adults are also more likely to have a
personal doctor; 94% of those aged 65 years and older, compared to 86.8% of those aged 45- 64, 76.6% of those aged 30-44 and 71.3% of those aged 18-29. In high hard-ship community areas, 74.1% report having a personal doctor, compared to 80.9% in medium hardship commu-nity areas and 85.8% in low hardship community areas. Overall, 77% of Chicagoans reported visi ng a doctor for a rou ne checkup in the past year. This rate was signifi cantly lower in males (69%).5
Figure 53. Percentage of adults who reported having health coverage, 2001-2011 (BRFSS), 2014 (HCS)
Figure 54. Percentage of adults with a personal doctor or health care provider, 2001-2011 (BRFSS), 2014 (HCS)

HEALTHY CHICAGO 2.0
Community Health Assessment:35
Figure 56. Preventable hospitaliza ons by zip code, 2011 (IDPH, US Census)
Figure 55. Preventable hospitaliza ons by race/ethnicity, 2000-2011 (IDPH, US Census)
Preventable hospitaliza ons, inpa ent stays that could poten ally have been avoided with the delivery of high quality outpa ent treatment and disease management, are an indicator of poten ally unmet community health needs. In Chicago, the age-adjusted rate of preventable hospitaliza ons in 2011 was 172.3 per 10,000 popula on, a decrease from 247.7 in 2000 (Figure 55). This rate is decreasing across all race/ethnici es, but dispari es have not changed. The rate of preventable hospitaliza ons among non-Hispanic blacks is 279.4 per 10,000 compared to 159.9 per 10,000 among Hispanics, 98.4 per 10,000 among non-Hispanic whites and 65.7 per 10,000 among non-Hispanic Asian/Pacifi c Islanders. The rate of prevent-able hospitaliza ons varies by zip code (Figure 56). The diff erence in preventable hospitaliza ons between the zip codes with the highest and lowest rates is more than 350%. The preventable hospitaliza on rate is strongly correlated to economic hardship; persons living in zip codes with higher economic hardship have higher rates of preventable hospitaliza ons.8
Avoidable emergency department (ED) visits are those that could have been more appropriately managed by and/or referred to a primary care provider in an offi ce or clinic se ng and include such diagnoses as tonsilli s, urinary tract infec ons and headaches. In Chicago, the age-adjusted rate of avoidable ED visits is 535.5 per 10,000 popula on, similar to previous years (Figure 57). The rate is highest among non-Hispanic blacks (908.5 per 10,000), followed by Hispanics (468.6 per 10,000), non-Hispanic whites (209.2 per 10,000) and non-Hispanic Asian/Pacifi c Islanders (174.8 per 10,000). The rate of avoidable ED visits varies by zip code (Figure 58). The diff erence in avoidable ED visits between the zip codes with the highest and lowest rates is more than 750%. The rate of avoidable ED visits is strongly correlated to economic hardship; persons living in zip codes with higher economic hardship have higher rates of avoidable ED visits.8

HEALTHY CHICAGO 2.0
Informing Eff orts to Achieve Health Equity 36
Figure 57. Avoidable emergency department visits by race/ethnicity, 2009-2011 (IDPH, US Census)
857.7
519.2448.0
198.4178.0 174.8
209.2
468.6
908.5
535.3
Figure 58. Avoidable emergency department visits by zip code, 2011
(IDPH, US Census)

HEALTHY CHICAGO 2.0
Community Health Assessment:37
Figure 59. HIV con nuum of care, 2011 (CDPH, CDC)
Data Sources: CDC Na onal Es mate of Persons Living with HIV (Diagnosed and Undiagnosed); Number of persons ≥18 years of age on 12/31/2010 diagnosed with HIV infec on through 12/31/2010, and living with HIV on 12/31/2011. Total weighted popula on es mate of HIV-infected adults who had at least 1 documented HIV medical care visit in 2011. Total HIV-infected adults (# of Retained, % of Living) who had at least 1 documented HIV medical care visit in 2011 with a documented prescrip on for an retroviral therapy (ART) in 2011. Total HIV-infected adults (# of on ART, % of Living) who had at least 1 documented HIV medical care visit in 2011 and had a documented HIV viral load of undetectable or ≤ 200 copies/mL at most recent viral load test.
Data from the CDPH Offi ce of HIV Surveillance demon-strate that of the es mated 23,334 living with HIV infec on in Chicago, only 86% (20,067) have been diagnosed (Figure 59). Of those diagnosed, only 63% (12,609) are currently receiving HIV medical care. Of those currently in care, 88% (11,143) are on an retroviral therapy. Of those currently
on therapy, approximately 84% (9,343) have no detectable HIV virus in their blood (viral suppression). Thus, only 47% of those diagnosed and living with HIV in Chicago have achieved viral suppression. The 2015 updated Na onal HIV Strategy aims to have 80% of those diagnosed and living with HIV achieve viral suppression by 2020.14
100
80
60
40
20
0Diagnosed and
Undiagnosed persons living with HIV
Diagnosed and living with HIV
Chicago
23,334
20,067
12,609 11,143
9,343441,661 361,764
478,433
1,201,100
1,032,800
United States
Retained in Care On ART Virally Suppressed

HEALTHY CHICAGO 2.0
Informing Eff orts to Achieve Health Equity 38
Figure 60. Hardship by selected popula on characteris cs, 2010 (US Census)
Economic Stability: Economic hardship varies by race/ethnicity, age and household type (Figure 60). Non-Hispanic blacks and Hispanics are overrepresented in the highest hardship community areas, with 48.2% and 46.2% respec vely. Children and youth are more o en in
the higher hardship community areas, with 43.2% of 5-14 year-olds living in areas with high hardship. Almost half (47.6%) of all female-headed households with children under 18 years of age live in community areas with higher levels of hardship.19
Low Medium High
Number Percent Number Percent Number Percent
Total Popula on 907,911 33.4 949,202 34.9 864,172 31.8
Race/ethnicity
Hispanic or La nos 136,867 17.5 284,258 36.3 362,353 46.2
Non-Hispanic African American or black 96,011 10.9 356,149 40.6 424,661 48.4
Non-Hispanic Asian or Pacifi c Islander 68,288 46.4 56,546 38.4 22,346 15.2
Non-Hispanic white 586,752 67.5 236,014 27.2 46,508 5.4
Age (years)
Less than 5 49,400 26.4 64,271 34.3 73,707 39.3
5-14 66,993 20.1 122,775 36.8 144,067 43.2
15-24 123,492 30.2 139,063 34.0 146,886 35.9
25-34 238,561 46.0 148,740 28.7 131,390 25.3
35-44 137,611 36.1 131,113 34.4 112,911 29.6
45-54 109,376 31.9 127,489 37.2 105,720 30.9
55-64 89,121 33.5 101,510 38.2 75,360 28.3
65-74 50,133 32.8 61,003 39.9 41,821 27.3
74-85 29,772 32.7 37,151 40.8 24,182 26.5
85 and older 13,452 35.7 16,087 42.7 8,128 21.6
Gender
Male 444,605 33.7 455,580 34.5 420,353 31.8
Female 463,306 33.1 493,622 35.2 443,819 31.7
Households 181,496 31.1 214,648 36.8 187,127 32.1
Households with children less than 18 years 72,031 27.1 96,150 36.2 97,686 36.7
Households with female head of household and children less than 18 years 13,668 15.0 34,180 37.4 43,437 47.6
Seniors living alone (65 and older) 35,819 39.3 34,721 38.1 20,498 22.5

HEALTHY CHICAGO 2.0
Community Health Assessment:39
Economic hardship is associated with many health outcomes in Chicago. High hardship strongly correlates with inadequate prenatal care, teen births, self-reported fair or poor health status, smoking, low fruit and vegetable consump on, no physical ac vity, adult obesity, poor mental health, chlamydia incidence, hospitaliza ons related to heart disease, diabetes and chronic obstruc ve pulmonary disease, cervical cancer incidence and mortality, premature mortality, homicides, drug-induced mortality and infant mortality. Low hardship is correlated with breast cancer incidence and suicide (Figures 62a and 62b).
Low hardship = light blue; Medium hardship = medium blue; High hardship = dark blue.
Figure 61. Household income diversity by census tract, 2009-2013 (US Census)
SMOKING (% of adults) MENTALLY UNHEALTHY DAYS (avg. in past month)
<5 SERVINGS FRUITS & VEGETABLES (% of adults)
FAIR OR POOR HEALTH STATUS (% of adults)
NO PHYSICAL ACTIVITY (%) ADULT OBESITY (%) TEEN BIRTH RATE (per 1,000 females aged 15-19)
CERVICAL CANCER MORTALITY (per 100,000 females)
BREAST CANCER MORTALITY (per 100,000 females)
INFANT MORTALITY (per 1,000 live births)
SUICIDE (per 100,000)
HOMICIDE (per 100,000)
Figure 62a. Selected health indicators by economic hardship, 2010 (US Census)

HEALTHY CHICAGO 2.0
Informing Eff orts to Achieve Health Equity 40
Figure 62b. Selected health indicators by neighborhood economic hardship, 2010 (IDPH, US Census)
Although about one-third (31.7%) of Chicago households spend at least 30% of household income on housing costs, this rate varies greatly by community area from 10% to 83.8%. Higher rates of severe housing cost burden dispropor onately aff ect the west and south sides of Chicago (Figure 63). On the west side in Hermosa, more than half (52%) of the households have severe housing cost burden.19 Severe housing cost burden has had a nega ve impact on chronic disease mortality. In Chicago, persons living in census tracts with the highest housing burden levels also have the highest rates of heart disease, cancer and diabetes mortality.
CERV
ICAL
CAN
CER
INCI
DENC
E
INAD
EQUA
TE
PREN
ATAL
CAR
E
10,000 50 25 250
R2=0.488 R2=0.429 R2=0.468 R2=0.582
HARDSHIP MoreLess
HARDSHIP MoreLess
HARDSHIP MoreLess
HARDSHIP MoreLess
BREA
ST C
ANCE
R IN
CIDE
NCE
CHLA
MYD
IA IN
FECT
ION
20,000 300 250 120
R2=0.448 R2=0.568 R2=0.357 R2=0.373
HARDSHIP MoreLess
HARDSHIP MoreLess
HARDSHIP MoreLess
HARDSHIP MoreLess
PREM
ATU
RE
MO
RTAL
ITY
(YPL
L)
DIAB
ETES
HO
SPIT
ALIZ
ATIO
NS
HEAR
T DI
SEAS
E
HOSP
ITAL
IZAT
IONS
COPD
HO
SPIT
ALIZ
ATIO
NS
Figure 63. Severe housing cost burden by census tract, 2008-2012 (US Census)

HEALTHY CHICAGO 2.0
Community Health Assessment:41
Built Environment: In Chicago, less child opportunity in a community area is strongly correlated with shoo ngs, elevated blood lead levels, child obesity, lower life
expectancies, diabetes-related and diet-related mortality and teen births (Figure 64).
R² = 0.6112
0
10
20
30
TEEN
BIR
TH R
ATE
LEVEL OF CHILD OPPORTUNITY Less More
R² = 0.5336
0
2
4
6
RATE
OF
SHO
OTI
NGS
LEVEL OF CHILD OPPORTUNITY Less More
R² = 0.5052
0
5
10
15
20
PERC
ENT
ELEV
ATED
BL
OO
D LE
VEL
LEVEL OF CHILD OPPORTUNITY Less More
R² = 0.4788
0
50
100
150DI
ABET
ES R
ELAT
ED
MO
RTAL
ITY
RATE
LEVEL OF CHILD OPPORTUNITY Less More
R² = 0.4725
60
70
80
90
LIFE
EXP
ECTA
NCY
LEVEL OF CHILD OPPORTUNITY Less More
R² = 0.4527
0
200
400
600
800
DIET
REL
ATED
M
ORT
ALIT
Y RA
TE
LEVEL OF CHILD OPPORTUNITY Less More
R² = 0.3225
0
10
20
30
40
PREV
ALEN
CE O
F CH
ILD
OBE
SITY
LEVEL OF CHILD OPPORTUNITY Less More
Figure 64. Selected health indicators by neighborhood child opportunity, 2014 (CDPH, CPD, CPS, IDPH, Kirwan Ins tute, US Census)

HEALTHY CHICAGO 2.0
Informing Eff orts to Achieve Health Equity 42
Overall in Chicago, 4.5% of children tested for lead are found to have elevated blood lead levels, with the highest percentages located in the western and southern parts of the city. Fuller Park has the highest concentra on of tested children with elevated blood lead levels (15.0%), while the Near South side has the lowest percentage (0.3%), a 15% diff erence (Figure 65). Community areas with lower child opportunity have a higher percentage of children with elevated blood lead levels.21
Approximately 500,000 Chicagoans (18.3%) experienced food insecurity in 2012, with the highest concentra ons on the west and south sides (Figure 66).22 Fuller Park has the highest percentage of residents experiencing food insecurity (56.4%) and the Loop has the lowest (6.5%), a diff erence of 50%. Diet-related mortality rates are higher in community areas with higher concentra ons of residents experiencing food insecurity.7 Nearly 400,000 residents of Chicago live in areas with reduced food access; there are 14 food deserts (two or more con guous census tracts with reduced food access) in the city, with most occurring on the south side (Figure 67).22
Figure 66. Percentage of popula on experiencing food insecurity by community area, 2012 (Greater Chicago Food Depository)
Figure 65. Percentage of children under 5 years with elevated blood lead levels by community area, 2014 (CDPH)

HEALTHY CHICAGO 2.0
Community Health Assessment:43
Conclusion: Chronic diseases, including heart disease, cancer, stroke, diabetes and respiratory diseases are the leading causes of morbidity and mortality in Chicago. Chicago has made progress on many health measures, including teen births, infant mortality and early prenatal care. However inequi es persist among racial-ethnic groups, neighborhoods and levels of economic hardship. In addi on, incidence of some chronic diseases and chronic disease risk factors (i.e., obesity, diabetes, breast cancer, hypertension and high cholesterol) are increasing. For adults overall there is li le to no improvement in the health behaviors related to smoking, nutri on, physical ac vity and preven ve cancer screenings, although, as referenced before with many health indicators, inequi es exist based on the popula on.
Children, adolescents and young adults face unique health challenges compared to adults. Sexually transmi ed infec ons and violence embody the most extreme inequi es seen in Chicago. LGB youth exhibit higher rates of risky behaviors, bullying, depression, suicide a empts and ea ng disorders. Over one-third of Chicago’s school-aged children are overweight or obese. Young females were more likely to report feeling sad or hopeless and disordered ea ng.
Aside from childbirth and heart disease, mental illness is the leading cause of hospitaliza ons, which includes substance-related, mood and schizophrenic disorders—the
second, third and fourth leading causes of hospitaliza ons in Chicago. Suicide was higher in community areas with lower hardship. Cost and access to mental health services were the most common reasons for not seeking treatment.
Overall violent crime decreased between 2001 and 2014 but extreme inequi es exist by community area. Among all leading causes of death, the greatest inequi es are seen in homicide rates between low and high economic hardship, non-Hispanic black and whites and Hispanic/La no and non-Hispanic whites.
The Educa onal Opportunity Index illustrates the presence and quality of early educa on and elementary schools at the neighborhood level. Lack of educa onal opportunity was shown to be strongly correlated with childhood obesity, teen births and lower rates of early prenatal care.
In 2011, 42,642 preventable hospitaliza ons occurred in Chicago, down 30% since 2000, but s ll high as they accounted for 14% of all hospitaliza ons. Both preventable hospitaliza ons and avoidable emergency department visits were strongly correlated with hardship. Asthma and diabetes-related hospitaliza ons in Chicago are much higher than na onal rates. Youth, Hispanics and residents living in high hardship areas are less likely to have a doctor. Of the 22,346 people living with HIV in Chicago, slightly more than half (54%) are in care.
The Hardship Index groups the economic characteris cs at the neighborhood level, while the Child Opportunity Index analyzes infrastructure elements that facilitate healthy child development at the neighborhood level. Both indices were strongly correlated with many health outcomes, indica ng the powerful rela onship between social determinants and health in Chicago. Across all analyses, equity was consistently related to place, socioeconomic status and race/ethnicity.
Figure 67. Loca ons of food deserts by census tract, 2014
(US Department of Agriculture)
HEALTHY CHICAGO 2.0
Informing Eff orts to Achieve Health Equity 44
REFERENCES:
1. Mon el LM, Nathan RJ, Wright DJ. An Update on Urban Hardship. Nelson A. Rockefeller Ins tute of Government. August 2004.
2. Acevedo-Garcia D, McArdle N, Hardy E et al. The Child Opportunity Index: Improving Collabora on Between Community Development And Public Health. Health Aff airs. 2014;33(11):1948-1957. doi:10.1377/hlthaff .2014.0679.
3. Silver N. The Most Diverse Ci es Are O en The Most Segre-gated. FiveThirtyEight. 2015. Available at: h p://fi vethirtye-ight.com/features/the-most-diverse-ci es-are-o en-the-most-segregated/. Accessed November 19, 2015.
4. Tunstall H. Neighbourhoods and Health. Kawachi I and Berkman LF (eds). New York: Oxford University Press Inc, USA, 2003, pp. 320, 39.50. ISBN 0195138384. Interna onal Journal of Epidemiology. 2004;34(1):231-232. doi:10.1093/ije/dyh387.
5. Lafl amme EM, et. al. Measuring Chicago’s Health: Find-ings from the 2014 Healthy Chicago Survey (HCS). City of Chicago. 2015. Available at: h p://www.cityofchicago.org/content/dam/city/depts/cdph/CDPH/CDPH_HealthyChica-goSurveyReport.pdf. Accessed November 19, 2015.
6. LaFlamme EM, et al. Healthy Chicago Reports: Life Expec-tancy in Chicago, 1990-2010. City of Chicago. June 2014 Available at: h p://www.cityofchicago.org/content/dam/city/depts/cdph/sta s cs_and_reports/LifeExpectancy-inChicago1990-2010.pdf. Accessed November 19, 2015
7. Illinois Department of Public Health (IDPH), Division of Vital Records, Death Data
8. Illinois Department of Public Health (IDPH), Division of Pa ent Safety and Quality, Hospital Discharge Data
9. Centers for Disease Control (CDC). Behavioral Risk Factor Surveillance System (BRFSS), 2001 – 2011.
10. Illinois Department of Public Health (IDPH). Illinois Cancer Registry, 2007 -2011.
11. Centers for Disease Control (CDC). Na onal Center for Health Sta s cs. Division of Vital Sta s cs. Na onal Vital Sta s cs Surveillance System. Available at: h p://www.cdc.gov/nchs/nvss.htm. Accessed November 19, 2015.
12. Healthy People 2020. Washington, DC: U.S. Department of Health and Human Services, Offi ce of Disease Preven- on and Health Promo on. Available from: h p://www.
healthypeople.gov/2020/data-search/Search-the-Data. Accessed November 19, 2015.
13. Illinois Department of Public Health (IDPH), Division of Vital Records, Birth Data
14. Chicago Department of Public Health (CDPH). HIV/STI Division – Offi ce of HIV/STI Surveillance, 2013.
15. Jones RC, Morita J, Ramirez E, Bocskay KA, Lakhani A, Li-onberger A, Harvey-Ginto BC, Whyte S. Overweight and Obesity among Chicago Public Schools Students, 2010-11. City of Chicago, 2013.
16. Centers for Disease Control (CDC). Youth Behavioral Risk Factor Surveillance System (YRBS), 2001 – 2013.
17. Chicago Data Portal. Chicago Police Department (CPD). Chicago Crimes 2001 – Present. Available at: h ps://data.cityofchicago.org/Public-Safety/Crimes-2001-to-present/ijzp-q8t2. Accessed November 19, 2015.
18. Lantz P, House J, Lepkowski J, Williams D, Mero R, Chen J. Socioeconomic Factors, Health Behaviors, and Mortality. JAMA. 1998;279(21):1703. doi:10.1001/jama.279.21.1703.
19. US Census Bureau. American Community Survey (ACS) 5-Year Es mates 2009-2013.
20. Chicago Public Schools (CPS). Accountability Reports. Available at: h p://cps.edu/SchoolData/Pages/SchoolDa-ta.aspx. Accessed November 19, 2015.
21. Chicago Department of Public Health (CDPH). Division of Environmental Health, Lead Poisoning Preven on Pro-gram, 2013.
22. Gundersen, C., E. Waxman, E. Engelhard, A. Satoh, & E. Waxman. Map the Meal Gap 2014: Food Insecurity Es -mates at the County Level. Feeding America, 2014.

HEALTHY CHICAGO 2.0
Community Health Assessment:45
PHASE 3B: COMMUNITY THEMES AND STRENGTHS ASSESSMENT
Purpose: The goal of the Community Themes and Strengths Assessment was to gather community resident feedback about their health and the health of their communi es and Chicago, i.e., what are community strengths/assets that improve residents’ health and what are barriers that impede their health. The assessment also obtained community-level strategies to how to improve community health and well-being. The fi ndings from this assessment will contribute to overall fi ndings from the other three assessments and be used to develop strategic issues during the Healthy Chicago 2.0 planning phase.
Process: CDPH collaborated with the University of Illinois at Chicago School of Public Health to conduct this assessment. To reach a broad sec on of residents, CDPH employed a mixed-methods approach, using four diff erent methods of data collec on: (1) an online neighborhood survey, (2) community conversa ons, (3) focus groups and (4) oral histories. By design, the online survey and community conversa ons reached larger numbers and broader segments of Chicago’s popula on. To reach marginalized communi es and popula ons who o en are not represented in broader data collec on eff orts, CDPH conducted focus groups and oral histories.
Data Collec on Methods:
Online Neighborhood Survey: An online neighborhood survey is a cost-effi cient method of collec ng a large number of community residents’ opinions on how they rate the health of their community and the health of Chicago. A subcommi ee designed the survey to obtain data on the following components that represent a broad view of health and well-being: educa on, safety, social cohesion, aff ordability, civic engagement, neighborhood upkeep, availability of services, transporta on, quality of life and equity. The survey collected individual demographics and contained twenty-four agree/disagree statements and two qualita ve ques ons (Appendix 2a). Direc on for the survey emerged through a review of community surveys made available by the Na onal Associa on of County and City Health Offi cials (NACCHO) website on Community Health Assessment and Improvement Planning. CDPH piloted the survey, made adjustments and then released both the English and Spanish versions on November 11, 2014. The survey closed on December 8, 2014.
CDPH promoted the survey through many communica on channels to obtain responses from a broad spectrum of Chicago residents. Public health partners and stakeholders, such as Partnership for Healthy Chicago members, forwarded the survey link to their colleagues and networks. CDPH also worked through the Aldermen’s offi ces and other City departments to share the survey link. For example, the
Chicago Public Library’s website featured a link to the survey on their home page. CDPH used social media (i.e. Facebook and Twi er) and our Healthy Chicago Monthly Update e-newsle er to promote the survey.
In total, 1,033 individuals completed the survey. Survey data were analyzed based on the Economic Hardship Index of the respondent’s community area. The Economic Hardship Index was developed by Rockefeller Ins tute and compares geo-graphic areas based on several data indicators from the U. S. Census Bureau’s American Community Survey: crowded housing, households below poverty, unemployment, high school gradua on, dependent popula on and income. A higher Hardship Index score represents worse economic condi ons. The survey grouped community areas into hardship quar les and analyzed responses based on the quar le (Figure 68). Demographics of survey respondents as compared to Chicago’s popula on are described in Figure 69.
Figure 68. Economic hardship by community area, 2012 (US Census)

HEALTHY CHICAGO 2.0
Informing Eff orts to Achieve Health Equity 46
Figure 69. Demographics of online neighborhood survey respondents, 2015, and City of Chicago residents, 2010 (US Census)
Survey Respondents City of ChicagoGender
Female 71.0% 51.5%Male 28.4% 48.5%Transgender 0.6% N/A
Race/EthnicityHispanic 20.3% 28.7%Non-Hispanic white 56.3% 32.2%Non-Hispanic black 17.6% 31.9%Non-Hispanic Asian 3.6% 5.7%Non-Hispanic other or mul -racial 4.2% 1.6%
IncomeLess than $20,000 8.9% N/A$20,000-$39,999 11.0% N/A$40,000-$59,999 19.3% N/A$60,000-$79,999 17.2% N/A$80,000 or more 43.6% N/A
Educa onLess than high school diploma 7.9% 18.9%High school graduate 2.1% 23.2%Some college, Associates degree 13.9% 23.8%Bachelors degree 27.4% 20.4%Graduate degree or higher 48.7% 13.8%
AgeMean age (years) 41.0 33.3 10 to 19 years 8.4% 12.7%20 to 29 years 16.8% 18.3%30 to 39 years 24.2% 16.2%40 to 49 years 16.8% 13.1%50 to 59 years 17.7% 11.7%60 to 69 years 13.2% 7.8%70 to 79 years 2.5% 4.4%80+ years 0.4% 2.8%

HEALTHY CHICAGO 2.0
Community Health Assessment:47
Community Conversa ons: To reach community residents and public health stakeholders throughout the city, CDPH held community conversa ons in fi ve diverse Chicago neighborhoods. These two-hour conversa ons brought people together to discuss assets and barriers to health and quality of life in their community and in Chicago as a whole. The loca ons and site hosts represent communi es likely to have health inequi es because of racial/ethnic, income, sexual orienta on and/or gender iden fi ca on status. CDPH, together with the Partnership, worked with local partners to host conversa ons in the communi es of Aus n, Grand Boulevard, Lake View, Lower West side and Near North side.
CDPH adver sed the community conversa ons through social media, CDPH listservs and the Partnership members’ contact lists. Host sites posted fl yers promo ng the events. Similar conversa ons occurred with other partners and public health experts, including the Chicago Board of Health, EverThrive Illinois Chapter Members, substance abuse providers and advocates, violence preven on providers, City of Chicago Interdepartmental Task Force on Childhood Obesity, Mikva Challenge Teen Health Youth Council, the Partnership for Healthy Chicago and CDPH management and staff .
A total of 299 individuals par cipated in the conversa ons. Although CDPH did not formally collect par cipants’ demographics, most either represented a community-based organiza on in that area or lived in or nearby the community where the mee ngs were held. During the conversa ons, facilitators asked the following ques ons (Appendix 2b):
1. What are the a ributes of your neighborhood/Chicago that improve health and well-being?
2. What are the barriers to achieving health and well-being?
3. What can we (the public health system/communi es) do over the next 3-5 years to improve health and well-being?
Focus Groups: To obtain insights from marginalized individuals who are less likely to answer a survey or a end a public mee ng, CDPH collaborated with the Community Assessment graduate level class (CHSC-431) at the University of Illinois at Chicago (UIC) School of Public Health to conduct fi ve focus groups. CDPH sought and received Internal Review Board (IRB) approval from both the University of Illinois at Chicago and the Chicago Department of Public Health for the protec on of human subjects, specifi cally vulnerable popula ons and use of the focus group process and procedures. CDPH held an addi onal focus group with ten
members of the Mikva Challenge Teen Health Youth Council, a group of diverse high school students who research health issues and develop policy recommenda ons to improve the health of CPS students. Held between October and November, 2014, the focus groups engaged the following popula ons: teen mothers, ex-off enders, families in shelters, housing advocates and members of a faith congrega on in the community areas of: Aus n, North Lawndale, Douglas and Lower West and Englewood, respec vely. A total of 48 individuals par cipated in the focus groups. The focus groups were confi den al, so demographic informa on was not collected. However, the majority of par cipants shared that they lived in or nearby the loca on of the focus group.
UIC graduate students led the 90-minute focus groups, which were conducted in English (Appendix 2c). To prompt focus group par cipants to think broadly about health and social determinants of health, UIC students presented the World Health Organiza on defi ni on of health, i.e., “a complete state of physical, mental and social well-being, and not merely the absence of disease or infi rmity.”
The graduate students asked the following ques ons to facilitate discussion and input:
• What do you like about your community and what are some things that support healthy living in Chicago? What are the biggest challenges to being healthy in your community?
• What are some barriers to being healthy in Chicago?
• When you think about the health of your community, what are barriers to good health?
Oral Histories: UIC worked with local partners and StoryCorps (the na onal story archival project of the American Folk Life Center at the U.S. Library of Congress) to collect oral histories from individuals who live in the Li le Village neighborhood of South Lawndale. The local partners/host iden fi ed six individuals to be interviewed (two men and four women) and conducted the interviews in Spanish (four of the interviews) or English (two of the interviews), based on the interviewee’s request. The interview consisted of six ques ons that encouraged interviewees to share experiences related to their health and the health of their families (Appendix 2d). The interviewees spoke about their experiences living in Li le Village, a predominantly La no and Mexican immigrant neighborhood in Chicago and the aspects of their community that contribute to their opportuni es to be healthy, i.e., their percep ons of the social and structural roots of health, safety and wellness.
Data Limita ons: This report acknowledges data limita ons in the data collec on methods, primarily due to the limited sample size and the limited diversity of par cipants. The online survey, although distributed widely and available in English and Spanish, did not obtain as broad of a par cipa on as sought. In addi on, the demographics of the respondents
A complete state of physical, mental and social well-being, and not merely the absence of disease or infi rmityWorld Health Organiza on defi ni on of health

HEALTHY CHICAGO 2.0
Informing Eff orts to Achieve Health Equity 48
from the online survey do not represent the popula on of the city of Chicago. CDPH a empted to address this problem by promo ng the survey through the Chicago Public Library and designing the survey to be completed on a smart phone. Even with these accommoda ons in place, survey response was skewed to higher income and lower minority popula ons.
Community conversa ons were held at sites familiar to key popula on groups from whom CDPH wanted feedback and involvement. CDPH conducted outreach through our communica on channels and other partners to engage community residents. The majority of a endees, while Chicago residents, were staff at local community-based organiza ons. Although the discussions were rich, as the a endees represented the concerns of their clients, feedback did not include as much of the direct resident input sought.
CDPH conducted the focus groups and oral histories specifi cally to obtain data from marginalized popula ons; therefore, they by design were not representa ve of the en re popula on. The focus groups allowed us to obtain informa on on percep ons of health and quality of life from 48 par cipants. Due to these small numbers, however, these fi ndings cannot be generalized to those communi es or to other popula ons. The focus groups were conducted in English and four of the six oral histories were conducted in Spanish.
Findings: As CDPH analyzed fi ndings from the various data collec on methods, nine themes emerged. These themes highlight both the problems impac ng people’s health as well as opportuni es to improve peoples’ lives. Most themes are inter-related and suppor ve of each other.
Theme #1: Stress
Theme #2: Safety
Theme #3: Educa on
Theme #4: Social Cohesion
Theme #5: Community and Civic Engagement
Theme #6: Aff ordability
Theme #7: Availability of Services/Resources
Theme #8: Neighborhood Upkeep
Theme #9: Transporta on
Stress: The central theme men oned consistently in all the data collec on methods was stress. People shared how the stress they experience impacts all levels of their health and quality of life. Research shows that the presence of stress, especially when it is con nuous or frequent, can aff ect both mental and physical health, including the following condi ons: heart disease, stroke, cancer and func oning of the immune system.1 Par cipants in this assessment recognized how stress impacts not only their health and the health of their family, but also the structure of their
community. Focus group members connected their high levels of stress to condi ons in their neighborhood and limited access to resources—feeling unsafe, educa on inequi es, transporta on inequi es, lack of health care resources, lack of social cohesion and connectedness, cost of living and poverty. Many community conversa on par cipants discussed issues of violence and educa onal inequi es as stressors. Oral history interviewees spoke at length about the many stressors that impact their health, including neighborhood violence, which impedes their ability to accomplish their daily ac vi es. The built environment was also men oned as a cause of stress for a par cipant who had diffi culty naviga ng the neighborhood where the sidewalks were inaccessible for someone using a wheelchair.
Safety: Findings from all the data collec on methods showed that individuals perceive community safety as a major impact on their health and the health of their community. Online survey respondents from all four hardship quar les iden fi ed safety as a concern and ranked eff orts to increase safety as the number one way to make Chicago a healthier place to live (Figure 70).
How would you make Chicago a healthier place to live?
Q1 Rank
Q2 Rank
Q3 Rank
Q4 Rank
Safety 1 1 1 1
Healthy Food 2 2 2 2
Equity 4 5 3 3
Educa on 5 4 6 4
Built Environment 3 3 4 6
However, the survey revealed large dispari es between the percep ons of respondents in the highest and lowest hardship quar les in response to ques ons about safety in their neighborhoods (Figure 71). Compared to quar le 4, twice the percentage of respondents in quar le 1 iden fi ed that they felt safe in their neighborhood and felt that law enforcement was responsive. Conversely, higher percentages of quar le 4 residents iden fi ed problems of property and violent crime, at more than one-third and two-thirds mes of those living in quar le 1, respec vely.
Figure 70. Health concern ranking by quar le, 2015 (Online Neighborhood Survey)

HEALTHY CHICAGO 2.0
Community Health Assessment:49
Figure 71. Percentage of respondents agreeing to safety ques ons by quar le, 2015 (Online Neighborhood Survey)
Par cipants in the focus groups, community conversa ons and oral histories connected issues of safety and violence to the lack of available services and inequitable distribu on of resources. Percep on of police corrup on was also iden fi ed as a barrier to health. Focus group members spoke at length about their mistrust of the police and that community members have been harassed. One focus group par cipant shared that “…you got to deal with all the nega ve vibra ons in the community like the police offi cers.” Another person stated that many neighborhood residents experience stress because they do not believe the police are interested in helping them.
Three of the fi ve focus groups addressed lack of safety as a barrier to health—a focus that also emerged repeatedly in the oral histories. Focus group par cipants conveyed they feel stress induced by the fear of being shot and being a vic m of violence. Par cipants also shared their feelings that violence in their communi es is at the founda on of inequitable health outcomes and opportuni es. One focus group member described how violence specifi cally aff ects her ability to take her child to the park: “they [the gang members] can shoot you or [you will] be caught in crossfi re...” Being surrounded by violence limits these individuals’ health and quality of life. The Mikva youth group echoed concerns with community violence, saying, “If you want to meet up with someone, you have to be careful what route you take.” They also shared that the presence of gangs makes it diffi cult to go to the park, so “it’s easier to stay inside and play video games.” Oral history interviewees also discussed the long-term eff ects that gang violence has had on them and their neighbors.
Many programs and community organiza ons are working to reduce and prevent violence. Focus group members spoke in support of a erschool programs for middle school students as eff ec ve deterrents. These programs provide at-risk children with posi ve adult support and off er an alterna ve to joining a gang. The success of these programs was shared by a focus group member, who said, “…[if] they can do what they love to do, they will put down the guns.” Another person stated that resources are needed to prevent children from ge ng involved in crime “…Every child has a gi . And kids they love... basketball, kids love football. And with nothing out there to keep them [busy]...” Another comment was... “We need Boys & Girls Clubs out here. We need something for these kids to be doing so when they get out [of] school, they can
have something to do, instead of just standing outside on the blocks… They don’t have nothing to do.” Mikva teens also iden fi ed the need for a safe community center where they could go a er school to par cipate in structured ac vi es.
To address mistrust of police, community members proposed several strategies, including trainings. Both police and community members need to be involved with trainings to build trust and understanding and to help iden fy common goals for a safe neighborhood. Community members also want more neighborhood watch programs that engage residents.
Group par cipants reinforced the importance of the Chicago Park District’s neighborhood parks for both physical ac vity and community engagement. However, park usability is dependent on their safety and community members’ percep on of safety. This varies widely throughout Chicago’s neighborhoods and eff orts must focus on making parks safe for all residents, especially the most marginalized.
Educa on: All of the adult focus groups and the par cipants in the community conversa ons discussed educa on and iden fi ed ways in which the quality of the educa on and the educa on system itself were both an asset and a barrier to good health. Community members inherently knew that high quality educa on leads to jobs that more likely provide be er health-related benefi ts and higher salaries, which allow individuals to make healthier choices in housing, food consump on and other factors of daily living. Research also connects higher educa onal status with more prolifera ve social networks and supports.2
When iden fying educa onal system assets, par cipants highlighted Chicago Public Schools’ (CPS) recess policy. Beginning in school year 2012-2013, all CPS elementary students are required to have daily recess. This policy is aligned with governmental agencies’ recommenda ons and recognizes recess as a vital component of a child’s physical, social and academic development.3
Focus group and community conversa on members also applauded CPS’ work with health care providers to improve access to care for their students through the presence of 30 School-based Health Centers (SBHCs). Students are able to obtain onsite health care (e.g., physicals, immuniza ons and ongoing care for chronic condi ons such as asthma). SBHCs
Survey Ques ons Quar le 1 Quar le 2 Quar le 3 Quar le 4
I feel safe in my neighborhood 86.2 71.1 44.4 40.0
I feel law enforcement is responsive in my neighborhood when needed 86.8 71.6 49.3 43.4
Property crime is a problem in my neighborhood 41.9 56.6 65.1 75.3
Violent crime is a problem in my neighborhood 21.1 27.3 50.3 67.4

HEALTHY CHICAGO 2.0
Informing Eff orts to Achieve Health Equity 50
also off er behavioral health care and services for the preven on and treatment of sexually transmi ed infec ons. With services provided in the school building, children do not need to be taken out of school and their parents/guardians do not need to miss work to help them obtain care. Research shows that SBHCs increase students’ health knowledge and access to health-related services.4 Other CPS system improvements discussed include the establishment of the Offi ce of Student Health and Wellness, which provides leadership to the district on health policy, program evalua on and delivery of school health services through community partners. These programs include CDPH-coordinated dental care and vision services.5
Although par cipants did iden fy the previous CPS system assets, more o en they listed problems with CPS and the lack of quality educa on for all Chicago children. The most o en cited concern was CPS’ closing of 49 schools in 2013.6 Community members were s ll angry about these school closings for many reasons—that closings occurred primarily in minority and low-income neighborhoods, the stress thestudents had because of changing schools, crowded classrooms at welcoming schools and the blight the closed schools will have on their neighborhood. Par cipants shared their percep ons that the Chicago Board of Educa on did not respect or consider parents’ and community members’ voices during the process.
Focus group and community conversa on members complained that educa onal quality and innova ve learning opportuni es are not equitable throughout the city. Par cipants spoke at length about their concerns over the lack of quality educa on in neighborhoods on the south and
west sides. The data from the online neighborhood survey supported these fi ndings, with stark diff erences between hardship quar le 1 and quar le 4 responses on access to high quality educa on (Figure 72).
Par cipants made several sugges ons to improve educa on and the educa onal system. CPS should focus on improving neighborhood schools through increased investment and
integra on of innova ve programming. More voca onal training programs in the high schools would improve student opportuni es to obtain be er paying jobs. To improve the health of marginalized popula ons, respondents wanted more school-based or school-linked health and social services.
Social Cohesion: Par cipants in the focus groups and community conversa ons brought up issues of social cohesion and community interac on and involvement when discussing health and quality of life. Research shows that these factors provide stress-buff ering proper es and are important predictors of subjec ve well-being and greater life sa sfac on.7,8,9 McMillan and Chavis defi ned sense of commu-nity as “a feeling that members have of belonging, a feeling that members ma er to one another and to the group and a shared faith that members’ needs will be met through their commitment to be together.”10 Par cipants in our groups advocated for the public health system to incorporate social networks and community involvement as necessary compo-nents of public health improvement eff orts.
The online neighborhood survey asked ques ons about social cohesion and community connec on. Similar percentages of respondents from all quar les agreed with the following
statements: “I know and talk with my neighbors” (ranged from 69%-74%) and “There are places for people to gather in my neighborhood” (ranged from 92% to 83%). However, diff erences were evident by hardship quar le for percentages of people who agreed with the statements “I feel like I belong in my neighborhood” (90% to 64%) and “I have felt discriminated against in my neighborhood” (10% to 30%) (Figures 73 and 74).
Focus group members shared stories of social cohesion in their communi es. One of these aspects discussed in a focus group on the west side was the posi ve infl uence of “nosey neighbors.” “…There are a lot of people around here that watch out for others people’s kids...there are s ll a lot of good people around here.”
Figure 72. Online neighborhood survey, 2015
Figure 73. Online neighborhood survey, 2015
Children in my neighborhood have access to high quality education.
I feel like I belong in my neighborhood.
Hardship Quar le
80
60
40
20
0Q1 Q2 Q3 Q4
% o
f Res
pond
ents
Hardship Quar le
100
75
50
25
0Q1 Q2 Q3 Q4
% o
f Res
pond
ents
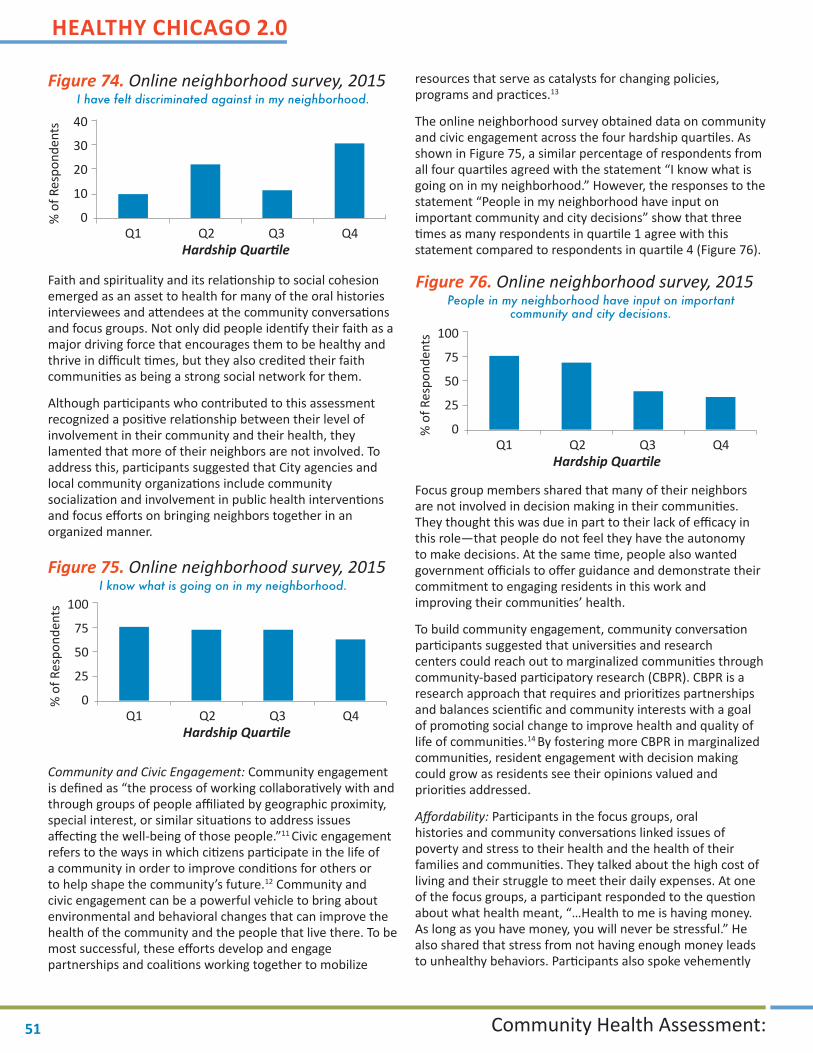
HEALTHY CHICAGO 2.0
Community Health Assessment:51
Faith and spirituality and its rela onship to social cohesion emerged as an asset to health for many of the oral histories interviewees and a endees at the community conversa ons and focus groups. Not only did people iden fy their faith as a major driving force that encourages them to be healthy and thrive in diffi cult mes, but they also credited their faith communi es as being a strong social network for them.
Although par cipants who contributed to this assessment recognized a posi ve rela onship between their level of involvement in their community and their health, they lamented that more of their neighbors are not involved. To address this, par cipants suggested that City agencies and local community organiza ons include community socializa on and involvement in public health interven ons and focus eff orts on bringing neighbors together in an organized manner.
Community and Civic Engagement: Community engagement is defi ned as “the process of working collabora vely with and through groups of people affi liated by geographic proximity, special interest, or similar situa ons to address issues aff ec ng the well-being of those people.”11 Civic engagement refers to the ways in which ci zens par cipate in the life of a community in order to improve condi ons for others or to help shape the community’s future.12 Community and civic engagement can be a powerful vehicle to bring about environmental and behavioral changes that can improve the health of the community and the people that live there. To be most successful, these eff orts develop and engage partnerships and coali ons working together to mobilize
resources that serve as catalysts for changing policies, programs and prac ces.13
The online neighborhood survey obtained data on community and civic engagement across the four hardship quar les. As shown in Figure 75, a similar percentage of respondents from all four quar les agreed with the statement “I know what is going on in my neighborhood.” However, the responses to the statement “People in my neighborhood have input on important community and city decisions” show that three mes as many respondents in quar le 1 agree with this
statement compared to respondents in quar le 4 (Figure 76).
Focus group members shared that many of their neighbors are not involved in decision making in their communi es. They thought this was due in part to their lack of effi cacy in this role—that people do not feel they have the autonomy to make decisions. At the same me, people also wanted government offi cials to off er guidance and demonstrate their commitment to engaging residents in this work and improving their communi es’ health.
To build community engagement, community conversa on par cipants suggested that universi es and research centers could reach out to marginalized communi es through community-based par cipatory research (CBPR). CBPR is a research approach that requires and priori zes partnerships and balances scien fi c and community interests with a goal of promo ng social change to improve health and quality of life of communi es.14 By fostering more CBPR in marginalized communi es, resident engagement with decision making could grow as residents see their opinions valued and priori es addressed.
Aff ordability: Par cipants in the focus groups, oral histories and community conversa ons linked issues of poverty and stress to their health and the health of their families and communi es. They talked about the high cost of living and their struggle to meet their daily expenses. At one of the focus groups, a par cipant responded to the ques on about what health meant, “…Health to me is having money. As long as you have money, you will never be stressful.” He also shared that stress from not having enough money leads to unhealthy behaviors. Par cipants also spoke vehemently
Figure 74. Online neighborhood survey, 2015
Figure 75. Online neighborhood survey, 2015
Figure 76. Online neighborhood survey, 2015
I have felt discriminated against in my neighborhood.
I know what is going on in my neighborhood.
People in my neighborhood have input on important community and city decisions.
Hardship Quar le
40
30
20
10
0Q1 Q2 Q3 Q4
% o
f Res
pond
ents
Hardship Quar le
100
75
50
25
0Q1 Q2 Q3 Q4
% o
f Res
pond
ents
Hardship Quar le
100
75
50
25
0Q1 Q2 Q3 Q4
% o
f Res
pond
ents

HEALTHY CHICAGO 2.0
Informing Eff orts to Achieve Health Equity 52
about the need to increase the minimum wage to a livable wage. Linking aff ordability and health has been substan ated through research, which shows that (1) people with lower socioeconomic status (SES) tend to experience more stress and (2) high levels of stress combined with low SES contribute to poor health outcomes.15
Several focus groups discussed aff ordability of housing, rela ng it to safety and quality of life. They complained about the poor quality of aff ordable housing in their communi es, which is o en not well maintained and contains many health hazards, such as mold.
Survey respondents in both quar le 1 and quar le 4 had lower percentages of agreement with the statement “Houses and apartments in my neighborhood are aff ordable” than respondents living in quar le 2 or 3 (Figure 77). This indicates that people living quar le 1 and 4 both recognize that their housing is not aff ordable. However, most people living in quar le 1 have chosen expensive housing compared to those in quar le 4, who may have no other choices.
The par cipants at several of the community conversa ons brought up concerns about wage inequi es. Wages impact residents’ ability to purchase basic needs for their fami-lies. Even holding a full- me posi on, most minimum wage earners do not have suffi cient income to cover all of his or her family expenses. One community member pointed out that at $8.25 an hour for a 40-hour work week, an employee wouldn’t even take home $300 dollars. A focus group mem-ber talked about the experience of working but not earning enough to pay bills. “Some people don’t want to live off the government. You know ‘cause I don’t. I try to live off of food stamps. I get paid every 2 weeks and get $413 for one month. What is that going to do? I have rent to pay. Rent is $670. I have 2 kids. One in diapers. So I’m being serious though, how are you going to survive with $413 with 2 kids...” Focus group members discussed that not being able to support one’s family is a driving factor to illegal ac vity. Par cipants also discussed their concerns over the high cost of child care. One focus group par cipant explained that a er fi nding and paying for childcare he/she could not make enough income to support rent and other bills.
Focus group, oral history and community conversa on par cipants suggested increasing the minimum wage as a strategy to improve health. (N.B. A er the assessment was completed, the Chicago City Council passed an ordinance that incrementally raises the minimum wage to $13 per hour by 2019.)16 Strategizing further, par cipants suggested developing more aff ordable childcare programs and increasing available aff ordable housing op ons, including single room occupancy and single-family homes.
Neighborhood Upkeep: Par cipants in the focus groups and community conversa ons iden fi ed the built environment and neighborhood upkeep as an important factor of health and quality of life. Not only does adequate infrastructure allow people to go outside and be physically ac ve, it also reinforces safety. Research aligns with par cipant feedback, showing that housing and neighborhood quality have an impact on percep ons of safety and on sa sfac on with the local physical environment.17
Figure 77. Online neighborhood survey, 2015
Figure 78. Online neighborhood survey, 2015
Houses and apartments in my neighborhood are affordable.
The streets and sidewalks in my neighborhood are in good shape.
Hardship Quar le
100
75
50
25
0Q1 Q2 Q3 Q4
% o
f Res
pond
ents
Hardship Quar le
100
75
50
25
0Q1 Q2 Q3 Q4
% o
f Res
pond
ents

HEALTHY CHICAGO 2.0
Community Health Assessment:53
The online neighborhood survey revealed large variances across the four quar les in respondents’ percep ons of upkeep and shape of their neighborhood, including the status of their streets and sidewalks (Figure 78). Focus group members were emo onal about the dispari es in neighborhoods. One person contrasted the condi on of homes in his/her neighborhood to richer neighborhoods, “They might be missing the doors off of their porches. Porches falling down. And I mean these are buildings people are living in and…it was something to see. And I mean, it was blocks and blocks and blocks and blocks and then you get to further east. And you got nicer homes.” People also expressed concern that poor housing condi ons (mold, lead and lack of heat) compound exis ng health issues.
Several of the oral histories interviewees brought out how lack of neighborhood upkeep creates a direct barrier to health for the disabled and aging popula on. Crumbling and impassable streets and sidewalks create signifi cant obstacles for people with disabili es, limi ng their ability to access resources and move more freely around the city. Focus group par cipants also complained about the poor road condi ons in their neighborhood.
Many ideas on how to improve neighborhood upkeep arose at the community conversa ons. Par cipants suggested neighborhood beau fi ca on several mes, envisioning the recruitment of local residents and other volunteers for these projects. Establishing more community gardens was also cited as an opportunity to improve neighborhood upkeep.
Availability of Services/Resources: Availability of basic ameni es such as a grocery store, pharmacy, or library is an important measure of community health and quality of life and percep ons of availability diff ered by hardship quar le (Figure 79). Respondents reported inequi es in access to healthy food, with almost twice as many respondents in quar le 1 than quar le 4 repor ng access (Figure 80).
Members at several focus groups spoke at length that they do not feel they have quality grocery stores in their south and west side neighborhoods. One woman cited seeing “bad” meat and wilted vegetables for sale at her local grocery store. She voiced that these off enses would not be tolerated at a grocery store on the north side.
Par cipants in the focus groups (including the Mikva Teen group) and community conversa ons talked about their personal experiences trying to obtain healthy food. Mikva Teens shared that their families buy food in the neighborhood because it is cheaper. However, one teen remarked that “…the corner stores sell cheaper inferior goods that are un-healthy.” In addi on to lack of access to healthy food, focus group par cipants brought up that people need to know more about how to cook healthy food and proper food storage methods.
Focus group and community conversa on par cipants discussed accessing health care resources for physical health and mental health. Par cipants spoke about the need for culturally-eff ec ve services throughout the whole system to reach marginalized popula ons. Community members expressed frustra on due to the reduc on of mental health services sites when the City of Chicago consolidated its 12 mental health clinics into six centers in 2012. Community members expressed that the closing of these facili es further denigrated the level of inadequate mental health services for Chicago residents—they stated that it is more diffi cult to fi nd resources, there is a longer wait for appointments and they believe that many people are not ge ng their needed services.
Group par cipants discussed how the Pa ent Protec on and Aff ordable Care Act (ACA) is working to increase access to health care insurance and health care. However, people also stated that many community members do not understand how to enroll or use their health plan when they get it. Par cipants knew that ACA pa ent navigators are working to reach uninsured popula ons and applauded all the work being done on this eff ort. At the same me, people shared there are s ll many groups that have not yet been reached with this informa on. Therefore, they recommended con nued eff orts in the communi es to reach the uninsured and also help people understand the health care system.
Figure 79. Online neighborhood survey, 2015
Figure 80. Online neighborhood survey, 2015
Basic amenities, such as a grocery store, pharmacy or library are easily accessible to me.
I have access to healthy food in my neighborhood.
Hardship Quar le
100
75
50
25
0Q1 Q2 Q3 Q4
% o
f Res
pond
ents
Hardship Quar le
100
75
50
25
0Q1 Q2 Q3 Q4
% o
f Res
pond
ents

HEALTHY CHICAGO 2.0
Informing Eff orts to Achieve Health Equity 54
Results from the online survey demonstrate diff ering percep ons of neighborhood access to health services and social and recrea onal opportuni es across hardship quar les. Figures 81 and 82 show larger percentages of respondents in quar le 1 indicated easier access to both health services and social and recrea onal opportuni es compared to respondents in quar le 4. Similarly, focus group par cipants, who primarily lived in low-income neighborhoods, discussed the limited availability of recrea onal ac vi es, which were due to lack of programming and cost.
To improve access to healthy food, par cipants at the community conversa ons suggested increasing farmers markets in marginalized neighborhoods and allowing purchase with the Supplemental Nutri on Assistance Program (SNAP—formerly known as food stamps) LINK card and incen ves, such as double value benefi ts.
Transporta on: The ability to travel around one’s neighbor-hood and throughout the city to commute to work, access services, u lize resources and visit family and friends is an important aspect of health and quality of life. Par cipants from all the data collec on methods recognized the impact of accessible transporta on on their health. Survey respon-dents across the city generally felt their neighborhood was well served by public transport (Figure 83). However, when asked about walking and bicycling, diff erences were evident between quar le 1 and quar le 4 (See Figure 84).
The Divvy bike sharing program was one of the main transporta on and public health eff orts men oned throughout this assessment. Chicago’s Divvy program supplies over 4,760 bikes at 476 sta ons across the city and provides a healthy op on for transporta on, encouraging people to be ac ve.18
On the fl ip side, group par cipants raised concerns that Divvy sta ons are not distributed equitably, with no sta ons located south of 55th Street.
Focus group members also talked about barriers to walking and biking. Many associated poor ligh ng, safety and dismantled infrastructure with a limited number of individuals choosing ac ve transporta on modes on the south and west sides of Chicago. Both community conversa ons and focus group par cipants expressed frustra on about the pot holes and poor roads. Community conversa on par cipants also presented the opportunity to improve the walkability of streets by priori zing pedestrians and conver ng more neighborhood streets to “Complete Streets,” i.e., designing streets that ensure safe access for all modes of transporta on, including pedestrians, bicyclists, motorists and transit riders. Adop ng a Complete Streets policy creates a be er network of streets that is safer for everyone, regardless of age or ability.19 Although Chicago adopted this policy in 2013, most par cipants did not know about it and most neighborhoods have not benefi ted yet.
Public transporta on emerged as a barrier impac ng health and quality of life in one of the focus groups. Par cipants expressed frustra on with the slow and limited bus service, causing them to be late or set aside long stretches of me to transfer buses to get to work or other appointments outside
Figure 81. Online neighborhood survey, 2015
Figure 82. Online neighborhood survey, 2015
Figure 83. Online neighborhood survey, 2015
Figure 84. Online neighborhood survey, 2015
Health services I use are easy to get to from my neighborhood.
My neighborhood provides social and recreational opportunities for me and my family.
My neighborhood is well served by public transit.
I see a lot of people walking or biking in my neighborhood.
Hardship Quar le
Hardship Quar le
100
75
50
25
0Q1 Q2 Q3 Q4
% o
f Res
pond
ents
100
75
50
25
0Q1 Q2 Q3 Q4
% o
f Res
pond
ents
Hardship Quar le
100
75
50
25
0Q1 Q2 Q3 Q4
% o
f Res
pond
ents
Hardship Quar le
100
75
50
25
0Q1 Q2 Q3 Q4
% o
f Res
pond
ents

HEALTHY CHICAGO 2.0
Community Health Assessment:55
of their neighborhood on the south and west sides. One par cipant said, “Out here, the buses around here run so slow but on the north side them buses literally come back to back to back to back.” People saw these inequi es as increasing their stress and therefore impac ng their health.
Sugges ons for improvements included improved access to transporta on on the south and west sides of Chicago. At the community conversa ons, par cipants suggested the City invest more funding into the road and sidewalk infrastructure, specifi cally on the south and west sides. Focus group par cipants also indicated improved safety has a direct eff ect on improving transporta on in and around the city.
Importance of policies and poli cal support for public health: Through all the data collec on methods for the Community Themes and Strengths Assessment (i.e., focus groups, oral histories, community conversa ons and online neighborhood survey), par cipants acknowledged the importance of policy on improving health. As iden fi ed in the themes above, par cipants discussed several current policies that they believe are improving health status (e.g., CPS recess policy, LINK card usage at farmers markets, minimum wage ordinance, etc.). Par cipants also highlighted the tobacco ordinances passed in 2014 that reduce access. Chicago City Council banned the sale of fl avored cigare es (including menthol) within 500 feet of a school and passed an ordinance that aligns restric ons on e-cigare es with tobacco cigare es.
Focus group and community conversa on par cipants discussed how poli cs and the poli cal system infl uence health. Several of the mee ngs were held prior to the 2014 gubernatorial elec on and people speculated possible changes that could occur with a new administra on. For the post-elec on mee ngs, par cipants asked ques ons about the impact the new administra on would have on funding for both the public health sector and eff orts to address health equity. People also discussed possible changes based on the upcoming Chicago mayoral elec on that was scheduled for early 2015.
Par cipants made several sugges ons regarding future policy strategies for improving health and equitable distribu on of resources. One strategy both stakeholders and community members brought up at community conversa ons was the need for long-term collabora on across the public health system to improve access and coordina on of services. Community members felt collabora on with the public health system would help streamline services and improve access for residents. They also noted that policy makers need to focus on social determinants of health, i.e., social and economic factors, social support networks, physical and social environments, access to health services and social and health policies.20
Crea ng a system of Health in All Policies (HiAP) was another sugges on of an opportunity to improve inequi es within Chicago. HiAP is a collabora ve approach to incorporate health considera ons into decision-making across sectors and policy areas and informs decision-makers about health consequences of various policy op ons during the policy development process.21
Conclusion: Community residents and public health stakeholders described many health assets and barriers in their neighborhoods and Chicago as a whole. In most cases, assets for some residents and communi es are barriers for others. This was illustrated with the discussions on commu-nity safety. Par cipants recognized that many organiza ons are working to decrease violence. Youth programming was highlighted as an important factor in impac ng both individual and community safety. People also iden fi ed rela onships in the community as helping to improve issues of safety. However, these programs are too limited and reliant on unstable funding sources. In addi on, most organiza ons do not focus on community cohesion. This dichotomy was also around issues of educa on and access to healthy food. Underlying all these discussions was individual and community-level stress. And throughout, par cipants emphasized the importance of health and resource equity and a steadfast focus on social and structural determinants of health.
Along with specifying the assets and barriers, CDPH asked par cipants for strategies to improve health. Par cipants iden fi ed the need to develop new policies and strengthen current eff orts. People also suggested expanding successful programs, developing new eff orts and increasing resources in communi es. Essen al within these sugges ons was their call for community involvement and social cohesion when conduc ng this work. Par cipants reiterated that impacts will only fully be made with resident engagement and buy-in with health improvement eff orts.

HEALTHY CHICAGO 2.0
Informing Eff orts to Achieve Health Equity 56
REFERENCES:
1. Stress and Anxiety. New York Times. h p://www.ny mes.com/health/guides/symptoms/stress-and-anxiety/pos-sible-complica ons.html. Published January 30, 2013. Accessed May 30, 2015.
2. Braveman P, Egerter S, Williams DR. The social determi-nants of health: Coming of age. Annual Review of Public Health. 2011;21(32):381–398. doi: 10.1146/annurev-publhealth-031210-101218.
3. Physical Ac vity. Chicago Public Schools. 2015. h p://cps.edu/oshw/Pages/PhysicalAc vity.aspx. Accessed Novem-ber 17, 2015.
4. Kisker E, Brown R. Do school-based health centers im-prove adolescents’ access to health care, health status and risk taking behavior? Journal of Adolescent Health. 1996;18(5):335-343. doi: 10.1016/1054-139X(95)00236-L.
5. Student Health and Wellness. Chicago Public Schools. 2015. h p://cps.edu/OSHW/Pages/HealthyCPS.aspx. Accessed November 17, 2015.
6. Yaccino S. Protests Fail to Deter Chicago From Shut- ng 49 Schools. New York Times. h p://www.ny mes.
com/2013/05/23/educa on/despite-protests-chica-go-closing-schools.html?_r=0. Published May 22, 2013. Accessed May 30, 2015.
7. Carpiano R, Hystad P. “Sense of community belonging” in health surveys: What social capital is it measuring? Health and Place. 2011;17(2):606-617. doi: 10.1016/j.health-place.2010.12.018.
8. Moore S, Shiell A, Hawe P, Haines V. The privileging of communitarian ideas: Cita on prac ces and the transla- on of social capital into public health research. Ameri-
can Journal of Public Health. 2005;95(8):1330-1337. doi: 10.2105/AJPH.2004.046094.
9. Hombrados-Mendieta MI, Gomez-Jacinto L, Domin-guez-Fuentes JM, Garcia-Leiva P. Sense of Community and Sa sfac on With Life Among Immigrants and the Na ve Popula on. Journal of Community Psychology. 2013;41(5):601-614. doi: 10.1002/jcop.21559.
10. McMillan DW, Chavis DM. Sense of community: A defi ni on and theory. Journal of Community Psy-chology. 1986;14(1):9. h p://iranarze.ir/wp-content/uploads/2015/01/Sense-of-Community.pdf. Accessed November 10, 2015.
11. Principles of community engagement. CDC/ATSDR Com-mi ee on Community Engagement. Centers for Disease Control and Preven on. h p://www.cdc.gov/phppo/pce/. Published 1997. Accessed May 30, 2015.
12. Adler R, Goggin J. What Do We Mean By “Civic En-gagement?” Journal of Transforma ve Educa on. 2005;3(3):236-253. doi: 10.1177/1541344605276792.
13. Fawce SB, Paine-Andrews A, Francisco VT, et al. Using empowerment theory in collabora ve partnership for community health and development. American Journal of Community Psychology. 1995;23(5):677-697. doi: 10.1007/BF02506987.
14. Resnik D, Kennedy C. Balancing Scien fi c and Com-munity Interests in Community-Based Par cipatory Research. Account Res. 2010;17(4):198-210. doi: 10.1080/08989621.2010.493095.
15. Brydon L, Edwards S, Mohamed-Ali V, Steptoe A. Socio-economic status and stress-induced increases in interleu-kin-6. Brain, Behavior and Immunity. 2004;281-290. doi: 10.1016/j.bbi.2003.09.011.
16. City of Chicago Minimum Wage Ordinance. City of Chicago. h p://www.cityofchicago.org/city/en/depts/mayor/supp_info/minimum-wage.html. Published 2014. Accessed May 30, 2015.
17. Aus n DM, Furr LA, Spine M. The eff ects of neighbor-hood condi ons on percep ons of safety. Journal of Criminal Jus ce. 2002;30(5):417-427. doi: 10.1016/S0047-2352(02)00148-4.
18. Chicago Department of Transporta on. About Divvy. h ps://www.divvybikes.com/about. Updated July 22, 2015. Accessed July 25, 2015.
19. Na onal Complete Streets Coali on. Smart Growth America. h p://www.smartgrowthamerica.org/com-plete-streets/complete-streets-fundamentals/complete-streets-faq. Published 2015. Accessed on November 17, 2015.
20. Koh HK, Oppenhheimer SC, Massain-Short SB, Em-mons KM, Geller AC, Viswanath K. Transla ng research evidence into prac ce to reduce health dispari es: A social determinants approach. American Journal of Public Health. 2010;100(S1):S72-S80. doi: 10.2105/AJPH.2009.167353.
21. Health in All Policies: A Guide for State and Local Govern-ment. Public Health Ins tute. h p://www.phi.org/re-sources/?resource=hiapguide. Published 2013. Accessed May 30, 2015.

HEALTHY CHICAGO 2.0
Community Health Assessment:57
PHASE 3C: FORCES OF CHANGE ASSESSMENT
Purpose: The purpose of the Forces of Change assessment (FOCA) is to iden fy forces (trends, factors or events) that presently or in the future will infl uence the health and quality of life of the community and the local public health system. Threats and opportuni es that could result from the forces are also iden fi ed.
Process: CDPH conducted the FOCA between October 2014 and January 2015 through several methods. The fi ve Community Conversa ons (see the descrip on in Community Themes and Strengths Assessment sec on) engaged stakeholders and residents and asked the following ques ons: “What are the forces and trends that are happening now or are likely to happen in the near future that will impact the health of Chicagoans?” “What are the threats or bad consequences of these forces?” “What are the opportuni es of these forces?” CDPH adver sed these conversa ons through emails, social media, the CDPH listserv, fl yers and the assistance of the host sites. CDPH engaged other groups in this assessment, including violence preven on providers, substance abuse providers, food insecurity advocates, the Chicago Board of Health and CDPH staff . CDPH combined par cipants’ responses into 12 diff erent categories. At the January 30, 2015 Partnership for Healthy Chicago mee ng, members met in small groups to add to and refi ne the forces iden fi ed through the conversa ons. Finally, all feedback was further synthesized and analyzed for themes. Over 200 people contributed to the Forces of Change Assessment.
Findings: Stakeholder discussion centered on the 12 categories of forces listed below. This sec on presents the forces iden fi ed and provides informa on and data that illustrate the context around these themes and related threats. Poten al opportuni es associated with the forces are also iden fi ed.
Force #1: Health and Mental Health
Force #2: Cost-of-Living and Inequality
Force #3: Housing and Homelessness
Force #4: Safety and Violence
Force #5: Educa on
Force #6: Policy and Poli cs
Force #7: Food and Food Systems
Force #8: Discrimina on and S gma
Force #9: Climate and Environment
Force #10: Data and Technology
Force #11: Older Adults
Force #12: Cultural Competence
Health and Mental Health: Star ng in 2013, the Pa ent Protec on and Aff ordable Care Act (ACA) and Illinois Public Act 98-104 extended health insurance coverage for many previously uninsured Chicagoans. Coverage provisions included the expansion of Medicaid eligibility to almost all nonelderly adults with incomes at or below 138% poverty, the extension of health care coverage to young adults to age 26 through their parents’ insurance and the availability of insurance through the Health Insurance Marketplace for persons without employer-based insurance or Medicaid. Persons with incomes between 100% and 400% of the federal poverty level are poten ally eligible for tax credits with Marketplace insurance.1 However, stakeholders expressed concern that the ACA does not provide universal health care coverage, leaving some people, including undocumented immigrants, without coverage.
In addi on, Illinois Public Act 96-1501, passed in 2011, mandated that 50% of Medicaid clients enroll in managed care by 2015, including the vast majority of Chicago clients.2 The Illinois Department of Healthcare and Family Services is focusing on these system changes to improve quality of care, reduce growth in health care costs and improve overall popula on health.3 Managed care en es organize a network of providers, with care coordinators assis ng with system naviga on, care transi ons and follow-up care. Providers will be rewarded for quality and health outcomes.
The mental health safety net is another concern for many. Community mental health treatment services and support services are cri cal for persons with serious mental illness. From FY2009-FY2012, Illinois cut $113.7 million in general revenue funding for mental health services. While increased insurance coverage through the ACA increases mental health coverage for some, Medicaid does not cover some services needed by persons with serious mental illness, such as early interven on. Medicaid pays low rates for some services, leaving many organiza ons with a need for addi onal funding sources.4
Threat: The system forces that improve health care access for many Chicagoans may also cause access diffi cul es for others. People who have trouble naviga ng new insurance systems may be unable to obtain needed care. Many newly-covered people have li le to no experience with health insurance. S ll others may have diffi culty understanding the system due to English language, cultural and/or literacy barriers. Indeed, consumer assistance services for the recently insured have been in demand na onwide. Those who are uninsured will con nue to need safety net services. Without provisions to maintain services for the uninsured, persons without
People have a choice of health plans, but care varies and there is a lot of confusion about the plans. -Community Conversa on Par cipant

HEALTHY CHICAGO 2.0
Informing Eff orts to Achieve Health Equity 58
insurance, such as undocumented individuals, risk a lack of preven ve care and untreated medical problems. Restricted medica on formularies pose serious risks to individuals who require specifi c medica ons to control and manage their health. Overall, system changes, without focus on popula ons in need, could lead to inadequate care, which then nega vely impacts health outcomes for persons with mental illness, including increased hospital emergency department use, hospitaliza on and contact with the criminal jus ce system.
Cuts to Medicaid funding and reimbursement are a poten al threat looming for health providers, including mental health agencies. In addi on, the overall capacity of the mental health system may be too small to address the needs of all Chicagoans.
Opportunity: Health care system changes bring opportuni es to expand the workforce of important lay providers—pa ent navigators and community health workers. This workforce is recognized as an eff ec ve and cost-effi cient method to assist individuals and families in understanding their insurance and obtaining the care they need. The opportunity to grow this workforce can also address issues of trust in the health care system, further promo ng access to care in marginalized communi es. The public health system can work with managed care providers to assure network adequacy.
Ongoing, high quality and accessible mental health treatment and support allows persons with serious mental illness to live independent, healthy and fulfi lling lives in the community. Advocacy for increased mental health funding, access to medica ons and provider reimbursement are needed. System coordina on and service integra on strategies can improve care access, quality and effi ciency.
Cost-of-Living and Inequality: Financial problems, e.g., poverty, high cost of living and the lack of jobs paying a livable wage, are a reality for many Chicagoans. In 2013, 10.8% of Chicagoans experienced poverty, with incomes at 0-99% of the poverty level, while 20.9% were classifi ed as low income (100-199%).5 Although the na on is no longer in a recession, many of the mid-wage jobs that were lost have not been recovered. For many, wages remain fl at despite higher costs of living. Income inequality is another issue that impedes equity in Chicago. Currently eighth in income inequality among 50 ci es in the United States, Chicago has experienced a sharp increase in income inequality since 1990.6,7 Poverty is concentrated in some communi es, crea ng large inequi es between neighborhoods.
Threat: Financial problems and poverty are a threat to housing stability, pu ng community members at risk for foreclosures and homelessness. Others are forced to move from Chicago to fi nd jobs or a more aff ordable place to live. Those experiencing fi nancial problems may newly qualify for public assistance and social services. Poverty, a key social determinant of health, is associated with poorer health outcomes overall.
Opportunity: In December 2014, Chicago City Council passed an ordinance to increase the minimum wage to $13.00 an hour by 2019.8 The passage of living wage legisla on, indexed to infl a on, is a step to further improve the well-being of Chicagoans and will have sustainable eff ects year-to-year. Chicago Public School (CPS) job training and appren ceships that are well-matched to growing Chicago job sectors could improve job outlooks for gradua ng seniors and voca onal training could be u lized by all age groups. Incen ves provid-ed to companies that train employees or have hiring pro-grams for the prisoner reentry popula on are opportuni es that could benefi t employers and employees alike.
Housing and Homelessness: Stakeholders discussed the need for aff ordable, safe housing, which is essen al to good health. However, about one-half of Chicagoans spent more than 30% of their income on rent in 2012, more than the accepted measure of aff ordability, with many paying more than one-half of their total income on rent.9 A 2014 analysis by Chicago Coali on for the Homeless es mates that 138,575 Chicagoans were homeless during the course of the 2013-2014 school year.10 Youth, veterans, domes c violence survivors and persons returning to the community following incarcera on are popula ons in need of interven ons to address the root causes of homelessness.
Threat: Unsafe and unaff ordable housing threatens health, mental health and well-being. When housing is unaff ordable, individuals have less money to spend on other essen al needs, including healthy food and health care, which may lead to increased stress. Decent housing in safe neighborhoods helps to reduce stressors and provides mental health benefi ts. Homelessness is a poten al consequence for those unable to obtain housing and closely linked to poor health outcomes. The rates of chronic and acute health problems are high among persons who are homeless.
Opportunity: An amendment to the Aff ordable Requirements Ordinance passed in March 2015 is designed to make 10 to 20 percent of the units in market rate developments more aff ordable.11 Opportuni es exist for further amendments to this ordinance and for new policies and incen ves to increase aff ordable housing in Chicago. Ini a ves to rehab vacant housing to create aff ordable housing and to create long-term housing for vulnerable groups have poten al to provide more op ons for housing stability for Chicago residents. Advocacy for federal funding to support aff ordable housing is needed.
The cost of living increases (housing, food, health care and transporta on) but wages remain the same. -Community Conversa on Par cipant

HEALTHY CHICAGO 2.0
Community Health Assessment:59
Safety and Violence: Violence is a concern for many Chicagoans. Gun violence makes everyday life in some communi es stressful and even life threatening. While homicides in Chicago decreased in 2014, the number of shoo ngs increased compared to 2013.12 Many Chicagoans face other types of violence, including in mate partner violence or bullying. Police brutality is both a local and na onal concern and is currently widely discussed in the media.
Threat: In addi on to the risk of injury and death, community violence is linked to chronic disease and mental health problems. Residents who feel unsafe in their own homes experience harmful stress and may stay inside, limi ng their ability to exercise.
Opportunity: Schools can play an important role in providing a safe, nurturing environment for children and youth. Schools with more advocates, including school social workers, can deliver support to children experiencing stress, fear and grief and can provide social skill development, confl ict resolu on and bullying preven on interven ons. They can connect families with needed services. Furthering restora ve jus ce prac ces in schools is another way to reduce confl ict by focusing on repairing harm and poten ally reducing school suspensions and juvenile jus ce involvement.
Increased communica on between communi es and police could increase trust between residents and police. Collabora ons between police and communi es have had posi ve outcomes in some areas of the country and could be used as a model. Police training may assist in crea ng greater understanding of community needs that ul mately improve rela onships between police and communi es.
Educa on: As in many American ci es, quality and equal educa on is on the minds of Chicagoans. Chicago Public School closures in 2013 were controversial and directly aff ected about 12,000 students.13 Limited school resources, student tes ng, poor student outcomes and the use of charter schools were frequently discussed issues in these conversa ons. Overall, poor school quality is a concern among families.
Threat: The ramifi ca ons of poor school quality include a lack of job and college readiness, a risk to a large propor on of students that threatens both individual and communi-ty well-being. A 2011 study of academic achievement and gradua on rates found that the vast majority of CPS students were not prepared for college. Racial gaps in achievement had increased over the past 20 years.14
Opportunity: Improving school quality through model school improvements around the country and evidence-based programming has the poten al to increase student achievement. Community-based learning and voca onal opportuni es could help to augment school-based learning and improve student outcomes. Further, advocacy eff orts aimed at public educa on funding reform are a poten al long-term solu on to educa onal inequality. School closures le dozens of vacant school buildings and opportuni es exist to convert vacant school buildings into community assets.
Policy and Poli cs: At the me of the assessment, the Mayoral elec on and changes in State leadership created uncertainty about how policy and poli cs would impact Chicago’s public health system. A shrinking public health budget, the introduc on of new public health policies and distrust in government aff ect the public health landscape.
Threat: With economic troubles in City and State government, budget cuts are a poten al threat to public health. Cuts in government funding threaten many diff erent sectors and services. This could infl uence health directly through decreased funding for public health, health care and mental health services. Budget cuts could also aff ect health indirectly through decreased funding for the social determinants of health, including cuts to educa on, human services, housing, transporta on and other sectors. Decreased or inequitable service funding has the poten al to increase health dispari es by widening gaps between those with limited means and those who have more resources.
Opportunity: The promo on of par cipa on in the democra c process is a poten al strategy to address policymaking. Community health issue forums are well situated to provide educa on to community members about health, the social determinants of health and the importance of being involved in the poli cal process. Community organiza ons have an opportunity to promote advocacy and policy work to community members. A Health in All Policies (HiAP) approach to government decision-mak-
There is an opportunity to develop vacant proper es for housing, specifi cally for low- income, formerly incarcerated individuals. -Community Conversa on Par cipant
Our children don’t have access to equal educa on. -Community Conversa on Par cipant
Shrinking budgets threaten public health. -Community Conversa on Par cipant
The con nued violence that plagues the city has become business as usual. There’s more reac on to Ebola than our kids dying. -Community Conversa on Par cipant

HEALTHY CHICAGO 2.0
Informing Eff orts to Achieve Health Equity 60
ing has taken hold in many ci es throughout the country and has the poten al to improve health in Chicago in spite of funding challenges.
Food and Food Systems: A lack of healthy food access remains an issue for some Chicagoans, par cularly in lower income communi es, and was a focus of stakeholders. Neighbor-hoods without adequate access to grocery stores o en have numerous fast food chains and corner stores where residents purchase food with li le nutri onal value. Federal food policies and food marke ng contribute to unhealthy food environments. In contrast, an increase in community gardens and urban agriculture in Chicago are posi ve trends.
Threat: Obesity and chronic disease are associated with food deserts and a lack of access to healthy foods. School performance may be an issue for children with limited access to healthy foods.
Opportunity: Opportuni es exist to extend the SNAP Double Up Bucks program at Chicago farmers markets, in which recipients double their purchasing power at farmers markets. City policies that incen vize small, locally owned grocery stores and the establishment of community gardens in food deserts could increase access to healthy foods.
Discrimina on and S gma: Stakeholders discussed how discrimina on and s gma shapes their lives. While overt types of prejudice and discrimina on have become less frequent, implicit or covert forms of bias are common. Many Chicagoans experience racism; discrimina on because of gender, mental illness, disability, age, sexual orienta on; and s gma on a regular basis. These social determinants of health are associated with poor outcomes for health and well-being.
Threat: Poorer health outcomes threaten those who experience racism, discrimina on and s gma and contribute to health inequity. S gma and discrimina on have been shown to nega vely impact health in several ways. First, perceived discrimina on produces stress, which is harmful to health. An cipa on of discrimina on can lead to long-term ac va on of stress response. Discrimina on can aff ect resources in such areas as educa on, employment and housing. Discrimina on in the health care se ng can result in diff eren al treatment leading to poor health outcomes. Internalized s gma, or self-s gma, is associated with low self-esteem, lack of social support and depressive symptoms.15
Opportunity: There is an opportunity to reduce s gma through public educa on campaigns. As more organiza ons recognize the importance of equity, they are making this a core component of their organiza ons’ values. This creates an opportunity for a collec ve impact in addressing these issues for Chicagoans.16
Climate and Environment: Stakeholders brought up concerns about environmental hazards and climate change on the public’s health. Air quality is a signifi cant issue. The American Lung Associa on’s State of the Air report gave Metropolitan Chicago a grade of “F” in air cleanliness in its 2015 report. In 2014, the report ranked Chicago as the 14th most polluted city in the U.S. for short-term par cle pollu on and 20th for most ozone-polluted and year-round par cle pollu on.17
Radon, a naturally occurring, odorless, colorless gas can be present at elevated levels in homes and too frequently goes undetected. Lead poisoning occurs dispropor onately in the poorest areas of the city and funding for preven on, tes ng and mi ga on has sharply declined in the past fi ve years.18
Threat: All of these environmental factors are direct threats to health. A 2013 report assessing climate change in the United States predicts that in coming decades, the Midwest will experience more frequent and severe heat waves and intense rainstorms and fl oods, while worsening air and water quality will threaten public health.19 Poor air quality is a par cular risk to children and teens, people age 65 and older, persons with asthma, chronic bronchi s or emphysema, people with cardiovascular disease or diabetes and people with low incomes.17 Over me exposure to elevated levels of radon gas can cause lung cancer. Elevated levels of lead in children can harm mental and physical development.
Opportunity: Chicago’s Climate Ac on Plan has fi ve priority areas: energy effi cient buildings, clean and renewable energy, improved transporta on op ons, reduced waste and industrial pollu on and adapta on. The plan provides numerous opportuni es for residents and businesses to help to reduce greenhouse gas emissions and will also improve air quality.20 Mul -sector strategies to create healthy housing (i.e., healthy homes programming or policies that incen vize building owners to address unhealthy homes) can protect the health of Chicago’s residents.
Data and Technology: Data and technology are a substan al force in public health today, infl uencing all areas of the fi eld. Trends in open data make health-related informa on more widely available to the general public. Health apps now track personal fi tness and well-being, as clinical tools and for health research. The use of big data—large, complex and diverse data sets—to address public health needs is a new trend that is rapidly evolving. Social media has become a widely used
Family meal adver sing doesn’t focus on nutri on; it focuses on value. -Community Conversa on Par cipant
We need to educate people about mental illness in order to reduce s gma. -Community Conversa on Par cipant
The environment is not well-protected or regulated. We must think about the impact on our health. -Community Conversa on Par cipant

HEALTHY CHICAGO 2.0
Community Health Assessment:61
tool for connec ng to the public. While li le research has analyzed its effi cacy in health messaging, social media has considerable reach and the poten al to engage large audienc-es.
Threat: Ethical challenges in technology must be addressed. The right to privacy, transparency and trust and the need to provide for the common good are central themes in the age of big data. Diff eren al access to technology brings the threat of increasing health inequali es, with some communi es le behind.
Opportunity: There is an opportunity to foster networks and systems to increase the use of reliable and secure pla orms and mobile apps and to implement a universal electronic health record system. Open data provides a way to empower residents with data to improve their health and the health of the community. Big data provides public health with numerous opportuni es for research and innova on. The use of real- me data in public health has the poten al to improve public health despite limited resources. Research on the reach, effi cacy and cost eff ec veness of social media campaigns, including research on targe ng vulnerable popula ons and needed levels of engagement, has the poten al to improve public health outcomes.
Older Adults: While na onal trends show an increase in the popula on of older adults, the popula on of Chicago seniors has been stable. For Chicago to maintain our popula on of older adults, however, Chicago must ensure access to needed services and supports. These include health care services, accessible housing, age-appropriate and intergenera onal recrea onal opportuni es, transporta on and other supports.
Threat: Without services and supports that enhance quality of life, the health and quality of life of Chicago’s seniors may be at serious risk. This is especially concerning for seniors living in poverty, alone and in marginalized communi es with li le resources. Other seniors may relocate to more age-friendly areas, limi ng diversity in our communi es.
Opportunity: Chicago is part of the World Health Organiza on’s (WHO) Global Network of Age-Friendly Ci es, a network of ci es striving to be er meet the needs of residents of all ages by crea ng inclusive and accessible urban environments. Findings from the Age-Friendly Chicago community-wide assessment provide recommenda ons for improvement in numerous areas, including safe, accessible streets and condi ons for walking, cycling profi ciency, aff ordable housing and access to informa on about health resources and community assets to support aging in place. There is an opportunity to use the Village model to provide services and supports to seniors aging in place.21
Cultural and Linguis c Competence: While the root causes of health dispari es are mul -faceted and complex, one of the evidence-based approaches to addressing them is culturally eff ec ve care. Stakeholders voiced that cultural competence and the ability to provide eff ec ve services to all popula ons is important not only for health care and public health workers, but for all engaged in social and human services, legal and criminal jus ces systems and the educa onal sys-tem. Culturally and linguis cally eff ec ve health care requires an understanding of how sociocultural diff erences may aff ect many elements of pa ent wellness and illness and are important in guiding clinical interac ons and decisions. Ability to navigate the health care system, health literacy, symptom presenta on and values and preferences will be diff erent for diff erent pa ents. Providers must be a uned to diverse pa ent needs and their own biases in order to communicate eff ec vely with pa ents, provide pa ent-centered care and make appropriate clinical decisions. In a diverse city like Chicago, culturally eff ec ve care and services are essen al.
Threat: When health care is not culturally and linguis cally eff ec ve, unsa sfactory care and poor health outcomes may result. Similarly, consumers of other types of services, when not culturally appropriate, may not receive the highest quality services, sa sfying services or the best outcomes.
Opportunity: Community health workers and pa ent navigators can play a central role in assuring a culturally and linguis cally eff ec ve health care system. All service providers should con nually develop skills that follow the principles of pa ent-centered care. Quality improvement interven ons that are designed to improve services for everyone but with a en on to diverse pa ent groups may be benefi cial to organiza ons.
There’s a lack of a unifi ed or consistent medical documenta on system to share informa on across healthcare providers, facili es and payers. -Community Conversa on Par cipant
If informa on is not available in non-English languages, people will not get health care. -Community Conversa on Par cipant

HEALTHY CHICAGO 2.0
Informing Eff orts to Achieve Health Equity 62
REFERENCES:
1. Aff ordable Care Act. Illinois Department of Healthcare and Family Services. h ps://www2.illinois.gov/hfs/PublicIn-volvement/Aff ordableCareAct/Pages/default.aspx. Pub-lished 2015. Accessed June 1, 2015.
2. Medicaid Reform Legisla on. Illinois Department of Health-care and Family Services. h p://www.hfs.illinois.gov/as-sets/012611_hcrfactsheet.pdf. Accessed June 1, 2015.
3. Accountable Care En es (ACE) and Care Coordina on En es (CCE). Illinois Department of Healthcare and Family Services. h ps://www2.illinois.gov/hfs/PublicInvolvement/ cc/ACE/Pages/default.aspx. Published 2015. Accessed June 1, 2015.
4. Picke S, Branderhorst C & Powell K. Making the case for funding and suppor ng comprehensive, evidence-based mental health services in Illinois: May 2015 white paper. NAMI Chicago. h p://www.namigc.org/wp-content/uploads/2012/08/NAMI-White-Paper-NAMI-Chica-go-May-2015.pdf. Published May 2015. Accessed June 1, 2015.
5. Terpstra A, Clary J, & Rynell A. Poor by comparison: Re-port on Illinois poverty. Social IMPACT Research Center at Heartland Alliance. h p://www.ilpovertyreport.org/sites/default/fi les/uploads/PR15_Report_FINAL.pdf. Published January 2015. Accessed June 1, 2015.
6. Berube A & Holmes N. Some ci es are s ll more unequal than others—an update. The Brookings Ins tu on. h p://www.brookings.edu/research/reports2/2015/03/city-in-equality-berube-holmes. Published March 17, 2015. Accessed June 1, 2015.
7. Mihalopoulos D. Chicago’s middle class vanishing. Chicago Sun-Times. h p://chicago.sun mes.com/chicago-poli- cs/7/71/163456/chicagos-middle-class-vanishing. Pub-
lished July 2, 2014. Accessed June 1, 2015.
8. Chicago minimum wage ordinance. City of Chicago. h p://www.cityofchicago.org/content/dam/city/depts/mayor/supp_info/Minimum%20Wage/O2014-9680.pdf. Published December 2, 2014. Accessed June 1, 2015.
9. Capperis S, Ellen I & Karfunkel B. Ren ng in America’s larg-est ci es. NYU Furman Center and Capital One. h p://fur-mancenter.org/fi les/CapOneNYUFurmanCenter__Na onal-RentalLandscape_MAY2015.pdf. Accessed June 1, 2015.
10. The facts behind the faces: A fact sheet from the Chicago Coali on for the Homeless. The Chicago Coali on for the Homeless. h p://www.chicagohomeless.org/wp-content/uploads/2015/02/2015-Fact-Sheet.pdf. Accessed June 1, 2015.
11. ARO enhancements: Summary. City of Chicago. h p://www.cityofchicago.org/content/dam/city/depts/dcd/gen-eral/housing/ARO_Enhancement_Summary.pdf. Published March 18, 2015. Accessed June 1, 2015.
12. Gorner J. Chicago homicides con nue drop, but grim trend in shoo ngs. Chicago Tribune. h p://www.chi-cagotribune.com/news/ct-chicago-homicides-shoot-ings-2014-met-20141230-story.html#page=1. Published December 31, 2014. Accessed June 1, 2015.
13. Krone E, McDaniel B, Puller J. School closings in Chica-go: Understanding families’ choices and restraints. The University of Chicago Consor um on Chicago School Research. h ps://ccsr.uchicago.edu/sites/default/fi les/publica ons/School%20Closings%20Report.pdf. Published January 2015. Accessed June 1, 2015.
14. Luppescu S, Allensworth E, Moore P, de la Torre M & Murphy J. Trends in Chicago’s Schools Across Three Eras of Reform. The University of Chicago Consor um on Chicago School Research. h p://ccsr.uchicago.edu/sites/default/fi les/publica ons/Trends_CPS_Full_Report.pdf. Published September 2011. Accessed June 1, 2015.
15. Studber J & Link B. S gma, prejudice, discrimina on and health. Soc Sci Med. 2008;67(3):351-357. doi: 10.1016/j.socscimed.2008.03.023.
16. Kania J & Kramer M. Collec ve impact. Stanford Social Innova on Review. 2011: 36-41. h p://c.ymcdn.com/sites/www.lano.org/resource/dynamic/blogs/20131007_093137_25993.pdf. Accessed June 1, 2015.
17. American Lung Associa on. State of the air report. h p://www.stateo heair.org/2015/states/illinois/cook.html. Published 2015. Accessed June 1, 2015.
18. Lead paint poisons poor Chicago kids as City spends millions less on cleanup. Chicago Tribune. h p://www.chicagotribune.com/news/watchdog/ct-lead-poisoning-chicago-met-20150501-story.html#page=1. Published May 1, 2015. Accessed June 1, 2015.
19. Heat waves, storms, fl ooding: Climate change to profoundly aff ect U.S. Midwest in coming decades. Science Daily. h p://www.sciencedaily.com/releas-es/2013/01/130118104121.htm. Published January 18, 2013. Accessed June 1, 2015.
20. City of Chicago. Chicago climate ac on plan. h p://www.chicagoclimateac on.org/fi lebin/pdf/fi nalreport/CCAPRE-PORTFINALv2.pdf. Accessed June 1, 2015.
21. Johnson R, Eisenstein A, & Boyken L. Age-friendly Chi-cago: Findings from a community-wide baseline as-sessment. Northwestern University Feinberg School of Medicine. h p://www.cityofchicago.org/content/dam/city/depts/fss/supp_info/AgeFriendly/FinalAgeFriendlyRe-port021815.pdf. Accessed June 1, 2015.

HEALTHY CHICAGO 2.0
Community Health Assessment:63
PHASE 3D: LOCAL PUBLIC HEALTH SYSTEM ASSESSMENT
Purpose: The Local Public Health System Assessment’s purpose is to analyze the capaci es of the local public health system (LPHS) to conduct the Ten Essen al Public Health Services (EPHS). Through the LPHSA, CDPH obtained infor-ma on on the system’s components, ac vi es, competencies and capaci es. This assessment also obtained data on how Chicago’s local public health system scored on health equity measures and gathered data on the quality and compre-hensiveness of the system’s performance of these essen al services. These fi ndings on the func oning of the local public health system, along with the fi ndings from the other three assessments, informed the development of strategic issues and ul mately the eff orts of the Healthy Chicago 2.0 Health Improvement Plan.
Process: To conduct the LPHSA, almost 90 people (Partnership members, Chicago Department of Public Health staff and other representa ves of Chicago’s public health system) par cipated in a day-long mee ng on February 24, 2015. This process used the Na onal Public Health Performance Standards Program (NPHPSP) Local Public Health System Performance Assessment Instrument (Instrument), which was developed by a collabora on including the Centers for Disease Control and Preven on (CDC) and the Na onal Associa on of County and City Health Offi cials (NACCHO) and is a standard for na onal Public Health Accredita on. The Instrument divides each essen al service into three to fi ve model standards, each of which contain several performance measures to be scored. Scoring was done by consensus and included the following categories: no ac vity (0%), minimal ac vity (1-25%), moderate ac vity (26-50%), signifi cant ac vity (51-75%) and op mal ac vity (76-100%). The groups also scored the performance of the system on health equity through one health equity ques on per essen al service, as developed in the MAPP Health Equity Supplement (Appendix 3).
Par cipants a ended one of fi ve groups, based on their exper se. Each group discussed two of the Ten Essen al Public Health Services:
• Group 1: Essen al Service # 1 and 2 • Group 2: Essen al Service # 3 and 4 • Group 3: Essen al Service # 5 and 6 • Group 4: Essen al Service # 7 and 9 • Group 5: Essen al Service # 8 and 10
In addi on to the scores for each measure, the groups iden fi ed strengths, weaknesses and short-term and long-term opportuni es for each of the essen al services. The compiled fi ndings are at the end of this sec on.
CDPH had assistance to conduct this assessment from the Illinois Public Health Ins tute (IPHI), who trained the group facilitators and note takers prior to the assessment. At the assessment, IPHI presented the process to the par cipants, supported the group facilitators and note takers and led the report back session at the end of the day. CDPH also had help from University of Illinois School of Public Health students, who took notes in each of the groups.
Findings:
Essen al Service 1: Monitor Health Status to Iden fy Community Health Problems
In Essen al Service 1, par cipants explored the extent to which the LPHS monitors health status to iden fy community health problems through community health assessment, technology to manage and communicate health data and the maintenance of popula on health registries. Overall, they scored this service as MODERATE. Par cipants iden fi ed several resources and an abundance of available data but emphasized a need to collaborate more and to develop systems to improve data dissemina on to LPHS partners and community members. Data are collected for community health assessments on the status of Chicago residents. The health department conducts these assessments every fi ve years for accredita on and local health department State cer fi ca on. With the passage of the Aff ordable Care Act, non-profi t hospitals are now required to complete an assessment every three years. Par cipants encouraged health departments and hospitals to work more collabora vely and make data more accessible for other stakeholders.
Enforce Laws
DevelopPolicies
AssureCompetentWorkforce
Linkto/Provide
Care
Inform,Educate,Empower
Diagnosee
Evaluate MonitorHealth
ps
MobilizeCommunityPartnerships
Research
Sy
stem Management
ASSESSMENTPO
LICY DEVELOPMENT
ASSU
RAN
CE
EPHS 1: Monitor health status0 20 40 60 80 100
1.1 Community Profi le
1.2 Current Technology
1.3 Registries 37.5
31.3
33.3
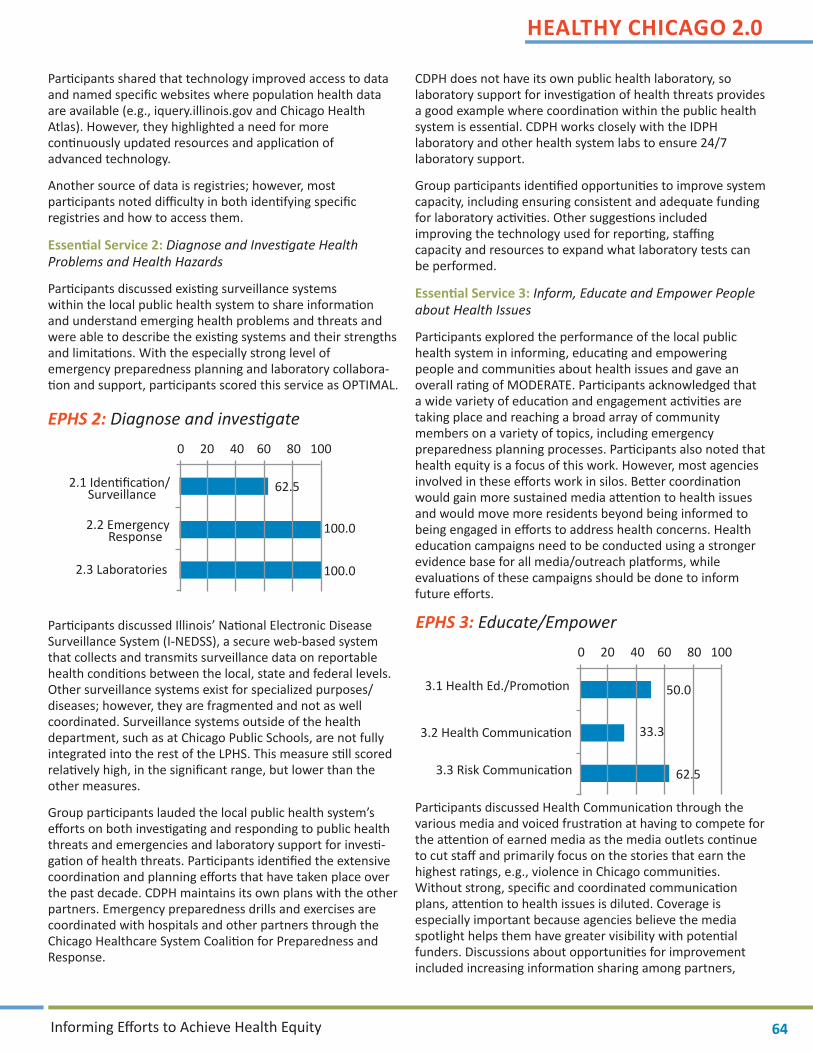
HEALTHY CHICAGO 2.0
Informing Eff orts to Achieve Health Equity 64
Par cipants shared that technology improved access to data and named specifi c websites where popula on health data are available (e.g., iquery.illinois.gov and Chicago Health Atlas). However, they highlighted a need for more con nuously updated resources and applica on of advanced technology.
Another source of data is registries; however, most par cipants noted diffi culty in both iden fying specifi c registries and how to access them.
Essen al Service 2: Diagnose and Inves gate Health Problems and Health Hazards
Par cipants discussed exis ng surveillance systems within the local public health system to share informa on and understand emerging health problems and threats and were able to describe the exis ng systems and their strengths and limita ons. With the especially strong level of emergency preparedness planning and laboratory collabora- on and support, par cipants scored this service as OPTIMAL.
Par cipants discussed Illinois’ Na onal Electronic Disease Surveillance System (I-NEDSS), a secure web-based system that collects and transmits surveillance data on reportable health condi ons between the local, state and federal levels. Other surveillance systems exist for specialized purposes/diseases; however, they are fragmented and not as well coordinated. Surveillance systems outside of the health department, such as at Chicago Public Schools, are not fully integrated into the rest of the LPHS. This measure s ll scored rela vely high, in the signifi cant range, but lower than the other measures.
Group par cipants lauded the local public health system’s eff orts on both inves ga ng and responding to public health threats and emergencies and laboratory support for inves -ga on of health threats. Par cipants iden fi ed the extensive coordina on and planning eff orts that have taken place over the past decade. CDPH maintains its own plans with the other partners. Emergency preparedness drills and exercises are coordinated with hospitals and other partners through the Chicago Healthcare System Coali on for Preparedness and Response.
CDPH does not have its own public health laboratory, so laboratory support for inves ga on of health threats provides a good example where coordina on within the public health system is essen al. CDPH works closely with the IDPH laboratory and other health system labs to ensure 24/7 laboratory support.
Group par cipants iden fi ed opportuni es to improve system capacity, including ensuring consistent and adequate funding for laboratory ac vi es. Other sugges ons included improving the technology used for repor ng, staffi ng capacity and resources to expand what laboratory tests can be performed.
Essen al Service 3: Inform, Educate and Empower People about Health Issues
Par cipants explored the performance of the local public health system in informing, educa ng and empowering people and communi es about health issues and gave an overall ra ng of MODERATE. Par cipants acknowledged that a wide variety of educa on and engagement ac vi es are taking place and reaching a broad array of community members on a variety of topics, including emergency preparedness planning processes. Par cipants also noted that health equity is a focus of this work. However, most agencies involved in these eff orts work in silos. Be er coordina on would gain more sustained media a en on to health issues and would move more residents beyond being informed to being engaged in eff orts to address health concerns. Health educa on campaigns need to be conducted using a stronger evidence base for all media/outreach pla orms, while evalua ons of these campaigns should be done to inform future eff orts.
Par cipants discussed Health Communica on through the various media and voiced frustra on at having to compete for the a en on of earned media as the media outlets con nue to cut staff and primarily focus on the stories that earn the highest ra ngs, e.g., violence in Chicago communi es. Without strong, specifi c and coordinated communica on plans, a en on to health issues is diluted. Coverage is especially important because agencies believe the media spotlight helps them have greater visibility with poten al funders. Discussions about opportuni es for improvement included increasing informa on sharing among partners,
EPHS 2: Diagnose and inves gate
EPHS 3: Educate/Empower
0 20 40 60 80 100
2.1 Iden fi ca on/ Surveillance
2.2 Emergency Response
2.3 Laboratories
100.0
100.0
62.5
0 20 40 60 80 100
3.1 Health Ed./Promo on
3.2 Health Communica on
3.3 Risk Communica on
33.3
62.5
50.0

HEALTHY CHICAGO 2.0
Community Health Assessment:65
holding formal training and working regularly with the media for sustained a en on on health issues to counteract poor health messages in popular culture.
Many par cipants who were from agencies connected to and aware of the public health department’s and local hospitals’ emergency communica on plans saw risk communica on as strong. However, par cipants acknowledged that the system does not reach the community equally with risk messages, leaving some sectors at a disadvantage.
Essen al Service 4: Mobilize Community Partnerships to Iden fy and Solve Health Problems
Par cipants explored the LPHS’s performance in engaging the community in local health issues through partnerships and scored it at a MODERATE level. Discussion highlighted the existence of many commi ed community coali ons and their impact on community health. Many coali ons now work on upstream issues of health to make longer-term impacts and much of this work is lauded. At the same me, par cipants want to make sure coali ons do not abandon their focus on preven on and managing specifi c health condi ons. Despite innova ve eff orts occurring with Chicago’s coali ons, par cipants iden fi ed several areas that should be improved, including strengthening coordina on among coali ons (both within same, con guous, or similar communi es) and mobilizing and securing consistent resources.
Many coali ons aim to involve mul -sector partners and community members to improve community health. Group par cipants shared successes with engaging some system partners; however, community residents have not been very involved and have only minimal awareness of these eff orts, especially with larger, citywide coali ons. Par cipants thought this might improve because of the ACA requirement for non-profi t hospitals to conduct community health needs assessments. These hospitals will most likely engage broader audiences in this work, which will generate more awareness and create cross-sec onal ini a ves to address the social determinants of health.
The par cipants explored how eff ec vely and broadly cons tuents are encouraged to par cipate in improving community health. In sum, the par cipants found that addi onal work can be done in order to recruit more dynamic, diverse groups and community members at large to ac vely par cipate in the LPHS.
To evaluate community partnerships in Chicago, par cipants reviewed exis ng eff orts that maximize public health improvement ac vi es. They determined that there are many, but that they o en operate on more localized or issue-specifi c levels (i.e., there is not a prominent broad-based commi ee) and are not very coordinated, while those that do exist are not very accessible to community members at large.
Essen al Service 5: Develop Policies and Plans that Support Individual and Community Health Eff orts
Par cipants in the Essen al Service 5 group discussed public health system policy development and planning eff orts that support individual and community health eff orts and scored this service as SIGNIFICANT. They commented that collabora- ve policy development in the past several years has grown,
especially around issues of tobacco cessa on/preven on and obesity preven on work. As a result, signifi cant gains have been made with regula on of e-cigare es and restric ons on the sale of fl avored (including menthol) cigare es. However, par cipants did men on that o en it is the “squeaky wheel” that gets a en on, while other less visible public health policy issues haven’t received the policy focus they deserve. Par cipants also acknowledged that progress and collabora- on of policy development is o en related to funding.
When discussing community health improvement planning, par cipants spoke highly of the Healthy Chicago 2.0 process, especially for its inclusivity, community engagement and focus on health equity. Although previous planning eff orts did involve many diverse partners, communica on did not reach the community and other stakeholders, so many of the par cipants were not knowledgeable about those eff orts. To address these issues, par cipants proposed a concerted eff ort should be made to formalize communica on of community health improvement planning eff orts.
Emergency preparedness planning work scored the highest of all the measures in Essen al Service 5, at OPTIMAL, with its level of comprehensive planning among strong system partnerships in place, especially the local hospitals. This high level of func oning has been recognized by the Centers for Disease Control and Preven on, with Chicago’s work o en being used as an example for na onal audiences.
EPHS 4: Mobilize partnerships
EPHS 5: Develop policies/plans
0 20 40 60 80 100
4.1 Cons tuency Development
4.2 Community Partnerships
33.3
45.0
0 20 40 60 80 100
5.1 Gov. Presence
5.2 Policy Development
5.3 CHIP/Strat. Planning
5.3 CHIP/Strat. Planning
50.0
83.3
41.7
41.7

HEALTHY CHICAGO 2.0
Informing Eff orts to Achieve Health Equity 66
Par cipants noted that the performance in this essen al service increased since CDPH received Na onal Public Health Accredita on in 2013 and was awarded the 2014 NACCHO Local Health Department of the Year Award.
Essen al Service 6: Enforce Laws and Regula ons that Protect Health and Ensure Safety
Governmental agencies are primarily responsible for Essen al Service 6, as it addresses the enforcement of public health-related laws and regula ons. In Chicago, CDPH is the main agency responsible for this work, along with other City Departments, including the Chicago Police Department, the Department of Buildings and the Department of Streets and Sanita on. Sister agencies are also involved with se ng and enforcing laws, notably: Chicago Public Schools, Chicago Park District and the Chicago Housing Authority. Other partners in the public health system are intricately involved in this work by collabora ng with these agencies in the development of laws and also helping to educate the community. Group par cipants scored this essen al service as SIGNIFICANT.
All aspects of this essen al service, including the review, improvement and enforcement of laws and regula ons, complement and build on one another. However, the measure focused on review of laws scored lower. CDPH staff acknowledged that with limited resources, eff orts are allo-cated to improving and enforcing current laws and that staff mostly focus on reviewing a law only when a problem arises.
Local and na onal organiza ons have formally recognized the work Chicago is doing to improve and strengthen its tobacco control law. CDPH has consulted with many local health departments to share our approach as a na onal standard, which includes collabora on among many system partners and crea ng venues for community feedback. Many public health system partners work to educate communi es about the impact of proposed laws.
Enforcement of public health laws occurs over many departments. Inspectors receive extensive training to enforce laws in their specialty area. In the course of inves ga ng possible viola ons, inspectors o en come upon other viola ons outside of their program area and are empowered to refer the program to the appropriate Department for follow up.
For example, a er their inspec on in response to a complaint, CDPH environmental inspectors refer concerns of excessive-ly loud noises to the Chicago Police Department (based on the Chicago Environmental Noise Control Ordinance of the Municipal Code). Enforcement of public health laws also is the responsibility of the community and group par cipants discussed increasing resident involvement by encouraging 311 repor ng of infrac ons or other illegal ac vity harmful to the public’s health.
Par cipants, both from City Departments and other system partners, acknowledged that performance in this essen al service is impacted because of insuffi cient funding for trained staff . This limits not only enforcement of current laws, but regular reviews of laws and fully comprehensive work to improve laws.
Essen al Service 7: Link People to Needed Personal Health Services and Assure the Provision of Health Care when Otherwise Unavailable
Par cipants in Essen al Service 7 discussed the LPHS performance in connec ng community members to the health services and gave this essen al service an overall score of MODERATE. The par cipants were in general agreement that Chicago is moderately aware of popula ons who are falling though the gaps and need further assistance. While par cipants reported that basic services to primary care are fairly good, they noted that some popula ons s ll lack access to primary care services. Although the Aff ordable Care Act (ACA) has been a posi ve step in linking people to care, many people have not enrolled and fi nd the system diffi cult to navigate.
Group par cipants stated that the LPHS does well in iden fying marginalized popula ons (e.g., homeless, disabled and people with mental health problems). Par cipants reported that the community health assessment helps to inform service providers about the needs of community members, but they also highlighted the need for a system that will allow providers to share informa on through a systema c data exchange portal to help providers refer their clients to available community services.
Par cipants scored the system’s performance in assuring link-ages to care as moderate and iden fi ed several areas where linkages to care fell short, including specialty care, dental care and mental health services. Par cipants described that strong
EPHS 6: Enforce laws
EPHS 7: Link to health services
0 20 40 60 80 100
6.1 Review Laws
6.2 Improve Laws
6.3 Enforce Laws 55.5
66.7
43.8
0 20 40 60 80 100
7.1 Pers Hlth Svc Needs
7.2 Assure Linkage 31.3
43.8

HEALTHY CHICAGO 2.0
Community Health Assessment:67
eff orts are being made on the part of many service providers to link marginalized individuals to available resources; however, large gaps in services s ll remain for these popula ons. Most agencies neglect to follow up a er referral, with no assurance that linkages resulted in service provision. While some agencies work well together to provide health services, many agencies are s ll working in silos. Coordina on and collabora on to best meet the needs of community is an area for addi onal improvement. One specifi c area of improvement is the coordina on and dissemina on of informa on about services among providers so they can track availability of services across the city to appropriately refer and partner with other agencies. Improving the provision of culturally competent services to subpopula ons within the community was another area of improvement.
Essen al Service 8: Assure a Competent Public Health and Personal Healthcare Workforce
Essen al Service 8 iden fi es ac vi es that are undertaken within individual agencies and performed collabora vely as part of workforce development. Overall, the group scored this service as MODERATE.
Par cipants scored the system’s current ac vity on workforce assessment the lowest of all measures in this essen al service. The group men oned organiza ons that may be doing assessments, but they focus on individual pro-fessional tles/licenses and do not assess the whole system. Work is completed in silos and lacks a universal standard of culturally competent workforce.
Par cipants iden fi ed that several types of organiza ons within the public health system have set standards for their workforce (e.g., Federally Qualifi ed Health Centers), which led to this measure being scored the highest within this essen al service. New hires have detailed job descrip ons, but these descrip ons are not based on specifi c standards and o en are not fully connected to the agency’s mission. The group discussed cer fi ca on for several professional tles and shared that the rigorous process can be a signifi cant obstacle to pursuing further qualifi ca ons. Illinois is in the process of assessing cer fi ca on for Community Health Workers (CHWs); however, not all par es are convinced this is the best move for CHWs.
The group iden fi ed several agencies and organiza ons that provide con nuing educa on, training and professional development opportuni es. Providers are required to obtain con nuing educa on credit units (CEUs) and therefore courses are abundant, but due to the work responsibili es and the number of CEUs needed, mely comple on for CHWs can be a struggle. On the other hand, public health department staff , who do not have this requirement, struggle to fi nd relevant training courses. Nonetheless, par cipants emphasized that all public health system staff need be er comprehensive training in health equity and dispari es.
Par cipants acknowledged the organiza ons that off er leadership development programs that include both academia and prac ce-based focus. However, it is not clear that all staff members are familiar with these opportuni es, or whether their agencies even allow par cipa on. The group felt leadership opportuni es needed to be both more diverse and to engage all sectors and levels of the public health workforce. Just as signifi cant was the opinion that leadership development should also focus on community members and skill building.
Essen al Service 9: Evaluate Eff ec veness, Accessibility and Quality of Personal and Popula on-Based Health Services
Overall performance for Essen al Service 9 was scored as MODERATE. Par cipants discussed how the LPHS evaluates the eff ec veness of personal and popula on-based services. Par cipants reported that individually, agencies do well in evalua ng their services, par cularly for personal health services. However, par cipants stated that the lack of data sharing is a major challenge to improving system quality.
Par cipants discussed evalua on of popula on-based services, including the use of community feedback and gaps in service provision. Due to its less rigorous data and the lack of coordinated eff ort of evalua on of popula on-based services, par cipants scored the performance of popula on-based service lowest of the essen al service measures. However, par cipants noted that HP 2020 established benchmarks, goals and objec ves and assists the local public health system agencies to evaluate public health eff orts. They also acknowledged academic ins tu ons as good partners and resources for service evalua on.
EPHS 8: Assure a competent workforce
EPHS 9: Evaluate services
0 20 40 60 80 100
8.1 Workforce Assessment
8.2 Workforce Standards
8.3 Con nuing Educ.
8.3 Leadership Dev.
58.3
37.5
18.8
35.0
0 20 40 60 80 100
9.1 Eval of Pop Health
9.2 Eval of Pers Health
9.3 Eval of LPHS 43.8
40.0
31.3

HEALTHY CHICAGO 2.0
Informing Eff orts to Achieve Health Equity 68
Par cipants generally agreed that partner agencies engage in individual service evalua on to assess community sa sfac on with health services. Some community partners are success-ful at using evalua on fi ndings to improve popula on-based services. However, this prac ce needs to be expanded throughout the system.
Par cipants discussed the level to which health care providers evaluate personal health care services. Par cipants reported that providers frequently engage in evalua on of the accessi-bility, quality and eff ec veness of health care and also of pa- ent sa sfac on. Par cipants indicated that client data from
these evalua ons is used to inform service, resources and program improvements. Furthermore par cipants acknowl-edge that the electronic health record system (EHR) has been an eff ec ve tool for capturing and dissemina ng informa on in an organized and effi cient manner. However, one specifi c challenge to the EHR is the cost of the system and the lack of uniform u liza on across all providers.
Par cipants discussed the LPHS performance in evalua ng its own eff ec veness as a system, repor ng that overall the LPHS is moving in the right direc on. The Healthy Chicago 2.0 process is key to further evalua on of the system. While there are s ll organiza ons missing, the system is engaging more and more diverse sectors and developing a formal and systema c evalua on of local public health system capacity.
Essen al Service 10: Research for New Insights and Inno-va ve Solu ons to Health Problems
Par cipants discussed how Chicago’s public health system is advancing public health prac ce through research and innova on. The conversa on focused on collabora on among ins tu ons of higher learning and research centers and on internal data analysis and research. Stakeholders rated Chicago an overall score of MODERATE. While the innova on and current research is somewhat limited, par cipants were enthusias c about opportuni es for improvement.
Though some innova on is currently ongoing, organiza ons have no capacity to fully integrate innova ve prac ces into their work. Time, skill development and funding are required to facilitate greater par cipa on and foster more public health innova on.
Many academic linkages exist to conduct research in Chicago, including eff orts around clinical transla onal research that helps move research into prac ce. Several universi es work together through the Chicago Consor um for Community Engagement (C3). C3 fosters community-based par cipatory research and assists with dissemina on of fi ndings into the broader community. Academia is also connected to the local public health system and to organiza ons and universi es through student internships. However, par cipants said that interac on between faculty and the local public health system is infrequent. The crea on of an academic health department is one opportunity to bridge these partners.
While some data are available to organiza ons through the community health assessment and the City data portal, overall, the research capacity of the local public health system is limited. As a result, this measure received the lowest score of all the measures in this essen al service. Most organiza ons don’t have access to libraries, journal databases, or data analysis so ware. Par cipants reported a lack of systemic data sharing and said that legal agreements are a barrier. In addi on, evalua on of research was almost non-existent.
Par cipants shared ideas on how to improve research capacity. Reciprocal learning opportuni es or co-sponsoring events would foster improved linkages between academia and other organiza ons. Conduc ng social network analysis of connec ons between the local public health system and their areas of work could facilitate collabora on. Universi es could provide access to research fi ndings and databases. Stakeholders desired prac cal and ac on-oriented research and said that this should be encouraged. The development of a shared research agenda with a health equity focus would not only encourage such research but could increase health equity, foster collabora on and improve system effi ciency.
EPHS 10: Research/Innova ons0 20 40 60 80 100
10.1 Foster Innova on
10.2 Academic Linkages
10.3 Research Capacity 31.3
41.7
40.0

HEALTHY CHICAGO 2.0
Community Health Assessment:69
Chicago Local Public Health System Func oning to Assure Health Equity
Based on the MAPP Health Equity Supplement guidance, each group scored the public health system on how well it incorporated health equity into its essen al service func ons. The combined score showed Chicago func oning at a MODERATE level. (Figure 85)
Figure 85: Chicago local public health system func oning to assure health equity
One of the health equity measures addressed whether the public health system monitors social and economic condi ons, which par cipants scored as minimal. However, the group scored the available resources to collect data and inves gate social determinant inequi es as moderate. This diff erence suggests opportuni es within the system to do a more comprehensive job of monitoring inequi es. Another measure asked group par cipants to score the system on how well it engages the community and community-based organiza ons in public health policy work. Par cipants cited the recent work on tobacco preven on and cessa on and scored this health equity measure as moderate. Group par cipants scored the system’s performance on iden fying issues with dispropor onate impact on marginalized communi es as moderate but discussed how implementa on was usually performed at a lower level of ac vity.
The remaining health equity ques ons received a minimal ac vity score. This indicates that the system needs to work collabora vely to direct specifi c eff orts to understanding these measures and ins tu onalizing them throughout the whole public health system.
Strengths, Weaknesses and Opportuni es
Par cipants in each group discussed the strengths and weaknesses of Chicago’s public health system, which were compiled into seven categories. Par cipants built off of these quali es to iden fy both short-term and long-term opportuni es to improve eff ec veness and effi ciency of the system.
• Community Partnerships/Collabora on/Engagement
• Data and Technology
• Communica on
• Health Equity
• Workforce and Training
• Evalua on, Evidence-based Interven ons and Research
• Funding and Resources

HEALTHY CHICAGO 2.0
Informing Eff orts to Achieve Health Equity 70
Community Partnerships/Collabora on/Engagement
• Strengths: Progress is being made in engaging diverse organiza ons in more public health collabora ons, which helps to ensure planning eff orts consider a broad range of perspec ves and solu ons. More universi es and community development organiza ons are joining this work. Hospitals and public health departments are forming collabora ves to conduct community health needs assessments and implement priori es. Community residents expressed interest in being more involved in this work.
• Weaknesses: Although the public health system seeks to engage community residents, these a empts have not always been successful. This is especially true in rela on to decision making and planning eff orts. Most partners and organiza ons that par cipate in coali ons are usually the same few people, which reduces the diversity in the approach. Most public health work is done in silos and is not coordinated, even within an agency.
• Opportuni es: All organiza ons involved in collabora ve work need to engage with broad partners as an integral component of their work. This can be done in the short-term by building off current eff orts and solici ng involvement from even more sectors. Organiza ons can also support the work of current diverse partnerships to strengthen their reach and impact on the community. Longer-term opportuni es include incen vizing government agencies to improve their collec ve impact, with more collabora on among City departments and with more City-County-State eff orts. The system also needs to consistently outreach to communi es on public health issues. One way to achieve this goal is to establish and use standards for community involvement across the public health system.
Data and Technology
• Strengths: System partners are developing new and innova ve methods to collect and share data. Health technology is advancing through mobile apps and ideas that reach out to the consumer, which make this an exci ng area for growth. More data are being collected measuring community health status, individual health and social determinants of health. Electronic Health Records (EHR) will have many uses to help providers and the public health system access and understand health status.
• Weaknesses: Although data are being collected, mely dissemina on con nues to be a major obstruc on for the system. Many people do not know how to access the wide range of data and lack of data infrastructure perpetuates this problem. Regarding technology, EHRs are expensive and prohibi ve for smaller prac ces at present. Older providers are less comfortable with technology, limi ng their ability to access these tools to help improve pa ent care.
• Opportuni es: With so much interest in data and data websites, this is an ideal me to work collabora vely with system partners to build a system to address the needs of
a broad spectrum of data consumers. At the same me, organiza ons need to develop and/or update data sharing agreements. Longer-term opportuni es exist to obtain more and be er data by developing a chronic disease surveillance system. Lastly, the Healthy Chicago Telephone Survey could also assist with data needs by expanding its ques onnaire to include ques ons on adverse childhood experiences (ACE) to allow the public health system to monitor these exposures and develop eff ec ve interven ons.
Communica on
• Strengths: Most partners communicate public health messages to their clients and cons tuents. Advocacy groups ac vely communicate with policy and decision makers to propose policy sugges ons to improve public health and to document consequences of pieces of legisla on.
• Weaknesses: No comprehensive service and resource guide exists for Chicago, reducing the eff ec veness of our communica on with consumers in need of services. Communica on about the regulatory and enforcement roles and responsibili es of the diff erent City Departments is also not clear to many people, including public health stakeholders.
• Opportuni es: Opportuni es to improve communica on involve use of technology and a focus on end users. Social media can be used in the short term to educate and inform specifi c popula ons and recruit them to get more involved in public health eff orts. Longer term, CDPH’s Health Alert Network (HAN), an electronic messaging system to inform providers and other users about public health alerts, could be designed to also reach community and stakeholders with public health informa on. Par cipants spoke about the need for a comprehensive resource guide for health and human services in Chicago. In the short term, agencies could work with current resources such as Purple Binder and Now Pow websites that provide informa on on services, including health care, child care, job training and aff ordable housing. A long-term opportunity to build and sustain a resource and referral service is to expand 311 for City services to support referrals to health and human services off ered by non-City agencies. Opportuni es exist to collaborate with United Way and the Illinois Alliance of Informa on and Referral Systems on this work.
Health Equity
• Strengths: The public health system is now broadly accep ng the importance of health equity as an essen al value of public health. Par cipants in the assessment process applauded the visible role health equity is taking in the Healthy Chicago 2.0 work. Policies are now priori zing health equity, with a focus on legal strategies that address issues of marginalized popula ons.
• Weaknesses: Many people and organiza ons do not fully understand the implica ons of a focus on health equity may

HEALTHY CHICAGO 2.0
Community Health Assessment:71
have on their opera ons. Eff orts need to educate the public health system to show how everyone will benefi t when health equity is achieved.
• Opportuni es: Short term, partners are engaging with Healthy Chicago 2.0 planning eff orts and keeping the focus on health equity. Long term, partners recognize opportuni es to call upon funders to support health equity by funding grants that address root causes and social determinants of health, rather than categories of health programming.
Workforce and Training
• Strengths: Group par cipants across the essen al service areas highlighted the need for ongoing workforce training and men oned several organiza ons that provide some training. Public health leadership training is available for the public health workforce through the MidAmerica Center for Public Health Prac ce at University of Illinois at Chicago (UIC). The Center also houses the Ins tute for Faith and Public Health Leadership, which brings faith and public health leaders together to learn how to collaborate and integrate community health and engagement approaches addressing health equity. UIC also trains public health staff through its Great Lakes Centers for Occupa onal and Environmental Safety and Health.
• Weaknesses: Public health system workforce shortages limit the eff ec veness of the system. Most notable are healthcare provider shortages, including primary care, oral health and mental health. Funding for health department workforce is decreasing, limi ng the programs and services off ered. In addi on to the workforce capacity, par cipants men oned lack of consistent trainings as a problem. The workforce needs training to improve pa ent/client interac on (e.g., cultural competence) and effi cient use of computers and technology.
• Opportuni es: Par cipants saw an opportunity to work with the training centers and to expand their training series. Short term, training centers may be able to add more classes/ses-sions to their schedules. Long term, the system needs to work together to assess training needs across the public health workforce and iden fy funding to develop new classes to meet these needs. Par cipants also suggested educa ng providers and students in the health profession about challenges their pa ent popula ons have in accessing care so they can provide more eff ec ve care.
Evalua on, Evidence-based Interven ons and Research
• Strengths: Public health departments and other system partners are adop ng performance management and quality improvement standards to improve the eff ec veness of their work. C3 encourages research among local universi es and the community through community-based par cipatory research (CBPR).
• Weaknesses: Public health program eff ec veness is deterred when it is not based on data and with limited to no robust evalua on. Other public health eff orts, such as coali ons, are not being measured or assessed.
• Opportuni es: Through the City of Chicago Data Portal and the Chicago Health Atlas, more data are now accessible for public health stakeholders. Short-term opportuni es exist to publicize these data sites and encourage their use in program-ming and evalua on. As these data sites con nue to expand with more social determinants of health and asset data, the system will be able to engage broader sectors of the public health system. More long-term opportuni es to improve the eff ec veness of interven ons and evalua on will emerge as more system partners fully implement performance and quality improvement eff orts. Chicago’s research community can develop an agenda to priori ze public health issues that would benefi t from research eff orts. A more comprehensive approach needs to be developed to disseminate research fi ndings across the whole public health system.
Funding and Resources
• Strengths: Although public health workforce capacity is not ideal, many agencies have local and na onal partners or other pro bono resources that help fi ll the gaps. This resourcefulness is a major strength of the system, as is the camaraderie among organiza ons serving similar popula ons. Some of the areas where assistance is available include technical assistance on specifi c public health issues, policy and technical wri ng. New partners to the public health system are the civic technologists and data scien sts who volunteer their skills to develop user-friendly public health technology, including smartphone/tablet apps such as FoodborneCHI that fi nds and replies to tweets on food poisoning with informa on about fi ling a report with CDPH.
• Weaknesses: Funding and resource gaps impact opera onal eff orts of the public health system. Without stable and adequate funding, the workforce is not suffi cient to fully address the ten essen al public health services. Programs may be discon nued or limited in scope. Without resources, innova on, especially with surveillance systems, may be stymied. Limited resources may encourage compe on among system partners, not collabora on.
• Opportuni es: Short term, opportuni es exist to strengthen partnerships among public health partners to share in-kind resources and to develop grant proposals that engage mul ple partners. The system can also reach out to na onal organiza ons with specifi c focus for assistance with special data or innova ve prac ces. Longer term opportuni es include coming together to advocate for a larger budget for public health eff orts and funding to support coali on building.

HEALTHY CHICAGO 2.0
Informing Eff orts to Achieve Health Equity 72
PHASE 4: IDENTIFY STRATEGIC ISSUES AND ACTION AREAS
Purpose: With quan ta ve and qualita ve data collected from the four assessments, the Healthy Chicago 2.0 planning eff ort moved into the next phase of the MAPP process—iden- fying strategic issues and ac on areas. The purpose of this
work is to iden fy overarching strategic issues the public health system needs to address to move toward the Healthy Chicago 2.0 vision and priori ze those issues into ac on ar-eas. The next phase develops goals, objec ves and strategies for these ac on areas.
Process: As in all phases of the plan, it is extremely important to engage broad public health stakeholders when develop-ing strategic issues. To do this, CDPH held many mee ngs to share the assessment fi ndings and obtained individuals’ thoughts about overarching themes. The fi rst session was held on April 13, 2015 at the Partnership for Healthy Chicago mee ng. CDPH staff reviewed the fi ndings from each of the assessments and Partnership members brainstormed strategic issues that emerged from at least two of the assessments and needed to be addressed to accomplish the Healthy Chicago 2.0 vision. CDPH then held Community Conversa ons with community members, public health stakeholders and CDPH staff in the following communi es: at Lower West (Blue 1647), Aus n (Aus n Town Hall) and Englewood (Hamilton Park) on April 14, 15 and 17, respec- vely. Par cipants at these mee ngs proposed addi onal
strategic issues and then voted for their top priori es through the use of fi ve s ckers, which they could divide up in any manner, e.g., fi ve votes for one strategic issue, one vote for fi ve strategic issues, etc.
Sixteen categories of strategic issues emerged from these mee ngs:
• Improve community safety (gun violence, traffi c crashes, falls)
• Improve access to and seamless con nuum of health care and social supports for all
• Move people and communi es to ac on to im-prove community health through advocacy, leader-ship and community involvement
• Further engage and align the broad spectrum of public health system partners to inform funding, programming and collabora on that reduces ineq-ui es
• Drive economic development to ensure good pay-ing jobs for marginalized popula ons and commu-ni es
• Reduce chronic disease dispari es
• Improve the mental health system
• Strengthen data accessibility, collec on eff orts and dissemina on for the public health system
• Employ innova ve communica on strategies that are informed and developed by and for marginalized popula ons to reduce inequi es and improve health
• Improve community health by building on strengths and assets of communi es and building community capacity
• Ensure the decision makers/government, funders and leadership understand and act to reduce inequi es
• Increase access to aff ordable and safe housing
• Advocate for equitable educa onal policies and funding to ensure quality educa on (Pre-K through Post-secondary)
• Develop a collabora ve city-wide public health research agenda
• Improve maternal, infant, child and adolescent health
• Work to prepare, protect the public’s health and prevent spread of infec ous diseases
To priori ze these issues for the plan, CDPH surveyed Partnership members and all 550 CDPH staff to rank the issues based on their importance. Through this process, ten priority ac on areas emerged (listed alphabe cally)*:
1. Access to Health Care and Human Services
2. Behavioral Health
3. Chronic Disease Preven on and Control
4. Community Development
5. Data and Research
6. Educa on
7. Maternal, Infant, Child and Adolescent Health
8. Partnerships and Community Engagement
9. Prepare, Protect and Prevent Disease
10. Violence and Injury Preven on
*The names of the ac on areas in the Healthy Chicago 2.0 Community Health Improvement Plan are slightly diff erent, as a result of the discussions in the ac on teams that developed the goals, objec ves and strategies.

HEALTHY CHICAGO 2.0
Community Health Assessment:73
Findings:
Vision: The ten priority ac on areas forward achievement of the Healthy Chicago 2.0 vision, “a city with strong communi es and collabora ve stakeholders, where all residents enjoy equitable access to resources, opportuni es and environments that maximize their health and well-being.” This includes ac on areas that promote equitable access to care resources (Access to Health Care and Human Services; Behavioral Health; Chronic Disease Preven on and Control and Maternal, Infant, Child and Adolescent Health) and other resources/opportuni es that promote advancement and improved quality of life (Educa on, Community Development).
The vision calls for collabora ve stakeholders, which is the focus of the Partnership and Community Engagement ac on area. The other nine ac on areas also acknowledge that collabora on/engagement is a key component of health equity eff orts.
The vision states that “all residents” will have equitable access and opportuni es to be healthy. To ensure that everyone has access, priority ac on areas focus on high priority popula ons (e.g., Maternal, Infant, Child and Adolescent Health) and marginalized communi es.
The priority area of Data and Research is crucial to the Healthy Chicago 2.0 vision, as maximizing health and ensur-ing access and opportuni es could not be achieved without collec on and analysis of health and social determinant data. Research, especially community-based par cipatory research, helps iden fy more evidence-based and evidence-informed prac ces to move toward health equity. Therefore, data and research are intrinsic to the vision.
MAPP Assessments: All ac on areas were supported by at least three of the four MAPP assessments. Data sources are cited in the assessment chapters. The following sec on outlines the relevance of each of the ten priority areas with suppor ng evidence from the MAPP assessments.
Ac on Area #1: Access to Health Care and Human Services
Community Themes and Strengths Assessment: Par cipants in the community conversa ons lauded the Aff ordable Care Act (ACA) and Medicaid expansion as important system components that focus on increasing access to care and improving the health of the community. People men oned health care resources, such as Federally Qualifi ed Health Centers and School-Based Health Centers, as essen al community ins tu ons that focus on community-based care and increase access to care. Par cipants and survey respondents indicated a need for more safety net services to be er reach popula ons and communi es with limited ac-cess and worse health outcomes. Survey respondents in high hardship communi es indicated diffi culty accessing health services in their community; only 50% agreed with the state-
ment: “Health services I use are easy to get to from my neighborhood” compared to 86% in low hardship communi es. People also were concerned about accessing social service programs and other social supports and programs to help keep them healthy. Discussions also suggested more workforce training to be er serve marginalized popula ons.
Forces of Change Assessment: Community conversa on par cipants consistently men oned that ACA regula ons are key forces impac ng the health of Chicagoans. These changes were primarily noted as opportuni es to get more people access to health insurance and comprehensive coverage. However, people had concerns that the system is solely focused on the newly insured while segments of the popula on (e.g., immigrants) are not eligible for any of these insurance programs. Medicaid expansion and Medicaid Managed Care requirements also off er some opportuni es for more people to have access to care; however, group par cipants noted that the complexity of these programs, coupled with changing rules and regula ons, may deter seeking care.
Local Public Health System Assessment: Func oning related to access to care is addressed in two of the Ten Public Health Essen al Services. Group par cipants scored the public health system func oning of Essen al Service: #7—Link people to needed personal health services and assure the provision of health care when otherwise unavailable—at a moderate level. Linking people to services is one of the most common ac vi es of community-based organiza ons and many do a great job. However, the public health system does not have one comprehensive and defi ni ve home for resources. Therefore, organiza ons o en create their own, which requires me and eff ort and is duplica ve. Organiza ons do not have the capacity to always follow up to assure the client accessed the service and received the care they needed, especially when people need oral health care and behavioral health services.
A competent workforce improves access to care by providing evidence-based, culturally-eff ec ve care. On this Essen al Service measure, #8—Assure a Competent Public Health and Personal Healthcare Workforce, Chicago’s public health system scored as func oning at a moderate level. Improvements in workforce training, assessment and leadership development will improve the competency of providers, staff and public health workers.
Community Health Status Assessment: Data strongly support the importance of a focus on access to care. The 2013 uninsured rates show stark diff erences among community areas and Chicago’s 2013 uninsured rate is much higher than the Na onal baseline (19.7% compared to 13.4%). Although the ACA increased the percentage of people with health insurance coverage, rates of the uninsured in Chicago are s ll expected to be high because of the large foreign-born popula on, many of which are not eligible for

HEALTHY CHICAGO 2.0
Informing Eff orts to Achieve Health Equity 74
ACA or Medicaid coverage. Preventable hospitaliza ons (i.e., inpa ent stays that could poten ally have been avoided with the delivery of high quality outpa ent treatment and disease management) have decreased steadily since 2000. However, rates are higher for non-Hispanic blacks and strongly correlate to high hardship community areas. Avoidable emergency department visits increased between 2009 and 2011, with the highest rate of increase for non-Hispanic blacks.
Healthy People 2020: Access to care is one of the main topic areas of Healthy People 2020 (HP 2020) and is recognized as important to achieving health equity and improving quality of life. HP 2020 focuses the access areas on: coverage levels, available services, meliness of services and workforce. By improving these components, marginalized popula ons will obtain health care that is designed more for their needs and structured to be more user-friendly.
Ac on Area #2: Behavioral Health
Community Themes and Strengths: Focus group and community conversa on par cipants expressed their concerns about limited access to mental health services in Chicago, which they felt were exacerbated by the 2012 consolida on of 12 City-operated mental health clinics. Men-tal health problems, especially coping with persistent stress many experience in their daily lives, resonated as par cipants discussed other issues (e.g., violence and police mistrust, economic uncertainty, lack of aff ordable housing and diffi culty accessing health care and social supports).
Forces of Change Assessment: The ACA not only increased the number of people who can obtain health insurance, but it also ins tu onalized mental health and behavioral health benefi ts. Illinois’ Medicaid health reform eff orts require that Medicaid Managed Care Organiza ons, which cover the ma-jority of Chicago’s Medicaid clients, have an adequate behav-ioral health network capacity. These provisions to improve access, however, do not suffi ciently cover the behavioral health needs of Chicago residents; some important services for these popula ons are not covered by Medicaid and advo-cates are not convinced plans have suffi cient capacity to serve all residents in need. State funding for safety net behavioral health services has been cut, severely impac ng communi-ty agencies’ ability to serve under-insured popula ons and those ineligible for Marketplace or Medicaid plans. Increased morbidity and mortality is an ongoing threat of a system that cannot provide adequate coverage to popula ons in need. Opportuni es to improve the behavioral health system exist by building on the eff orts of the ACA pa ent navigators and community organiza ons to help people access care and understand their coverage.
Local Public Health System Assessment: An important public health component of the behavioral health system is addressed in ES#7: Link People to Needed Personal Health Services and Assure the Provision of Health Care when Otherwise Unavailable. Networks of behavioral health providers, including CDPH, provide care for both uninsured and insured clients. Medical providers, FQHCs and community-based organiza ons refer pa ents to community behavioral health centers. However, this network lacks suffi cient capacity to serve all clients and the referral system is not robust enough to assure coverage of all clients’ needs. As a result, this essen al service scored performing at only a moderate level.
Community Health Status Assessment: Substance-related disorders, mood disorders and schizophrenic disorders were the second, third and fourth most common diagnoses of hospital discharges in 2011 (not including birth and delivery). Rates for non-Hispanic blacks were signifi cantly higher than other race/ethnic popula ons for all these diagnoses. The average number of days adults reported that their mental health; including stress, depression and problems with emo ons; was not good in the past 30 days decreased from 9.7 in 2002 to 3.1 days in 2013. More than 9% of Chicagoans reported 14 or more mentally unhealthy days, defi ned as frequent mental distress. The percentage of students in 2013 who reported they felt so sad or hopeless almost every day for two weeks remained about the same as 2001, at 33% and 34%, respec vely. Females and LGB/unsure youth had higher rates, at 41% and 55%, respec vely.
Healthy People 2020: Na onal data es mate 13 million American adults have a severe mental illness, substan a ng its posi on as one of the most common causes of disability. Substance abuse disorders impact 22 million people, with most being unaware of their problem and its impacts on their health and quality of life. HP 2020 set up objec ves to improve access to services for these condi ons, with a focus on access to preven on eff orts and services to reduce risks for both adolescents and adults.
Ac on Area #3: Chronic Disease Preven on and Control
Community Themes and Strengths: Both the in-person discussions and survey ques ons obtained feedback on access to resources that impact chronic disease, including healthy foods and opportuni es to get physical ac vity. Across all hardship quar les, survey respondents iden fi ed access to healthy foods as a priority to make Chicago healthier, second only to issues of safety. All communi es ranked healthy food access as either the fi rst or second priority in making their own neighborhood healthier. Sugges ons include sponsoring more farmers markets in low food access areas and providing double value coupons for SNAP recipients through LINK card benefi ts. People iden fi ed that access to opportuni es for physical ac vity, such as walking and biking, varied among communi es. The Divvy bike sharing program was lauded for encouraging bi-

HEALTHY CHICAGO 2.0
Community Health Assessment:75
cycling; however, people cri cized the lack of sta ons on the south side of Chicago. People also shared that the infrastructure (e.g., poor ligh ng, pot holes and crumbling roads) interfered with safe bicycling and walking on the south and west sides of Chicago. Par cipants widely supported bringing the Complete Streets model to all neighborhoods as an interven on that would help increase ac vity levels. Focus group par cipants thought that more people would use local parks and be physically ac ve if these loca ons could be made safer.
Forces of Change Assessment: Many stakeholders had concerns about the ongoing lack of healthy food in many low-income Chicago neighborhoods. Access to farmers markets and community gardens is growing; however, federal food policies do not fully support eff orts to improve healthy ea ng. Without improvement in access to healthy foods, obesity rates and incidence of chronic diseases will likely increase and management of chronic diseases will be more diffi cult and require more medical a en on. Eff orts to increase access include the double value LINK benefi ts at farmers markets and encouraging local stores to carry healthy foods.
Local Public Health System Assessment: The public health system work on chronic disease connects to the majority of essen al public health services. Through datasets, registries and state and local surveys, the system monitors chronic disease incidence and prevalence and behaviors that impact chronic disease (ES#1). Many organiza ons within the system focus on chronic disease preven on and management and collaborate in an eff ort to mobilize the community (ES#4) and inform and empower residents on how to decrease their risk of chronic disease (ES#3). These collabora ons include the City of Chicago Interdepartmental Task Force on Childhood Obesity and ongoing work with the Consor um to Lower Obesity in Chicago Children (CLOCC) and the Respiratory Health Associa on (RHA). In addi on to mobilizing the community, the public health system has been successful in its work on tobacco control by developing policies (ES#5) and enforcing laws and regula ons (ES#6). New City ordinances are now in place to reduce the sale of fl avored cigare es (Chicago Mun. Code § 4-64-180b) and impose restric ons on the sale of e-cigare es (Regula on passed by Chicago Board of Health pursuant to authority in § 2-112-100). In part because of the innova ve policy and enforcement eff orts for tobacco use preven on and control, system members scored these two essen al services as being performed at the signifi cant level.
Community Health Status Assessment: Chronic diseases make up six of the ten leading causes of mortality, accoun ng for 64% of all deaths in Chicago in 2011. Chronic disease mortality rates for non-Hispanic blacks are higher than rates for non-Hispanic whites: 20% higher for heart disease, 30% higher for cancer, 70% higher for stroke and 80% higher for diabetes. Chronic disease condi ons also comprised fi ve of the top ten causes for hospitaliza on (excluding pregnancy and childbirth). Obesity in Chicago adults is steadily increasing, from 21% in 2001 to almost 29%
in 2014. Women have higher percentages of obesity than men (32% compared to 25%) and non-Hispanic blacks have higher rates than Hispanics and non-Hispanic whites, at 38%, 32% and 24%, respec vely. Obesity is almost twice as preva-lent in high hardship communi es (37.3%) as in low hardship communi es (21.0%).
Consistent with high rates of chronic diseases, data also show limited improvement in the behaviors that impact chronic disease. The current smoking rate for adults is 18.4%, which is less than the rate in 2001 (24.3%). However, dispari es exist, with higher rates seen in men (21.8%), non-Hispanic blacks (25.3%) and high hardship communi es (25.4%). Percentages of adults who reported they did not exercise in the past month stayed the same as in the previous year, at 18.3% in 2014, with higher rates for Hispanic/La nos (20.3%), non-Hispanic blacks (22.4%) and adults living in high hardship communi es (25.4%). The percentage of Chicago adults ea ng fi ve or more servings of fruits and vegetables a day increased between 2001 (23.3%) and 2014 (29.2%), with dispari es for Hispanic/La nos (23.6%), non-Hispanic blacks (18.9%) and high hardship communi es (19.5%).
Healthy People 2020: HP 2020 objec ves focus on many health behaviors and condi ons that impact chronic disease, including tobacco use, heart disease and stroke and nutri on and weight status. The objec ves and interven ons include focus on policies, systems and environmental changes to decrease risk of these condi ons.
Ac on Area #4: Community Development (Economic Development and Housing)
Community Themes and Strengths: Focus group and community conversa on par cipants voiced strong concerns about the lack of aff ordable and healthy housing, childcare and other necessi es and how the lack of these necessi es impact health and quality of life. People complained that low-wage jobs did not allow families to aff ord decent housing and healthy food and several par cipants shared the stress they feel when they are not able to take care of their families. Survey responses documented the diff erences of aff ordability by hardship community—88% of the respondents who live in the low hardship quar le communi es agreed with the statement “I have enough money to pay for my and my family’s basic needs” compared to 66% of respondents in the high hardship quar le communi es.
Forces of Change Assessment: Housing aff ordability is a concern for Chicago residents, with about 50% of renters experiencing housing cost burden (i.e., spending more than 30% of their income on rent). Popula ons in need (e.g., youth, veterans, domes c violence survivors and persons returning to the community following incarcera on) would benefi t from comprehensive interven ons to address the root causes of homelessness. When people are in an unstable housing situa on, their health is at risk due to unsafe housing and stress that aff ects one’s mental health and ability to func on. Without enough money to cover basic needs,

HEALTHY CHICAGO 2.0
Informing Eff orts to Achieve Health Equity 76
families do not have funds to cover healthier foods and to live in safer neighborhoods. Policies to increase aff ordable hous-ing in Chicago passed in March 2015 through an amendment to the Aff ordable Requirements Ordinance (Chicago Mun. Code § 2-45-110). More amendments can be proposed to strengthen aff ordable housing policies. Another opportunity is to support and strengthen Chicago’s Minimum Wage Ordi-nance (Chicago Mun. Code §§ 2-25-050, 2-92-320, 2-92-610, 4-4-320, 1-24) (Am. Legal 2015), which begins July 2015 and requires minimum wage jobs to pay $13/hour by 2019.
Local Public Health System Assessment: Economic equity and housing issues are addressed through ES#6, especially in regard to enforcing laws on exposure to lead and other hous-ing-based hazards and the ordinances promo ng minimum wage and aff ordable housing. ES#6 was scored at a signifi cant level. In addi on, ES#4 focuses on the public health system mobilizing partnerships. Since the public health system has recognized the impact of social determinants of health, more system members are joining eff orts with community develop-ment partners and recrui ng these organiza ons to par ci-pate in joint community health work. This work was scored as being performed at a moderate level.
Community Health Status Assessment: The fi ndings from the Economic Hardship Index show that the communi es on the west and south sides of Chicago experience poverty, low wages and housing cost burden at higher rates than other areas. The Child Opportunity Index highlights similar areas that have higher rates of housing vacancies, neighborhood foreclosures, poverty, unemployment and families covered by public assistance.
Healthy People 2020: HP 2020 introduced the topic of social determinants in this most recent version of the na onal health objec ves, establishing an area of focus for what pub-lic health has known for a while—that the condi ons in which we live, work, play and worship contribute to health status and health equity. HP 2020 emphasizes the importance of crea ng social and physical environments that promote good health for all through sectors such as: community develop-ment, educa on, housing, community planning and transpor-ta on.
Ac on Area #5: Data and Research
Community Themes and Strengths Assessment: Par cipants suggested research, specifi cally Community-Based Par ci-patory Research (CBPR), as one way to increase community involvement in their health. CBPR is a research approach that emphasizes partnerships between researchers and commu-nity members and helps balance scien fi c and community interests. CBPR could help increase civic engagement if community members feel they have an equal role in making decisions about their community.
Forces of Change Assessment: The public health system inter-est in data is growing rapidly as more data become available through technology (e.g., Electronic Health Records, mobile
health apps for smartphones, etc.) and as the understanding of how social determinants and their data infl uence health equity. Several data ini a ves are occurring in Chicago to increase provider/system access to pa ent-level data and will also allow public health en es to be er monitor health con-di ons. Ongoing concerns with data include privacy infringe-ment, transparency and access to mely data on key health indicators. A new community of coders, who develop pro-grams that code open data and develop apps for public use, see opportuni es to improve access to data. With access to more data, researchers will be able to conduct more studies on public health concerns, including interven ons in margin-alized communi es.
Local Public Health System Assessment: The public health system collects data to monitor health status and iden fy community health problems (ES#1). This func on is a funda-mental component of public health departments. Along with surveillance data, CDPH is now conduc ng a telephone survey to be er understand health behaviors at the community area level. Data are available on several diff erent websites, making it confusing for less experienced users to access and understand the signifi cance of the fi ndings. Data are also an important part of collabora on and mobilizing community partnerships to address health system or health condi ons (ES#4). CDPH will o en bring data to the partnership to help iden fy priority popula ons for whom interven ons should be focused. Data also help to evaluate impact of community interven ons.
With an increased focus on evidence-based and evidence-in-formed interven ons, public health system members are bringing research to the community (ES#10: Research for New Insights and Innova ve Solu ons to Health Problems). Several universi es in Chicago conduct CBPR, engaging communi es throughout the whole process. Clinical transla onal research helps to disseminate fi ndings to improve the health of the community. These collabora ons are growing; however, eff orts need to further connect researchers with public health system members, coordinate studies and ensure providers and communi es have access to learnings. Development of a shared research agenda would help to improve coordina on, reduce duplica on and impact health equity.
Healthy People 2020: Data and research are integral parts of the mission of HP 2020 as it works to iden fy measurable objec ves and goals for its leading health indicators. An im-portant role that will move this eff ort forward is through the iden fi ca on of cri cal research, evalua on and data collec- on needs.
Ac on Area #6: Educa on
Community Themes and Strengths: Both praise for and con-cerns with Chicago’s schools came out in the focus groups and community conversa ons. Posi ve comments revolved around new policies (physical ac vity, recess), organiza onal eff orts (forma on of the Offi ce for Student Health and Well-ness) and access to health resources (School-based Health

HEALTHY CHICAGO 2.0
Community Health Assessment:77
Centers). Concerns mainly focused on CPS closing 49 schools in 2013 and the nega ve impact par cipants felt the closures have had on students and communi es, including increased travel me to schools, inequitable closures in minority communi es, impact on learning with high class size, etc. Percep ons of educa onal quality show extreme diff erences between hardship communi es, with 66% of residents in the lowest hardship community agreeing with the statement “Children in my neighborhood have access to high quality educa on,” compared to only 14% in the highest hardship communi es.
Strategies to improve the educa on system focused on increasing funding and resources, including health and social services available through school-based health centers (SBHCs). To meet community needs, par cipants also wanted more voca onal training, more neighborhood schools and revitaliza on of school buildings.
Forces of Change Assessment: The Chicago Public Schools system’s bleak fi nancial situa on is a constant force that limits resources and programming and, as a result, the equity and quality of educa on for the students. To balance their budget, CPS closed 49 schools in 2013. This strategy was met by pa-rental and community concerns for their children’s educa on, which is at risk due to low gradua on and college prepara- on rates. Further threats to the ongoing fi nancial problems
and CPS’ response to them are inequi es in achievement for minority and low-income students. Community conversa ons par cipants iden fi ed opportuni es to improve educa onal status through the implementa on of model school improve-ments and evidence-based programming throughout the District. Sugges ons also pointed to changing educa onal funding strategies to provide a consistent and adequate bud-get to fully meet student needs.
Local Public Health System Assessment: Public educa on is a key social determinant of health and is associated with most of the essen al public health services. Through Essen al Ser-vice #3—Inform, Educate and Empower People about Health Issues, the public health system helps people understand how to take care of themselves. CPS reaches students of all grade levels with its comprehensive and age-appropriate sexual health educa on curricula. CPS, through its staff and collab-ora ng organiza ons, helps students and parents sign up for Medicaid and the Health Insurance Marketplace and also provides direct care (ES#7: Link people to needed personal health services and assure provision of health care when oth-erwise unavailable). Many public health system partners work with CPS to promulgate policies to improve student health, e.g., banning the sale of fl avored tobacco—including men-thol—within 500 feet of a school, (ES#5: Develop policies and plans that support individual and community health eff orts). Many organiza ons are interested in collabora ng with CPS to access student data and conduct research to be er under-stand this important segment of Chicago’s popula on (ES#10: Research for New Insights and Innova ve Solu ons to Health Problems).
Community Health Status Assessment: Dispari es in educa- onal status occur by race/ethnicity, income and geography;
with communi es on the west and south sides having higher percentages of people without a high school degree. Data were also analyzed through the Educa onal Opportunity Index, which uses the following variables to demonstrate ed-uca onal dispari es: early childhood educa on par cipa on, quality and proximity, student poverty rate, reading profi cien-cy rate, math profi ciency rate, high school gradua on rate and adult educa onal a ainment. As with poverty and many health condi ons, communi es on the west and south sides, with their lack of high quality educa onal resources and stu-dent achievement, are the areas of concern.
Healthy People 2020: HP 2020 acknowledges the many components of educa on that are needed to improve health. Of primary concern is an educa on system that focuses on quality, availability and eff ec veness. Schools also provide op-portuni es to improve student health, through school-based and school-linked programs. Through curricula and special programs, schools teach students informa on and skills to decrease risk-taking behavior; while through policy, schools provide students with healthy environments that support posi ve health outcomes. HP 2020 also sets objec ves to pro-mote pipeline programs to encourage more minority students to choose public health as a career.
Ac on Area #7: Maternal, Infant, Child and Adolescent Health
Community Themes and Strengths: Focus group par cipants shared their concerns about the opportuni es for adoles-cents, especially those who may be involved in or impacted by violence. Par cipants recognized a erschool programs and sports programs as important resources for helping to guide students in more posi ve direc ons.
Forces of Change Assessment: Community conversa ons par- cipants discussed several health concerns impac ng children
and adolescents, including violence and the impact from envi-ronmental condi ons. To address youth and violence, par- cipants discussed augmen ng the work of schools, as they
can be safe spaces and also provide loca ons where children can seek health care and social services. Many schools off er programs in confl ict resolu on and social skill development. Children also experience health problems from environmen-tal condi ons, including air quality and home-based hazards (e.g., tobacco smoke, dust mites, lead-based paint). These condi ons exacerbate asthma in children and exposure to lead can harm their physical and behavioral development, including learning abili es.
Local Public Health System Assessment: The public health system priori zes maternal, infant, child and adolescent health throughout all the essen al services, as eff orts with this popula on help prevent/reduce chronic health problems. Society and government have responsibili es to protect the health and safety of vulnerable popula ons. Therefore, most

HEALTHY CHICAGO 2.0
Informing Eff orts to Achieve Health Equity 78
of the essen al public health services include eff orts with pregnant women, children and adolescents. For example, monitoring infant mortality, fi rst trimester care and teen births (ES#1: Monitor Healthy Status to Iden fy Community Health Problems) are universal health care indicators for all health departments and the U.S. Department of Health and Human Services. Other health indicators (i.e., tobacco usage rates in adolescents) prompt legisla ve, policy and program-ma c eff orts geared to these popula ons for the preven on of chronic health problems due to tobacco use (ES #5: Devel-op Policies and Plans that Support Individual and Community Health Eff orts, ES#6: Enforce Laws and Regula ons that Pro-tect Health and Ensure Safety). Chicago’s public health system provides services to pregnant women, paren ng adults and young children (ES#7) through nurse case management, WIC nutri on programs, immuniza ons, family planning and other well-child services. A good referral system is available across many organiza ons that work with these popula ons.
Community Health Status Assessment: Chicago’s infant mortality rate decreased by 36% between 2000 and 2010; however, the rate is s ll higher than the na onal rate. Dis-pari es exist for non-Hispanic blacks, whose infant mortality rate is almost three mes higher than non-Hispanic whites. Teen birth rates show similar fi ndings, with a 35% decrease between 2000 and 2010 and higher rates for non-Hispanic black and Hispanic teens and for teens living in high hardship communi es. Childhood immuniza on rates increased slightly from 2000 (61%) to 2013 (64%) but are lower than the US rate (70%) and the HP 2020 goal (80%). The prevalence of obesity in Chicago aff ects over one-third of school-aged chil-dren, shown by the decrease in the percent of children who eat fi ve or more servings of vegetables per day (30% in 2000 to 24% in 2013) and the decrease of physical educa on ac v-ity fi ve days per week (57% to 39%). Adolescents in Chicago also have high rates of sexually transmi ed infec ons and comprise 35% of all chlamydia cases in 2013. Compared to heterosexual adolescents, those who are lesbian, gay, bisexu-al or unsure (LGBU) are at higher risk for unhealthy behaviors: suicide a empts (11% for LGBU compared to 2% for hetero-sexual), smoking (19% to 9%), marijuana use (42% to 26%) and binge drinking (25% to 16%).
Healthy People 2020: The health and well-being of children and adolescents is a founda onal measure of public health; it is an indicator of how a na on and community cares for its most vulnerable popula ons and these data help to predict resources needed for future genera ons. HP 2020 sets goals to improve nutri on and growth and development. HP 2020 also addresses social determinants of health by se ng goals to reduce inequi es of health outcomes and social determi-nants of health by addressing racial/ethnic, income, educa- onal a ainment and other variables.
Ac on Area #8: Partnerships and Community Engagement
Community Themes and Strengths: Throughout the commu-nity conversa ons, par cipants discussed the importance of
community engagement. Although par cipants shared they were glad they decided to a end the mee ngs and discuss how to improve their community, they expressed their frus-tra on that more residents were not there and do not get involved with neighborhood events. The online survey found that three-fourths of the respondents in each of the four quar les agreed with the statement “I know and talk to my neighbors.” However diff erences between quar les came out with the percentage that agreed with “I belong in my neigh-borhood.” Ninety percent of respondents who lived in the low hardship quar le agreed with that statement compared to 63% in the highest hardship quar le. Focus group members knew individuals who looked out for their neighborhood (i.e., “nosey neighbors”) and cited them as assets because they know what is going on and were good resources. Focus group members also men oned faith communi es as a way for peo-ple to be involved and connected to their neighbors. Sugges- ons to increase community involvement focused on crea ng
opportuni es for residents to get involved with partnerships and to work with local community-based organiza ons and City agencies to improve quality of life in their community. They also thought campaigns to promote volunteerism could help with social cohesion and connec on.
Local Public Health System Assessment: Collabora on and en-gaging partners is one of the ten essen al public health ser-vices (ES#4: Mobilize Community Partnerships to Iden fy and Solve Health Problems). The public health system in Chicago has many dedicated partners and many coali ons working on a variety of health condi ons and in many diff erent com-muni es. However, these eff orts do not o en communicate with each other and residents may not know about the work happening in their communi es. Eff orts need to be intensifi ed to include more diverse groups and community residents. This essen al service was scored as performing at a moderate level due to the limita ons men oned above.
Healthy People 2020: HP 2020 established these na onal objec ves with a goal of encouraging collabora ons to work together to improve the health and quality of life of peo-ple both locally and na onally. Although HP 2020 does not have a separate priority area addressing partnerships and community engagement, it is embedded throughout this eff ort becaused HP 2020 was developed by a “diverse group of individuals and organiza ons,” including subject ma er experts and community feedback. In addi on, many of the evidence-based strategies HP 2020 promotes are conducted by coali ons.
Ac on Area #9: Prepare, Protect and Prevent Disease
Forces of Change Assessment: The public’s health is impacted by environmental factors both inside and outside one’s home. Second-hand smoke and dust can increase asthma a acks in children. Exposure to lead can impair learning and behavior and cause developmental problems, yet funding for public health eff orts to address lead poisoning has declined. Air pollu on is a problem in Chicago as well. The American Lung

HEALTHY CHICAGO 2.0
Community Health Assessment:79
Associa on in its 2014 report “State of the Air 2014” graded metropolitan Chicago’s air quality as “F.” This report ranked Chicago as the 14th most polluted city for short-term par cle pollu on and 20th for the most ozone-polluted and year-round par cle polluted city. Opportuni es to address these problems are contained in the 2010 Chicago’s Climate Ac on Plan, which works to iden fy strategies to reduce greenhouse gas emissions. Collabora ve eff orts among the City, County, universi es and other sectors focus on iden fying strategies to promote healthy homes policies and programs.
Local Public Health System Assessment: Par cipants in this assessment scored the essen al service of diagnosing and inves ga ng health problems and hazards (ES#2) as being performed at an op mal level—the highest ranking giv-en and the highest scoring of the essen al services in this assessment. Par cipants cited the work and collabora on conducted through CDPH’s communicable disease, HIV/STI surveillance and treatment and the emergency preparedness offi ces when scoring. CDPH depends on the state laboratory to get informa on on possible threats and these eff orts are well coordinated. Securing consistent and suffi cient funding for these laboratory services and improving technology and staffi ng would help improve this essen al service.
This ac on area also focuses on educa ng and empowering people about threats to their health (ES#3), linking people to care and assuring care when otherwise unavailable (ES#7). Much work occurs in these essen al services on HIV/STI preven on and treatment. CDPH and a network of partners work to inform and educate high risk popula ons about HIV/STI and help facilitate healthy sexual behaviors. The public health system also off ers tes ng and treatment for HIV/STI and works to reach partners with expedited tes ng and treatment.
Community Health Status Assessment: Annual HIV diagno-ses varied widely from 1990 to 2013, with a high in 2001 (1,857 cases) and a low in 2011 (1,015 cases). In 2013, 1,090 people were diagnosed with HIV. AIDS diagnoses peaked in 1993 (1,914 cases) and declined to a low in 2013 (536). New infec ons are occurring in non-Hispanic black men who have sex with men (MSM) (35% of new cases), non-Hispanic white MSM (20%), Hispanic MSM (16%) and non-Hispanic black women (12%). Those under 30 years of age represent 41% of new infec ons.
Rates of chlamydia and primary and secondary syphilis in-creased between 1998 and 2013. Chlamydia increased from 17,000 cases to almost 25,000 cases and syphilis increased from 338 to 623. Gonorrhea cases decreased from 14,000 to 8,400. However, as with chlamydia, adolescents and young adults (13 to 24 years old) represent the majority of cases: 65% of gonorrhea and 70% of chlamydia cases.
Immuniza on coverage in Chicago varies, with some 2013 rates mee ng the HP 2020 goals: (1) measles, mumps and Rubella; (2) diphtheria, tetanus and pertussis; and (3) pneu-
monia. In contrast, rates for children aged 19 to 35 months receiving the full range of immuniza on coverage is at 64%, lower than both the na onal rate (70%) and the HP 2020 goal (80%). Human Papillomavirus (HPV) vaccine coverage rates for 13 to 17-year old females receiving three doses have increased since 2010, from 62% to 71% in 2013.
Healthy People 2020: As with previous na onal health goals, HP 2020 promotes the use of immuniza on to reduce spread of vaccine-preventable disease through both evidence-based approaches and community engagement. With the expansion of technology, global travel and security concerns, HP 2020’s interven ons now include innova ve advances to aid in surveillance, early detec on and rapid response to emerging diseases.
Ac on Area #10: Violence and Injury Preven on
Community Themes and Strengths: Par cipants in the com-munity conversa ons, focus groups and oral histories men- oned safety most frequently as a concern for their health
and quality of life. Survey respondents across Hardship Index quar les also rated safety as the number one concern for Chicago. Percep ons of safety through the online survey illustrated large dispari es by Hardship Index quar les; more than twice the percentage of respondents living in the lowest hardship communi es felt safe compared to respondents in the highest hardship areas. Respondents’ percep ons of law enforcement show similar dispari es for these quar les. Fo-cus group par cipants a ributed much of their daily stress to the high rate of violence in their communi es along with their mistrust of law enforcement. Sugges ons for improvements pointed to increasing resources for organiza ons that work with youth.
Forces of Change Assessment: Par cipants discussed the high rates of violence in many Chicago communi es and iden -fi ed how the stress accompanying the violence threatens an individual’s mental and physical health. With fear of violence, people o en decrease their outside physical ac vity and limit travel, which o en limits access to healthier foods. Opportu-ni es to address the high rates of violence center on schools and their role in providing a safe, nurturing environment for children and youth. Schools can help students access both health and social services and can teach confl ict resolu on. People also iden fi ed the need for improved communica on with law enforcement to build trust, improve cultural com-petence and collaborate on programs to address community safety.
Local Public Health System Assessment: The public health system has a role in reducing and preven ng violence and this work is embedded in many of the Essen al Public Health Services. The Chicago Police Department enforces laws that protect public health and safety (ES#6). CDPH works with many other stakeholders to mobilize community partnerships to address issues of violence (ES#4) and to inform, educate and empower communi es on violence preven on (ES#3).

HEALTHY CHICAGO 2.0
Informing Eff orts to Achieve Health Equity 80
New programs are being developed to (1) train the health care and criminal jus ce workforce how to engage individuals with mental health problems in an eff ort to reduce criminal jus ce system involvement and (2) assist children and others exposed to violence or other adverse experiences to improve health and reduce recidivism (ES #8). More eff orts are needed with this popula on, including improving the linkages of the formerly incarcerated.
Community Health Status Assessment: Violent crime has decreased citywide since 2001; however, inequi es exist with rates of violent crime being strongly correlated with Hardship Index. Maps of non-fatal shoo ngs show clusters in high hard-ship community areas.
Healthy People 2020: With injuries being a leading cause of death and disability, HP 2020 priori zes work to comprehen-sively reduce these occurrences. Objec ves look at many components, including individual behaviors, the physical envi-ronment, access to services and the social environment.

HEALTHY CHICAGO 2.0
Community Health Assessment:81
PHASE 5: FORMULATE GOALS, OBJECTIVES AND STRATEGIES
Purpose: This phase moves the plan further toward imple-menta on, as it converts the ten priority areas into ac onable eff orts, with concrete goals and objec ves. Diverse work teams developed mul ple strategies, to be implemented by community partners, through which the objec ves will be met. Because it was inclusive of public health stakeholders, this phase strengthened community engagement and buy-in for Healthy Chicago 2.0. It also helped to ensure effi cacy of the plan through a focus on evidence-based/evidence-in-formed, community-driven strategies.
Process: To conduct this phase of the plan, CDPH undertook a comprehensive process that engaged, trained and supported the work of stakeholders and community members. Many people were already involved in Healthy Chicago 2.0 through the community conversa ons, held as part of the Communi-ty Themes and Strengths Assessment, the Forces of Change Assessment and the mee ngs held to iden fy overarching strategic issues. For this phase of the plan, however, CDPH wanted even more community breadth and depth to ensure our goals and strategies refl ect the most eff ec ve interven- ons to address health equity. To solicit broader par cipa on
in this phase, CDPH developed and release an online form for people to volunteer their me.
The form opened up on April 15, 2015 through a City of Chi-cago online survey tool and CDPH publicized it through many communica on channels, including CDPH’s Healthy Chicago Monthly Update listserv, CDPH’s Facebook page, CDPH’s Twi er feed and other programma c contact lists. CDPH also sent this no ce to its partners, including the Partnership for Healthy Chicago, to disseminate through their networks. By the me the applica on closed on April 27, 2015, over 200 people had submi ed their forms to volunteer on a work group.
CDPH staff reviewed the applica ons and, based on criteria, such as diversity, exper se and community engagement, iden fi ed 150 applicants to join one of the ten Healthy
Chicago 2.0 work groups. The work groups were co-chaired by a CDPH staff member and a community liaison, iden fi ed through their applica on forms or personal discussions with experts in the fi eld. Once the work groups began, members invited addi onal people to join this eff ort to augment the knowledge base of the group.
CDPH trained its work group co-chairs and members to allow all groups to approach their work in a similar manner and with a similar understanding of their roles and responsibil-i es. On April 29, 2015, the Illinois Public Health Ins tute (IPHI) trained the CDPH and community co-chairs on group facilita on skills. IPHI also trained 75 work group members on how to write eff ec ve goals, objec ves and strategies at a four-hour training on May 6, 2015 at the Chicago Public Library—Legler at 115 S. Pulaski Road, Chicago.
Facilitated by the co-chairs, each work group met an addi- onal fi ve to seven mes between May and August 2015. At
these mee ngs, members fi rst developed broad goals and then more specifi c objec ves through which to measure progress. These objec ves reference data from many sources, including the Healthy Chicago Survey. Members then created strategies, with a focus on health equity and marginalized communi es/popula ons. Work groups suggested both community organiza ons and governmental agencies to lead these strategies.
From August through November 2015, CDPH and the work group co-chairs priori zed the most essen al elements of the ten ac on areas, resul ng in a focused approach to improve health equity through specifi c goals, objec ves and strategies.
Findings: The Healthy Chicago 2.0 Plan presents the goals, objec ves and strategies developed by the work groups.
Next Steps: CDPH will reconvene ac on area work groups to develop detailed work plans for the strategies. These groups will assess their membership and invite new partners who may lead or be involved with specifi c strategies. CDPH and the re-formed work groups will oversee these eff orts and report annually on their progress with the strategies and objec ves.

HEALTHY CHICAGO 2.0
Informing Eff orts to Achieve Health Equity 82
ACKNOWLEDGMENTSThe Chicago Department of Public Health expresses its sincere gra tude to the individuals and organiza ons who contributed to the Healthy Chicago 2.0 Community Health Assessment. Your exper se, insights and feedback made this assessment richer and more representa ve of our community. Thank you for your me and eff ort.
PARTNERSHIP FOR HEALTHY CHICAGO:
Sheri Cohen, Co-ChairChicago Department of Public HealthKirsten Peachey, Co-ChairAdvocate Congrega onal Health Partnerships,The Center for Faith and Community Health Transforma onJoel Africk Respiratory Health Associa onJoe Albri on Mayor’s Offi ce for People with Disabili esAdam Becker Consor um to Lower Obesity in Chicago ChildrenLe cia Boughton Price Chicago CHW Local NetworkGraham Bowman Coali on for the HomelessPaul Brandt RaufUniversity of Illinois at Chicago, School of Public HealthJen Brown Northwestern University Center for Community HealthVaughn Bryant Chicago Park DistrictKathy Chan Cook County Health & Hospitals SystemDrew Williams Clark Chicago Metropolitan Agency for PlanningJennifer Clary Heartland Alliance/Social IMPACTMark Clough Illinois Primary Health Care Associa onChris an Denes Chicago Department of Family & Support ServicesJaime Dircksen Chicago Department of Public HealthPeter EckartIllinois Public Health Ins tuteBarry Eisenberg Ins tute of Medicine-ChicagoWesley Epplin Health & Medicine Policy Research GroupMegan ErskineChicago Public SchoolsCaswell Evans Chicago Board of Health
Beth Ford Chicago Police DepartmentColleen Gallagher Chicago Park DistrictJudith Gethner Illinois Partners for Human ServiceAllyson GoldLoyola University Health Jus ce ProjectYonina GrayMetropolitan Planning CouncilDiana Hackbarth Illinois Nurses Associa onJoseph HarringtonIllinois Department of Public HealthBlair HarveyPublic Health Ins tute of Metro ChicagoColleen HarveyPlayworksJeni Hebert-Beirne University of Illinois at Chicago, School of Public HealthSarah Hess Chicago Lawyers’ Commi ee for Civil Rights Under LawJana Hirsch ck Sinai Urban Health Ins tuteManasi Jayaprakash Illinois Primary Health Care Associa onLisa JohnsonMetropolitan Chicago Healthcare CouncilPeter Kamps Chicago Department of Family & Support ServicesEllen Kaufmann Illinois Public Health Ins tuteDoris Konicki Ins tute of Medicine-ChicagoLisa Kritz EverThrive IllinoisCarolyn Lopez Chicago Board of HealthKate McMahonRespiratory Health Associa onJulie Morita Chicago Department of Public HealthEva Paredes Chicagoland Chamber of Commerce

HEALTHY CHICAGO 2.0
Community Health Assessment:83
Rajesh Parikh Illinois Primary Health Care Associa onJillian Phillips Campaign for Be er Health CareJay Readey Chicago Lawyers’ Commi ee for Civil Rights Under LawKaren Reitan Public Health Ins tute of Metro ChicagoJessica Rooney Heartland Alliance/Heartland Human Care ServicesMargie Schaps Health & Medicine Policy Research Group Richard Sewell University of Illinois at Chicago, School of Public HealthSujata Shah Chicago Public SchoolsSamantha Sherrod Chicago Metropolitan Agency for PlanningEmma Swinford Loyola University Health Jus ce ProjectDarius TandonNorthwestern University Center for Community HealthAndy Teitelman Chicago Housing AuthorityAlejandra Valencia Chicago Community Oral Health ForumMona Van Kanegan Chicago Community Oral Health ForumHerminia Vanna Chicago Department of Public HealthVanisa Verma Illinois Primary Health Care Associa onRachael Viale Loyola University Health Jus ce ProjectDominique Williams Local Ini a ves Support Corpora on Chicago
HOSTS FOR COMMUNITY CONVERSATIONS AND FOCUS GROUPS Access LivingAlumni Associa on of the Cook County Sheriff ’s Day Repor ng CenterBethel New LifeBlue 1647Apostolic Faith ChurchCatholic Chari es Family ShelterCenter on HalstedChicago Park District-Aus n Town HallChicago Park District-Hamilton Park Cultural CenterDr. Mar n Luther King, Jr. City of Chicago Service CenterMetropolitan Tenants Organiza onNew Moms, Inc.
CDPH STAFFRegina An Emily Lafl ammeKirs Bocskay Laura MilsteinAnn Cibulskis Daryl MurphySheri Cohen Nhan NguyenFlorence Cullerton Nikhil PrachandJaime Dircksen Margarita ReinaSuzanne Elder Brian RichardsonKaren Ewing Mallika SabharwalMaria Gallegos Angelica SanchezJonathan Giuff rida Isabel SanchezDana Harper-Jemison Janis SayerJennifer Herd Kate SchellingerMonica Hernandez Megan SchreierTina Schuh Herminia Vanna Madeline Shea Cris na Villarreal Cristal Simmons Kingsley Weaver Berenice Tow Marlita White

HEALTHY CHICAGO 2.0
Informing Eff orts to Achieve Health Equity 84
UIC SCHOOL OF PUBLIC HEALTH COMMUNITY HEALTH SCIENCES 431, FALL 2014Jennifer Hebert-Beirne, PhD Jennifer Felner, MPH, PhD candidate
Jennifer Anderson Chris na PateJinsun Baek Marisa PochterKaijah Blackwell Raeesa SadatAnna Browar Tina SchuhBrynn D. Foss Anne ScobelKelsey Gruss Sunny SetoNicole Gulich Grace ShermanJonathan Hofacker Desmona StrahanDemonica Jones Kimi SuhReem Kieso Pete ThomasChris na Larson Cris na TurinoJill Massino Milona Van KaneganMwia Mutua Sarah WagenerGeoyia Nightengale Sarah WrightJennifer Norsworthy Lindsay Zeman
OTHER CONTRIBUTORSShirley Alfaro, StoryCorps, Inc. Laurie Call, Illinois Public Health Ins tuteDolores Castaneda Yve e CastanedaAmanda Dougherty, UIC School of Public Health Student Tiff any Ford, UIC School of Public Health Student Maribel Gamon, UIC School of Public Health Student Haley Jordahl, 2015 Chicago Summer Mayoral FellowMackenzie Magnus, UIC School of Public Health Student Kris n Monnard, Illinois Public Health Ins tuteChris ne Rapp, UIC School of Public Health Student Allison Weil, 2015 Chicago Summer Mayoral Fellow

HEALTHY CHICAGO 2.0
Community Health Assessment:85

HEALTHY CHICAGO 2.0
Informing Eff orts to Achieve Health Equity 86
APPENDICES1: Community Health Assets
2: Community Themes and Strengths Assessment a. Online Neighborhood Survey
b. Facilitator Guide for Community Conversa ons
c. Focus Group Facilitator Guide
d. Oral History Facilitator Guide
3: MAPP Health Equity Supplement
87
9599
100102
104

HEALTHY CHICAGO 2.0
Community Health Assessment:87
APPENDIX 1: COMMUNITY HEALTH ASSETSPurpose: Chicago’s public health infrastructure consists of a wide variety of assets that posi vely impact the community’s health. This sec on provides informa on on several of the
key assets to be er understand available resources that can be mobilized to improve health.
Process: Chicago’s public health system assets were catego-rized into 10 areas.
Community Support Culture Educa on Employment Health Care System
Charitable Organiza ons Theaters Head Start Programs Business Associa ons Hospitals
Faith-Based Organiza ons Museums Daycare facili es Small Businesses FQHCs
Immigrant Communi es Film/TV Industry Chicago Public Schools Chambers of
Commerce Safety Net System
Formal & Informal Support Groups Fes vals Religious Schools Technology Incubators Mental Health Clinics
Shelters & Drop In Centers Media Outlets A er School Programs Banks Urgent Care Centers
Neighborhood Associa ons Musicians & Ar sts Local School Councils Tourism Industry School-based Health
Centers
Founda ons Outdoor exhibits Voca onal Schools Financial Services Industry
Private Medical & Dental Prac ces
Community College System One Summer Chicago Pharmacies
Colleges & Universi es Business Districts Home Health
Public Library Anchor ins tu ons Public Health Department
Healthy Food Housing Physical Ac vity Public Safety Transporta on
Community Gardens Aff ordable Housing Neighborhood Events/Races
Community Advocacy Groups Divvy Bike Share
Farmers Markets Assisted Living Facili es The 606-Bloomingdale Trail Safe Passage Routes Bike lanes & trails
Community Grocers Charitable Organiza ons Fitness Centers CAPS Community Polic-
ing Program Complete Streets
Food Banks/Pantries Green building services Recrea on Centers Juvenile Courts CTA-El and buses
Restaurants Historic Preserva on Organiza ons Public Pools Cook County Jail Metra
Food Trucks Homeownership Program Parks & Playgrounds Chicago Police Depart-
mentHighways and surface roads
WIC Program & Outdoor exhibits Voca onal Schools Financial Services Industry
Private Medical & Dental Prac ces
SNAP Benefi ts Housing Choice Voucher Bike Trails Chicago Fire Depart-
mentWaterways—lake and river
School Lunch Programs Running Paths Summer Camps Airports

HEALTHY CHICAGO 2.0
Informing Eff orts to Achieve Health Equity 88
Informa on was collected for several of these assets. Maps illustrate geographic coverage, with further demographic overlays to assist with understanding implica ons of assets.
Findings:
Educa on
Chicago Public Schools (CPS) is Chicago’s public educa on provider, with a total of 660 schools serving 396,683 students in grade pre-kindergarten through 12th grade. In addi on to educa on in all subject areas, CPS partners with other City and community resources to provide a range of extracurricular op ons to support student development. These programs include resources for early childhood educa on (such as Head Start) and career development through the A er School Ma ers program.
Although all Chicago children are eligible for enrollment into CPS schools, access to high performing schools (i.e., Level 1 Plus) are limited. As the map shows, Level 1 Plus schools are not spread evenly throughout the community areas: 27.9% in high hardship areas compared to 31.7% in medium and 40.4% in low hardship areas. Improving the quality of schools in high hardship communi es would improve equity and strengthen academic performance of children living in these areas.
Chicago is home to many types of ins tu ons of higher educa on, including two-year colleges, four-year colleges, universi es and professional training programs. The majority of these resources are privately-owned and op-erated, except for the seven campuses of the City Colleges of Chicago system, the University of Illinois at Chicago and Chicago State University. World-renowned universi es are located in Chicago, including Northwestern University and University of Chicago with na onal and interna onal student bodies. Many others focus on specifi c training programs, including health care (Rush University, Alder School of Profes-sional Psychology) and law (Kent Law School, Loyola Univer-sity School of Law). Chicago also is home to a leading arts school—the School of the Art Ins tute. These ins tu ons, especially the public ones, provide opportuni es for Chicago residents to obtain educa on and training in many fi elds. The public health system benefi ts by having students with varied interests and backgrounds as interns and as a connec on to forward research and innova on. The students also benefi t by learning about public health, with a focus on health equity.
Data Sources: U.S. Census Bureau, American Community Survey, 2009-2013; Chicago Public Schools
Data Sources: U.S. Census Bureau, American Community Survey, 2009-2013

HEALTHY CHICAGO 2.0
Community Health Assessment:89
Public Safety: Safe Passage Routes
For children to grow up with access to opportuni es for a healthy and produc ve life, they need to feel safe at home and in their community. Many organiza ons, including public, not-for-profi t and faith-based, run programs, provide resourc-es and work to reduce violence and promote community safe-ty. One of these programs is the Safe Passage Program that provides adult supervision to improve child safety when walk-ing to and from school. Forty new routes were added for the school year 2014-2015 to accommodate children transferring to new schools a er the closure of 49 neighborhood schools. Currently, almost 100 Safe Passage Routes are opera ng in Chicago, with most of the helping children a end their new schools and in areas of high public violence, i.e., gun-related crimes commi ed in the public way.
Employment: Job Training Programs
When individuals are employed in steady jobs that provide a living wage, they are more able to aff ord ameni es (i.e., healthy food and housing, etc.) that improve their health status and the health of their families. Chicago has resources to help people obtain jobs, including job training programs, transi onal job provision and assistance with job placement. The map shows the loca on of these programs and unem-ployment rates by census tract. Many of these programs are clustered in the near south side, which is easy to access through public transporta on. Other programs are sca ered throughout the city, primarily in areas of higher unemploy-
ment. This map, however, shows an unmet need, as many communi es with high unemployment do not have easy access to job training programs.
Data Sources: U.S. Census Bureau, American Community Survey, 2009-2013
Data Sources: Chicago Police Department, 2014 Chicago Public Schools

HEALTHY CHICAGO 2.0
Informing Eff orts to Achieve Health Equity 90
Employment: Business Resources
Chicago is home to a strong and dynamic business environ-ment, with growing opportuni es for technology innova on and incubators. To promote business development, espe-cially in the communi es, the City sponsors local chambers of commerce. These 65 chambers of commerce galvanize business development support and neighborhood-level economic development in nearly all community areas, as evidenced by the map at le . The chambers o en play host to the City’s Neighborhood Business Development Centers (NBDCs), which are funded by the City and provide dedicated and loca on-specifi c small business support. The map notes, however, that certain areas remain underserved, par cularly those most aff ected by rates of unemployment above 30%, on the City’s southwest and far south sides.
Data Sources: U.S. Census Bureau, American Community Survey, 2009-2013
Transporta on
Chicago has an extensive public network of trains and buses that assist individuals and families to travel to work, school and to access resources throughout the City. Chicago is home to two interna onal airports, commuter rail systems and a lakefront that serves boats of all sizes. The transporta on net-work also includes several major highways and miles of sur-face streets available for cars and freight. A new emphasis is on Complete Streets, to improve safety and usability of street for pedestrians and bicyclists. Currently Chicago has over 225
miles of barrier protected bike lanes, buff er protected bike lanes and conven onal bike lanes, marked shared lanes and neighborhood bike routes and is con nuing to grow.
In 2013, Chicago inaugurated the DIVVY bike share program, which currently off ers 4,760 bikes for rent at 476 sta ons. DIVVY sta ons are spread throughout the city, however are most heavily focused in the areas with low levels of hardship. As the Divvy sta ons expand into lower hardship communi- es, Divvy recently started a program allowing for those who
qualify fi nancially to obtain an annual low-cost membership. This benefi t, along with the expansion of Divvy sta ons will off er more choices for transporta on and exercise for com-muni es in need.
Data Sources: U.S. Census Bureau, American Community Survey, 2009-2013
Physical Ac vity
Chicago off ers many op ons for physical ac vity, chief among them the infrastructure operated by the Chicago Park Dis-trict (CPD). These resources include over 8,000 acres of open space, including over 570 parks, 31 beaches, 50 nature areas and two world-class conservatories. CPD also hosts thousands of special events, cultural, nature, sports and recrea onal programs that promote physical ac vity, play, learning and social connectedness.
As noted in the map, larger parks are primarily located on the lakefront, although several large parks are in some neighbor-hoods, including Humboldt Park, Douglas Park and Washing-

HEALTHY CHICAGO 2.0
Community Health Assessment:91
ton Park. Other communi es are home to smaller parks and play lots, with play equipment for children. Other programs promote physical ac vity in communi es with limited access to resources, such as PlayStreets run by the Chicago Depart-ment of Public Health. PlayStreets closes several street blocks and transforms them into play and recrea on spaces for a few hours at a me.
Even with these resources available, access to physical ac vi es is limited due to safety issues. Because of violence that occurs in or around the public spaces, many people do not benefi t from these resources. To address these issues, Chicago Park District is working with the Chicago Police De-partment and other City and local organiza ons to improve community safety and ensure parks remain a safe center for physical fi tness and recrea on for all members of the commu-nity.
Healthy Food
Access to healthy foods, i.e., fruits and vegetables, is a measure of a community’s health and is key for individuals wan ng to follow healthy nutri on guidelines. In recent years, more healthy food outlets have become available, with the advent of urban agriculture, community gardens and mobile produce carts. In addi on, the City hosts farmers mar-kets with local vendors selling fruits, vegetables, fl owers and prepared foods. While some farmers markets are privately fa-cilitated, the majority are City-run. To enhance economic ac-
cessibility, the farmers markets now allow for purchase using Supplemental Nutri on Assistance Program (SNAP) LINK card. Although this program does provide access to healthy food, the farmers markets are not distributed equitably across the city. The map shows the geographic divide in the placement of these markets. Eff orts to bring more nutri onal assets to high hardship communi es will help to improve health status.
Data Sources: U.S. Census Bureau, American Community Survey, 2009-2013Data Sources: Chicago Police Department, 2014 Chicago Park District

HEALTHY CHICAGO 2.0
Informing Eff orts to Achieve Health Equity 92
Cultural Assets
Chicago is home to many cultural assets that foster communi-ty awareness, learning and social connectedness; and there-fore infl uence quality of life and health. These assets include theaters, fi lm and television industries, street fes vals, media outlets, musicians and ar sts. Chicago is also home to several world-class museums, including the Art Ins tute of Chicago and the Field Museum. Most large ins tu ons are located in the central business district to provide easier access for tourists and all Chicago residents. Some museums, such as the Na onal Museum of Mexican Art and DuSable Museum of Af-rican American History, are located in neighborhoods and pro-vide programming and educa onal opportuni es for students and community residents. Development of cultural assets in communi es with lower levels of educa on would increase exposure to new informa on and learning experiences
Data Sources: U.S. Census Bureau, American Community Survey, 2009-2013
Housing: Chicago Housing Authority Residences
With access to aff ordable and safe housing, individuals and families can focus on other components of their lives that improve their health, including ge ng physical ac vity, ea ng healthy foods and strengthening family rela onships. Stable housing also helps children to stay in the same school throughout the school year, which increases their academic performance. Proper es are available for families, seniors and mobility and sensory impaired individuals. The map shows that many of these sites are located in low hardship communi- es on the north side. CHA residents living in these proper es
benefi t through improved access to resources available in these neighborhoods. Other sites are located in high/medium hardship communi es on the near south side, west side and far south side to allow people to stay in familiar neighbor-hoods, when possible.
Data Sources: U.S. Census Bureau, American Community Survey, 2009-2013; Chicago Housing Authority

HEALTHY CHICAGO 2.0
Community Health Assessment:93
.
Health Care Resources: Community Health Centers
With the passage of the Aff ordable Care Act (ACA), many previously uninsured individuals are now eligible for aff ord-able health care insurance through either the Marketplace or Medicaid expansion. These individuals, along with many oth-er pa ents, seek care at the 92 federally qualifi ed health cen-ters (FQHCs) and Look-Alike clinics, 31 school-based health centers, eight clinics operated by the Cook County Health & Hospitals System and four other safety net clinics. These clinics also provide comprehensive care to the uninsured. To meet this need, these centers are primarily located in areas with higher rates of uninsured, as shown on the map.
Data Sources: U.S. Census Bureau, American Community Survey, 2009-2013
Data Sources: U.S. Census Bureau, American Community Survey, 2009-2013; City of Chicago Data Portal
Human Services: Homeless Shelters
Many organiza ons; public, not-for-profi t, faith-based; pro-vide services for people and families in need. One of these needs is for housing, especially for the 6,800 homeless indi-viduals in Chicago (based on the 2015 Chicago Department of Family & Support Services Point-in-Time Count & Survey Report). However, based on the informa on through the City of Chicago Data Portal, shelter capacity does not provide for all homeless individuals. In September 2015, capacity at both overnight shelters and interim shelters totaled 3,400 beds. The map shows the loca ons of shelters off ering overnight facili es.
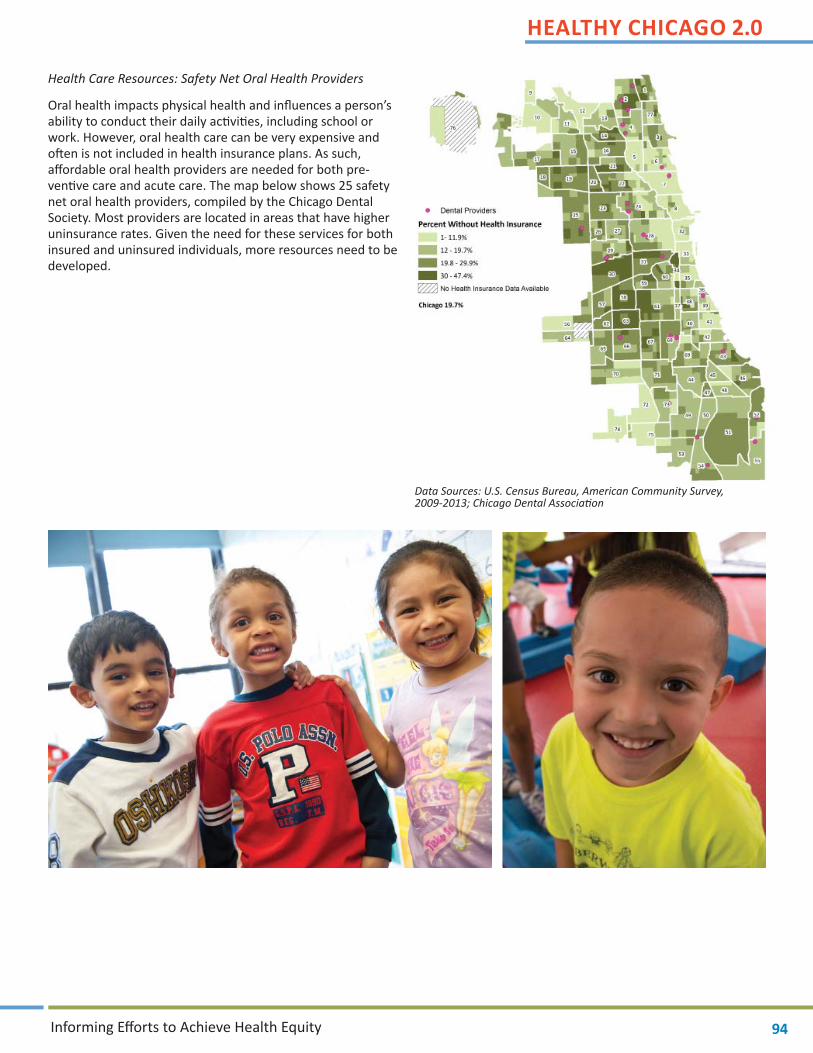
HEALTHY CHICAGO 2.0
Informing Eff orts to Achieve Health Equity 94
Health Care Resources: Safety Net Oral Health Providers
Oral health impacts physical health and infl uences a person’s ability to conduct their daily ac vi es, including school or work. However, oral health care can be very expensive and o en is not included in health insurance plans. As such, aff ordable oral health providers are needed for both pre-ven ve care and acute care. The map below shows 25 safety net oral health providers, compiled by the Chicago Dental Society. Most providers are located in areas that have higher uninsurance rates. Given the need for these services for both insured and uninsured individuals, more resources need to be developed.
Data Sources: U.S. Census Bureau, American Community Survey, 2009-2013; Chicago Dental Associa on

HEALTHY CHICAGO 2.0
Community Health Assessment:95
APPENDIX 2A: HEALTHY CHICAGO 2.0 ONLINE NEIGHBORHOOD SURVEY
The Chicago Department of Public Health (CDPH) is collec ng feedback from Chicagoans about the neighborhood they live in, since where you live is an important part of your health. Your responses will help CDPH and its partners develop health priori- es for the city. This survey will take about 10 minutes to complete. You may choose not to answer any ques on on the survey
and all responses will be kept confi den al and anonymous. Only combined results from the survey will be shared.
Thank you for your par cipa on!
What neighborhood do you live in?
How many years have you lived in that neighborhood? Less than 1 year Between 1 and 3 years Between 3 and 5 years Between 5 and 10 years Between 10 and 20 years More than 20 years
Think about the neighborhood where you live and choose whether you agree or disagree with the following statements. We understand that you might not completely agree or disagree with some statements. In those cases, please choose the answer that best refl ects your opinion.
Agree Disagree I don’t know
I know and talk to my neighbors
I know what is going on in my neighborhood
I am sa sfi ed with the quality of life in my neighborhood
There are places for people to gather in my neighborhood (e.g. faith ins tu on, community center, library, school, parks)
I feel safe in my neighborhood
Property crime is a problem in my neighborhood (e.g. graffi , vandalism, burglary)
Violent crime is a problem in my neighborhood
Schools in my neighborhood have what they need to provide a high quality educa on
Children in my neighborhood have access to high quality educa on
Houses and apartments in my neighborhood are in good shape
Houses and apartments in my neighborhood are aff ordable
I have enough money to pay for my and my family’s basic needs
I have access to a personal checking account to store money

HEALTHY CHICAGO 2.0
Informing Eff orts to Achieve Health Equity 96
Agree Disagree I don’t know
My neighborhood is well-served by public transit
I see a lot of people walking or biking in my neighborhood
I have access to healthy food in my neighborhood
Basic ameni es, such as a grocery store, pharmacy or library, are easily accessible to me
Health services I use are easy to get to from my neighborhood
My neighborhood provides social and recrea onal opportuni es for me and my family
I feel law enforcement is responsive in my neighborhood when needed
The streets and sidewalks in my neighborhood are in good shape
I have felt discriminated against in my neighborhood
I feel like I belong in my neighborhood
People in my neighborhood have input on important community and city decisions
In your opinion, how would you make your neighborhood a healthier place to live?

HEALTHY CHICAGO 2.0
Community Health Assessment:97
Now thinking about the en re city, how would you make Chicago a healthier place to live?
The next few ques ons will ask a li le bit more about you.
What is your age?
What is your gender?
Male Female Transgender
Which of the following would you say is your race (select all that apply)? White
Black or African American
American Indian or Alaska Na ve
Asian (including Asian Indian, Chinese, Filipino, Japanese, Korean, Vietnamese, or other Asian)
Pacifi c Islander (including Na ve Hawaiian, Guamanian or Chamorro, Samoan, or other Pacifi c Islander)
Are you of Hispanic, La no/a, or Spanish origin? No, not of Hispanic, La no/a, or Spanish origin
Yes, Mexican, Mexican American, Chicano
Yes, Puerto Rican
Yes, Cuban
Yes, another Hispanic, La no/a, or Spanish origin
What is the highest grade or year of school you completed? Less than 9th grade
9th to 12th grade, no diploma
High school graduate (includes GED)
Some college credit, no degree
Associate’s degree
Bachelor’s degree
Graduate or professional degree Are you currently… Employed, full- me (including self-employed)
Employed, part- me (including self-employed)
Out of work for 1 year or more
Out of work for less than 1 year
A Homemaker
A Student
Re red
Unable to work

HEALTHY CHICAGO 2.0
Informing Eff orts to Achieve Health Equity 98
What language do you speak most o en at home? English Spanish Polish Arabic Armenian Cambodian (Mon-Khmer) Chinese Creole French German Greek Gujara Hebrew Hindi Hmong Hungarian Italian Japanese Korean Lao an Navajo Persian Polish Portuguese Russian Scandinavian Serbo-Croa an Tagalog Thai Urdu Vietnamese Other, please specify
Which of the following best describes how you think of yourself?
Heterosexual or straight Homosexual, gay or lesbian Bisexual Other
How many adults 18 years of age or older live in your household (including yourself, if applicable)?
1 2 3 4 5
6 7 8 More Than 8
How many children less than 18 years of age live in your household (including yourself, if applicable)?
1 2 3 4 5
6 7 8 More Than 8
What is your annual household income from all sources? ] Less than $20,000 Between $20,000 and $39,999
Between $40,000 and $59,999 Between $60,000 and $79,999
Between $80,000 and $99,999 $100,000 and over Are you limited in conduc ng ac vi es of daily living because of any physical, mental, or emo onal condi on?
Yes No
Would you say that in general your health is:
Excellent Very good Good Fair Poor
Thank you for your par cipa on! Results will be posted on the Chicago Department of Public Health website (www.cityofchicago.org/health) and will be used to inform public health priori es. If you have ques ons about this survey or need technical assistance, please contact us at [email protected]. If you are interested in receiving regular updates on Healthy Chicago, please sign up for our mailing list here. [hyperlink to: h p://visitor.r20.constantcontact.com/manage/op n/ea?v=001jsw_pnV76tUmSNJOdEkYeA%253D%253D.] Your email will never be linked to your responses.
Thank you! Chicago Department of Public Health

HEALTHY CHICAGO 2.0
Community Health Assessment:99
APPENDIX 2B: FACILITATOR GUIDE FOR COMMUNITY CONVERSATIONS Logis cs/Materials needed:
• All Planning Team members assigned must arrive to the loca on 45 minutes prior to the session star ng
• Room must be organized in round tables/chairs
• Each table needs a stack of post it notes and pens
• Large post it paper and sharpies are needed for larger space
• Sign in sheet
• 3 microphones
To help guide our Healthy Chicago 2.0 health plan, CDPH wants to get community and stakeholder feedback on the health of Chicago and its communi es, especially vulnerable popula ons. We also want hear from you about future changes that could impact the Chicago’s health and the public health and healthcare system.
For Professionals
(1) From your experience, what are the issues (such as social-poli cal-economic and other trends) that may/will impact the health of Chicagoan s and the public health and health care systems?
a. What are the threats from these issues?
b. What are the opportuni es from these issues?
For Community Residents(Only to be used if more than 30% of the audience are community members rather than professional stakeholders)
(2) What are the a ributes of your neighborhood and Chicago that improve health and well-being? Prompt: What programs or policies help support these improvements? Prompt: What about those vulnerable popula ons that experience health dispari es?
(3) What are the barriers to achieving health and well-being in your neighborhood and in Chicago? Prompt: Why? What are some of the underlying causes of these? Prompt: What about special and vulnerable popula ons?
(4) What can we (public health system, communi es, businesses, etc.) do over the next 3-5 years to improve the health and well-being of you, your family, and your community?
Prompt: What can we do to specifi cally impact special and vulnerable popula ons?

HEALTHY CHICAGO 2.0
Informing Eff orts to Achieve Health Equity 100
APPENDIX 2C: FOCUS GROUP FACILITATOR GUIDE
FACILITATOR INTRODUCTION:
Thank you for par cipa ng in this discussion today. We are talking to groups of people across Chicago to be er understand what Chicago residents think and feel about their health and the health of their communi es. This research is part of a city-wide community health needs assessment conducted by the Chicago Department of Public Health to iden fy the health needs and assets of the Chicago residents. We are interested in knowing about what you think about what helps your family and community stay healthy and what things are barriers to being healthy. Please feel free to state your thoughts. We will not share your personal informa on that can iden fy you. Again, we are very interested in your thoughts and there are no right or wrong answers.
A Focus Group is a group discussion led by a moderator around a set of ques ons. I have the set of ques ons here in front of me to help guide the conversa on. We ask your permission to record the conversa on so that we can review the recording lat-er and iden fy themes that emerged within this focus group and across the other focus groups. In addi on to the use of digital recorders my colleague here [name of Assistant Moderator] may be taking some notes so that we can remember the conversa- on be er later. As I stated before, we will not use your name or any other iden fi ers that you share today.
GUIDELINES FOR FG:
For a focus group to go well we ask that: • Only one person speaks at the me (best for audio recording quality)
• We respect all opinions (it’s unlikely we will all agree on everything)
• There is no right or wrong answers or opinions
• Please respect one’s privacy
It is very important that you respect everyone’s privacy and confi den ality by not iden fying anyone par cipa ng in the ses-sion and by not repea ng the informa on shared with the group outside of this discussion.
Any ques ons or comments before we begin?
Date of Focus Group:
FG loca on:
Focus Group Moderators Name:
Assistant Moderators Name:
Number of par cipants:
Time of Focus Group: Start |__|__:__|__| End |__|__:__|__|

HEALTHY CHICAGO 2.0
Community Health Assessment:101
Let’s begin by introducing ourselves.
Would you please share with the group your fi rst name and how long you’ve lived in Chicago.
Great. So lets get started. I’m going to turn on the recorder now. I’ll let you know when I turn it off at the end of our discussion as well. Turn digital recorders on.
Today, when we are talking about health we’re using broad defi ni on of health that includes not just the absence of disease but about health as encompassing wellness, safety, mental and social health and factors in the community that infl uence health. These include factors in community itself, its surroundings and the people who live in the community and social or cultural infl uences of the residents of the community.
HEALTH ASSETSSo now thinking of this broad defi ni on of health what is healthy about your community?
PROBE: What do you like about your community? What are some things that support healthy living in Chicago?
The Chicago Department of Public Health is concerned with health equity, or fair opportuni es for all to be healthy.
HEALTH NEEDSThinking of health equity what are the biggest challenges to being healthy in your community?
PROBES: What are some barriers to being healthy in Chicago? When you think about the health of your community: What would you say is going well? What are the barriers to good health?
Describe ways in which your surroundings in your neighborhood impact the health of you and your neighbors? How?
FUTURE NEEDS AND ASSETS
What can be done in the next 3-5 years to improve the health of your community and the city?
PROBE: What are your sugges ons for making it easier to stay healthy?
What else do you think would be important for us to know related to the health of your community and the residents of Chicago? Thank you very much for your me. We appreciate your input and support of this community health needs assessment.

HEALTHY CHICAGO 2.0
Informing Eff orts to Achieve Health Equity 102
APPENDIX 2D: ORAL HISTORY FACILITATOR GUIDE
Step 1: “Pre Interview” and Data sheetInterviewer(s) describe the storytelling process and review the key questions topics they will beasking the storyteller. Ask the storyteller if there is anything they want to make sure they areasked about. If there’s anything they do NOT want to discuss, be respectful and avoid thatquestion/topic.All interviewers and storyteller(s) should complete a data sheet. This is for EACH story and EACHperson involved. Use black pen.Explain the introduction cue cardsExplain that you will have about 40 minutes to record the story. This will help you set the toneand schedule for the recording.
Step 2: Sound CheckThe assistant interviewer should check the sound.Put on headphones and hit “record pause”Interviewer asks the storyteller a question, e.g., what did you have for breakfast/lunch today?Assistant adjust so that volume is “green” and between 12 and 6.Monitor sound throughout the story and adjust as necessary.Interviewer and storyteller should keep about a fist’s length between mouth and microphoneMost important that the audio is best for the storyteller’s voice.
Step 3: Record storyHit “record”; you’ll know it’s recording when you see the numbers counting the secondsAssistant takes notes throughout the story and checks on audioInterviewer(s) introduce self using prompts on cue cardYour location is “Chicago, Illinois”Storyteller introduces self using prompts on cue cardInterviewer asks the first question
Step 4: Stop recording; complete Release Form(s) and Interview Keywords FromHit “stop”Required: complete a release form (generic), only need one per story, use black pen
Step 5: Wrap up the cords nicely, the way you found them – no kinks. Place in box. Return toJenn/Jeni.
Other details:If you need to take a break, hit “Stop”. Once you’re ready to start again, hit “record”.This will create a second audio track, but that is OK!If storyteller would like to use an alias or not share their name at all, they are allowed todo that. But still have them fill out a release form.
o If they don’t use their real name, it may be hard for others to find their story,though!
o If they use a nickname, but the nickname in quotes and also put their real name(if they allow it).

HEALTHY CHICAGO 2.0
Community Health Assessment:103
yStoryteller can decide not to have the story archived.
o If that happens, they do not sign the release formInterviewer holds the mic; assistant has on headphones and takes observational notes.You won’t “mess up” on the audio – just be yourself! If you say a question wrong, don’ttry and stop or rewind, just go with it.DON’T insert your opinion or feelings into the story. Use silent probes and bodylanguage as much as possible so that you don’t talk over the story.Plug in the recorder, but you can use double A batteries if needed.Place a post it with the day’s date on the cue card so that you don’t get tongue tied onthe audio!
Probes
1. What does living in Little Village community mean to you?2. How has your health needs and impacted your life?3. Describe your experience when seeking support or receiving services for health or social needs?4. Can you tell me a story that happened in your life that changed you?5. How has your work impacted your health?6. Tell me about a person who has made a positive difference in your life.

HEALTHY CHICAGO 2.0
Informing Eff orts to Achieve Health Equity 104
APPENDIX 3: MAPP HEALTH EQUITY SUPPLEMENT*
*Available at naccho.org

HEALTHY CHICAGO 2.0
Community Health Assessment:105
Mobilizing and Organizing Partners to Achieve Health Equity
“ Health equity is the realization by all people of the highest attainable level of health. Achieving health equity requires valuing all individuals and populations equally, and entails focused and ongoing societal efforts to address avoidable inequalities by ensuring the conditions for optimal health for all groups.”
—Adewale Troutman in Health Equity, Human Rights and Social Justice: Social Determinants as the Direction for Global Health
Achieving health equity requires collaboration, coordination, and collective action. The Mobilizing for Action through Planning and Partnerships (MAPP) process can help communities develop a culture of continuous collaborative health improvement that can guide them through this process. This supplement provides tools and resources for communities that seek to frame their MAPP process around health equity.
Addressing health inequities can be an ever-evolving, unpredictable process. Often, no right or wrong answer exists for how to achieve health equity. Communities may find themselves at different stages of readiness to tackle the complex questions and issues that underlie the root causes of health inequities.
Each MAPP community should consider its own expectations, goals, and vision as it undertakes health equity work and use the provided tools as appropriate. NACCHO staff and the MAPP Network (http://mappnetwork.naccho.org) are available as resources for MAPP and invite your thoughts and suggestions as you work in your communities on this process.
MAPP
HealthEquity

HEALTHY CHICAGO 2.0
Informing Eff orts to Achieve Health Equity 106
HealthEquity
How to Use this SupplementAll stages of the MAPP process can be conducted with a health equity frame. Accordingly, the pages in this supplement are meant to be integrated into your MAPP Handbook. The page numbers below show where each health equity page can be inserted into your book. For example, “Getting Started, page 6a,” can be inserted behind page 6 of your existing book.
Introduction • Getting Started (page 6a)
• Selecting a Facilitator (page 6b)
Phase 1 • Revisit Your Circle of Involvement (page 18a)
Phase 2 • Creating a Vision for Health Equity (page 38a)
Phase 3 • Community Health Status Assessment: Measuring Health Inequity (pages 56a-56b)
• Reflecting on Health Disparities and Health Inequity Data (page 68a)
• Local Public Health System Assessment: System Contributions to Assuring Health Equity (pages 72a-72d)
• Forces of Change Assessment: Identify Forces that Affect Health Equity (page 76a)
Phase 4 • Identifying Strategic Health Equity Issues (page 88a)
• Identifying Root Causes of Health Inequity (page 92a)
Phase 5 • Developing Health Equity Strategic Issues, Goals, and Strategies (page 104a)
Phase 6 • An Action Cycle for Achieving Health Equity (page 118a)
Health Equity References
• Page 136a
ACKNOWLEDGMENTS: This manual is made possible by the Centers for Disease Control and Prevention: Office for State, Tribal, Local and Territorial Support and the Health Resources and Services Administration. Its contents are solely the responsibility of NACCHO and do not necessarily represent the official views of the funders.
HEALTHY CHICAGO 2.0
Community Health Assessment:107
6aMobilizing for Action through Planning and Partnerships (MAPP): User’s Handbook
Mobilizing and Organizing Partners to Achieve Health EquityHealthEquity
Health Equity in MAPPAchieving health equity involves identifying, preventing, and reversing the effects of patterned decisions, policies, investments, rules, and laws that have caused social and economic inequities that affect people’s abilities to live healthy lives.
Using a Health Equity Frame The way people interpret and organize information influences the way they define a problem and how they devise strategies to solve it. As people work on protecting and preserving the public’s health, they may not realize that they are influenced by certain values, assumptions, and perspectives. Frames define the following:
• Legitimate and trustworthy sources of knowledge;
• Which research questions people pursue or ignore (e.g., do we study the poor, or do we study which policies produce poverty?);
• The attribution of responsibility for health or illness (To individuals? Or systems?);
• Appropriate targets for policy; and
• How and where to use resources.
Questions are never neutral. Rather, people apply frames that influence the questions they ask. Questions are posed within specific social, political, historical, and cultural contexts. Questions are often driven by institutional agendas, values, and priorities that may or may not address community members’ needs and wants.
Health inequities are “differences in population health status and mortality rates that are systemic, patterned, unfair,
unjust, and actionable, as opposed to random or caused by
those who become ill.”—Margaret Whitehead in
The Concepts and Principles of
Equity and Health
“Health equity is the realization by all people of the highest attainable level
of health. Achieving health equity requires valuing all individuals and populations equally and entails focused and ongoing societal efforts to address avoidable inequalities by ensuring the conditions
for optimal health for all groups, particularly those who have experienced historical or contemporary
injustices or socioeconomic disadvantage.”
—Adewale Troutman in Health Equity, Human Rights
and Social Justice: Social Determinants
as the Direction for Global Health

HEALTHY CHICAGO 2.0
Informing Eff orts to Achieve Health Equity 108
10aMobilizing for Action through Planning and Partnerships (MAPP): User’s Handbook
PH
AS
E O
NE
: Org
an
ize
for S
uc
ce
ss
/Pa
rtne
rsh
ip D
ev
elo
pm
en
tSelecting a Facilitator
HealthEquity
Communities can use facilitators throughout the Mobilizing for Action through Planning and Partnerships (MAPP) process to help guide group discussions. Discussions that identify sources of health inequity can be difficult to facilitate. People may feel uncomfortable discussing racism, classism, and gender inequity. Some people might feel personally attacked or responsible, while others might deny inequities exist. People might feel the problem is outside their control or too much to tackle. They may find it easier to maintain and not challenge the status quo.
A skilled facilitator brings attention to emotions, contradictions, and discomfort that often arise when discussing the root causes of health inequity and uses the tensions to identify systemic, structural, and institutional changes that can result in health equity. When selecting a facilitator, consider someone who can skillfully do the following:
• Communicate a health equity approach to community health improvement;
• Establish rules that ensure a safe place for discussion;
• Reflectively listen and create space for participants to contemplate emotional or controversial ideas and use participant reflection to bring a group to a new level of awareness of the root causes of health inequity;
• Identify tensions in the room and use the discomfort to uncover new information;
• Assess power dynamics in a room and structure conversation to prevent power dynamics from stifling participation from those with less power;
• Design a process that encourages those who are not comfortable discussing difficult topics in public a way to contribute to the discussion;
• Reinforces a health equity frame and critical thinking and analysis;
• Uncover contradictory or competing perceptions of health equity and develop a common understanding of health equity among participants; and
• Focus conversations on equality as opposed to remediating health problems with more programs and activities.
Resources for Understanding Health EquityThe following resources may help communities as they seek to achieve health equity. These tools can help individuals and groups develop a common framework for understanding health equity and facilitate meaningful dialogue about the root causes of health inequity.
Assessing Readiness for Addressing Health Inequities
Community partners can use the Organizational Self-Assessment for Addressing Health Inequities Toolkit developed by the Bay Area Regional Health Inequities Initiative (http://barhii.org/resources/toolkit.html) to determine if they are ready to address health inequities. The toolkit helps organizations identify the skills, practices, and infrastructure needed to achieve health equity.
Roots of Health Inequity Web-Based Course
Communities can use the Roots of Health Inequity Web-Based Course (http://www.rootsofhealthinequity.org/) to educate public health leaders. The course includes interactive content, case studies, questions for reflection and group discussion. MAPP participants can use the course to develop a common framework for understanding health equity.
Unnatural Causes Dialogue
Many communities have screened the Unnatural Causes documentary series (http://www.unnaturalcauses.org/) and facilitated community dialogues to increase awareness and better understand the root causes of health inequity in their communities. California Newsreel, the organization that produced the documentary series, provides a discussion guide on its website to help people digest, reflect, and apply the knowledge that is gained from viewing the documentary series.
The Raising of America
The makers of Unnatural Causes will release The Raising of America in fall 2014. This documentary series will encourage viewers to facilitate dialogue about improving early child health and development to create a healthier, more prosperous, and more equitable nation. The series’ website (http://www.raisingofamerica.org/) provides tools to promote community engagement and discussion.
HEALTHY CHICAGO 2.0
Community Health Assessment:109
WORKSHEET: Circles of InvolvementDeveloping Key Relationships for Implementation
18a
PH
AS
E O
NE
: Org
an
ize
for S
uc
ce
ss
/Pa
rtne
rsh
ip D
ev
elo
pm
en
t
Mobilizing for Action through Planning and Partnerships (MAPP): User’s Handbook
HealthEquity
To identify, communicate, and develop strategies to achieve health equity, you need to mobilize and organize the right people. Reference the individuals, groups, and organizations you have included in your Circle of Involvement worksheet.
Ask members of the MAPP Core Group whether your Circle of Involvement includes the following:
• Population groups that are affected by decisions, policies, investments, rules, and laws that have compromised their abilities to live healthy lives. These groups include people who are the subject of racism, gender inequity, and class exploitation;
• People who have knowledge about the structure of power and patterns of decisions, policies, investments, rules, and laws that have caused health inequity;
• Groups that can influence processes that can combat, reverse, and prevent decisions, policies, investments, rules, and laws that have caused health inequity;
• People who know how to measure social, economic, and health inequities;
• Groups that can communicate the causes of health inequities in a way that inspires people to work on achieving health equity; and
• People who can facilitate productive discussions about health inequities that result in strategies and collaborative action.
Engage individuals and groups that are committed to achieving social justice and health equity, have power and influence in the community, and can be allies in an equitable partnership. Examples of groups that could have representation in your Circle of Involvement include the following:
• Civil rights organizations;
• Labor organizations;
• Organizations representing minority groups, including religious minorities, immigrant populations, and English as a foreign language groups;
• Housing authorities and service providers for the homeless;
• Community development organizations;
• Community organizing groups;
• Women’s rights organizations;
• Gay, lesbian, bisexual, transgender organizations;
• Child advocacy groups;
• Developmental and physical disability rights organizations;
• Mental health advocacy organizations; and
• Organizations dedicated to transparency, accountability, representation, participation, and inclusiveness in democracy.
Revisit Your Circle of Involvement

HEALTHY CHICAGO 2.0
Informing Eff orts to Achieve Health Equity 110
In Ingham County, Michigan, the health department
convened staff dialogues to ask questions like, “If Ingham
County were to address racism in a meaningful way, internally
or externally, what would it look like?”
Creating a Vision for Health Equity
Mobilizing for Action through Planning and Partnerships (MAPP): User’s Handbook
PH
AS
E T
W0
: Vis
ion
ing
38a
HealthEquity
MAPP Communities can create vision statements that aim to achieve health equity. When planning a visioning event, consider asking participants the following visioning questions:
• What does an equitable community look like to you?
• What would be different in our community if all people had circumstances in which they could live healthy and flourishing lives?
• What would institutions (e.g., local health departments, schools, prisons, hospitals, corporations) do differently if they contributed to a more equitable community?
• What would our community look like if all people and groups were equally represented in positions of power and decision-making?
• In five years, if our community successfully worked towards achieving health equity, what would we have accomplished?
• If our community were nationally recognized as an equitable place to live, what would people say?
Also consider asking the following questions to generate value statements that will guide your collaborative process:
• What must be in place to ensure our MAPP process is equitable, transparent, accessible, and inclusive, particularly of those affected by inequity?
• What values must we uphold to ensure equitable participation?
• How do we ensure we do not inadvertently create, contribute, or support decisions, policies, investments, rules, and laws that contribute to health inequities?
• How do we ensure the community drives and owns the process?
• How do we ensure we can share power to those affected by inequity?
Brainwriting is a technique that can help foster
participation among all members in a group. After providing a prompt, ask
each person to reflect and write his or her ideas on a sheet of paper without
talking. After a limited amount of time, have people pass their papers to
another person. Each person will then review the previous person’s ideas and add to their thoughts.
Repeat the process several times.

HEALTHY CHICAGO 2.0
Community Health Assessment:111
Community Health Status Assessment: Measuring Health Inequity
Mobilizing for Action through Planning and Partnerships (MAPP): User’s Handbook
PH
AS
E T
HR
EE
: Fo
ur M
AP
P A
ss
es
sm
en
ts
56a
HealthEquity
Several approaches exist for exploring and documenting areas of health inequity as part of the Community Health Status Assessment. All three of the following strategies should be used to identify patterns of health inequity in a community.
1. Cross-Tabulations that Measure Health Disparities
Health disparities are differences in health status. The term “health disparities” is not the same as “health equity.” “Health disparities” describes simply differences in health outcomes among groups and does not describe the reasons why differences in health status exist. Still, information about health disparities can provide insight on health inequities depending on how the data are analyzed and discussed.
Cross-tabulations can be used to identify differences in health status among different groups. For instance, you can collect data on cardiovascular disease prevalence. You can also collect data on race and gender. You can then use cross-tabulations to see if there are differences in the prevalence of cardiovascular disease based on race and gender.
White Black Hispanic/Latino Asian-Pacific Islander
Native Indian/Alaska Native
Male Female Male Female Male Female Male Female Male FemalePrevalence of diabetes in the countyInfant mortality ratePrevalence of youth violence
Unemployed Employed, part-time Employed, full-time
Male Female Male Female Male FemalePrevalence of heart disease
Examples of data that should be collected and used in cross-tabulations to identify health disparities include the following:• Income;• Race;• Ethnicity;• Immigration status;• Gender;• Sexual identity;• Education;• Age;• Employment status; and• Homeownership and housing status.
These categories represent segments of your population that may experience different health outcomes. Comparing the health status of subgroups to those with the worst, the best, or the average or median health status can give you insight into groups affected by inequity. You can also compare subgroup health status with targets such as Healthy People 2020 objectives.
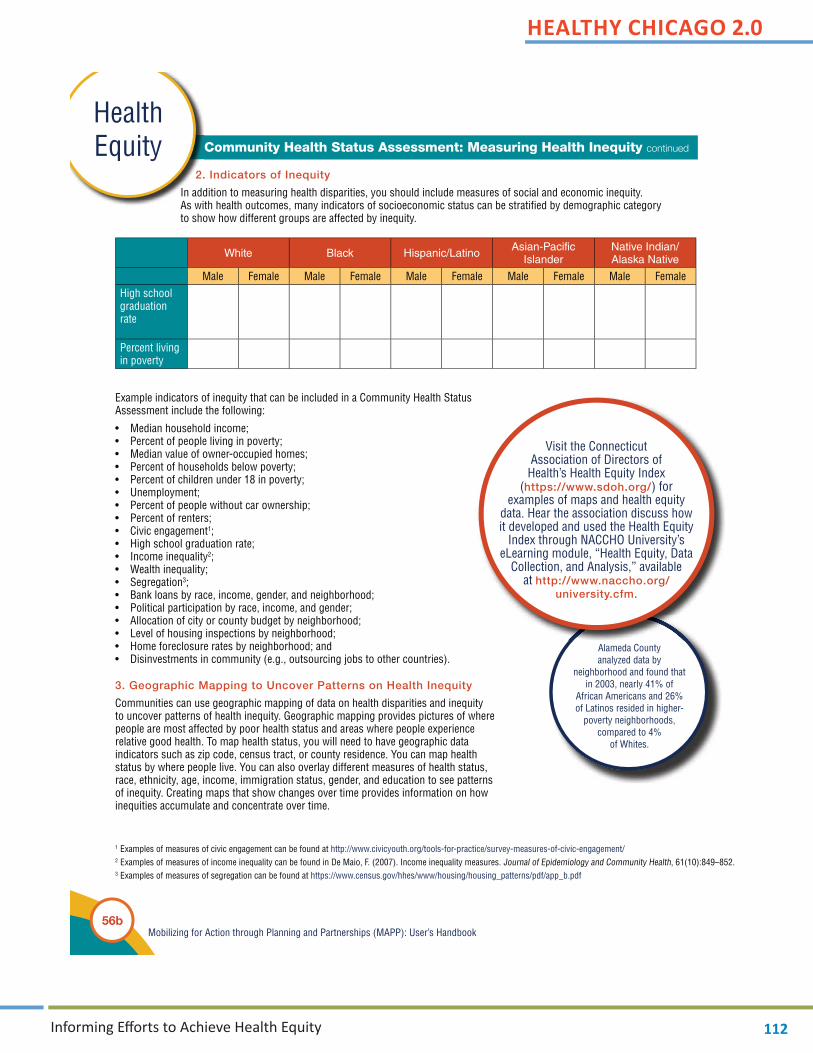
HEALTHY CHICAGO 2.0
Informing Eff orts to Achieve Health Equity 112
Mobilizing for Action through Planning and Partnerships (MAPP): User’s Handbook56b
Community Health Status Assessment: Measuring Health Inequity continued
HealthEquity
2. Indicators of Inequity
In addition to measuring health disparities, you should include measures of social and economic inequity. As with health outcomes, many indicators of socioeconomic status can be stratified by demographic category to show how different groups are affected by inequity.
White Black Hispanic/Latino Asian-Pacific Islander
Native Indian/Alaska Native
Male Female Male Female Male Female Male Female Male FemaleHigh school graduation rate
Percent living in poverty
1 Examples of measures of civic engagement can be found at http://www.civicyouth.org/tools-for-practice/survey-measures-of-civic-engagement/ 2 Examples of measures of income inequality can be found in De Maio, F. (2007). Income inequality measures. Journal of Epidemiology and Community Health, 61(10):849–852.3 Examples of measures of segregation can be found at https://www.census.gov/hhes/www/housing/housing_patterns/pdf/app_b.pdf
Alameda County analyzed data by
neighborhood and found that in 2003, nearly 41% of
African Americans and 26% of Latinos resided in higher-
poverty neighborhoods, compared to 4%
of Whites.
Visit the Connecticut Association of Directors of Health’s Health Equity Index
(https://www.sdoh.org/) for examples of maps and health equity
data. Hear the association discuss how it developed and used the Health Equity
Index through NACCHO University’s eLearning module, “Health Equity, Data
Collection, and Analysis,” available at http://www.naccho.org/
university.cfm.
Example indicators of inequity that can be included in a Community Health Status Assessment include the following:
• Median household income;• of people living in poverty;• Median value of owner-occupied homes;• of households below poverty;• of children under 18 in poverty;• Unemployment;• of people without car ownership;• of renters;• Civic engagement1;• High school graduation rate;• Income inequality2;• Wealth inequality;• Segregation3;• Bank loans by race, income, gender, and neighborhood;• Political participation by race, income, and gender;• Allocation of city or county budget by neighborhood;• Level of housing inspections by neighborhood;• Home foreclosure rates by neighborhood; and• Disinvestments in community (e.g., outsourcing jobs to other countries).
3. Geographic Mapping to Uncover Patterns on Health Inequity
Communities can use geographic mapping of data on health disparities and inequity to uncover patterns of health inequity. Geographic mapping provides pictures of where people are most affected by poor health status and areas where people experience relative good health. To map health status, you will need to have geographic data indicators such as zip code, census tract, or county residence. You can map health status by where people live. You can also overlay different measures of health status, race, ethnicity, age, income, immigration status, gender, and education to see patterns of inequity. Creating maps that show changes over time provides information on how inequities accumulate and concentrate over time.
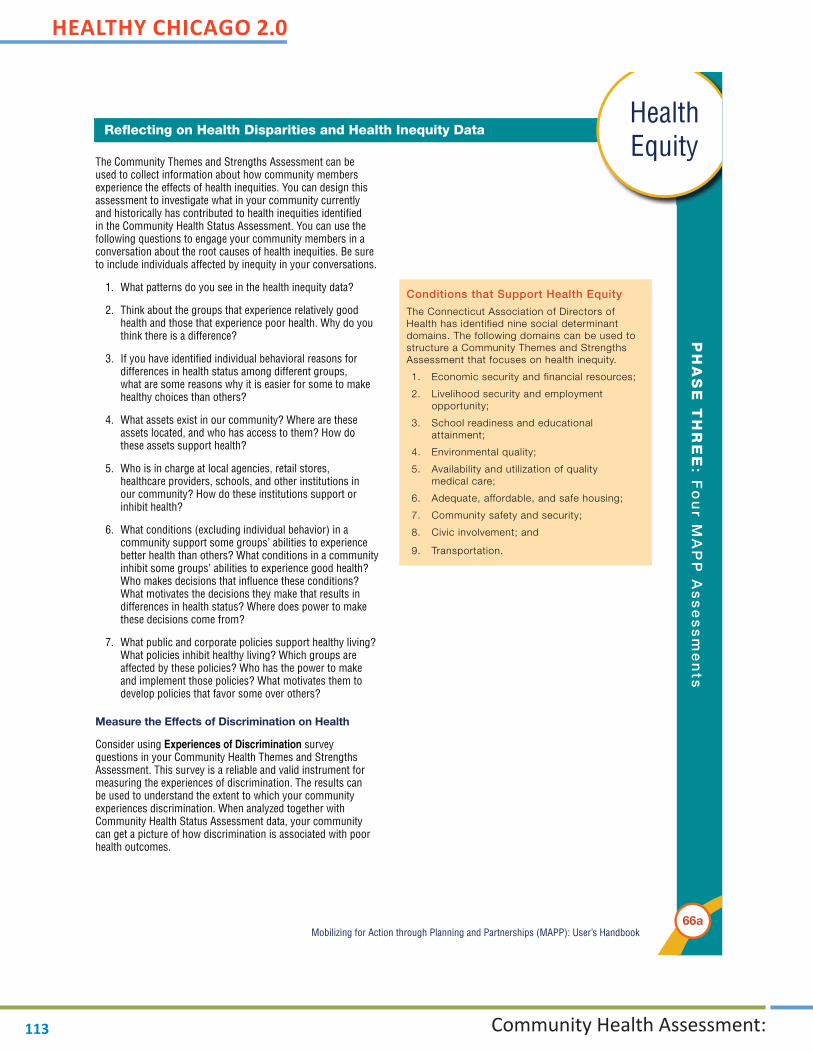
HEALTHY CHICAGO 2.0
Community Health Assessment:113
Reflecting on Health Disparities and Health Inequity DataP
HA
SE
TH
RE
E: F
ou
r MA
PP
As
se
ss
me
nts
66aMobilizing for Action through Planning and Partnerships (MAPP): User’s Handbook
HealthEquity
The Community Themes and Strengths Assessment can be used to collect information about how community members experience the effects of health inequities. You can design this assessment to investigate what in your community currently and historically has contributed to health inequities identified in the Community Health Status Assessment. You can use the following questions to engage your community members in a conversation about the root causes of health inequities. Be sure to include individuals affected by inequity in your conversations.
1. What patterns do you see in the health inequity data?
2. Think about the groups that experience relatively good health and those that experience poor health. Why do you think there is a difference?
3. If you have identified individual behavioral reasons for differences in health status among different groups, what are some reasons why it is easier for some to make healthy choices than others?
4. What assets exist in our community? Where are these assets located, and who has access to them? How do these assets support health?
5. Who is in charge at local agencies, retail stores, healthcare providers, schools, and other institutions in our community? How do these institutions support or inhibit health?
6. What conditions (excluding individual behavior) in a community support some groups’ abilities to experience better health than others? What conditions in a community inhibit some groups’ abilities to experience good health? Who makes decisions that influence these conditions? What motivates the decisions they make that results in differences in health status? Where does power to make these decisions come from?
7. What public and corporate policies support healthy living? What policies inhibit healthy living? Which groups are affected by these policies? Who has the power to make and implement those policies? What motivates them to develop policies that favor some over others?
Measure the Effects of Discrimination on Health
Consider using Experiences of Discrimination survey questions in your Community Health Themes and Strengths Assessment. This survey is a reliable and valid instrument for measuring the experiences of discrimination. The results can be used to understand the extent to which your community experiences discrimination. When analyzed together with Community Health Status Assessment data, your community can get a picture of how discrimination is associated with poor health outcomes.
Conditions that Support Health Equity
The Connecticut Association of Directors of
Health has identified nine social determinant
domains. The following domains can be used to
structure a Community Themes and Strengths
Assessment that focuses on health inequity.
1. Economic security and financial resources;
2. Livelihood security and employment
opportunity;
3. School readiness and educational
attainment;
4. Environmental quality;
5. Availability and utilization of quality
medical care;
6. Adequate, affordable, and safe housing;
7. Community safety and security;
8. Civic involvement; and
9. Transportation.

HEALTHY CHICAGO 2.0
Informing Eff orts to Achieve Health Equity 114
Local Public Health System Assessment continued
System Contributions to Assuring Health Equity
PH
AS
E T
HR
EE
: Fo
ur M
AP
P A
ss
es
sm
en
ts
72aMobilizing for Action through Planning and Partnerships (MAPP): User’s Handbook
HealthEquity
When completing the Local Public Health System (LPHS) Assessment using the National Public Health Performance Standards (NPHPS) Instrument, your group can reframe questions about essential service delivery to identify how well the LPHS acknowledges and addresses health inequities. The following questions provide examples of how the instrument can be revised to focus on health equity.
Essential Public Health Service 1: Monitoring Health Status
At what level does the LPHS…
• Conduct a community health assessment that includes indicators intended to monitor differences in health and wellness across populations, according to race, ethnicity, age, income, immigration status, sexual identify, education, gender, and neighborhood?
No Activity Minimal Moderate Significant Optimal
• Monitor social and economic conditions that affect health in the community, as well as institutional practices and policies that generate those conditions?
No Activity Minimal Moderate Significant Optimal
Essential Public Health Service 2: Diagnosing and Investigating Health Problems
At what level does the LPHS…
• Operate or participate in surveillance systems designed to monitor health inequities and identify the social determinants of health inequities specific to the jurisdiction and across several of its communities?
No Activity Minimal Moderate Significant Optimal
• Collect reportable disease information from community health professionals about health inequities?
No Activity Minimal Moderate Significant Optimal
• Have the necessary resources to collect information about specific health inequities and investigate the social determinants of health inequities?
No Activity Minimal Moderate Significant Optimal
Essential Public Health Service 3: Inform, Educate, and Empower People about Health Issues
At what level does the LPHS…
• Provide the general public, policymakers, and public and private stakeholders with information about health inequities and the impact of government and private sector decision-making on historically marginalized communities?
No Activity Minimal Moderate Significant Optimal
• Provide information about community health status (e.g., heart disease rates, cancer rates, and environmental risks) and community health needs in the context of health equity and social justice?
No Activity Minimal Moderate Significant Optimal

HEALTHY CHICAGO 2.0
Community Health Assessment:115
Mobilizing for Action through Planning and Partnerships (MAPP): User’s Handbook72b
HealthEquity
Local Public Health System Assessment continued
• Plan and conduct health promotion and education campaigns that are appropriate to culture, age, language, gender, socioeconomic status, race/ethnicity, and sexual orientation?
No Activity Minimal Moderate Significant Optimal
• Plan campaigns that identify the structural determinants of health inequities and the social determinants of health inequities (rather than focusing solely on individuals’ health behaviors and decision-making)?
No Activity Minimal Moderate Significant Optimal
Essential Public Health Service 4: Mobilizing Community Partnerships to Identify and Solve Health Problems
At what level does the LPHS…• Have a process for identifying and engaging key constituents and participants that recognizes and
supports differences among groups?
No Activity Minimal Moderate Significant Optimal
• Provide institutional means for community-based organizations and individual community members to participate fully in decision-making?
No Activity Minimal Moderate Significant Optimal
• Provide community members with access to community health data?
No Activity Minimal Moderate Significant Optimal
Essential Public Health Service 5: Developing Policies and Plans that Support Individual Community Health Efforts
At what level does the LPHS…• Ensure that community-based organizations and individual community members have a substantive
role in deciding what policies, procedures, rules, and practices govern community heath efforts?
No Activity Minimal Moderate Significant Optimal
Essential Public Health Service 6: Enforce Laws and Regulations that Protect Health and Ensure Safety
At what level does the LPHS…• Identify local public health issues that have a disproportionate impact on historically marginalized
communities (that are not adequately addressed through existing laws, regulations, and ordinances)?
No Activity Minimal Moderate Significant Optimal
System Contributions to Assuring Health Equity

HEALTHY CHICAGO 2.0
Informing Eff orts to Achieve Health Equity 116
Local Public Health System Assessment continued
System Contributions to Assuring Health Equity
PH
AS
E T
HR
EE
: Fo
ur M
AP
P A
ss
es
sm
en
ts
72cMobilizing for Action through Planning and Partnerships (MAPP): User’s Handbook
HealthEquity
Essential Public Health Service 7: Link People to Needed Personal Health Services
At what level does the LPHS…• Identify any populations that may experience barriers to personal health services based on factors
such as on age, education level, income, language barriers, race or ethnicity, disability, mental illness, access to insurance, sexual orientation and gender identity, and additional identities outlined in Model Standard 7.1?
No Activity Minimal Moderate Significant Optimal
• Identify the means through which historical social injustices specific to the jurisdiction (e.g., the inequitable distribution health services and transportation resources) may influence access to personal health services?
No Activity Minimal Moderate Significant Optimal
• Work to influence laws, policies, and practices that maintain inequitable distributions of resources that may influence access to personal health services?
No Activity Minimal Moderate Significant Optimal
Essential Public Health Service 8: Assure a Competent and Personal Health Care Workforce
At what level does the LPHS…• Conduct assessments related to developing staff capacity and improving organizational functioning
to support health equity initiatives?
No Activity Minimal Moderate Significant Optimal
• Identify staff perspectives on the facilitators and barriers to addressing health equity initiatives?
No Activity Minimal Moderate Significant Optimal
• Include staff members that are often excluded from planning and organizational decision-making processes in workforce assessments?
No Activity Minimal Moderate Significant Optimal
• Recruit and train staff members from multidisciplinary backgrounds that are committed to achieving health equity?
No Activity Minimal Moderate Significant Optimal
• Recruit and train staff members that reflect the communities they serve?
No Activity Minimal Moderate Significant Optimal

HEALTHY CHICAGO 2.0
Community Health Assessment:117
System Contributions to Assuring Health Equity
Mobilizing for Action through Planning and Partnerships (MAPP): User’s Handbook72d
HealthEquity
Local Public Health System Assessment continued
Essential Public Health Service 9: Evaluate the Effectiveness, Accessibility, and Quality of Personal and Population-Based Health Services
At what level does the LPHS…• Identify community organizations or entities that contribute to the delivery of the Essential Public
Health Services to historically marginalized communities?
No Activity Minimal Moderate Significant Optimal
• Monitor the delivery of the Essential Public Health Services to ensure that they are equitably distributed?
No Activity Minimal Moderate Significant Optimal
Essential Public Health Service 10: Research for New Insights and Innovative Solutions to Health Problems
At what level does the LPHS…• Encourage staff, research organizations, and community members to explore the root causes of
health inequity, including solutions based on research identifying the health impact of structural racism, gender and class inequity, social exclusion, and power differentials?
No Activity Minimal Moderate Significant Optimal
• Share information and strategize with other organizations invested in eliminating health inequity?
No Activity Minimal Moderate Significant Optimal
• Use Health Equity Impact Assessments to analyze the potential impact of local policies, practices, and policy changes on historically marginalized communities?
No Activity Minimal Moderate Significant Optimal
• Facilitate substantive community participation in the development and implementation of research about the relationships between structural social injustices and health status?
No Activity Minimal Moderate Significant Optimal

HEALTHY CHICAGO 2.0
Informing Eff orts to Achieve Health Equity 118
PH
AS
E T
HR
EE
: Fo
ur M
AP
P A
ss
es
sm
en
ts
76aMobilizing for Action through Planning and Partnerships (MAPP): User’s Handbook
WORKSHEET: Forces of Change Brainstorming HealthEquity
Forces of Change Assessment: Identify Forces that Affect Health Equity
Questions to Identify Forces
Powerful organized interests develop structures and support policies and practices that can either contribute to health equity or cause health inequities. The following questions can be answered during the Forces of Change Assessment to identify these forces, opportunities, and threats.
What patterns of decisions, policies, investments, rules, and laws affect the health of our community?
Who benefits from these decisions, policies, investments, rules, and laws?
Whom do these decisions, policies, investments, rules, and laws harm?
Who or what institutions have the power to create, enforce, implement, and change these decisions, policies, investments, rules, and laws?
What interests support or oppose actions that contribute to health inequity?
What opportunities exist to influence decisions, policies, investments, rules, and laws to benefit all groups?
What forces now and in the future can reinforce health inequity in our community? How can we mitigate or prevent these forces?
What forces now and in the future can reinforce health equity in our community? How can we take advantage of these forces?
When posing these questions, be sure to include people that are affected by health inequity.

HEALTHY CHICAGO 2.0
Community Health Assessment:119
Identifying Strategic Issues to Address Health Equity
Mobilizing for Action through Planning and Partnerships (MAPP): User’s Handbook
PH
AS
E F
OU
R: Id
en
tify S
trate
gic
Iss
ue
s
88a
HealthEquity
As you develop strategic issues, remember that questions are never neutral. Rather, people apply frames that influence the questions they ask. They are posed within specific social, political, historical, and cultural contexts. Questions are often driven by institutional agendas, values, and priorities that may or may not address community members’ needs and wants.
The following table contrasts conventional and health equity questions that can be used to understand public health problems and identify potential solutions. When analyzing data from the MAPP Assessments to identify strategic issues, use a health equity frame to ask your community these questions.
CONVENTIONAL APPROACH HEALTH EQUITY APPROACH
Why are people unhealthy in our community? What social conditions and economic policies make some people more likely to be unhealthy?
Why can’t vulnerable populations access services? What institutional policies and practices prevent people from accessing services?
What types of services and resources do we need to improve health?
What fundamental policy changes do we need?
How do we reduce disparities in health outcomes? How do we eliminate the social injustices that produce inequities in health outcomes?
What programs and services do we need to address health disparities?
What kind of collective action and structural social changes do we need to tackle health inequities?
What unhealthy behaviors should we discourage among vulnerable populations?
What interests and power structures affect people’s health and wellness?
Which government officials, expert researchers, or media personalities best understand the issue?
Which community members and grassroots organizations can best define the issue?
Which public officials and research institutions will decide on appropriate courses of action?
How can we work within our communities to define and prioritize public health concerns?
How can we make people more responsible for their own health?
How can we create social responsibility and public accountability to protect the public good?

HEALTHY CHICAGO 2.0
Informing Eff orts to Achieve Health Equity 120
Health Outcomes &
Health Equity
Social & Econom
ic Inequities
Laws, Regulations,
& Policies
Conditions in the Com
munity
Access to ServicesIndividual Behavior &
Risk Factors
Identifyin
g R
oot C
ause
s of H
ealth
Inequity
HealthEquity
Ask comm
unity mem
bers to review data from
the four MAPP Assessm
ents. Ask them to m
ap the data to show w
hat they learned about relationships am
ong the following:
• Health outcom
es and health equity (from Com
munity Health Status Assessm
ent);
• Individual behavior and risk factors (from
Comm
unity Health Status Assessment);
• Access to services (from
Local Public Health System Assessm
ent);
• Conditions in the com
munity (from
Comm
unity Themes and Strengths Assessm
ent);
• Law
, regulations, and policies (from Local Public Health System
Assessment and Com
munity Them
es and Strengths Assessment); and
• Social and econom
ic inequities (from Com
munity Health Status Assessm
ent and Comm
unity Themes Assessm
ent).
Ask your comm
unity mem
bers to share how social and econom
ic inequities affect how law
s, regulations, and policies decisions are made and how
those decisions shape the conditions in the com
munity that affect how
people can access services, engage in healthy living, and maxim
ize their health outcomes.
Mobilizing for Action through Planning and Partnerships (MAPP): User’s Handbook92a

HEALTHY CHICAGO 2.0
Community Health Assessment:121
Given what group members share, ask them what fundamentally has to change in the community to achieve health equity. Fundamental change may be in the form of the following:
• Policies, laws, and decision-making processes;
• Redistribution of power in decision-making;
• Reallocation of resources;
• Transparency in decision-making processes that support social and economic equity;
• Mobilizing, engaging, and sharing power and resources with those affected by inequity; and
• Accountability in decision-making.
Use information from the discussion to develop strategic issues, goals, and strategies.
Example of a Health Equity Strategic Issue, Goal, and Strategy
Strategic Issue:How can the public health community address shortened life spans and inferior quality of life for communities of color and poor communities?
Goal:Prevent land use policies that expose neighborhoods and community members to environmental hazards, displacement, and sprawl.
Strategy:Forge relationships with social movements rooted in developed coalitions and provide technical assistance that fuels advocacy.
Mobilizing for Action through Planning and Partnerships (MAPP): User’s Handbook
PH
AS
E F
IVE
: Fo
rmu
late
Go
als
an
d S
trate
gie
s
104a
Developing Health Equity Strategic Issues, Goals, and Strategies
HealthEquity
In the rural community of Mound Bayou, Mississippi, the
Delta Health Center helped establish a bank branch where local black
community members were hired as tellers and supervisors.
As a result, racial discrimination in mortgage lending decreased.

HEALTHY CHICAGO 2.0
Informing Eff orts to Achieve Health Equity 122
Mobilizing for Action through Planning and Partnerships (MAPP): User’s Handbook
PH
AS
E S
IX: A
ctio
n C
yc
le
118a
When identifying actions for achieving health equity, remember to use a health equity frame and the data about health inequities collected in the MAPP Assessment phase. The table below contrasts remedial actions that do not address root causes of inequity with actions that investigate, reverse, or prevent the causes of health inequity.
Remedial Actions Health Equity Actions
Track health outcomes by county Track the accumulation of health-harming conditions and decision processes that produce those conditions
Treat or repair people’s health and life conditions Tackle negative life conditions with the goal of permanent social change to prevent reproduction of conditions
Support subsidies for low-income housing Oppose discriminatory housing practices and gentrification that causes displacement
Regulate permissible levels of toxic chemicals Limit the production of toxic chemicals and disproportionate burden on communities of color
Provide inhalers and clinical services to those communities with high asthma rates
Prevent the predominant location of polluting sites in communities of color and communities with low income levels
An Action Cycle for Achieving Health Equity
HealthEquity

HEALTHY CHICAGO 2.0
Community Health Assessment:123
136aMobilizing for Action through Planning and Partnerships (MAPP): User’s Handbook
RE
FE
RE
NC
ES
HEALTH EQUITY REFERENCES
De Maio, F. (2007). Income inequality measures. Journal of Epidemiology and Community Health, 61(10):849–852.
Hofrichter, R. and Bhatia, R. (eds.). (2010). Tackling health inequities through public health practice. New York: Oxford University Press.
Iceland, J., Weinberg, D., and Steinmetz, E. (2002). Racial and ethnic residential segregation in the United States: 1980–2000. U.S. Census Bureau.
Krieger, N., Smith, K., Naishadham, D., Hartman, C., and Barbeau, E. (2005). Experiences of discrimination: Validity and reliability of a self-report measure for population health research on racism and health. Social Science and Medicine, 61(7):1,576–1,596.
Brennan Ramirez, L., Baker, E., and Metzler, M. (2008). Promoting health equity: A resource to help communities address social determinants of health. Atlanta: Department of Health and Human Services, Centers for Disease Control and Prevention.
The Center for Information & Research on Civic Learning and Engagement. (2010). Survey measures of civic engagement. Accessed Aug. 1, 2014, from http://www.civicyouth.org/tools-for-practice/survey-measures-of-civic-engagement/
Treuhaft, S. (2009). Community mapping for health equity advocacy. Available at http://www.bostonalliance.org/wprs/wp-content/uploads/2012/02/community-mapping-for-health-equity-advocacy.pdf
Troutman, A. n.d. Health equity, human rights and social justice: Social Determinants as the direction for global health. Accessed Aug. 1, 2014, from http://urbanhealth.jhu.edu/_pdfs/sdh_placeandhealth_4_troutman%20hopkins%202013.pdf
Whitehead, M. (1992). The concepts and principles of equity and health. International Journal of Health Services, 22(3):429–445.
rk:
HealthEquity


