37 3 Portfolio models If you asked most business owners and managers what they would consider to be the most logical strategy direction in which to take the business, the answer would be growth in the majority of cases. Indeed, no matter what the size of the business, this is probably correct, as, if a business does not grow over time, it is likely to fail. This holds true for both separate businesses and strategic business units (SBUs; see ‘The planning process’ in Chapter 1, page 5). However, growth is not always the best option. In markets where the intensity of competition makes it too costly to be able to compete profitably, or in markets that are nearing the mature stage of the product/market life cycle, growth is least likely to be the best direction for most, but not necessarily all, businesses. While deciding the strategic direction, the manager/decision-maker must also decide the level of resources to commit to the chosen strategic direction. To make the best decisions regarding strategic direction and the level of resources to commit, the manager/decision-maker needs to have a good knowledge of the market, the competitive environment, the business environment and the business itself. As we saw in Chapter 1, such decisions are part of the ongoing planning process, but are not always made at a level where the knowledge required to make the best decision is available first-hand. For small and medium-sized businesses, where the decision-makers are involved in the daily running and operation of the business, the knowledge is, or should be, readily available so appropriate decisions can be made. However, it becomes a far more difficult situation in medium to large businesses, where the decision-makers are somewhat separated from the business operations. These decision-makers need to rely on advice from a variety of sources, including operational managers, to make decisions that may be critical to the ongoing success of the business as a whole. This process becomes increasingly difficult as the business becomes larger, more layers are created between the decision-makers and the operational levels, and more diverse geographic markets (up to global) are entered.
Transcript
37
3Portfolio models
If you asked most business owners and managers what they would consider to be themost logical strategy direction in which to take the business, the answer would begrowth in the majority of cases. Indeed, no matter what the size of the business, this isprobably correct, as, if a business does not grow over time, it is likely to fail. This holdstrue for both separate businesses and strategic business units (SBUs; see ‘The planningprocess’ in Chapter 1, page 5).
However, growth is not always the best option. In markets where the intensity ofcompetition makes it too costly to be able to compete profitably, or in markets that arenearing the mature stage of the product/market life cycle, growth is least likely to bethe best direction for most, but not necessarily all, businesses.
While deciding the strategic direction, the manager/decision-maker must also decidethe level of resources to commit to the chosen strategic direction. To make the bestdecisions regarding strategic direction and the level of resources to commit, themanager/decision-maker needs to have a good knowledge of the market, thecompetitive environment, the business environment and the business itself.
As we saw in Chapter 1, such decisions are part of the ongoing planning process,but are not always made at a level where the knowledge required to make the bestdecision is available first-hand. For small and medium-sized businesses, where thedecision-makers are involved in the daily running and operation of the business, theknowledge is, or should be, readily available so appropriate decisions can be made.
However, it becomes a far more difficult situation in medium to large businesses,where the decision-makers are somewhat separated from the business operations.These decision-makers need to rely on advice from a variety of sources, includingoperational managers, to make decisions that may be critical to the ongoing success ofthe business as a whole. This process becomes increasingly difficult as the businessbecomes larger, more layers are created between the decision-makers and theoperational levels, and more diverse geographic markets (up to global) are entered.
Decision-makers in these circumstances need to rely on advice from lower divisionaland operational managers, and one of the factors taken into account is the amount ofsupporting evidence provided with the advice.
It is in these circumstances that portfolio models are useful. They can providean essential part of the supporting evidence attached to advice provided to remotedecision-makers responsible for several SBUs operating in a variety of markets.
They are far less useful for small to medium-sized businesses that operate in onlyone or two markets, although they can have some limited use, which will be discussedlater in this chapter.
Portfolio models are a tool used to compare all SBUs within a company, on specificcriteria, to give an indication of the most logical strategic direction to take each SBU,and to what extent, i.e. the level of resources to commit. They provide some of thesupporting evidence to the decision-maker.
While there are a variety of portfolio models, we will examine two in this text: theBCG model, a growth/share portfolio matrix; and the GE/McKinsey model, a multi-factor portfolio matrix.
Both have certain uses and advantages within the context of supporting businessand marketing decisions, and certain limitations. These, as well as the method ofcalculating and analysing the results for management reporting, will be discussed inthis chapter.
Where portfolio analysis fits in marketingplanning
Portfolio analysis, regardless of the model used, examines and compares differentSBUs, so it, together with the results produced, forms part of current situationanalysis. The strategy indications form part of the justification for specific strategiesand tactics developed.
BCG model
The BCG model was one of the first portfolio models, developed by the BostonConsulting Group (and hence the name of the model) during the late 1960s. It isrelatively easy to plot, uses ‘catchy’ names for its quadrants, which makes it easy toremember, and allows decision-makers to compare all the SBUs within the company’sumbrella on criteria that are taken to represent cash generation and resource needs.The BCG model is shown in Figure 3.1.
Briefly, the different parts of the model are as follows:
• The market/industry growth rate indicates the annual growth of the industry ormarket each SBU operates in.
• The relative market share is the market share of each SBU compared to the marketshare of the largest or next largest competitor in the market the SBU operates in.
38 strategic marketing analysis
• The numbered circles represent the plotted location of each SBU, and the sizeof the circle represents the proportional share of total company earnings foreach SBU.
• The quadrants indicate the combined characteristics of each SBU and a general(or most likely recommended) strategy direction for each SBU:− ‘Stars’ are SBUs that are market leaders in high growth markets.− ‘Question marks’ (sometimes called ‘problem children’ or ‘wildcats’) are
SBUs that are not market leaders in high growth markets.− ‘Cash cows’ are SBUs that are market leaders in low growth markets.− ‘Dogs’ (sometimes called ‘pets’ by the Boston Consulting Group)1 are
SBUs that are not market leaders in low growth markets.
FIGURE 3.1 The BCG matrix
chapter 3 portfolio models 39
%High
Medium
Low
Stars Question marks
Cash cows Dogs
Mar
ket/
indu
stry
gro
wth
rat
e
10× 1× 0.1×
Relative market share
The BCG model is based on the following premises regarding cash flow:2
• Margins and cash generated are a function of market share. High market sharegenerates high profit margins through economies of scale, scope andexperience. (See Appendix 2 ‘Competitive cost efficiencies’ for an explanationof economies.)
• Growth requires cash input to finance-added assets. The higher the marketgrowth rate, the more additional cash needed to hold or increase market sharedue to the increased level of competitive activity.
• High market share must be earned or bought. Buying market share requiresadditional investment (cash).
• No product market can grow indefinitely. The payoff for growth can only comewhen the growth slows, and cash generated becomes larger than the cashneeded to sustain the business.
1
5
2
3
6
4
7
• Every company needs products that generate cash, and every product shouldeventually be a cash generator, otherwise it is worthless.
• A successful company is one with a diversified, balanced portfoliocontaining:− stars whose high share and high growth assure the future− cash cows that supply funds for that future growth− question marks to be converted into stars with added funds.Dogs (pets) are not necessary as they are evidence of failure to either obtainleadership during the growth phase, or to get out and cut losses before theycost the company too much. (This is not necessarily true – see ‘Limitations ofthe BCG model’, page 50.)Each aspect of the BCG model will be discussed in the next part of this chapter,
together with possible adaptations to make the model more relevant to businessesother than larger, diversified corporations, and limitations which have drawncriticism from many theorists.
Market/industry growth rateThe vertical axis refers to the level of growth in the industry or market of eachSBU. The growth rate of any market or industry is the relative increase ordecrease in overall size from the previous period (usually one year). The BCGmodel uses the premise that the higher the growth rate, the more attractive theindustry or market, as the overall size is larger, therefore there are morecustomers entering than leaving.
The growth rate can be roughly equated to the position in the product(category) life cycle, as shown in Figure 3.2.
FIGURE 3.2 The product life cycle as it relates to the BCG model
40 strategic marketing analysis
Intro. Growth Maturity
Low growth(cash cows and
dogs/pets)
High growth(stars and question
marks/problem
children/wildcats)
As can be seen from Figure 3.2, the early and late stages of the product lifecycle (PLC) do not really fit into the BCG model. If markets in the introduction orearly growth stages were entered into the BCG model, they would appear at thebottom of the grid, and anything past the plateau of the mature stage woulddisappear below the base line. (See ‘Limitations of the BCG model’ on page 50 formore discussion on this.)
Figure 3.1 shows the growth rate scale as high, medium and low. It is morecommon, and much more useful, to show the growth rate as a percentage figure.As growth rates tend to be linked to other national and international economicactivity, the specific figures you use when assembling a BCG matrix will bewhatever is relevant given the economic climate at the time. Additionally someindustries may grow more strongly in some countries rather than others.
chapter 3 portfolio models 41
In the early part of 2003, Australia’s growth overall was between 3 per centand 4 per cent, whereas in Japan, it was around 0 per cent to negative.
When the BCG model was developed, in the late 1960s, the scale 0–20 per centwas considered realistic. That was a time when post-war growth was stillcontinuing strongly. Times have changed, and while some industries may be stillgrowing at above 10 per cent per year, the majority are not. In 2004,markets/industries growing at 5–7 per cent are considered high growth.
Deciding on the growth scaleThe growth scale will generally start at 0 per cent, although if you wish to includemarkets that are past the plateau of the mature stage of the PLC, or yourparticular market is located in a region of negative growth, you may wish to startthe scale at some relevant ‘minus’ figure.
The centre line on the vertical scale represents the average growth across allindustries or markets. This may be set at whatever point is most logical for thebusiness’s SBUs being included in the model. Reed suggests using the nationalGDP figure as the average point,3 but this may cause complications for multi-national businesses operating in countries with varying national growth rates.Kerin suggests setting the average figure based on the current growth and theexpected growth for the next period,4 which would require a reasonable abilityto accurately predict the future. The average growth line could be calculatedspecifically for the business plotting the model – the marketer plotting a BCGmatrix could determine the growth rates of all industries or markets in which theyoperate, and use discretionary judgement to set the average point.
The top point of the vertical scale is usually set at double the average growthpercentage. This should work adequately for most businesses, but some mayneed to set this point higher to take into account industries or markets that aregrowing abnormally quickly, e.g. the ‘dot-com’ industries during the late 1990s.
Relative market shareThe horizontal axis of the BCG matrix is relative market share (RMS), which is theparticular SBU’s market share compared to the largest competitor in the samemarket. The position of an SBU on the RMS scale is considered a reflection of futurecash generation potential.
The RMS scale anchor points are shown in Figure 3.3.
FIGURE 3.3 The relative market share (RMS) scale
42 strategic marketing analysis
10× 5× 4× 3× 2× 1×
10× 1× 0.8× 0.6× 0.4× 0.2× 0.1×
The 1× (central line) is an indicator of joint leadership. The scale from 0.1× to 1×is usually best divided equally, as seen in Figure 3.3. The scale from 1× to 10×,however, need not be divided equally, as there are very few businesses whosemarket share is more than three to four times the market share of the nextcompetitor. The 1× to 10× scale can be more usefully drawn as in Figure 3.4.
FIGURE 3.4 The distorted 1×–10× scale
In the majority of markets, due to competitive intensity and government controls,market leaders do not have substantially larger market share than their nearestcompetitors.
In 2002–2003, QANTAS had an RMS of two to three and a half times that of itsonly competitor, Virgin, even though it was substantially larger.
As with the market growth scale, this scale is flexible, except for the three anchorpoints, and should be adapted to suit the situation of the planner calculating it.
RMS is calculated using the following formula:
Market share of SBU ‘X’
Market share of the largest competitor
‘X’ is the SBU whose position is being calculated.If ‘X’ is not the market leader, the largest competitor is the market leader.If ‘X’ is the market leader, the largest competitor is the second, or next largest,
competitor in the same market.
RMS =
Therefore, any SBU whose RMS places them in to the ‘stars’ or ‘cash cows’quadrants is the market leader in that market. Any SBU whose RMS places them inthe ‘question marks’ or ‘dogs’ quadrants is not the market leader.
The following example shows how the RMS of four different businesses in thesame market can be calculated and plotted using the BCG model.
chapter 3 portfolio models 43
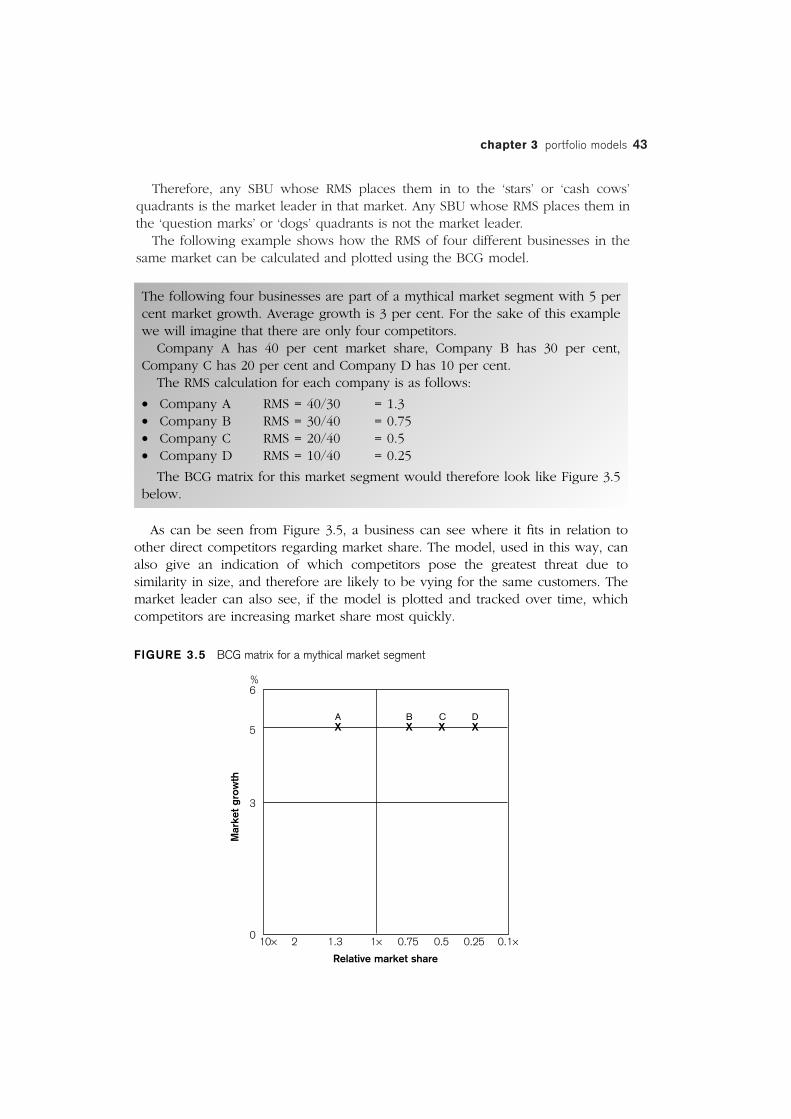
The following four businesses are part of a mythical market segment with 5 percent market growth. Average growth is 3 per cent. For the sake of this examplewe will imagine that there are only four competitors.
Company A has 40 per cent market share, Company B has 30 per cent,Company C has 20 per cent and Company D has 10 per cent.
The RMS calculation for each company is as follows:
• Company A RMS = 40/30 = 1.3• Company B RMS = 30/40 = 0.75• Company C RMS = 20/40 = 0.5• Company D RMS = 10/40 = 0.25
The BCG matrix for this market segment would therefore look like Figure 3.5below.
As can be seen from Figure 3.5, a business can see where it fits in relation toother direct competitors regarding market share. The model, used in this way, canalso give an indication of which competitors pose the greatest threat due tosimilarity in size, and therefore are likely to be vying for the same customers. Themarket leader can also see, if the model is plotted and tracked over time, whichcompetitors are increasing market share most quickly.
FIGURE 3.5 BCG matrix for a mythical market segment
Relative market share
A B C DX X X X
%6
5
3
0
Mar
ket
grow
th
10× 2 1.3 1× 0.75 0.5 0.25 0.1×
Challenges for plotting market share
The main challenge for plotting RMS is to decide what unit(s) of measurement touse for market share. Market share can be measured using a variety of factors,each of which needs to be considered as follows:
• Unit of measurement – do we use dollar sales, unit sales, total quantity sold(some sales may be for multiple units), or number of customers?
• SBU definition – do we use a total business unit with multiple products, totalproduct lines, individual product versions within a line or brands?
• Market definition – do we use the total market, or only the served market,defined as customer segments, geographical markets or distribution channels?
• Relative competition definition – do we consider only the top three competitorsby company or brand, all brands serving the product market or category, orinclude substitutes?
The served market is the segment(s) targeted by the particular business. If abusiness targets only one or two of a possible ten segments, or targets onlycustomers in a specific geographic area, it makes no sense to measure their marketshare against the entire market. This would not only distort the RMS calculationand lead to inappropriate analysis, but would also incorporate businesses that donot directly, or possibly even indirectly, compete.
Whatever measurement, or combination, is used, the same measurement mustbe applied to all competitors being used in the RMS calculation.
The other challenge is to find out the shares of the various competitors in themarket. This may be relatively easy if there is a well-established, well-resourcedand analytical industry association that keeps track and measures all competitorswithin the industry. Otherwise it is probably going to be much more difficult, andwill rely on good judgement and some reasonably accurate assessment method onthe part of the planner. Privately owned and operated companies will be evenmore difficult to estimate as such businesses do not tend to publish informationabout themselves. Publicly listed companies may be easier to estimate based oninformation published in their annual reports.
Quadrants
Stars
Strategic business units that fall into the ‘star’ quadrant are market leaders inhigher than average growth markets.
High growth markets are considered attractive as the overall size of the marketis growing rapidly, so additional sales can be gained from new entrants to themarket, rather than persuading other brand customers to switch. As it is earlier inthe PLC, the new customers will probably be less price sensitive. Therefore themarket will attract many new entrants, provided there are not any major barriersto entry (see Chapter 5), and competition will probably be intense.
44 strategic marketing analysis
The ‘star’ quadrant indicates that, although the SBU may be making some money,it will need to be funded with additional resources to meet the competitivepressures, and maintain its market leadership position. Failure to invest sufficientlywill result in loss of market share and probably leadership.
Question marks/problem children/wildcats
Strategic business units that fall into the ‘question mark’ (sometimes called ‘problemchildren’ or ‘wildcats’) quadrant, are not market leaders in high growth markets.
As with ‘stars’, ‘question mark’ SBUs will need additional resources from otherareas in the company to allow them to compete effectively in the high growthmarket environment. The BCG model theorises that all ‘question mark’ SBUs shouldbe attempting to become ‘stars’. If not, they will eventually become a liability to thecompany.5 If it is not possible for the ‘question mark’ SBU to become market leader,it should be eliminated. (See ‘Strategy options’, page 46.)
The BCG theory assumes that all businesses should attempt to become marketleaders, even if only in the particular segment(s) served. This may be the case forlarge multinationals, and significant businesses whose resource capacity and coststructure require substantial sales to return profit and achieve the various internaleconomies. However, many smaller businesses should never attempt to becomemarket leader, but should attempt to achieve the growth level (market share) thatbest suits their particular size and resource availability. (See ‘Limitations of the BCGmodel’, page 50.)
This theory also ignores the need for some SBUs/products to exist, e.g. to providesupport for other SBUs or products, e.g. supplying essential parts that wouldotherwise need to be sourced externally; or to maintain credibility with customersor a presence in a marketplace.
Cash cows
‘Cash cows’ are SBUs that are market leaders in low growth markets. Low growthmarkets (related to the late growth and mature stages of the PLC) are those wherecustomers are generally more brand loyal, but also more price sensitive. The overallmarket size will eventually shrink as customers move to newer markets or theindustry becomes redundant. Therefore the industry or market is becomingincreasingly less attractive, and some competitors will leave as it becomes moredifficult to make profits.
‘Cash cow’ SBUs are considered to be the revenue generators for companies. Ascompetitive pressures decrease, and economies of scale, scope and experiencereduce costs, increasing profits are generated. This is enhanced if there is strongbrand loyalty for the market leader.
Dogs/pets
‘Dogs’ (sometimes called ‘pets’ by the Boston Consulting Group)6 are SBUs that arenot market leaders in low growth markets.
Low growth markets are less attractive, and the theory behind the BCG modelsuggests that anyone who is not market leader in a low growth market should leavethe market, as they will not have the economies available to the market leader to
chapter 3 portfolio models 45
generate profits. But this implies that all ‘dog’ SBUs are set up to the same capacitylevels as ‘cash cows’. As with ‘question mark’ SBUs, this would not be the case forsmaller companies, whose smaller size and cost structures may mean that they canstill operate profitably, particularly if their customers are also brand loyal.
Can you think of company SBUs or products/brands that fit each of the abovecategories?
Circle sizesThe position of the SBU is plotted on the BCG matrix, and a circle drawn aroundits plot point to indicate the proportional contribution to total company sales of eachSBU. Looking back at Figure 3.1 (page 39), there is a range of SBUs contributingvarious amounts to the total company sales.
SBU 5 contributes the largest amount. SBU 7 contributes roughly half theamount of SBU 5. SBUs 2 and 4 contribute approximately one third of the amountof SBU 5, and SBUs 1 and 6 about a quarter of that of SBU 5. SBU 3 contributesthe smallest amount, probably about one tenth or less of SBU 5. The circle size isa quick visual indicator of which SBUs are generating cash.
Strategy optionsThere are four strategy options related to the BCG model. They are:
1 Build – invest resources to increase market share. − Increase or intensify promotion and distribution. − Extend and expand product offerings – ongoing investment in research
and development (R & D).− Develop new markets. − Work towards gaining and maintaining loyalty to your brand. − Persuade other brands’ customers to switch. In fact any of the growth possibilities explained in Chapter 4 could be used.
2 Hold/Maintain – invest resources to maintain the current level of market share.− Maintain current level of promotion unless reduced competitive pressures
allow some reduction.− Rationalise distribution to support profitable outlets, but reduce or cancel
unprofitable ones.− Rationalise product lines to eliminate unprofitable versions, continue to
support profitable versions.− Continue loyalty programs.
3 Harvest/Milk – maximise short-term cash generation, even if it results in reducedmarket share. This option is generally only pursued when cash needs to be
46 strategic marketing analysis
generated quickly, the SBU has substantial levels of finished goods, and thebusiness expects to eventually withdraw from the market (business) or eliminatethe product line.− Stop R & D and other capital investment.− Reduce marketing and sales budgets except what is needed to move
stock.− Raise prices to increase profitability of remaining sales, or reduce prices to
quickly sell stock that is becoming obsolete.− Reduce costs wherever possible, even if there is a slow decline in quality
of product or service.
4 Divest/Kill – move out of the business, market or product line/category.− Sell the business (divest). The higher the growth rate, the more possible
this option is. Selling the business can generate additional cash resourcesand eliminate some costs.
− Walk away/liquidate – where growth is low and there are no long-termprospects for the market or product category, there are not likely to beany potential buyers. In these circumstances, the business needs toliquidate what it can after reallocating resources wherever possible.Anything that remains becomes a write down on the balance sheets.
The traditional allocation of strategies to the BCG quadrants was:
• ‘stars’ – build• ‘question marks’ – build or divest• ‘cash cows’ – maintain• ‘dogs’ – harvest or divest.
This strategy allocation is too simplistic and neglects many factors that need to beconsidered before a sound business and marketing decision can be made. In reality,the strategy options for the quadrants should be as follows:
• ‘stars’ − Build if the lead on the nearest competitor is small, the market growth is
still increasing and there are many competitors.− Maintain if the SBU has a larger lead on the nearest competitor. The SBU
may not be permitted (by the ACCC) to continue to increase market sharedue to dominance concerns, particularly if the increase is due to mergeror takeover strategies.
• ‘question marks’− Build if resources and capacity are available and growth is increasing.− Maintain if growth is slowing, market share matches capacity and
resources and brand loyalty is strong.− Divest (sell) if the cost of competing outweighs any possible returns and a
buyer can be found.− Divest (liquidate) if the market is expected to decline rapidly and no
buyer can be found.
chapter 3 portfolio models 47
• ‘cash cows’− Maintain when profitable and longer-term prospects are reasonable.− Build, but selectively in segments that are growing, if interest in the product
range can be regenerated (re-start the PLC) or attractive competitors can beabsorbed cost effectively.
− Divest if the market is attractive to potential buyers, but is no longerattractive to the company itself. This may be for profitability reasons, or avariety of other non-profit related reasons, e.g. it is not the core business ofthe company and the company needs to pursue a retrenchment policy tore-establish itself in its core business, or the particular SBU’s business has adetrimental effect on the company’s image.
− Harvest or liquidate when the market has no medium to long-term future,and when remaining in the market would result in increased costs anddecreased overall profitability.
• ‘dogs’ – decisions really depend on whether they are genuine ‘dogs’ (no profit,no potential and no reason to be kept), or either ‘cash’ dogs – non-marketleaders that return a profit because of brand loyalty and consistency betweenmarket share and capacity, or ‘dogs’ that have synergistic relationships with otherareas within the company.− Harvest or liquidate if genuine dogs, and no buyers can be found.− Divest (sell) if growth is still reasonable, and the market share, even though
small, may be attractive to another company, e.g. the market leader tofurther improve its profitability via greater economies of scale, or a newentrant from overseas that regards it as an easy entry into the local market.
− Maintain if the decline in growth is gradual, and the SBU is profitable, or ithas synergistic impacts on other more profitable SBUs, e.g. supplyingimportant parts to another SBU, which otherwise would need to be sourcedelsewhere, and therefore add to that SBU’s cost structure.
− Selectively build if growth is still reasonable, and an increase in marketshare will enhance profitability through increased economies of scale. Thiswould also be the option if the market leader was regenerating interest inthe market sector.
Strategy considerations
The marketing/business planner must consider a range of factors before making adecision based on the SBU’s position in the BCG matrix. These questions should beconsidered regardless of the quadrant and the position of the SBU. Some factors toconsider include:
• How long has the SBU been in the market, and what has it cost to gain thecurrent level of market share?
48 strategic marketing analysis
• Is growth increasing or decreasing, and at what rate?
• What is the current market size? What is the future market potential? Howprobable is it that the market will reach this size, and how long will it take? Theseare all related questions, and need to be considered in all aspects that are usedto estimate market share.
• What is the overall market profitability? How does the SBU’s profitabilitycompare?
• Other competitors – How many are there? What is their attitude? What are theirrelative strengths and weaknesses? Are any similar in their offerings to our SBU,and if so, are they relatively more or less successful than us?
• What is the level of brand loyalty for our brands and competitors’ brands?
• How does the SBU interconnect with other parts of the company’s otherbusinesses?
• Are there any macro-environmental changes occurring now or in the future thatwill make the industry/market, or the SBU’s ability to compete, more or lessattractive?
Can you think of any other questions or considerations that would need to be takeninto account?
Adaptations of the BCG model
As indicated, the BCG model was developed to assist larger companies withmultiple businesses in different markets to better understand the cash generationand cash requirements of the different SBUs within the company umbrella. Inits traditional form, the BCG is of little use to businesses with only one or twoseparate divisions. However, it may be adapted to provide some insight intosmaller business.
Small and medium-sized businesses can use the BCG model by calculating theposition of individual products rather than SBUs, and using the growth of theindividual market segments each product is aimed at for the market/industrygrowth aspect. Direct other brand competitors would be used for each product toestimate relative market share.
The main question then becomes whether the time and resources committed topreparing and analysing a BCG matrix is outweighed by the information provided.
For any given market, the RMS of all competitors can be calculated (see Figure3.5). This will give the planner a perspective of which competitors are more likelyto be immediate, direct competitors based on similar size. Generally, particularlyamong smaller (non-market leader) competitors, the greatest competitive threatscome from similar-sized companies. Plotting the BCG matrix in this manner overtime will also reveal which competitors are growing at the fastest rates. These willprobably be the challengers in the market, and likely to prove the greatest threat.
chapter 3 portfolio models 49
Limitations of the BCG model
While the BCG is relatively easy to calculate, it is often regarded as too simplisticand potentially disastrous if strategies are based purely on the location of an SBU inthe model. Limitations include:• Although plotting the BCG is quite easy if you have the market growth and
market share figures, it is not always easy to find these figures. Although themodel is not expected to be 100 per cent accurate, accuracy of approximately 90per cent would be necessary for the results to be useful.
• Not all businesses will find high growth markets attractive. It may well be thatthe resources required to compete successfully in such markets are beyond thecapacity, or even interest, of many businesses.
• The attractiveness of a market or industry is usually determined by many morefactors than just the market growth rate (see ‘Market attractiveness’ factors for theGE model, page 52). These factors are also particular to each business, based onits resources, abilities and temperament.
• Success for a business is determined by more than ability to become marketleader. Aspects such as specialisation, flexibility, innovation, a customerorientation and even lower sales in exchange for environmental credibility maybe more relevant for many businesses.
• Return on investment (ROI) may be more important than cash flow whenmaking investment decisions. Businesses with smaller market share, but bettercost management, may have higher ROI than businesses with larger marketshare, but poorer cost management.
• Factors other than market share contribute to profit, e.g. strategic alliancesleading to reduced costs, brand loyalty and the cost of competing. In low marginmarkets, where competition is intense, the cost of competing may be so high thateven the market leader may not be particularly profitable.
• Small circle sizes, i.e. small cash contributors should not necessarily beeliminated. Their relative cost/profit structures and strategic importance need tobe considered.
GE (General Electric) model
The GE model, also known as the General Electric model or the McKinsey model,was developed by McKinsey and Company on commission from General Electric,during the 1970s, as a response to some of the inadequacies of the BCG. GeneralElectric believed there was merit in the portfolio approach, but a number of factorsneeded to be considered when calculating market attractiveness and businessstrength. It is therefore described as is a multifactor portfolio matrix, which meansthat several factors are combined and compared to allow the analysis to beundertaken. The GE model is seen in Figure 3.6.
50 strategic marketing analysis
A major difference between the two portfolio models is that, while the BCG iscalculated on two given facts, the GE model is based on management assessmentof a range of factors. The GE model requires the planner to decide which of themany possible factors are relevant for each individual company when determiningbusiness strength (sometimes called ‘competitive position’)7 and marketattractiveness, how each SBU rates on the factors, and the resulting position is thenplotted on a nine-sector model, with different strategy implications suggested foreach sector.
Briefly, the different parts of the model are as follows:
• Market/industry attractiveness indicates how well the industry/market and thebusiness match, and how easy it is for the business to achieve its objectives giventhe opportunities within the particular market/industry
• Business strength is a comparative factor that indicates how successful thebusiness is likely to be, as compared to its direct competitors, within theparticular market/industry.
chapter 3 portfolio models 51
FIGURE 3.6 The GE model
A
B
DC
5 4 3 2 15
4
3
2
1
Business strength
High Medium Low
Mar
ket
attr
activ
enes
s
H
igh
Med
ium
Lo
w
Invest/grow Manage selectively or for earnings
Harvest or divest
• The circles represent the comparative size of the overall market/industry, and theshaded sectors indicate the market share of the particular business or SBU.
• The sectors indicate the combined characteristics of each SBU and a range ofstrategy directions for SBUs located in each sector. The main strategy directions are:− invest and grow− manage for selective growth or earnings− harvest or divest.Each main strategy direction covers three sectors, but has a variety of suggestedoptions (see the strategy options in the ‘Strategy implications’ section later in thischapter).
• Arrows indicate the future position of the SBU over the next three to five yearsif current strategies remain in place, e.g. SBU A is predicted to become strongercompetitively in a market of increasing attractiveness, while SBU C is expectedto lose position as its competitive strengths are reduced, probably by competitivepressures.
The GE model was developed on the understanding that success in any businessdepends on the attractiveness of the markets in which it operates, i.e. how manyopportunities for growth and profit exist, and how easy it is for the business toaccess and make use of them (business strength). Success requires a matchingcombination of both business strength and attractive markets. As Kotler suggests,8
neither strong businesses in unattractive markets, nor weak businesses in attractivemarkets will do well.
Each aspect of the GE model will now be discussed, as well as limitations.
Market attractivenessThe first decision the marketer must make when plotting the GE model is whatfactors should be included to determine market/industry attractiveness. Some of thefactors will include:
• the size of the market, in terms of value and/or number of units• technology• buyers’ and/or suppliers’ bargaining power• segments, their number and size• industry profitability• growth rate• stage of life cycle• competition, including the number of competitors, their attitude and dominance• political/legal constraints• price sensitivity• customer satisfaction levels• seasonality• sensitivity to economic trends• entry/exit barriers.
52 strategic marketing analysis
The factors considered should reflect those used when conducting an externalsituation analysis.
While some factors will be reasonably generic, some will be particular to specificindustries, or even specific companies. Additionally, factors will have different levelsof contribution to overall attractiveness. The more comprehensive the list is, thebetter the overall assessment will be, but the greater level of mathematicalcalculation. Generally, between five and twelve factors would seem to be mostreasonable.
What do you think are the most common market attractiveness factors?
Consider some markets you are familiar with. Which factors would you use to plot aGE model?
To calculate market attractiveness, the marketing planner must decide:
• which factors are most relevant to the specific business• how many factors need to be included to create a balance between
completeness and functionality• what relative weighting needs to be attributed to each factor.
Then the marketer needs to allocate a score for the company’s SBUs against eachfactor. The calculation of the weight and SBU scoring can be done using a baseweight of:
• 100 and an SBU score of between 0.0 and 1.0 (1.0 = high attractiveness,0.5 = medium attractiveness and 0.0 = no attractiveness), resulting in ascale of 0–100, as used by Reed9
• 100 and an SBU score of between 0 and 10 (10 = high attractiveness and0 = no attractiveness), resulting in a total ranking that is then divided by100, to arrive at a scale of 0 to 10, as used by Boyd, Walker and Larreche10
• 1.0 and an SBU score of between 0 and 5 (5 = high attractiveness,3 = medium attractiveness, and 0 = no attractiveness), resulting in ascale of 1–5, as used by Condie.11
The SBU score
Apart from deciding which factors to use, and their relative weights, the othercritical aspect to calculating the GE model is to score each SBU against eachfactor. This provides another possibility for either miscalculating ormisrepresenting the outcomes of the model.
The scoring needs to be done as honestly and analytically as possible but, ifleft to one person, will almost always be skewed. This may be from a desire tobe seen as just a little better than reality (or from false modesty), or may be theresult of a limited perspective.
One method of getting the score as realistic as possible may be to conduct amini-research exercise, getting several key people within the organisation, andsome trusted people, e.g. suppliers or distributors, from outside the organisation,to score each SBU. All results could then be averaged, which should provide a
chapter 3 portfolio models 53
fairly realistic, or at least broader, score. This method would also avoid claims ofbias or misjudgement from SBU management not involved in plotting the model.
Calculating the market attractiveness
Table 3.1 shows the calculation of market attractiveness for a mythicalorganisation with four SBUs, seven relevant market attractiveness factors(chosen at random) using the weight base of 1.0 and the SBU score of 0–5 resultingin a scale of 1–5. This example will be used in conjunction with following examplesto explain the construction of a GE model for the company.
The ranking is calculated by multiplying the score by the weight for each factor.The total ranking for each SBU is then calculated by adding all rankings for thatSBU. This total ranking (in this example 2.95) becomes the plot point for the SBUon the industry/market attractiveness scale. Note that the score for the SBU is nottotalled. The SBU score is only used to multiply by the weight.
This completes most of the calculations related to market attractiveness. Themarketing planner must now perform the calculations relating to business strength.
Business strengthThis process is repeated to develop and calculate business strength. Some of thefactors that might be considered to constitute business strength include:
• market/segment share • flexibility• economies of scale • profit margins• sales force • economies of experience• innovation • company culture• product quality • marketing expertise• management expertise • product differentiation• sales effectiveness • patents.
What do you think are the most common business strength factors?
Consider some businesses you are familiar with.
• Which factors would you use to plot a GE model?
• Do the factors differ between businesses?
Remember, the strength of a business is a subjective and comparative measure,as is the attractiveness of a market. For some businesses, the volume of sales is moreimportant than specialisation. For others, particularly those that focus on niche orspecific needs markets, becoming too large (sales outstripping capacity), may beconsidered a weakness as it becomes more difficult to maintain quality of productand service.
For some (larger) businesses, the bigger the market, the more attractive, but forsmaller businesses (particularly niche marketers), a small, slowly growing marketwill be more attractive, as it is less likely to attract the attention of bigger, mainstreamcompetitors.
Calculating the business strength
Business strength is calculated and plotted using the same methodology as used formarket attractiveness.
Continuing with our mythical organisation, the planner has determined whichfactors are most important for business strength, and ranked each SBU accordingly.The results are shown in Table 3.3.
Now the marketing planner has completed the calculations for both marketattractiveness and business strength, it is time to plot the positions of the SBUs onthe model. Before this happens, the marketing planner needs to consider how tospace the scales.
ScalesBoth the ‘industry/market attractiveness’ and the ‘business strength’ (competitiveposition) scales are generally shown in texts as high, medium and low, or similardescriptors, as seen in Figure 3.6 (page 51). To plot the model more accurately, a
chapter 3 portfolio models 55
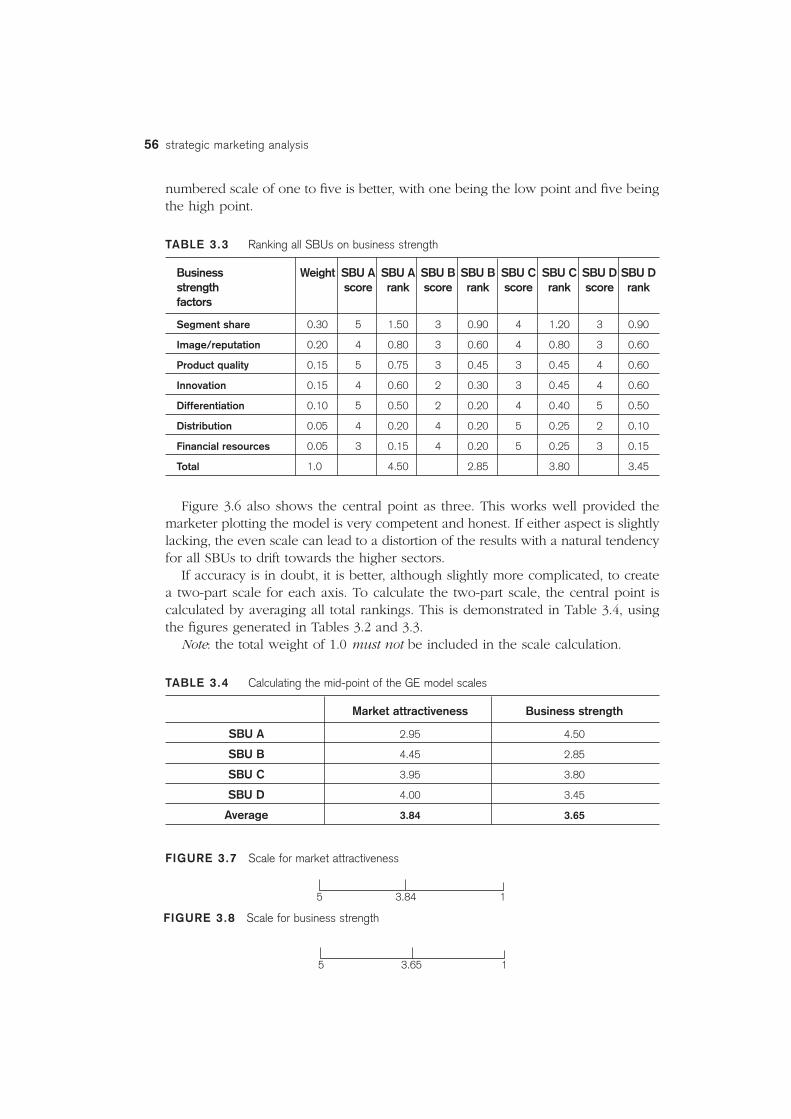
numbered scale of one to five is better, with one being the low point and five beingthe high point.
TABLE 3.3 Ranking all SBUs on business strength
Business Weight SBU A SBU A SBU B SBU B SBU C SBU C SBU D SBU D strength score rank score rank score rank score rankfactors
Figure 3.6 also shows the central point as three. This works well provided themarketer plotting the model is very competent and honest. If either aspect is slightlylacking, the even scale can lead to a distortion of the results with a natural tendencyfor all SBUs to drift towards the higher sectors.
If accuracy is in doubt, it is better, although slightly more complicated, to createa two-part scale for each axis. To calculate the two-part scale, the central point iscalculated by averaging all total rankings. This is demonstrated in Table 3.4, usingthe figures generated in Tables 3.2 and 3.3.
Note: the total weight of 1.0 must not be included in the scale calculation.
TABLE 3.4 Calculating the mid-point of the GE model scales
Market attractiveness Business strength
SBU A 2.95 4.50
SBU B 4.45 2.85
SBU C 3.95 3.80
SBU D 4.00 3.45
Average 3.84 3.65
FIGURE 3.7 Scale for market attractiveness
56 strategic marketing analysis
5 3.84 1
5 3.65 1
FIGURE 3.8 Scale for business strength
If the centre point of the scale remains at three for a calculation of the GE modelsuch as this, all SBUs would appear to be in a better position than they should. Bymaking the centre point for the scales the average of all SBU plot points, theirpositions in the GE model become more realistic.
Try plotting the above figures on a GE model using three as the centre point of eachscale. How different are the results and what would the strategy implications be?
Plotting the GE model
Using the results from Tables 3.2, 3.3 and 3.4, the GE model can now be plotted forthis company. This has been done in Figure 3.9.
The market sizes (using the segments served as the market under consideration)and market shares, shown in volume of sales, for these SBUs are given in Table 3.5.
TABLE 3.5 Market size and market share figures
SBU Market size Market share
A 2 million 48%
B 4 million 20%
C 5 million 30%
D 6 million 20%
FIGURE 3.9 Completed GE model
chapter 3 portfolio models 57
5 4.3 3.65 2.3 15
4.4
3.85
2.4
1
Business strength
Mar
ket
attr
activ
enes
s
C D
B
A
Strategy implications
As seen in Figure 3.6, there are three broad strategy options for the GE model:
1 Invest and grow the business.2 Manage selective aspects of the business to maximise earnings.3 Harvest or divest.
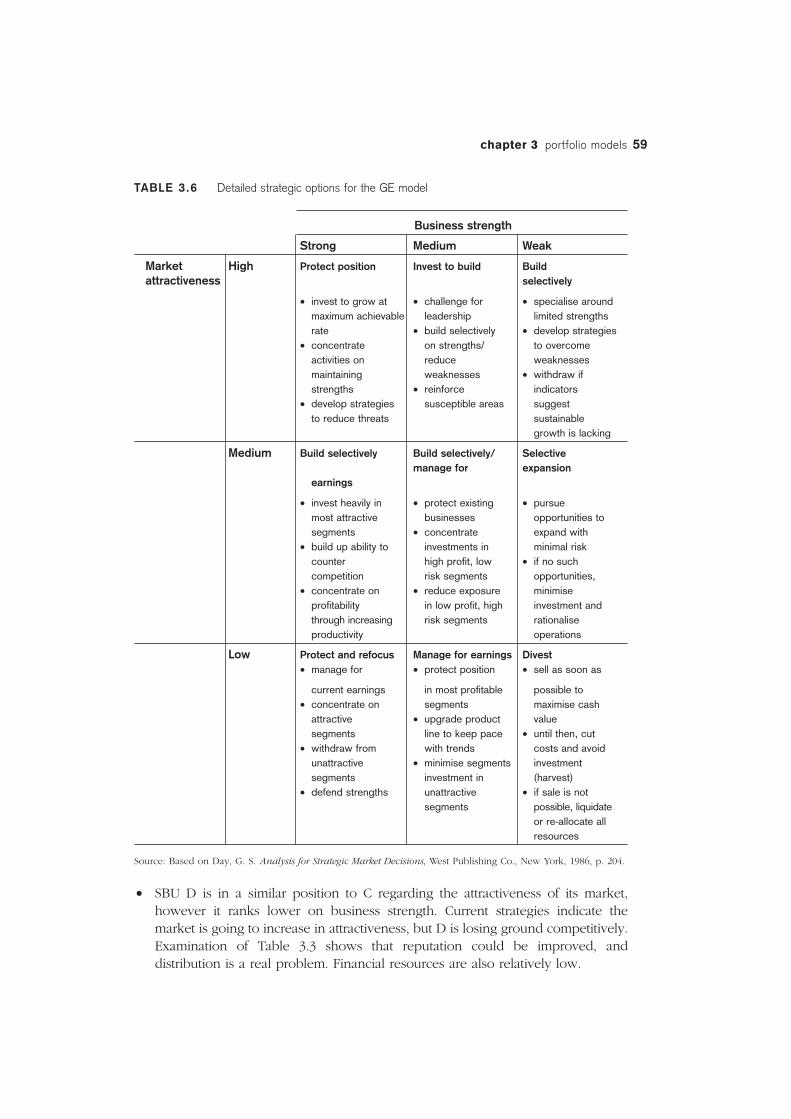
There are however, many more options available in the detail provided in Table 3.6,which allow the marketing planner to nominate strategies that will suit the individualcircumstances of each SBU.
Following the indications given in Table 3.6, the strategy implications that areapplicable for this company’s SBUs are:
• SBU A is located between the ‘build selectively’ and ‘protect and refocus’ sectors.The business strength is high, and the company has almost half the availablemarket share. This, plus the small market size and other market attractivenessand business strength factors, suggest that this is a specialist or niche market. Thearrow direction indicates that competitive strength will be reduced unlessrectifying strategies are implemented.
If this is the case, strategies should be developed to reinforce strengths andprotect position. Looking at the market attractiveness factors in Table 3.6, thelow entry barriers would be of concern, so management should investigateways to raise barriers through strong brands and customer loyalty programs.Other possibilities can be found in Chapter 5 ‘Porter’s five forces model’. Someconsideration should also be given to bidding for a greater share of thecompany’s financial resources.
• SBU B is a much weaker business, although it operates in a far more attractiveindustry. Strategies to build selectively on strengths and reinforce or improvevulnerable areas would be suggested. A challenge for leadership may not beadvisable until the weaknesses are reduced.
Looking at the business strength factors in Table 3.3, it can be seen thatthis SBU scores quite poorly on the innovation and differentiation factors. Thissuggests that management needs to address these factors by reassessingproduct development and brand image strategies. Table 3.3 also shows thisSBU quite strong financially, which may suggest that resources are not beingcorrectly allocated.
• SBU C is in a market of average attractiveness, which is expected to increaseslowly, and has reasonably good business strength, which is also expected toimprove. Protecting existing businesses and investing in attractive segmentsappear to be logical strategic directions.
Table 3.3 indicates that there is room for improvement in innovation andproduct quality. The market attractiveness factors in Table 3.2 suggest thatcompetitor numbers and intensity are the main things limiting marketattractiveness. As SBU C has excellent financial resources, perhaps a buy-out ofsome competitors may be an option.
58 strategic marketing analysis
TABLE 3.6 Detailed strategic options for the GE model
Business strength
Strong Medium Weak
Market High Protect position Invest to build Buildattractiveness selectively
• invest to grow at • challenge for • specialise around maximum achievable leadership limited strengthsrate • build selectively • develop strategies
• concentrate on strengths/ to overcome activities on reduce weaknessesmaintaining weaknesses • withdraw if strengths • reinforce indicators
• develop strategies susceptible areas suggest to reduce threats sustainable
growth is lacking
Medium Build selectively Build selectively/ Selective manage for expansion
earnings
• invest heavily in • protect existing • pursue most attractive businesses opportunities to segments • concentrate expand with
• build up ability to investments in minimal risk counter high profit, low • if no such competition risk segments opportunities,
• concentrate on • reduce exposure minimise profitability in low profit, high investment and through increasing risk segments rationalise productivity operations
Low Protect and refocus Manage for earnings Divest• manage for • protect position • sell as soon as
current earnings in most profitable possible to • concentrate on segments maximise cash
attractive • upgrade product valuesegments line to keep pace • until then, cut
• withdraw from with trends costs and avoid unattractive • minimise segments investment segments investment in (harvest)
• defend strengths unattractive • if sale is not segments possible, liquidate
or re-allocate allresources
Source: Based on Day, G. S. Analysis for Strategic Market Decisions, West Publishing Co., New York, 1986, p. 204.
• SBU D is in a similar position to C regarding the attractiveness of its market,however it ranks lower on business strength. Current strategies indicate themarket is going to increase in attractiveness, but D is losing ground competitively.Examination of Table 3.3 shows that reputation could be improved, anddistribution is a real problem. Financial resources are also relatively low.
chapter 3 portfolio models 59
Strategies to improve reputation and distribution are needed. Perhaps thedistribution needs to be rationalised to the high profit, low risk segments.
And that is basically all there is to plotting and analysing a GE model. Of course,as with the BCG model, the strategy indications are possibilities only. The marketingplanner needs to take into account all other aspects of the business before makinga final choice. Strategy considerations such as those for the BCG may also needto be considered.
Limitations of the GE modelWhile it is generally considered that the GE model gives a more thorough orrealistic analysis platform than the BGC model, it also has weaknesses. Theseinclude:
• It is totally dependent on the ability and integrity of the person calculating it– it is very open to both manipulation and incompetence. If the informationused to plot the model is poor, decisions based on the results will also bepoor.
• Management agreement needs to be reached on which factors should beincluded and the extent of their impact.
• Synergies between SBUs are not readily apparent.• Two SBUs landing in the same sector, such as C and D in Figure 3.9 (page 57),
may be there for completely different reasons, and therefore need differentstrategic directions developed for both to succeed.
• External environmental risks are not taken into account, but need to beconsidered before strategic decisions are made.
Conclusion
Portfolio models can be useful visual tools for diversified companies to review allbusinesses together, and see where growth is expected (resources needed) andreturns are generated (cash produced). They provide the decision-maker with astarting point for decisions regarding: SBU retention or deletion; the generalstrategic direction (growth, maintenance, deletion) for each SBU; and resourceallocation/redistribution decisions.
Two models have been reviewed in this text: the BCG model and the GEmodel. Both have advantages and disadvantages.
The BCG model is quite easy to plot, provided the estimates for market shareand market growth are reasonably readily available. It is however very simplisticand disregards many factors needed to made good strategic decisions. It alsoassumes that all businesses should aim to become market leaders, which isillogical when most businesses lack the resources and/or the desire to compete tothat level. Despite this, many businesses are considered successful.
60 strategic marketing analysis
The GE model is more difficult to plot, needing good and honest judgementwhen deciding how SBUs rank on the factors considered, and even which factorsto include. As this is a qualitative model, the adage ‘garbage in, garbage out’applies. However, if plotted well, it does take a more holistic view of the businessand provides greater strategic direction.
divest market/industry growth rate strategic business unit (SBU)
Review questions
1 What is a portfolio model and how is it used?
2 Using the BCG model:
a Draw and label all parts of the model.
b Explain each quadrant in terms of market share and market growth.
c What is the formula for calculating relative market share?
d Explain what the circles indicate.
e What are the main limitations of the BCG model?
3 Using the data provided in Table 3.7 below draw and plot a BCG product
portfolio model. Suggest strategies for each SBU.
TABLE 3.7 Data for review question 3
Product Market Market share: Market share: Total Product (SBU) (SBU) growth Your SBU Top 3 competitors sales
rate competitors in market
A 4% 14% 27%, 15%, 13% 10 $2.5 million
B 6% 5% 22%, 19%, 15% 14 $700 000
C 9% 16% 14%, 12%, 11% 16 $3.75 million
D 2% 22% 16%, 20%, 18% 6 $4.25 million
Average growth is 5 per cent.
4 Using the GE model:
a Draw and label all parts of the model.
b Explain what constitutes market attractiveness and how it is calculated.
c Explain what constitutes business strength and how it is calculated.
d Explain what the circles and arrows indicate.
e What are the main limitations of the GE model?
chapter 3 portfolio models 61
5 Using the data provided in Tables 3.8 and 3.9 below draw and plot a GE portfolio
model. Suggest strategies for each SBU.
TABLE 3.8 Company figures for review question 5
SBU Market size Market share
A 8 million 8%
B 12 million 20%
C 16 million 15%
D 13 million 25%
TABLE 3.9 Market figures for review question 5
Business strength Weight SBU A SBU B SBU C SBU Dfactors score score score score
Market share 0.25 2 4 3 5
Quality 0.25 4 2 3 3
Sales force 0.15 2 2 4 3
Patents 0.20 5 3 4 5
Differentiation 0.10 4 3 4 4
Distribution 0.05 3 2 5 5
Total 1.0
Market attractiveness Weight SBU A SBU B SBU C SBU Dfactors score score score score
Market size 0.25 3 4 5 4
Growth rate 0.20 2 4 3 4
Competitor no.s 0.20 4 3 2 2
Profitability 0.20 4 2 3 4
Technology 0.10 5 3 4 5
Seasonality 0.05 5 3 4 5
Total 1.0
Case questions1 Peter has asked you to do some portfolio analysis for The Tilba Cheese Factory,
to help with his planning.
a What information would you need to complete both a BCG model and a GE
model? Where do you think you might find the information?
b What decisions does Peter need to make before you can calculate and plot
both the BCG model and the GE model?
62 strategic marketing analysis
2 Explain the advantages and the limitations, of both the BCG model and the GE
model, for a business of the size and type of Peter’s.
Endnotes1 Boston Consulting Group ‘The Product Portfolio Perspectives’ 1 January 1970, viewed
8 February 2004, <http://www.bcg.com/>.2 Boston Consulting Group ‘The Product Portfolio Perspectives’.3 Reed, P. Marketing Planning and Strategy, 2nd edn, Harcourt Brace, Sydney, 1997, ch. 8.4 Kerin R. A., Mahajan V. & Varadarajan, P. R. Contemporary Perspectives on Strategic
Market Planning, Allyn & Bacon, Boston, 1990, ch. 2.5 Boston Consulting Group ‘The Product Portfolio Perspectives’.6 Boston Consulting Group ‘The Product Portfolio Perspectives’.7 Stokes, D. Marketing, 3rd edn, Continuum, London, 2002, ch. 8.8 Kotler, P. Marketing Management: The Millennium Edition, Prentice-Hall, 2000, ch. 3.9 Reed, ch. 4.
10 Boyd, H. W., Walker, O. C. & Larreche, J.-C. Marketing Management: A StrategicApproach with a Global Orientation, 3rd edn, Irwin McGraw-Hill, Boston, 1998, ch. 8.