33


N A S D A Q : H E A R
SafeHarborStatement
Forward-LookingInformationThispresentationincludes“forward-lookingstatements”withinthemeaningofthefederalsecuritieslaws.Theseforward-lookingstatementsarestatementsthatarenothistoricalfactsincludingstatementsaboutourbeliefsandexpectationsandstatements,andmaycontainthewords“may,”“could,”“would,”“should,”“believe,”“expect,”“anticipate,”“plan,”“estimate,”“target,”“project,”“intend,”“foresee,”andsimilarexpressions.Thereareanumberofrisksanduncertaintiesthatcouldcauseactualresultstodiffermateriallyfromtheforward-lookingstatementsmadeherein,includingbutnotlimitedto,theapplicationofquarter-endandyear-endaccountingproceduresandadjustments,risksrelatedtotheCompany’sliquidityandfinancialposition,thesubstantialuncertaintiesinherentintheacceptanceofexistingandfutureproducts,thedifficultyofcommercializingandprotectingnewtechnology,theimpactofcompetitiveproductsandpricing,generalbusinessandeconomicconditions,risksassociatedwiththeexpansionofourbusinessincludingtheimplementationofanybusinessesweacquire,ourindebtedness,theoutcomeofourHyperSoundstrategicreviewprocess,andtheotherfactorsdiscussedinourpublic filings,includingthesectionentitled“RiskFactors”inourmostrecentQuarterlyReportonForm10-Q,ourAnnualReportonForm10-KandotherperiodicreportsfiledwiththeSecuritiesandExchangeCommission(the“SEC”)andavailableontheSEC’swebsite,www.sec.gov.Readersarecautionednottoplaceunduerelianceontheseforward-lookingstatements,whichspeakonlyasofthedateofthispresentation.Exceptasrequiredbylaw,TurtleBeachCorporation(the“Company”)undertakesnoobligationtopubliclyreleaseanyrevisiontoitsforward-lookingstatementstoreflecteventsorcircumstancesafterthedateofthispresentation.Alloftheforward-lookingstatementsinthispresentationarequalifiedbysuchcautionary statements,andsubjecttotheprotectionofthesafeharborforforward-lookingstatementscontainedinthePrivateSecuritiesLitigationReformActof1995.Thispresentationalsocontainstrademarksandtradenamesthatarepropertyoftheirrespectiveowners.
Non-GAAPFinancialMeasuresThispresentationcontainscertainfinancialmeasures,includingadjustedEBITDAandnon-GAAPearningspershare(“EPS”),thatarenotcalculatedunderthestandardsorrulesofU.S.GAAP,whicharereferredtoas"non-GAAPfinancialmeasures."Thesenon-GAAPfinancialmeasures,ascalculatedbytheCompany,arenotnecessarilycomparabletosimilarlytitledmeasuresreportedbyothercompanies.Additionally,thesenon-GAAPfinancialmeasuresarenotmeasurementsoffinancialperformanceorliquidityunderGAAPandshouldnotbeconsideredanalternativetotheCompany’sotherfinancialinformationdeterminedunderGAAP.Managementbelievesthatthese non-GAAPfinancialmeasures,whenreadinconjunctionwiththeCompany'sreportedresults,canprovideusefulsupplementalinformationforinvestorsanalyzingperiodtoperiodcomparisonsoftheCompany'sresults.“AdjustedEBITDA”isdefinedbytheCompanyasnetincome(loss)beforeinterest,taxes,depreciationandamortization,stock-basedcompensation(non-cash),andcertainspecialitemsthatwebelievearenotrepresentativeofcoreoperations.Non-GAAPEPSisdefinedasEPSless$0.01perdilutedshareinHyperSoundbusinesstransition charges.TheAdjustedEBITDAoutlookforthesecondquarterandfullyear2017hasnotbeenreconciledwiththeCompany’snetlossoutlookforthesameperiodsbecauseofthevariability,complexityandlackofvisibilitywithrespecttocertainreconcilingitemsbetweenadjustedEBITDAandnetloss,includingotherincome(expense),provisionforincometaxesand stock-basedcompensation.Theseitemscannotbereasonablyandaccuratelypredictedwithouttheinvestmentofunduetime,costandotherresourcesand,accordingly,areconciliationoftheCompany’sadjustedEBITDAoutlooktoitsnetlossoutlookforsuchperiodsisnotavailablewithoutunreasonableeffort.ThesereconcilingitemscouldbematerialtotheCompany’sactualresultsforsuchperiods.
©2017TurtleBeachCorporation.AllRightsReserved.
1

N A S D A Q : H E A R
WhoWeAre
� Dominantmarketleaderingamingheadsets
� Strongbrandwithhighconsumerloyalty
� Globaldistribution andpartnerships
� Fulllineofdifferentiatedproducts
� Extensiveandvaluablepatentportfolio
� Keyplayerin$96Bgamingmarket
� Wellpositionedforastrong2017
� Opportunitiestodrivedouble-digitgrowth
� Strengthening balancesheet
� Experienced board andmanagement team
2

N A S D A Q : H E A R
BalanceSheetHighlights
� RevolvertypicallypeaksinQ4andlowestinQ1afterholidayreceipts
� $49.0Mfederal,$21.0Mstatenetoperatinglosses@Dec31,2016offsettaxableincome(notscheduledtoexpireuntil2029)
� $60Mlineofcreditandexpectationtobesignificantlymoreprofitableonconsolidatedbasisisanticipatedtoprovidesufficientcapitaltofundourplan
KeyStats
3
Sources:S&PCapitalIQ,companyfilings.1) AsofMarch31,2017.2) DueinOctober2030andhas8%perannumPIKinterest.
TradingData(@Jul6,2017)
StockPrice $0.68
MarketCap. $33.5M
52Wk.Low/High $0.65/$2.00
Avg.DailyVol.(3mos.) 120K
PublicFloat¹ 45%
InsiderOwnership¹ 55%
SharesOutstanding¹ 49.3M
Capitalization
@3-31-16 @3-31-17
Cash&Equivalents $3.2M $3.6M
Debt
Revolver (asset-basedloan) $0.5M $0M
TermLoans $17.2M $14.4M
SubordinatedNotes $17.8M $20.0M
TotalDebt $35.5M $34.4M
SeriesB- PreferredStock² $16.5M $17.8M
ValuationMetrics(@Jul6,2017)
EnterpriseValue $64.3M
Revenue(trailing12mos.) $164.3M
EV/Revenue 0.4x
N A S D A Q : H E A R
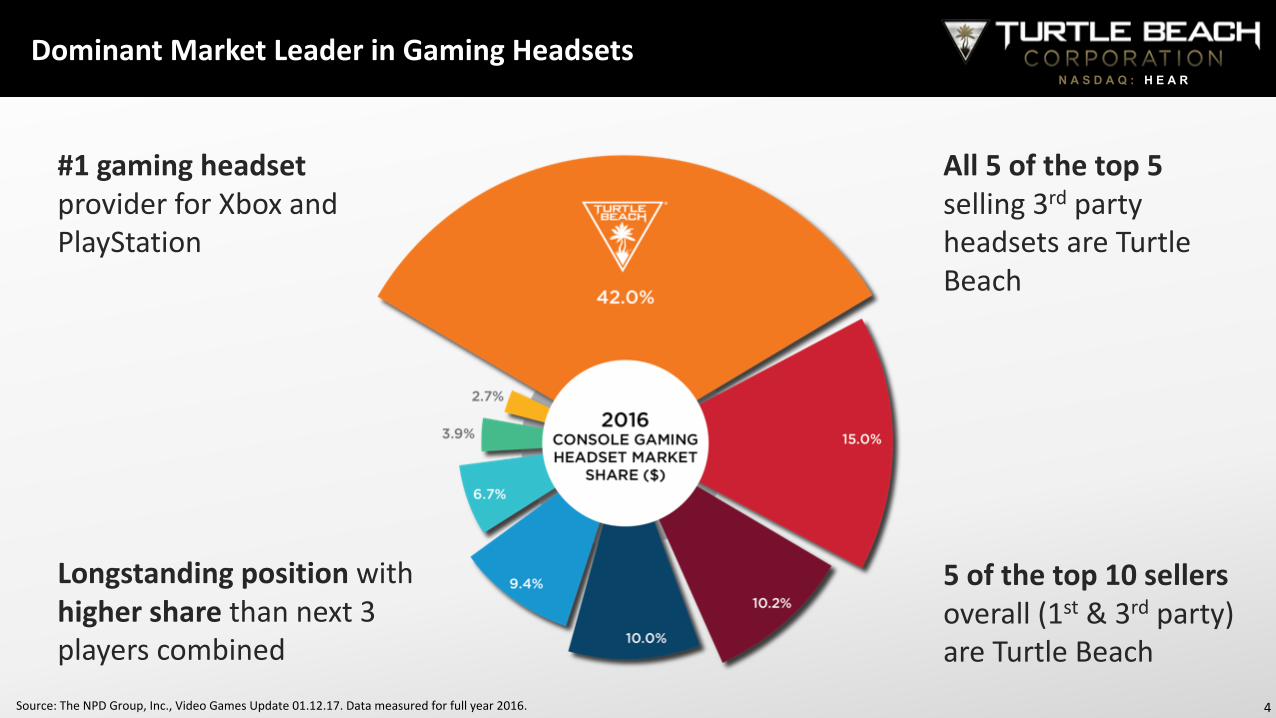
DominantMarketLeaderinGamingHeadsets
5ofthetop10sellersoverall(1st &3rd party)areTurtleBeach
4Source:TheNPDGroup,Inc.,VideoGamesUpdate01.12.17.Datameasuredforfullyear2016.
#1gamingheadsetproviderforXboxandPlayStation
All5ofthetop5selling3rd partyheadsetsareTurtleBeach
Longstandingpositionwithhighersharethannext3playerscombined

N A S D A Q : H E A R
StrongBrandwithHighConsumerLoyalty
(1)Source:BowenResearch(June2015);(2)Source:SurveySamplingInternationalResearch(April2017),showingmainConsole GamingHeadsetcompetitors;(3)Source:SimplyMeasuredService,June2017. 5
Consumers’ Favorite Gaming Headset Brand¹
Facebook “Likes”³
#1ratedheadsetbasedonaudioquality¹
36% 30%
12% 8%
5% 4% 3% 3%
654,090
251,349201,407 200,719
129,94861,981
23% 21%
6% 5% 2%
Unaided Brand Awareness²
#1ratedheadsetbasedcomfort¹
+52NetPromoterScore²
Thinkingaboutbrandsofgamingheadsets,whatbrandscometomind?
Comp#1 Comp#2 Comp#3 Comp#4 Comp#5 Comp#6 Comp#7
Comp#1 Comp#2 Comp#3 Comp#4 Comp#1 Comp#2 Comp#3 Comp#4 Comp#5

N A S D A Q : H E A R
StrongRetail Presence GreatPartnerships 12,000+Interactive Displays
Sampleretailers
GlobalDistributionandPartnerships
6
Productsalesin42countrieswithover270,000pointsof
distribution
Partnershipswithindustryleadingbrands
Marketleaderindeployinginteractivegamingheadset
displays

N A S D A Q : H E A R
FullLineofProducts…
7
Entry-Level Gamer< 4 hours per week
Casual Gamer4-6 hours per week
Enthusiast Gamer7-15 hours per week
Core Gamer16+ hours per week
ASP TB Key FeaturesSample Products
>$200
$100- $200
$50- $100
<$50
• 100%wirelessandactivenoisecancelling• DTS7.1Headphone:X• BoomlessMicrophone• SuperhumanHearingTM• Bluetoothintegration
• DTS7.1Headphone:X• SuperhumanHearing• 100%wireless• Noisecancelling• EQPresets
• SuperhumanHearing• 50mmspeakerdrivers• Micmonitoring
• Stereosound,40mmspeakerdrivers• 3.5mmconnection• Removablemic
• Openearcup• Glassesfriendlydesign
eSports Varies• Unique,adjustabletension• Coolinggelearpads• Patentedglassesreliefsystem
JustLaunched
LaunchingSeptember
LaunchingJuly
N A S D A Q : H E A R
8
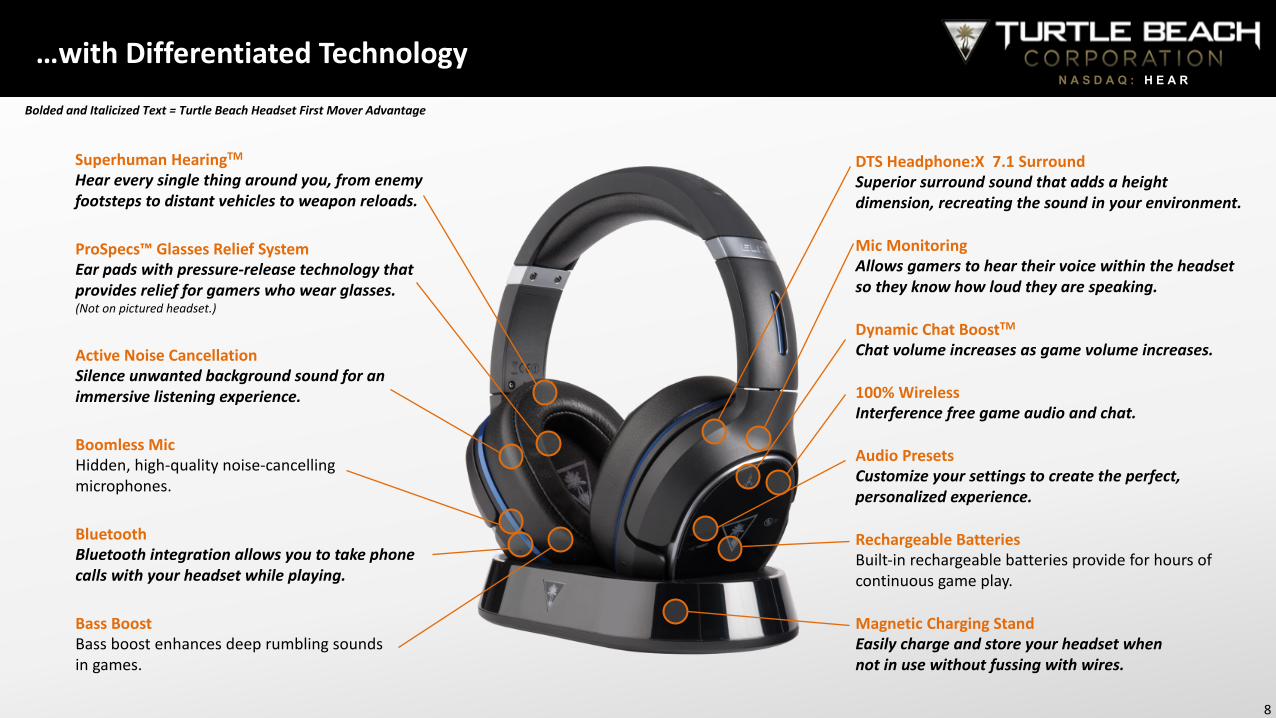
ActiveNoiseCancellationSilenceunwantedbackgroundsoundforanimmersivelisteningexperience.
BoldedandItalicizedText=TurtleBeachHeadsetFirstMoverAdvantage
RechargeableBatteriesBuilt-inrechargeablebatteriesprovideforhoursofcontinuousgameplay.
BluetoothBluetoothintegrationallowsyoutotakephonecallswithyourheadsetwhileplaying.
100%WirelessInterferencefreegameaudioandchat.
BassBoostBassboostenhancesdeeprumblingsoundsingames.
DTSHeadphone:X7.1SurroundSuperiorsurroundsoundthataddsaheightdimension,recreatingthesoundinyourenvironment.
AudioPresetsCustomizeyoursettingstocreatetheperfect,personalizedexperience.
DynamicChatBoostTMChatvolumeincreasesasgamevolumeincreases.
MicMonitoringAllowsgamerstoheartheirvoicewithintheheadsetsotheyknowhowloudtheyarespeaking.
SuperhumanHearingTMHeareverysinglethingaroundyou,fromenemyfootstepstodistantvehiclestoweaponreloads.
ProSpecs™GlassesReliefSystemEarpadswithpressure-releasetechnologythatprovidesreliefforgamerswhowearglasses.(Notonpicturedheadset.)
BoomlessMicHidden,high-qualitynoise-cancellingmicrophones.
MagneticChargingStandEasilychargeandstoreyourheadsetwhennotinusewithoutfussingwithwires.
…withDifferentiatedTechnology

N A S D A Q : H E A R
26 28 35
8120
68
86
65
Jan2013 Jan2014 Jan2015 Mar2017¹
Pending Issued� Headsetinnovations:
� Audioprocessing
� Gamingspecificfeatures
� HyperSound innovations:� Emitterconstruction
� Ultrasoundandemitterelectronics
� Digitalsignalprocessingtechniques
121
96
46
146
Extensive&ValuablePatentPortfolio
91) AsofMar10,2017.
PatentPortfolioValuedat$45+Min
June2015

N A S D A Q : H E A R
KeyPlayerin$96BillionGlobalGamingMarket
PCGaming:$33B MobileGaming:$31B
ConsoleGaming:$32B
$96BGlobalGamingOpportunity
Source:DFCIntelligenceVideoGameWorldwideMarketForecast(October2016). 10

N A S D A Q : H E A R
StrongNew ProductAdditions NewTitlesExpectedToDoWell ’17 ResultsExpectedtoImprove
ReconChatheadsetslaunchedinQ2andpropelledTurtleBeachto#1spotforXboxOnechatcommunicatorsalesinMay2017(U.S.market)¹.
CurrentsalestrendsindicateReconChatswillbecome#1chatcommunicatorsacrossbothplatforms.
XOThreeandRecon150launchinginJulyrefreshaheadsetwithprovenmarketleadershiptoanew,lowerpricepointof$69.95.
Stealth600and700’s launchinSept,bringingunprecedentedfeaturesto$99and$149pricepoints.XboxOnemodelsexpectedtobefirst-to-marketwithdirectwirelessconnectiontoXboxconsoles.
Strong’17holidayoutlookforAAAgametitles.
NPD predictingatleast4titleswillexceed$100MinQ4packagedconsumersales2.
NPDpredictingtop5sellingtitlesthisQ4willcombinetogenerateatleast20%morepackagedconsumerrevenues thanthetop5oneyearago2.
� ConsolidatedAdj.EBITDAexpectedtoimproveto$11M($4Min’16)³.
� ConsolidatedAdj.EBITDAmarginexpectedtoimproveto7%(2%in’16)³.
� AdjustedEBITDAexpectedtobesufficienttosupportseniordebtrepayment.
� Averagerevolverbalance(asset-basedloan)in2017expectedtodecline.
WellPositionedForaStrong2017
111. Source:TheNPDGroup,May2017andTurtleBeachprojections. 2.Source:IndustryAnalysts,VideoGamesTheNPDGroup,Inc. 3.GuidanceeffectiveonMay9,2017.Reflectsmidpointofrange.

N A S D A Q : H E A R
1) GuidancereiteratedandeffectiveonMay9,2017.2) Deltareflectsmidpointoftheoutlook.3) ExcludesintangibleassetamortizationcostsassociatedwithHyperSoundClear™500Plaunch,$7.1MininventoryreservesassociatedwithHyperSoundrestructuringand$0.6Mforotherrestructuringchargesin2016.
2017OutlookReflectsQ4-16ChannelInventoryImpactonRevenuesButSignificantlyImprovedProfitability
12
($inmillions) 2017¹ %∆² ManagementCommentary&Assumptions
TotalRevenue $155-$160 (9)% Holiday’16inventorycarryoverimpactsfirsthalf2017revenue
HeadsetGrossMargin ~30% Upfrom24.5%in‘16 Loweroperationscosts,continuedCOGS improvements,somelossofoperatingleverageduetolowerrevenue
EPS³ $(0.08)-$(0.12) $(0.33) in‘16³ Basedupon49.3Mshares
AdjustedEBITDA:
Headsets ~$12 (17)% Higherchannelinventoryinearly2017impactsfull-yearsales
HyperSound ~$(1) $(10.4)M‘16 Significant costreductionsenableconsolidatedadj.EBITDAimprovement
Consol.Adj.EBITDA $10-$12 162% $4Min2016

N A S D A Q : H E A R
13
($inmillions) 2013 2014 2015 2016 2017E¹HeadsetNetRevenue $178.5 $185.5 $161.8 $173.3 $157.0AdjustedEBITDA² $13.9 $12.0 $2.4 $14.4 $12.0GrossMargin % 28.2% 27.5% 26.5% 31.9% ~30%
HyperSoundNetRevenue - $0.7 $0.9 $0.7 -AdjustedEBITDA² - ($10.0) ($13.8) ($10.4) ($1.0)
ConsolidatedNetRevenue $178.5 $186.2 $162.7 $174.0 $157.0AdjustedEBITDA² $13.9 $2.0 ($11.4) $4.0 $11.0
HistoricalSegmentResultsDetailtheDriversofConsolidatedPerformance
FollowingHyperSoundTransitiontoaLicenseModel,GamingBusinessDrivingRevenueandAdj.EBITDAGoingForward1) GuidancereiteratedandeffectiveonMay9,2017.2) SeeappendixforareconciliationofadjustedEBITDA.
Gamingbusinessdrivesrevenueandcashflowsgoingforward
HyperSoundtransitionedtoalicensemodelinQ3/Q42016

N A S D A Q : H E A R
Highlights:
• Between2013and2016,newgennetrevenuegrewfromzeroto$173.3M
• Between2013and2016,oldgennetrevenuedeclinedfrom$207.1Mto$6.9M
• From2013-2016,wounddownalloldgenproductsandbuiltentirenewgenproductline-up
• 2014and2015hadgreatestnegativeimpactfromconsoletransitiondrivenbyproductportfoliochanges,higherpromotionalactivitytoclearinventory,incrementalcoststogetnewgenproductstomarket,andhigherlogisticscosts
14
($inmillions) 2013 2014 2015 2016 2017E¹
NetRevenue $178.5 $185.5 $161.8 $173.3 $157.0
GrossMargin$ $50.3 $51.0 $42.8 $55.2
GrossMargin% 28.2% 27.5% 26.5% 31.9% ~30%
Operating Expenses $48.7 $51.6 $51.5 $46.4
Operating Income $1.6 ($0.3) ($8.7) $8.6
Foreign ExchangeGain(Loss) - ($0.7) ($1.0) ($2.4)
AdjustedEBITDA $13.9 $12.0 $2.4 $14.4 ~$12.0
HistoricalHeadsetGAAPFinancialResultsStrengtheningAsConsoleTransitionCompletes
1) GuidancereiteratedandeffectiveonMay9,2017.
HeadsetBusinessGeneratesSufficientCashtoServiceSeniorDebt
ConsolidatedAdjustedEBITDAImprovesto$11Mor7%ofRevenuein2017

N A S D A Q : H E A R
15
($millions) 2013 2014 2015 2016 2017E¹
NewGenRevenue¹ $15.9 $100.2 $124.2 $160.0 $151.0
YoY$Change $15.9 $84.3 $24.0 $35.8 ($9.0)
YoY%Change 100% 530% 24% 29% (6%)
OldGenRevenue¹ $153.4 $75.4 $30.4 $6.9 -
YoY$Change ($53.7) ($78.0) ($45.0) ($23.5) ($6.9)
YoY%Change (26%) (51%) (60%) (77%) (100%)
StrongNewGenCompoundedAnnualGrowthNowDrivingHeadsetBusiness
1. XboxandPlayStationnetrevenueonly2. MidpointofguidancereiteratedandeffectiveonMay9,2017.
2014newgenrevenue• Microsoftgamingaudioforheadsetsnot
availableuntilMarch2014,missing2013holidayandbenefitting2014
2015wasinflectionpointfornewgen:• Moregamesfornewgenplatformsvs.2014• Newgenconsolesover50%ofactive
installedbase• Newgenconsoleunitsalessignificantly
higherthanoriginalprojections
2017newgenrevenue• Negativelyimpactedby
~$12Mdueprimarilytofirst-personshootergametitlesbeingdown40%year-over-yearin2016holiday

N A S D A Q : H E A RHeadsetRevenueGrowthOpportunitiesToDriveDouble-DigitRevenueGrowth
16
History
2013- 2015:Consoleplatformchangeforceschangeovertonewportfolio(notexpectedtohappenagain).Strongdollarimpacted2015.
2014- 2016:SignificantinvestmentinHyperSound.GamingmarkethasweakQ4-16,leadingtohighchannelinventory.
Focus/Priorities
2016:Focusonreturningheadsetbusinesstostrongprofitability.Wind-downHyperSound.EntereSports,virtualreality(VR),StreamingMiccategories.
2017:Focusoncoreheadsetbusinessandcontinuedprofitabilityimprovements.ExpandeSports.NurturenewVRandmicbusiness.Laygroundworkfor2018+growthinitiativesinPCandinternational.
2018- 2019:Maintainleadershipincoreconsolesegment.ExpandintoPCgamingheadsetsincludingChinamarket.DriveeSports,VR,micbusinesses.Evaluateadditionalnewproductcategoriesfor2019+.Note:Old-gen,new-genrevenuesplitsareapproximations.1) GuidancereiteratedandeffectiveonMay9,2017.
2013 2014 2015 2016 2017E¹ 2018E 2019E
NewGen OldGen Other HyperSound PC/VR/NewProducts
$178M$186M
$163M$174M
$155-160M

N A S D A Q : H E A R
17
LongerTermConsoleMarketExpectedtoGrowat~5%Rate
Sources:DFCIntelligenceForecasts:WorldwideConsoleForecast,PreliminaryFebruary2017andTurtleBeachprojections.
N A S D A Q : H E A R
VirtualReality(VR)PCGaming International
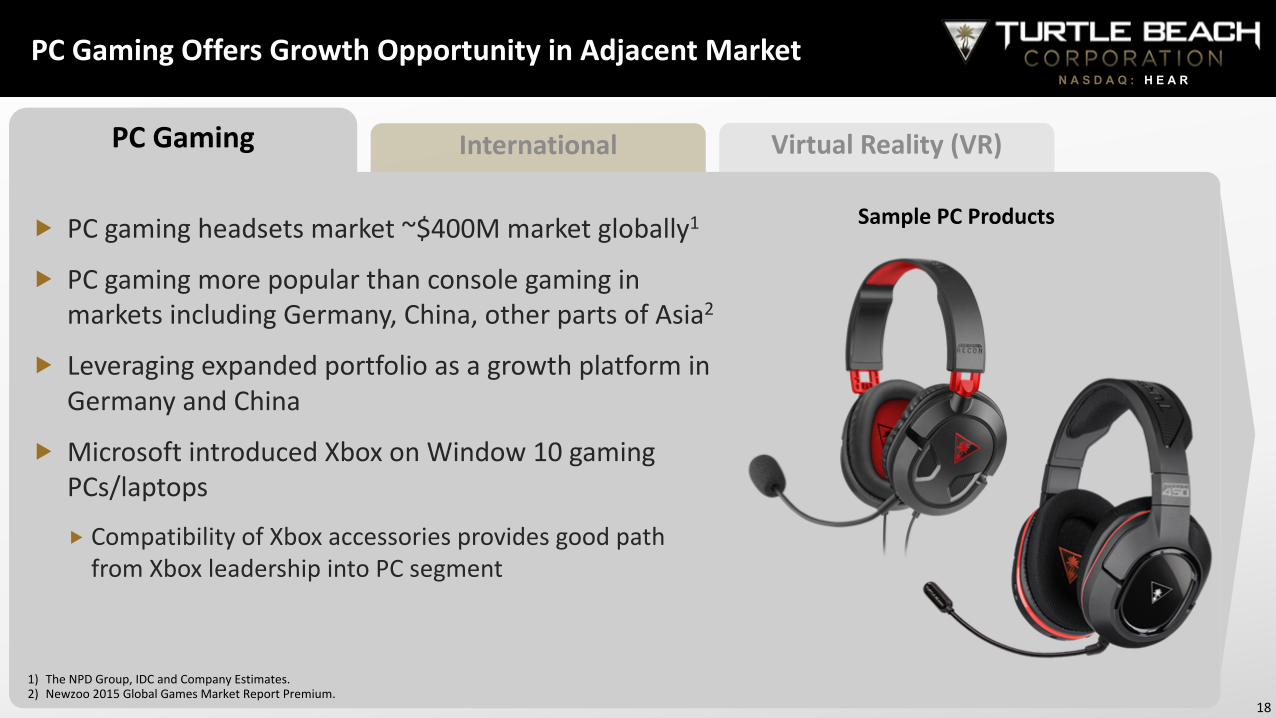
PCGamingOffersGrowthOpportunityinAdjacentMarket
18
� PCgamingheadsetsmarket~$400Mmarketglobally1
� PCgamingmorepopularthanconsolegaminginmarketsincludingGermany,China,otherpartsofAsia2
� LeveragingexpandedportfolioasagrowthplatforminGermanyandChina
� MicrosoftintroducedXboxonWindow10gamingPCs/laptops
� CompatibilityofXboxaccessoriesprovidesgoodpathfromXboxleadershipintoPCsegment
1) TheNPDGroup,IDCandCompanyEstimates.2) Newzoo2015GlobalGamesMarketReportPremium.
SamplePCProducts

N A S D A Q : H E A R
VirtualReality(VR)PCGaming International
ChinaisaLargeGamingMarketwithPCFocus,UntappedforTurtleBeach
19
� Chinarepresentslong-termgrowthopportunityforconsoleandPCgamingheadsets
� 530MChinesegamers2
� TurtleBeachrevenuesfromChinawellunder$1Min2016
� Initiatedmodestgrowthinvestmentin2016,expectedtorampin2018
� 73MEsportsaudienceinChinaofwhich42MareEsportsEnthusiasts2
� TurtleBeachinvestmentineSportsunderway
� GrowthPlansandexpansioninLatinAmerica
� 209Mestimatedgamers3
� TurtleBeachin12countriesandover1600storesinLatinAmerica
$13.8B
$33.7B
2013 2020E
ChineseGamesMarketForecast¹
1) Newzoo|Q22017Update|GlobalGamesMarketReport.2) Newzoo2016GlobalEsportsMarketReport.3) Newzoo2016GlobalGamesMarketReportPremium.

N A S D A Q : H E A R
VirtualReality(VR)PCGaming International
VirtualRealityOffersAdditionalLong-TermGrowthOpportunity
20
� AccordingtoSuperDataResearch,VRhardwaremarketexpectedtoreach$17.8Bby2020from$1.5Bin2016(85%CAGR)¹
� Consoleslikelytobekeydriverofnon-mobileVRasevidencedbySonyPSVRhaving70%+revenueshareofmajornon-mobileVRheadsetssinceOct’16launch²
� STEALTH350VR,ourfirstgamingheadsetdesignedforupcomingVRdevices,launchedinOct2016
STEALTH350VR
1) https://www.superdataresearch.com/market-data/virtual-reality-industry-report/2) February2017NPDreport.
N A S D A Q : H E A R
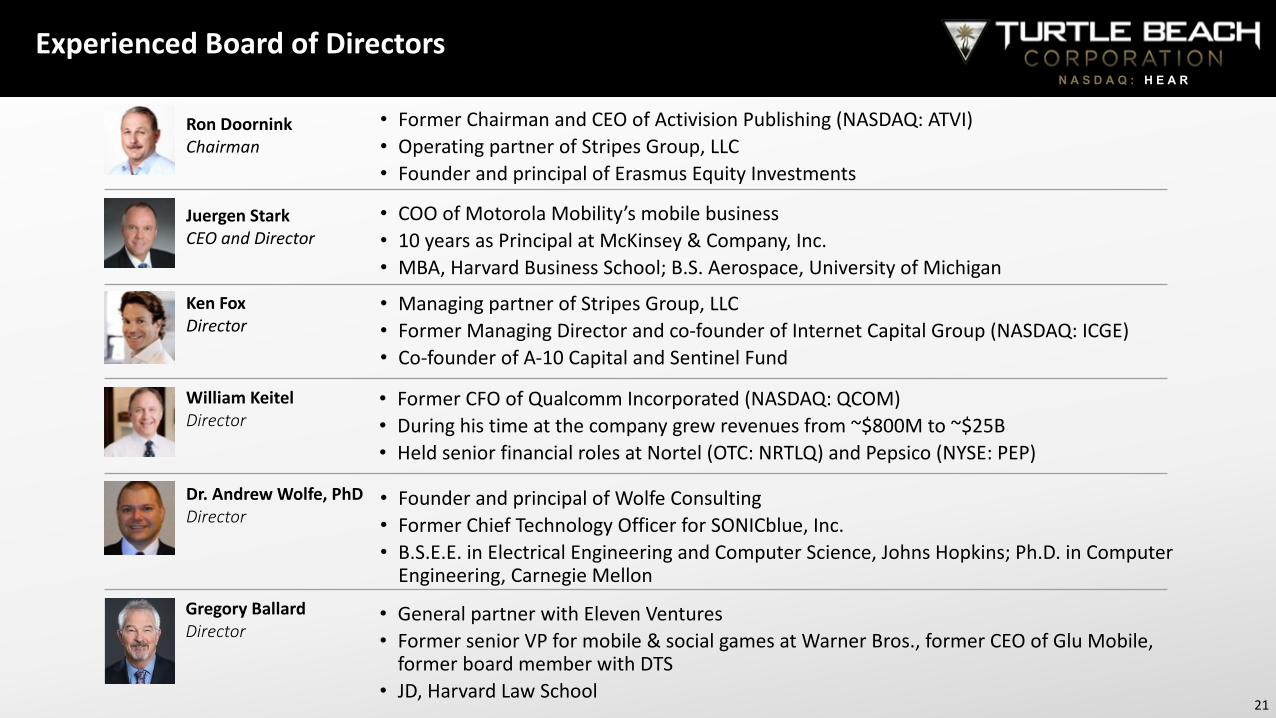
ExperiencedBoardofDirectors
KenFoxDirector
WilliamKeitelDirector
Dr.AndrewWolfe,PhDDirector
RonDoorninkChairman
• ManagingpartnerofStripesGroup,LLC• FormerManagingDirectorandco-founderofInternetCapitalGroup(NASDAQ:ICGE)• Co-founderofA-10CapitalandSentinelFund
• FormerCFOofQualcommIncorporated(NASDAQ:QCOM)• Duringhistimeatthecompanygrewrevenuesfrom~$800Mto~$25B• HeldseniorfinancialrolesatNortel(OTC:NRTLQ)andPepsico(NYSE:PEP)
• FounderandprincipalofWolfeConsulting• FormerChiefTechnologyOfficerforSONICblue,Inc.• B.S.E.E.inElectricalEngineeringandComputerScience,JohnsHopkins;Ph.D.inComputerEngineering,CarnegieMellon
• FormerChairmanandCEOofActivisionPublishing(NASDAQ:ATVI)• OperatingpartnerofStripesGroup,LLC• FounderandprincipalofErasmusEquityInvestments
JuergenStarkCEOandDirector
• COOofMotorolaMobility’smobilebusiness• 10yearsasPrincipalatMcKinsey&Company,Inc.• MBA,HarvardBusinessSchool;B.S.Aerospace,UniversityofMichigan
21
GregoryBallardDirector
• GeneralpartnerwithElevenVentures• FormerseniorVPformobile&socialgamesatWarnerBros.,formerCEOofGluMobile,formerboardmemberwithDTS
• JD,HarvardLawSchool

N A S D A Q : H E A R
ExperiencedManagementTeam
JuergenStarkCEO
• COOofMotorolaMobility’smobilebusiness• 10yearsasprincipalatMcKinsey&Company
RichardKuvalikCTO
• 15+yearsinconsumeraudio• LedperipheralproductsforPlayStationatSony
CrisKeirnSVP,GlobalSales
AndrewLilienVPofMarketing
MeganWynneGeneralCounsel
• 20+yearsofbrand,consumerandretailmarketingexperience
• PastexperienceatESPN,FleerTradingCardsandNationalMediaGroup
• 5yearswithI-Flow,aKimberly-ClarkHealthCareCompany
• 13yearswithMorrisPolich&Purdylawfirm
22
• LedheadsettransitionasVPofbusinessplanning&strategy
• 17yearswithMotorolainproductmanagement,operations,qualityandcustomerrelations
JohnHansonCFO
• EVPandCFOatDialogic• CFOatOneCommunicationsCorp
• 20+yearsintheConsumerElectronicsindustry• PreviouslywithSonyleadingtelevisionportfolioplanning&development,productmarketing
MattSeymourVP,ProductManagement
• 20+yearsoflogistics,transportationandoperationsexperience
• 11+yearsatTurtleBeachScottRankinVPGlobalLogistics
JoseRosadoVPGlobalOperations
• FormerSr.Director,GlobalSupplyChainOperationsforHP
• 22yearsofsupplychainmanagementwithMotorola,OnSemiconductor,HP,Cisco
N A S D A Q : H E A R
KeyTakeaways
� #1consolegamingheadsetbrandintheworld-~3xlargerthannextcompetitorbyrevenue
� $92billionglobalgamingopportunity
� Disruptive,cutting-edgetechnologiesandpatents
� New-genheadsettransitionexpectedtocontinuetoimprovemargins,profitabilityandcashflows
� 2017isfocusedonimprovingprofitabilityandstrengtheningthebalancesheet
� VR,PCgamingandinternationalexpansionallprovidemeaningfullonger-termheadsetgrowthopportunities
23

N A S D A Q : H E A RContactInformation
InvestorRelations: MediaContact:CodySlach MacleanMarshallLiolios TurtleBeachCorporation949.574.3860 [email protected] [email protected]
www.turtlebeach.com www.hypersound.com
COMPANY WEBS ITES
www.turtlebeachcorp.com
ContactUs
24

Appendix

N A S D A Q : H E A R
Q22017Outlook
26
Q2-17¹ YoY ∆2 ManagementCommentary&Assumptions
Revenue $17-$18M (40)%
- Lingeringimpactof weakholiday’16sales- Higher-than-normalpost-holidaychannelinventory- NewQ3productlaunchesexpectedtoimpactQ2ascompanypullsbacksalestoprepforlaunchofreplacementmodels
Adj.EBITDA $(5.5)M 13% - Reflectsanticipated lowerrevenuebutlower opex(betteradj.EBITDAmargins)
EPS $(0.17)-$(0.19) 22%³ - Profitexpectedtoincreasedespiteweakoperatingenvironmenthighlightsstrongexpensemanagement
1) GuidanceeffectiveonMay9,2017.2) Deltareflectsmidpointoftheoutlook.3) AssumesQ2-16EPSof$(0.23),whichexcludesa$0.63non-cashgoodwillimpairmentcharge.

N A S D A Q : H E A R
FinancialOverview– LastReportedQuarter
271) Seeslides28and29forareconciliationofnon-GAAPmeasures.
2016 2017 YOY∆$inmillions(exceptpersharedata) Q1 Q1Revenue $24.0 $14.4 -40%
GrossProfit $3.4 $2.2 -34%
GrossMargin 14.0% 15.4% +140bps
HeadsetGrossMargin 19.9% 19.5% -40bps
OperatingExpenses $13.1 $10.3 Reduced22%
OperatingIncome(Loss) ($9.8) ($8.1) +$1.7
HeadsetOperatingIncome ($5.3) ($7.1) -$1.8
GAAPNetIncome(Loss) ($12.0) ($9.9) +$2.1
GAAPEPSDiluted ($0.26) ($0.20) +$0.06
Non-GAAPNetIncome(Loss)1 ($11.8) ($9.3) +$2.5
Non-GAAPEPSDiluted¹ ($0.26) ($0.19) +$0.07
Adj.EBITDA¹ ($6.3) ($6.2) +$0.1
HeadsetAdj.EBITDA ($3.2) ($5.6) -$2.4

N A S D A Q : H E A R
ReconciliationofGAAPandNon-GAAPMeasures
28
ThreeMonthsEndedMarch31,2017 March31,2016
NetIncome(Loss)GAAPNetIncome(Loss) $ (9,926) $ (12,011)
Businesstransitioncharges 651 225Non-GAAPEarnings (9,275) (11,786)
DilutedEarningsPerShareGAAP- Diluted $ (0.20) $ (0.26)
Businesstransitioncharges $ 0.01 $ —Non-GAAP- Diluted $ (0.19) $ (0.26)
N A S D A Q : H E A R
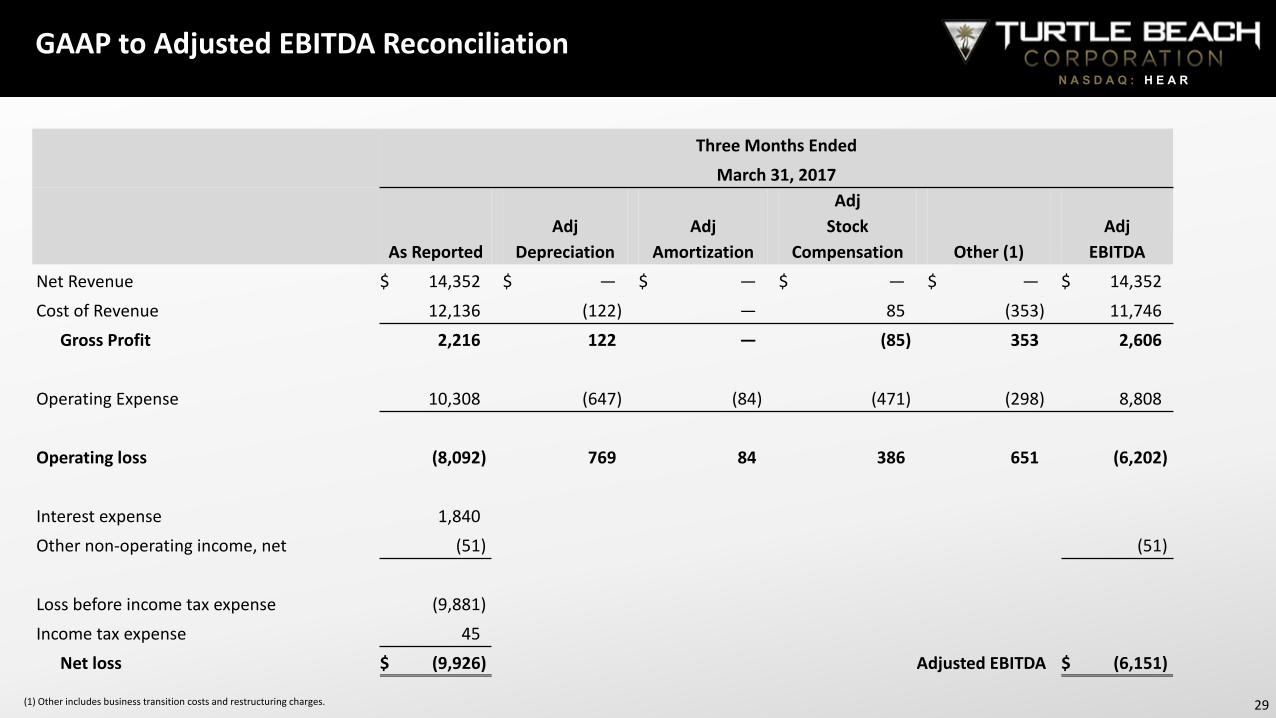
GAAPtoAdjustedEBITDAReconciliation
29(1)Otherincludesbusinesstransitioncostsandrestructuringcharges.
ThreeMonthsEndedMarch31,2017
AsReportedAdj
DepreciationAdj
Amortization
AdjStock
Compensation Other(1)Adj
EBITDANetRevenue $ 14,352 $ — $ — $ — $ — $ 14,352CostofRevenue 12,136 (122) — 85 (353) 11,746
GrossProfit 2,216 122 — (85) 353 2,606
OperatingExpense 10,308 (647) (84) (471) (298) 8,808
Operatingloss (8,092) 769 84 386 651 (6,202)
Interestexpense 1,840Othernon-operatingincome,net (51) (51)
Lossbeforeincometaxexpense (9,881)Incometaxexpense 45
Netloss $ (9,926) AdjustedEBITDA $ (6,151)

N A S D A Q : H E A R
GAAPtoAdjustedEBITDAReconciliation(continued)
30
December31,2016 December31,2015 December31,2014 December31,2013
NetIncome(Loss) (87,182) (82,907) (15,485) (6,163)
Depreciation 5,066 5,901 5,800 4,422
Amortizationofintangibles 4,128 2,015 1,066 923
Interest 7,447 5,100 7,209 6,626
Taxes (387) 2,392 (6,272) 1,090
StockCompensation 3,960 5,897 5,194 2,563
RestructuringExpense 664 399 747 527
Goodwill 63,236 49,822 - -
BusinessTransactionExpense 7,079 - 3,744 3,864
EBITDA 4,011 (11,381) 2,003 13,852
N A S D A Q : H E A R
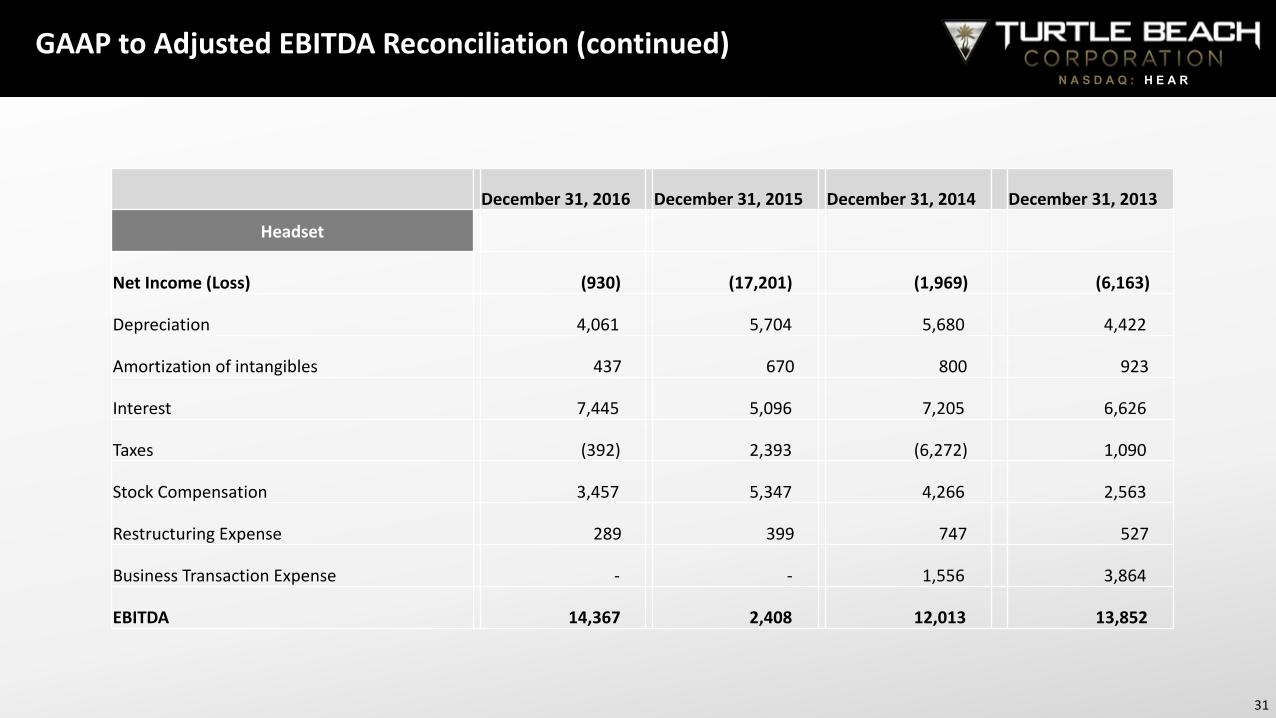
GAAPtoAdjustedEBITDAReconciliation(continued)
31
December31,2016 December31,2015 December31,2014 December31,2013
Headset
NetIncome(Loss) (930) (17,201) (1,969) (6,163)
Depreciation 4,061 5,704 5,680 4,422
Amortizationofintangibles 437 670 800 923
Interest 7,445 5,096 7,205 6,626
Taxes (392) 2,393 (6,272) 1,090
StockCompensation 3,457 5,347 4,266 2,563
RestructuringExpense 289 399 747 527
BusinessTransactionExpense - - 1,556 3,864
EBITDA 14,367 2,408 12,013 13,852

N A S D A Q : H E A R
GAAPtoAdjustedEBITDAReconciliation(continued)
32
December31,2016 December31,2015 December31,2014 December31,2013
HyperSound
NetIncome(Loss) (86,252) (65,706) (13,516) -
Depreciation 1,005 197 120 -
Amortizationofintangibles 3,691 1,345 266 -
Interest 2 4 4 -
Taxes 5 (1) - -
StockCompensation 503 550 928 -
RestructuringExpense 375 - - -
Goodwill 63,236 49,822 - -
BusinessTransactionExpense 7,079 - 2,188 -
EBITDA (10,356) (13,789) (10,010) -


