14
Hearing Lab Tests
| Date post: | 14-Dec-2015 |
| Category: |
Documents |
| Upload: | tracy-west |
| View: | 219 times |
| Download: | 1 times |

Hearing Lab Tests

Rinne Test
• http://www.webster.edu/~davittdc/ear/rinne/rinne.htm
• http://video.about.com/deafness/Hearing-Test.htm

Rinne Test
• Hearing is NORMAL:– Air conduction will be heard TWICE as long as
bone conduction
• Conductive Hearing Impairment:– Bone conduction is heard longer than or equally
as long as air conduction
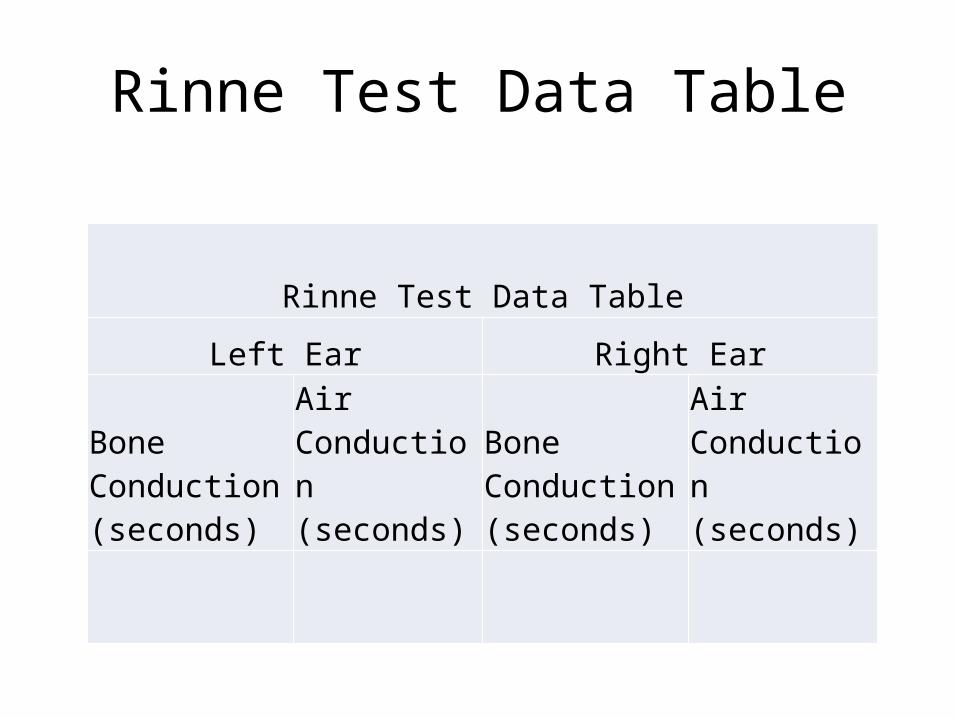
Rinne Test Data Table
Rinne Test Data Table
Left Ear Right EarBone Conduction (seconds)
Air Conduction (seconds)
Bone Conduction (seconds)
Air Conduction (seconds)

Speech-in-Noise Test
• Sensorineural hearing loss:– Difficult time understanding speech in the
presence of background noise.
• http://press.hear-it.org/page.dsp?forside=yes&area=1189
Audiogram
• One of the most important tests used to assess hearing– Pure Tone Test
• Audiometer– Used to measure a subject’s hearing sensitivity
• Plays a series of beeps or tones at a distinct frequency– Every time the person hears a beep, the person raises their finger (or
pushes a button)– The tone gets softer and softer
• The softest sound the person hears is the THRESHOLD for that particular frequency.
• Threshold will then be tested for those frequencies ranging from 250 Hz to 8,000 Hz.
– Thresholds are recorded on a graph called AUDIOGRAM

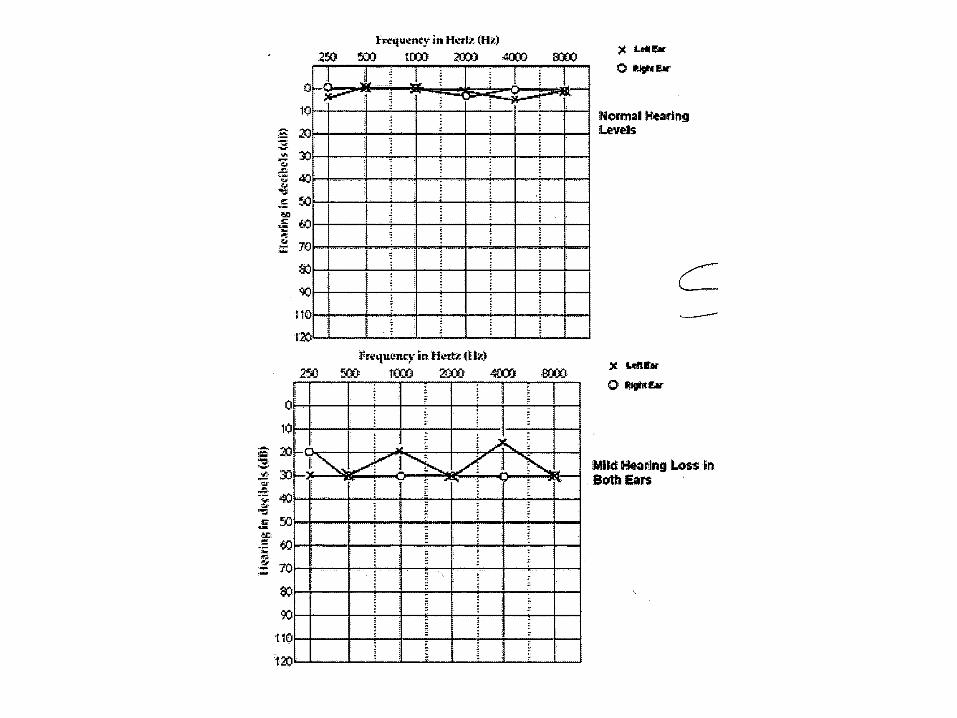
Audiogram
• Frequencies on x-axis• Hearing Thresholds on y-axis – In decibels
• X=left ear• O=right ear

Hearing Loss
• On graph: X and O’s are connected– Keeps track of hearing levels across different
pitches• Hearing Loss:– Normal, Mild, Moderate, Moderately Severe, and
Profound

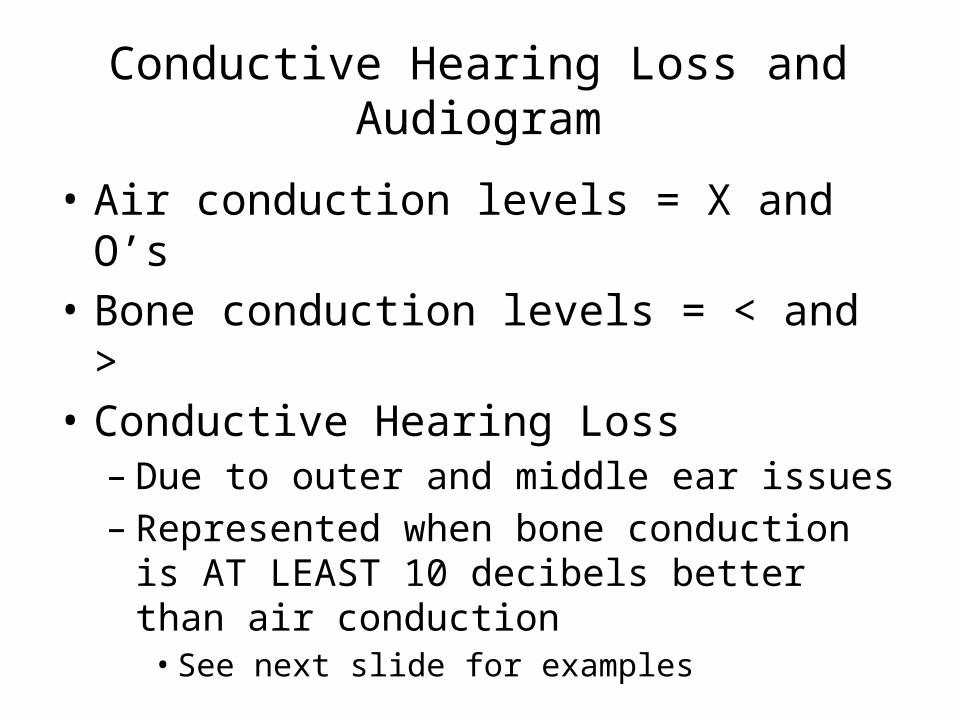
Conductive Hearing Loss and Audiogram
• Air conduction levels = X and O’s• Bone conduction levels = < and >• Conductive Hearing Loss– Due to outer and middle ear issues– Represented when bone conduction is AT LEAST
10 decibels better than air conduction• See next slide for examples

Conductive Hearing Loss
• Left audiogram = no hearing loss• Right audiogram = conductive hearing loss

Audiogram Website
• http://lloydhearingaid.com/shopping/audiogram.asp

Hearing Loss Lab• You will conduct the following
– Rinne Test• Record results in Rinne Test Table (see slide 4)
– Speech-in-noise Test• Record results
– Can start new table under Rinne Test Table
– Audiogram• Using Logger Pro• Copy and Paste Graphs• Create COLUMN GRAPH in Excel
– Comparing your Hearing Results (Series 1) with Minimum Normal Hearing (Series 2) and Maximum Normal Hearing (Series 3)
• You should be able to discuss:– Do you have conductive hearing loss? (see slides 11 and 12)– Is your hearing in normal range? (see slide 3 and 8)– Do you have sensorineural hearing loss? (see slide 5)
• You will write a lab report INDIVDUALLY!!!! (see Lab Report Hand Out)– Lab Report will be due on Wednesday/Thursday


