144


HEARTLAND COMMUNITY COLLEGE COMMUNITY COLLEGE DISTRICT #540
COMPREHENSIVE ANNUAL FINANCIAL STATEMENTS
YEARS ENDED JUNE 30, 2018 AND 2017
Prepared by:
Business Services
Doug MinterVice President of Business Services
Sharon McDonaldController

HEARTLAND COMMUNITY COLLEGE COMMUNITY COLLEGE DISTRICT #540
TABLE OF CONTENTSYEARS ENDED JUNE 30, 2018 AND 2017
INTRODUCTORY SECTION
PRESIDENT’S LETTER ILETTER OF TRANSMITTAL IIPRINCIPAL OFFICIALS XIVORGANIZATIONAL CHART XVCERTIFICATE OF ACHIEVEMENT FOR EXCELLENCE IN FINANCIAL
REPORTING XIX
FINANCIAL SECTION
INDEPENDENT AUDITORS’ REPORT 1MANAGEMENT’S DISCUSSION AND ANALYSIS 4BASIC FINANCIAL STATEMENTS
STATEMENTS OF NET POSITION 18STATEMENTS OF REVENUES, EXPENSES, AND CHANGES IN NET POSITION 20STATEMENTS OF CASH FLOWS 21NOTES TO BASIC FINANCIAL STATEMENTS 23
REQUIRED SUPPLEMENTARY INFORMATION
REQUIRED SUPPLEMENTARY INFORMATION (SURS COVERED PAYROLL) 55SCHEDULE OF DISTRICT’S PROPORTIONATE SHARE OF THE NET OPEB
LIABILITY 56SCHEDULE OF DISTRICT’S CONTRIBUTIONS 57NOTES TO REQUIRED SUPPLEMENTARY INFORMATION – COMMUNITY
COLLEGE HEALTH INSURANCE SECURITY FUND 58
STATISTICAL SECTION (UNAUDITED)
STATISTICAL SECTION CONTENTS 60NET POSITION BY COMPONENT 61CHANGES IN NET POSITION 62ASSESSED VALUE AND ACTUAL VALUE OF TAXABLE PROPERTY 63PROPERTY TAX RATES – DIRECT AND OVERLAPPING GOVERNMENTS WITHIN
MCLEAN COUNTY 65PRINCIPAL TAXPAYERS 66PROPERTY TAX LEVIES AND COLLECTIONS 67ENROLLMENT, TUITION AND FEE RATES, CREDIT HOURS, AND TUITION AND
FEE REVENUES GENERATED 68RATIOS OF OUTSTANDING DEBT BY TYPE 69RATIOS OF NET GENERAL BONDED DEBT OUTSTANDING 70LEGAL DEBT MARGIN INFORMATION 71LISTING OF DIRECT AND OVERLAPPING BONDED DEBT 72PERSONAL INCOME PER CAPITA 75PRINCIPAL EMPLOYERS 76PROPERTY VALUES, CONSTRUCTION, AND BANK DEPOSITS 77NUMBER OF EMPLOYEES 78STUDENT CREDIT HOURS BY ENROLLMENT CATEGORIES 79STUDENT ENROLLMENT DEMOGRAPHIC STATISTICS 80CAPITAL ASSET STATISTICS 81
HEARTLAND COMMUNITY COLLEGE COMMUNITY COLLEGE DISTRICT #540
TABLE OF CONTENTSYEARS ENDED JUNE 30, 2018 AND 2017
CAPITAL ASSET STATISTICS – SCHOOL BUILDING INFORMATION 82EQUALIZED ASSESSED VALUATIONS AND TAXES EXTENDED AND
COLLECTED 83SUMMARY OF TAXES RECEIVABLE AND TAX COLLECTIONS 84
CERTIFICATION OF CHARGEBACK REIMBURSEMENT FORM 86
ICCB STATE GRANTS SECTION
INDEPENDENT AUDITORS’ REPORT ON THE ADULT EDUCATION AND FAMILY LITERACY GRANTS PROGRAM 88
INDEPENDENT AUDITORS’ REPORT ON COMPLIANCE 90ADULT EDUCATION AND FAMILY LITERACY GRANT
STATEMENT OF NET POSITION 91STATEMENT OF REVENUES, EXPENDITURES, AND CHANGES IN NET
POSITION 92BACKGROUND INFORMATION ON STATE GRANT ACTIVITY 93NOTE TO ICCB GRANT PROGRAM FINANCIAL STATEMENTS 94SUPPLEMENTARY SCHEDULE 95
SUPPLEMENTARY ICCB SCHEDULES
INDEPENDENT ACCOUNTANTS’ REPORT ON SCHEDULE OF ENROLLMENT DATA AND OTHER BASES UPON WHICH CLAIMS ARE FILED 97
SCHEDULE OF ENROLLMENT DATA AND OTHER BASES UPON WHICH CLAIMS ARE FILED 98
DOCUMENTATION OF RESIDENCY VERIFICATION STEPS 100
UNIFORM FINANCIAL STATEMENT SECTION
UNIFORM FINANCIAL STATEMENT NO. 1 – ALL FUNDS SUMMARY 102UNIFORM FINANCIAL STATEMENT NO. 2 – SUMMARY OF CAPITAL ASSETS
AND DEBT 103UNIFORM FINANCIAL STATEMENT NO. 3 – OPERATING FUND REVENUES AND
EXPENDITURES 104UNIFORM FINANCIAL STATEMENT NO. 4 – RESTRICTED PURPOSES FUND
REVENUES AND EXPENDITURES 106UNIFORM FINANCIAL STATEMENT NO. 5 – CURRENT FUNDS EXPENDITURES
BY ACTIVITY 107
FEDERAL FINANCIAL AND COMPLIANCE SECTION
INDEPENDENT AUDITORS’ REPORT ON INTERNAL CONTROL OVER FINANCIAL REPORTING AND ON COMPLIANCE AND OTHER MATTERS BASED ON AN AUDIT OF FINANCIAL STATEMENTS PERFORMED IN ACCORDANCE WITH GOVERNMENT AUDITING STANDARDS 110
INDEPENDENT AUDITORS’ REPORT ON COMPLIANCE FOR EACH MAJOR FEDERAL PROGRAM AND REPORT ON INTERNAL CONTROL OVER COMPLIANCE REQUIRED BY THE UNIFORM GUIDANCE 112
SCHEDULE OF EXPENDITURES OF FEDERAL AWARDS 114NOTES TO SCHEDULE OF EXPENDITURES OF FEDERAL AWARDS 115SCHEDULE OF FINDINGS AND QUESTIONED COSTS 117
INTRODUCTORY SECTION
HEARTLAND COMMUNITY COLLEGE
®
October 12, 2018 President's Letter
(
Members of the Board of Trustees:
It is with pleasure that I submit, to you and the residents of District 540, the Heartland Community College Comprehensive Annual Financial Report (CAFR) for the Fiscal Year ended June 30, 2018. Heartland is committed to supporting the success of all students. The 2018 CAFR provides evidence that the College is well positioned to serve its communities as a leader in higher education and a responsible financial steward.
Serving the Central Illinois area, Heartland Community College remains an important educational option for area students and community members. The College continues to provide a significant return on investment for our community. Student success, community engagement and responsiveness, and fiscal responsibility are the bedrocks of Heartland's many great accomplishments. Those key priorities make Heartland an outstanding institution, intent on keeping higher education affordable for our students as they pursue their dreams and lifelong ambitions.
Heartland is committed to fiscal responsibility. As a steward of public tax dollars and student tuition and fees, Heartland is entrusted to provide District 540 with quality academic programs, valuable community services, and access to all individuals whom we serve. To that end, Heartland Community College will continue to appropriately utilize existing revenue streams. The College also will continue to identify and pursue new and innovative sources of funding to support future growth and development. At the same time, Heartland remains committed to implementing and promoting cost-effective strategies across all areas of the College. This will help ensure Heartland's sustainability.
On behalf of the entire Heartland Community College Family, it is my honor to express pride in 1soow. Raab Rd. how we serve our students, our District 540 community, and anyone needing our programs and Normal, IL 61761 services in order to achieve their success. (309) 268-8000 •
TDD (309) 268-8030 www.heartland.edu

HEARTLAND COMMUNITY COLLEGE
®
1500 W. Raab Rd. Normal, IL 61761 (309) 268-8000 •
TDD (309) 268-8030 www.heartland.edu
October 12, 2018
To Members of the Board of Trustees and Citizens of Heartland Community College District No. 540:
The Comprehensive Annual Financial Report (CAFR) of Heartland Community College District No. 540, Normal, Illinois, as of and for the fiscal year ended June 30, 2018 is hereby submitted. The CAFR provides a snapshot of Heartland's financial performance and major initiatives, as well as an overview of trends in the local economy. Above all, the report represents the College's commitment to inform members of the community about the College's finances.
Responsibility for both the accuracy of the data and the completeness and fairness of the presentation, including all disclosures, rests with the College. To the best of our knowledge and belief, the enclosed data is accurate in all material respects and is reported in a manner designed to present fairly the financial position and results of operations of the College. All disclosures necessary to enable the reader to gain an understanding of the College's financial activities, in relation to its mission, have been included.
CliftonLarsonAllen LLP, Certified Public Accountants, has issued an unmodified (clean) opinion on the Heartland Community College District No. 540 basic financial statements for the year ended June 30, 2018. The independent auditors' report is located at the front of the financial section of the report.
This letter of transmittal should be read in conjunction with Management's Discussion and Analysis (MD&A), which immediately follows the independent auditors' report. The MD&A provides a narrative introduction, analyses of the basic financial statements, and focuses on current activities, accounting changes, and currently known facts.
PROFILE OF THE COLLEGE
Heartland Community College is a comprehensive community college operating in accordance with the provisions of the Illinois Public Community College Act and is recognized by the Illinois Community College Board (ICCB). The College is accredited by the Higher Learning Commission.
(II)

(III)
The College District extends roughly from Lincoln, Illinois on the south, along Interstate 55, and north to Pontiac, Illinois. Of the nearly 214,000 district residents, about two-thirds reside in incorporated areas. Bloomington-Normal is the largest population center of this region. The District includes most of McLean County and parts of DeWitt, Ford, Livingston, Logan and Tazewell counties. The main campus is located in Normal, Illinois (McLean County) with centers in both Lincoln and Pontiac.
VISION, MISSION, FOUNDATIONAL COMMITMENTS, AND OUR ENDURING GOALS
Heartland Community College is committed to student success. The College represents a vital and progressive center for learning as manifested in its vision and mission statements, and strategic priorities and goals.
VisionLeading our community to lifelong learning and success.
MissionHeartland provides accessible, innovative learning opportunities and resources that enrich our community.
Foundational Value Statements and College-Wide Priorities and GoalsThe seven Foundational Value Statements that will support our priorities, goals and operations are:
1. We are learner-centered, focused on creating a personalized path to success foreach holistic learner.
2. We inspire an upbeat, can-do attitude, empowering our students, ourcommunities, and each other to fully actualize our potential.
3. We support professional development of all employees so that we maycontinually adapt and improve.
4. We are all partners in the success of the organization, boldly embracing currentand future options that will empower our students and communities.
5. We respect all individuals; civility, collegiality, and the highest standards ofprofessionalism characterize Heartland’s daily environment.
6. We are proud of our College’s quality but always seek improvement.7. We practice ethical decision-making and responsible use of environmental,
financial, and community resources to promote a sustainable future.
Heartland Community College strives to foster a culture of data-informed continuous improvement to attain its priorities and goals. Our college-wide priorities and goals are:

(IV)
Promote Student Success Increase percentage of students progressing toward and completing their
educational and career goals. Improve student satisfaction. Increase student achievement of the College’s Essential Competencies.
Ensure Resource Stewardship Improve employee satisfaction. Maintain or increase the College’s financial health. Maintain or increase value of the College’s physical assets.
Serve as a Community Resource Meet emerging workforce needs through education and training programs. Fulfill unmet community demand for personal enrichment and professional
learning.Model Effective Communication, Collaboration and Transparency
Intentionally obtain and incorporate employee input. Improve internal dissemination of information. Share resources, responsibilities and results to achieve college-wide goals.
The College’s strategic plan was updated and approved by the Board of Trustees inAugust 2017. Although the new plan includes updated vision and mission statements as well as institutional priorities, some of the priorities of the previous strategic plan continue to be embeeded in the current plan.
FINANCIAL INFORMATION
The College maintains its accounts and prepares its financial statements in accordance with accounting principles generally accepted in the United States of America as set forth by the Governmental and Financial Accounting Standards Boards, the National Association of College and University Business Officers and the Illinois Community College Board (ICCB). The ICCB requires accounting by funds in order to easily account for limitations and restrictions on resources. The financial records of the College are maintained on the accrual basis of accounting whereby all revenues are recorded when earned and all expenses are recorded when they have been reduced to a legal obligation to pay. The notes to the financial statements expand and explain the financial statements and the accounting principles applied.
The Business Services Division is responsible for directing the College’s fiscal, human resources, administrative services, information technology, and facilities operations. Managing resources with strict attention to dynamic facility, funding, technology, and staffing requirements has been the primary goal of the Division. Financial resources and their management have also been strongly influenced by the Board of Trustees. The Board’s financial policies, directives, and decisions have set the tone for fiscal stewardship and accountability since the College’s founding.

(V)
In an effort to continue to improve fiscal understanding of the College budget as well as to increase transparency and communication, a modified zero-based budgeting approach was used to develop both the fiscal year 2018 and 2019 annual budgets. A highly collaborative online tool and process was used to engage budget managers from across the College.
Management of the College is responsible for establishing and maintaining an internal control structure designed to ensure that the assets of the College are protected from loss, theft, or misuse, and to ensure that transactions are properly recorded to allow for the preparation of financial statements in conformity with generally accepted accounting principles. The internal control structure is designed to provide reasonable, but not absolute assurance that these objectives are met. The concept of reasonable assurance recognizes that (1) the cost of a control should not exceed the benefits likely to be derived; and (2) the valuation of the costs and benefits requires estimates and judgments by the College.
The College maintains budgetary controls. Their primary objective is to ensure compliance with legal provisions embodied in the annual appropriated budget approved by the College’s Board of Trustees. The level of budgetary control (that is, the level at which expenditures cannot exceed the appropriated amount) is established for each individual fund. The College also maintains an encumbrance accounting system as one method for accomplishing budgetary control. Encumbered amounts lapse at year-end but may be re-authorized as part of the following year’s budget only when funds are available and with appropriate administrative approvals. As demonstrated by the statements and schedules included in the financial section of this report, the College continues to meet its responsibility for sound financial management.
ECONOMIC CONDITION AND OUTLOOK
The financial position of the College is strong. This is attributed to a stable and diverse local economy, strong management practices by a quality and stable administration and Board of Trustees, favorable reserve levels and proactive financial planning, strong budgetary management and cost controls, moderate debt burden with rapid payback, and a healthy property tax base. Over the last ten years, the College’s net position has decreased from $42.6 million in fiscal year 2008 to $41.8 million in fiscal year 2018. The decrease in net position was due to a prior period adjustment of $16.8 million, which accounts for the Governmental Accounting Standard Board’s (GASB) Statement Number 75. GASB Statement Number 75 requires the College to record a liability for any OtherPost Employment Benefits (OPEB). The OPEB liability is the College’s proportionateshare of the liability related to the Community College Health Insurance Security Fund(CCHISF) (also known as the College Insurance Program, “CIP”). The liability wascalculated by an actuarial retained by the State of Illinois and is reported with ameasurement date of June 30, 2017.

(VI)
State of Illinois Economy
The State of Illinois economy continues to show some signs of improvement at a rate that nevertheless continues to lag the nation. The unemployment rate for Illinois as of May 2018 was 4.3 percent (down from 4.6 percent in May 2017).
The State’s employment growth numbers also continue to trail those of the rest of the nation. Illinois has gained 0.7% employment growth over the last year, from May 2017 to May 2018, as reported by the US Bureau of Labor Statistics.
The Illinois Department of Employment Security has projected employment growth through the year 2024 by industry for the State of Illinois. The top two areas of growth are in Professional-Business Services and Health Care & Social Assistance. In order to find gainful employment in both of these industries, many will be required to obtain additional training and education from vocational schools, community colleges, or four-year colleges and universities.
The State of Illinois continues to struggle with its financial condition. On July 6, 2017, the General Assembly of the State enacted a budget for the State fiscal year ending June 30, 2018. The Fiscal Year 2018 Budget appropriated community college funding equal to the fiscal year 2015 levels. This yielded a Fiscal Year 2017 supplemental system grant to Heartland Community College for an additional $2,492,810 (includes the adult education state funding, base operating grant, career and technical education funding, a state veteran’s grant, and ISAC-MAP funding). However, because of Governmental Accounting Standard Board (GASB) rulings, the Fiscal Year 2017 supplemental funding must be recognized as revenue in Fiscal Year 2018.
The Fiscal Year 2019 State Budget was appropriated in a timely fashion with an increase of 2% for community colleges and will be recognized as revenue in Fiscal Year 2019. The College’s concern about the loss of authority to levy an equity tax was realized and reflected in the Fiscal Year 2019 Budget with the College’s first deficit operating budget. This has driven the need to focus a significant amount of time and effort on multi-year budgetary plans and strategies.
The State is now shifting some pension costs by changing employer contribution requirements. The State University Retirement System (SURS) will now require employers that have employee final average earnings impacted by salary increases in excess of 3% (instead of 6%) to contribute the actuarially computed difference to SURS.

(VII)
District Economy
The Heartland Community College district is an important business and agricultural region in central Illinois, supported by two major insurance companies, farm implement and agricultural products dealers, and financial and health care institutions. Some of the largest employers in the district are State Farm Insurance Companies (corporate and regional headquarters), Illinois State University, COUNTRY Financial, Advocate BroMenn Medical Center, Normal School District #5, TEK Systems, Caterpillar, Inc., OSF St. Joseph Medical Center, Heartland Community College, and Growmark.
The District has several higher education institutions. Bloomington-Normal is the location of two universities, Illinois State University in Normal (with an on-campus enrollment of 18,643 undergraduate students in 2017 according to their website) and Illinois Wesleyan University in Bloomington (with an enrollment of approximately 1,771 students in 2017 according to their website). Lincoln, in the southern part of the district, has two colleges: Lincoln College, a private residential college that offers instruction to about 1,068 total students, and Lincoln Christian University, a private four-year institution of about 779 students. Several cooperative arrangements and educational alliances have been established with some of these institutions, as well as with some of our peer Illinois community colleges.
Bloomington-Normal and McLean County retail sales for 2017 were $2,348,607,573, which was an increase of 0.6 percent from 2016 retail sales. Median household income for McLean County was $63,420, making it one of the highest counties in the State. The most recent population of the County was 176,271. Population in the County is projected to continue to grow, reaching 180,895 by 2022. The current population of the entire district is 214,185. These economic growth indicators bode well for the community and for Heartland Community College.
Tax Base
The Heartland Community College District 2017 tax levy base of $4,464,342,208 increased by 0.91 percent from the 2016 tax base. This followed an increase of 2.49 percent in the previous year. Modest residential and commercial growth is expected to continue, with a projected increase of between one and two percent in the 2017 tax levy base. The value of farmland and the varieties of construction growth have been key factors in the District’s historical economic growth. There has been continued growth within the District in green economy initiatives such as wind farms.
The district Equalized Assessed Valuation (EAV) is projected to increase slightly, between one and two percent per annum, for the next two to three years. Local property taxes will continue to be a significant source of revenue for the College. During fiscal year 2018, local property taxes accounted for 39.7 percent of total revenues. Local support represents 35.1 percent of total operating fund revenues in the fiscal year 2019 budget.

(VIII)
There is some uncertainty regarding local tax support. Property tax freeze legislation has been advocated by the Governor and appears to have some support of the General Assembly. The College is monitoring the potential for a freeze and its impact on local property tax revenue.
Net Position and Liquidity
In fiscal year 2018 a prior period adjustment of $16.8 million was made to the beginning of the year net position due to the Governmental Accounting Standards Board (GASB) Statement Number 75. This statement requires the College to record a liability for any Other Post Employment Benefits (OPEB). The OPEB liability is the College’s proportionate share of the liability related to the Community College Health Insurance Security Fund (CCHISF) (also known as the College Insurance Program, “CIP”). The College’s net position at the end of fiscal year 2018 decreased to $41.8 million as compared to fiscal year 2017’s ending net position of $51.8 million. Net position was 73.7 percent of total fiscal year 2018 operating expenses. Liquidity is strong, with $38.4 million of cash and short-term investments at year end.
College Enrollment
Credit hour enrollment declined by 1.0 percent during fiscal year 2018 as compared to a 1.7 percent decline in 2017. This was the fifth consecutive year for an enrollment decline. Heartland’s enrollment patterns are affected by the economy and have trended more positively, in recent years, than State and national enrollments at other community colleges where declines have been larger and occurring for more years.
For the current fall semester of fiscal year 2019 (fall 2018) total credit hours and the full-time equivalent (FTE) count both decreased by 5.0 percent. Total credit hours for fall 2018 were 43,672 as compared to 45,972 in fall 2017. Student headcount at tenth day however, decreased by 2.2 percent to 4,848 students from 4,955 students in the previous fall of 2017. Five years ago, in the fall 2013 semester, 5,005 students were enrolled in 47,865 credit hours. The five-year decline in students is 157 or 3.1 percent and in credit hours is 4,193 or 8.8 percent.
The College has established several initiatives and teams to address enrollment-related strategies for assessing and improving student registration, engagement, persistence and retention. This initiative is a network of intentional supports embedded throughout the College to foster student success at every level. Partnerships are key to the overall Heartland mission.

(IX)
The initiative partners the College with students, K-12 schools, universities, families, businesses, and our community to create the right circumstances for increased learning and planned progress. Essentially, Heartland is developing the capacity to increase high school graduation rates and college readiness by collaboratively developing and providing career, college, and life planning services. These broad support services will be provided at Heartland and in area high schools for students, whether or not they attend Heartland.
The College invested in its Lincoln, Illinois site in fiscal year 2018 by committing to a new lease for a site that has more room and ample parking for our students. The College will be able to utilize the extra space for more classes including Adult Education and CNA classes.
The fiscal year 2019 budget was predicated on an overall 5.0 percent decrease in budgeted credit hours from fiscal year 2018’s actual credit hours. We believe the enrollment declines during 2018 and the five previous fiscal years have been driven by: (1) economic factors; (2) declines in high school graduating class sizes; and (3) changesthat restrict continuing federal financial aid eligibility. Most of our peer institutions haveseen similar declines in enrollment this year and in previous years.
An increase of $5.00 was made to the in-district tuition and fees rate between fiscal year 2018 and fiscal year 2019. Heartland’s current per credit hour in-district tuition and fees rate of $153.00 and is now ranked as #10 (from the highest) in tuition rates among other Illinois community colleges.
Adult Education fiscal year 2017 funding was in limbo until the State of Illinois passed the Supplemental Budget on July 6, 2017, which funded fiscal year 2018 along with providing supplemental funding for fiscal year 2017. Due to GASB rules, the revenues for fiscal year 2017 and fiscal year 2018 are recorded in fiscal year 2018.
In fiscal year 2018, overall revenues in the College’s continuing education programs decreased from fiscal year 2017 mainly due to a discontinued agreement with one instructional provider. Sales and service fees from continuing education programs were $1,247,837 in fiscal year 2018 as compared to $2,978,703 in 2017, which was down $1,730,866. The single provider accounted for $1,710,978, or all but $20,000, of the decline in revenue.
Adult, community, and corporate education programs and offerings are projected to increase for fiscal year 2019. This is due to growing continuing education programs with local corporate partners.
The ethnicity of Heartland’s students, for the most part, reflects that of the District in that approximately 81.5 percent of the students are white non-Hispanic. More than 40 percent of the students receive financial aid, mainly from federal and state grants, scholarships, loans, and student employment. The College has the resources required to serve a growing and diverse student enrollment and to respond to changing enrollments.

(X)
Federal Government
Federal grant activity is 2.4 % lower in 2018 compared to 2017. Federal grants accounted for 12.4 percent of the College’s total revenues during fiscal year 2018 as compared to 14.8 percent in 2017. Student awards and loans are approximately $90,000 less in 2018 compared to 2017. Federal financial aid dollars for student awards and loans accounted for approximately $8.9 million (or 92.7 percent) of the federal total. As one of its strategic priorities, the College is committed to seeking alternate revenue sources, such as federal grant funds, to support new initiatives.
Component Unit
The Heartland Community College Foundation, considered a component unit of the College, assists the College and its students by providing scholarships and grants from its fundraising efforts. The Foundation’s net position increased from $6.4 million at the end of fiscal year 2017 to $6.8 million in 2018. The Foundation also awarded $442,331 in student scholarships during fiscal year 2018.
DEBT ADMINISTRATION
The College had general bonded debt of $75,157,077 as of June 30, 2018 and $76,973,512 as of June 30, 2017. The $1,816,435 decrease from 2018 to 2017 is the result of several different factors: (1) principal payments totaling $17,200,000 (reducing debt); (2) amortization of bond premiums totaling approximately $746,973 (reducing debt); (3) current refunding of $43,830,000 of the outstanding balance of the Series 2007 issue of General Obligation College Bonds with General Obligation Community College Bonds, Series 2017B and Series 2017C of $38,860,000, which included additional bond premiums of $5,387,559 (increasing debt by $417,559); (4) issuance of $5,515,000 limited tax General Obligation Debt Certificates, Series 2017D (increasing debt by $5,515,000); and (5) issuance of General Obligation Community College Bonds, Series 2018A of $10,145,000 which included additional bond premiums of $59,849 (increasing debt by $10,197,979).
The College refunded $43,830,000 of the Series 2007 issue of General Obligation College Bonds with General Obligation Community College Bonds, Series 2017B for $37,535,000 and Taxable General Obligation Refunding Bonds, Series 2017C in September 2017. The net proceeds related to the refunding of $44,728,960 were used to purchase U.S. government securities. The securities were deposited in an irrevocable trust with an escrow agent to provide for all future debt service payments on the portion of the Series 2007 being refunded. The savings to the College due to this refunding will be a reduction in the interest rate by 0.6% to 4.4% on the issue of $38,860,000. This was the final refunding phase (phase III) for the Series 2007 Bonds.
In December 2017, the College issued $5,515,000 limited tax General Obligation Debt Certificates, Series 2017D. These certificates were paid in full and retired in February 2018 when the College issued General Obligation Community College Bonds, Series 2018.

(XI)
The College also issued General Obligation Community College Bonds, Series 2018, in the amount of $10,145,000 with interest rates of 2.25% to 4% during February 2018. Proceeds were used to retire Debt Certificate 2017D whose funds will be used to purchase technology and capital and to pay certain costs associated with the issuance of the bonds. Also, the proceeds were used to retire Debt Certificate 2016C, which had been used for the purchase of a wind turbine. Additional funds from the proceeds were placed into an escrow account to be used to retire Debt Certificate 2011, which funded a facilities improvement measure, and to retire Debt Certificate 2012, which funded a purchase of land directly west of the Heartland Community College campus.
Moody’s Investor Services rated the College at Aa2 and Standard and Poor’s Investor Services rated the College at AA+. The College continues to be rated high because of (1) participation in the diverse Bloomington-Normal economy; (2) good wealth and income levels; (3) good financial operations with strong reserves; and (4) a moderate overall debt burden.
According to State of Illinois statute, the College is subject to a limit on bonded debt equal to 2.875 percent of assessed valuation. The 2017 assessed valuation of $4,464,342,208 results in a legal debt limit of $128,349,838. The College is well withinthis statutory limit. Other useful indicators of debt position are the ratios of general obligation debt to assessed valuation and debt per capita. For fiscal years 2014-2018, these indicators compare as follows:
General General ObligationFiscal Year Obligation Debt Debt/EAV Debt Per Capita
2018 $75,157,077 1.7 percent $350.902017 $76,973,512 1.7 percent $359.382016 $82,206,624 1.9 percent $395.312015 $81,261,750 1.9 percent $390.772014 $85,700,750 2.1 percent $410.96
PROSPECTS FOR THE FUTURE
The College’s financial outlook for the future is stable reflecting its strong financial operations, combined with growing populations within the District. The outlook is supported by the diverse Bloomington-Normal metropolitan area economy. There are certainly challenges facing the institution, including continued uncertain levels of future State funding, the State’s pending pension reform efforts, declining enrollments, student engagement and retention efforts, and long range master planning under these circumstances.

(XII)
A long-term financial reserves plan is regularly updated and reviewed with the Board of Trustees to ensure timely and appropriate accumulation of net position for future capital projects, possible pension cost shifts, and other financial exigencies. A five-year operating budget outlook is updated and reviewed regularly by College management and with the Board of Trustees. Efforts are also underway to update the long-term master plan for future campus development.
Contingencies and strategic additions to reserves are budgeted annually to provide for the uncertainties associated with State funding, enrollment fluctuations, capital funding requirements, faculty contract negotiations, utility and other market-driven costs and to fund reserve plans. Likewise, alternative means of funding our needs, such as through leasing and bonding, will continue to be evaluated. The College also has the capacity to increase tuition rates since the current rate is below any State limits.
AWARDS AND ACKNOWLEDGEMENTS
Independent Audit
The Illinois Public Community College Act requires an annual audit by independent certified public accountants. The College’s Board of Trustees selected the public accounting firm of CliftonLarsonAllen LLP. The requirement has been satisfied and the auditors’ opinion is unmodified. The auditors’ report on the financial statements and schedules is included in the financial section of this report.
Awards for Financial Reporting
The Government Finance Officers Association of the United States and Canada (GFOA) awarded a Certificate of Achievement for Excellence in Financial Reporting to Heartland Community College for its CAFR for the fiscal year ended June 30, 2017. The Certificate of Achievement is a prestigious national award recognizing conformance with the highest standards for preparation of state and local government financial reports.
In order to be awarded a Certificate of Achievement, a government unit must publish an easily readable and efficiently organized CAFR whose contents conform to program standards. The CAFR must satisfy both generally accepted accounting principles and applicable legal requirements. A Certificate of Achievement is valid for a period of one year only.
Heartland Community College has received the Certificate of Achievement annually since 1998. Staff believes the current report for the fiscal year ended June 30, 2018 continues to meet the stringent program requirements for the Certificate of Achievement for Excellence in Financial Reporting. The report is being submitted to GFOA to determine its eligibility for another certificate.
Acknowledgments
Thanks are to be extended to the Board of Trustees for its continued interest and support in planning and conducting the financial operations of the College with fiscal integrity. Each member of the Business Services Division and the external auditors, CliftonLarsonAllen LLP, have our sincere appreciation for the contributions made in preparation of this report.
Respectfully submitted,
/s/ Douglas E. Minter
Douglas E. Minter Vice President of Business Services
(XIII)
HEARTLAND COMMUNITY COLLEGE COMMUNITY COLLEGE DISTRICT #540
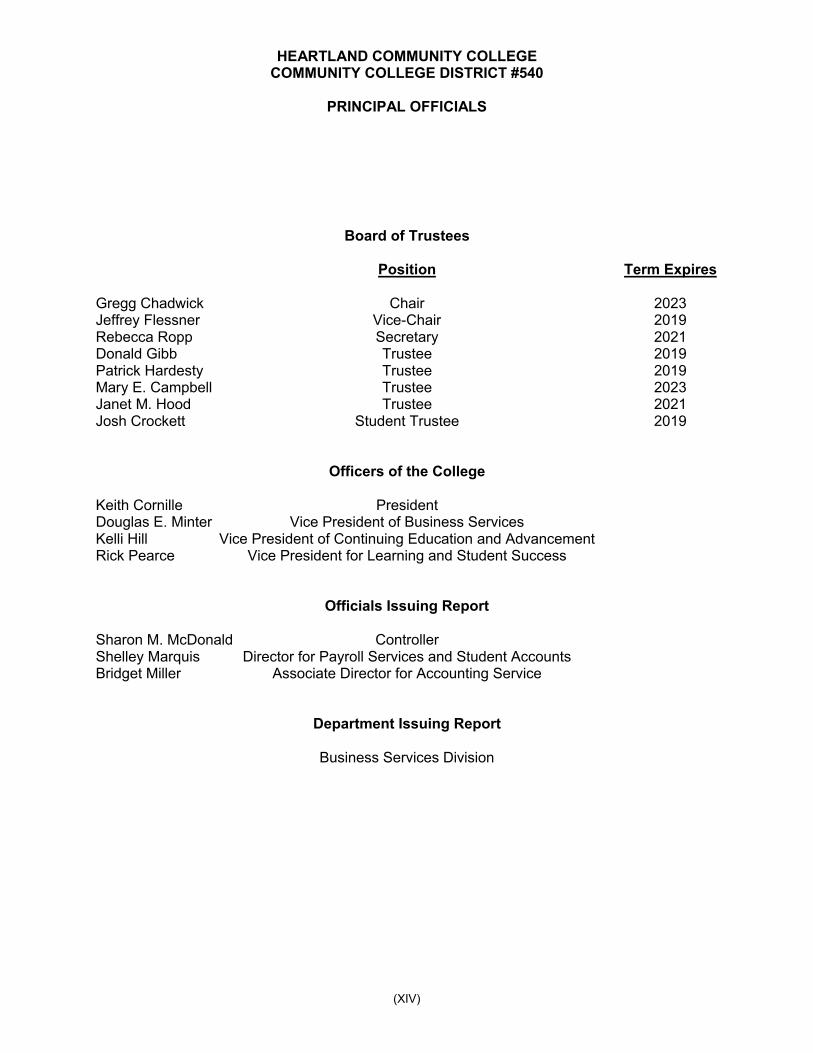
PRINCIPAL OFFICIALS
(XIV)
Board of Trustees
Position Term Expires
Gregg Chadwick Chair 2023Jeffrey Flessner Vice-Chair 2019Rebecca Ropp Secretary 2021Donald Gibb Trustee 2019Patrick Hardesty Trustee 2019Mary E. Campbell Trustee 2023Janet M. Hood Trustee 2021Josh Crockett Student Trustee 2019
Officers of the College
Keith Cornille PresidentDouglas E. Minter Vice President of Business ServicesKelli Hill Vice President of Continuing Education and AdvancementRick Pearce Vice President for Learning and Student Success
Officials Issuing Report
Sharon M. McDonald ControllerShelley Marquis Director for Payroll Services and Student AccountsBridget Miller Associate Director for Accounting Service
Department Issuing Report
Business Services Division

Heartland provides accessible, innovative learning opportunities and resources that enrich our community.
Development and
Community
Engagement
Marketing and
Public Information
Enrollment
Services
Health Sciences
Administrative
Services
Business Office
Human Resources
Information
Technology
Facilities
District 540 Electorate
Continuing
Education
Student Support
Services
Business Services
Board of Trustees
Learning and
Student Success
Continuing Education
and Advancement
PresidentHeartland Community College
Foundation Board of Directors
Academic AffairsAdult Education
Liberal Arts and
Social Sciences
STEM and
Business
,-i-=-=~~----===F: ~~=-=--r=--_____J I I I
I I I I
I I I I
I I I I I I L_

Business Services
Operations
Employment and
Compensation
Employee
Benefits
Student Accounts
and Cashiering
Purchasing
and Capital Assets
Book Store
(contractual)
Custodial Services
(contractual)
Food Services
(contractual)
Grounds Services
(contractual)
Employee
Recruitment
Mail Services,
Shipping and
Receiving
Payroll Services
Accounting Services
and Budgeting
Safety and
Emergency Services
Vice President of
Business Services
Director of Administrative
Services
Grants AccountingNetwork and System
Administration
Institutional Research
PeopleSoft
Technical Support
Services
Controller Chief Information Officer
Risk Management
Heartland provides accessible, innovative learning
opportunities and resources that enrich our community.
Maintenance
Executive Director of
Facilities
Executive Director of Human
Resources
Purchasing and
Software Support
Web and Media
Employee
Development and
Training
Foundation Relations
Public Information
Associate Director of
Institutional Projects
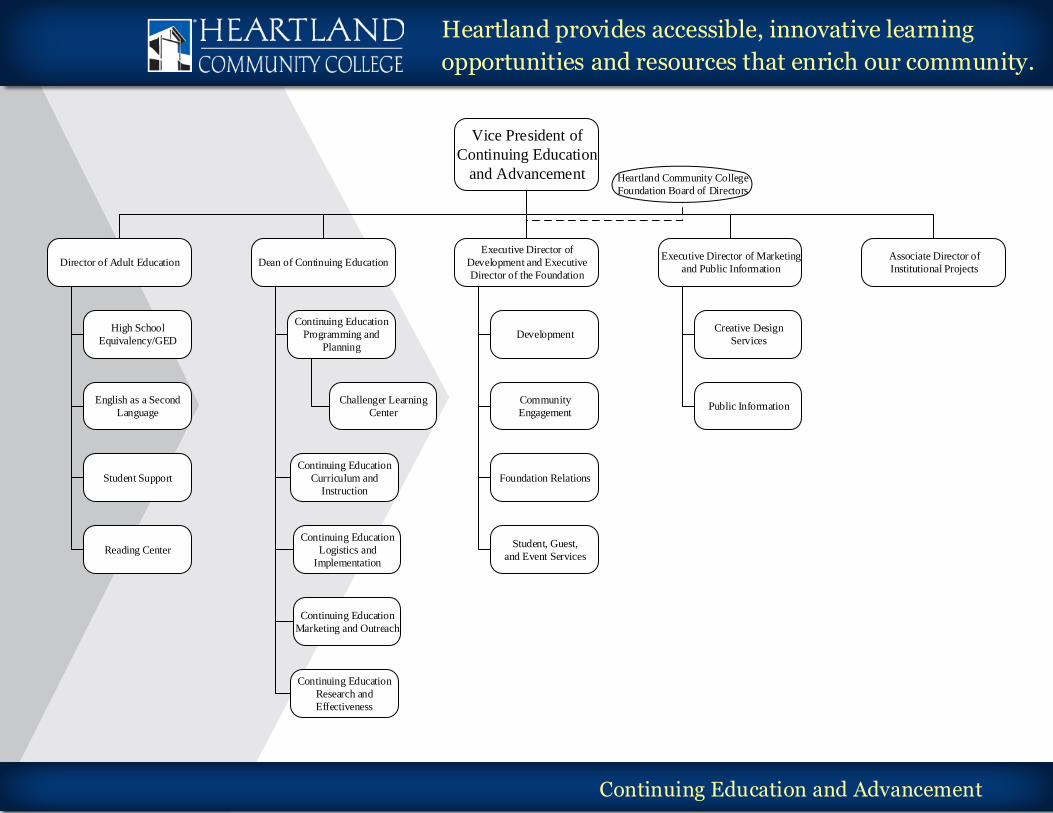
Vice President of
Continuing Education
and Advancement
Community
Engagement
Executive Director of Marketing
and Public Information
DevelopmentCreative Design
Services
Executive Director of
Development and Executive
Director of the Foundation
Continuing Education
Programming and
Planning
Continuing Education
Logistics and
Implementation
Continuing Education
Research and
Effectiveness
Challenger Learning
Center
Continuing Education
Marketing and Outreach
Heartland Community College
Foundation Board of Directors
English as a Second
Language
High School
Equivalency/GED
Student Support
Director of Adult Education
Continuing Education and Advancement
Heartland provides accessible, innovative learning
opportunities and resources that enrich our community.
Reading Center
Dean of Continuing Education
Continuing Education
Curriculum and
Instruction
Student, Guest,
and Event Services

Vice President for Learning
and Student Success
Learning and Student Success
Financial Aid
Student Recruitment
Advisement and
Career Connections
Records
College NOW
Dual Credit
Dean of Enrollment
Services
Athletics
Heartland
Pontiac Center
International
Studies
Access and
Accommodation
Services
Curriculum
Student
Engagement
Dean of Student
Support Services
Student Success
TRIO Student
Support Services
Library and
Information Services
Communication
Music
English
Languages
Art
Honors
Accounting
Instructional
Development
Biology
Earth Science
Psychology
Social Work
Humanities
History
Education
Philosophy
Political
Science
Anthropology
Associate Vice
President for
Academic Affairs Dean of Liberal Arts
and Social Sciences
Early Childhood
Education
Nursing
Emergency
Medical Services
Criminal Justice
Child
Development Lab
Health
Radiography
Dean of Health
Sciences
MathInformation
Technology
Digital Media
Industrial
Technology
Student Counseling
and Wellness
Physical Therapist
AssistantEconomics
Applied Computer
Science
Instructional
Assessment
Online Learning
and Instructional
Technology
Sociology
Business
Physics
Physical Science
Reading
Fitness and
Recreation Center
Heartland provides accessible, innovative learning
opportunities and resources that enrich our community.
Theater
Women s
Studies
Film
Religion
Geology/
Geography
Office
Technology
Dean of STEM and
Business
Sport
Management
Engineering
Agriculture
Heartland
Lincoln Center
Equity, Compliance
and Title IX
Chemistry
Perkins IV GrantTutoring
Services
Certified Medical
Assistant
Testing Center
Admissions

Government Finance Officers Association
Certificate of Achievement
for Excellence in Financial Reporting
Presented to
Heartland Community College
District #540, Illinois
For its Comprehensive Annual Financial Report
for ~he Fiscal Year Ended
June 30, 2017
Executive Director/CEO

FINANCIAL SECTION

(1)
INDEPENDENT AUDITORS’ REPORT
Board of TrusteesHeartland Community College Community College District #540Normal, Illinois
Report on the Financial Statements
We have audited the accompanying basic financial statements of the business-type activities and the discretely presented component unit of Heartland Community College District #540 (District or College), as of and for the years ended June 30, 2018 and 2017, and the related notes to the financial statements, which collectively comprise the entity’s basic financial statements as listed in the table of contents.
Management’s Responsibility for the Financial Statements
Management is responsible for the preparation and fair presentation of these financial statements in accordance with accounting principles generally accepted in the United States of America; this includes the design, implementation, and maintenance of internal control relevant to the preparation and fair presentation of financial statements that are free from material misstatement, whether due to fraud or error.
Auditors’ Responsibility
Our responsibility is to express an opinion on the basic financial statements based on our audits. We did not audit the financial statements of the discretely presented component unit, Heartland Community College Foundation, which represents 100% of the assets, net position, and revenue of the component unit. Those statements were audited by another auditor whose report has been furnished to us, and our opinion, insofar as it relates to the amounts included for the discretely presented component unit, is based solely on the report of the other auditor. We conducted our audit in accordance with auditing standards generally accepted in the United States of America and the standards applicable to financial audits contained in Government Auditing Standards, issued by the Comptroller General of the United States. Those standards require that we plan and perform the audit to obtain reasonable assurance about whether the financial statements are free from material misstatement. The financial statements of the District’s component unit were not audited in accordance with Government Auditing Standards.
CliftonLarsonAllen LLPCLAconnect.com~
Cl iftonlarsonAllen
Board of TrusteesHeartland Community College Community College District #540
(2)
An audit involves performing procedures to obtain audit evidence about the amounts and disclosures in the financial statements. The procedures selected depend on the auditors’ judgment, including the assessment of the risks of material misstatement of the financial statements, whether due to fraud or error. In making those risk assessments, the auditor considers internal control relevant to the entity’s preparation and fair presentation of the financial statements in order to design audit procedures that are appropriate in the circumstances, but not for the purpose of expressing an opinion on the effectiveness of the entity’s internal control. Accordingly, we express no such opinion. An audit also includes evaluating the appropriateness of accounting policies used and the reasonableness of significant accounting estimates made by management, as well as evaluating the overall presentation of the financial statements.
We believe that the audit evidence we have obtained is sufficient and appropriate to provide a basis for our audit opinion.
Opinions
In our opinion, based on our audits and the reports of the other auditor, the financial statements referred to above present fairly, in all material respects, the respective financial position of the business-type activities of Heartland Community College District #540 and its discretely presented component unit as of June 30, 2018 and 2017, and the respective changes in financial position and, where applicable, cash flows thereof for the years then ended in accordance with accounting principles generally accepted in the United States of America.
Emphasis of a Matter - Restatement
The District adopted the provision of Governmental Accounting Standards Board (GASB) Statement No. 75, Accounting and Financial Reporting for Postemployment Benefits Other than Pensions. As a result of the implementation of Statement No. 75, the District reported a restatement for the cumulative effect of a change in accounting principle. Our opinions are not modified with respect to this matter.
Other Matters
Required Supplementary InformationAccounting principles generally accepted in the United States of America require that the management’s discussion and analysis on pages 4 through 17, defined benefit pension plan information on page 55, the schedule of District’s proportionate share of the net OPEB liability on page 56, and the schedule of District’s contributions on page 57 be presented to supplement the basicfinancial statements. Such information, although not a part of the basic financial statements, is required by the Governmental Accounting Standards Board who considers it to be an essential part of financial reporting for placing the basic financial statements in an appropriate operational, economic, or historical context. We have applied certain limited procedures to the required supplementary information in accordance with auditing standards generally accepted in the United States of America, which consisted of inquiries of management about the methods of preparing the information and comparing the information for consistency with management’s responses to our inquiries, the basic financial statements, and other knowledge we obtained during our audit of the basic financial statements. We do not express an opinion or provide any assurance on the information because the limited procedures do not provide us with sufficient evidence to express an opinion or provide any assurance.

Board of TrusteesHeartland Community College Community College District #540
(3)
Other InformationOur audits were conducted for the purpose of forming opinions on the financial statements that collectively comprise Heartland Community College District #540’s basic financial statements. The Uniform Financial Statement section (pages 102 through 108) and the Certification of ChargebackReimbursement on page 86 are presented for purposes of additional analysis and are not a requiredpart of the basic financial statements. The schedule of expenditures of federal awards on page 114, asrequired by Title 2 U.S. Code of Federal Regulations Part 200, Uniform Administrative Requirements, Cost Principles, and Audit Requirements for Federal Awards, is also presented for purposes of additional analysis and is not a required part of the basic financial statements.
The Uniform Financial Statement section, the Certification of Chargeback Reimbursement, and the schedule of expenditures of federal awards are the responsibility of management and were derived from and relate directly to the underlying accounting and other records used to prepare the basic financial statements. Such information has been subjected to the auditing procedures applied in the audit of the basic financial statements and certain additional procedures, including comparing and reconciling such information directly to the underlying accounting and other records used to prepare the basic financial statements or to the basic financial statements themselves, and other additional procedures in accordance with auditing standards generally accepted in the United States of America. In our opinion, the information is fairly stated, in all material respects, in relation to the basic financial statements as a whole.
The introductory section, the statistical section, and the Documentation of Residency Verification Steps on page 100 have not been subjected to the auditing procedures applied in the audit of the basicfinancial statements and, accordingly, we do not express an opinion or provide any assurance on them.
Other Reporting Required by Governmental Auditing Standards
In accordance with Government Auditing Standards, we have also issued our report dated October 12, 2018, on our consideration of Heartland Community College District #540‘s internal control over financial reporting and on our tests of its compliance with certain provisions of laws, regulations, contracts, and grant agreements and other matters. The purpose of that report is solely to describe the scope of our testing of internal control over financial reporting and compliance and the result of that testing, and not to provide an opinion on the effectiveness of the District’s internal control over financial reporting or on compliance. That report is an integral part of an audit performed in accordance with Government Auditing Standards in considering Heartland Community College District #540’s internal control over financial reporting and compliance.
aCliftonLarsonAllen LLP
Peoria, IllinoisOctober 12, 2018

HEARTLAND COMMUNITY COLLEGE COMMUNITY COLLEGE DISTRICT #540
MANAGEMENT’S DISCUSSION AND ANALYSISJUNE 30, 2018 AND 2017
(4)
Management’s Discussion and AnalysisThis section of Heartland Community College’s (District or College) Comprehensive Annual Financial Report presents management’s discussion and analysis of the College’s financial activity during the fiscal years ended June 30, 2018 and June 30, 2017. Since this discussion and analysis is designed to focus on current activities, resulting changes and currently known facts, please read it in conjunction with the transmittal letter, the College’s basic financial statements, and the notes to the basic financial statements. Responsibility for the completeness and fairness of this information rests with the College.
Using This Annual ReportThe financial statements focus on the College as a whole. The College’s basic financial statements are designed to emulate corporate presentation models whereby all College activities are consolidated into one total.
The focus of the Statement of Net Position is designed to be similar to bottom line results for the College. This Statement combines and consolidates current financial resources (short-term spendable resources) with capital assets. It reflects Heartland’s financial position at a certain date. Net position, the difference between the College’s total assets and deferred outflows of resources, and total liabilities and deferred inflows of resources, is one way to measure the College’s financial health or position. All assets, deferred outflows of resources, liabilities and deferred inflows of resources associated with the operation of the College are included in the Statement of Net Position.
The Statements of Revenues, Expenses, and Changes in Net Position focus on both the gross costs and the net costs of College activities, which are supported mainly by property taxes, student tuition and fees, and other governmental revenues. This approach is intended to summarize and simplify the user’s analysis of the cost of various College services to students and the public.
The Statements of Cash Flows focus on the incomings and outgoings of cash representing the financial activities of the College and show the net increase (decrease) in cash and cash equivalents. They aregrouped by operating, noncapital financing, capital and related financing, and investing activities. This statement also reconciles Operating Income (Loss) to the net cash provided by the operating activities of the College.
Finally, the Statements provide a picture of the net position (assets and deferred outflows minus liabilities and deferred inflows) and its availability for expenditure by the College. Net position is divided into three major categories: (1) funds invested in capital assets, net of related debt, provides the College’s equity in property, plant and equipment owned by the College; (2) restricted net position reflects the dollars available for expenditure by the College but that must be spent in accordance with any time or purpose restrictions specified by donors and/or other external entities; and (3) unrestricted net position dollars are available to the College for any lawful purpose.
Financial Highlights Total assets and deferred outflows of resources exceeded total liabilities and deferred inflows (net position) by $41,828,730 as of June 30, 2018. Of this amount, $38,906,902 is invested in capital assets (net of related debt), $3,900,000 is restricted for working cash, $783,488 is restricted for capital projects, $85,454 is restricted for other specific purposes, and ($1,847,114) is unrestricted.
Operating revenues include activities that have the characteristics of exchange transactions, such as (1) student tuition and fees (net of scholarship allowances), (2) auxiliary enterprise revenues, (3) othereducational sales and service fees and (4) the State Universities Retirement System contribution

HEARTLAND COMMUNITY COLLEGE COMMUNITY COLLEGE DISTRICT #540
MANAGEMENT’S DISCUSSION AND ANALYSISJUNE 30, 2018 AND 2017
(5)
provided by the State of Illinois. Total operating revenues for the year ended June 30, 2018 were $23,942,509. Non-operating revenues include activities that have the characteristics of non-exchange transactions, such as (1) property taxes, (2) State grants and contracts, (3) Federal and local grants and contracts, and (4) investment income. Total net non-operating revenues for the year ended June 30, 2018 were $41,108,669.
Operating expenses are those expenses for the purpose of providing educational and operational activities of the College. All expenses not meeting this definition, such as interest expense, are reported as non-operating expenses. The College’s operating expenses are funded primarily through non-operating revenue. Total operating expenses for the year ended June 30, 2018 were $58,230,142.
The difference between total operating revenues of $23,942,509 and total operating expenses of $58,230,142 produced an operating loss of ($34,287,633) for the year ended June 30, 2018. Net non-operating revenue of $41,108,669 offset this loss and resulted in an overall increase in net position of $6,821,036.
In fiscal year 2018, a prior period adjustment of ($16,849,976) was made to record a liability for Other Post-Employment Benefits (OPEB). GASB Statement Number 75 requires the College to record a liability for any Other Post Employment Benefits (OPEB). The OPEB liability is the College’s proportionate share of the liability related to the Community College Health Insurance Security Fund (CCHISF) (also known as the College Insurance Program, “CIP”). The prior period adjustment caused an overall decrease in net position of $10,028,940.
Following are comparative analyses of net position and operating results for fiscal years 2018, 2017, and 2016.
Financial Analysis of the College as a Whole
Increase Increase
(Decrease) Percent (Decrease) Percent
2018 2017 2018-2017 Change 2016 2017-2016 Change
Current Assets 57,392$ 48,771$ 8,621$ 17.7 % 42,703$ 6,068$ 14.2 %
Noncurrent Assets
Long-Term Investments 1,711 - 1,711 N/A 1,973 (1,973) (100.0)
Capital Assets, Net of Depreciation 106,881 110,623 (3,742) (3.4) 114,912 (4,289) (3.7)
Total Assets 165,984 159,394 6,590 4.1 159,588 (194) (0.1)
Deferred Outflows of Resources 1,819 1,144 675 59.0 825 319 1.0
Total Assets and Deferred
Outflows of Resources 167,803$ 160,538$ 7,265$ 4.5 160,413$ 125$ 0.1
Current Liabilities 16,714$ 14,857$ 1,857 12.5 13,256$ 1,601$ 12.1
Noncurrent Liabilities 81,637 67,777 13,860 20.4 75,774 (7,997) (10.6)
Total Liabilities 98,351 82,634 15,717 19.0 89,030 (6,396) (7.2)
Deferred Inflows of Resources 27,623 26,047 1,576 6.1 23,347 2,700 11.6
Net Position
Net Investment in Capital Assets 38,907 37,317 1,590 4.3 38,389 (1,072) (2.8)
Unrestricted (1,847) 10,268 (12,115) (118.0) 5,319 4,949 93.0
Restricted 4,769 4,273 496 11.6 4,328 (55) (1.3)
Total Net Position 41,829 51,858 (10,029) (19.3) 48,036 3,822 8.0
Total Liabilities, Deferred Inflows of
Resources and Net Position 167,803$ 160,539$ 7,264$ 4.5 160,413$ 126$ 0.1
Net Position as of June 30, (in Thousands)
This schedule was prepared from the College’s Statement of Net Position, which is presented on an accrual basis of accounting whereby assets are capitalized and depreciated.

HEARTLAND COMMUNITY COLLEGE COMMUNITY COLLEGE DISTRICT #540
MANAGEMENT’S DISCUSSION AND ANALYSISJUNE 30, 2018 AND 2017
(6)
Net assets invested in capital assets, net of related debt, consist of capital assets net of accumulated depreciation and reduced by the amount of outstanding indebtedness attributable to the acquisition, construction, or improvement of those assets. The principal liabilities for capital assets are the general obligation bonds and debt certificates used to provide funding for campus development construction, land acquisition, and equipment purchases.
In Fiscal Year 2018 and 2017, the current assets and current liabilities were adjusted to reflect only unearned revenue and related student accounts receivable for student payments received for Fall 2018 and 2017 as of June 30, 2018 and June 30, 2017 respectively.
Fiscal Year 2018 Compared to Fiscal Year 2017The College’s net position at June 30, 2018 was $41,828,730 and at June 30, 2017 was $51,857,670, a decrease of $10,028,940 (-19.3%). The decrease in net position was due to the OPEB prior period adjustment of ($16,849,976) combined with a net position increase in fiscal year 2018 of $6,821,036. The College had a current ratio of 1.34 at June 30, 2018, as compared to 1.24 at July 1, 2017. The current ratio is total current assets and deferred outflows of resources divided by total current liabilities and deferred inflows of resources. This means that for every dollar of current liabilities and deferred inflows the College had $1.34 in current assets and deferred outflows. This ratio is one indicator of the College’s ability to pay its debts as they become due.
Current assets have increased by $8,620,797 (17.7%) at June 30, 2018 when compared to June 30, 2017. There were some significant fluctuations between the various categories of current assets. Largest among these was the $8,982,151 increase in cash and cash equivalents from $12,036,360 in 2017 to $21,018,511 in 2018. There was an increase of $509,212 in short-term investments from $16,912,871 in 2017 to $17,422,083 in 2018. Total accounts receivables decreased by $1,337,559. Property taxes receivable decreased by $104,931 (-0.7%). Student receivables decreased by $847,661 (-48.1%) partly because of a credit hour decrease from 2017; student waivers increased; and bad debt and the allowance for bad debt have both increased. Government receivables decreased by $284,958 (-19.8%) mainly due to a decrease in Illinois Student Assistance Commission – Monetary Award Program receivables. Other receivables decreased by $100,009 (-22.7%) because of insurance reimbursements due of approximately $172,000 at the end of Fiscal Year 2017 received in Fiscal Year 2018; and an increase in Fiscal Year 2018’s receivables due from the National Guard Center of approximately $72,000. Accrued interest increased $59,133 (184.0%) due to higher interest rates and an increase in investment funds. Prepaid items increased $221,161 (21.6%), and other current assets increased $186,699 (96.2%).
Non-current assets have decreased by $2,030,944 (-1.8%) due to the $3,742,509 decrease in net capital assets and a $1,711,565 increase in long-term investments. Net capital assets decreased due to the annual increase in accumulated depreciation. Long-term investments increased during Fiscal Year 2018 because of technology and capital bond fund proceeds invested to be used during the next fiscal year.
Deferred outflows of resources from the subsequent year’s pension expense related to federal, trust or grant contributions in the current year decreased by $704 from fiscal year 2017. Also included in deferred outflows of resources for fiscal year 2018 are the deferred charges on the refunding bond issues. The additional deferred charges on the refunding issue in 2018 and the amortization of the deferred charges of all refunding issues resulted in an increase of $483,780 to the deferred charges on refunding. Deferred outflows related to the OPEB liability increased $191,462 in fiscal year 2018. Deferred outflows of resources had an overall increase of $674,538 from fiscal year 2017.

HEARTLAND COMMUNITY COLLEGE COMMUNITY COLLEGE DISTRICT #540
MANAGEMENT’S DISCUSSION AND ANALYSISJUNE 30, 2018 AND 2017
(7)
Current liabilities have increased by $1,857,611 (12.5%) due to the combined effects of various factors. These factors were: (1) an increase of $1,419,600 in the current portion of bonds payable; (2) an increase of $348,239 in unearned student tuition and fees due to an increase in deferred revenue; (3) an increase of $41,527 in accrued interest payable due to debt service scheduling; (4) an increase of $41,535 in accounts payables; (5) a decrease in other unearned revenue of $59,832; (6) an increase of $4,950 in the deposit for bonds; (7) an increase of $171 for accrued compensated absences; (8) an increase of $61,421 in accrued liabilities which reflects 11 more days of payroll accruals between pay periods in FY 18 (34 days) versus FY 17 (23 days).
Total non-current liabilities increased by $13,859,847 (20.4%) from 2017 balance as a result of several factors: (1) the OPEB non-current liability increased by $17,095,712; (2) the bond and debt certificate principal payments made and the bond principal reclassification to current liability decreased non-current liability by $3,236,035; (3) and the accrued compensated absences increased non-current liability by $170.
Total deferred inflows of resources increased by $1,575,873 (6.1%) from 2017 balances. Deferred inflows related to OPEB increased by $1,472,623 and the subsequent year’s property taxes increased by $103,250.
Fiscal Year 2017 Compared to Fiscal Year 2016The College’s net position at June 30, 2017 was $51,857,670 and at June 30, 2016 was $48,036,244, an increase of $3,821,426 (8.0%). The College had a current ratio of 1.24 at June 30, 2017, as compared to 1.19 at June 30, 2016. The current ratio is total current assets and deferred outflows of resources divided by total current liabilities and deferred inflows of resources. This means that for every dollar of current liabilities and deferred inflows the College had $1.24 in current assets and deferred outflows. This ratio is one indicator of the College’s ability to pay its debts as they become due.
Current assets increased by $6,068,510 (14.2%) at June 30, 2017 when compared to June 30, 2016. There were some significant fluctuations between the various categories of current assets. Largest among these was the $6,933,201 increase in short-term investments from $9,979,670 in 2016 to $16,912,871 in 2017. There was a decrease of $2,648,877 in cash and cash equivalents from $14,685,237 in 2016 to $12,036,360 in 2017. This represented a shifting of funds from cash to short-term investments. Total accounts receivables increased by $1,399,941. Property taxes receivable increased by $1,788,077 (13.6%) due to an increase in the 2015 tax levy and 1.8% growth in property tax values. Student receivables increased by $302,528 (20.7%). Government receivables decreased by $502,701 (-25.8%). Other receivables decreased by $187,963 (-29.9%). Other receivables include Foundation scholarships due for $11,000, National Guard Normal Readiness Center maintenance expenditures due for approximately $52,900, bus ridership payment due of approximately $14,000, insurance reimbursement due for approximately $172,000, various Customized Training receivables of approximately $29,000, Corporate receivables of approximately $17,000, and other miscellaneous receivables due such as childcare tuition and room rentals.
Non-current assets decreased by $6,262,038 (-5.4%) due to the $4,288,838 decrease in net capital assets and a $1,973,200 decrease in long-term investments. Net capital assets decreased due to the annual increase in accumulated depreciation. Long-term investments were moved to short-term investments during fiscal year 2017 because of technology bond fund purchases to be made during the next fiscal year.

HEARTLAND COMMUNITY COLLEGE COMMUNITY COLLEGE DISTRICT #540
MANAGEMENT’S DISCUSSION AND ANALYSISJUNE 30, 2018 AND 2017
(8)
Deferred outflows of resources from the subsequent year’s pension expense related to federal, trust or grant contributions in fiscal year 2017 decreased by $1,088 from fiscal year 2016. Also included in deferred outflows of resources for fiscal year 2017 were the deferred charges on the refunding bond issues. The additional deferred charges on the refunding issue in 2017 and the amortization of the deferred charges of all refunding issues resulted in an increase of $319,961 to the deferred charges on refunding. The result of the outflows of resources in fiscal year 2017 resulted in an overall increase of deferred outflows of resources of $318,873.
Current liabilities increased by $1,600,013 (12.1%) due to the combined effects of various factors. These factors were: (1) an increase of $2,760,032 in the current portion of bonds payable; (2) a decrease of $321,621 in unearned student tuition and fees due to lower credit hours for Summer and Fall 2017; (3) a decrease of $75,082 in accrued interest payable due to debt service scheduling; (4) an increase of $53,526 in accounts payables; (5) a decrease in other unearned revenue of $178,924; (6) an increase of $53,930 in the deposit for bonds; (7) a decrease of $3,401 for accrued compensated absences; (8) a decrease of $688,447 in accrued liabilities which reflects less days of payroll accruals between pay periods in FY 17 (5 days) versus FY 16 (14 days).
Total non-current liabilities decreased by $7,996,544 (-10.6%) from 2016 balances as a result of bond and debt certificate principal payments, bond and debt principal due in the next fiscal year moved to bonds payable classified under current liabilities, and a small decrease in accrued compensated absences.
Deferred inflows of resources from the subsequent year’s property taxes increased by $2,700,449 (11.6%) over the 2016 amount. This was due to the overall levy increase and an Equalized Assessed Valuation (EAV) increase of 1.8%.

HEARTLAND COMMUNITY COLLEGE COMMUNITY COLLEGE DISTRICT #540
MANAGEMENT’S DISCUSSION AND ANALYSISJUNE 30, 2018 AND 2017
(9)
Increase Increase
(Decrease) Percent (Decrease) Percent
2018 2017 2018-2017 Change 2016 2017-2016 Change
Operating Revenues
Net Tuition and Fees 9,463$ 10,692$ (1,229)$ -11.5% 10,201$ 491$ 4.8%
12,075 11,175 900 8.1% 8,771 2,404 27.4%
Other 2,405 3,783 (1,378) -36.4% 3,718 65 1.7%
Total Operating Revenues 23,943 25,650 (1,707) -6.7% 22,690 2,960 13.0%
Less Operating Expenses 58,230 54,373 3,857 7.1% 53,721 652 1.2%
Operating (Loss) (34,287) (28,723) (5,564) 19.4% (31,031) 2,308 -7.4%
Nonoperating Revenues (Expenses)
Property Taxes 25,987 23,216 2,771 11.9% 21,376 1,840 8.6%
State Grants and Contracts 6,991 2,267 4,724 208.4% 2,064 203 9.8%
Federal Grants and Contracts 9,596 9,799 (203) -2.1% 9,922 (123) -1.2%
Investment Income 387 164 223 136.0% 44 120 272.7%
Interest Expense (1,839) (2,888) 1,049 -36.3% (3,195) 307 -9.6%
Loss on Disposal of Assets - - - N/A (1) 1 -100.0%
Amortization Expense (13) (13) - 0.0% (13) - 0.0%
Total Net Nonoperating Revenue 41,109 32,545 8,564 26.3% 30,197 2,348 7.8%
Change in Net Position 6,822 3,822 3,000 78.5% (834) 4,656 -558.3%
Net Position - Beginning of Year 51,858 48,036 3,822 8.0% 48,870 (834) -1.7%
Prior Period Adjustment (16,850) - (16,850) -100.0% - - 0.0%
Net Position - Beginning of Year, Restated 35,008 48,036 (13,028) -27.1% 48,870 (834) -1.7%
Net Position - End of Year 41,830$ 51,858$ (10,028)$ -19.3% 48,036$ 3,822$ 8.0%
Total Revenues 66,904$ 61,096$ 5,808$ 9.5% 56,096$ 5,000$ 8.9%
Total Expenses 60,082$ 57,275$ 2,807$ 4.9% 56,930$ 345$ 0.6%
Operating Results for the Years Ended June 30, (in Thousands)
Fiscal Year 2018 Revenues Compared to Fiscal Year 2017For fiscal year 2018, total revenues were $66,903,693, an increase of $5,807,528 (9.5%) from 2017 total revenues. Operating revenues decreased by $1,707,330 (-6.7%) from 2017 to 2018. Student tuition and fees, net of scholarship allowances, decreased by $1,228,891 (-11.5%). Credit hours did decline by approximately 5.0% from 2018 to 2017 and scholarship allowances increased by $807,363 from 2018 to 2017. Auxiliary revenues increased by $196,079 (49.2%) due to China IITL revenue increase of approximately $135,000; Child Development Lab revenue increased approximately $115,000; and other auxiliary revenues decreased by approximately $54,000. The State of Illinoiscontribution provided had a revenue increase of $900,349 (8.0%) from 2018 to 2017. Other operating revenues decreased by $1,574,867 (-46.5%) because of a Community Education instructional service provider that generated more revenue in 2017 than in 2018.
Total net non-operating revenues increased by $7,514,858 (21.2%) over 2017 non-operating revenues due to several variable factors. The largest increase of $4,723,502 (208.3%) was the State Grants and Contracts due to the State’s late appropriation of fiscal year 2017 funds recognized in fiscal year 2018. Property tax revenue increased by $2,771,260 (11.9%) due to EAV increases and a levy increase.
Total federal grants and contracts decreased by $203,081 (-2.1%). During 2018, $8,907,951 was awarded in federal student awards and student and parent loans, as compared to $8,994,266 in 2017, for a decrease of $86,315. Adult Education and Perkins federal grants from the ICCB decreased by

HEARTLAND COMMUNITY COLLEGE COMMUNITY COLLEGE DISTRICT #540
MANAGEMENT’S DISCUSSION AND ANALYSISJUNE 30, 2018 AND 2017
(10)
$31,230 during 2018 compared to 2017. TRIO grant funds decreased by $26,203 during 2018 compared to 2017. Department of Labor grant funds increased by $8,500 during 2018 compared to 2017. All other federal grant funding decreased by $67,833. Investment income increased by $223,177 due to rising interest rates and interest on the new issue of bond funds that have been invested and not yet expensed.
For fiscal year 2018, total expenses were $60,082,657 resulting in an increase of $2,807,918 (4.9%) from 2017. Net position decreased by $10,028,940 (-19.3%), which was less than the net position change in 2017. The net position decrease was due to the prior period adjustment of $16,849,976 to record net OPEB liability due to the implementation of GASB 75.
Fiscal Year 2017 Revenues Compared to Fiscal Year 2016For fiscal year 2017, total revenues were $61,096,165, an increase of $4,999,708 (8.9%) from 2016 total revenues. Operating revenues increased by approximately $2,960,395 (13.0%) from 2016 to 2017.The largest increase of $2,403,938 (27.4%) was the SURS contribution provided by the State due to increased pension funding required by the State. Student tuition and fees, net of scholarship allowances, increased by $490,790 (4.8%) due to a tuition increase of $2 per credit hour. Credit hours did decline by approximately 1.7% from 2017 to 2016. Auxiliary revenues decreased by $732,333 (-64.7%) mainly due to International Institute of Teaching and Learning revenue received in 2016 that was not received in 2017. Other operating revenues increased by $798,524 (30.9%) because of a Community Education instructional service provider who generated more revenue in 2017 than in 2016.
Total net non-operating revenues increased by $2,039,774 (6.1%) over 2016 non-operating revenues due to several variable factors. Property tax revenue increased by $1,839,264 (8.6%) due to EAV increases and a levy increase. The State Grants and Contracts increased by a little over $203,153 (9.8%) due to the following factors: ICCB Credit Hour Grant along with the Career and Technical Education (CTE) Grant funds increased by $495,493, the Corporate Personal Property Replacement Tax (CPPRT) funds increased by $88,457, Illinois Student Assistance Commission (ISAC) Monetary Award Program (MAP) awards decreased by $346,002 due to revenue appropriated for fiscal year 2017, which will be recognized in fiscal year 2018 according to GASB, Adult Education grant funds decreased $11,227, and other State grant funds decreased $16,753.
Total federal grants and contracts decreased by $122,643. During 2017, $8,994,266 was awarded in federal student awards and student and parent loans, as compared to $9,087,879 in 2016, for a decrease of $93,613. Adult Education and Perkins federal grants from the ICCB decreased approximately $23,000 during 2017 compared to 2016. TRIO grant funds increased by approximately $68,700 during 2017 compared to 2016. Department of Labor grant funds decreased by $70,800 during 2017 compared to 2016. Over all other federal grant funding decreased by approximately $5,000. Investment income increased by approximately $120,000 due to a full year of interest on the new issue of technology bond funds that was invested and not yet expensed; a dividend paid out by Cincinnati Insurance of approximately $44,000; higher interest rates during 2017 compared to 2016; and approximately $5,000,000 more invested in certificate of deposits and term series investments as of June 30, 2017 compared to June 30, 2016.
For fiscal year 2017, total expenses were $57,274,739 resulting in an increase of approximately $344,411 (0.6%) from 2016. Net position increased by $3,821,426 which was 558.3% more than the net position change in 2016.

HEARTLAND COMMUNITY COLLEGE COMMUNITY COLLEGE DISTRICT #540
MANAGEMENT’S DISCUSSION AND ANALYSISJUNE 30, 2018 AND 2017
(11)
Following is a graphic illustration of revenues by source for fiscal year 2018:
Tuition and Fees14.1%
Auxiliary 0.9%
State Grants10.4%
Federal Grants14.3%
Other Operating2.7%
Property Taxes38.9%
Investment Income0.6%
State of Illinois Contribution
18.1%

HEARTLAND COMMUNITY COLLEGE COMMUNITY COLLEGE DISTRICT #540
MANAGEMENT’S DISCUSSION AND ANALYSISJUNE 30, 2018 AND 2017
(12)
For purposes of comparison, following is a graphic illustration of revenues by source for fiscal year 2017:
Investment income 0.3%
Property taxes 38.0%
Tuition and fees
Auxiliary 0.7%
..,_"-__ _
Other operating 5.5%
State grants 3.7%
Federal grants 16.0%
7

HEARTLAND COMMUNITY COLLEGE COMMUNITY COLLEGE DISTRICT #540
MANAGEMENT’S DISCUSSION AND ANALYSISJUNE 30, 2018 AND 2017
(13)
Following is a comparative analysis of operating expense by program:
Increase Increase
(Decrease) Percent (Decrease) Percent
2018 2017 2018-2017 Change 2016 2017-2016 Change
Program:
Instruction 20,949$ 19,130$ 1,819$ 9.5% 18,202$ 928$ 5.1%
Academic Support 2,887 2,566 321 12.5% 2,808 (242) -8.6%
Student Services 4,164 3,838 326 8.5% 3,735 103 2.8%
Public Service 2,684 4,416 (1,732) -39.2% 3,688 728 19.7%
Institutional Support 11,381 9,202 2,179 23.7% 9,791 (589) -6.0%
Operating and Maintenance of Plant 4,149 3,728 421 11.3% 3,727 1 0.0%
Auxiliary Enterprises 1,812 1,518 294 19.4% 1,473 45 3.1%
Depreciation 4,491 4,533 (42) -0.9% 4,587 (54) -1.2%
Scholarships, Grants, and Waivers 5,713 5,442 271 5.0% 5,710 (268) -4.7%
Total Expenses 58,230$ 54,373$ 3,857$ 7.1% 53,721$ 652$ 1.2%
Operating Expenses by Program for the Years Ended June 30, (in Thousands)
HEARTLAND COMMUNITY COLLEGE COMMUNITY COLLEGE DISTRICT #540
MANAGEMENT’S DISCUSSION AND ANALYSISJUNE 30, 2018 AND 2017
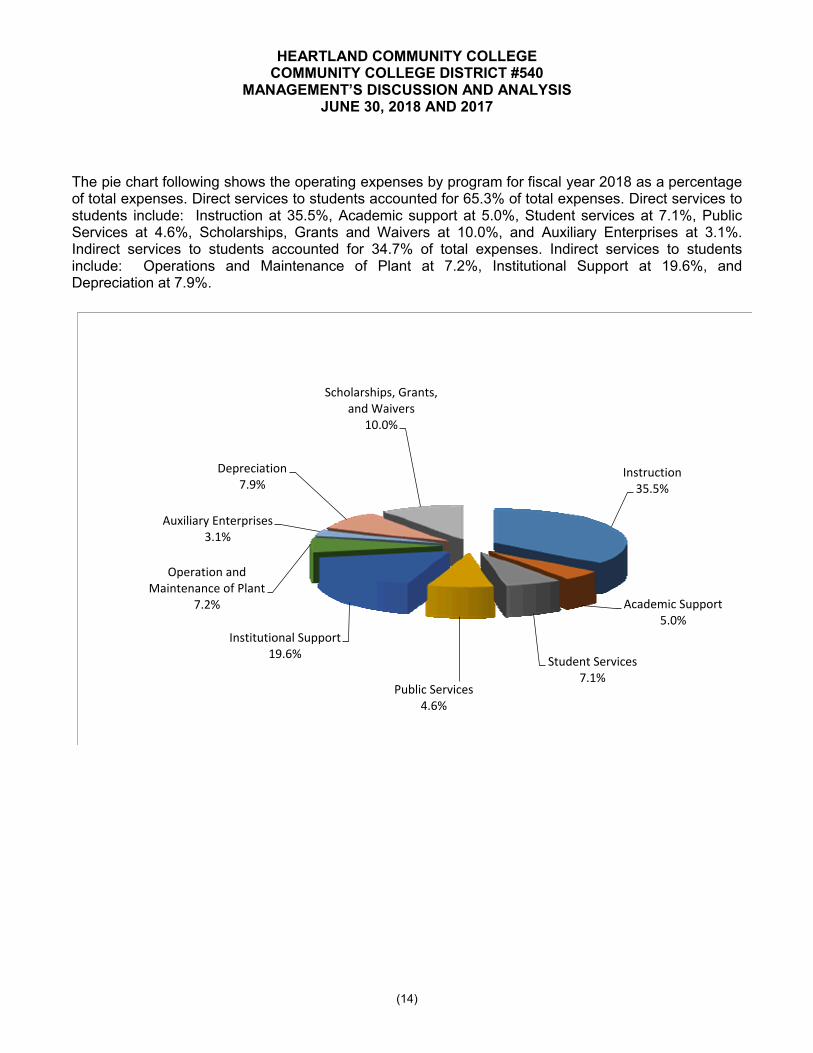
(14)
The pie chart following shows the operating expenses by program for fiscal year 2018 as a percentage of total expenses. Direct services to students accounted for 65.3% of total expenses. Direct services to students include: Instruction at 35.5%, Academic support at 5.0%, Student services at 7.1%, Public Services at 4.6%, Scholarships, Grants and Waivers at 10.0%, and Auxiliary Enterprises at 3.1%. Indirect services to students accounted for 34.7% of total expenses. Indirect services to students include: Operations and Maintenance of Plant at 7.2%, Institutional Support at 19.6%, and Depreciation at 7.9%.
Instruction35.5%
Academic Support5.0%
Student Services7.1%
Public Services4.6%
Institutional Support19.6%
Operation and Maintenance of Plant
7.2%
Auxiliary Enterprises3.1%
Depreciation7.9%
Scholarships, Grants,and Waivers
10.0%
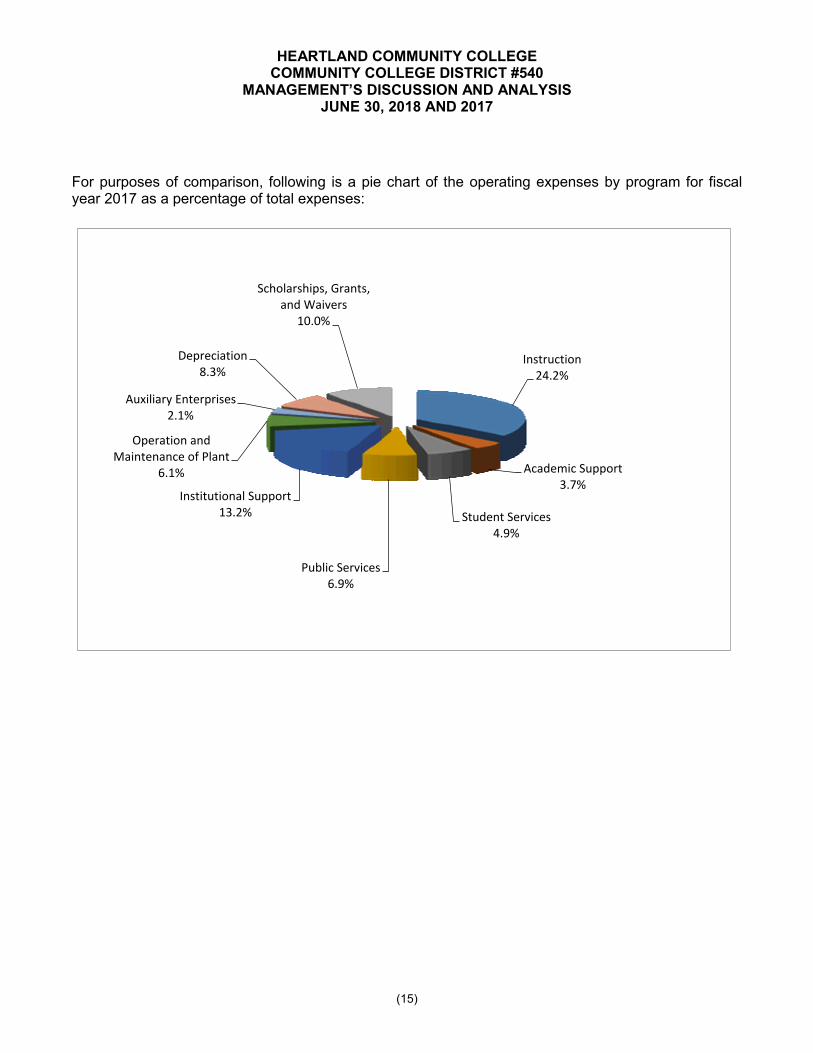
HEARTLAND COMMUNITY COLLEGE COMMUNITY COLLEGE DISTRICT #540
MANAGEMENT’S DISCUSSION AND ANALYSISJUNE 30, 2018 AND 2017
(15)
For purposes of comparison, following is a pie chart of the operating expenses by program for fiscal year 2017 as a percentage of total expenses:
Instruction24.2%
Academic Support3.7%
Student Services4.9%
Public Services6.9%
Institutional Support13.2%
Operation and Maintenance of Plant
6.1%
Auxiliary Enterprises2.1%
Depreciation8.3%
Scholarships, Grants,and Waivers
10.0%

HEARTLAND COMMUNITY COLLEGE COMMUNITY COLLEGE DISTRICT #540
MANAGEMENT’S DISCUSSION AND ANALYSISJUNE 30, 2018 AND 2017
(16)
Capital AssetsAs of June 30, 2018, the College investment in capital assets totaled $157,971,686. Capital assets net of accumulated depreciation of $51,091,162 totaled $106,880,524. The 3.4% decrease in net capital assets as of June 30, 2018 is due to the increase in accumulated depreciation of $4,302,410 (9.2%).
Additional information regarding capital assets can be found in Note 4 to the financial statements. Following is an analysis of capital assets:
Increase Increase
(Decrease) Percent (Decrease) Percent
2018 2017 2018-2017 Change 2016 2017-2016 Change
Capital Assets not Being Depreciated
Land 4,481$ 4,481$ -$ 0.0% 4,481$ -$ 0.0%
Construction-in-Progress 79 103 (24) -23.3% 103 - 0.0%
Capital Assets Being Depreciated
Buildings 121,214 121,164 50 0.0% 121,164 - 0.0%
Infrastructure 17,882 17,824 58 0.3% 17,679 145 0.8%
Furniture and Equipment 14,315 13,840 475 3.4% 13,754 86 0.6%
Total 157,971 157,412 559 0.4% 157,181 231 0.1%
Less Accumulated Depreciation (51,091) (46,789) (4,302) 9.2% (42,269) (4,520) 10.7%
Net Capital Assets 106,880$ 110,623$ (3,743)$ -3.4% 114,912$ (4,289)$ -3.7%
Capital Assets for the Years Ended June 30, (in Thousands)
Debt AdministrationThe College issued a current refunding of $43,830,000 for the outstanding balance of the Series 2007 issue of General Obligation College Bonds with $37,535,000 General Obligation Community College Bonds, Series 2017B, and $1,325,000 Taxable General Obligation Refunding Bonds, Series 2017C in September 2017. This was the final phase (phase III) of the refunding of the Series 2007 Bonds.
In December 2017, the College issued $5,515,000 limited tax General Obligation Debt Certificates, Series 2017D. These certificates were paid in full and retired in February 2018 when the College issued General Obligation Community College Bonds, Series 2018.
The College also issued General Obligation Community College Bonds, Series 2018, in the amount of $10,145,000 during February 2018. Proceeds were used to retire Debt Certificate 2017D whose funds will be used to purchase technology and capital and to pay certain costs associated with the issuance of the bonds. Also, the proceeds were used to refund Debt Certificate 2016C, which had been used for the purchase of a wind turbine. Additional funds from the proceeds were placed into an escrow account to be used to retire Debt Certificate 2011, which funded a facilities improvement measure, and to retire Debt Certificate 2012, which funded a purchase of land.
The College paid $17,200,000 in bond and debt certificate principal. The Phase III refunding in fiscal year 2018 added additional bond premiums of $5,387,559. The Series 2018 General Obligation Community College Bonds added additional bond premiums of $59,849. All bond premiums were amortized and reduced by $746,973. The net effect of the bond premium activity for fiscal year 2018 was an increase of $4,700,435 (247.6%). Compensated absences for employee vacations increased by a net amount of $341 (0.0%).

HEARTLAND COMMUNITY COLLEGE COMMUNITY COLLEGE DISTRICT #540
MANAGEMENT’S DISCUSSION AND ANALYSISJUNE 30, 2018 AND 2017
(17)
The College recorded a net OPEB liability of $17,095,712 during fiscal year 2018. This is the first year the College has recorded the liability as required by the Governmental Accounting Standard Board’s (GASB) Statement #75. The net OPEB liability is the College’s proportionate share of the liability related to the Community College Health Insurance Security Fund (CCHISF) (also known as the College Insurance Program, “CIP”). The liability was calculated by an actuary retained by the State of Illinois and is reported with a measurement date of June 30, 2017.
Increase Increase
(Decrease) Percent (Decrease) Percent
2018 2017 2018-2017 Change 2016 2017-2016 Change
Long-Term Debt
General Obligation Bonds and
Debt Certificates 68,565$ 75,075$ (6,510)$ -8.7% 80,855$ (5,780)$ -7.1%
Bond Premium 6,592 1,898 4,694 247.3% 1,352 546 40.4%
Compensated Absences 1,178 1,178 - 0.0% 1,184 (6) -0.5%
OPEB Liability 17,096 16,931 165 1.0% - 16,931 0.0%
Total 93,431$ 95,082$ (1,651)$ -1.7% 83,391$ 11,691$ 14.0%
Long-Term Debt for the Years Ended June 30, (in Thousands)
Contacting Heartland’s Financial ManagementThis financial report is designed to provide the College’s board of trustees, State Officials, Legislature, taxpayers, students, and other interested parties with a general overview of the College’s finances and to demonstrate the College’s accountability for the money it receives. If you have questions about this report or would like to request additional financial information, contact Douglas E. Minter, Vice President of Business Services or Sharon M. McDonald, Controller. College budgets and audited financial reports are also available on the College website at www.heartland.edu/about/financials.html.
OtherManagement is not aware of any other currently known facts, decisions, or conditions that would have a significant effect on the College’s financial position (net position) or results of operations (revenues, expenses, and other changes in net position).

HEARTLAND COMMUNITY COLLEGE COMMUNITY COLLEGE DISTRICT #540
STATEMENTS OF NET POSITIONJUNE 30, 2018 AND 2017
See accompanying Notes to Basic Financial Statements.(18)
2018 2017 2018 2017
ASSETS AND DEFERRED
OUTFLOWS OF RESOURCES
CURRENT ASSETS
Cash and Cash Equivalents 21,018,511$ 12,036,360$ 273,675$ 782,522$
Short-Term Investments 17,422,083 16,912,871 5,814,963 5,019,698
Accounts Receivable:
Property Taxes 14,825,211 14,930,142 - -
Student Tuition and Fees, Net of Allowance of
$365,000 for 2018 and $337,000 for 2017 913,490 1,761,151 - -
Government 1,157,314 1,442,272 - -
Pledges Receivable - - 20,000 81,500
Other Receivables 339,975 439,984 5 15,170
Accrued Interest Receivable 91,271 32,138 14,182 23
Prepaid Items 1,243,507 1,022,346 19,582 -
Other Current Assets 380,792 194,093 - -
Total Current Assets 57,392,154 48,771,357 6,142,407 5,898,913
NONCURRENT ASSETS
Long-Term Investments 1,711,565 - 712,735 463,764
Pledges Receivable - - - 74,000
Capital Assets not Being Depreciated 4,560,874 4,584,486 - -
Capital Assets, Net of Depreciation 102,319,650 106,038,547 - -
Total Noncurrent Assets 108,592,089 110,623,033 712,735 537,764
DEFERRED OUTFLOWS OF RESOURCES
Deferred Charge on Refunding 1,591,002 1,107,222 - -
Deferred Outflows Related to OPEB 191,462 - - -
Subsequent Yearʼs Pension Expense Related to
Federal, Trust, or Grant Contributions in the
Current Year 36,248 36,952 - -
Total Deferred Outflows of Resources 1,818,712 1,144,174 - -
Total Assets and Deferred Outflows
of Resources 167,802,955$ 160,538,564$ 6,855,142$ 6,436,677$
Primary Government Component Unit
College Foundation

(19)
2018 2017 2018 2017
LIABILITIES, DEFERRED INFLOWS OF
RESOURCES, AND NET POSITION
CURRENT LIABILITIES
Accounts Payable 970,976$ 929,441$ 39,053$ 18,956$
Accrued Liabilities 889,198 827,777 - -
Accrued Interest Payable 327,007 285,480 - -
Deposit for Bonds 287,514 282,564 - -
Unearned Revenue:
Student Tuition and Fees 2,051,388 1,703,149 - -
Other 394,575 454,407 - -
Accrued Compensated Absences 588,932 588,761 - -
Bonds Payable 11,204,632 9,785,032 - -
Total Current Liabilities 16,714,222 14,856,611 39,053 18,956
NONCURRENT LIABILITIES
Accrued Compensated Absences 588,932 588,762 - -
Net OPEB Liability 17,095,712 - - -
Bonds and Debt Certificates 63,952,445 67,188,480 - -
Total Noncurrent Liabilities 81,637,089 67,777,242 - -
Total Liabilities 98,351,311 82,633,853 39,053 18,956
DEFERRED INFLOWS OF RESOURCES
Subsequent Yearʼs Property Taxes 26,150,291 26,047,041 - -
Deferred Inflows Related to OPEB 1,472,623 - - -
Total Deferred Inflows of Resources 27,622,914 26,047,041 - -
NET POSITION
Net Investment in Capital Assets 38,906,902 37,316,749 - -
Restricted for:
Capital Projects 783,488 314,078 - -
Working Cash 3,900,000 3,900,000 - -
Specific Purposes 85,454 59,079 5,453,917 5,290,629
Unrestricted (1,847,114) 10,267,764 1,362,172 1,127,092
Total Net Position 41,828,730$ 51,857,670$ 6,816,089$ 6,417,721$
College Foundation
Primary Government Component Unit

HEARTLAND COMMUNITY COLLEGE COMMUNITY COLLEGE DISTRICT #540
STATEMENTS OF REVENUES, EXPENSES, AND CHANGES IN NET POSITIONYEARS ENDED JUNE 30, 2018 AND 2017
See accompanying Notes to Basic Financial Statements.(20)
2018 2017 2018 2017
OPERATING REVENUES
Student Tuition and Fees (Net of Scholarship
Allowances $7,443,020 for 2018;
$6,635,657 for 2017) 9,462,627$ 10,691,518$ -$ -$
Auxiliary Enterprises Revenue 594,268 398,189 - -
Annual Campaign/Gifts - - 543,862 445,307
Fundraising - - 264,775 217,970
State of Illinois Contributions Provided 12,075,075 11,174,726 - -
Other Operating Revenues 1,810,539 3,385,406 1,065 390
Total Operating Revenue 23,942,509 25,649,839 809,702 663,667
OPERATING EXPENSES
Institutional Support 11,380,938 9,201,537 - -
Instruction 20,948,645 19,129,740 - -
Scholarships, Student Grants, and Waivers 5,713,095 5,442,292 442,331 415,365
Operations and Maintenance 4,149,497 3,728,175 - -
Student Services 4,164,319 3,838,495 - -
Academic Support 2,886,808 2,565,994 - -
Public Services 2,683,517 4,415,868 - -
Depreciation 4,491,303 4,533,451 - -
Auxiliary Enterprises 1,812,020 1,517,861 - -
General and Administrative - - 358,641 152,969
Fundraising - - 28,202 77,506
Total Operating Expenses 58,230,142 54,373,413 829,174 645,840
OPERATING INCOME (LOSS) (34,287,633) (28,723,574) (19,472) 17,827
NONOPERATING REVENUES (EXPENSES)
Property Taxes 25,986,941 23,215,681 - -
State Grants and Contracts 6,990,691 2,267,189 - -
Federal Grants and Contracts 9,595,893 9,798,974 - -
Interest Expense (1,839,089) (2,887,900) - -
Investment Income 387,659 164,482 417,840 540,424
Amortization Expense (13,426) (13,426) - -
Total Nonoperating Revenues (Expenses) 41,108,669 32,545,000 417,840 540,424
INCREASE IN NET POSITION 6,821,036 3,821,426 398,368 558,251
Net Position - Beginning of Year, as
Previously Reported 51,857,670 48,036,244 6,417,721 5,859,470
Prior Period Adjustment (16,849,976) - - -
Net Position - Beginning of Year, as Restated 35,007,694 48,036,244 6,417,721 5,859,470
NET POSITION - END OF YEAR 41,828,730$ 51,857,670$ 6,816,089$ 6,417,721$
Primary Government Component Unit
College Foundation
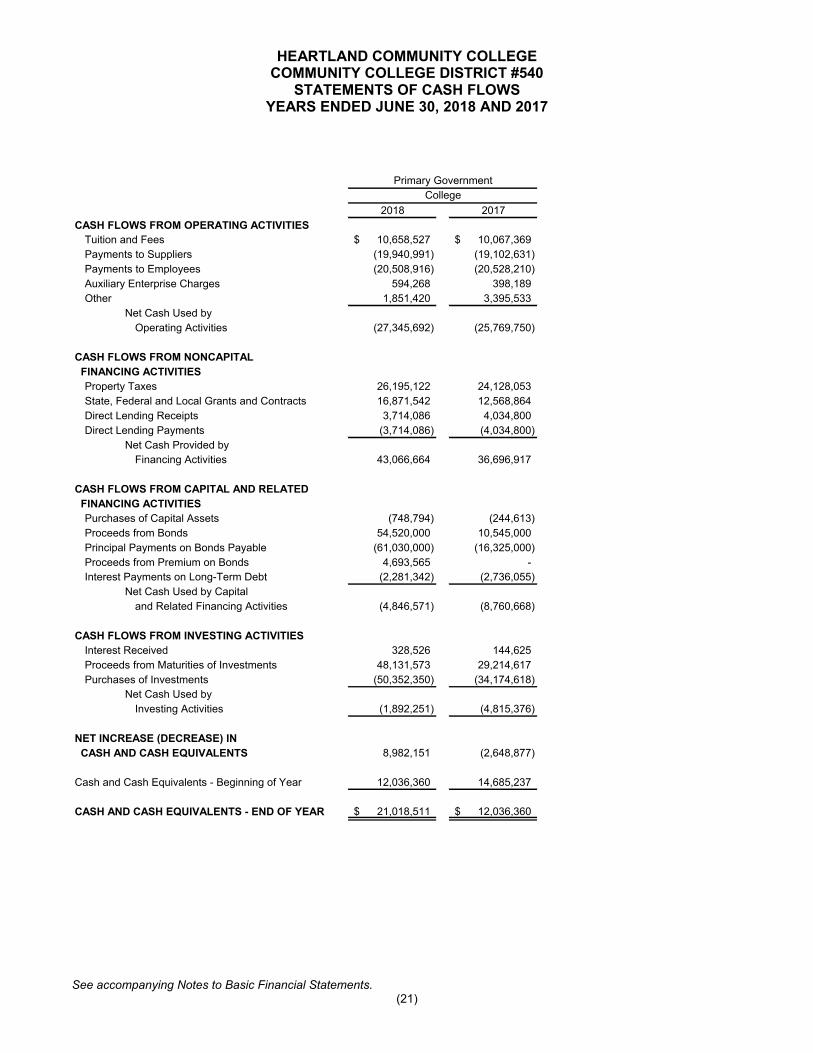
HEARTLAND COMMUNITY COLLEGE COMMUNITY COLLEGE DISTRICT #540
STATEMENTS OF CASH FLOWSYEARS ENDED JUNE 30, 2018 AND 2017
See accompanying Notes to Basic Financial Statements.(21)
2018 2017
CASH FLOWS FROM OPERATING ACTIVITIES
Tuition and Fees 10,658,527$ 10,067,369$
Payments to Suppliers (19,940,991) (19,102,631)
Payments to Employees (20,508,916) (20,528,210)
Auxiliary Enterprise Charges 594,268 398,189
Other 1,851,420 3,395,533
Net Cash Used by
Operating Activities (27,345,692) (25,769,750)
CASH FLOWS FROM NONCAPITAL
FINANCING ACTIVITIES
Property Taxes 26,195,122 24,128,053
State, Federal and Local Grants and Contracts 16,871,542 12,568,864
Direct Lending Receipts 3,714,086 4,034,800
Direct Lending Payments (3,714,086) (4,034,800)
Net Cash Provided by
Financing Activities 43,066,664 36,696,917
CASH FLOWS FROM CAPITAL AND RELATED
FINANCING ACTIVITIES
Purchases of Capital Assets (748,794) (244,613)
Proceeds from Bonds 54,520,000 10,545,000
Principal Payments on Bonds Payable (61,030,000) (16,325,000)
Proceeds from Premium on Bonds 4,693,565 -
Interest Payments on Long-Term Debt (2,281,342) (2,736,055)
Net Cash Used by Capital
and Related Financing Activities (4,846,571) (8,760,668)
CASH FLOWS FROM INVESTING ACTIVITIES
Interest Received 328,526 144,625
Proceeds from Maturities of Investments 48,131,573 29,214,617
Purchases of Investments (50,352,350) (34,174,618)
Net Cash Used by
Investing Activities (1,892,251) (4,815,376)
NET INCREASE (DECREASE) IN
CASH AND CASH EQUIVALENTS 8,982,151 (2,648,877)
Cash and Cash Equivalents - Beginning of Year 12,036,360 14,685,237
CASH AND CASH EQUIVALENTS - END OF YEAR 21,018,511$ 12,036,360$
Primary Government
College

HEARTLAND COMMUNITY COLLEGE COMMUNITY COLLEGE DISTRICT #540
STATEMENTS OF CASH FLOWS (CONTINUED)YEARS ENDED JUNE 30, 2018 AND 2017
See accompanying Notes to Basic Financial Statements.(22)
2018 2017
RECONCILIATION OF OPERATING
LOSS TO NET CASH PROVIDED (USED) BY
OPERATING ACTIVITIES
Operating Loss (34,287,633)$ (28,723,574)$
Adjustments to Reconcile Operating
Loss to Net Cash Used by
Operating Activities:
Depreciation 4,491,303 4,533,451
Changes in Deferred Outflows of Resources (109,428) 1,088
Changes in Deferred Inflows of Resources 1,472,623 -
Change in Assets and Liabilities:
Receivables 947,670 (114,565)
Prepaid Items (234,587) (368,269)
Other (186,699) (9,545)
Accounts Payable 41,535 53,526
Accrued Liabilities 61,421 (688,447)
OPEB Liability 164,405 -
Deferred Tuition and Fees 348,239 (321,621)
Deferred Other Revenue (59,832) (178,924)
Deposits 4,950 53,930
Accrued Compensated Absences 341 (6,800)
Net Cash Used by
Operating Activities (27,345,692)$ (25,769,750)$
SUPPLEMENTAL DISCLOSURES OF
NONCASH OPERATING ACTIVITIES
State of Illinois Contributions Provided 12,075,075$ 11,174,726$
State of Illinois Contributions Paid 12,075,075$ 11,174,726$
College
Primary Government

HEARTLAND COMMUNITY COLLEGE COMMUNITY COLLEGE DISTRICT #540
NOTES TO BASIC FINANCIAL STATEMENTSJUNE 30, 2018 AND 2017
(23)
NOTE 1 SUMMARY OF SIGNIFICANT ACCOUNTING POLICIES
The financial statements are based on accounts prescribed or permitted by the Fiscal Management Manual of the Illinois Community College Board. The accounting policies of the District conform to accounting principles generally accepted in the United States of America as set forth in GASB Statement No. 35, Basic Financial Statements - and Management’s Discussion and Analysis - for Public Colleges and Universities. The following is a summary of the significant policies:
Organization
Heartland Community College Community College District #540 (District or College) is a public community college serving portions of DeWitt, Ford, Livingston, Logan, McLean, and Tazewell Counties. It was established in 1990 and is governed by a board of trustees elected by the residents of the District. The board is responsible for establishing the policies and procedures of the District.
Revenues are substantially generated as a result of taxes assessed and allocated to the District and grants received from state and federal governmental agencies. The District’s revenues are, therefore, primarily dependent upon the availability of funds at the state and federal level and the economy within its territorial boundaries. Industries within the territorial area are primarily manufacturing, insurance, retail, and agricultural.
Financial Reporting Entity
In evaluating how to define the District for financial reporting purposes, management has considered all potential component units. The decision whether to include a potential component unit was made by applying the criteria set forth in accounting principles generally accepted in the United States of America. A component unit is a legally separate entity that meets all of the following requirements:
The economic resources received or held by an organization are entirely or almostentirely for the direct benefit of the District,
The District is entitled to, or has the ability to otherwise access, a majority of theeconomic resources received or held by the organization, and
The economic resources received or held by an organization that the District isentitled to, or has the ability to otherwise access, are significant to the District.
Based on the foregoing criteria, the Heartland Community College Foundation (Foundation) is considered to be a component unit and is discretely presented in the basic financial statements.
The Foundation assists the District and its students in the form of scholarships and grants from the Foundation’s fundraising efforts. Total student scholarships awarded for the yearsended June 30, 2018 and 2017 were $442,331 and $415,365, respectively.

HEARTLAND COMMUNITY COLLEGE COMMUNITY COLLEGE DISTRICT #540
NOTES TO BASIC FINANCIAL STATEMENTSJUNE 30, 2018 AND 2017
(24)
NOTE 1 SUMMARY OF SIGNIFICANT ACCOUNTING POLICIES (CONTINUED)
Financial Reporting Entity (Continued)
The Foundation is a legally separate, tax-exempt component unit of the District. The Foundation acts primarily as a fundraising organization to supplement the resources that are available to the District in support of its programs. The Foundation is governed by a separate board of directors. Although the District does not control the timing or amount of receipts from the Foundation, the majority of resources or income thereon that the Foundation holds and invests, are restricted to the activities of the District by the donors. Because these restricted resources held by the Foundation can only be used by, or for the benefit of, the District, the Foundation is considered to be a component unit of the District.
The Foundation is a private nonprofit organization that reports its financial results under the Financial Accounting Standards Board (FASB) Accounting Standards Codification (ASC). Most significant to the Foundation’s operations and reporting models is FASB ASC 958 related to accounting for contributions received and financial reporting for nonprofit organizations. As such, certain revenue recognition criteria and presentation features are different from GASB revenue recognition criteria and presentation features. For purposes of the District’s financial statement presentation, the financial statements of the Foundation have been converted to a GASB presentation.
Separate financial statements of the Foundation are available. Requests should be made to Douglas E. Minter, Secretary/Treasurer of the Foundation, at 309-268-8109.
Basis of Accounting
For financial reporting purposes, the District is considered a special-purpose government entity engaged only in business-type activities. Accordingly, the District’s financial statements have been presented using the economic resources measurement focus and the accrual basis of accounting. Under the accrual basis, revenues are recognized when earned, and expenses are recorded when an obligation has been incurred. All significant intra-agency transactions have been eliminated.
Nonexchange transactions, in which the District receives value without directly giving equal value in return, include property taxes, federal, state, and local grants, state appropriations, and other contributions. On an accrual basis, revenue from property taxes is recognized in the period for which the levy is intended to finance. Revenue from grants, state appropriations, and other contributions is recognized in the year in which all eligibility requirements have been satisfied. Eligibility requirements include timing requirements, which specify the year when the resources are required to be used or the fiscal year when use is first permitted, matching requirements, in which the District must provide local resources to be used for a specified purpose, and expenditure requirements, in which the resources are provided to the District on a reimbursement basis.

HEARTLAND COMMUNITY COLLEGE COMMUNITY COLLEGE DISTRICT #540
NOTES TO BASIC FINANCIAL STATEMENTSJUNE 30, 2018 AND 2017
(25)
NOTE 1 SUMMARY OF SIGNIFICANT ACCOUNTING POLICIES (CONTINUED)
Investments
Investments are reported at fair value in accordance with guidelines defined by GASB Statement No. 72. Bank deposits and certificates of deposit are recorded at cost. Investment income consists of interest earned on bank deposits and certificates of deposit.
Property Taxes
The District’s property taxes are levied each calendar year on all taxable real property located in the District. Property taxes are collected by the County Collector and are submitted to the County Treasurer, who remits to the units their respective shares of the collections. Taxes levied in 2017 become due and payable in two installments (June and September 2018). In accordance with board resolution, property taxes extended for the 2017 tax year and collected in 2018 are recorded as revenue in fiscal year 2018. Uncollected taxes are sold by the County Collector in order that those taxes can be distributed to respective taxing bodies. Final distribution on the current year levy is made by the County Collector’s office at a date after the tax sale, usually no later than during the first quarter of the following year.
Capital Assets
Capital assets include property, plant, equipment, and infrastructure assets (such as roads and sidewalks), intangibles (software and other), donated capital assets, donated works of art and similar items, and capital assets received in a service concession arrangement are reported at cost at the date of acquisition. The District’s capitalization policy includes all items with an initial unit cost of $5,000 or more and an estimated useful life in excess of one year. Renovations to buildings, infrastructure, and land improvements that increase the value more than $50,000 or extend the useful life of the structure are capitalized. Routine repairs and maintenance are charged to operating expense in the year in which the expense is incurred. Major outlays for capital assets and improvements are capitalized as projects are constructed, with interest accrued during the construction period.
Depreciation is computed using the straight-line method over the following useful lives:
Land Improvements 10 to 20 YearsBuildings and Infrastructure 40 to 60 YearsFurniture and Equipment 3 to 10 Years

HEARTLAND COMMUNITY COLLEGE COMMUNITY COLLEGE DISTRICT #540
NOTES TO BASIC FINANCIAL STATEMENTSJUNE 30, 2018 AND 2017
(26)
NOTE 1 SUMMARY OF SIGNIFICANT ACCOUNTING POLICIES (CONTINUED)
Risk Management
The District is exposed to various risks of loss related to torts; theft of, damage to, and destruction of assets, errors and omissions; injuries to employees; and natural disasters. The District purchases commercial insurance coverage covering each of these risks of loss, except for health care for which the District is self-insured. The District has not had significant reductions in insurance coverage for the past two years. Settled claims have not exceeded this commercial coverage in any of the past four fiscal years.
Unearned Tuition and Grant Revenues
Tuition collected prior to June 30 for the subsequent fall semester and the portion of tuition collected for the summer session that is not earned as of June 30, is recorded as unearned revenue at June 30, and recognized as revenue in the following year.
Noncurrent Liabilities
Noncurrent liabilities include (1) principal amounts of general obligation bonds, debt certificates, and capital lease obligations with contractual maturities greater than one year and (2) estimated amounts for accrued compensated absences and other liabilities that willnot be paid within the next fiscal year.
Scholarship Discounts and Allowances
Student tuition and fee revenues, and certain other revenues from students, are reported net of scholarship discounts and allowances in the statement of revenues, expenses, andchanges in net position. Scholarship discounts and allowances are the difference between the stated charge for goods and services provided by the District, and the amount that is paid by students and/or third parties making payments on the student’s behalf.
On-behalf Payments for Fringe Benefits and Salaries
The District recognizes as revenues and expenses contributions made by the state of Illinois to the State Universities Retirement System on behalf of the District’s employees. In fiscal years 2018 and 2017, the State made contributions of $10,584,229 and $11,174,726, respectively.
Use of Estimates
The preparation of financial statements in conformity with accounting principles generally accepted in the United States of America requires management to make estimates and assumptions that affect the reported amounts of assets and liabilities at the date of the financial statements and the reported amounts of revenues and expenses during the reporting period. Actual results could differ from those estimates.

HEARTLAND COMMUNITY COLLEGE COMMUNITY COLLEGE DISTRICT #540
NOTES TO BASIC FINANCIAL STATEMENTSJUNE 30, 2018 AND 2017
(27)
NOTE 1 SUMMARY OF SIGNIFICANT ACCOUNTING POLICIES (CONTINUED)
Cash and Cash Equivalents
For purposes of the statement of cash flows, all highly liquid investments with a maturity of three months or less when purchased are considered cash equivalents.
Prepaid Items
Prepaid items represent current expenditures which benefit future periods.
Deferred Outflows of Resources
The District reports decreases in net position or fund equity that relate to future periods as deferred outflows of resources in a separate section of its statements of net position. The District has three types of items which occur. Employer paid federal, trust or grant contributions were made subsequent to the pension liability measurement date. The District has the deferred charge on refunding reported in the statements of net position. A deferred charge on refunding results from the difference in the carrying value of refunded debt and its reacquisition price. This amount is deferred and amortized over the shorter of the life of the refunded or refunding debt. Additionally, the District has deferred outflows related to OPEB expense to be recognized in future periods and for contributions made after the measurement date.
Deferred Inflows of Resources
The District’s financial statements report a separate section for deferred inflows of resources. This separate financial statement element reflects an increase in net position or fund equity that applies to a future period. The District will not recognize the related revenue until a future event occurs. The District has two types of deferred inflows of resources relating to revenue recognition. Tax receivables are recorded in the current year, but the revenue will be recorded in the subsequent year. The District also has deferred inflows related to OPEB expense to be recognized in future periods.
Pensions
For purposes of measuring the net pension liability, deferred outflows of resources and deferred inflows of resources related to pensions, and pension expense, information about the plan net position of the State Universities Retirement System (SURS) and additions to/deductions from SURS’ plan net position has been determined on the same basis as they are reported by SURS. For this purpose, benefit payments (including refunds of employee contributions) are recognized when due and payable in accordance with the benefit terms. Investments are reported at fair value.

HEARTLAND COMMUNITY COLLEGE COMMUNITY COLLEGE DISTRICT #540
NOTES TO BASIC FINANCIAL STATEMENTSJUNE 30, 2018 AND 2017
(28)
NOTE 1 SUMMARY OF SIGNIFICANT ACCOUNTING POLICIES (CONTINUED)
Pensions (Continued)
For the purposes of financial reporting, the state of Illinois and participating employers are considered to be under a special funding situation. A special funding situation is defined as a circumstance in which a nonemployer entity is legally responsible for making contributions directly to a pension plan that is used to provide pensions to the employees of another entity or entities and either (1) the amount of the contributions for which the nonemployer entity is legally responsible is not dependent upon one or more events unrelated to pensions, or (2) the nonemployer is the only entity with a legal obligation to make contributions directly toa pension plan. The state of Illinois is considered a nonemployer contributing entity.Participating employers are considered contributing entities.
Net Position
The District’s net position is classified as follows:
Net Investment in Capital Assets: This represents the District’s total investment incapital assets, net of accumulated depreciation and outstanding debt incurred toacquire, construct, or improve those assets. Net investment in capital assetsexcludes unspent debt proceeds. As of June 30, 2018 and 2017, the District had$5,592,453 and $2,560,006, respectively, of unspent bond proceeds.
Restricted Net Position: This includes resources that the District is legally orcontractually obligated to spend in accordance with restrictions imposed by externalthird parties. When both restricted and unrestricted resources are available for use, itis the District’s policy to use restricted resources first, then unrestricted resourceswhen they are needed.
Unrestricted: This includes resources derived from student tuition and fees, stateappropriations, and sales and services of educational departments and auxiliaryenterprises. These resources are used for transactions relating to the educationaland general operations of the District and may be used at the discretion of thegoverning board to meet current expenses for any purpose.
Classification of Revenues
Operating revenues include activities that have the characteristics of exchange transactions, such as (1) student tuition and fees and (2) sales and services of auxiliary enterprises, net of scholarship discounts and allowances. Nonoperating revenue includes activities that have the characteristics of nonexchange transactions, such as (1) local property taxes, (2) state appropriations, and (3) most federal, state, and local grants and contracts and federal appropriations.
Classification of Expenses
Operating expenses are those expenses for the purpose of providing educational and operational activities of the College, such as (1) salaries, (2) scholarships, (3) operations and maintenance, (4) depreciation, and (5) expenses of auxiliary enterprises. Nonoperating expenses include expenses such as interest and amortization.

HEARTLAND COMMUNITY COLLEGE COMMUNITY COLLEGE DISTRICT #540
NOTES TO BASIC FINANCIAL STATEMENTSJUNE 30, 2018 AND 2017
(29)
NOTE 1 SUMMARY OF SIGNIFICANT ACCOUNTING POLICIES (CONTINUED)
Federal Financial Assistance Programs
The College participates in federally funded Pell Grants, SEOG Grants, Federal Work-Study, Federal Direct Loans, Student Support Services, and other educational programs. Federal programs are subject to an audit in accordance with Title 2 U.S. Code of Federal Regulations Part 200, Uniform Administrative Requirements, Cost Principles, and Audit Requirements for Federal Awards.
Reclassification
Prior year amounts have been reclassified, where appropriate, to conform to the current year method of presentation. These changes had no impact to the change in net position.
NOTE 2 DEPOSITS AND INVESTMENTS
Cash
Custodial credit risk is the risk that, in the event of a bank failure, the District’s deposits may not be returned to it. At June 30, 2018 and 2017, the bank balance of the District’s deposits, which primarily consists of demand deposits, was $4,615,750 and $4,469,486, respectively. At June 30, 2018 and 2017, all deposits were covered by federal depository insurance or by collateral held by the District’s agent in the District’s name.
The District’s deposits had the following balances at June 30:
Deposits
2018 2017Cash and Cash Equivalents 21,018,511$ 12,036,360$ Less: Illinois Funds (930,989) (1,076,037) Less: Illinois School District Liquid Asset Fund (ISDLAF) (15,945,320) (6,944,970)
Carrying Amount of Deposits 4,142,202$ 4,015,353$

HEARTLAND COMMUNITY COLLEGE COMMUNITY COLLEGE DISTRICT #540
NOTES TO BASIC FINANCIAL STATEMENTSJUNE 30, 2018 AND 2017
(30)
NOTE 2 DEPOSITS AND INVESTMENTS (CONTINUED)
Investments
The District’s investment balances were as follows at June 30:
Fair Market Less than More than
Value One Year One Year Rating
U.S. Agencies 3,525,420$ 2,291,055$ 1,234,365$ AA+ Standard & Poorʼs
Certificates of Deposit 15,608,228 15,131,028 477,200 AA+ Standard & Poorʼs
Total 19,133,648$ 17,422,083$ 1,711,565$
Fair Market Less than More than
Value One Year One Year Rating
U.S. Agencies 3,250,000$ 3,250,000$ -$ AA+ Standard & Poorʼs
Certificates of Deposit 13,662,871 13,662,871 - AA+ Standard & Poorʼs
Total 16,912,871$ 16,912,871$ -$
2018
2017
Credit Risk
Credit risk is the risk that the District will not recover its investments due to the inability of the counterparty to fulfill its obligation. Illinois statutes authorize the District to invest in obligations of the U.S. Treasury and U.S. Agencies, interest-bearing savings accounts, interest-bearing time deposits, money market mutual funds registered under the Investment Company Act of 1940 (limited to U.S. Government obligations), shares issued by savings and loan associations (provided the investments are insured by the Federal Savings and Loan Insurance Corporation (FSLIC)), short-term discount obligations issued by the Federal National Mortgage Association, share accounts of certain credit unions, securities issued by the Illinois Funds, investments in the ISDLAF, and certain repurchase agreements.
The board of trustees has authorized the District to invest funds in accordance with the Illinois Community College Act and the Investment of Public Funds Act with the exception that investments are not permitted in short-term obligations of U.S. corporations.
Concentration of Credit Risk
The District may be invested in a single institution so long as such funds do not exceed 30%of the institution’s capital structure.

HEARTLAND COMMUNITY COLLEGE COMMUNITY COLLEGE DISTRICT #540
NOTES TO BASIC FINANCIAL STATEMENTSJUNE 30, 2018 AND 2017
(31)
NOTE 2 DEPOSITS AND INVESTMENTS (CONTINUED)
Interest Rate Risk
The District does not have a formal investment policy that limits investment maturities as a means of managing its exposure to fair value losses arising from increasing interest rates.
Accounting principles generally accepted in the United States of America provide the framework for measuring fair value. That framework provides a fair value hierarchy that prioritizes the inputs to valuation techniques used to measure fair value. The hierarchy gives the highest priority to unadjusted quoted prices in active markets for identical assets or liabilities (Level 1 measurements) and the lowest priority to unobservable inputs (Level 3measurements). The three levels of the fair value hierarchy under accounting principles generally accepted in the United States of America are described below:
Level 1 Inputs to the valuation methodology are unadjusted quoted prices for identical assets or liabilities in active markets that the District has the ability to access.
Level 2 Inputs to the valuation methodology include:
• Quoted prices for similar assets or liabilities in active markets;• Quoted prices for identical or similar assets or liabilities in inactive markets;• Inputs other than quoted prices that are observable for the asset or liability;• Inputs that are derived principally from or corroborated by observable
market data by correlation or other means.
If the asset or liability has a specified (contractual) term, the Level 2 input must be observable for substantially the full term of the asset or liability.
Level 3 Inputs to the valuation methodology are unobservable and significant to the fair value measurement.
The asset’s or liability’s fair value measurement level within the fair value hierarchy is based on the lowest level of any input that is significant to the fair value measurement. Valuation techniques used need to maximize the use of observable inputs and minimize the use of unobservable inputs.
Equity securities and mutual funds listed on a national market or exchange are valued at the last sales price, or if there is no sale and the market is still considered active, at the last transaction price before year-end. Such securities are classified within Level 1 of the valuation hierarchy.
Debt securities consisting primarily of corporate and municipal bonds are generally valued at the most recent price of the equivalent quoted yield for such securities, or those of comparable maturity, quality, and type. Debt securities are generally classified within Level 2of the valuation hierarchy.

HEARTLAND COMMUNITY COLLEGE COMMUNITY COLLEGE DISTRICT #540
NOTES TO BASIC FINANCIAL STATEMENTSJUNE 30, 2018 AND 2017
(32)
NOTE 2 DEPOSITS AND INVESTMENTS (CONTINUED)
Interest Rate Risk (Continued)
The methods described above may produce a fair value calculation that may not be indicative of net realizable value or reflective of future fair values. Furthermore, while the Foundation believes its valuation methods are appropriate and consistent with other market participants, the use of different methodologies or assumptions to determine the fair value of certain financial instruments could result in a different fair value measurement at the reporting date.
The following tables set forth by level, within the fair value hierarchy, the Foundation’s assets at fair value as of June 30, 2018:
Level 1 Level 2 Level 3 Total
U.S. Agencies -$ 3,525,420$ -$ 3,525,420$
Total -$ 3,525,420$ -$ 3,525,420$
Assets at Fair Value as of June 30, 2018
The following tables set forth by level, within the fair value hierarchy, the Foundation’s assets at fair value as of June 30, 2017:
Level 1 Level 2 Level 3 Total
U.S. Agencies -$ 3,250,000$ -$ 3,250,000$
Total -$ 3,250,000$ -$ 3,250,000$
Assets at Fair Value as of June 30, 2017
NOTE 3 PROPERTY TAXES
Property taxes are recorded as deferred inflows of resources in the year of the levy and are recognized as revenue in the following year for which they are budgeted. Accordingly, at June 30, 2018 and 2017, the District had $26,150,291 and $26,047,041, respectively, of deferred inflows of resources.

HEARTLAND COMMUNITY COLLEGE COMMUNITY COLLEGE DISTRICT #540
NOTES TO BASIC FINANCIAL STATEMENTSJUNE 30, 2018 AND 2017
(33)
NOTE 4 CAPITAL ASSETS
The following tables present the changes in the various capital asset categories for fiscal years 2018 and 2017.
Capital Assets – Fiscal Year 2018
Balance Balance
July 1, 2017 Additions Deletions June 30, 2018
Capital Assets not Being Depreciated:
Land 4,481,528$ -$ -$ 4,481,528$
Construction-in-Progress 102,958 51,388 (75,000) 79,346
Total Capital Assets not
Being Depreciated 4,584,486 51,388 (75,000) 4,560,874
Capital Assets Being Depreciated:
Furniture and Equipment 13,839,975 663,879 (188,893) 14,314,961
Buildings 121,163,674 50,000 - 121,213,674
Infrastructure 17,823,650 58,527 - 17,882,177
Total Capital Assets Being
Depreciated 152,827,299 772,406 (188,893) 153,410,812
Less Accumulated Depreciation for:
Furniture and Equipment (9,425,401) (575,828) 188,893 (9,812,336)
Buildings (27,838,225) (3,121,052) - (30,959,277)
Infrastructure (9,525,126) (794,423) - (10,319,549)
Total Accumulated Depreciation (46,788,752) (4,491,303) 188,893 (51,091,162)
Net Capital Assets Being
Depreciated 106,038,547 (3,718,897) - 102,319,650
Net Capital Assets 110,623,033$ (3,667,509)$ (75,000)$ 106,880,524$

HEARTLAND COMMUNITY COLLEGE COMMUNITY COLLEGE DISTRICT #540
NOTES TO BASIC FINANCIAL STATEMENTSJUNE 30, 2018 AND 2017
(34)
NOTE 4 CAPITAL ASSETS (CONTINUED)
Capital Assets – Fiscal Year 2017
Balance Balance
July 1, 2016 Additions Deletions June 30, 2017
Capital Assets not Being Depreciated:
Land 4,481,528$ -$ -$ 4,481,528$
Construction-in-Progress 102,958 - - 102,958
Total Capital Assets not
Being Depreciated 4,584,486 - - 4,584,486
Capital Assets Being Depreciated:
Furniture and Equipment 13,754,391 99,346 (13,762) 13,839,975
Buildings 121,163,674 - - 121,163,674
Infrastructure 17,678,383 145,267 - 17,823,650
Total Capital Assets Being
Depreciated 152,596,448 244,613 (13,762) 152,827,299
Less Accumulated Depreciation for:
Furniture and Equipment (8,818,064) (621,099) 13,762 (9,425,401)
Buildings (24,837,974) (3,000,251) - (27,838,225)
Infrastructure (8,613,025) (912,101) - (9,525,126)
Total Accumulated Depreciation (42,269,063) (4,533,451) 13,762 (46,788,752)
Net Capital Assets Being
Depreciated 110,327,385 (4,288,838) - 106,038,547
Net Capital Assets 114,911,871$ (4,288,838)$ -$ 110,623,033$

HEARTLAND COMMUNITY COLLEGE COMMUNITY COLLEGE DISTRICT #540
NOTES TO BASIC FINANCIAL STATEMENTSJUNE 30, 2018 AND 2017
(35)
NOTE 5 LONG-TERM LIABILITIES
Long-term liability activity for the years ended June 30, 2018 and 2017 is as follows:
Balance
Balance Balance Due Within
July 1, 2017 Additions Deletions June 30, 2018 One Year
General Obligation Bonds and
Debt Certificates 75,075,000$ 54,520,000$ (61,030,000)$ 68,565,000$ 10,445,000$
Bond Premium 1,898,512 5,447,408 (753,843) 6,592,077 759,632
Compensated Absences 1,177,523 763,353 (763,012) 1,177,864 588,932
Total 78,151,035$ 60,730,761$ (62,546,855)$ 76,334,941$ 11,793,564$
Balance
Balance Balance Due Within
July 1, 2016 Additions Deletions June 30, 2017 One Year
General Obligation Bonds and
Debt Certificates 80,855,000$ 10,545,000$ (16,325,000)$ 75,075,000$ 8,985,000$
Bond Premium 1,351,624 880,812 (333,924) 1,898,512 800,032
Compensated Absences 1,184,324 763,750 (770,551) 1,177,523 588,761
Total 83,390,948$ 12,189,562$ (17,429,475)$ 78,151,035$ 10,373,793$
Accrued compensated absences (earned vacation leave) at June 30, 2018 and 2017 is $1,177,864 and $1,177,523, respectively, and is expected to be paid out ratably or taken over the next two years.
In September 2012, the District issued $990,000 in General Obligation Debt Certificates, Series 2012, dated September 1, 2012. Proceeds of the certificates were used to finance capital improvements. Principal on the certificates was due annually beginning with December 1, 2013 through December 1, 2022, with interest rates ranging from 1.10% to 2.45%. Interest payments were due semiannually beginning December 1, 2013. On January 23, 2018, the outstanding balance was currently refunded with the General Obligation Community College Bonds, Series 2018.
In September 2011, the District issued $3,300,000 in General Obligation Debt Certificates, Series 2011, dated September 1, 2011. The Series 2011 certificates were due December 1, 2026, and had interest rates ranging from 2.0% to 4.0%. The proceeds were used to fund the construction of a wind turbine. On January 23, 2018, the outstanding balance was advanced refunded with the General Obligation Community College Bonds, Series 2018.
In December 2016, the District issued $1,700,000 in General Obligation Debt Certificates, Series 2016C, dated December 1, 2016. The Series 2016C certificates were due February 15, 2018, and had an interest rate of 2.25%. The proceeds were used to refund the Series 2013 certificates. On January 23, 2018, the outstanding balance was currentlyrefunded with the General Obligation Community College Bonds, Series 2018.
On February 17, 2016, the District issued General Obligation Community College Bonds, Series 2016A, in the amount of $4,375,000, due on December 1, 2017 through December 1, 2018 with interest rates ranging from 3% to 4%. Proceeds of the bonds were used to pay claims against the District and pay certain costs associated with the issuance of the bonds.Interest payments are due semiannually beginning December 1, 2016.

HEARTLAND COMMUNITY COLLEGE COMMUNITY COLLEGE DISTRICT #540
NOTES TO BASIC FINANCIAL STATEMENTSJUNE 30, 2018 AND 2017
(36)
NOTE 5 LONG-TERM LIABILITIES (CONTINUED)
The annual requirements to amortize these general obligation bonds outstanding are as follows:
Year Ending June 30, Principal Interest Total
2019 2,225,000$ 33,375$ 2,258,375$
On April 21, 2016, the District issued General Obligation Community College Bonds, Series 2016B, in the amount of $8,675,000 due on December 1, 2016 through December 1, 2025 with interest rates ranging from 2% to 4%. Proceeds of the bonds were used to advance refund a portion of the District’s outstanding General Obligation Community College Bonds, Series 2007 and pay certain costs associated with the issuance of the bonds.
The annual requirements to amortize these general obligation bonds outstanding are as follows:
Year Ending June 30, Principal Interest Total
2019 -$ 279,850$ 279,850$
2020 - 279,850 279,850
2021 - 279,850 279,850
2022 - 279,850 279,850
2023 - 279,850 279,850
2024-2026 8,525,000 421,025 8,946,025
Total 8,525,000$ 1,820,275$ 10,345,275$
On January 31, 2017, the District issued General Obligation Community College Bonds, Series 2017A, in the amount of $8,845,000 due on December 1, 2017 through December 1, 2025 with interest rates ranging from 3% to 4%. Proceeds of the bonds were used to advance refund a portion of the District’s outstanding General Obligation Community College Bonds, Series 2007 and pay certain costs associated with the issuance of the bonds.
The annual requirements to amortize these general obligation bonds outstanding are as follows:
Year Ending June 30, Principal Interest Total
2019 35,000$ 351,700$ 386,700$
2020 35,000 350,300 385,300
2021 40,000 348,800 388,800
2022 40,000 347,200 387,200
2023 45,000 345,500 390,500
2024-2026 8,615,000 557,500 9,172,500
Total 8,810,000$ 2,301,000$ 11,111,000$

HEARTLAND COMMUNITY COLLEGE COMMUNITY COLLEGE DISTRICT #540
NOTES TO BASIC FINANCIAL STATEMENTSJUNE 30, 2018 AND 2017
(37)
NOTE 5 LONG-TERM LIABILITIES (CONTINUED)
On August 17, 2017, the District issued General Obligation Community College Bonds, Series 2017B, in the amount of $37,535,000 due on December 1, 2018 through December 1, 2027 with interest rates ranging from 4% to 5%. Proceeds of the bonds were used to currently refund a portion of the District’s outstanding General Obligation Community College Bonds, Series 2007 and pay certain costs associated with the issuance of the bonds.
The annual requirements to amortize these general obligation bonds outstanding are as follows:
Year Ending June 30, Principal Interest Total
2019 3,235,000$ 1,577,500$ 4,812,500$
2020 4,760,000 1,417,600 6,177,600
2021 4,950,000 1,223,400 6,173,400
2022 5,150,000 1,021,400 6,171,400
2023 5,360,000 811,200 6,171,200
2024-2028 14,080,000 2,633,250 16,713,250
Total 37,535,000$ 8,684,350$ 46,219,350$
On August 17, 2017, the District issued General Obligation Community College Bonds, Series 2017C, in the amount of $1,325,000 due on December 1, 2018 with an interest rate of 4%. Proceeds of the bonds were used to currently refund a portion of the District’s outstanding General Obligation Community College Bonds, Series 2007 and pay certain costs associated with the issuance of the bonds.
The annual requirements to amortize these general obligation bonds outstanding are as follows:
Year Ending June 30, Principal Interest Total
2019 1,325,000$ 26,500$ 1,351,500$
The Series 2017B and 2017C refundings resulted in a deferred outflow of $898,960. The refundings resulted in future cash flow savings of $2,226,738 and an economic gain of $2,070,221.
On November 21, 2017, the District issued General Obligation Debt Certificates, Series 2017D, in the amount of $5,515,000 due on December 1, 2022 with an interest rate of 1.95%. Proceeds of the bonds were used to finance various capital improvements for the District and pay certain costs associated with the issuance of the Certificates. On January 23, 2018, the outstanding balance was currently refunded with the General Obligation Community College Bonds, Series 2018.
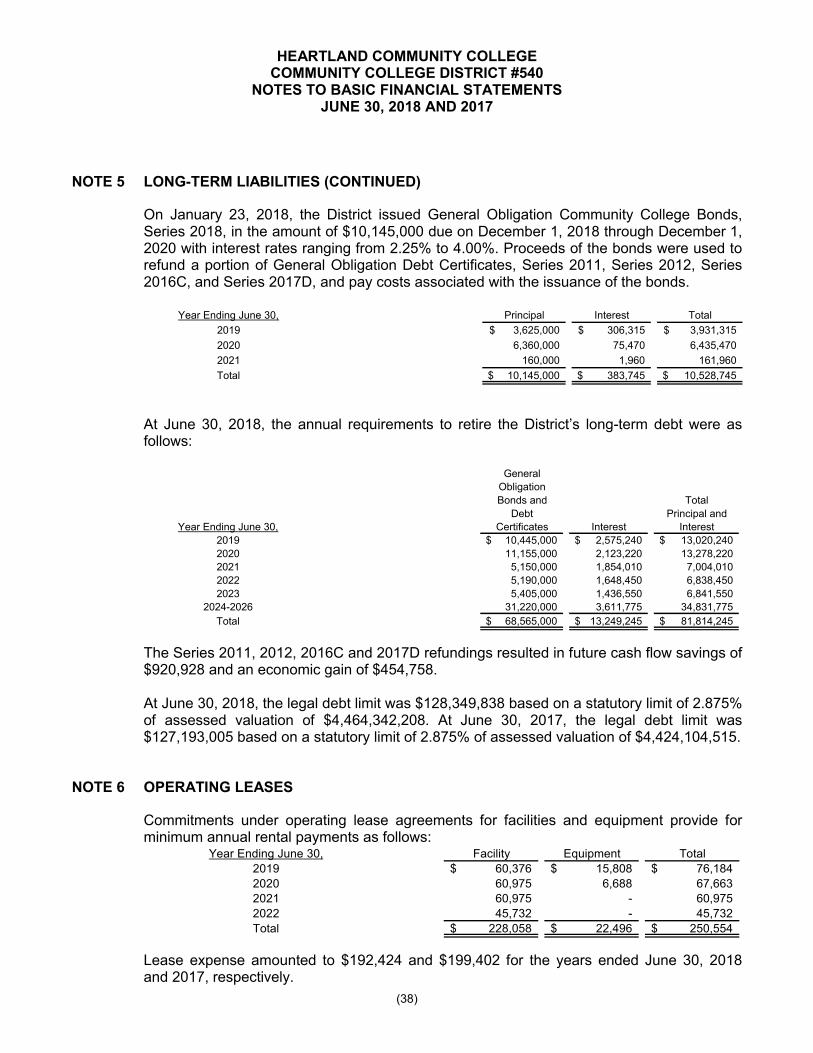
HEARTLAND COMMUNITY COLLEGE COMMUNITY COLLEGE DISTRICT #540
NOTES TO BASIC FINANCIAL STATEMENTSJUNE 30, 2018 AND 2017
(38)
NOTE 5 LONG-TERM LIABILITIES (CONTINUED)
On January 23, 2018, the District issued General Obligation Community College Bonds, Series 2018, in the amount of $10,145,000 due on December 1, 2018 through December 1, 2020 with interest rates ranging from 2.25% to 4.00%. Proceeds of the bonds were used torefund a portion of General Obligation Debt Certificates, Series 2011, Series 2012, Series 2016C, and Series 2017D, and pay costs associated with the issuance of the bonds.
Year Ending June 30, Principal Interest Total
2019 3,625,000$ 306,315$ 3,931,315$
2020 6,360,000 75,470 6,435,470
2021 160,000 1,960 161,960
Total 10,145,000$ 383,745$ 10,528,745$
At June 30, 2018, the annual requirements to retire the District’s long-term debt were as follows:
General
Obligation
Bonds and Total
Debt Principal and
Year Ending June 30, Certificates Interest Interest
2019 10,445,000$ 2,575,240$ 13,020,240$
2020 11,155,000 2,123,220 13,278,220
2021 5,150,000 1,854,010 7,004,010
2022 5,190,000 1,648,450 6,838,450
2023 5,405,000 1,436,550 6,841,550
2024-2026 31,220,000 3,611,775 34,831,775
Total 68,565,000$ 13,249,245$ 81,814,245$
The Series 2011, 2012, 2016C and 2017D refundings resulted in future cash flow savings of $920,928 and an economic gain of $454,758.
At June 30, 2018, the legal debt limit was $128,349,838 based on a statutory limit of 2.875%of assessed valuation of $4,464,342,208. At June 30, 2017, the legal debt limit was $127,193,005 based on a statutory limit of 2.875% of assessed valuation of $4,424,104,515.
NOTE 6 OPERATING LEASES
Commitments under operating lease agreements for facilities and equipment provide for minimum annual rental payments as follows:
Year Ending June 30, Facility Equipment Total
2019 60,376$ 15,808$ 76,184$
2020 60,975 6,688 67,663
2021 60,975 - 60,975
2022 45,732 - 45,732
Total 228,058$ 22,496$ 250,554$
Lease expense amounted to $192,424 and $199,402 for the years ended June 30, 2018and 2017, respectively.

HEARTLAND COMMUNITY COLLEGE COMMUNITY COLLEGE DISTRICT #540
NOTES TO BASIC FINANCIAL STATEMENTSJUNE 30, 2018 AND 2017
(39)
NOTE 7 DEFINED BENEFIT PENSION PLAN
General Information about the Pension Plan
Plan Description. The District contributes to the State Universities Retirement System of Illinois (SURS), a cost-sharing multiple-employer defined benefit plan with a special funding situation whereby the state of Illinois (the State) makes substantially all actuarially determined required contributions on behalf of the participating employers. SURS was established July 21, 1941 to provide retirement annuities and other benefits for staff members and employees of state universities, certain affiliated organizations, and certain other state educational and scientific agencies and for survivors, dependents, and other beneficiaries of such employees. SURS is considered a component unit of the State’sfinancial reporting entity and is included in the State’s financial reports as a pension trust fund. SURS is governed by Chapter 40, Act 5, Article 15 of the Illinois Compiled Statutes. SURS issues a publicly available financial report that includes financial statements and required supplementary information. That report may be obtained by accessing the website at www.SURS.org.
Benefits Provided. A traditional benefit plan was established in 1941. Public Act 90-0448 enacted effective January 1, 1998, established an alternative defined benefit program known as the portable benefit package. The traditional and portable plan Tier 1 refers to members that began participation prior to January 1, 2011. Public Act 96-0889 revised the traditional and portable benefit plans for members who begin participation on or after January 1, 2011, and who do not have other eligible Illinois reciprocal system services. The revised plan is referred to as Tier 2. New employees are allowed six months after their date of hire to make an irrevocable election. A summary of the benefit provisions as of June 30,2017 can be found in the System’s comprehensive annual financial report (CAFR) Notes to the Financial Statements.
Contributions. The State is primarily responsible for funding the System on behalf of the individual employers at an actuarially determined amount. Public Act 88-0593 provides a Statutory Funding Plan consisting of two parts: (i) a ramp-up period from 1996 to 2010 and (ii) a period of contributions equal to a level percentage of the payroll of active members ofthe System to reach 90% of the total Actuarial Accrued Liability by the end of Fiscal Year2045. Employer contributions from “trust, federal, and other funds” are provided underSection 15-155(b) of the Illinois Pension Code and require employers to pay contributionswhich are sufficient to cover the accruing normal costs on behalf of applicable employees.The employer normal cost for fiscal year 2017 and 2018 was 12.53% and 12.46%,respectively, of employee payroll. The normal cost is equal to the value of current year’spension benefit and does not include any allocation for the past-unfunded liability or intereston the unfunded liability. Plan members are required to contribute 8.0% of their annualcovered salary. The contribution requirements of plan members and employers areestablished and may be amended by the Illinois General Assembly.

HEARTLAND COMMUNITY COLLEGE COMMUNITY COLLEGE DISTRICT #540
NOTES TO BASIC FINANCIAL STATEMENTSJUNE 30, 2018 AND 2017
(40)
NOTE 7 DEFINED BENEFIT PENSION PLAN (CONTINUED)
General Information about the Pension Plan (Continued)
Participating employers make contributions toward separately financed specific liabilities under Section 15.139.5(e) of the Illinois Pension Code (relating to contributions payable due to the employment of “affected annuitants” or specific return to work annuitants) and Section 15.155(g) (relating to contributions payable due to earning increases exceeding 6% during the final rate of earnings period).
Pension Liabilities, Expense, and Deferred Outflows of Resources and DeferredInflows of Resources Related to Pensions
Net Pension Liability
SURS reported a net pension liability (NPL) of $25,481,105,995 and $25,965,271,744 for the years ended June 30, 2017 and 2016, respectively. The net pension liabilities were measured as of June 30, 2016 and 2015, respectively.
Employer Proportionate Share of Net Pension Liability
The amount of the proportionate share of the net pension liability to be recognized for the District is $-0- for both years ended June 30, 2017 and 2016. The proportionate share of the State’s net pension liability associated with the District at June 30, 2017 and 2016 was$110,893,773 or 0.4352% and $113,066,447 or 0.4355%, respectively. This amount should not be recognized in the financial statements. The net pension liability and the total pension liability as of June 30, 2017 and 2016 were determined based on the June 30, 2016 and 2015 actuarial valuations rolled forward. The basis of allocation used in the proportionate share of net pension liability is the actual reported pensionable earnings made to SURS during fiscal years 2017 and 2016.
Pension Expense
For the years ended June 30, 2017 and 2016, SURS reported collective net pension expenses of $2,412,918,129 and $2,566,164,865, respectively.
Employer Proportionate Share of Pension Expense
The employer proportionate share of collective pension expense should be recognized similarly to on-behalf payments as both revenue and matching expenditure in the financial statements. The basis of allocation used in the proportionate share of collective pension expense is the actual reported pensionable earnings made to SURS during fiscal years2017 and 2016. As a result, the District recognized on-behalf revenue and pension expense of $10,501,020 and $11,174,431 for the fiscal years ended June 30, 2018 and 2017, respectively.

HEARTLAND COMMUNITY COLLEGE COMMUNITY COLLEGE DISTRICT #540
NOTES TO BASIC FINANCIAL STATEMENTSJUNE 30, 2018 AND 2017
(41)
NOTE 7 DEFINED BENEFIT PENSION PLAN (CONTINUED)
Pension Liabilities, Expense, and Deferred Outflows of Resources and DeferredInflows of Resources Related to Pensions
Deferred Outflows of Resources and Deferred Inflows of Resources Related to Pensions
Deferred outflows of resources are the consumption of net position by the system that is applicable to future reporting periods.
SURS Collective Deferred Outflows and Deferred Inflows of Resources
Fiscal year ended June 30, 2017 Deferred Outflows Deferred Inflows
of Resources of Resources
Difference Between Expected and Actual Experience 139,193,227$ 1,170,771$
Changes in Assumption 205,004,315 259,657,577
Net Difference between Projected and Actual
Earnings on Pension Plan Investments 94,620,827 -
Total 438,818,369$ 260,828,348$
Fiscal year ended June 30, 2016 Deferred Outflows Deferred Inflows
of Resources of Resources
Difference Between Expected and Actual Experience 14,215,882$ 2,298,574$
Changes in Assumption 655,463,758 -
Net Difference between Projected and Actual
Earnings on Pension Plan Investments 1,431,081,306 635,552,976
Total 2,100,760,946$ 637,851,550$
SURS Collective Deferred Outflows and Deferred Inflows of Resources by Year to be recognized in Future Pension Expenses
Net Deferred
Outflows of
Fiscal Year Ending June 30, Resources
2018 55,589,850$
2019 187,874,276
2020 90,475,551
2021 (155,949,656)
2022 -
Thereafter -
Total 177,990,021$
Employer Deferral of Fiscal Year 2018 Pension Expense
The District paid $36,248 and $36,952 in federal, trust or grant contributions for the fiscal years ended June 30, 2018 and 2017, respectively. These contributions were made subsequent to the pension liability measurement dates of June 30, 2017 and 2016, and are recognized as Deferred Outflows of Resources as of June 30, 2018 and 2017.

HEARTLAND COMMUNITY COLLEGE COMMUNITY COLLEGE DISTRICT #540
NOTES TO BASIC FINANCIAL STATEMENTSJUNE 30, 2018 AND 2017
(42)
NOTE 7 DEFINED BENEFIT PENSION PLAN (CONTINUED)
Assumptions and Other Inputs
Actuarial Assumptions. The actuarial assumptions used in the June 30, 2017 valuation were based on the results of an actuarial experience study for the period June 30, 2010 – 2014. The total pension liability in the June 30, 2017 actuarial valuation was determined using the following actuarial assumptions, applied to all periods included in the measurement:
Inflation 2.75%Salary Increases 3.75% to 15.00%, including inflationInvestment Rate of Return 7.25% Beginning with the Actuarial
Valuation as of June 30, 2014
Mortality rates were based on the RP2014 Combined Mortality Table with projected generational mortality and a separate mortality assumption for disabled participants.
The long-term expected rate of return on pension plan investments was determined using a building-block method in which best-estimate ranges of expected future real rates of return (expected returns, net of pension plan investment expense and inflation) are developed for each major asset class. These ranges are combined to produce the long-term expected rate of return by weighting the expected future real rates of return by the target asset allocation percentage and by adding expected inflation. Best estimates of arithmetic real rates of return were adopted by the plan’s trustees after considering input from the plan’s investment consultant(s) and actuary(ies). For each major asset class that is included in the pension plan’s target asset allocation as of June 30, 2017, these best estimates are summarized in the following table:
Long-TermTarget Expected Real
Asset Class Allocation Rate of ReturnU.S. Equity 23 % 6.08 %Private Equity 6 8.73Non-U.S. Equity 19 7.34Global Equity 8 6.85Fixed Income 19 1.38Treasury-Inflation Protected Securities 4 1.17Emerging Market Debt 3 4.14Real Estate REITS 4 5.75Direct Real Estate 6 4.62Commodities 2 4.23Hedged Strategies 5 3.95Opportunity Fund 1 6.71
Total 100 % 5.20Inflation 2.75
Expected Arithmetic Return 7.95 %

HEARTLAND COMMUNITY COLLEGE COMMUNITY COLLEGE DISTRICT #540
NOTES TO BASIC FINANCIAL STATEMENTSJUNE 30, 2018 AND 2017
(43)
NOTE 7 DEFINED BENEFIT PENSION PLAN (CONTINUED)
Assumptions and Other Inputs (Continued)
Discount Rate. A single discount rate of 7.09% and 7.01% at June 30, 2017 and June 30, 2016, respectively, was used to measure the total pension liability. This single discount rate was based on an expected rate of return on pension plan investments of 7.25% at June 30, 2017 and June 30, 2016, and a municipal bond rate of 3.56% and 2.85% at June 30, 2017and June 30, 2016, respectively (based on the weekly rate closest to but not later than the measurement date of the 20-Year Bond Buyer Index as published by the Federal Reserve). The projection of cash flows used to determine this single discount rate were the amounts of contributions attributable to current plan members and assumed that plan member contributions will be made at the current contribution rate and that employer contributions will be made at rates equal to the statutory contribution rates under the System’s funding policy. Based on these assumptions, the pension plan’s fiduciary net position and future contributions were sufficient to finance the benefit payments through the year 2073. As a result, the long-term expected rate of return on pension plan investments was applied to projected benefit payments through the year 2073, and the municipal bond rate was applied to all benefit payments after that date.
Sensitivity of the System’s Net Pension Liability to Changes in the Discount Rate. Regarding the sensitivity of the net pension liability to changes in the single discount rate, the following presents the plan’s net pension liability, calculated using a single discount rate of 7.09% and 7.01% at June 30, 2017 and 2016, respectively, as well as what the plan’s net pension liability would be if it were calculated using a single discount rate that is 1-percentage-point lower or 1-percentage-point higher:
Current SingleDiscount Rate
1% Decrease Assumption 1% Increase6.09% 7.09% 8.09%
30,885,146,279$ 25,481,105,995$ 20,997,457,586$
Current SingleDiscount Rate
1% Decrease Assumption 1% Increase6.01% 7.01% 8.01%
31,348,831,631$ 25,695,271,744$ 21,502,421,700$
June 30, 2017
June 30, 2016
Additional information regarding the SURS basic financial statements including the Plan Net Position can be found in the SURS comprehensive annual financial report by accessing the website at www.SURS.org.
Changes of Benefit Terms. There were no benefit changes recognized in the Total Pension Liability as of June 30, 2017 and 2016.

HEARTLAND COMMUNITY COLLEGE COMMUNITY COLLEGE DISTRICT #540
NOTES TO BASIC FINANCIAL STATEMENTSJUNE 30, 2018 AND 2017
(44)
NOTE 7 DEFINED BENEFIT PENSION PLAN (CONTINUED)
Assumptions and Other Inputs (Continued)
Changes of Assumptions. In accordance with Illinois Compiled Statutes, an actuarial review is to be performed at least once every three years to determine the reasonableness of actuarial assumptions regarding the retirement, disability, mortality, turnover, interest, and salary of the members and benefit recipients of SURS. An experience review for the years June 30, 2010 to June 30, 2014 was performed in February 2015, resulting in the adoption of new assumptions as of June 30, 2015. The changes are listed below.
Mortality rates. Change from the RP 2000 mortality table projected to 2017, sexdistinct, to the RP-2014 mortality tables with projected generational moralityimprovement. Change to a separate mortality assumption for disabled participants.
Salary increase. Change assumption to service-based rates, ranging from 3.75% to15.00% based on years of service, with underlying wage inflation of 3.75%.
Normal retirement rates. Change to retirement rates at ages younger than 60, age66, and ages 70-79 to reflect observed experiences.
Early retirement rates. Change to a slight increase to the rates at ages 55 and 56. Turnover rates. Change to produce lower expected turnover for members with less
than 10 years of service and higher turnover for members with more than 10 years ofservice than the currently assumed rates.
Disability rates. Decrease rates and have separate rates for males and females toreflect observed experience.
Dependent assumption. Maintain the current assumption on marital status that variesby age and sex and the assumption that males are three years older than theirspouses.
NOTE 8 POSTEMPLOYMENT BENEFITS OTHER THAN PENSIONS
General Information
Plan administrationThe District participates in the state of Illinois Community College Health Insurance Security Fund (CCHISF) (also known as the College Insurance Program, “CIP”). CIP is a non-appropriated trust fund held outside the State Treasury, with the State Treasurer as custodian. Additions deposited into the Trust are for the sole benefit of providing the health benefits to retirees, as established under the plan, and associated administrative costs. CIP is a cost-sharing multiple-employer defined benefit post-employment healthcare plan that covers retired employees and their dependents of Illinois community college districts throughout the state of Illinois, excluding the City Colleges of Chicago. The Department of Central Management Services (Department) administers the plan with the cooperation of the State Universities Retirement System and the boards of trustees of the various community college districts. Separate financial statements, including required supplementary information, may be obtained from the Department at 715 Stratton Office Building, Springfield, Illinois, 62706.

HEARTLAND COMMUNITY COLLEGE COMMUNITY COLLEGE DISTRICT #540
NOTES TO BASIC FINANCIAL STATEMENTSJUNE 30, 2018 AND 2017
(45)
NOTE 8 POSTEMPLOYMENT BENEFITS OTHER THAN PENSION (CONTINUED)
General Information (Continued)
Plan membershipAll members receiving benefits from the State Universities Retirement System (SURS) who have been full-time employees of a community college district or an association of a community who have paid the required active member CIP contributions prior to retirement are eligible to participate in CIP. Survivors of an annuitant or benefit recipient eligible for CIP coverage are also eligible for coverage under CIP.
Benefits providedHealth, dental, and vision benefits include basic benefits for annuitants and dependents under the State’s self-insurance plan and insurance contracts currently in force. Annuitants may be required to contribute towards health, dental, and vision benefits with the amount based on factors such as date of retirement, years of credited service with the State, whether the annuitant is covered by Medicare, and whether the annuitant has chosen a managed health care plan. Annuitants who retired prior to January 1, 1998, and who are vested in the State University’s Retirement System do not contribute towards health, dental, and vision benefits. For annuitants who retired on or after January 1, 1998, the annuitant’s contribution amount is reduced five percent for each year of credited service with the State allowing those annuitants with twenty or more years of credited service to not have to contribute towards health, dental, and vision benefits. Annuitants also receive life insurance coverage equal to the annual salary of the last day of employment until age 60, at which time the benefit becomes $5,000.
ContributionsThe Act requires every contributor (employee) of SURS to contribute .5% of covered payroll and every community college district to contribute .5% of covered payroll. Retirees pay a premium for coverage that is also determined by ILCS. The State Pension Funds Continuing Appropriation Act (40/ILCS 15/1.4) requires a special funding situation whereby the State of Illinois to make an annual appropriation to the CIP to cover any expected expenditures in excess of the contributions by active employees, employers, and retirees. The result is pay as you go financing of the plan. The employer contributions made by the state of Illinois on behalf of the District to CIP and the College’s contributions for the years ended June 30, 2018 and 2017 were $83,229 and $81,331, respectively.
Illinois Community College Health Insurance Security Fund – OPEB Liabilities, Expense, and Deferred Outflows of Resources and Deferred Inflows of Resources Related to OPEB
The District reported a liability of $17,095,712 as of June 30, 2018. This amount is the District’s proportional share of the net OPEB liability. The State of Illinois is considered a non-employer contributing entity and the state’s contribution meets the definition of a special funding situation. The State of Illinois’ proportionate share of the net pension liability associated with the District totaled $16,870,542. The net OPEB liability was measured as of June 30, 2017. The total OPEB liability used to calculate the net OPEB liability was determined by an actuarial valuation as of June 30, 2016, with procedures performed to roll forward the total OPEB liability to the June 30, 2017 measurement date. The District’s proportion of the net OPEB liability was based on the District’s share of contributions to the OPEB plan relative to the contributions of all participating employers and the state of Illinois. At June 30, 2017, the District’s proportion was 0.937451%.

HEARTLAND COMMUNITY COLLEGE COMMUNITY COLLEGE DISTRICT #540
NOTES TO BASIC FINANCIAL STATEMENTSJUNE 30, 2018 AND 2017
(46)
NOTE 8 POSTEMPLOYMENT BENEFITS OTHER THAN PENSION (CONTINUED)
For the year ended June 30, 2018, the District recognized OPEB expense of $1,610,126 for its proportionate share of the OPEB expense. In addition, the District recognized an additional $1,490,846 as OPEB expense (and revenue) for its proportionate share of the State of Illinois’ contribution to the plan.
At June 30, 2018, the District reported deferred outflows of resources and deferred inflows of resources related to OPEB from the following sources:
Deferred Deferred Outflows of Inflows of
Deferred Amounts Related to OPEB Resources ResourcesDeferred Amounts to be Recognized in OPEB Expense in
Future PeriodsDifferences between Expected and Actual Experience -$ 48,384$ Changes of Assumptions - 1,424,059Net Difference between Projected and Actual Investment
Earnings on OPEB Plan Investments - 180Changes in Proportion and Differences between Employer
Contributions and Share of Contributions 108,233 -
Total Deferred Amounts to be Recognized in OPEB Expense in Future Periods 108,233 1,472,623
OPEB Contributions Made Subsequent to the Measurement Date 83,229 -
Total Deferred Amounts Related to OPEB $ 191,462 $ 1,472,623
Amounts reported as deferred outflows of resources and deferred inflows of resources related to OPEB will be recognized in OPEB expense in future periods as follows:
Deferred DeferredOutflows of Inflows of
Year ended June 30, Resources Resources2018 21,646$ 294,533$ 2019 21,646 294,533
2020 21,646 294,533 2021 21,646 294,533 2022 21,649 294,491
108,233$ 1,472,623$

HEARTLAND COMMUNITY COLLEGE COMMUNITY COLLEGE DISTRICT #540
NOTES TO BASIC FINANCIAL STATEMENTSJUNE 30, 2018 AND 2017
(47)
NOTE 8 POSTEMPLOYMENT BENEFITS OTHER THAN PENSION (CONTINUED)
Actuarial assumptions and other inputs. The total CIP plan’s net OPEB liability was determined by an actuarial valuation as of June 30, 2016 using the following actuarial assumptions, applied to all periods included in the measurement date, unless otherwise specified.
Inflation – 2.75% Salary increases – depends on service and ranges from 10.00% at less than 1
year of service to 3.75% at 34 or more years of service. Salary increase includesa 3.75 wage inflation assumption
Investment rate of return – 0%, net of OPEB plan investment expense, includinginflation
Healthcare cost trend rates – actual trend used for fiscal year 2017. For fiscalyears on or after 2018, trend starts at 8.00% and 9.00% for non-Medicare costsand post Medicare costs, respectively, and gradually decreases to an ultimatetrend rate of 4.50%. Additional trend rate of 0.52% is added to non-Medicare coston and after 2020 to account for the Excise tax.
Mortality rates for retirement and beneficiary annuitants were based on the RP-2014 White Collar Annuitant Mortality Table. For disabled annuitants mortality rates were based on the RP-2014 Disabled Annuitant table. Mortality rates for pre-retirement were based on the RP-2014 White Collar table. Tables were adjusted for SURS experience. All tables reflect mortality improvements using Projection Scale MP-2014.
The actuarial assumptions used in the June 30, 2016 valuation were based on the results of an actuarial experience study for the period June 30, 2010 to June 30, 2014.
Discount RateProjected benefit payments were discounted to their actuarial present value using a Single Discount Rate that reflects (1) a long-term expected rate of return on OPEB plan investments (to the extent that the plan’s fiduciary net position is projected to be sufficient to pay benefits), and (2) tax-exempt municipal bond rate based on an index of 20-year general obligation bond with an average AA credit rating as of the measurement date (to the extent that the contributions for use with the long-term expected rate of return are not met). Since CIP is financed on a pay-as-you-go basis, a discount rate consistent with the 20-year general obligation bond index has been selected. The discount rates are 2.85% as of June 30, 2016, and 3.56% as of June 30, 2017.

HEARTLAND COMMUNITY COLLEGE COMMUNITY COLLEGE DISTRICT #540
NOTES TO BASIC FINANCIAL STATEMENTSJUNE 30, 2018 AND 2017
(48)
NOTE 8 POSTEMPLOYMENT BENEFITS OTHER THAN PENSION (CONTINUED)
Changes in the Net OPEB Liability
Total Plan
OPEB Fiduciary Net OPEB
Liability Net Position Liability
(A) (B) (A) - (B)
Balances at June 30, 2016 16,702,456$ (358,725)$ 17,061,181$
Changes for the year:
Service Cost 1,386,943 - 1,386,943
Interest on Total OPEB Liability 511,686 - 511,686Differences Between Expected and Actual
Experience of the Total OPEB Liability (58,061) - (58,061)
Changes of Assumptions (1,708,869) - (1,708,869)
Employer Contributions - 81,333 (81,333)
Active Member Contributions - 40,938 (40,938)
Net Investment Income - Projected - 225 (225)Benefit Payments, including Refunds
of Employee Contributions (214,845) (214,845) -
Operating Expenses - (27,055) 27,055
Other - 1,727 (1,727)
Net Changes (83,146) (117,677) 34,531 Balances at June 30, 2017 16,619,310$ (476,402)$ 17,095,712$
Sensitivity of CIP’s Net OPEB Liability to changes in the Single Discount RateThe following presents the CIP plan’s net OPEB liability, calculated using a Single Discount Rate of 3.56%, as well as what the total CIP’s plan net OPEB liability would be if it were calculated using a discount rate that is 1-percentage-point lower (2.56%) or 1-percentage-point higher (4.56%) than the current discount rate:
Current SingleDiscount
1% Decrease Rate Assumption 1% Increase2.56% 3.56% 4.56%
Net OPEB Liability $ 19,551,703 $ 17,095,712 $ 14,978,325
Sensitivity of Net OPEB Liability as of June 30, 2017 to the Single Discount Rate Assumption

HEARTLAND COMMUNITY COLLEGE COMMUNITY COLLEGE DISTRICT #540
NOTES TO BASIC FINANCIAL STATEMENTSJUNE 30, 2018 AND 2017
(49)
NOTE 8 POSTEMPLOYMENT BENEFITS OTHER THAN PENSION (CONTINUED)
Sensitivity of the CIP’s plan Net OPEB liability to changes in the healthcare cost trend rates. The following presents the CIP’s plan net OPEB liability, calculated using the healthcare cost trend rates as well as what the total CIP’s net OPEB liability would be if it were calculated using healthcare cost trend rates that are 1-percentage-point lower or 1-percentage-point higher than the current healthcare cost trend rates. The key trend rates are 8.00% in 2018 decreasing to an ultimate trend rate of 5.02% in 2025, for non-Medicare coverage, and 9.00% in 2018 decreasing to an ultimate trend rate of 4.5% in 2027 for Medicare coverage.
Healthcare CostTrend
1% Decrease Rate Assumption 1% Increase
Net OPEB Liability $ 14,182,626 $ 17,095,712 $ 21,311,291
Sensitivity of Net OPEB Liability as of June 30, 2017 to the Healthcare Cost Trend Rate Assumption
One percentage point decrease in healthcare trend rates are 7.00% in 2018decreasing to an ultimate trend rate of 4.02% in 2025, for non-Medicarecoverage, and 8.00% in 2018 decreasing to an ultimate trend rate of 3.5% in2027 for Medicare coverage.
One percentage point increase in healthcare trend rates are 9.00% in 2018decreasing to an ultimate trend rate of 6.02% in 2025, for non-Medicarecoverage, and 10.00% in 2018 decreasing to an ultimate trend rate of 5.5% in2027 for Medicare coverage.
NOTE 9 RISK MANAGEMENT
The District accounts for and finances its uninsured risks of loss related to medical care, outpatient prescription drug costs, and dental care. A third party administrator provides administrative services for this self-insurance plan. Under this program, the fund provides coverage of the District’s employee medical insurance up to $105,000 in eligible claims per covered member per year. The aggregate stop loss coverage limit (for all covered members) equals the average number of employees during the stop loss coverage period multiplied by the aggregate stop loss limit claim value of $12,754. In no event will the aggregate stop loss coverage limit be less than $3,133,712.
The reserve for health care costs reported in the fund at June 30, 2018 and 2017, is based on the requirements of Governmental Accounting Standards Board Statement No. 10, which requires that a liability for claims be reported if information prior to the issuance of the financial statements indicates that it is probable that a liability has been incurred at the date of the financial statements and the amount of the loss can be reasonably estimated. Claims liability includes all known claims and an amount for claims that have been incurred but not reported (IBNR).
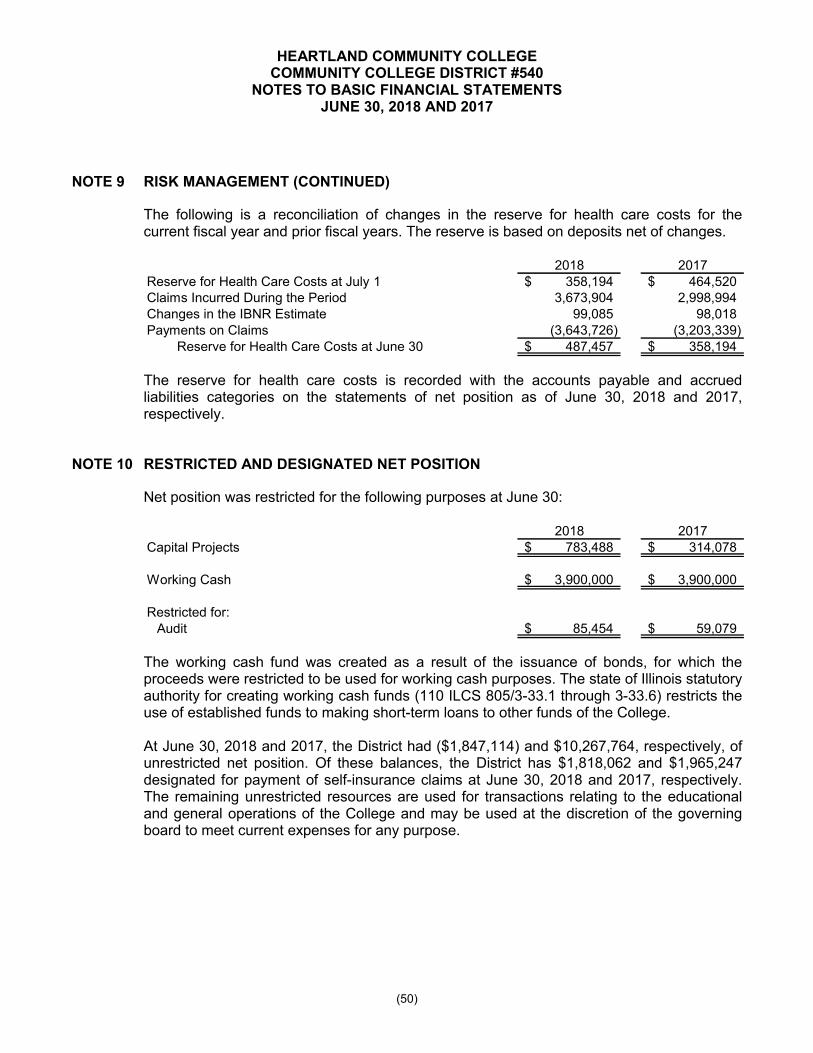
HEARTLAND COMMUNITY COLLEGE COMMUNITY COLLEGE DISTRICT #540
NOTES TO BASIC FINANCIAL STATEMENTSJUNE 30, 2018 AND 2017
(50)
NOTE 9 RISK MANAGEMENT (CONTINUED)
The following is a reconciliation of changes in the reserve for health care costs for the current fiscal year and prior fiscal years. The reserve is based on deposits net of changes.
2018 2017Reserve for Health Care Costs at July 1 358,194$ 464,520$ Claims Incurred During the Period 3,673,904 2,998,994 Changes in the IBNR Estimate 99,085 98,018 Payments on Claims (3,643,726) (3,203,339)
Reserve for Health Care Costs at June 30 487,457$ 358,194$
The reserve for health care costs is recorded with the accounts payable and accrued liabilities categories on the statements of net position as of June 30, 2018 and 2017, respectively.
NOTE 10 RESTRICTED AND DESIGNATED NET POSITION
Net position was restricted for the following purposes at June 30:
2018 2017Capital Projects 783,488$ 314,078$
Working Cash 3,900,000$ 3,900,000$
Restricted for:Audit 85,454$ 59,079$
The working cash fund was created as a result of the issuance of bonds, for which the proceeds were restricted to be used for working cash purposes. The state of Illinois statutory authority for creating working cash funds (110 ILCS 805/3-33.1 through 3-33.6) restricts the use of established funds to making short-term loans to other funds of the College.
At June 30, 2018 and 2017, the District had ($1,847,114) and $10,267,764, respectively, of unrestricted net position. Of these balances, the District has $1,818,062 and $1,965,247designated for payment of self-insurance claims at June 30, 2018 and 2017, respectively. The remaining unrestricted resources are used for transactions relating to the educational and general operations of the College and may be used at the discretion of the governing board to meet current expenses for any purpose.

HEARTLAND COMMUNITY COLLEGE COMMUNITY COLLEGE DISTRICT #540
NOTES TO BASIC FINANCIAL STATEMENTSJUNE 30, 2018 AND 2017
(51)
NOTE 11 COMPONENT UNIT - FOUNDATION
Following is condensed financial information of the Heartland Community College Foundation (Foundation), a discretely presented component unit of the District.
The Foundation is a private nonprofit organization that reports its financial results under applicable Financial Accounting Standards Board (FASB) Statements.
The financial statements separately identify the net position of the Foundation according to the legal restrictions placed on the assets by donors as follows:
Unrestricted Net Position
Includes net position that is not restricted by donor-imposed stipulations which can be used at the discretion of the Foundation’s board to accomplish the purposes for which the Foundation was founded.
Restricted Net Position
Includes net position that is temporarily restricted and permanently restricted by donor-imposed stipulations that require the Foundation to expend the resources either for a particular purpose, or after the expiration of a certain period of time, or not at all. As donor-imposed stipulations are satisfied, the related net position is transferred to unrestricted net position and reported in the statement of revenues, expenses, and changes in net position as net position released from restrictions.
Basis of Accounting
The accompanying financial statements are prepared on the accrual basis.
Revenue Recognition
Funds that are not restricted by their sources are recognized as revenue as they are received. Funds that are restricted by their sources are recorded as additions to the net position of the appropriate fund groups. Restricted funds are then recorded as revenue during the period in which they are expended. All other revenue is recognized in the period to which it relates.
Investments
Investments in marketable securities with readily determinable fair values are reported at fair value in the statement of net position. Unrealized gains and losses are included in the change in net position. Investment income and gains restricted by a donor are reported as increases in unrestricted net position if the restrictions are met, either by passage of time or by use, in the reporting period in which the income and gains are recognized.
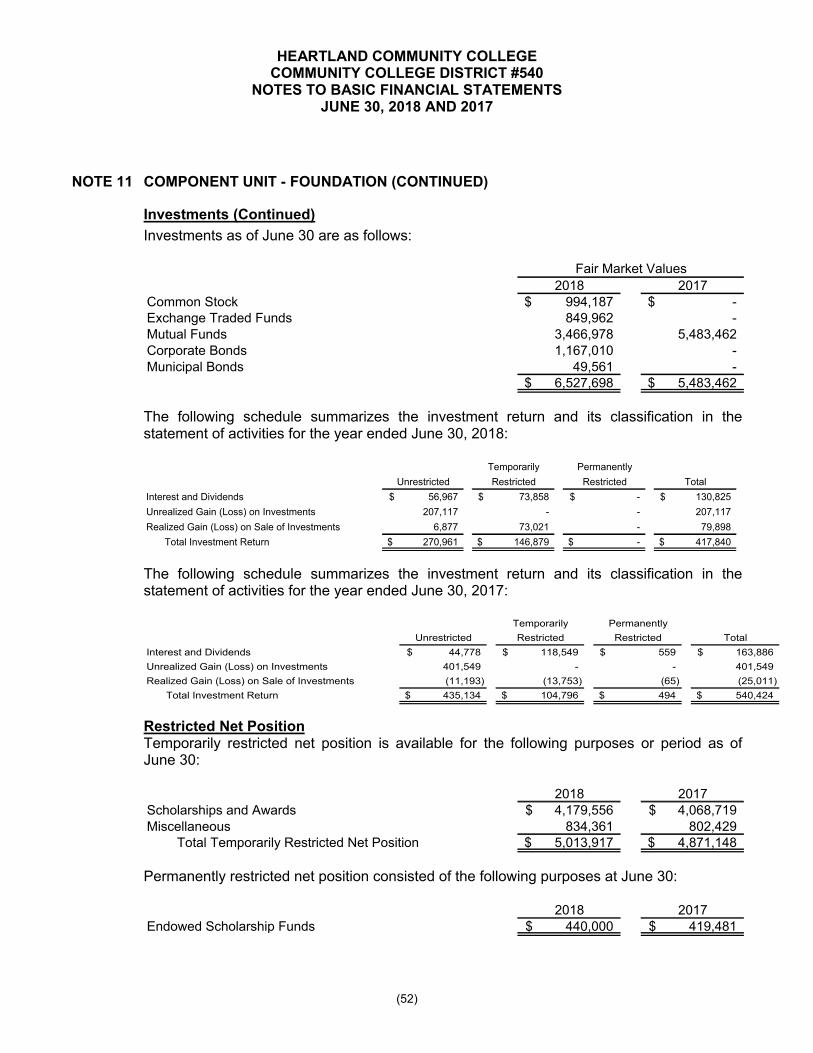
HEARTLAND COMMUNITY COLLEGE COMMUNITY COLLEGE DISTRICT #540
NOTES TO BASIC FINANCIAL STATEMENTSJUNE 30, 2018 AND 2017
(52)
NOTE 11 COMPONENT UNIT - FOUNDATION (CONTINUED)
Investments (Continued)
Investments as of June 30 are as follows:
2018 2017Common Stock 994,187$ -$Exchange Traded Funds 849,962 -Mutual Funds 3,466,978 5,483,462 Corporate Bonds 1,167,010 -Municipal Bonds 49,561 -
6,527,698$ 5,483,462$
Fair Market Values
The following schedule summarizes the investment return and its classification in the statement of activities for the year ended June 30, 2018:
Temporarily Permanently
Unrestricted Restricted Restricted Total
Interest and Dividends 56,967$ 73,858$ -$ 130,825$
Unrealized Gain (Loss) on Investments 207,117 - - 207,117
Realized Gain (Loss) on Sale of Investments 6,877 73,021 - 79,898
Total Investment Return 270,961$ 146,879$ -$ 417,840$
The following schedule summarizes the investment return and its classification in the statement of activities for the year ended June 30, 2017:
Temporarily Permanently
Unrestricted Restricted Restricted Total
Interest and Dividends 44,778$ 118,549$ 559$ 163,886$
Unrealized Gain (Loss) on Investments 401,549 - - 401,549
Realized Gain (Loss) on Sale of Investments (11,193) (13,753) (65) (25,011)
Total Investment Return 435,134$ 104,796$ 494$ 540,424$
Restricted Net PositionTemporarily restricted net position is available for the following purposes or period as of June 30:
2018 2017Scholarships and Awards 4,179,556$ 4,068,719$ Miscellaneous 834,361 802,429
Total Temporarily Restricted Net Position 5,013,917$ 4,871,148$
Permanently restricted net position consisted of the following purposes at June 30:
2018 2017Endowed Scholarship Funds 440,000$ 419,481$

HEARTLAND COMMUNITY COLLEGE COMMUNITY COLLEGE DISTRICT #540
NOTES TO BASIC FINANCIAL STATEMENTSJUNE 30, 2018 AND 2017
(53)
NOTE 12 TAX ABATEMENTS
Tax abatements, as defined by Governmental Account Standards Board (GASB) Statement No. 77, Tax Abatement Disclosures (GASB 77), are agreements between a government and an individual or entity in which the government promises to forgo tax revenues and the individual or entity promises to subsequently take a specific action that contributes to economic development or otherwise benefits the government or its citizens. This Statement requires disclosure of tax abatement information about (1) a reporting government’s own tax abatement agreements and (2) those that are entered into by other governments and that reduce the reporting government’s tax revenues.
Illinois’s Tax Increment Financing Act enables cities to finance certain redevelopment costs with the revenue generated from (I) payments in lieu of real estate taxes, as measured by the net increase in assessed valuation resulting from redevelopment and (II) a portion of the increase in other local tax revenue associated with new economic activity. When a tax increment financing (TIF) plan is adopted, real estate taxes in the redevelopment are frozen at their current level. By applying the real estate tax rate of all taxing districts having taxing power within the redevelopment area to the increased assessed valuation resulting from redevelopment, a tax “increment” is produced. The District’s estimated net reduced tax revenue resulting from the TIFs adopted in these cities within the District is $582,069 and $480,104 for fiscal years 2018 and 2017, respectively.
NOTE 13 CONTINGENCIES
The District is involved in litigation in the normal course of business but while the outcome of litigation is not known, management does not believe there is a significant risk of loss.
NOTE 14 RESTATEMENT OF NET POSITION
The District determined that it is necessary to restate beginning net position in order to implement GASB Statement No. 75, Accounting and Financial Reporting for Postemployment Benefits Other Than Pensions (GASB 75). Beginning net position has thereby been restated as follows:
Total NetPosition
Net position, beginning of year, as previously reported 51,857,670$ Adjustment for beginning deferred outflows of resources related to OPEB 81,331 Adjustment for beginning OPEB liability (16,931,307)
Subtotal 35,007,694$

REQUIRED SUPPLEMENTARY INFORMATION

HEARTLAND COMMUNITY COLLEGE COMMUNITY COLLEGE DISTRICT #540
REQUIRED SUPPLEMENTARY INFORMATION (SURS COVERED PAYROLL)YEAR ENDED JUNE 30, 2018
(55)
Fiscal Year 2014 Fiscal Year 2015 Fiscal Year 2016 Fiscal Year 2017
(a) Proportion Percentage of the Collective Net
Pension Liability 0.00% 0.00% 0.00% 0.00%
(b) Proportion Amount of the Collective Net Pension
Liability -$ -$ -$ -$
(c) Portion of Nonemployer Contributing Entitiesʼ
Total Proportion of Collective Net Pension
Liability Associated with Employer 96,989,820 104,463,724 113,066,447 110,893,773
Total (b) + (c) 96,989,820 104,463,724 113,066,447 110,893,773
Employer Covered Payroll 16,152,552 16,016,358 15,777,476 15,416,548
Proportion of Collective Net Pension Liability
Associated with Employer as a Percentage
of Covered Payroll 600.46% 652.23% 716.63% 719.32%
SURS Plan Net Position as a Percentage of
Total Pension Liability 44.39% 42.37% 39.57% 42.04%
Federal, Trust, Grant, and Other Contributions 49,214 38,040 36,952 36,248
Contribution in Relation to Required Contribution 49,214 38,040 36,952 36,248
Contribution Deficiency (Excess) - - - -
Employer Covered Payroll 16,152,552 16,016,358 15,777,476 15,416,548
Contributions as a Percentage of Covered-
Payroll 0.30% 0.24% 0.23% 0.24%
many years as available. The Schedule is intended to show information for 10 years.
Note: The System implemented GASB No. 68 in fiscal year 2015. The information above is presented for as

HEARTLAND COMMUNITY COLLEGE COMMUNITY COLLEGE DISTRICT #540
SCHEDULE OF DISTRICT’S PROPORTIONATE SHARE OF THE NET OPEB LIABILITYCOMMUNITY COLLEGE HEALTH INSURANCE SECURITY FUND
YEAR ENDED JUNE 30, 2018
(56)
2017
District's proportion of the net OPEB liability 0.937451%
Portion of nonemployer contributing entities' total proportionof collective net OPEB liability associated with employer 16,870,542$
District's proportionate share of the net OPEB liability 17,095,712$
District's covered payroll 16,265,763$
District's proportionate share of the net OPEB liability as a 105.10%percentage of its covered payroll
Plan fiduciary net position as a percentage of the totalOPEB liability -2.87%
Note: Information is not available prior to 2017. Additional years will be added to futurereports as schedules are intended to show 10 years of historical data.

HEARTLAND COMMUNITY COLLEGE COMMUNITY COLLEGE DISTRICT #540
SCHEDULE OF DISTRICT’S CONTRIBUTIONSCOMMUNITY COLLEGE HEALTH INSURANCE SECURITY FUND
YEAR ENDED JUNE 30, 2018
(57)
Fiscal Year Ending June 30, 2017
Contractually Required Contribution 81,331$
Contributions in Relation to the Contractually Required Contribution 81,331$
Contribution Deficiency (Excess) -$
District's Covered Payroll 16,265,763
Contributions as a Percentage of Covered Payroll 0.50%
Note: Information is not available prior to 2017. Additional years will be added to futurereports as schedules are intended to show 10 years of historical data.

HEARTLAND COMMUNITY COLLEGE COMMUNITY COLLEGE DISTRICT #540
REQUIRED SUPPLEMENTARY INFORMATIONNOTES TO REQUIRED SUPPLEMENTARY INFORMATION
COMMUNITY COLLEGE HEALTH INSURANCE SECURITY FUNDYEAR ENDED JUNE 30, 2018
(58)
NOTE 1 CHANGES IN BENEFIT TERMS
In the June 30, 2017 actuarial valuation, there were no changes in benefit terms.
NOTE 2 CHANGES IN ASSUMPTIONS
In the June 30, 2017 actuarial valuation, there were no changes of assumptions.

STATISTICAL SECTION(UNAUDITED)
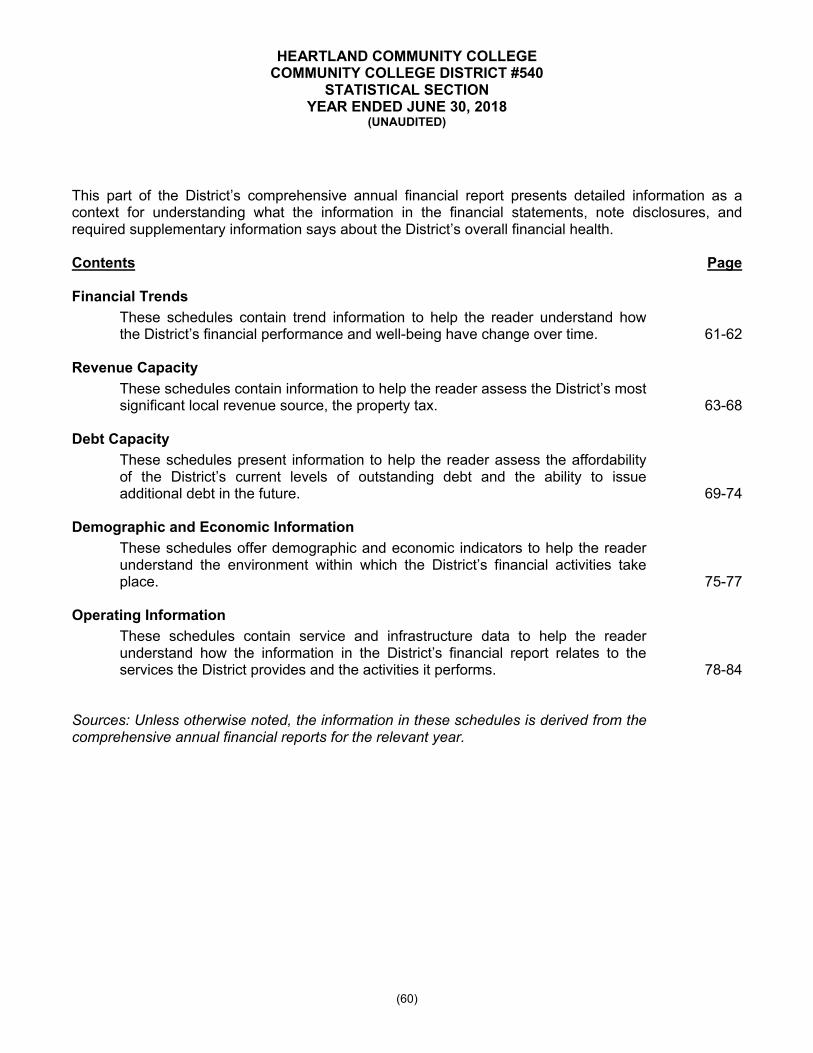
HEARTLAND COMMUNITY COLLEGE COMMUNITY COLLEGE DISTRICT #540
STATISTICAL SECTIONYEAR ENDED JUNE 30, 2018
(UNAUDITED)
(60)
This part of the District’s comprehensive annual financial report presents detailed information as a context for understanding what the information in the financial statements, note disclosures, and required supplementary information says about the District’s overall financial health.
Contents Page
Financial Trends
These schedules contain trend information to help the reader understand how the District’s financial performance and well-being have change over time. 61-62
Revenue Capacity
These schedules contain information to help the reader assess the District’s most significant local revenue source, the property tax. 63-68
Debt Capacity
These schedules present information to help the reader assess the affordability of the District’s current levels of outstanding debt and the ability to issue additional debt in the future. 69-74
Demographic and Economic Information
These schedules offer demographic and economic indicators to help the reader understand the environment within which the District’s financial activities take place. 75-77
Operating Information
These schedules contain service and infrastructure data to help the reader understand how the information in the District’s financial report relates to the services the District provides and the activities it performs. 78-84
Sources: Unless otherwise noted, the information in these schedules is derived from the comprehensive annual financial reports for the relevant year.

HEARTLAND COMMUNITY COLLEGE COMMUNITY COLLEGE DISTRICT #540
FINANCIAL TRENDSNET POSITION BY COMPONENT
LAST TEN FISCAL YEARS(UNAUDITED)
(61)
2018 2017 2016 2015 2014 2013 2012 2011 2010 2009Net Position:
Net Investment in Capital Assets 38,906,902$ 37,316,749$ 38,389,218$ 39,912,827$ 41,635,091$ 46,573,950$ 46,469,388$ 40,937,774$ 37,581,516$ 27,452,287$
Restricted for:Capital Projects 783,488 314,078 374,520 1,677 337,411 651,580 384,545 537,080 72,427 1,874,660 Working Cash 3,900,000 3,900,000 3,900,000 3,900,000 3,900,000 3,900,000 3,900,000 3,900,000 3,900,000 3,900,000 Specific Purposes 85,454 59,079 84,604 157,210 280,128 142,602 24,509 1,542,279 2,597,613 8,395,101
Unrestricted (1,847,114) 10,267,764 5,287,902 4,898,401 4,496,632 1,230,631 3,933,290 4,341,765 4,862,254 4,474,335
Total Net Position 41,828,730$ 51,857,670$ 48,036,244$ 48,870,115$ 50,649,262$ 52,498,763$ 54,711,732$ 51,258,898$ 49,013,810$ 46,096,383$
Sources: Heartland Community College Comprehensive Annual Financial Reports and general ledger reports

HEARTLAND COMMUNITY COLLEGE COMMUNITY COLLEGE DISTRICT #540
FINANCIAL TRENDSCHANGES IN NET POSITIONLAST TEN FISCAL YEARS
(UNAUDITED)
(62)
2018 2017 2016 2015 2014 2013 2012 2011 2010 2009
OPERATING REVENUES
Student Tuition and Fees, Net of Scholarship 9,462,627$ 10,691,518$ 10,200,728$ 9,322,824$ 11,796,677$ 10,529,999$ 11,575,275$ 9,405,410$ 7,849,080$ 6,793,175$
Auxiliary Enterprises Revenue 594,268 399,237 1,131,570 724,995 637,986 856,864 584,994 578,892 619,166 477,929
Other Operating Revenues 1,810,539 3,385,406 2,586,882 2,820,351 2,510,642 3,898,229 2,721,908 1,424,609 1,314,230 1,274,313
SURS Contribution Provided by State 12,075,075 11,174,726 8,770,788 7,345,516 6,703,401 6,493,851 4,861,925 3,477,359 2,895,964 1,814,969
Total Operating Revenues 23,942,509 25,650,887 22,689,968 20,213,686 21,648,706 21,778,943 19,744,102 14,886,270 12,678,440 10,360,386
OPERATING EXPENSES
Instruction 20,948,645 13,155,043 13,525,124 13,806,722 13,665,862 13,616,377 13,865,346 12,556,027 11,188,713 6,091,926
Academic Support 2,886,808 2,021,859 2,409,502 2,406,802 2,323,736 2,672,241 2,531,533 1,755,930 1,827,783 10,437,426
Public Services 2,683,517 3,762,448 3,135,985 3,190,156 3,719,162 5,116,227 3,657,252 2,820,304 2,283,646 2,602,753
Student Services 4,164,319 2,656,640 2,811,517 2,767,179 2,569,575 2,578,637 2,826,803 2,508,947 2,304,352 2,823,286
Institutional Support 11,380,938 7,148,890 8,144,174 9,287,265 8,600,653 9,165,271 8,833,998 7,884,575 7,334,067 2,270,247
Scholarships, Student Grants, and Waivers 5,713,095 5,442,292 5,709,869 5,439,759 6,988,876 4,854,931 6,710,771 6,249,924 3,711,205 1,716,290
Operations and Maintenance 4,149,497 3,331,613 3,419,832 3,622,478 3,525,130 3,454,321 4,124,979 3,725,177 3,162,645 1,943,093
Auxiliary Enterprises 1,812,020 1,146,451 1,206,791 1,191,842 1,145,145 1,237,178 1,118,834 1,762,563 1,641,309 1,986,178
Depreciation 4,491,303 4,533,451 4,587,293 4,638,829 4,710,573 4,722,293 4,430,553 3,625,303 2,457,929 1,814,969
SURS Contribution Paid by State - 11,174,726 8,770,788 7,345,516 6,703,401 6,493,851 4,861,925 3,477,359 2,895,964 1,356,181
Total Operating Expenses 58,230,142 54,373,413 53,720,875 53,696,548 53,952,113 53,911,327 52,961,994 46,366,109 38,807,613 33,042,349
OPERATING LOSS (34,287,633) (28,722,526) (31,030,907) (33,482,862) (32,303,407) (32,132,384) (33,217,892) (31,479,839) (26,129,173) (22,681,963)
Property Taxes 25,986,941 23,215,681 21,376,417 20,986,413 19,985,064 19,798,786 19,502,637 18,587,282 17,807,436 16,744,021
State Grants and Contracts 6,990,691 2,267,189 2,064,036 4,296,628 4,261,307 4,273,349 4,932,733 4,172,813 4,186,981 4,545,743
Federal Grants and Contracts 9,595,893 9,797,926 9,921,617 9,942,770 9,962,457 9,840,696 12,459,068 11,282,682 7,377,813 4,917,827
Local Grants and Contracts - - - - - - - - (388,331) -
Interest Expense (1,839,089) (2,887,900) (3,194,707) (3,532,897) (3,766,198) (3,692,292) (388,353) (329,219) 113,198 (1,697,059)
Investment Income 387,659 164,482 44,419 24,227 44,931 16,910 201,497 39,716 (50,497) 1,705,568
Amortization Expense (13,426) (13,426) (13,426) (13,426) (13,426) (13,426) (36,856) (28,347) - (47,213)
Gain on Bond Refunding - - - - - - - - - 40,100
Loss on Disposal of Asset - - (1,320) - (20,229) - - - - -
Total Nonoperating Revenues, Net 41,108,669 32,543,952 30,197,036 31,703,715 30,453,906 30,224,023 36,670,726 33,724,927 29,046,600 26,208,987
CAPITAL CONTRIBUTIONS - - - - - - - - - -
CHANGE IN NET POSITION 6,821,036 3,821,426 (833,871) (1,779,147) (1,849,501) (1,908,361) 3,452,834 2,245,088 2,917,427 3,527,024
Beginning of Year, as Previously Reported 51,857,670 48,036,244 48,870,115 50,649,262 52,498,763 54,711,732 51,258,898 49,013,810 46,096,383 42,569,359
GASB 68 Implementation - - - - - (304,608) - - - -
GASB 75 Implementation (16,849,976) - - - - - - - - -
Beginning of Year, as Restated 35,007,694 48,036,244 48,870,115 50,649,262 52,498,763 54,407,124 51,258,898 49,013,810 46,096,383 42,569,359
END OF YEAR 41,828,730$ 51,857,670$ 48,036,244$ 48,870,115$ 50,649,262$ 52,498,763$ 54,711,732$ 51,258,898$ 49,013,810$ 46,096,383$
Sources: Heartland Community College Comprehensive Annual Financial Reports and general ledger reports
NONOPERATING REVENUES (EXPENSES)

HEARTLAND COMMUNITY COLLEGE COMMUNITY COLLEGE DISTRICT #540
REVENUE CAPACITYASSESSED VALUE AND ACTUAL VALUE OF TAXABLE PROPERTY
LAST TEN LEVY YEARS(UNAUDITED)
(63)
TaxLevy Assessed EstimatedYear Value Actual Value
2017 4,464,342,208$ 13,399,280,571$ 2016 4,424,104,515 13,272,313,545 2015 4,314,111,666 12,942,334,998 2014 4,240,488,783 12,721,466,349 2013 4,154,298,826 12,462,896,478 2012 4,131,636,881 12,394,910,643 2011 4,161,237,754 12,483,713,262 2010 4,118,116,444 12,354,349,332 2009 4,048,351,290 12,145,053,870 2008 3,934,147,396 11,802,532,188
Source: College Records
Notes: Assessed value is computed to be equal to one third of the estimated actual value.

HEARTLAND COMMUNITY COLLEGE COMMUNITY COLLEGE DISTRICT #540
REVENUE CAPACITYASSESSED VALUE AND ACTUAL VALUE OF TAXABLE PROPERTY (CONTINUED)
LAST TEN LEVY YEARS(UNAUDITED)
(64)
Total Taxable Total
Levy Residential Commercial Industrial Farm Railroad Other Assessed Direct
Year Property Property Property Property Property Property Value Tax Rate
2017 2,725,958,779$ 1,114,714,862$ 37,588,890$ 528,640,522$ 22,148,863$ 35,290,292$ 4,464,342,208$ 0.58576
2016 2,714,153,916 1,105,950,449 38,164,215 506,840,313 22,415,809 36,579,813 4,424,104,515 0.58875
2015 2,656,194,344 1,073,521,959 39,187,220 484,132,645 22,685,466 38,390,032 4,314,111,666 0.54116
2014 2,612,074,796 1,057,963,549 42,589,895 467,616,790 19,975,744 40,268,009 4,240,488,783 0.50583
2013 2,561,430,797 1,050,697,690 43,963,693 436,999,100 19,745,865 41,461,681 4,154,298,826 0.50161
2012 2,573,618,223 1,049,682,431 39,273,863 407,565,002 17,913,945 43,583,417 4,131,636,881 0.49191
2011 2,620,093,718 1,060,939,966 40,604,960 385,515,518 16,757,294 37,326,298 4,161,237,754 0.47673
2010 2,607,206,669 1,067,531,559 41,660,214 366,976,710 15,701,968 19,039,324 4,118,116,444 0.47315
2009 2,582,151,424 1,053,616,203 43,482,610 341,410,855 13,673,024 14,017,174 4,048,351,290 0.45988
2008 2,505,052,129 1,046,680,547 43,546,041 327,029,856 11,700,513 138,310 3,934,147,396 0.45331
Sources: Heartland Community College Records and County Clerkʼs Offices of McLean, Livingston, Tazewell, Ford, Logan,
and DeWitt Counties

HEARTLAND COMMUNITY COLLEGE COMMUNITY COLLEGE DISTRICT #540
REVENUE CAPACITYPROPERTY TAX RATES – DIRECT AND OVERLAPPING
GOVERNMENTS WITHIN MCLEAN COUNTYLAST TEN LEVY YEARS
(UNAUDITED)
(65)
Taxing Bodies 2017 2016 2015 2014 2013 2012 2011 2010 2009 2008
McLean County 0.91052 0.91399 0.91836 0.90133 0.90375 0.91165 0.91571 0.91673 0.90687 0.89659
Town of Normal 1.04145 0.95891 0.92500 0.91581 0.89427 0.76272 0.77488 0.78259 0.78476 0.74289
Normal Library 0.44962 0.45260 0.45049 0.44185 0.44646 0.43971 0.41484 0.39507 0.36452 0.35069
Normal Township 0.23281 0.23079 0.22786 0.22800 0.22296 0.16692 0.16501 0.15807 0.15138 0.14934
Normal Road and Bridge 0.09291 0.09589 0.09571 0.09346 0.09101 0.09070 0.08965 0.08589 0.08115 0.08115
Normal School District #5 5.03610 5.01469 5.05827 5.02707 5.00704 4.88412 4.73499 4.76383 4.69289 4.58932
Bloomington/Normal Water District 0.18466 0.17931 0.17446 0.17216 0.17011 0.16402 0.16390 0.16391 0.16476 0.16036
Bloomington/Normal Airport Authority 0.11937 0.12442 0.13572 0.13655 0.12736 0.12745 0.15486 0.09855 0.08546 0.11008
City of Bloomington 1.07967 1.08363 1.07729 1.06782 1.06121 1.05990 1.05955 1.06013 1.07616 0.99541
City of Bloomington Township 0.12660 0.12166 0.12433 0.12541 0.12243 0.14145 0.14328 0.17309 0.18217 0.18683
Bloomington School District #87 5.15321 5.13998 5.15877 4.95303 4.83486 4.72322 4.65741 4.65682 4.61222 4.58085
Bloomington Library 0.25959 0.25296 0.25098 0.25323 0.25811 0.25620 0.25073 0.25087 0.26108 0.26108
Bloomington Cemetery 0.00000 0.00000 0.00000 0.00000 0.00000 0.00000 0.00000 0.00000 0.00000 0.00000
Total Overlapping Rate 14.68651 14.56883 14.59724 14.31572 14.13957 13.72806 13.52481 13.50555 13.36342 13.10459
Heartland Community College 0.58576 0.58875 0.54116 0.50583 0.50161 0.49191 0.47673 0.47315 0.45988 0.45331
Total Rate 15.27227 15.15758 15.13840 14.82155 14.64118 14.21997 14.00154 13.97870 13.82330 13.55790
Source: McLean County Clerkʼs Office
Notes: Rates are per $100 of assessed valuation.

HEARTLAND COMMUNITY COLLEGE COMMUNITY COLLEGE DISTRICT #540
REVENUE CAPACITYPRINCIPAL TAXPAYERS
CURRENT LEVY YEAR AND NINE YEARS AGO(DOLLARS IN THOUSANDS)
(UNAUDITED)
(66)
Percentage of Percentage of
2017 District 540 2008 District 540
Assessed Assessed Assessed Assessed
Taxpayer Name Valuation Rank Valuation Valuation Rank Valuation
State Farm Insurance Company Insurance 172,288$ 1 3.86% 168,467$ 1 4.28%
Eastland Mall LLC %CBL & Associates Mgt. Inc. Retail Mall 16,951 2 0.38% 18,573 2 0.47%
White Oak Energy LLC Energy 16,706 3 0.37% - 0.00%
Wal-Mart Stores, Inc. Retail 10,898 4 0.24% 13,992 3 0.36%
High Trail Wind Farm Energy 10,441 5 0.23% -
Illinois Agriculture Association AG Insurance 9,179 6 0.21% 9,973 7 0.25%
SH The Flats Normal LLC Apartments 7,911 7 0.18% -
GMAC Real Estate 7,349 8 0.16% -
Rivan Automotive Auto Manufacturing 7,173 9 0.16% -
Mitsubishi Motors Manufacturing Auto Manufacturing - 9,159 8 0.23%
Backyard Apts by Snyder Apartments/Hotel - 12,620 6 0.32%
Wingover Apts Housing 6,830 10 0.15% -
Country Insurance & F.S. Insurance - 13,726 4 0.35%
Intercontinental Hotel - 5,745 9 0.15%
IMI College Hills Development LLC Retail - 6,705 5 0.17%
Meijer Realty Company Retailer - 5,383 10 0.14%
265,726$ 5.95% 264,343$ 6.72%
Source: County Assessorʼs office
Notes:
(1) Every effort has been made to seek out and report the largest taxpayers.
However, many of the taxpayers listed contain multiple parcels and it is
possible that some parcels and their valuations have been overlooked.
(2) The 2017 assessed valuation is the most current available.
Total
Type of
Business/Service
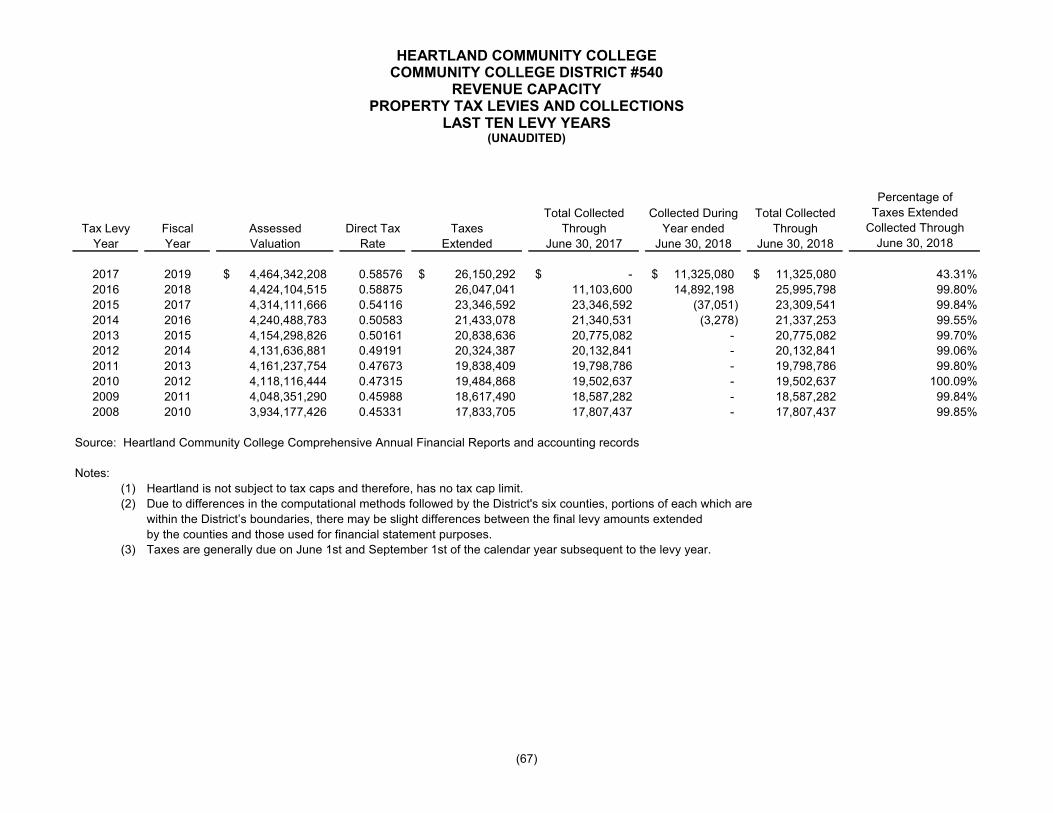
HEARTLAND COMMUNITY COLLEGE COMMUNITY COLLEGE DISTRICT #540
REVENUE CAPACITYPROPERTY TAX LEVIES AND COLLECTIONS
LAST TEN LEVY YEARS(UNAUDITED)
(67)
Total Collected Collected During Total Collected
Tax Levy Fiscal Assessed Direct Tax Taxes Through Year ended Through
Year Year Valuation Rate Extended June 30, 2017 June 30, 2018 June 30, 2018
2017 2019 4,464,342,208$ 0.58576 26,150,292$ -$ 11,325,080$ 11,325,080$ 43.31%
2016 2018 4,424,104,515 0.58875 26,047,041 11,103,600 14,892,198 25,995,798 99.80%
2015 2017 4,314,111,666 0.54116 23,346,592 23,346,592 (37,051) 23,309,541 99.84%
2014 2016 4,240,488,783 0.50583 21,433,078 21,340,531 (3,278) 21,337,253 99.55%
2013 2015 4,154,298,826 0.50161 20,838,636 20,775,082 - 20,775,082 99.70%
2012 2014 4,131,636,881 0.49191 20,324,387 20,132,841 - 20,132,841 99.06%
2011 2013 4,161,237,754 0.47673 19,838,409 19,798,786 - 19,798,786 99.80%
2010 2012 4,118,116,444 0.47315 19,484,868 19,502,637 - 19,502,637 100.09%
2009 2011 4,048,351,290 0.45988 18,617,490 18,587,282 - 18,587,282 99.84%
2008 2010 3,934,177,426 0.45331 17,833,705 17,807,437 - 17,807,437 99.85%
Source: Heartland Community College Comprehensive Annual Financial Reports and accounting records
Notes:
(1) Heartland is not subject to tax caps and therefore, has no tax cap limit.
(2) Due to differences in the computational methods followed by the District's six counties, portions of each which are
within the Districtʼs boundaries, there may be slight differences between the final levy amounts extended
by the counties and those used for financial statement purposes.
(3) Taxes are generally due on June 1st and September 1st of the calendar year subsequent to the levy year.
Taxes Extended
Collected Through
Percentage of
June 30, 2018

HEARTLAND COMMUNITY COLLEGE COMMUNITY COLLEGE DISTRICT #540
REVENUE CAPACITYENROLLMENT, TUITION AND FEE RATES, CREDIT HOURS, AND TUITION AND
FEE REVENUES GENERATEDLAST TEN FISCAL YEARS
(UNAUDITED)
(68)
Tuition and
Tuition and Fee Rates ICCB S3 Fee Revenues
In District Out of District Out of State Total
Tuition and Tuition and Tuition and Semester
Fiscal Headcount Fees per Fees per Fees per Credit Hours All
Year Credit Courses Semester Hour Semester Hour Semester Hour Generated Funds
2018 5,193 148$ 285$ 422$ 91,222 16,779,683$
2017 5,282 144 279 414 95,607 17,043,175
2016 5,298 142 275 408 97,279 16,907,749
2015 5,286 139 269 399 99,170 16,914,112
2014 5,215 139 269 399 100,879 17,259,646
2013 5,456 136 263 390 104,408 17,551,049
2012 5,610 131 254 377 111,560 17,844,502
2011 5,459 115 223 331 108,514 15,231,883
2010 5,266 95 183 271 105,787 12,430,415
2009 5,062 87 167 247 95,110 10,393,191
Sources: Heartland Community College records and Comprehensive Annual Financial Reports, and ICCB S3 Summary Report
The tuition figures here are reflected at gross amounts, while financial statements present tuition net of scholarship allowances.
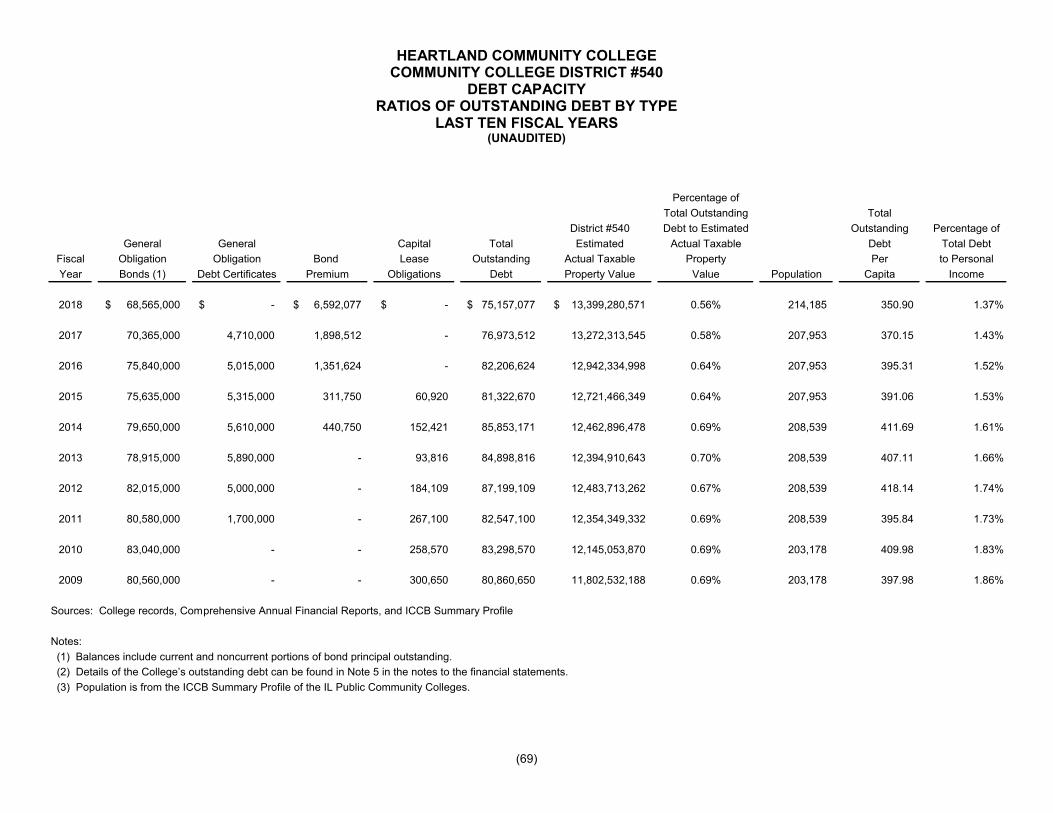
HEARTLAND COMMUNITY COLLEGE COMMUNITY COLLEGE DISTRICT #540
DEBT CAPACITYRATIOS OF OUTSTANDING DEBT BY TYPE
LAST TEN FISCAL YEARS(UNAUDITED)
(69)
Percentage of
Total Outstanding Total
District #540 Debt to Estimated Outstanding Percentage of
General General Capital Total Estimated Actual Taxable Debt Total Debt
Fiscal Obligation Obligation Bond Lease Outstanding Actual Taxable Property Per to Personal
Year Bonds (1) Debt Certificates Premium Obligations Debt Property Value Value Population Capita Income
2018 68,565,000$ -$ 6,592,077$ -$ 75,157,077$ 13,399,280,571$ 0.56% 214,185 350.90 1.37%
2017 70,365,000 4,710,000 1,898,512 - 76,973,512 13,272,313,545 0.58% 207,953 370.15 1.43%
2016 75,840,000 5,015,000 1,351,624 - 82,206,624 12,942,334,998 0.64% 207,953 395.31 1.52%
2015 75,635,000 5,315,000 311,750 60,920 81,322,670 12,721,466,349 0.64% 207,953 391.06 1.53%
2014 79,650,000 5,610,000 440,750 152,421 85,853,171 12,462,896,478 0.69% 208,539 411.69 1.61%
2013 78,915,000 5,890,000 - 93,816 84,898,816 12,394,910,643 0.70% 208,539 407.11 1.66%
2012 82,015,000 5,000,000 - 184,109 87,199,109 12,483,713,262 0.67% 208,539 418.14 1.74%
2011 80,580,000 1,700,000 - 267,100 82,547,100 12,354,349,332 0.69% 208,539 395.84 1.73%
2010 83,040,000 - - 258,570 83,298,570 12,145,053,870 0.69% 203,178 409.98 1.83%
2009 80,560,000 - - 300,650 80,860,650 11,802,532,188 0.69% 203,178 397.98 1.86%
Sources: College records, Comprehensive Annual Financial Reports, and ICCB Summary Profile
Notes:
(1) Balances include current and noncurrent portions of bond principal outstanding.
(2) Details of the Collegeʼs outstanding debt can be found in Note 5 in the notes to the financial statements.
(3) Population is from the ICCB Summary Profile of the IL Public Community Colleges.

HEARTLAND COMMUNITY COLLEGE COMMUNITY COLLEGE DISTRICT #540
DEBT CAPACITYRATIOS OF NET GENERAL BONDED DEBT OUTSTANDING
LAST TEN FISCAL YEARS(UNAUDITED)
(70)
Percentage of
Net General Bonded Net
District #540 Debt to Estimated General
General General Estimated Actual Taxable Bonded Debt
Fiscal Obligation Obligation Bond Net General Actual Taxable Property Per
Year Bonds (1) Debt Certificates Premium Bonded Debt Property Value Value Population Capita
2018 68,565,000$ -$ 6,592,077$ 75,157,077$ 13,399,280,571$ 0.56% 214,185 350.90$
2017 70,365,000 4,710,000 1,898,512 76,973,512 13,272,313,545 0.58% 207,953 370.15
2016 75,840,000 5,015,000 1,351,624 82,206,624 12,942,334,998 0.64% 207,953 395.31
2015 75,635,000 5,315,000 311,750 81,261,750 12,721,466,349 0.64% 207,953 390.77
2014 79,650,000 5,610,000 440,750 85,700,750 12,462,896,478 0.69% 208,539 410.96
2013 78,915,000 5,890,000 - 84,805,000 12,394,910,643 0.68% 208,539 406.66
2012 82,015,000 5,000,000 - 87,015,000 12,483,713,262 0.70% 208,539 417.26
2011 80,580,000 1,700,000 - 82,280,000 12,354,349,332 0.67% 208,539 394.55
2010 83,040,000 - - 83,040,000 12,145,053,870 0.68% 203,178 408.71
2009 80,560,000 - - 80,560,000 11,802,532,188 0.68% 203,178 396.50
Sources: College records, Comprehensive Annual Financial Reports, and ICCB Summary Profile
Notes:
(1) Balances include current and noncurrent portions of bond principal outstanding.
(2) Details of the Collegeʼs outstanding debt can be found in Note 5 in the notes to the financial statements.
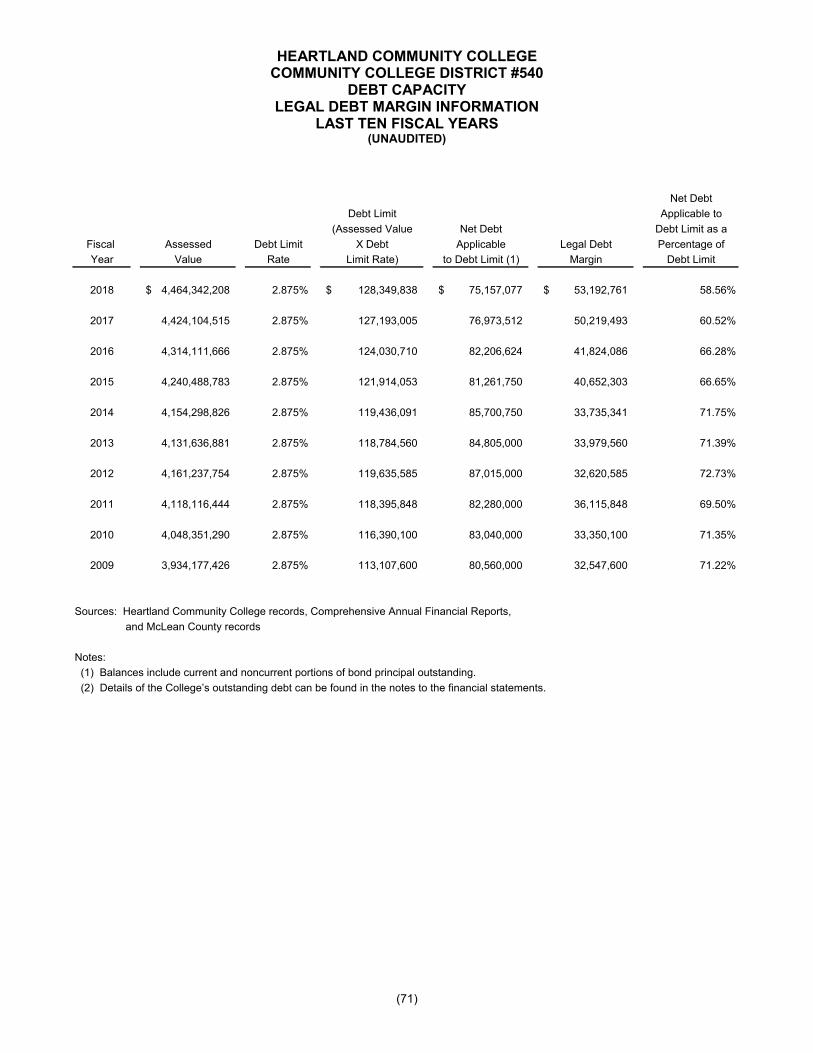
HEARTLAND COMMUNITY COLLEGE COMMUNITY COLLEGE DISTRICT #540
DEBT CAPACITYLEGAL DEBT MARGIN INFORMATION
LAST TEN FISCAL YEARS(UNAUDITED)
(71)
Net Debt
Debt Limit Applicable to
(Assessed Value Net Debt Debt Limit as a
Fiscal Assessed Debt Limit X Debt Applicable Legal Debt Percentage of
Year Value Rate Limit Rate) to Debt Limit (1) Margin Debt Limit
2018 4,464,342,208$ 2.875% 128,349,838$ 75,157,077$ 53,192,761$ 58.56%
2017 4,424,104,515 2.875% 127,193,005 76,973,512 50,219,493 60.52%
2016 4,314,111,666 2.875% 124,030,710 82,206,624 41,824,086 66.28%
2015 4,240,488,783 2.875% 121,914,053 81,261,750 40,652,303 66.65%
2014 4,154,298,826 2.875% 119,436,091 85,700,750 33,735,341 71.75%
2013 4,131,636,881 2.875% 118,784,560 84,805,000 33,979,560 71.39%
2012 4,161,237,754 2.875% 119,635,585 87,015,000 32,620,585 72.73%
2011 4,118,116,444 2.875% 118,395,848 82,280,000 36,115,848 69.50%
2010 4,048,351,290 2.875% 116,390,100 83,040,000 33,350,100 71.35%
2009 3,934,177,426 2.875% 113,107,600 80,560,000 32,547,600 71.22%
Sources: Heartland Community College records, Comprehensive Annual Financial Reports,
and McLean County records
Notes:
(1) Balances include current and noncurrent portions of bond principal outstanding.
(2) Details of the Collegeʼs outstanding debt can be found in the notes to the financial statements.

HEARTLAND COMMUNITY COLLEGE COMMUNITY COLLEGE DISTRICT #540
DEBT CAPACITYLISTING OF DIRECT AND OVERLAPPING BONDED DEBT
LAST TEN FISCAL YEARS(UNAUDITED)
(72)
Fiscal Year 2018 Fiscal Year 2017 Fiscal Year 2016
Percentage of Collegeʼs Percentage of Collegeʼs Percentage of Collegeʼs
Total Debt Applicable Direct and Total Debt Applicable Direct and Total Debt Applicable Direct and
Gross Debt to District Overlapping Gross Debt to District Overlapping Gross Debt to District Overlapping
Outstanding #540 Bonded Debt Outstanding #540 Bonded Debt Outstanding #540 Bonded Debt
Normal School District 121,595,000$ 99.92% 121,497,724$ 136,585,000$ 99.92% 136,475,732$ 138,845,000$ 99.92% 138,733,924$
Ford County - 0.00% - - 0.00% - - 0.00% -
City of Bloomington 56,085,000 100.00% 56,085,000 57,440,000 100.00% 57,440,000 66,705,000 100.00% 66,705,000
McLean County Public Building Commission - 0.00% - - 0.00% - - 0.00% -
B/N Airport Authority 10,790,000 100.00% 10,790,000 11,715,000 100.00% 11,715,000 12,615,000 100.00% 12,615,000
Prairie Central School District #8 1,570,000 69.21% 1,086,597 3,050,000 69.21% 2,110,905 4,362,277 69.21% 3,019,132
Town of Normal 87,145,000 100.00% 87,145,000 87,145,000 100.00% 87,145,000 83,530,000 100.00% 83,530,000
Village of Carlock 15,000 100.00% 15,000 25,000 100.00% 25,000 35,000 100.00% 35,000
Town of Normal Special Service Area #1 - 0.00% - - 0.00% - - 0.00% -
Olympia School District #16 10,950,000 99.97% 10,946,715 13,790,000 99.97% 13,785,863 15,755,000 99.97% 15,750,274
Bloomington School District #87 53,530,000 100.00% 53,530,000 49,305,000 100.00% 49,305,000 42,955,000 100.00% 42,955,000
Tri-Valley School District #3 4,480,000 99.91% 4,475,968 4,915,000 99.91% 4,910,577 5,320,000 99.91% 5,315,212
Heyworth School District #4 5,725,000 100.00% 5,725,000 6,490,000 100.00% 6,490,000 6,780,000 100.00% 6,780,000
Ridgeview School District #19 1,705,000 48.30% 823,515 2,515,000 48.30% 1,214,745 1,280,000 48.30% 618,240
Village of Heyworth - 0.00% - 149,700 100.00% 149,700 149,700 100.00% 149,700
Gridley School District #10 - 0.00% - - 0.00% - - 0.00% -
Chenoa School District #9 - 0.00% - - 0.00% - - 0.00% -
El Paso-Gridley School Unit #11 4,800,000 24.77% 1,188,960 5,700,000 24.77% 1,411,890 4,445,000 24.77% 1,101,027
Lexington School District #7 4,900,000 100.00% 4,900,000 5,345,000 100.00% 5,345,000 5,755,000 100.00% 5,755,000
City of Chenoa - 0.00% - - 0.00% - - 0.00% -
City of El Paso - 0.00% - - 24.77% - 221,000 24.77% 54,742
Randolph Fire Protection District - 0.00% - - 0.00% - - 0.00% -
Village of Stanford - 0.00% - - 0.00% - - 0.00% -
Village of Towanda - 0.00% - - 0.00% - - 0.00% -
Village of Gridley - 0.00% - - 0.00% - - 0.00% -
Village of McLean - 0.00% - - 0.00% - - 0.00% -
City of Lincoln 498,000 100.00% 498,000 498,000 100.00% 498,000 163,000 100.00% 163,000
City of Fairbury 420,000 79.68% 334,656 440,000 79.68% 350,592 460,000 79.68% 366,528
City of Atlanta - 0.00% - - 100.00% - 15,000 100.00% 15,000
Randolph Township Road & Bridge - 0.00% - - 0.00% - - 0.00% -
Town of Randolph Road District - 0.00% - - 0.00% - - 0.00% -
Lincoln Rural Fire Protection District 455,000 97.64% 444,262 570,000 97.64% 556,548 655,000 97.64% 639,542
Lincoln Park District 615,000 100.00% 615,000 615,000 100.00% 615,000 610,000 100.00% 610,000
Chester-East Lincoln SD #61 2,075,000 99.37% 2,061,928 2,075,000 99.37% 2,061,928 2,075,000 99.37% 2,061,928
Eureka CUSD #140 - 0.00% - - 0.00% - - 0.00% -
Illini Central CUSD #189 2,065,000 0.03% 620 2,575,000 0.03% 773 2,630,000 0.03% 789
Lincoln CHSD #404 1,955,000 92.65% 1,811,308 2,270,000 92.65% 2,103,155 2,595,000 92.65% 2,404,268
Lincoln SD #27 - 0.00% - - 0.00% - - 0.00% -
Pontiac CCSD #429 - 0.00% - - 0.00% - - 0.00% -
Pontiac THSD #90 - 0.00% - - 0.00% - - 0.00% -
Rooks Creek CCSD #425 - 0.00% - - 0.00% - - 0.00% -
West Lincoln-Broadwell SD #92 1,471,000 96.54% 1,420,103 1,754,000 96.54% 1,693,312 1,185,000 96.54% 1,143,999
Logan Country - 0.00% - - 0.00% - - 0.00% -
Downs Fire Protection District - 0.00% - - 0.00% - - 0.00% -
Tazewell County - 0.00% - - 0.00% - - 0.00% -
Village of Cooksville - 0.00% - - 0.00% - - 0.00% -
LeRoy CUSD #2 7,185,000 0.46% 33,051 7,605,000 0.46% 34,983 7,535,000 0.46% 34,661
Clinton CUSD #15 13,870,000 0.02% 2,774 14,625,000 0.02% 2,925 15,805,000 0.02% 3,161
LeRoy Community Fire Protection District 1,685,000 1.22% 20,557 1,760,000 1.22% 21,472 1,830,000 1.22% 22,326
Octavia Park District - 0.00% - - 0.00% - - 0.00% -
Subtotal 395,584,000 365,451,738 418,956,700 385,463,100 424,310,977 390,582,453
Heartland Community College #540 75,157,077 100.00% 75,157,077 76,973,512 100.00% 76,973,512 82,206,624 100.00% 82,206,624
Total 470,741,077$ 440,608,815$ 495,930,212$ 462,436,612$ 506,517,601$ 472,789,077$

HEARTLAND COMMUNITY COLLEGE COMMUNITY COLLEGE DISTRICT #540
DEBT CAPACITYLISTING OF DIRECT AND OVERLAPPING BONDED DEBT (CONTINUED)
LAST TEN FISCAL YEARS(UNAUDITED)
(73)
Fiscal Year 2015 Fiscal Year 2014 Fiscal Year 2013 Fiscal Year 2012
Percentage of Collegeʼs Percentage of Collegeʼs Percentage of Collegeʼs Percentage of Collegeʼs
Total Debt Applicable Direct and Total Debt Applicable Direct and Total Debt Applicable Direct and Total Debt Applicable Direct and
Gross Debt to District Overlapping Gross Debt to District Overlapping Gross Debt to District Overlapping Gross Debt to District Overlapping
Outstanding #540 Bonded Debt Outstanding #540 Bonded Debt Outstanding #540 Bonded Debt Outstanding #540 Bonded Debt
171,020,000$ 99.92% 170,883,184$ 175,930,000$ 99.92% 175,792,254$ 179,790,000$ 99.96% 179,718,084$ 183,650,000$ 99.96% 183,576,540$
1,270,000 0.08% 1,016 1,165,000 0.08% 924 475,000 0.10% 475 580,000 0.10% 580
71,555,000 100.00% 71,555,000 79,485,000 100.00% 79,485,000 73,360,000 100.00% 73,360,000 77,145,000 100.00% 77,145,000
8,697,489 94.71% 8,237,392 8,697,489 94.71% 8,237,126 10,625,282 95.01% 10,095,310 12,563,993 95.19% 11,959,665
17,190,000 100.00% 17,190,000 14,695,000 100.00% 14,695,000 15,080,000 100.00% 15,080,000 15,460,000 100.00% 15,460,000
5,154,923 69.21% 3,567,722 2,101,000 69.21% 1,454,166 3,976,248 70.17% 2,790,133 5,630,008 70.17% 3,950,577
84,365,000 100.00% 84,365,000 78,055,000 100.00% 78,055,000 78,060,000 100.00% 78,060,000 78,940,000 100.00% 78,940,000
45,000 100.00% 45,000 55,000 100.00% 55,000 65,000 100.00% 65,000 75,000 100.00% 75,000
- 0.00% - - 0.00% - 4,870,000 100.00% 4,870,000 5,150,000 100.00% 5,150,000
17,050,000 99.97% 17,044,885 12,530,000 99.97% 12,526,094 13,670,000 99.97% 13,665,899 13,205,000 99.97% 13,201,039
45,955,000 100.00% 45,955,000 37,795,000 100.00% 37,795,000 39,795,000 100.00% 39,795,000 41,580,000 100.00% 41,580,000
5,695,000 99.91% 5,689,875 4,505,000 99.91% 4,500,841 4,875,000 99.88% 4,869,150 5,215,000 99.88% 5,208,742
7,660,000 100.00% 7,660,000 6,810,000 100.00% 6,810,000 7,345,000 100.00% 7,345,000 7,810,000 100.00% 7,810,000
1,920,000 48.30% 927,360 2,660,000 48.30% 1,285,742 2,220,000 82.08% 1,822,176 3,395,000 82.08% 2,786,616
149,700 100.00% 149,700 15,000 100.00% 15,000 30,000 100.00% 30,000 45,000 100.00% 45,000
- 0.00% - - 0.00% - - 0.00% - - 0.00% -
- 0.00% - - 0.00% - - 0.00% - - 0.00% -
4,445,000 24.77% 1,101,027 3,795,000 24.77% 939,973 3,795,000 25.10% 952,545 4,850,000 25.10% 1,217,350
6,090,000 100.00% 6,090,000 5,380,000 100.00% 5,380,000 5,655,000 100.00% 5,655,000 4,470,000 100.00% 4,470,000
- 0.00% - - 0.00% - 8,700 100.00% 8,700 17,400 100.00% 17,400
509,000 24.77% 126,079 - 0.00% - - 0.00% - - 0.00% -
- 0.00% - - 0.00% - - 0.00% - - 0.00% -
- 0.00% - - 0.00% - - 0.00% - - 0.00% -
- 0.00% - - 0.00% - - 0.00% - - 0.00% -
- 0.00% - - 0.00% - - 0.00% - - 0.00% -
- 0.00% - - 0.00% - - 0.00% - - 0.00% -
493,000 100.00% 493,000 493,000 100.00% 493,000 175,000 100.00% 175,000 345,000 100.00% 345,000
480,000 79.68% 382,464 500,000 79.68% 398,406 500,000 100.00% 500,000 500,000 100.00% 500,000
30,000 100.00% 30,000 45,000 100.00% 45,000 60,000 100.00% 60,000 70,000 100.00% 70,000
- 0.00% - - 0.00% - - 0.00% - - 0.00% -
- 0.00% - - 0.00% - - 0.00% - - 0.00% -
750,000 97.64% 732,300 840,000 97.64% 820,180 925,000 97.96% 906,130 1,005,000 97.96% 984,498
3,600,000 100.00% 3,600,000 600,000 100.00% 600,000 595,000 100.00% 595,000 575,000 100.00% 575,000
2,075,000 99.37% 2,061,928 2,075,000 99.37% 2,061,903 2,105,000 99.93% 2,103,527 88,000 99.93% 87,938
- 0.00% - - 0.00% - - 0.00% - 365,000 0.04% 146
2,890,000 0.03% 867 3,140,000 0.03% 967 3,375,000 0.04% 1,350 3,595,000 0.04% 1,438
3,200,000 92.65% 2,964,800 3,200,000 92.65% 2,964,943 3,480,000 90.11% 3,135,828 3,745,000 90.11% 3,374,620
670,000 100.00% 670,000 670,000 100.00% 670,000 1,085,000 100.00% 1,085,000 1,490,000 100.00% 1,490,000
- 0.00% - 95,000 99.28% 94,317 350,000 99.01% 346,535 595,000 99.01% 589,110
3,825,000 81.81% 3,129,233 900,000 81.81% 736,320 1,150,000 90.57% 1,041,555 1,390,000 90.57% 1,258,923
- 0.00% - - 0.00% - 25,000 100.00% 25,000 50,000 100.00% 50,000
1,325,000 96.54% 1,279,155 1,325,000 96.54% 1,279,094 1,390,000 94.58% 1,314,662 1,450,000 94.58% 1,371,410
- 0.00% - - 0.00% - 600,000 72.28% 433,680 - 0.00% -
- 0.00% - - 0.00% - - 0.00% - - 0.00% -
- 0.00% - - 0.00% - - 0.00% - - 0.00% -
315,000 100.00% 315,000 - 0.00% - - 0.00% - 340,000 100.00% 340,000
8,095,000 0.46% 37,237 8,325,000 0.46% 38,419 - 0.00% - - 0.00% -
18,860,078 0.02% 3,772 18,730,000 0.02% 3,331 - 0.00% - - 0.00% -
1,900,000 1.22% 23,180 1,900,000 1.22% 23,188 - 0.00% - - 0.00% -
- 0.00% - - 0.00% - 10,000 100.00% 10,000 - 0.00% -
497,279,190 456,311,176 476,511,489 437,256,188 459,520,230 449,915,739 475,384,401 463,631,592
81,261,750 100.00% 81,261,750 85,700,750 100.00% 85,700,750 84,805,000 100.00% 84,805,000 87,015,000 100.00% 87,015,000
578,540,940$ 537,572,926$ 562,212,239$ 522,956,938$ 544,325,230$ 534,720,739$ 562,399,401$ 550,646,592$

HEARTLAND COMMUNITY COLLEGE COMMUNITY COLLEGE DISTRICT #540
DEBT CAPACITYLISTING OF DIRECT AND OVERLAPPING BONDED DEBT (CONTINUED)
LAST TEN FISCAL YEARS(UNAUDITED)
(74)
Fiscal Year 2011 Fiscal Year 2010 Fiscal Year 2009
Percentage of Collegeʼs Percentage of Collegeʼs Percentage of Collegeʼs
Total Debt Applicable Direct and Total Debt Applicable Direct and Total Debt Applicable Direct and
Gross Debt to District Overlapping Gross Debt to District Overlapping Gross Debt to District Overlapping
Outstanding #540 Bonded Debt Outstanding #540 Bonded Debt Outstanding #540 Bonded Debt
193,137,884$ 99.96% 193,060,629$ 175,290,000$ 99.96% 175,219,884$ 175,290,000$ 99.96% 175,219,884$
- 0.00% - 1,060,000 0.06% 636 1,060,000 0.06% 636
73,055,000 100.00% 73,055,000 77,330,000 100.00% 77,330,000 79,430,000 100.00% 79,430,000
- 0.00% - 18,709,513 95.24% 17,818,940 18,709,513 95.24% 15,304,382
- 0.00% - 23,710,000 100.00% 23,710,000 14,770,000 100.00% 14,770,000
4,994,576 70.12% 3,502,197 9,559,215 70.12% 6,702,922 9,559,215 70.12% 6,702,922
- 0.00% - 89,590,000 100.00% 89,590,000 89,590,000 100.00% 89,590,000
85,000 100.00% 85,000 100,000 100.00% 100,000 100,000 100.00% 100,000
80,000,000 100.00% 80,000,000 5,510,000 100.00% 5,510,000 5,510,000 100.00% 5,510,000
13,905,802 99.97% 13,901,630 13,990,000 99.97% 13,985,803 13,990,000 99.97% 13,985,803
43,195,000 100.00% 43,195,000 45,965,000 100.00% 45,965,000 45,965,000 100.00% 45,965,000
5,523,460 99.88% 5,516,832 3,060,000 99.88% 3,056,328 3,060,000 99.88% 3,056,328
8,005,000 100.00% 8,005,000 9,730,000 100.00% 9,730,000 9,730,000 100.00% 9,730,000
3,500,691 82.08% 2,873,367 5,515,000 82.08% 4,526,712 5,515,000 82.08% 4,526,712
60,000 100.00% 60,000 9,075,000 100.00% 9,075,000 90,000 100.00% 90,000
- 0.00% - - 0.00% - - 0.00% -
- 0.00% - - 0.00% - - 0.00% -
1,460,618 25.10% 366,615 7,500,000 25.10% 1,882,500 7,500,000 25.10% 1,882,500
4,735,000 100.00% 4,735,000 2,490,000 100.00% 2,490,000 2,490,000 100.00% 2,490,000
26,100 100.00% 26,100 103,500 100.00% 103,500 43,500 100.00% 43,500
- 0.00% - - 0.00% - - 0.00% -
- 0.00% - 510,000 100.00% 510,000 - 100.00% -
- 0.00% - - 0.00% - - 0.00% -
- 0.00% - - 0.00% - - 0.00% -
- 0.00% - 1,090,000 100.00% 1,090,000 - 100.00% -
- 0.00% - 780,000 100.00% 780,000 - 100.00% -
500,000 100.00% 500,000 610,000 100.00% 610,000 330,000 100.00% 330,000
- 0.00% - 170,000 100.00% 170,000 - 0.00% -
80,000 100.00% 80,000 450,000 100.00% 450,000 100,000 100.00% 100,000
- 0.00% - - 0.00% - - 0.00% -
- 0.00% - 230,000 100.00% 230,000 - 100.00% -
- 0.00% - 1,215,000 97.96% 1,190,214 1,215,000 97.96% 1,190,214
- 0.00% - 545,000 100.00% 545,000 545,000 100.00% 545,000
134,900 99.93% 134,806 110,000 99.93% 109,923 110,000 99.93% 109,923
287 0.04% - 1,655,000 0.04% 662 1,655,000 0.04% 662
1,352 0.04% 1 4,000,000 0.04% 1,600 4,000,000 0.04% 1,600
3,599,885 90.11% 3,243,856 4,455,000 90.11% 4,014,401 4,455,000 90.11% 4,014,401
1,855,000 100.00% 1,855,000 5,370,000 100.00% 5,370,000 2,540,000 100.00% 2,540,000
821,783 99.01% 813,647 1,245,000 99.01% 1,232,675 1,245,000 99.01% 1,232,675
1,467,234 90.57% 1,328,874 2,050,000 90.57% 1,856,685 2,050,000 90.57% 1,856,685
75,000 100.00% 75,000 120,000 100.00% 120,000 120,000 100.00% 120,000
1,423,487 94.58% 1,346,334 1,600,000 94.58% 1,513,280 1,600,000 94.58% 1,513,280
- 0.00% - - 0.00% - - 0.00% -
- 0.00% - 2,795,000 92.66% 2,589,847 - 0.00% -
- 0.00% - 6,655,000 3.89% 258,880 - 0.00% -
340,000 100.00% 340,000 - 0.00% - - 0.00% -
- 0.00% - - 0.00% - - 0.00% -
- 0.00% - - 0.00% - - 0.00% -
- 0.00% - - 0.00% - - 0.00% -
- 0.00% - - 0.00% - - 0.00% -
441,983,059 438,099,887 533,942,228 509,440,392 502,367,228 481,952,107
82,280,000 100.00% 82,280,000 83,040,000 100.00% 83,040,000 80,560,000 100.00% 80,560,000
524,263,059$ 520,379,887$ 616,982,228$ 592,480,392$ 582,927,228$ 562,512,107$

HEARTLAND COMMUNITY COLLEGE COMMUNITY COLLEGE DISTRICT #540
DEMOGRAPHIC AND ECONOMIC INFORMATIONPERSONAL INCOME PER CAPITA
LAST TEN FISCAL YEARS(UNAUDITED)
(75)
McLean Co. McLean Co.
District #540 McLean Co. McLean Co. Per Capita Unemployment
Year District #540 Counties Served Size of District (2) Population (2) Population Personal Income Income Rate
2018 Dewitt, Ford, Livingston, Logan, McLean, Tazewell 1,863 Square Miles 214,185 172,290 5,470,552,080$ 31,752$ 4.70%
2017 Dewitt, Ford, Livingston, Logan, McLean, Tazewell 1,863 Square Miles 207,953 172,418 5,397,545,490 31,305 5.50%
2016 Dewitt, Ford, Livingston, Logan, McLean, Tazewell 1,863 Square Miles 207,953 175,890 5,404,747,920 30,728 5.20%
2015 Dewitt, Ford, Livingston, Logan, McLean, Tazewell 1,863 Square Miles 207,953 174,061 5,301,898,060 30,460 3.90%
2014 Dewitt, Ford, Livingston, Logan, McLean, Tazewell 1,863 Square Miles 208,539 174,647 5,319,747,620 30,460 7.30%
2013 Dewitt, Ford, Livingston, Logan, McLean, Tazewell 1,863 Square Miles 208,539 171,166 5,128,133,360 29,960 7.20%
2012 Dewitt, Ford, Livingston, Logan, McLean, Tazewell 1,863 Square Miles 208,539 170,556 5,018,610,300 29,425 7.20%
2011 Dewitt, Ford, Livingston, Logan, McLean, Tazewell 1,863 Square Miles 208,539 169,572 4,776,334,524 28,167 7.70%
2010 Dewitt, Ford, Livingston, Logan, McLean, Tazewell 1,863 Square Miles 203,178 168,854 4,553,823,526 26,969 6.40%
2009 Dewitt, Ford, Livingston, Logan, McLean, Tazewell 1,863 Square Miles 203,178 167,066 4,350,398,640 26,040 6.70%
Sources: Heartland Community College Comprehensive Annual Financial Reports, ICCB Summary Profile,
U.S. Census Bureau - McLean County Personal Income, McLean County Economic Development Council's Demographic Profiles,
and Illinois Department of Employment Security - Unemployment Rate/McLean County.
Notes:
(1) Approximately 100% of Heartland Community College District #540 Metropolitan areas lie in McLean County.
All other counties in District #540 are considered Non-Metropolitan.
(2) Square miles and population data were obtained from the most recent ICCB Summary Profiles available.
(3) McLean County population growth for FY 2009 - 2010 was based upon the projected increase in population by 2015 by the Department of Commerce and Economic Opportunity,
Northern Illinois Planning Commission
McLean County population for FY 2011 was based upon the US Census Bureau's 2010 report.
McLean County population for FY 2012 was based upon the US Department of Commerce 2012.
McLean County population for FY 2013 and FY2014 was based upon the ESRI and U S Census Bureau population for calendar year 2012 from the B/N EDC Report.
(4) McLean County Per Capita Income was obtained from demographic information from the US Census Bureau. McLean County Personal Income was calculated by
multiplying the Per Capita Income by the McLean County Population.

HEARTLAND COMMUNITY COLLEGE COMMUNITY COLLEGE DISTRICT #540
DEMOGRAPHIC AND ECONOMIC INFORMATIONPRINCIPAL EMPLOYERSLAST TEN FISCAL YEARS
(UNAUDITED)
(76)
District #540% of District #540% of District #540% of District #540% of District #540% of
Employer Employees Rank Population Employees Rank Population Employees Rank Population Employees Rank Population Employees Rank Population
Anderson Financial Network, Inc. (AFNI) 830 8 0.39% 760 8 0.37% 765 8 0.37% 765 9 0.37% - 0.00%
Advocate Bro Menn Medical Center 1,305 5 0.61% 1,271 5 0.61% 1,402 5 0.67% 1,372 5 0.66% 791 9 0.38%
City of Bloomington 679 10 0.32% 691 10 0.33% - 0.00% - 0.00% 765 10 0.37%
COUNTRY Financial 1,972 3 0.92% 1,939 3 0.93% 1,910 3 0.92% 1,905 3 0.92% 1,949 3 0.93%
District 87 Schools (Bloomington) 680 9 0.32% - 0.00% 657 9 0.32% 664 10 0.32% - 0.00%
Illinois State University 3,281 2 1.53% 3,300 2 1.59% 3,320 2 1.60% 3,639 2 1.75% 3,289 2 1.58%
McLean County 835 7 0.39% 713 9 0.34% 829 7 0.40% 806 8 0.39% 812 8 0.39%
Mitsubishi Motor Manufacturing - 0.00% - 0.00% - 0.00% 1,280 6 0.62% 1,251 5 0.60%
OSF St. Joseph Medical Center 860 6 0.40% 894 6 0.43% 1,364 6 0.66% 1,225 7 0.59% 1,012 7 0.49%
State Farm Insurance Companies 14,731 1 6.88% 14,532 1 6.99% 14,282 1 6.87% 14,109 1 6.78% 14,765 1 7.08%
TEK Systems - 0.00% - 0.00% - 0.00% - 0.00% 1,131 6 0.54%
Unit 5 Schools (Normal) 1,761 4 0.82% 1,669 4 0.80% 1,654 4 0.80% 1,549 4 0.74% 1,576 4 0.76%
Growmark - 0.00% - 0.00% - 0.00% - 0.00% - 0.00%
Heritage Enterprises - 0.00% - 0.00% 596 10 0.29% - 0.00% - 0.00%
Heartland Bank & Trust - 0.00% 763 7 0.00% - 0.00% - 0.00% - 0.00%
Total 26,934 12.58% 26,532 12.39% 26,779 12.88% 27,314 13.13% 27,341 13.11%
District #540% of District #540% of District #540% of District #540% of District #540% of
Employer Employees Rank Population Employee Rank Population Employees Rank Population Employees Rank Population Employees Rank Population
Anderson Financial Network, Inc. (AFNI) 700 10 0.34% 778 10 0.37% 900 8 0.43% 750 9 0.37% 883 8 0.43%
Advocate Bro Menn Medical Center 1,347 5 0.65% 1,157 6 0.55% 1,522 5 0.73% 2,006 5 0.99% 1,591 5 0.78%
City of Bloomington - 0.00% - 0.00% 743 10 0.36% - 0.00% - 0.00%
COUNTRY Financial 1,955 3 0.94% 2,049 3 0.98% 2,084 3 1.00% 2,174 3 1.07% 2,178 3 1.07%
District 87 Schools (Bloomington) 700 9 0.34% - 0.00% - 0.00% 699 10 0.34% 680 10 0.33%
Illinois State University 3,251 2 1.56% 3,275 2 1.57% 3,259 2 1.56% 3,542 2 1.74% 3,205 2 1.58%
McLean County 806 8 0.39% 806 9 0.39% 806 9 0.39% 806 8 0.40% 820 9 0.40%
Mitsubishi Motor Manufacturing 1,294 6 0.62% 1,270 5 0.61% 1,278 6 0.61% 1,303 6 0.64% 1,418 6 0.70%
OSF St. Joseph Medical Center 1,028 7 0.49% 832 8 0.40% 1,140 7 0.55% 1,096 7 0.54% 1,122 7 0.55%
State Farm Insurance Companies 14,935 1 7.16% 14,528 1 6.97% 14,450 1 6.93% 15,359 1 7.56% 15,509 1 7.63%
TEK Systems - 0.00% - 0.00% - 0.00% - 0.00% - 0.00%
Unit 5 Schools (Normal) 1,674 4 0.80% 1,754 4 0.84% 1,826 4 0.88% 2,037 4 1.00% 1,692 4 0.83%
Growmark - 0.00% 932 7 0.45% - 0.00% - 0.00% - 0.00%
Heritage Enterprises - 0.00% - 0.00% - 0.00% - 0.00% - 0.00%
Heartland Bank & Trust - 0.00% - 0.00% - 0.00% - 0.00% - 0.00%
Total 27,690 13.28% 27,381 13.13% 28,008 13.43% 29,772 14.65% 29,098 14.32%
Sources: Heartland Community College Comprehensive Annual Financial Reports and
Bloomington-Normal Economic Development Council.
Note: Approximately 100% of Heartland Community College District No. 540
metropolitan areas lie in McLean County. All other counties in District No. 540
are considered Nonmetropolitan for purposes of this table.
200920102013
20142018 2017 2016
2012
2015
2011

HEARTLAND COMMUNITY COLLEGE COMMUNITY COLLEGE DISTRICT #540
DEMOGRAPHIC AND ECONOMIC INFORMATIONPROPERTY VALUES, CONSTRUCTION, AND BANK DEPOSITS
LAST TEN FISCAL YEARS(DOLLARS IN THOUSAND)
(UNAUDITED)
(77)
Fiscal District #540 McLean Co. McLean Co.
Year Property Value Construction Bank Deposits
2018 13,399,281$ 64,587$ 14,573,979$
2017 13,272,314 136,797 13,824,988
2016 12,942,335 72,605 13,377,016
2015 12,721,466 76,518 13,362,905
2014 12,462,896 92,567 13,362,905
2013 12,394,911 48,823 12,453,121
2012 12,483,713 62,499 12,440,671
2011 12,354,349 62,284 12,415,000
2010 12,145,054 67,808 12,796,000
2009 11,802,532 53,865 12,147,000
Sources: Heartland Community College Comprehensive Annual Financial Reports, College
Records, McLean County Economic Development Council, U.S. Census Bureau-McLean
County Construction and BN Economic Development Council, and [email protected]
Notes: Approximately 100% of Heartland Community College District #540 Metropolitan
areas lie in McLean County. All other counties in District #540 are considered
Nonmetropolitan.

HEARTLAND COMMUNITY COLLEGE COMMUNITY COLLEGE DISTRICT #540
OPERATING INFORMATIONNUMBER OF EMPLOYEESLAST TEN FISCAL YEARS
(UNAUDITED)
(78)
2018 2017 2016 2015 2014
Faculty
Full-time 86 85 85 89 90
Part-time 187 179 172 186 187
Total Faculty 273 264 257 275 277
Staff
Administrative 65 63 66 68 65
Classified 49 48 46 51 53
Professional/Technical 91 94 88 89 94
Total Staff 205 205 200 208 212
2013 2012 2011 2010 2009
Faculty
Full-time 93 95 94 89 85
Part-time 172 232 213 200 189
Total Faculty 265 327 307 289 274
Staff
Administrative 69 66 57 50 49
Classified 63 67 62 56 58
Professional/Technical 96 100 98 85 89
Total Staff 228 233 217 191 196
Sources: Heartland Community College Comprehensive Annual Financial Reports
and College Records

HEARTLAND COMMUNITY COLLEGE COMMUNITY COLLEGE DISTRICT #540
OPERATING INFORMATIONSTUDENT CREDIT HOURS BY ENROLLMENT CATEGORIES
LAST TEN FISCAL YEARS(UNAUDITED)
(79)
Funding Category 2018 2017 2016 2015 2014
Baccalaureate 69,554 68,203 69,754 67,943 68,374
Business Occupational 2,365 2,580 2,513 2,282 3,134
Technical Occupational 5,207 5,056 4,029 4,154 4,381
Health Occupational 5,856 5,417 4,552 5,090 5,359
Remedial Developmental 7,553 8,309 8,720 9,649 10,371
687 6,042 7,711 10,052 9,260
Total 91,222 95,607 97,279 99,170 100,879
Funding Category 2013 2012 2011 2010 2009
Baccalaureate 71,611 80,036 77,170 74,823 68,423
Business Occupational 3,413 3,404 3,571 3,950 3,615
Technical Occupational 4,039 4,362 5,144 5,171 4,959
Health Occupational 5,353 5,614 6,053 5,355 4,483
Remedial Developmental 11,093 12,138 11,770 11,985 10,039
8,899 6,006 4,806 4,503 3,591
Total 104,408 111,560 108,514 105,787 95,110
Source: College Records
Adult Basic Education/
Adult Secondary Education
Adult Basic Education/
Adult Secondary Education

HEARTLAND COMMUNITY COLLEGE COMMUNITY COLLEGE DISTRICT #540
OPERATING INFORMATIONSTUDENT ENROLLMENT DEMOGRAPHIC STATISTICS
LAST TEN FISCAL YEARS(UNAUDITED)
(80)
Average
Fiscal Fall Full-Time Average Class Size
Year Enrollment Equivalent Male Female Full-Time Part-Time Class Size and Labs
2018 5,193 3,241 2,401 2,792 2,127 3,066 17.10 191
2017 5,282 3,219 2,318 2,655 2,153 3,129 17.21 179
2016 5,298 3,477 2,375 2,923 2,168 3,130 16.72 179
2015 5,286 3,418 2,413 2,873 2,073 3,213 16.70 179
2014 5,215 3,319 2,414 2,801 2,241 2,974 18.97 179
2013 5,456 3,459 2,529 2,927 2,452 3,004 18.01 179
2012 5,610 3,632 2,616 2,994 2,591 3,019 18.42 179
2011 5,459 3,508 2,545 2,914 2,599 2,860 17.30 179
2010 5,266 3,395 2,451 2,815 2,524 2,742 18.09 179
2009 5,062 3,156 2,298 2,764 2,273 2,710 18.36 179
First Time
Fiscal Continuing College Level Nondegree Transfer High School In District Degrees
Year Students Students Seeking Students Students Residents Median Age Conferred
2018 2,056 748 1,214 488 615 4,082 21 1,103
2017 2,145 734 991 538 616 4,129 21 1,088
2016 2,606 498 1,077 550 552 4,215 21 696
2015 2,485 861 960 332 531 4,692 21 639
2014 3,435 783 523 474 141 4,288 21 700
2013 2,532 1,019 824 663 210 4,341 21 654
2012 2,568 1,062 868 709 NA 4,346 21 723
2011 2,514 1,019 870 668 NA 4,192 21 718
2010 2,805 1,129 1,082 250 NA 4,240 22 673
2009 343 2,919 170 1,551 NA 4,834 21 655
Source: College Records, ICCB E1 and A2 Reports, and IPEDS Fall Enrollment Report.
NA - data not available

HEARTLAND COMMUNITY COLLEGE COMMUNITY COLLEGE DISTRICT #540
OPERATING INFORMATIONCAPITAL ASSET STATISTICS
LAST TEN FISCAL YEARS(UNAUDITED)
(81)
2018 2017 2016 2015 2014
Net Capital Assets:
Land 4,481,528$ 4,481,528$ 4,481,528$ 4,481,528$ 4,368,661$
Furniture and Equipment 4,484,710 4,414,574 4,936,327 5,312,171 5,816,802
Buildings 88,111,906 93,325,449 96,325,700 99,325,951 102,264,528
Infrastructure 9,723,035 8,298,524 9,065,358 9,887,357 10,080,223
Other Assets (Tower Leases) 345,739 152,027 165,453 178,879 192,305
Construction in Progress 79,346 102,958 102,958 102,958 564,957
Total Net Capital Assets 107,226,264$ 110,775,060$ 115,077,324$ 119,288,844$ 123,287,476$
2018 2017 2016 2015 2014
Other Information:
Capital Contributions -$ -$ -$ -$ -$
Depreciation Expense 4,491,303 4,533,451 4,587,293 4,638,829 4,710,573
Amortization Expense (Tower
Leases) 24,328 13,426 13,426 13,426 13,426
2013 2012 2011 2010 2009
Net Capital Assets:
Land 4,368,661$ 4,368,661$ 4,368,661$ 2,225,290$ 2,225,290$
Furniture and Equipment 6,322,035 6,880,156 2,278,654 1,687,340 1,315,471
Buildings 103,141,471 106,121,515 106,546,605 85,362,347 50,745,044
Infrastructure 13,001,026 11,779,288 9,777,203 6,209,081 2,593,895
Other Assets (Tower Leases) 205,732 219,158 232,584 - -
Construction in Progress 139,573 84,849 281,167 18,311,046 28,285,153
Total Net Capital Assets 127,178,498$ 129,453,627$ 123,484,874$ 113,795,104$ 85,164,853$
2013 2012 2011 2010 2009
Other Information:
Capital Contributions -$ -$ -$ -$ -$
Depreciation Expense 4,722,293 4,430,553 3,619,928 2,457,929 1,986,177
Amortization Expense (Tower
Leases) 13,246 - 4,916 - -
Source: College Records

HEARTLAND COMMUNITY COLLEGE COMMUNITY COLLEGE DISTRICT #540
OPERATING INFORMATIONCAPITAL ASSET STATISTICS – SCHOOL BUILDING INFORMATION
LAST TEN FISCAL YEARS(UNAUDITED)
(82)
CAPITAL ASSET TYPE: 2018 2017 2016 2015 2014 2013 2012 2011 2010 2009
Land - Acres 145.05 145.05 145.05 142.45 142.45 142.45 142.45 45.00 45.00 45.00
Furniture and Equipment - No. of Units
Education 92 96 97 110 112 117 116 123 113 110
Operations and Maintenance 23 18 18 19 19 18 14 12 12 14
Operations and Maintenance Restricted 64 65 65 65 67 68 68 85 85 85
Restricted Purposes 291 274 266 244 230 219 193 185 153 131
Liability, Protection & Settlement 19 11 11 8 7 7 7 6 5 5
Total Furniture and Equipment Units 489 464 457 446 435 429 398 411 368 345
Buildings - Square Feet
Instructional Commons Building 97,666 97,666 97,666 97,666 97,666 97,666 97,666 97,666 97,666 97,666
Instructional Commons North Building 44,350 44,350 44,350 44,350 44,350 44,350 44,350 44,350 44,350 -
Astroth Continuing Education Center 40,751 40,751 40,751 40,751 40,751 40,751 40,751 40,751 40,751 -
Child Development Lab 20,100 20,100 20,100 20,100 20,100 20,100 20,100 20,100 20,100 20,100
Fitness and Recreation Center 46,784 46,784 46,784 46,784 46,784 46,784 46,784 46,784 - -
Receiving and Storage Building 7,556 7,556 7,556 7,556 7,556 7,556 7,556 7,556 7,556 7,556
Physical Plant Building 14,436 14,436 14,436 14,436 14,436 14,436 14,436 14,436 14,436 14,436
Community Commons Building 49,191 49,191 49,191 49,191 49,191 49,191 49,191 49,191 49,191 49,191
Student Commons Building 102,182 102,182 102,182 102,182 102,182 102,182 102,182 102,182 102,182 79,932
Parkside Project Building 1,134 1,134 1,134 1,134 - - - - - -
Workforce Development Center 101,425 101,425 101,425 101,425 101,425 101,425 101,425 101,425 101,425 101,425
Total Building Square Footage 525,575 525,575 525,575 525,575 524,441 524,441 524,441 524,441 477,657 370,306
Infrastructure - No. of Improvements
Education 1 1 1 1 - - - - - -
Operations and Maintenance 12 11 11 11 9 9 8 6 4 3
Operations and Maintenance Restricted 19 18 17 17 13 12 11 11 10 9
Auxiliary 1 1 1 1 1 1 1 1 - -
Restricted Purposes 8 8 8 8 7 6 4 2 1 -
Liability, Protection & Settlement 1 1 1 - - - - - - -
Total Infrastructure Improvements 42 40 39 38 30 28 24 20 15 12
Construction in Progress - No. of Buildings/Projects
Buildings/Projects 4 2 2 2 4 2 2 4 1 4
Total Construction in Progress Buildings/Projects 4 2 2 2 4 2 2 4 1 4
Capital Assets Disposed - No. of Units 17 1 15 8 13 - 28 3 2 22

HEARTLAND COMMUNITY COLLEGE COMMUNITY COLLEGE DISTRICT #540
OPERATING INFORMATIONEQUALIZED ASSESSED VALUATIONS AND TAXES EXTENDED AND COLLECTED
LEVY YEARS 2016 THROUGH 2008(UNAUDITED)
(83)
2017 Levy 2016 Levy 2015 Levy 2014 Levy 2013 Levy 2012 Levy 2011 Levy 2010 Levy 2009 Levy
Equalized Assessed Valuation
DeWitt County 11,953,163$ 11,369,364$ 10,948,245$ 10,451,830$ 9,985,298$ 9,661,719$ 9,257,216$ 8,821,882$ 8,855,821$
Ford County 244,000 229,770 219,550 205,650 196,500 187,310 179,260 171,980 165,330
Livingston County 331,881,287 325,462,512 313,498,012 300,293,602 302,920,748 304,334,001 304,891,479 298,191,608 293,226,900
Logan County 359,332,526 357,942,786 351,084,777 339,880,292 322,332,191 314,407,415 310,343,406 311,309,611 303,802,499
McLean County 3,663,250,300 3,632,459,522 3,542,390,690 3,494,423,465 3,424,724,043 3,410,957,250 3,447,174,824 3,411,002,045 3,359,472,510
Tazewell County 97,680,932 96,640,561 95,970,392 95,233,944 94,140,046 92,089,186 89,391,569 88,619,318 82,828,230
Total 4,464,342,208$ 4,424,104,515$ 4,314,111,666$ 4,240,488,783$ 4,154,298,826$ 4,131,636,881$ 4,161,237,754$ 4,118,116,444$ 4,048,351,290$
Tax Rates (Per $100 of Equalized
Assessed Valuation)
Educational Fund 0.17508 0.17500 0.17500 0.17500 0.17500 0.17500 0.17500 0.17500 0.17500
Operations and Maintenance Fund 0.05002 0.05002 0.05000 0.05000 0.05000 0.05000 0.05000 0.05000 0.05000
Audit Fund 0.00337 0.00324 0.00316 0.00307 0.00314 0.00350 0.00327 0.00300 0.00291
Liability, Protection and Settlement Fund 0.06015 0.05809 0.05310 0.05653 0.06092 0.06770 0.05901 0.05513 0.05184
Bond and Interest Fund 0.29165 0.22196 0.19344 0.17695 0.17880 0.16860 0.15971 0.16256 0.15284
Operations and Maintenance
Fund (Restricted) 0.00549 0.00565 0.00116 0.00118 0.00094 0.00061 0.00264 0.00096 0.00099
Equity Tax - 0.07479 0.06530 0.04310 0.03281 0.02650 0.02710 0.02650 0.02630
Total 0.58576 0.58875 0.54116 0.50583 0.50161 0.49191 0.47673 0.47315 0.45988
Taxes Extended
Educational Fund 7,816,247$ 7,744,519$ 7,543,683$ 7,415,423$ 7,270,023$ 7,230,365$ 7,282,166$ 7,206,704$ 7,084,615$
Operations and Maintenance Fund 2,233,213 2,212,878 2,157,053 2,118,692 2,077,149 2,065,818 2,080,619 2,059,058 2,024,176
Audit Fund 150,491 143,320 136,500 130,000 130,000 142,704 135,909 123,554 117,670
Liability, Protection and Settlement Fund 2,685,100 2,569,910 2,291,000 2,395,000 2,530,799 2,797,118 2,456,000 2,270,000 2,099,000
Bond and Interest Fund 13,020,240 9,819,832 8,345,186 7,497,650 7,428,025 6,967,310 6,646,020 6,694,465 6,187,314
Operations and Maintenance
Fund (Restricted) 245,000 249,991 50,000 50,000 38,800 25,355 110,000 39,600 40,000
Equity Tax - 3,306,591 2,823,170 1,826,313 1,363,840 1,095,717 1,127,695 1,091,301 1,064,716
Total 26,150,291$ 26,047,041$ 23,346,592$ 21,433,078$ 20,838,636$ 20,324,387$ 19,838,409$ 19,484,682$ 18,617,491$

HEARTLAND COMMUNITY COLLEGE COMMUNITY COLLEGE DISTRICT #540
OPERATING INFORMATIONSUMMARY OF TAXES RECEIVABLE AND TAX COLLECTIONS
YEAR ENDED JUNE 30, 2018(UNAUDITED)
(84)
2017 Levy 2016 Levy
Assessed Valuations 4,464,342,208$ 4,424,104,515$
Combined Rate Per $100 0.58576 0.58875
Taxes Extended 26,150,291$ 26,047,041$
Total Collected to June 30, 2017 -$ 11,103,600$
Collected During Year Ended June 30, 2018 11,325,080 14,943,441
Total Collected to June 30, 2018 11,325,080$ 26,047,041$
Write-Offs -$ -$
Balance at June 30, 2018 14,825,211$ -$
Percent Collected through June 30, 2018 43.31% 100.00%
Balance by Funds:Education 4,433,090$ Operations and Maintenance 1,266,592 Operations and Maintenance (Restricted) 138,860Bond and Interest 7,379,456 Audit 85,340Liability, Protection, and Settlement 1,521,873
Total 14,825,211$

(85)
CERTIFICATION OF CHARGEBACK REIMBURSEMENTFOR FISCAL YEAR 2019
(Unaudited)

CERTIFICATION OF CHARGEBACK REIMBURSEMENT FOR FISCAL YEAR 2019
LINE NO. FUND/DESCRIPTION
1 EDUCATION FUND 2 OPER & MAINT FUND 3 PBC O&M FUND 4 BOND AND INTEREST 5 PBC RENTAL FUND 6 RESTRICTED PURPOSES 7 AUDIT FUND 8 LIABILITY. PROTECTION, SET 9 AUXILIARY ENTERPRISES (subsidy only)
10 TOTAL NON-CAPITAL EXPENDS
11 DEPRECIATION ON CAPITAL OUTLAY FROM SOURCES OTHER THAN STATE/FEDERAL
12 TOTAL COSTS INCLUDED
Prepared: October 9, 2018
13 TOTAL CERTIFIED SEMESTER CREDIT HOURS FOR FY 2018
14 PER CAPITA COST
15 ALL FY2018 STATE/FEDERAL OPERATING GRANTS FOR NON-CAPITAL EXPENDITURES, EXCEPT ICCB GRANTS
16 FY 2018 STATE/FEDERAL GRANTS PER SEMESTER CREDIT HOUR
17 DISTRICT'S AVERAGE ICCB FY 2018 GRANT RATE
18 DISTRICT'S STUDENT TUITION AND FEE RATE PER SEMESTER CREDIT HOUR FOR FY2019
CHARGEBACK REIMBURSEMENT PER SEMESTER CREDIT HOUR
NON-CAPITAL OPER.EXPENSES
Date:
$25,698,940 3,098,222
1,919,324
25,314,052 119,327
2,467,262 0
$58,617,127
124 634
$58,741,761
97,860
$600
$10,437,900
$107
$29
$153
$311
Date: ~

ILLINOIS COMMUNITY COLLEGE BOARD (ICCB) STATE GRANTS SECTION

(88)
INDEPENDENT AUDITORS’ REPORT ON THE ADULT EDUCATIONAND FAMILY LITERACY GRANTS PROGRAM
Board of TrusteesHeartland Community College Community College District #540Normal, Illinois
Report on the Financial Statements
We have audited the accompanying financial statements of the Adult Education and Family Literacy Grants Program of Heartland Community College District #540 (District), which comprise the statement of net position as of June 30, 2018, and the related statement of revenues, expenditures and changes in net position for the year then ended, and the related note to the financial statements.
Management’s Responsibility for the Financial Statements
Management is responsible for the preparation and fair presentation of these financial statements in accordance with accounting principles generally accepted in the United States of America; this includes the design, implementation, and maintenance of internal control relevant to the preparation and fair presentation of financial statements that are free from material misstatement, whether due to fraud or error.
Auditors’ Responsibility
Our responsibility is to express an opinion on these financial statements based on our audit. We conducted our audit in accordance with auditing standards generally accepted in the United States of America and the grant policy guidelines of the Illinois Community College Board’s Fiscal Management Manual. Those standards and guidelines require that we plan and perform the audit to obtain reasonable assurance about whether the financial statements are free from material misstatement.
An audit involves performing procedures to obtain audit evidence about the amounts and disclosures in the financial statements. The procedures selected depend on the auditors’ judgment, including the assessment of the risks of material misstatement of the financial statements, whether due to fraud or error. In making those risk assessments, the auditor considers internal control relevant to the entity’s preparation and fair presentation of the financial statements in order to design audit procedures that are appropriate in the circumstances, but not for the purpose of expressing an opinion on the effectiveness of the entity’s internal control. Accordingly, we express no such opinion. An audit also includes evaluating the appropriateness of accounting policies used and the reasonableness of significant accounting estimates made by management, as well as evaluating the overall presentation of the financial statements.
We believe that the audit evidence we have obtained is sufficient and appropriate to provide a basis for our audit opinion.
CliftonLarsonAllen LLPCLAconnect.com
~ Cl iftonlarsonAllen

Board of TrusteesHeartland Community College Community College District #540
(89)
Opinion
In our opinion, the financial statements referred to above present fairly, in all material respects, the financial position of the Adult Education and Family Literacy Grant Program of Heartland Community College District #540 as of June 30, 2018, and the changes in financial position for the year then ended in accordance with accounting principles generally accepted in the United States of America.
Other Matters
Emphasis of Matter
The financial statements of the Adult Education and Family Literacy Grants Program are intended to present the net position and changes in net position of only that portion of the business-type activities of Heartland Community College District #540 that is attributable to the Adult Education and Family Literacy Grant Program. These financial statements do not purport to, and do not, present fairly the statement of net position of Heartland Community College District #540 as of June 30, 2018, or the revenues, expenses, and changes in net position, for the year then ended in accordance with accounting principles generally accepted in the United States of America. Our opinion is not modified with respect to this matter.
Other Information
Our audit was conducted for the purpose of forming opinions on the financial statements that collectively comprise the Adult Education and Family Literacy Grants Program’s basic financial statements. The supplementary schedule on page 95 is presented for purposes of additional analysisand is not a required part of the basic financial statements.
aCliftonLarsonAllen LLP
Peoria, IllinoisOctober 12, 2018

(90)
INDEPENDENT AUDITORS’ REPORT ON COMPLIANCE
Board of TrusteesHeartland Community College Community College District #540Normal, Illinois
We have audited, in accordance with auditing standards generally accepted in the United States of America, the financial statements of the Adult Education and Family Literacy Grants Program ofHeartland Community College District #540 (the District), which comprise the statement of net positionas of June 30, 2018, and the related statement of revenues, expenditures, and changes in net positionfor the year then ended, and the related note to the financial statements, and have issued our report thereon dated October 12, 2018.
In connection with our audit, nothing came to our attention that caused us to believe that Heartland Community College District #540 failed to comply with the terms or conditions of the grant policy guidelines of the Illinois Community College Board’s Fiscal Management Manual, insofar as they relate to accounting matters. However, our audit was not directed primarily toward obtaining knowledge of such noncompliance. Accordingly, had we performed additional procedures, other matters may have come to our attention regarding the District’s noncompliance with the above-referenced terms or conditions of the grant policy guidelines of the Illinois Community College Board’s Fiscal Management Manual, insofar as they relate to accounting matters.
This report is intended solely for the information and use of the board of trustees and management of Heartland Community College District #540 and the Illinois Community College Board and is not intended to be and should not be used by anyone other than these specified parties.
aCliftonLarsonAllen LLP
Peoria, IllinoisOctober 12, 2018
CliftonLarsonAllen LLPCLAconnect.com
~ Cl iftonlarsonAllen

HEARTLAND COMMUNITY COLLEGE COMMUNITY COLLEGE DISTRICT #540
ADULT EDUCATION AND FAMILY LITERACY GRANTSTATEMENT OF NET POSITION
JUNE 30, 2018
(91)
StateBasic Performance Total
ASSETSReceivable 73,525$ 48,462$ 121,987$
LIABILITIESDue to District 73,525$ 48,462$ 121,987$
NET POSITION -$ -$ -$
See Note to ICCB Grant Programs Financial Statements.

HEARTLAND COMMUNITY COLLEGE COMMUNITY COLLEGE DISTRICT #540
ADULT EDUCATION AND FAMILY LITERACY GRANTSTATEMENT OF REVENUES, EXPENDITURES, AND CHANGES IN NET POSITION
YEAR ENDED JUNE 30, 2018
(92)
State Basic Performance Total
REVENUE
State Sources 220,575$ 145,385$ 365,960$
EXPENDITURES BY PROGRAM
All Other Instructional Types 125,060 13,651 138,711
Social Work Services 16,092 - 16,092
Guidance Services 9,733 5,728 15,461
Assessment and Testing 12,257 8,946 21,203
Student Transportation Services 895 50 945
Literacy Services 645 - 645
Subtotal Instructional and Student Services 164,682 28,375 193,057
Improvement of Instructional Services 17,139 26,472 43,611
General Administration 19,226 79,961 99,187
Data and Information Services 19,528 10,577 30,105
Subtotal Program Support 55,893 117,010 172,903
Total Expenditures 220,575 145,385 365,960
EXCESS OF REVENUE OVER EXPENDITURES - - -
Net Position - July 1, 2017 - - -
NET POSITION - JUNE 30, 2018 -$ -$ -$
See Note to ICCB Grant Programs Financial Statements.

HEARTLAND COMMUNITY COLLEGE COMMUNITY COLLEGE DISTRICT #540
BACKGROUND INFORMATION ON STATE GRANT ACTIVITYJUNE 30, 2018
(93)
ADULT EDUCATION AND FAMILY LITERACY GRANT PROGRAMS
State Basic Grant. Grant awarded to Adult Education and Family Literacy providers to establish special classes for the instruction of persons of age 21 and over or persons under the age of 21 and not otherwise in attendance in public school, for the purpose of providing adults in the community other instruction as may be necessary to increase their qualifications for employment or other means of self-support and their ability to meet their responsibilities as citizens including courses of instruction regularly accepted for graduation from elementary or high schools, and for Americanization and general education development review classes. Included in this grant are funds for support services, such as student transportation and childcare facilities or provision.
Performance Grant. Grant awarded to Adult Education and Family Literacy providers based on performance outcomes.

HEARTLAND COMMUNITY COLLEGE COMMUNITY COLLEGE DISTRICT #540
NOTE TO ICCB GRANT PROGRAM FINANCIAL STATEMENTSADULT EDUCATION AND FAMILY LITERACY GRANT PROGRAM
JUNE 30, 2018
(94)
NOTE 1 SUMMARY OF SIGNIFICANT ACCOUNTING POLICIES
General
The accompanying statements include only those transactions resulting from the ICCB Adult Education and Family Literacy Grants of the District. These transactions have been accounted for in the Restricted Purposes Fund.
Basis of Accounting
The statements have been prepared on the accrual basis of accounting in accordance with accounting principles generally accepted in the United States of America.

HEARTLAND COMMUNITY COLLEGE COMMUNITY COLLEGE DISTRICT #540
ADULT EDUCATION AND FAMILY LITERACY GRANTS SUPPLEMENTARY SCHEDULEEXPENDITURE AMOUNTS AND PERCENTAGES FOR ICCB GRANT FUNDS ONLY
YEAR ENDED JUNE 30, 2018
(95)
Audited ActualExpenditure Expenditure
State Basic Amount Percentage
Instruction (45% Minimum Required) 125,060$ 57%
General Administration (15% Maximum Allowed) 19,226 9%

SUPPLEMENTARY ICCB SCHEDULES

(97)
INDEPENDENT ACCOUNTANTS’ REPORT ONSCHEDULE OF ENROLLMENT DATA AND OTHER
BASES UPON WHICH CLAIMS ARE FILED
Board of TrusteesHeartland Community College Community College District #540Normal, Illinois
We have examined the accompanying Schedule of Enrollment Data and Other Bases Upon Which Claims are Filed and the Reconciliation of Semester Credit Hours (the Schedules) of Heartland Community College District #540 for the year ended June 30, 2018. Management is responsible for the preparation and presentation of the Schedules in accordance with the guidelines of the Illinois Community College Board’s Fiscal Management Manual. Our responsibility is to express an opinion on the Schedules based on our examination.
Our examination was conducted in accordance with attestation standards established by the American Institute of Certified Public Accountants. Those standards require that we plan and perform the examination to obtain reasonable assurance about whether the Schedules are in accordance with the guidelines of the Illinois Community College Board’s Fiscal Management Manual, in all material respects. An examination involves performing procedures to obtain evidence about the Schedules. The nature, timing, and extent of the procedures selected depend on our judgment, including an assessment of the risks of material misstatement of the Schedules, whether due to fraud or error. We believe that the evidence we obtained is sufficient and appropriate to provide a reasonable basis for our opinion.
In our opinion, the Schedules for the year ended June 30, 2018, are presented in all material respects,in accordance with provisions with the aforementioned guidelines.
aCliftonLarsonAllen LLP
Peoria, IllinoisOctober 12, 2018
CliftonLarsonAllen LLPCLAconnect.com
~ Cl iftonlarsonAllen

w O>
Heartland Community College Community College District #540
Schedule of Enrollment Data and Other Bases Upon Which Claims are Filed Year ended June 30, 2018
Total Reimbursable Semester Credit Hours by Term
(Notes 1 and 2) Summer Fall Categories Unrestricted Restricted Unrestricted Restricted
Baccalaureate 7,486.0 0.0 32,734.5 0.0 Business Occupational 242.5 0.0 929.5 0.0 Technical Occupational 370.5 0.0 2,311.5 0.0 Health Occupational 485.0 0.0 2,027.0 0.0 Remedial Developmental 576.0 0.0 4,212.0 0.0 Adult Basic Education/ 297.0 0.0 166.5 3,346.0
Adult Secondary Education
Total credit hours certified 9 457.0 0.0 42 381.0 3 346.0
Attending Out-of-District
on Chargeback Attending or Contractual In-District A2reement
Semester credit hours (all terms) 70,789.0 0.0
Dual Credit Dual Enrollment
Reimbursable Semester Credit Hours(AII Terms) 7,570.0
District equalized assessed valuation
Signatures
Note 1: Unrestricted credit hours are supported with 50% or more of unrestricted sources of funding and are reimbursable ~ they meet all eligibility requirements.
Note 2: Restricted credit hours are supported with more than 50% of restricted sources of funding. Note 3: Total of unrestricted and restricted should equal the S • 3 record totals.
368
Spring Unrestricted
29,333.5 1,193.0 2,524.5 3,344.0 2,765.0
223.5
39 383.5
Total
70,789.0
$4,424,104,515
(Note3) Total
Restricted Unrestricted Restricted 0.0 69,554.0 0.0 0.0 2,365.0 0.0 0.0 5,206.5 0.0 0.0 5,856.0 0.0 0.0 7,553.0 0.0
3,292.0 687.0 6,638.0
3 292.0 91221.5 6 638.0

HEARTLAND COMMUNITY COLLEGE COMMUNITY COLLEGE DISTRICT #540
SCHEDULE OF ENROLLMENT DATA AND OTHER BASESUPON WHICH CLAIMS ARE FILED (CONTINUED)
YEAR ENDED JUNE 30, 2018
(99)
Total Total
Total Unrestricted Total Restricted
Unrestricted Credit Hours Restricted Credit Hours
Credit Certified to Credit Certified to
Categories Hours the ICCB Difference Hours the ICCB Difference
Baccalaureate 69,554.0 69,554.0 - - - -
Business Occupational 2,365.0 2,365.0 - - - -
Technical Occupational 5,206.5 5,206.5 - - - -
Health Occupational 5,856.0 5,856.0 - - - -
Remedial Developmental 7,553.0 7,553.0 - - - -
Adult Basic Education/Adult
Secondary Education 687.0 687.0 - 6,638.0 6,638.0 -
Total 91,221.5 91,221.5 - 6,638.0 6,638.0 -
Reconciliation of Total Semester Credit Hours
Total
Attending
Total as Certified
Attending to the ICCB
(Unrestricted (Unrestricted
and Restricted) and Restricted) Difference
In-District Residents 70,789.0 70,789.0 -
Out-of-District on Chargeback or
Contractual Agreement - - -
Total 70,789.0 70,789.0 -
Total
Reimbursable
Total Certified
Reimbursable to the ICCB Difference
Dual Credit 7,570.0 7,570.0 -
Dual Enrollment 368.0 368.0 -
Total 7,938.0 7,938.0 -
Total
Total Correctional
Correctional Credit Hours
Credit Certified to
Categories Hours the ICCB Difference
Baccalaureate - - -
Business Occupational - - -
Technical Occupational - - -
Health Occupational - - -
Remedial Developmental - - -
Adult Basic Education/Adult
Secondary Education - - -
Total - - -
Reconciliation of In-District/Chargeback and Cooperative/
Contractual Agreement Credit Hours

HEARTLAND COMMUNITY COLLEGE COMMUNITY COLLEGE DISTRICT #540
DOCUMENTATION OF RESIDENCY VERIFICATION STEPSJUNE 30, 2018
(UNAUDITED)
(100)
NOTE 1 RESIDENCY VERIFICATION PROCESS
Procedures for Verifying and Classifying Residency
Every credit student must submit an application to the College which contains biographic and demographic information. The student signs the application verifying the accuracy of the information and the ability to provide documentation to verify it. The Records Department will use the data contained in the application and on the subsequent enrollment forms to determine residency.
In order to be classified as in-district for tuition, the student must indicate one or more of the following:
Current residence for at least 30 days at an in-district address Permanent residence at an in-district address Graduation from or current enrollment in an in-district high school Current enrollment at another institution of higher education located in-district Although the student resides out-of-district, the student or his parent or guardian
maintains full-time employment in-district Although the student resides out-of-district, the student owns land and pays taxes in-
district
In the case of an address change, a student will submit the change in writing to the Records Department or via the self-service address changes in our online system.
The student’s signature on the forms mentioned above indicates that he/she is able to produce appropriate documentation to verify residency in-district. Proper documentation includes one or more of the following:
Driver’s license State-issued ID Voter registration card Utility bill Bank statement ID card from another institution of higher education in-district Progress summary from another institution of higher education in-district Home/apartment lease Cell phone bill

UNIFORM FINANCIAL STATEMENT SECTION
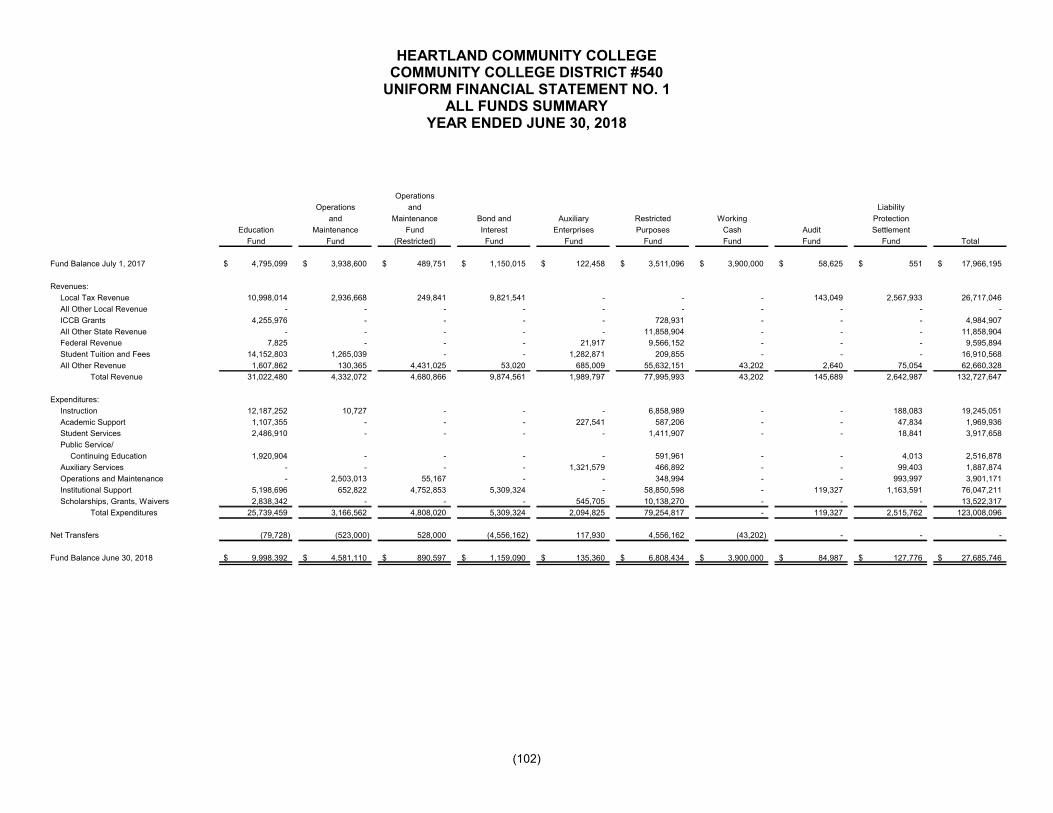
HEARTLAND COMMUNITY COLLEGE COMMUNITY COLLEGE DISTRICT #540
UNIFORM FINANCIAL STATEMENT NO. 1ALL FUNDS SUMMARY
YEAR ENDED JUNE 30, 2018
(102)
Operations
Operations and Liability
and Maintenance Bond and Auxiliary Restricted Working Protection
Education Maintenance Fund Interest Enterprises Purposes Cash Audit Settlement
Fund Fund (Restricted) Fund Fund Fund Fund Fund Fund Total
Fund Balance July 1, 2017 4,795,099$ 3,938,600$ 489,751$ 1,150,015$ 122,458$ 3,511,096$ 3,900,000$ 58,625$ 551$ 17,966,195$
Revenues:
Local Tax Revenue 10,998,014 2,936,668 249,841 9,821,541 - - - 143,049 2,567,933 26,717,046
All Other Local Revenue - - - - - - - - - -
ICCB Grants 4,255,976 - - - - 728,931 - - - 4,984,907
All Other State Revenue - - - - - 11,858,904 - - - 11,858,904
Federal Revenue 7,825 - - - 21,917 9,566,152 - - - 9,595,894
Student Tuition and Fees 14,152,803 1,265,039 - - 1,282,871 209,855 - - - 16,910,568
All Other Revenue 1,607,862 130,365 4,431,025 53,020 685,009 55,632,151 43,202 2,640 75,054 62,660,328
Total Revenue 31,022,480 4,332,072 4,680,866 9,874,561 1,989,797 77,995,993 43,202 145,689 2,642,987 132,727,647
Expenditures:
Instruction 12,187,252 10,727 - - - 6,858,989 - - 188,083 19,245,051
Academic Support 1,107,355 - - - 227,541 587,206 - - 47,834 1,969,936
Student Services 2,486,910 - - - - 1,411,907 - - 18,841 3,917,658
Public Service/
Continuing Education 1,920,904 - - - - 591,961 - - 4,013 2,516,878
Auxiliary Services - - - - 1,321,579 466,892 - - 99,403 1,887,874
Operations and Maintenance - 2,503,013 55,167 - - 348,994 - - 993,997 3,901,171
Institutional Support 5,198,696 652,822 4,752,853 5,309,324 - 58,850,598 - 119,327 1,163,591 76,047,211
Scholarships, Grants, Waivers 2,838,342 - - - 545,705 10,138,270 - - - 13,522,317
Total Expenditures 25,739,459 3,166,562 4,808,020 5,309,324 2,094,825 79,254,817 - 119,327 2,515,762 123,008,096
Net Transfers (79,728) (523,000) 528,000 (4,556,162) 117,930 4,556,162 (43,202) - - -
Fund Balance June 30, 2018 9,998,392$ 4,581,110$ 890,597$ 1,159,090$ 135,360$ 6,808,434$ 3,900,000$ 84,987$ 127,776$ 27,685,746$

HEARTLAND COMMUNITY COLLEGE COMMUNITY COLLEGE DISTRICT #540
UNIFORM FINANCIAL STATEMENT NO. 2SUMMARY OF CAPITAL ASSETS AND DEBT
YEAR ENDED JUNE 30, 2018
(103)
Balance Balance
July 1, 2017 Additions Deletions June 30, 2018
CAPITAL ASSETS
Land and Site Improvements 4,481,528$ -$ -$ 4,481,528$
Buildings, Additions, and Improvements 121,163,674 50,000 - 121,213,674
Furniture and Equipment 13,839,975 663,879 188,893 14,314,961
Infrastructure 17,823,650 58,527 - 17,882,177
Construction in Progress 102,958 51,388 75,000 79,346
Accumulated Depreciation 46,788,752 4,491,303 188,893 51,091,162
Net Capital Assets 110,623,033$ (3,667,509)$ 75,000$ 106,880,524$
FIXED DEBT
General Obligation Bonds 70,965,000$ 49,005,000$ 51,405,000$ 68,565,000$
General Obligation Debt Certificates 4,110,000 5,515,000 9,625,000 -
OPEB Liability 16,931,307 164,405 - 17,095,712
Total Fixed Liabilities 92,006,307$ 54,684,405$ 61,030,000$ 85,660,712$

HEARTLAND COMMUNITY COLLEGE COMMUNITY COLLEGE DISTRICT #540
UNIFORM FINANCIAL STATEMENT NO. 3OPERATING FUND REVENUES AND EXPENDITURES
YEAR ENDED JUNE 30, 2018
(104)
Operations
and Total
Education Maintenance Operating
Fund Fund Funds
OPERATING REVENUES BY SOURCE
Local Government Revenue:
Local Taxes 10,998,014$ 2,206,560$ 13,204,574$
Corporate Personal Property Replacement Tax - 730,108 730,108
Total Local Government 10,998,014 2,936,668 13,934,682
State Government:
ICCB Base Operating Grant 3,990,996 - 3,990,996
ICCB Career and Technical Education 250,050 - 250,050
Other ICCB Grants Not Listed Above 14,930 - 14,930
Total State Government 4,255,976 - 4,255,976
Federal Government:
Department of Education 7,825 - 7,825
Student Tuition and Fees:
Tuition 13,339,770 1,265,039 14,604,809
Fees 813,033 - 813,033
Total Student Tuition and Fees 14,152,803 1,265,039 15,417,842
Other Sources:
Sales and Service Fees 1,279,549 - 1,279,549
Facilities Revenue 93,594 - 93,594
Investment Revenue 99,846 62,692 162,538
Other 134,873 67,673 202,546
Total Other Revenue 1,607,862 130,365 1,738,227
Total Revenue 31,022,480$ 4,332,072$ 35,354,552$

HEARTLAND COMMUNITY COLLEGE COMMUNITY COLLEGE DISTRICT #540
UNIFORM FINANCIAL STATEMENT NO. 3OPERATING FUND REVENUES AND EXPENDITURES (CONTINUED)
YEAR ENDED JUNE 30, 2018
(105)
Operations
and Total
Education Maintenance Operating
Fund Fund Funds
OPERATING EXPENDITURES BY PROGRAM
Instruction 12,187,252$ 10,727$ 12,197,979$
Academic Support 1,107,355 - 1,107,355
Student Services 2,486,910 - 2,486,910
Public Service/Continuing Education 1,920,904 - 1,920,904
Operations and Maintenance - 2,503,013 2,503,013
Institutional Support 5,198,696 652,822 5,851,518
Scholarships, Grants, Waivers 2,838,342 - 2,838,342
Total Operating Expenditure by Program 25,739,459 3,166,562 28,906,021
Adjusting Nonoperating Items:
Tuition Chargeback - - -
Transfers 117,930 528,000 645,930
Total Adjusted Expenditures 25,857,389$ 3,694,562$ 29,551,951$
OPERATING EXPENDITURES BY OBJECT
Salaries 17,401,067$ 498,114$ 17,899,181$
Employee Benefits 2,703,028 91,270 2,794,298
Contractual Services 901,264 594,874 1,496,138
General Materials and Supplies 951,075 512,385 1,463,460
Library Materials** 47,270 - 47,270
Conference and Meeting Expenses 276,716 14,779 291,495
Fixed Charges 193,646 320,965 514,611
Utilities 614 815,933 816,547
Capital Outlay 40,519 307,340 347,859
Other 3,271,530 10,902 3,282,432
Student Grants and Scholarships** 2,838,341 - 2,838,341
Total Operating Expenditures by Object 25,739,459 3,166,562 28,906,021
Adjusting Nonoperating Items:
Tuition Chargeback - - -
Transfers 117,930 528,000 645,930
Total Adjusted Expenditures 25,857,389$ 3,694,562$ 29,551,951$
**These items are for informational purposes only and not included in the total expenditure by object code.

HEARTLAND COMMUNITY COLLEGE COMMUNITY COLLEGE DISTRICT #540
UNIFORM FINANCIAL STATEMENT NO. 4RESTRICTED PURPOSES FUND REVENUES AND EXPENDITURES
YEAR ENDED JUNE 30, 2018
(106)
REVENUE BY SOURCE
State Government:
ICCB - Adult Education 665,201$
ICCB - Other 63,730
Illinois Student Assistance Commission 1,261,686
SURS - On-Behalf 10,584,229
Other 12,989
Total State Government 12,587,835
Federal Government:
Department of Education 9,528,883
Department of Labor 37,269
Total Federal Government 9,566,152
Other Sources:
Tuition and Fees 209,855
Other 55,632,151
Total Other Sources 55,842,006
Total Restricted Purposes Fund Revenues 77,995,993$
EXPENDITURES BY PROGRAM
Instruction 6,858,989$
Academic Support 587,206
Student Services 1,411,907
Public Service/Continuing Education 591,961
Auxiliary Services 466,892
Operations and Maintenance 348,994
Institutional Support 58,850,598
Scholarships, Grants, and Waivers 10,138,270
Total Restricted Purposes Fund Expenditures 79,254,817$
EXPENDITURES BY OBJECT
Salaries 909,884$
Employee Benefits (Including SURS On-Behalf) 10,720,654
Contractual Services 1,550,497
Student Financial Aid 10,138,270
General Materials and Supplies 1,311,692
Library Materials* 1,913
Travel and Conference/Meeting Expenses 85,821
Fixed Charges 53,989,368
Utilities 14,431
Capital Outlay 526,985
Other 7,215
Scholarships, Grants, Waivers* 10,138,270
Total Restricted Purposes Fund Expenditures 79,254,817$
*This item is for informational purposes only and not included in the total expenditure by object code.

HEARTLAND COMMUNITY COLLEGE COMMUNITY COLLEGE DISTRICT #540
UNIFORM FINANCIAL STATEMENT NO. 5CURRENT FUNDS* EXPENDITURES BY ACTIVITY
YEAR ENDED JUNE 30, 2018
(107)
INSTRUCTION
Instructional Programs 19,245,051$
ACADEMIC SUPPORT
Library Center 449,611
Instructional Materials Center 19,056
Educational Media Services 65,479
Academic Computing Support 19,520
Academic Administration and Planning 187,898
Other (Including SURS On-Behalf) 1,228,372
Total Academic Support 1,969,936
STUDENT SERVICES SUPPORT
Admissions and Records 454,649
Counseling and Career Services 162,321
Financial Aid Administration 328,324
Other (Including SURS On-Behalf) 2,972,364
Total Student Services Support 3,917,658
PUBLIC SERVICE/CONTINUING EDUCATION
Community Education 1,948,532
Customized Training (Instructional) 311,634
Community Services 40,166
Other (Including SURS On-Behalf) 216,546
Total Public Service/Continuing Education 2,516,878
AUXILIARY SERVICES 1,887,874

HEARTLAND COMMUNITY COLLEGE COMMUNITY COLLEGE DISTRICT #540
UNIFORM FINANCIAL STATEMENT NO. 5CURRENT FUNDS* EXPENDITURES BY ACTIVITY (CONTINUED)
YEAR ENDED JUNE 30, 2018
(108)
OPERATIONS AND MAINTENANCE OF PLANT
Maintenance 446,518$
Custodial Services 467,617
Grounds 40,830
Campus Security 416,644
Transportation 37,527
Utilities 667,921
Administration 446,144
Other (Including SURS On-Behalf) 1,322,803
Total Operations and Maintenance of Plant 3,846,004
INSTITUTIONAL SUPPORT
Executive Management 952,349
Fiscal Operations 621,253
Community Relations 1,158,974
Administrative Support Services 598,423
Board of Trustees 18,359
General Institutional 17,022,221
Institutional Research 261,641
Administrative Data Processing 3,288,377
Other (Including SURS On-Behalf) 42,063,437
Total Institutional Support 65,985,034
SCHOLARSHIPS, STUDENTS GRANTS, AND WAIVERS 13,522,317
Total Current Funds Expenditures 112,890,752$
*Current Funds include the Education; Operations and Maintenance; Auxiliary
Enterprises; Restricted Purposes; Audit; Liability, Protection, and Settlement funds

FEDERAL FINANCIAL AND COMPLIANCE SECTION

(110)
INDEPENDENT AUDITORS’ REPORT ON INTERNAL CONTROL OVERFINANCIAL REPORTING AND ON COMPLIANCE AND OTHER MATTERS
BASED ON AN AUDIT OF FINANCIAL STATEMENTS PERFORMEDIN ACCORDANCE WITH GOVERNMENT AUDITING STANDARDS
Board of TrusteesHeartland Community College Community College District #540Normal, Illinois
We have audited, in accordance with the auditing standards generally accepted in the United States of America and the standards applicable to financial audits contained in Government Auditing Standards, issued by the Comptroller General of the United States, the financial statements of the business-type activities and the discretely presented component unit of Heartland Community College District #540 (District), as of and for the year ended June 30, 2018, and the related notes to the financial statements, which collectively comprise Heartland Community College District #540’s basic financial statements, and have issued our report thereon dated October 12, 2018. Our report includes a reference to another auditor who audited the component unit of the District, as described in our report on Heartland Community College District #540’s financial statements. The financial statements of the District’s discretely presented component unit were not audited in accordance with Government Auditing Standards.
Internal Control Over Financial Reporting
In planning and performing our audit of the financial statements, we considered Heartland Community College District #540’s internal control over financial reporting (internal control) to determine the audit procedures that are appropriate in the circumstances for the purpose of expressing our opinion on the financial statements, but not for the purpose of expressing an opinion on the effectiveness of Heartland Community College District #540’s internal control. Accordingly, we do not express an opinion on the effectiveness of Heartland Community College District #540’s internal control.
A deficiency in internal control exists when the design or operation of a control does not allow management or employees, in the normal course of performing their assigned functions, to prevent, or detect and correct, misstatements on a timely basis. A material weakness is a deficiency, or a combination of deficiencies, in internal control, such that there is a reasonable possibility that a material misstatement of the entity’s financial statements will not be prevented, or detected and corrected on a timely basis. A significant deficiency is a deficiency, or a combination of deficiencies, in internal control that is less severe than a material weakness, yet important enough to merit attention by those charged with governance.
CliftonLarsonAllen LLPCLAconnect.com
~ Cl iftonlarsonAllen

Board of TrusteesHeartland Community College Community College District #540
(111)
Our consideration of internal control was for the limited purpose described in the first paragraph of this section and was not designed to identify all deficiencies in internal control that might be material weaknesses or significant deficiencies. Given these limitations, during our audit we did not identify any deficiencies in internal control that we consider to be material weaknesses. However, material weaknesses may exist that have not been identified.
Compliance and Other Matters
As part of obtaining reasonable assurance about whether Heartland Community College District #540’s financial statements are free from material misstatement, we performed tests of its compliance with certain provisions of laws, regulations, contracts, and grant agreements, noncompliance with which could have a direct and material effect on the determination of financial statement amounts. However, providing an opinion on compliance with those provisions was not an objective of our audit and, accordingly, we do not express such an opinion. The results of our tests disclosed no instances of noncompliance or other matters that are required to be reported under Government Auditing Standards.
Purpose of this Report
The purpose of this report is solely to describe the scope of our testing of internal control and compliance and the result of that testing, and not to provide an opinion on the effectiveness of the entity’s internal control or on compliance. This report is an integral part of an audit performed in accordance with Government Auditing Standards in considering the entity’s internal control and compliance. Accordingly, this communication is not suitable for any other purpose.
aCliftonLarsonAllen LLP
Peoria, IllinoisOctober 12, 2018

(112)
INDEPENDENT AUDITORS’ REPORT ON COMPLIANCE FOR EACH MAJORFEDERAL PROGRAM AND REPORT ON INTERNAL CONTROL OVER COMPLIANCE
REQUIRED BY THE UNIFORM GUIDANCE
Board of TrusteesHeartland Community College Community College District #540Normal, Illinois
Report on Compliance for Each Major Federal Program
We have audited Heartland Community College’s (District) compliance with the types of compliance requirements described in the OMB Compliance Supplement that could have a direct and material effect on the District’s major federal program for the year ended June 30, 2018. The District’s major federal program is identified in the summary of auditors’ results section of the accompanying schedule of findings and questioned costs.
Management’s Responsibility
Management is responsible for compliance with federal statutes, regulations, and the terms and conditions of its federal awards applicable to its federal awards.
Auditors’ Responsibility
Our responsibility is to express an opinion on compliance for the District’s major federal program based on our audit of the types of compliance requirements referred to above. We conducted our audit of compliance in accordance with auditing standards generally accepted in the United States of America; the standards applicable to financial audits contained in Government Auditing Standards, issued by the Comptroller General of the United States; and the audit requirements of Title 2 U.S. Code of Federal Regulations Part 200, Uniform Administrative Requirements, Cost Principles, and Audit Requirements for Federal Awards (Uniform Guidance). These standards and the Uniform Guidance require that we plan and perform the audit to obtain reasonable assurance about whether noncompliance with the types of compliance requirements referred to above that could have a direct and material effect on a major federal program occurred. An audit includes examining, on a test basis, evidence about the District’s compliance with those requirements and performing such other procedures as we considered necessary in the circumstances.
We believe that our audit provides a reasonable basis for our opinion on compliance for each major federal program. However, our audit does not provide a legal determination of the District’s compliance.
Opinion on Major Federal Program
In our opinion, the District complied, in all material respects, with the types of compliance requirements referred to above that could have a direct and material effect on its major federal program for the year ended June 30, 2018.
CliftonLarsonAllen LLPCLAconnect.com
~ Cl iftonlarsonAllen

Board of TrusteesHeartland Community College Community College District #540
(113)
Report on Internal Control Over Compliance
Management of the District is responsible for establishing and maintaining effective internal control over compliance with the types of compliance requirements referred to above. In planning and performing our audit of compliance, we considered the District’s internal control over compliance with the types of requirements that could have a direct and material effect on each major federal program to determine the auditing procedures that are appropriate in the circumstances for the purpose of expressing an opinion on compliance for each major federal program and to test and report on internal control over compliance in accordance with the Uniform Guidance, but not for the purpose of expressing an opinion on the effectiveness of internal control over compliance. Accordingly, we do not express an opinion on the effectiveness of the District’s internal control over compliance.
A deficiency in internal control over compliance exists when the design or operation of a control over compliance does not allow management or employees, in the normal course of performing their assigned functions, to prevent, or detect and correct, noncompliance with a type of compliance requirement of a federal program on a timely basis. A material weakness in internal control over compliance is a deficiency, or combination of deficiencies, in internal control over compliance, such that there is a reasonable possibility that material noncompliance with a type of compliance requirement of a federal program will not be prevented, or detected and corrected, on a timely basis. A significant deficiency in internal control over compliance is a deficiency, or a combination of deficiencies, in internal control over compliance with a type of compliance requirement of a federal program that is less severe than a material weakness in internal control over compliance, yet important enough to merit attention by those charged with governance.
Our consideration of internal control over compliance was for the limited purpose described in the first paragraph of this section and was not designed to identify all deficiencies in internal control over compliance that might be material weaknesses or significant deficiencies and therefore, material weaknesses or significant deficiencies may exist that were not identified. We did not identify any deficiencies in internal control over compliance that we consider to be material weaknesses. However, material weaknesses may exist that have not been identified.
The purpose of this report on internal control over compliance is solely to describe the scope of our testing of internal control over compliance and the results of that testing based on the requirements of the Uniform Guidance. Accordingly, this report is not suitable for any other purpose.
aCliftonLarsonAllen LLP
Peoria, IllinoisOctober 12, 2018

HEARTLAND COMMUNITY COLLEGE COMMUNITY COLLEGE DISTRICT #540
SCHEDULE OF EXPENDITURES OF FEDERAL AWARDSYEAR ENDED JUNE 30, 2018
(114)
Federal Pass-Through
Federal Grantor/Pass Through CFDA Entity Identifying Federal
Grantor/Program Title or Cluster Title Number Number Expenditures
U.S. Department of Education
Student Financial Aid Cluster (Direct):
Federal Pell Grant Program (M) 84.063 4,999,897$
Federal Pell Grant Program-Administrative Cost Allowance (M) 84.063 7,825
Federal Work Study Program (M) 84.033 89,168
Federal Supplemental Educational Opportunity Grant (M) 84.007 96,975
Federal Parent Plus Loans (M) 84.268 92,287
Federal Subsidized Student Loans (M) 84.268 1,727,881
Federal Unsubsidized Student Loans (M) 84.268 1,893,918
Subtotal Student Financial Aid Cluster (Direct) 8,907,951
TRIO - Student Support Services (Direct) 84.042 238,720
Pass-through Illinois Community College Board:
Adult Education - Basic Grants to States:
Federal Adult Education-Basic 84.002 54001 153,035
EL/Civics Program 84.002 54001 58,135
Subtotal Adult Education Federal Grants from ICCB 211,170
Vocational Educational Basic Grants to States:
V.E. Perkins Title II Postsecondary/Adult 84.048 CTE54012 161,201
ICCB - Special Population Grant 84.048 CTE54012 7,665
ICCB - Dual Credit Enhancement 84.048 CTE54012 10,000
Subtotal Vocational Educational Basic Grants to States 178,866
Total U.S. Department of Education 9,536,707
U.S. Department of Labor
WIOA Youth Activities Cluster, Pass-Through Career Link:
Drop Out Recovery Grant 17.259 OOOSY2015-1 37,269
U.S. Department of Agriculture
Pass-through State Board of Education:
Child and Adult Food Care Program 10.558 1376002057 21,917
Total Expenditures of Federal Awards 9,595,893$
(M) Denotes major program

HEARTLAND COMMUNITY COLLEGE COMMUNITY COLLEGE DISTRICT #540
NOTES TO SCHEDULE OF EXPENDITURES OF FEDERAL AWARDSJUNE 30, 2018
(115)
NOTE 1 BASIS OF PRESENTATION
The accompanying schedule of expenditures of federal awards includes the federal grant activity of Heartland Community College Community College District #540 (District) under programs of the federal government for the year ended June 30, 2018. The information in this schedule is presented in accordance with the requirements of Title 2 U.S. Code of Federal Regulations Part 200, Uniform Administrative Requirements, Cost Principles, and Audit Requirements for Federal Awards. Therefore, some amounts presented in this schedule may differ from amounts presented in, or used in the preparation of, the basic financial statements.
NOTE 2 SUMMARY OF SIGNIFICANT ACCOUNTING POLICIES
Expenditures reported on the Schedule are reported on the accrual basis of accounting. Such expenditures are recognized following the cost principals contained in the Uniform Guidance, wherein certain types of expenditures are not allowable or are limited as to reimbursements.
As of and during the year ended June 30, 2018, the District did not receive any noncash federal assistance, federal insurance, or loan guarantees.
NOTE 3 DIRECT LOAN PROGRAMS
During the fiscal year ended June 30, 2018, students and their parents were awarded$3,714,086 of federally guaranteed loans under the Federal Direct Student Loan Program (programs include Stafford Loans, Parents’ Loans for Undergraduate Students, and Unsubsidized Stafford Loans).
The District is responsible only for the performance of certain administrative duties with respect to the federally guaranteed student loan programs and, accordingly, balances relating to these loan programs are not included in the District’s basic financial statements.
NOTE 4 INSURANCE
The District maintains property and liability insurance which management believes is sufficient to meet its needs. None of the insurance coverages are directly funded by federal awards.
NOTE 5 INDIRECT COST RATE
The District has elected to use its 10 percent de minimis indirect cost rate allowed under Uniform Guidance.
HEARTLAND COMMUNITY COLLEGE COMMUNITY COLLEGE DISTRICT #540
NOTES TO SCHEDULE OF EXPENDITURES OF FEDERAL AWARDSJUNE 30, 2018
(116)
NOTE 6 SUBRECIPIENTS
No funding was passed through to subrecipients during the year ended June 30, 2018.
NOTE 7 BACKGROUND INFORMATION ON GRANT ACTIVITY
Restricted Adult Education Grants/Federal CFDA #84.002
Federal Basic. Grant awarded to Adult Education and Family Literacy providers to assist adults in becoming literate and obtain the knowledge and skills necessary for employment and self-sufficiency; to assist adults who are parents in obtaining the educational skills necessary to become full partners in the educational development of their children; and to assist adults in completing a secondary school education.
Restricted Vocational Education Grants to State (Perkins)/Federal CFDA #84.048
Grant awarded to community colleges as a result of the Carl D. Perkins Vocational and Technical Education Act of 1998 (Perkins III). This grant is intended to help accomplish the new vision of vocational and technical education for the 21st century. The central goals of this new vision are improving student achievement and preparing students for postsecondary education, further learning, and careers. The grant allows community colleges to focus on those programs and student populations they feel will allow for the greatest improvement in overall performance while assuring success for all students in career and technical education programs.

HEARTLAND COMMUNITY COLLEGE COMMUNITY COLLEGE DISTRICT #540
SCHEDULE OF FINDINGS AND QUESTIONED COSTSYEAR ENDED JUNE 30, 2018
(117)
Section I – Summary of Auditors’ Results
Financial Statements
Type of auditors' report issued: Unmodified
Internal control over financial reporting:
Material weakness(es) identified? yes X no
Significant deficiency(ies) identified that are notconsidered to be material weakness(es)? yes X none reported
Noncompliance material to financialstatements noted? yes X no
Federal Awards
Internal control over major programs:
Material weakness(es) identified? yes X no
Significant deficiency(ies) identified that are notconsidered to be material weakness(es)? yes X none reported
Type of auditors’ report issued on compliance forfor major programs? Unmodified
Any audit findings disclosed that are required to bereported in accordance with 2 CFR 200.516(a) yes X no
Identification of major programs:
CFDA Number(s) Name of Federal Program or Cluster
84.063, 84.007, 84.033 and 84.268 Student Financial Aid Center
Dollar threshold used to distinguishbetween type A and type B programs: $750,000
Auditee qualified as low-risk auditee? X yes no

HEARTLAND COMMUNITY COLLEGE COMMUNITY COLLEGE DISTRICT #540
SCHEDULE OF FINDINGS AND QUESTIONED COSTS (CONTINUED)YEAR ENDED JUNE 30, 2018
(118)
Section II - Findings Related to the Financial Statement Audit as Required to be Reported in Accordance with Generally Accepted Government Auditing Standards
None.

HEARTLAND COMMUNITY COLLEGE COMMUNITY COLLEGE DISTRICT #540
SCHEDULE OF FINDINGS AND QUESTIONED COSTS (CONTINUED)YEAR ENDED JUNE 30, 2018
(119)
Section III - Federal Award Findings and Questioned Costs
None.


