Hearts and Mines: A District-Level Analysis of the Maoist Conflict in India Kristian Hoelscher 1 University of Oslo, Norway & Peace Research Institute Oslo, Norway [email protected]Jason Miklian Peace Research Institute Oslo, Norway & NORAGRIC, Ås [email protected]Krishna Chaitanya Vadlamannati Alfred-Weber-Institute for Economics University of Heidelberg, Germany [email protected]1 Authors’ Note: Author contributions were equal, and order is alphabetical. We thank the Royal Norwegian Embassy, New Delhi, for providing financial assistance for this project. The data and do files for replicating the results can be obtained upon request at [email protected]
Transcript
Hearts and Mines:
A District-Level Analysis of the Maoist Conflict in India
Disaggregation is essential to understanding conflict (and resolution) drivers, and rationales
for disaggregation are manifold. Many of India’s 28 states are extremely large, and within the
country’s 592 districts tremendous geo-spatial inequalities are hidden by state-level analyses.
This is especially the case when dealing with states like Andhra Pradesh that host both
wealthy mega-cities and indigenous populations suffering endemic poverty.
This study draws upon previous qualitative fieldwork and employs data from three disparate
district-level conflict data sources to test theories explaining recent Maoist insurgency. Our
previous research provided strong anecdotal evidence that the Maoist movement and mining
industry activities are correlated (Miklian 2010; Miklian 2011; Miklian and Carney 2010).
Here we empirically test the association between the mining sector and the Maoist conflict in
a multivariate model. We analyze cross-sectional data from six Indian states - Chhattisgarh,
Andhra Pradesh, Orissa, Jharkhand, Bihar and West Bengal. These states cover the areas
where the Maoist insurgency was strongest during the 2004-2010 period, and represent 151
of India’s 592 districts. Although this reduces the total number of observations these selected
districts account for 90% of total violent Maoist incidents.
Using Probit and Negative Binomial estimation techniques we find that conflict is
consistently related to increased forest cover, prevalence of conflict in neighboring districts,
and larger scheduled caste and tribe share of the population; while mining activity under some
conditions increases likelihood of conflict.. Our conclusions suggest conflicts are more likely
to occur in districts with aggrieved populations, and where conditions favor insurgency,
Similarly, conflict is likely to spill across borders yet mining activity only plays a role in
fueling conflict in poorer districts where existing grievances may be exploited.
2. Theoretical Background
The Maoist conflict in India dates to 1967, when an uprising over land reform in the West
Bengal village of Naxalbari spurred large-scale revolts against unjust agrarian practices.
Followers called themselves Naxals, professing that political violence was necessary to loosen
the ruling elite’s hold over rural India. The movement ebbed and flowed throughout the
1970s, reaching a nadir in the early 1980s after the government captured or killed most senior
leaders. After a period of fracture and disorganization, heretofore disparate Naxal groups
began to consolidate in the early 2000s, and together formed the Communist Party of India-
Maoist in 2004. Since then, violence has dramatically increased, spreading to most states of
east-central India.
Concurrently, the ruling United Progressive Alliance (UPA hereafter) government led by the
Indian National Congress party initiated several social welfare projects in an effort to stem the
Maoists’ allure in rural areas. The most significant such scheme is the National Rural
Employment Guarantee Act (NREGA, now re-titled to MGNREGA), the government’s
flagship employment development program. NREGA was launched in 2006 to enhance
livelihood security in rural areas beset by chronic joblessness and falling agricultural
productivity by guaranteeing at least one hundred days per year of wage-employment to every
rural household. Citizens register with local authorities to work, and wages are paid on a fixed
daily rate (about $2.40 USD/day).
While the short-term objective of NREGA was to bolster employment, after 2008 it was also
trumpeted by UPA politicians as a key policy tool to campaign for the ‘hearts and minds’ of
local populations. Like the Planning Commission before it, UPA consensus holds that citizens
join the Maoists in retribution for being chronically impoverished, and development programs
that to address land, employment and inequality-based grievances highlighted by the Maoists
will lead to resolution (Kolås & Miklian 2009; Verma 2011). As the opening quote illustrates,
winning the ideological fight for India’s rural soul is deemed essential to durable military
victory, but policymakers and local implementation actors differ as to the scope, mandate, and
direction that development should take. Employment generation and integration into the
framework of the Indian state are the twin pillars upon which NREGA operates, and Indian
policymakers often believe that more economic development (industrial growth) by definition
means less conflict.
However, this grievance-based narrative of under-development as the sole cause for rebel
recruitment overlooks a number of factors that while initially peripheral are now integral to
the conflict. India’s economic boom has heralded an explosion of both foreign direct
investment (FDI) and demand for the estimated $1 trillion USD of natural resources that lie
within.2 India’s mining sector has thus been eager for the past decade to rapidly ramp up
operations across the country for both profit and national security reasons. Further, significant
mining occurs in many of the same areas where the Maoist conflict has been the most severe.
‘Push’, ‘pull’ and ‘fog of war’ factors culled from our previous qualitative research suggest
that this correlation is not accidental.
The mining industry has a poor reputation in India. Most of India’s largest mining deposits lie
within the states that are considered most corrupt, exacerbating inequality and providing vivid
examples of graft. Politicians, police, and mining companies all profit from projects that
either skirt or ignore laws meant to protect fragile environmental or human landscapes
(Miklian 2012). Many mines are also operationalized with so little consideration for local
concerns that citizens feel moved to either commit violence or support the Maoists for their
anti-mining rhetoric (Navlahkan 2010, Shah 2011). In these cases, our anecdotal evidence
suggested that projects ‘pushed’ local populations to support the anti-capitalist and anti-
foreign stances of the Maoists in an attempt to save their lands.
Pull factors were also related to increased violence, as districts with heavy mining activity are
tremendously attractive targets for the Maoists. These districts have common characteristics
that an extensive number of studies show that insurgent groups find desirable: difficult to
access terrain (Fearon and Latin 2003), a high degree of corruption in natural resource
projects (Ross 2004; le Billon 2004), large amounts of explosives on mine sites that can be
stolen and then used against official forces (Miklian and Carney 2010), and a ready
population of citizens who feel aggrieved (Regan and Norton 2005). While literature on
‘resource curses’ is also extensive, it remains underpinned by what le Billon (2001:565) calls
‘the socially constructed nature of resources.”
Further, unending violence may actually be the desired equilibrium for all parties to the
conflict. Peripheral scholars including Duffield (1998) and Keen (2008) take a more nuanced
2 Estimated coal reserves account for approx 55% of this total, with iron at 30% and the remainder split between dozens of other minerals.
approach to the political economy of conflict, arguing that violence is not a breakdown of
society but merely a different framework that empowers alternate actors financially and
politically. Conflicts define material and psychological gain at both the individual and societal
levels, but are fundamentally about the transfer, displacement, and acquisition of power – be it
in a violent or non-violent way (Foucault 2003, Reid 2003). The Maoists have a long history
of exploiting these dynamics to further their political and financial aims through both
historical (Suykens 2010) and contemporary (People’s March 2010) propaganda, which is
couched in standard Communist ‘permanent revolution’ rhetoric.
Complicating matters, commercial concerns have become the third rail of conflict. Dozens of
major and minor mining companies saw mining deregulation as a spectacular opportunity, and
the less scrupulous united with local politicians to use the ‘fog of war’ as an excuse for a land
grab. In the most egregious example, a civilian militia was created in southern Chhattisgarh to
fight the Maoists and make the region safer for mining companies to operate (PUCL 2006).
After the militia launched, over 100,000 villagers living atop resource beds were forced to
flee; many were still not allowed to return years later (HRW 2008). Government mining firms
paid both the militia and the Maoists for ‘protection’ services in order to ensure continued
operations (Miklian 2009), or to clear land through proxy wars (Bahree 2010). The Maoists
also contributed, extorting 3% of the profits from each of the mine owners under their areas of
control to fund their war and play up their Robin Hood credentials to locals (Verma 2011).
Many locals willingly joined the Maoists after hearing the government claim that their
districts were ‘too violent’ to have schools, police, or health services for years while
continuing to actively support mining activities.
There is an important distinction between insurgent recruitment and insurgent latent support
(Kalyvas 2006; Weinstein 2006). In many impoverished conflict villages, local support is
predicated on the belief that the Maoists can provide services that the government either fails
to offer (f.ex. schools), or implements so poorly that the Maoist alternative is preferred
(judicial system) (Navlakha 2010). This support is also supported by broader literature on
‘hearts and minds’, as citizens may choose to support a violent challenger to the state if
service provision is poor (Berman et al. 2011). Support is also a function of fear, as a village
that might otherwise resist a challenger often offers material or logistical aid to violent groups
that represent a new status quo (Green 1994). However, recruitment remains an individual’s
decision, which may not reflect the grievance-based issues that drive latent support.
Individuals join rebel groups for revenge, justice, personal profit, escaping family situations,
machismo, and other reasons that may have nothing to do with the conflict (Humphreys and
Weinstein 2008). While latent conditions for rebel recruitment may exist throughout India,
they are insufficient to explain alone the Maoists’ growth.
Hypotheses
With this background, we develop several hypotheses related to conflict, socio-economic
factors, mining, and development at the district level. First, we can theoretically link poverty
with a decreased opportunity cost of rebellion (Collier and Hoeffler 2004). It can also,
however, represent a lack of state capacity within a district (Fearon & Laitin 2003). Similarly
the lack of service provision to rural communities has been cited as a grievance motivating
rebellion (Borooah 2008). Maoist insurgents tend to exploit decreased state reach and local
grievances in poorer areas, and support may be more easily gained and maintained where
income or state reach is reduced3. We hypothesize that:
H1a: Lower levels of income will be related to greater Maoist violence
H1b: Lower levels of basic service provision will be related to greater Maoist violence
We also assess the role of literacy in supporting violence. Primarily, it is an indicator of
human capital and a reflection of livelihood options and expected future income (Collier and
Hoeffler 1998; 2004). It follows that where literacy rates are low, income and the opportunity
cost to rebel is lowered. Specific to the Indian context is that the literacy rate also represents
citizens’ access to justice and representation in the legal system (Rukare 2006). We therefore
hypothesize that:
H2: Lower literacy rates will be related to greater Maoist violence
Third, we assess the link between the presence of natural resources and conflict. The civil
conflict literature gives numerous powerful examples of how rents from natural resources
create and sustain civil conflicts; and that their effects on national economies prolong fighting
and hinder post-conflict recoveries (e.g. Ross, 2004a, 2004b; de Soysa & Binningsbø, 2009).
In several Maoist-affected states, natural resources have been expropriated to finance rebel
3 It must be acknowledged that without undertaking a comprehensive survey of Maoist fighters it is difficult to
determine which districts fighters themselves come from. For this reason, any study attempting to make claims
on the relationship between district-level (or even state-level) indicators and rebel recruitment without this data
will be fundamentally flawed, and the reason for our omission of regarding this important issue. We
acknowledge this potential bias, but must assume that district level violence is motivated by variables of the
same district.
activity (Miklian 2010). We therefore test the effect of presence and value of district level
mining, and hypothesize that:
H3a: The presence of mining activity in a district will be related to greater Maoist violence
H3b: Greater value of mining activity in a district will be related to greater Maoist violence
Fourth, the Maoists claim to represent the interests and grievances of disadvantaged
populations including scheduled castes and tribes (Shah & Pettigrew, 2009). If the Maoist
insurgency is predicated upon an ideological platform that appeals to and requires the support
of SC/ST communities, we would expect that greater SC/ST populations increase localized
support for Maoists, which may then represent increased violence. Therefore:
H4: Greater SC/ST populations will be related to greater Maoist violence
Fifth, we assess the effect of policies designed to address rural poverty, most notably
NREGA. We expect that where a greater percentage of households are employed under the
scheme, there is a greater opportunity cost to engage in violence, leading to decreased support
for the Maoists and lower rates of insurgent violence.
H5: Greater coverage of the NREGA program will be related to lower levels of Maoist
violence
It is also highly likely that economic or grievance based factors do not work in isolation, and
theoretical and empirical work on civil conflict has moved on considerably from a simple
greed or grievance based narrative (or its newer ‘opportunities vs. incentives’ incarnation-
see Miguel & Blattman 2010). We suggest and measure three possible ways in which motive
and opportunity may coincide to increase Maoist conflict.
First, we test the possibility that mining activities are only likely to increase violence where it
disenfranchises local tribal populations. Where mining occurs without creating grievances for
Maoists to exploit, violence may not be ideologically or strategically possible. Second, we
assess whether mining is conflict-inducing only where it occurs in the context of poor state
capacity or poverty. Third, we assess whether poor provision of basic services by the state is
only conflict generating where excluded populations are present. We hypothesize that:
H6: Mining activity in the context of greater SCST populations will be related to greater
levels of Maoist violence.
H7: Mining activity in the context of lower levels of income will be related to greater Maoist
violence.
H8: Poorer basic public services provision in the context of greater SCST populations will be
related to greater levels of Maoist violence.
3. Estimation Strategy and Data
Our estimation strategy examines the correlates of Maoist violence in India. We employ a
cross-sectional design at the district level, and analyze factors related to the incidence and
severity of armed insurgency in six Maoist-affected states. Our sample consists of 151
districts from six Maoist affected Indian states for the period from 2004–2010 (see appendix
2). We use the count totals of Maoist-related violent events for this period to assess the
aggregate levels of violence experienced in the districts of these states since the onset of the
most recent phase of the insurgency. This study does not claim to measure temporal aspects
that may influence the conflict but rather how structural factors have determined current
levels of violence in the districts most affected by the movement.
We choose a cross sectional design for this time period for reasons both theoretical and
pragmatic. We select only six states as they together represent both the historical and current
loci of Maoist insurgency and the vast majority of Maoist-related incidents - over 90% of
conflict events and fatalities since the CPI-Maoist was formed in 2004. Second, these states
also house all of the core districts of Maoist recruitment, activity, and support in the current
stage of the rebellion from 2004 onwards.4 We thus consider that a type of ‘exceptionalism’ is
present in these states, and therefore analyze the relationship between Maoist violence and
socio-economic and structural factors for the districts in these six states alone, thus limiting
our overall claims to these states.
This opens our design to criticisms of selection bias, primarily that we have non-randomly
selected states that have experienced high levels of insurgent Maoist violence, thus limiting
the veracity of causal inferences. This criticism of non-random selection of cases based on
invariant values of the dependent variable is reasonable, and we counter with three points.
4 Also, the UPA government came into power in 2004, providing an opportune marker for rural development policy assessment.
First, while the states we choose are hotspots of Maoist violence, our analysis is at the district
rather than state level. We include all districts of the six selected states regardless of level of
violence. Indeed, 30 % of the 151 districts in our study experienced no conflict events
between 2004 and 2010. Further, only 57% of districts experienced more than one event over
the period of analysis, with significant variation on the number of events and fatalities at this
level of aggregation. Secondly, as previously stated there is an exceptionalism about these
particular states. While Maoist violence occurs in some limited degree in other states, it is
fundamentally less organized and more factional while also far less integrated with the
movement in the Eastern states. Third, and most relevant, we do not claim to extend the
findings of this paper beyond the six states in question.
Addressing the temporal aspects of the study, we forego a panel analysis as existing data is
deemed to be of questionable quality or lack variation. Other recent studies have attempted
pooled panel analyses that employ questionable methodologies (Gomes 2011). Given our
concerns, we limit our study and inferences to what is permitted by current accessible data.
Future work will employ 2011 Indian census data to analyze the mobility of the insurgency
over time through a district-year panel dataset, and broaden the study to Maoist violence over
each district of India to assess whether our conclusions hold.
Data
While reams of data exist on the Maoist conflict in India, there is no one source that is to-date
complete. Data sources are often housed within partisan think-tanks in India, making analyses
based on these numbers then a priori either politically slanted, incomplete or
misrepresentative (by underreporting civilian killings, for example). For this reason, our
dataset is designed to utilize all available legitimate sources, cross-referencing the data with
fieldwork, and using only total reported deaths. We do not (and can not without studying
every case individually) base our assessments upon reported but often factually dubious
accounts of a victim’s allegiance, be it ‘civilian’, ‘insurgent’, ‘army’ or ‘pro-government
militia’ member.5 Previous academic attempts to catalogue the scale of the Maoist conflict
have therefore been commendable but suffer from sizeable gaps in coverage of Maoist-related
events (Iyer 2009) or overly simplify classification of districts where conflict is either present
or absent that masks differences in the scale of violence (Boorah 2008). Other emerging
5 Most sources divide deaths at roughly 1/3 civilian, 1/3 insurgent, and 1/3 government. While these figures
fluctuate across districts and over time, one-sided violence is not present.
research attempts to catalogue Maoist violence over time, but sacrifices validity of
measurement in order to create panel datasets (Gomes 2011).
In addressing the issue of event completeness, we compiled a unique dataset on incidence and
severity of conflict events at the district level using information from three separate sources.
We record Maoist related events involving at least one fatality as reported by the South Asian
Terrorism Portal (SATP), the National Counterterrorism Centre’s Worldwide Incidents
Tracking System (WITS) and the Global Terrorism Database. We then cross-checked
between sources as well as with our previous qualitative fieldwork and the Ministry of Home
Affairs in the Government of India to code all unique violent incidents. Events were geo-
coded to the district level and the number of fatalities recorded Additionally, all lethal events
were dummy coded, in addition to coding the total number of fatalities per event. Our dataset
includes information on deaths for combatants, non-combatants, state and non-state actors for
the period January 2004 to November 2010 - a total of 1827 events with 4816 fatalities.
Descriptive statistics for these and other variables are shown in Appendix 1. Figure 1 shows
the distribution of events and deaths by state.
While our dataset represents a significant step forward in coverage and quality, we do not
claim to have compiled a complete collection of the events and fatalities of the Maoist
insurgency. We rely on third party reports of conflict events from newspaper and wire
agencies, and while standards of journalism in India are improving, partisan views or simple
omissions most likely ensure that we have not captured all deaths or events – particularly in
conflict zones. Regardless, this dataset represents the most current and complete source of
Maoist related violence presently available.
4.1. Dependent variables
It is plausible that there are different drivers of the frequency and magnitude of attacks.
Grievance-related issues may associate with the establishment of insurgency, but economic
incentives can prolong conflicts and render them more violent. A greater number of attacks,
or more severe violent attacks might provoke particularly harsh reactions by the respective
state and central governments concerned. They also clearly represent a greater threat to the
security and livelihoods of citizens in these areas. We therefore measure the Maoist conflict in
three ways. We look at whether a conflict is present or not; how frequently violent events
have occurred; and how severe these events have been.
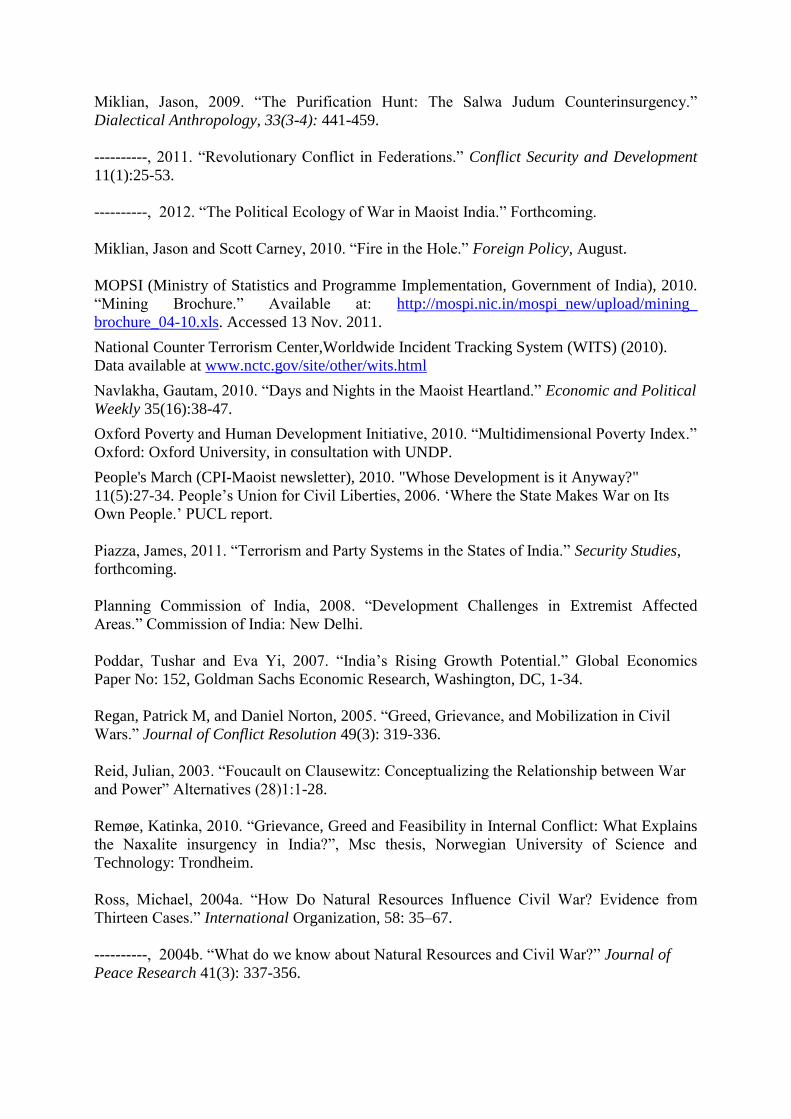
Figure 1: Maoist Conflict, Mining districts and SC and ST population share
(Map designed by Jan Ketil Rød and Krishna Vadlamannati)
Notes:
(a) Districts with thicker border lines are the ones with the presence of some mining activities.
(b) Dark blue colour indicates SC and ST population share greater than 75%.
(c) Red spots are conflict lethal events per 10000 capita.
Conflict Incidence
We measure conflict incidence cross-sectionally by assessing whether or not a district
experienced one or more Maoist events that resulted in a fatality for the period between 2004
and 2010. We estimate our cross-sectional regressions for conflict incidence employing the
probit estimator with controlling for district effects and standard errors clustered at district
level (Beck and Katz 1995). This approach assumes that the observations are non-independent
within units (districts) but independent across. We estimate the following relationship:
)1(21 jijijiji ZNConflict
Where, Conflict ji represents the armed conflict incidence in a district j in state i, N ji denotes
key explanatory variable(s) specific to the Maoist conflict, Z ji are control variables related to
the outbreak of civil conflict, and ωji is an error term for district j in state i.
Conflict Intensity: frequency and severity
We estimate the intensity of conflict in two ways, generating 2 cross-sectional dependent
variables. We measure frequency using the sum of the total number of violent incidents in the
2004-2010 period; and measure severity using the sum of the total number of battle deaths due
to Maoist violence during the same 2004-2010 period.
For conflict intensity, we estimate the following relationship:
)2(21 jijijiji ZNIntensity
Intensity ji is measured by counts of Maoist violent incidents or battle deaths in a district j in
state i. Since the intensity of conflict is a count variable(s), we estimate our cross-sectional
regressions employing the negative binomial estimator by controlling for district effects. Our
data on the number of violent incidents and battle deaths are strongly skewed to the right
(with an accumulation of observations at zero) and display significant over dispersion6. We
therefore employ the Negative Binomial estimator over Poisson method (e.g. see Beck and
Katz 1995; Lawless 1987: Cameron and Trivedi 1998).7
4.2. Explanatory variables
We test characteristics specific to the Maoist conflict in our vector Nji . We construct several
of our variables using data from the 2001 Indian population census and district profiles based
on official data. While this data pre-dates our dependent variables measuring Maoist violence
from 2004–2010 it is the most recent district-level data available. Furthermore, many socio-
economic development indicators in rural areas change relatively slowly over time. Moreover,
6 see descriptive statistics in appendix 1
7 This choice is supported by the results of ‘goodness-of-fit’ test indicating the appropriateness of using negative
binomial methods rather than poisson estimation method.
several of these variables were constructed using the 2001 census data collected prior to the
conflict data we use, partially mitigating concerns regarding reverse causality as it is unlikely
that conflict between 2004 and 2010 caused the variables derived from the 2001 census8.
We use logged district-level per capita GDP for the year 20019 to measure aspects of state
capacity and poverty (Planning Commission of India, 2001). To measure of provision of
public goods, we create a factor index from four variables, which measure the percentage of
villages with access to primary health centers, education centers, water facilities and paved
roads. We include the district level literacy rate to measure aspects of opportunity cost and
human capital. Data for all variables above is taken from the 2001 Indian census profiles. For
our mining hypotheses, we employ a measure of the relative value of mining in a district10
.
We use the per capita value of coal and iron mining and quarrying in millions of rupees for
the 2006/7 fiscal year, which we then log transform.11
This data was collated through analysis
of information provided by the Ministry of Mines, Ministry of Coal, and Ministry of Steel on
coal and iron production. Although we do not capture district-level information on the entirety
of mining in our study, iron and coal mining represent over 90% of total mining production in
our selected states.
We have two caveats with how mining is measured. First, our data does not capture changes
over time, evidenced by lower than expected values of mining related GDP in some districts
that have seen substantial increases in both mining and violence over the past decade. Second,
there is a significant amount of illegal mining in India, which is not recorded in official
revenues. This undervalues natural resource extraction in some districts. Because of issues
regarding both data availability and face validity in measuring mining value in a district, we
expect that our results may underestimate the value of mining in some districts, and thus the
relationship between mining and conflict.
8 While events in the past cannot be caused by events in the future, it is clear that there is some inertia in the
levels of conflict. The current design does not allow us to test the effect of conflict in previous years, and is thus
susceptible to problems of reverse causality – where previous conflict may be related to both current conflict and
our explanatory variables. While our independent variables are from prior to our conflict data years, we
acknowledge reverse causality as a potential problem that is not entirely solved. 9 Measured in 1999 constant dollars. 10 We also create a dummy variable assessing the presence or absence of any mining related revenue in a district.
Substituting this variable for per capita mining revenues does not change any of our core results and we choose
to omit them here. 11 When log transforming we added a 1 to zero values before logging. We ran all analyses without log transformation without any changes to results.
To measure the effect of SCST populations, we use the percentage of the total population that
is made up of members of scheduled castes and scheduled tribes at the district level taken
from the Indian census district profiles (2001).12
Finally, to address the effect of rural
development programs we include a variable measuring the average percentage of households
between 2004 and 2010 employed under NREGA in each district. This information is taken
from NREGA's aggregated state reports at the district level.
4.3 Interaction effects
We test our three contextual hypotheses with three interaction terms. We test the effect of
mining in districts with greater SC/ST populations by interacting log transformed per capita
value of Coal and Iron Mining and Quarrying with the SC/ST percentage in the total
population at the district level. To test the effect of mining in the context of poor state
capacity or poverty we interact our logged per capita Coal and Iron Mining variable with
logged per capita GDP at the district level. Finally, we test the effect of SCST populations in
the context of limited service provision by interacting the share of SC/ST in the population
with our index of public goods availability.
4.4. Control variables
We test a vector of control variables (Zji), which are drawn from the previous literature on
cross-country studies of civil violence (Fearon and Laitin, 2003; Collier et al., 2009; Fearon,
2004; de Soysa, 2002; Do & Iyer, 2007; Bohara, Mitchell & Nepal, 2006). First, we include a
variable measuring the total population at the district level, which we then log transform to
adjust for a non-normal distribution. This variable captures some effects of both the pressures
on renewable natural resources (e.g. Homer-Dixon, 1999; Homer-Dixon & Blitt, 1998); and
controls for that, all things equal, more populous districts should experience more violent
incidents and a greater number of battle deaths.
Second, insurgent actors often favor areas that lie beyond the state’s reach (Fearon & Laitin,
2003), and in India, the Maoists indeed favor densely forested areas. We measure the effect of
remoteness and lack of state reach by using the percentage share of a district that is covered in
forested area; and ‘ruralness’ as a percentage of the district population living in urban areas to
control for this effect. Population, urbanization and forest area variables are from the
12 We also consider that it may be only tribal populations which respond to Maoist calls for rebellion. We have run separate models including only scheduled tribal populations with no differences in results.
government of India’s census district profiles (2001).Third, we test the claim that land rights
based grievances may create cleavages and horizontal inequalities that may motivate
rebellion, whereby the design of colonial institutions created path dependencies affecting
inequalities over access to land.13
We dummy code with a 1 if a district was under the British
direct rule and 0 otherwise using data from Somanathan and Banerjee (2005). Essentially,
where British-created landlord institutions have persisted (Iyer 2010), collective action is
weakened, enabling unfairly compensated land claims by public and private interest groups.
Violence may be greater in such districts as land-related grievances may support Maoist
recruitment, especially given the movement’s initial foundations in land grievances a
generation before. Finally, many conflicts expand beyond where they originated (Hegre et al.
2009). Pertinently, the Maoists are highly mobile given the lack of ‘territoriality’ in their
demands (they are not separatist, for example). We therefore include the count of lethal
conflict incidents in immediately neighboring districts to capture possible spillover effects
5. Empirical Results
We present three estimations in our results, each summed at the district level for the period
2004 and 2010. In table 1, the first column analyses the presence of lethal Maoist events; and
columns 2 – 5 analyses the frequency of lethal Maoist events. Table 2 presents conflict
intensity measured by the total number of casualties from Maoist related violence. For conflict
presence in column 1 in table 1 we use probit estimation technique, while for frequency of
lethal events and battle deaths use negative binomial regressions. Baseline Models for conflict
incidence and frequency are presented in the first and second columns of Table 1; and for
severity in the first column of Table 2, with marginal effects at the mean for explanatory
variables are reported in all tables. 14
Our main results are generally consistent across models, with several variables standing out as
consistent and robust correlates of presence, frequency and severity of Maoist activity. Our
results support previous theories of civil conflict and insurgency, while extending
understanding of conflict drivers in Maoist affected states. Intriguingly, they indicate that
13 See also, for example, Banerjee & Iyer (2005) and Banerjee et al (2005) regarding path dependencies affecting
patterns of investment and public goods availability in India, also factors which may foster grievances. 14 We use Stata 11.0’s margins command to calculate marginal effects.
conflict is most likely in districts where local grievances coincide with economic conditions
that make organization of rebellion more feasible.
We find support for a hypothesis 1a between lower district level GDP and greater frequency
and severity of Maoist violence (Column 2, table 1 & Column 1 Table 2). District per capita
GDP is associated with fewer conflict events and battle deaths, with, for example, a standard
deviation increase in per capita GDP (log) is associated with decline in roughly one or more
battle deaths. We do not, however, find support that lower availability of public goods is
related to Maoist violence, with our baseline models remaining insignificant despite their
negative sign. Hypothesis 2 largely unsupported, with only our baseline model for conflict
incidence being weakly correlated with literacy rates. All baseline and interactive models for
frequency and severity of conflict while negative, were insignificant, suggesting that human
capital measured this way is not strongly related to conflict. Our third hypothesis that mining
GDP would co-vary with Maoist violence is not supported here. We find that greater of
mining share of district GDP is unrelated to the presence, frequency and severity of Maoist
violence (columns 1 and 2 in table 1, and column 1 in table 2, respectively), with mining
share variables taking a positive sign but remaining not significantly different from zero15
.
Our results strongly support our fourth hypothesis, with greater shares of SCST in the
population related to greater incidence frequency and severity of violence in all model
specifications. This suggests the presence of excluded populations may provide insurgents
with a source of support or a pool to recruit from. We also see a strong relationship between
greater numbers of households covered by the NREGA program and lower incidence,
frequency and severity of violence. This implies that there may be peaceful returns to the
programs the Indian state has employed in its attempts to securitize development. We are
though cautious about this interpretation as we are unable to assess the causal direction of the
relationship. It is possible that in districts less threatened by insurgent violence, programs
designed to win the ‘hearts and minds’ of rural populations are more easily able to be rolled
out; or that in more violent districts it is more difficult to reach the programs target
population.
15 This is in line with the findings of Brunnschweiler and Bulte (2009) who find no effect of natural resources on
outbreak of violent conflict after controlling for institutions and treating natural resources variables as
endogenous.
Our controls generally show support for structural factors related to violence and insurgency
that emerge from the quantitative literature. For nearly all specifications, districts with larger
populations experience greater levels of violence. This is consistent with previous findings at
the district (Borooah, 2008; Do and Iyer, 2007; Bohrah et al., 2006) and state level in India
(Urdal, 2008). For our measures of geographic remoteness, we find districts with large forest
shares are repeatedly correlated with the presence of Maoist activity, emphasizing how lack of
state reach and poor infrastructure supports conditions for insurgency. However, we find no
strong support that the level of urbanization in districts is significantly related to Maoist
violence. While results are not robust, this insignificant effect might stem from insurgency
favoring rural areas and migration to urban areas easing pressure on rural resources.16
No evidence is found that districts with landlord colonial institutions are related to Maoist
conflicts in any of our specifications, yet we do find consistent support that violence is greater
in districts sharing borders with other districts themselves experiencing Maoist attacks. Tables
1 and 2 indicate that the incidence, frequency and severity of Maoist violence is positively
and significantly related to the number of lethal events in neighboring districts. This finding is
robust to all model specifications for our three dependent variables, and indicates that cross-
border spillover effects are occurring in these six Indian states, supporting similar previous at
the national and sub-national level (Hegre et al., 2009). Furthermore, the mobility of Maoists
and their propensity to cross borders to evade the reach of Indian forces is at least partially
driving the association between violence in neighboring districts.
Taken together, our baseline results provide an interesting picture about Maoist violence in
India. It appears that poorer districts with larger tribal and caste populations are more likely to
experience violence, and that development programs to address grievances may reduce
violence. Similarly, the insurgency appears likely to be mobile and spill across borders, and
benefit from operational advantages in remote or rough terrain. While our previous work
suggested that the Maoists are operating primarily in a loot-seeking enterprise, violence
appears unrelated to mining operations exist. While mines (both legal and illegal) provide
opportunities and incentives for actors on all sides to loot resources to finance their
operations, our results do not support the anecdotal evidence in previous fieldwork that this is
the core factor driving the conflict.
16 Seemingly though, the ‘rural’ dimensions this variable measures may have been better captured in other measures, such as basic service provision or percentage forest share.
Table 1: Conflict Incidence and Frequency
(1) (2) (3) (4) (5)
Variables Conflict
Incidence Conflict Events
Conflict Events
Conflict Events
Conflict Events
Probit Nbreg Nbreg Nbreg Nbreg
District Per capita GDP (log) -0.623 -0.713* -0.510 -0.505 -0.840**
(1.58) (1.84) (1.33) (1.30) (2.10)
Access to Public Basic Goods 0.133 -0.229 -0.333* -0.230 0.411
(0.68) (1.25) (1.86) (1.32) (1.22)
Total Literacy Rate -0.020* -0.015 -0.011 -0.013 -0.006
(1.66) (1.11) (0.81) (0.96) (0.39)
Per capita Iron & Coal value (log) 0.135 0.016 -0.792*** 9.035*** 0.028
(0.69) (0.10) (2.91) (2.61) (0.18)
SC & ST Population share 0.019* 0.048*** 0.036*** 0.045*** 0.040***
(1.89) (4.87) (3.39) (4.36) (4.22)
Households Employed under NREGA per capita -0.007 -0.092*** -0.081** -0.092*** -0.082**
(0.32) (2.66) (2.52) (2.78) (2.47)
Total Population (log) 0.631** 1.050*** 1.015*** 0.977*** 1.130***
(2.39) (3.50) (3.52) (3.26) (3.88)
Share of Forest Area in Sqkms 0.049*** 0.030** 0.031*** 0.027*** 0.033**
(2.63) (2.38) (2.67) (2.70) (2.09)
Urbanization Rate 0.002 0.007 0,007 0,006 0,006
(0.14) (0.42) (0.48) (0.36) (0.38)
British Direct Rule dummy -0.138 -0.025 -0.144 -0.023 -0.076
(0.42) (0.07) (0.45) (0.07) (0.23)
Conflicts in Neighboring Districts 0.010 0.008*** 0.009*** 0.007*** 0.008***
(1.46) (2.68) (2.97) (2.68) (2.81) Per capita Iron & Coal value (log) × SC & ST Population share 0.015***
(3.22) Per capita Iron & Coal value (log) × District Per capita GDP (log) -0.949***
(2.66) SC & ST population share × Access to Basic Public Goods -0.022**
(2.49)
Total Observations 140 140 140 140 140
a. Standard errors in parentheses, *** p<0.01, ** p<0.05, * p<0.1 b. Reports average marginal effects holding covariates at mean.