Journal of Engineered Fibers and Fabrics 15 http://www.jeffjournal.org Volume 3, Issue 4 - 2008 Heat Aged Tensile Strength Retention of Poly (p-phenylene terephthalamide) Sewing Thread Walter R. Hall, III, Warren F. Knoff, Ph.D. DuPont Advanced Fiber Systems, Richmond, Virginia, USA Correspondence to: Walter R. Hall, III email: [email protected]ABSTRACT The strength retention after exposure to elevated tem- perature in air of continuous filament and staple spun PPTA sewing thread and the precursor yarns was determined. For both types, the process of converting the greige yarn to thread reduced the amount of strength retained after thermal exposure. The continu- ous filament products retained more strength than the staple products. The data was fitted to a kinetic rate model in which two strength loss processes occurred. The first process occurred within about the first 5 minutes of thermal exposure and is hypothesized to be hydrolytic degradation. The estimated secondary degradation process activation energy suggests this to be thermo-oxidative degradation. Optical microscopy of filaments indicates a higher level of kink banding and other damage in continuous filament versus sta- ple products and in finished thread versus the precur- sor yarns. The kink bands and damage are believed to be caused by the staple manufacturing process and the downstream processing of precursor yarn to fin- ished sewing thread. The kink bands and damage are hypothesized to be responsible for the differences in strength retention. INTRODUCTION Poly(p-phenylene teraphthalamide) (PPTA) is an aromatic long-chain polyamide in which the linking amide groups occupy the para positions on the aromatic ring. The polymer is commonly synthesized by low temperature polycondensation of p-phenylene diamine (PPD) and terephthaoyl chloride (TCl) in dialkyl amide solvent. PPTA polymer can be formed into highly oriented fibers by means of spinning from a liquid crystalline solution [1-5]. The two most common commercially available PPTA fiber products are Kevlar® 1 brand para-aramid fiber manufactured by DuPont and Twaron® manufac- tured by Teijin 2 . 1 KEVLAR® is a registered trademark of E.I. du Pont de Nemours and Company and its affiliates. 2 TWARON® is a registered trademark of Tejin Aramid BV and its affiliates. PPTA fibers exhibit no melting point, high limiting oxygen index for combustion, excellent structural integrity at elevated temperatures, and a high strength to weight ratio. Notable applications include fire protection applications, high strength to mass ratio applications (mooring rope, cable reinforcement), bullet resistant vests and composites, and aerospace heat resistant and strength applications. PPTA sewing thread is utilized in numerous thermal protection applications including personal protective equipment and fire resistant home furnishings. A critical reason to use PPTA sewing thread is to help prevent sewn seams from breaking open during thermal attack, exposing the protected person or object, and potentially leading to burns or other consequences of thermal exposure. The type of PPTA precursor yarn used and the post processes the yarn undergoes in order to convert it to a usable sewing thread may affect the ability to maintain structural integrity when exposed to elevated temperatures. The object of this work was to determine the impact of thermal exposure on the tensile properties of several types of PPTA sewing threads and the precursor (greige) yarns used to manufacture the thread. EXPERIMENTAL Test Materials PPTA sewing thread can be segregated into two general types: continuous filament and non- continuous filament. Continuous filament or simply “filament” sewing thread is made from continuous filament yarn obtained directly from the yarn spinning process. The conversion process to make the precursor filament yarn into a useful sewing thread typically involves the application of lubricants, binders to improve bundle cohesion and colorants. The precursor
Transcript
Journal of Engineered Fibers and Fabrics 15 http://www.jeffjournal.org Volume 3, Issue 4 - 2008
ABSTRACT The strength retention after exposure to elevated tem-perature in air of continuous filament and staple spun PPTA sewing thread and the precursor yarns was determined. For both types, the process of converting the greige yarn to thread reduced the amount of strength retained after thermal exposure. The continu-ous filament products retained more strength than the staple products. The data was fitted to a kinetic rate model in which two strength loss processes occurred. The first process occurred within about the first 5 minutes of thermal exposure and is hypothesized to be hydrolytic degradation. The estimated secondary degradation process activation energy suggests this to be thermo-oxidative degradation. Optical microscopy of filaments indicates a higher level of kink banding and other damage in continuous filament versus sta-ple products and in finished thread versus the precur-sor yarns. The kink bands and damage are believed to be caused by the staple manufacturing process and the downstream processing of precursor yarn to fin-ished sewing thread. The kink bands and damage are hypothesized to be responsible for the differences in strength retention. INTRODUCTION Poly(p-phenylene teraphthalamide) (PPTA) is an aromatic long-chain polyamide in which the linking amide groups occupy the para positions on the aromatic ring. The polymer is commonly synthesized by low temperature polycondensation of p-phenylene diamine (PPD) and terephthaoyl chloride (TCl) in dialkyl amide solvent. PPTA polymer can be formed into highly oriented fibers by means of spinning from a liquid crystalline solution [1-5]. The two most common commercially available PPTA fiber products are Kevlar® 1 brand para-aramid fiber manufactured by DuPont and Twaron® manufac-tured by Teijin2.
1 KEVLAR® is a registered trademark of E.I. du Pont de Nemours and Company and its affiliates. 2 TWARON® is a registered trademark of Tejin Aramid BV and its affiliates.
PPTA fibers exhibit no melting point, high limiting oxygen index for combustion, excellent structural integrity at elevated temperatures, and a high strength to weight ratio. Notable applications include fire protection applications, high strength to mass ratio applications (mooring rope, cable reinforcement), bullet resistant vests and composites, and aerospace heat resistant and strength applications. PPTA sewing thread is utilized in numerous thermal protection applications including personal protective equipment and fire resistant home furnishings. A critical reason to use PPTA sewing thread is to help prevent sewn seams from breaking open during thermal attack, exposing the protected person or object, and potentially leading to burns or other consequences of thermal exposure. The type of PPTA precursor yarn used and the post processes the yarn undergoes in order to convert it to a usable sewing thread may affect the ability to maintain structural integrity when exposed to elevated temperatures. The object of this work was to determine the impact of thermal exposure on the tensile properties of several types of PPTA sewing threads and the precursor (greige) yarns used to manufacture the thread. EXPERIMENTAL Test Materials PPTA sewing thread can be segregated into two general types: continuous filament and non-continuous filament. Continuous filament or simply “filament” sewing thread is made from continuous filament yarn obtained directly from the yarn spinning process. The conversion process to make the precursor filament yarn into a useful sewing thread typically involves the application of lubricants, binders to improve bundle cohesion and colorants. The precursor
Journal of Engineered Fibers and Fabrics 16 http://www.jeffjournal.org Volume 3, Issue 4 - 2008
filament yarn is frequently also twisted or textured to improve feel, coverage and sewing performance. Three nominal 400 denier PPTA continuous filament products were chosen for evaluation:
• Continuous filament yarn (CF1) (precursor yarn for thread),
Non-continuous or staple fiber sewing thread is made from staple spun or stretch broken yarns which contain fibers of a finite length much shorter than those in continuous filament yarn. Staple spun yarns are produced by spinning or twisting staple (or cut) fiber into a yarn bundle using one of several yarn spinning processes (i.e. ring spinning, open end spinning, sliver spinning). Stretch broken yarns create non-continuous yarn through the over extension of filament yarn past the point of individual filament fracture without separating the overall yarn bundle. After stretch breaking, the yarn is twisted to stabilize the bundle and create the final yarn. Lubricants, binders, and colorants are also applied to these yarns to convert them into useful sewing threads. Staple fiber sewing thread, both fire retardant and non-fire retardant, is the most commonly used because it allows more control over yarn size and mechanical properties than filament thread. Three 30cc/34 ply PPTA short staple spun yarns were chosen for evaluation:
The measured linear densities are shown in Table I.
TABLE I. Linear Densities of Staple Spun Products
Sample ID Linear density, denier
S1 526
S2 567 S3 646
Heat Aging Test Method A Blue M convection oven (model DC-1506) was used to heat age the specimens. Samples were
3 These are from different thread manufacturers 4 Nomenclature 30cc/3 ply yarn refers to a yarn made up of three individual plies of 30 cotton count yarn twisted together
measured into 60-meter skeins, loosely twisted into a tow in an essentially stress-free environment, and hung within the oven at 285°C, 350°C, and 400°C for 5, 10, 20, and 30-minute intervals. Temperatures were chosen based on ASTM D7016 and the degradation temperature of the para-aramid polymer. All yarn samples for a given exposure time were heat aged in the oven at the same time to reduce sample variability due to oven temperature stability. The sample skeins were removed and conditioned at 75°F (23.9°C) and 55% relative humidity for a minimum of 24 hours prior to tensile testing under these conditions. The tensile properties of the heat aged yarn samples and control yarn samples were measured according to ASTM D2256 straight strength method (gauge length of 20 inches and crosshead speed of 10 inches per minute). Each value is the average of ten replicates. RESULTS AND DISCUSSION Tables II and III contain the heat aged tensile strength results for the above described categories of threads.
TABLE II. Breaking Strength Data for Continuous Filament Products. Values are in pounds force, time in minutes. First value is average, second value is standard deviation, third value is 95%
TABLE III. Breaking Strength Data for Staple Spun Products. Values are in pounds force, time in minutes. First value is average, second value is standard deviation, third value is 95% confidence
General Observations Continuous Filament Yarns and Thread As can be seen from the strength of the unheated precursor filament yarn (CF1) (16.75 lbf break force) and that of the sewing threads (15.1 and 15.5 lbf break force), the process of converting the precursor yarn (CF1) to sewing thread (CF2 and CF3) results in ~9% loss of breaking strength. Upon heating at all temperatures studied, the filament sewing threads (CF2 and CF3) also consistently lose a greater percentage of their strength than does the precursor filament yarn (CF1). This observation is shown graphically for the 400°C data (Figure 1). There is also a significant difference in retained strength between the two thread samples (CF2 and CF3).
0
20
40
60
80
100
120
0 10 20 30 40
Time, minutes
% R
etai
ned
Stre
ngth
CF1CF2CF3
FIGURE 1. Retained strength of continuous filament products after exposure to 400°C
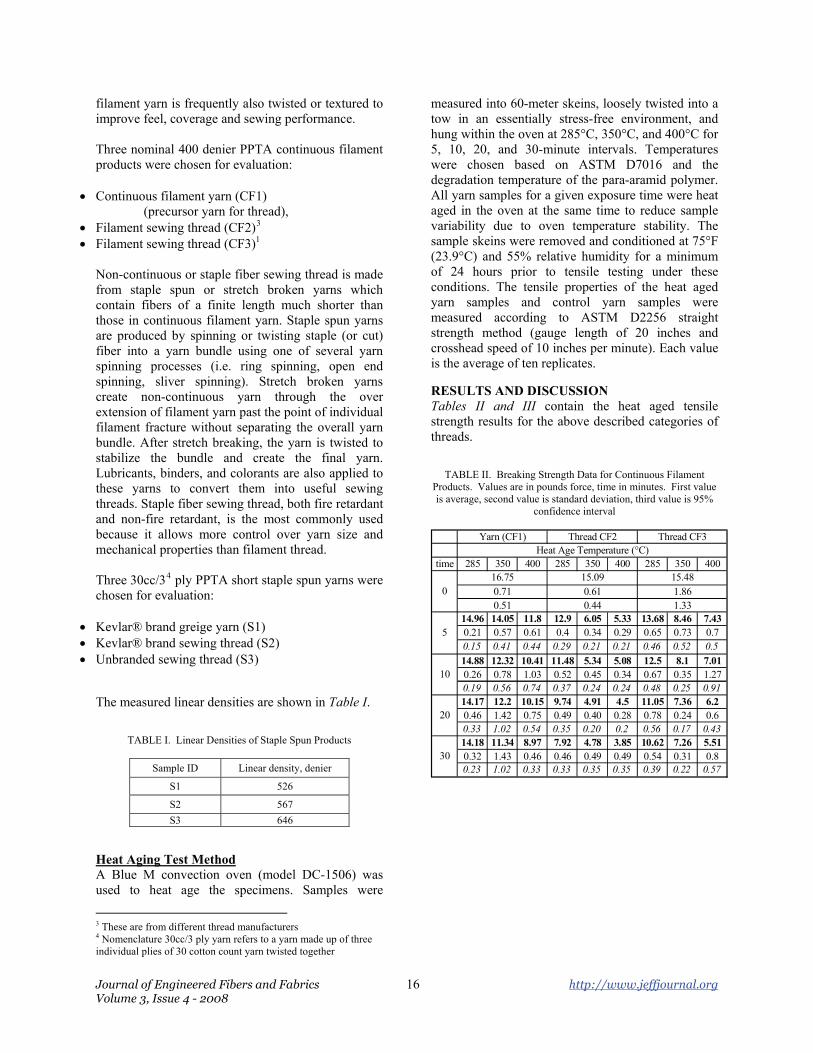
Staple Yarns and Threads For the staple products, there again is a difference in the strength of the unheated greige yarn (S1) (11.0 lbf break force) and the finished sewing threads (S2 and S3) (10.3 and 10.8 lbf break force). For these products, the tensile strength of the finished sewing threads is 2% to 7% lower than that of the greige precursor yarn (S1). A somewhat smaller difference than that observed between the continuous filament precursor yarn and finished sewing thread. After 285°C exposure, there are significant differences in the tensile strength retention of all these staple based products. Overall, the staple spun greige yarn (S1) retained ~10% more of its original tensile strength than did the Kevlar® brand sewing thread (S2) and ~20% more than the unbranded thread (S3) (Figure 2).
0
20
40
60
80
100
120
0 10 20 30 40
Time, minutes
% R
etai
ned
Stre
ngth
S1S2S3
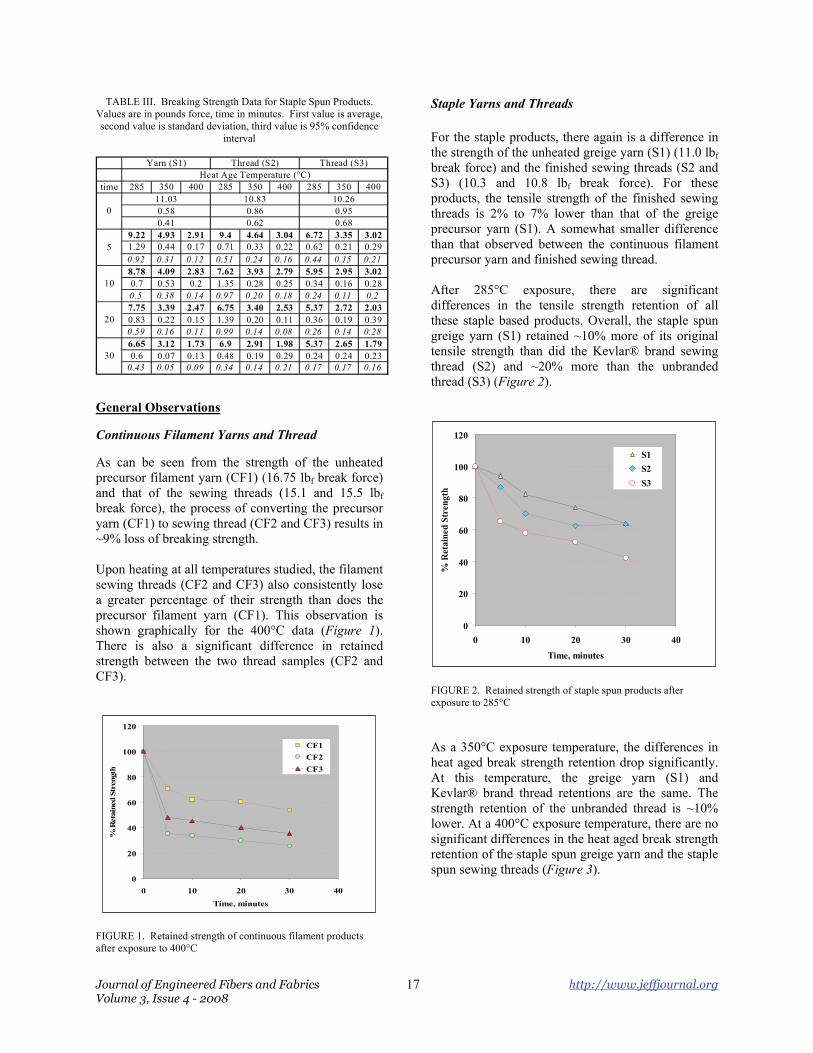
FIGURE 2. Retained strength of staple spun products after exposure to 285°C As a 350°C exposure temperature, the differences in heat aged break strength retention drop significantly. At this temperature, the greige yarn (S1) and Kevlar® brand thread retentions are the same. The strength retention of the unbranded thread is ~10% lower. At a 400°C exposure temperature, there are no significant differences in the heat aged break strength retention of the staple spun greige yarn and the staple spun sewing threads (Figure 3).
Journal of Engineered Fibers and Fabrics 17 http://www.jeffjournal.org Volume 3, Issue 4 - 2008
0
20
40
60
80
100
120
0 10 20 30 40
Time, minutes
% R
etai
ned
Stre
ngth
S1S2S3
FIGURE 3. Retained strength of staple spun products after exposure to 400°C The Kelvar® brand thread (S2) shows significantly higher strength than the unbranded thread (S3) at 285° and 350°C aging conditions and equivalent strength under 400°C conditions. Kinetic Analysis Strength Loss Model The decrease in strength was modeled based on a second order rate equation. This model has been used previously to describe para-aramid fiber strength loss [6, 7] and its integrated form has wide precedent in the field of polymer degradation [8]. The model is
2kdtd σσσ ∗−= (1)
which upon integration yields
tk0
1t
1∗=− σσσ )()(
(2)
where σ(t) and σ(0) are the strength at time, t and 0 respectively, and kσ is a function of temperature, typically assumed to be of an Arrhenius form. If this model is applicable, the quantity to the left when plotted versus time should be linear with a slope equal to the rate constant, kσ.
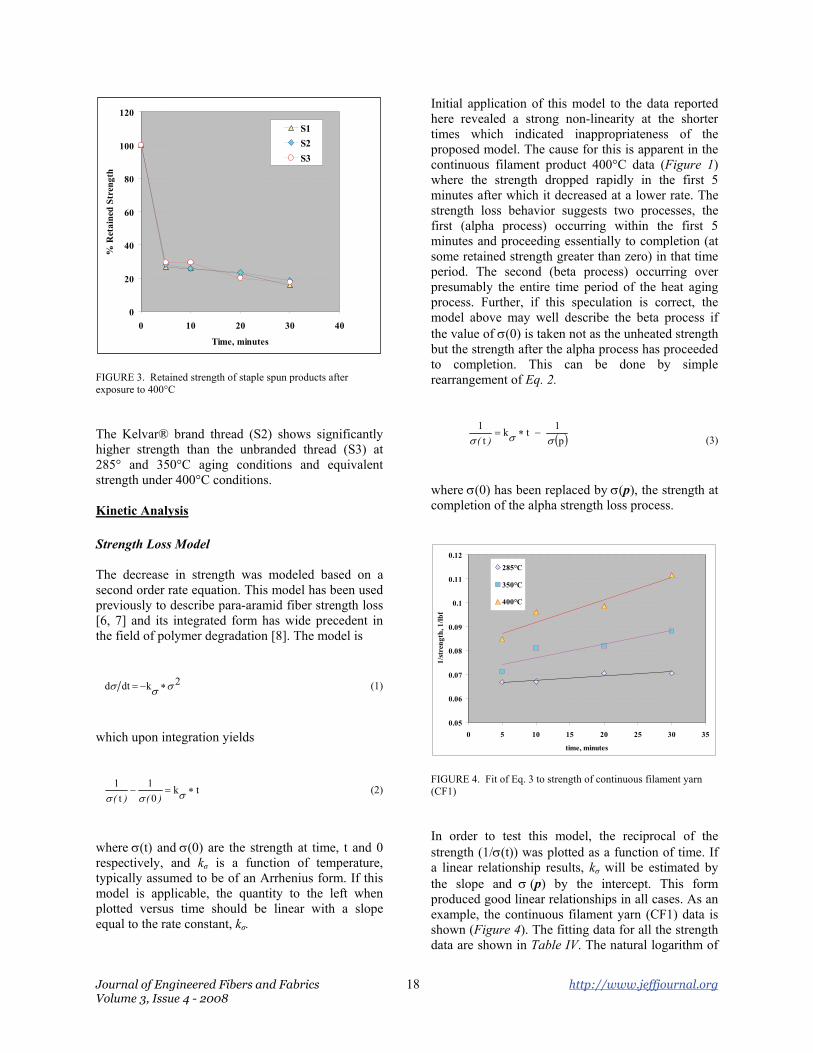
Initial application of this model to the data reported here revealed a strong non-linearity at the shorter times which indicated inappropriateness of the proposed model. The cause for this is apparent in the continuous filament product 400°C data (Figure 1) where the strength dropped rapidly in the first 5 minutes after which it decreased at a lower rate. The strength loss behavior suggests two processes, the first (alpha process) occurring within the first 5 minutes and proceeding essentially to completion (at some retained strength greater than zero) in that time period. The second (beta process) occurring over presumably the entire time period of the heat aging process. Further, if this speculation is correct, the model above may well describe the beta process if the value of σ(0) is taken not as the unheated strength but the strength after the alpha process has proceeded to completion. This can be done by simple rearrangement of Eq. 2.
( )p1tk
t1
σσσ−∗=
)(
(3)
where σ(0) has been replaced by σ(p), the strength at completion of the alpha strength loss process.
0.05
0.06
0.07
0.08
0.09
0.1
0.11
0.12
0 5 10 15 20 25 30 35
time, minutes
1/st
reng
th, 1
/lbf
285°C
350°C
400°C
FIGURE 4. Fit of Eq. 3 to strength of continuous filament yarn (CF1) In order to test this model, the reciprocal of the strength (1/σ(t)) was plotted as a function of time. If a linear relationship results, kσ will be estimated by the slope and σ (p) by the intercept. This form produced good linear relationships in all cases. As an example, the continuous filament yarn (CF1) data is shown (Figure 4). The fitting data for all the strength data are shown in Table IV. The natural logarithm of
Journal of Engineered Fibers and Fabrics 18 http://www.jeffjournal.org Volume 3, Issue 4 - 2008
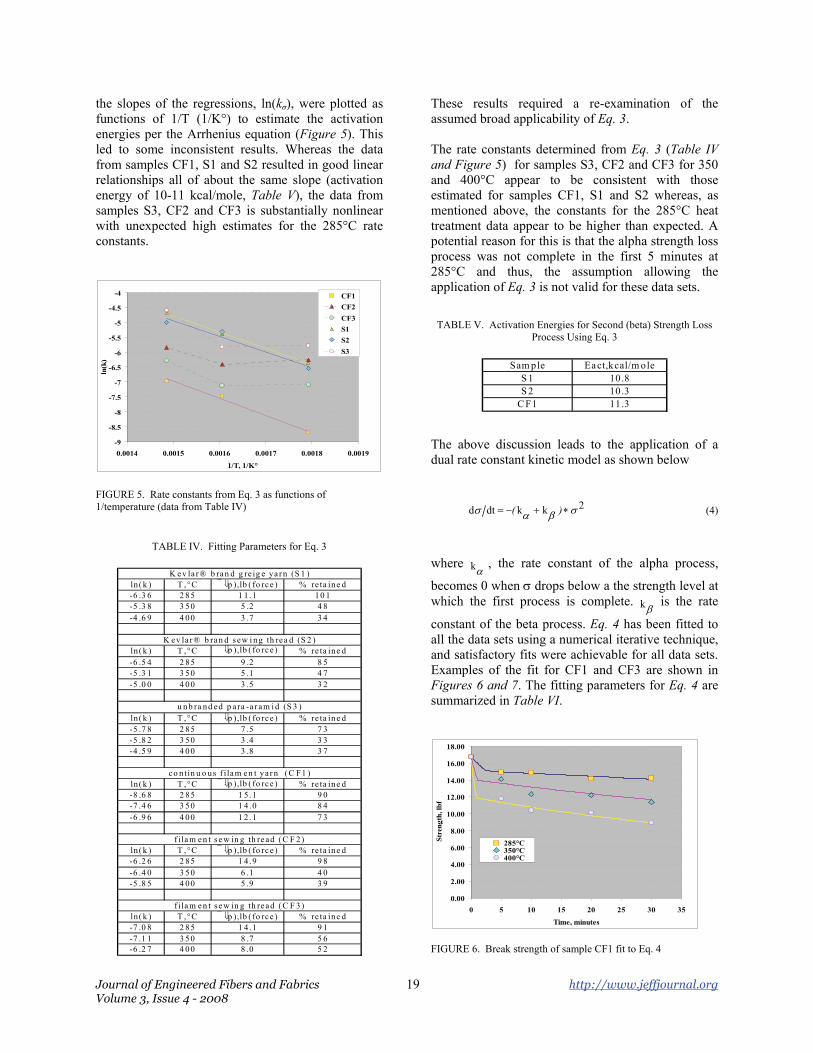
the slopes of the regressions, ln(kσ), were plotted as functions of 1/T (1/K°) to estimate the activation energies per the Arrhenius equation (Figure 5). This led to some inconsistent results. Whereas the data from samples CF1, S1 and S2 resulted in good linear relationships all of about the same slope (activation energy of 10-11 kcal/mole, Table V), the data from samples S3, CF2 and CF3 is substantially nonlinear with unexpected high estimates for the 285°C rate constants.
-9
-8.5
-8
-7.5
-7
-6.5
-6
-5.5
-5
-4.5
-4
0.0014 0.0015 0.0016 0.0017 0.0018 0.0019
1/T, 1/K°
ln(k
)
CF1CF2CF3S1S2S3
FIGURE 5. Rate constants from Eq. 3 as functions of 1/temperature (data from Table IV)
TABLE IV. Fitting Parameters for Eq. 3
ln( k ) T ,°C ⎯ ⇓p ),lb ( fo rce ) % re ta ine d-6 .3 6 2 85 1 1.1 10 1-5 .3 8 3 50 5 .2 4 8-4 .6 9 4 00 3 .7 3 4
ln( k ) T ,°C ⇓p ),lb ( fo rce ) % re ta ine d-6 .5 4 2 85 9 .2 8 5-5 .3 1 3 50 5 .1 4 7-5 .0 0 4 00 3 .5 3 2
ln( k ) T ,°C ⇓p ),lb ( fo rce ) % re ta ine d-5 .7 8 2 85 7 .5 7 3-5 .8 2 3 50 3 .4 3 3-4 .5 9 4 00 3 .8 3 7
ln( k ) T ,°C ⎯ ⇓p ),lb ( fo rce ) % re ta ine d-8 .6 8 2 85 1 5.1 9 0-7 .4 6 3 50 1 4.0 8 4-6 .9 6 4 00 1 2.1 7 3
ln( k ) T ,°C ⎯ ⇓p ),lb ( fo rce ) % re ta ine d-6 .2 6 2 85 1 4.9 9 8-6 .4 0 3 50 6 .1 4 0-5 .8 5 4 00 5 .9 3 9
ln( k ) T ,°C ⎯ ⇓p ),lb ( fo rce ) % re ta ine d-7 .0 8 2 85 1 4.1 9 1-7 .1 1 3 50 8 .7 5 6-6 .2 7 4 00 8 .0 5 2
f ila m e n t s e w in g th re ad ( C F 3)
K e v la r ® b ran d g re ig e ya r n (S 1 )
K ev la r ® b ran d s ew i ng th rea d (S 2 )
u nb ra nd ed p a ra -a r am i d (S 3 )
co n tin u o us f i lam e n t ya r n ( C F1 )
f ila m e n t s e w in g th re ad ( C F 2)
These results required a re-examination of the assumed broad applicability of Eq. 3. The rate constants determined from Eq. 3 (Table IV and Figure 5) for samples S3, CF2 and CF3 for 350 and 400°C appear to be consistent with those estimated for samples CF1, S1 and S2 whereas, as mentioned above, the constants for the 285°C heat treatment data appear to be higher than expected. A potential reason for this is that the alpha strength loss process was not complete in the first 5 minutes at 285°C and thus, the assumption allowing the application of Eq. 3 is not valid for these data sets.
TABLE V. Activation Energies for Second (beta) Strength Loss Process Using Eq. 3
Sam ple Eact,kcal/m ole
S 1 10.8S 2 10.3
C F1 11.3 The above discussion leads to the application of a dual rate constant kinetic model as shown below
2kkdtd σβασ ∗+−= )( (4)
where , the rate constant of the alpha process,
becomes 0 when σ drops below a the strength level at which the first process is complete. is the rate
constant of the beta process. Eq. 4 has been fitted to all the data sets using a numerical iterative technique, and satisfactory fits were achievable for all data sets. Examples of the fit for CF1 and CF3 are shown in Figures 6 and 7. The fitting parameters for Eq. 4 are summarized in Table VI.
αk
βk
0.00
2.00
4.00
6.00
8.00
10.00
12.00
14.00
16.00
18.00
0 5 10 15 20 25 30 35
Time, minutes
Stre
ngth
, lbf
285°C350°C400°C
FIGURE 6. Break strength of sample CF1 fit to Eq. 4
Journal of Engineered Fibers and Fabrics 19 http://www.jeffjournal.org Volume 3, Issue 4 - 2008
Journal of Engineered Fibers and Fabrics 20 http://www.jeffjournal.org Volume 3, Issue 4 - 2008
0
2
4
6
8
10
12
14
16
18
0 10 20 30 4
Time,minutes
Stre
ngth
, lb
0
f285°C350°C400°C
FIGURE 7. Break strength of sample CF3 fit to Eq. 4
The dual rate constant model of Eq. 4 was only needed for the 285°C data of samples S3, CF2 and CF3. For all other data sets, the single rate constant model of Eqs. 2 and 3 was satisfactory. This is evident in that rate constants and activation energies of the beta process and retained strength σ(p)/σ(0) after the completion of the alpha process are all essentially the same regardless of the model used. That is, Eq. 3 or Eq 4. Activation Energies and Retained Strength The activation energies estimated here for the beta strength loss process range from 10 to 11.3 kcal/mole. This range is slightly lower than the 12.9 kcal/mole value reported by Parimala and Vijayan [9]
for the thermally induced strength loss of PPTA fibers. Mead et al. [10] also estimated 13 kcal/mole for the activation energy of thermo-oxidative strength loss but also, cautioned that this was subject to large uncertainty. Auerbach [6] investigated the strength loss of PPTA fibers and found the activation energy
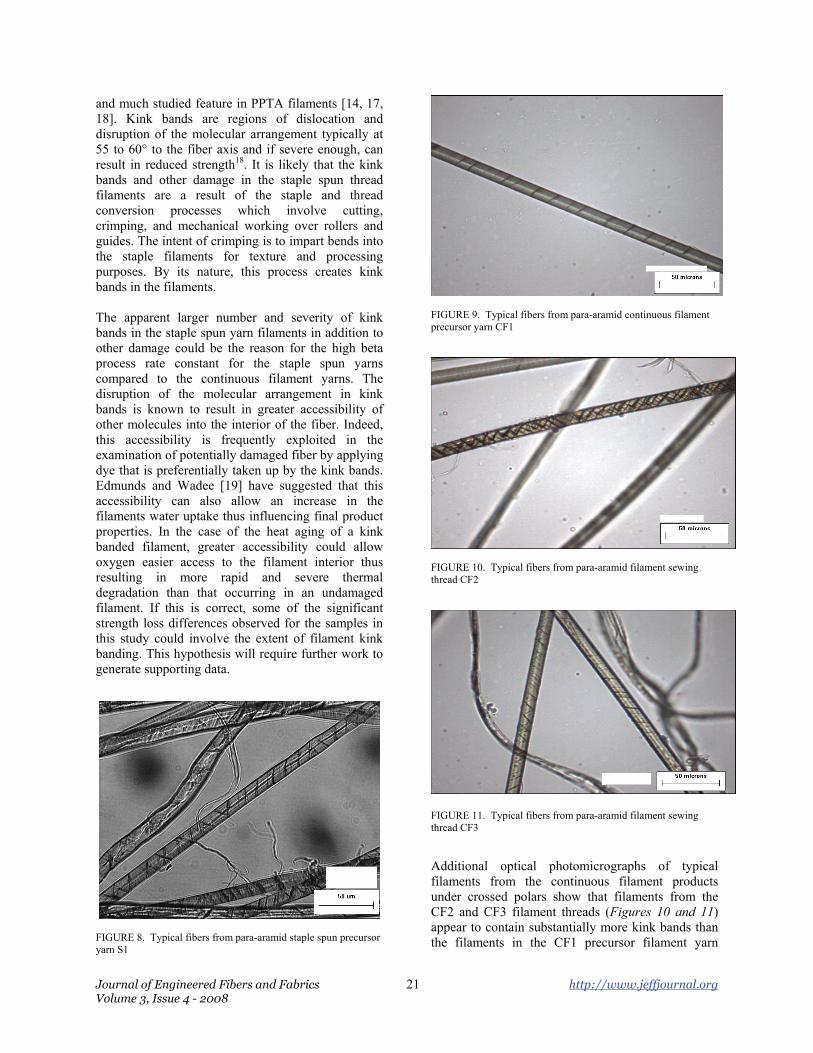
to be 10 kcal/mole in the absence of water which he attributed to thermo-oxidative degradation and 15.3 kcal/mole when water was present which he described as hydrolytic degradation. Knoff [7] found the activation energy of hydrolytic degradation to be 13.9 ±1.3 kcal/mole, a value consistent with that of Auerbach. In view of these previous studies, the values of 10 to 11.3 kcal/mole found in this study are generally consistent with those estimated for thermo-oxidative degradation. The activation energies for the alpha and more rapid strength loss process are higher and cover a greater range (15 to 35 kcal/mole). They are also likely to be subject to greater uncertainty. One might speculate that they suggest the temporary presence of water and thus hydrolytic degradation. This hypothetical mechanism also provides an explanation for the halting of the alpha process, as it would when the internal water is gone, followed by the transition to the lower activation energy thermo-oxidative only beta process. Auerbach also found the rate of the strength loss to be in the presence of water to be much faster than that in the absence of water. The 15 to 35 kcal/mole observed here is more in the 24 to 32 kcal range previously found for PPTA mass loss in air [11, 12] and also the 18.6 kcal/mole estimated for free radical formation in PPTA fibers [13]. Why such a mass loss process would stop is, at this point not clear. The retained strengths at the apparent completion of the alpha process (Table VI) clearly show the differences between continuous filament and staple products and also the impact of the process of converting the precursor yarns to finished sewing threads. Continuous filament products, in general retain a higher percentage of strength than the staple products and, given their higher unheated strength have higher heat treated strengths. The thread conversion process also greatly reduces the amount of retained strength for both product types. Structural Considerations The most significant difference observed in the kinetic parameters (Table VI) is that of the rate constants of the beta process (hypothesized to be thermo-oxidative) for the staple spun products compared to the continuous filament products. Optical photomicrographs under crossed polars show that typical filaments from the staple spun greige yarn, S1, (Figure 8) contain substantially more kink bands and damage than the continuous filament precursor yarn, CF1 (Figure 9). Kink bands, which are a result of axial compression or severe bending of the individual filaments [14-16], are a well known
and much studied feature in PPTA filaments [14, 17, 18]. Kink bands are regions of dislocation and disruption of the molecular arrangement typically at 55 to 60° to the fiber axis and if severe enough, can result in reduced strength18. It is likely that the kink bands and other damage in the staple spun thread filaments are a result of the staple and thread conversion processes which involve cutting, crimping, and mechanical working over rollers and guides. The intent of crimping is to impart bends into the staple filaments for texture and processing purposes. By its nature, this process creates kink bands in the filaments. The apparent larger number and severity of kink bands in the staple spun yarn filaments in addition to other damage could be the reason for the high beta process rate constant for the staple spun yarns compared to the continuous filament yarns. The disruption of the molecular arrangement in kink bands is known to result in greater accessibility of other molecules into the interior of the fiber. Indeed, this accessibility is frequently exploited in the examination of potentially damaged fiber by applying dye that is preferentially taken up by the kink bands. Edmunds and Wadee [19] have suggested that this accessibility can also allow an increase in the filaments water uptake thus influencing final product properties. In the case of the heat aging of a kink banded filament, greater accessibility could allow oxygen easier access to the filament interior thus resulting in more rapid and severe thermal degradation than that occurring in an undamaged filament. If this is correct, some of the significant strength loss differences observed for the samples in this study could involve the extent of filament kink banding. This hypothesis will require further work to generate supporting data.
FIGURE 10. Typical fibers from para-aramid filament sewing thread CF2
FIGURE 11. Typical fibers from para-aramid filament sewing thread CF3 Additional optical photomicrographs of typical filaments from the continuous filament products under crossed polars show that filaments from the CF2 and CF3 filament threads (Figures 10 and 11) appear to contain substantially more kink bands than the filaments in the CF1 precursor filament yarn
Journal of Engineered Fibers and Fabrics 21 http://www.jeffjournal.org Volume 3, Issue 4 - 2008
Journal of Engineered Fibers and Fabrics 22 http://www.jeffjournal.org Volume 3, Issue 4 - 2008
(Figure 9). Through the same mechanism described above, the additional kink banding of the finished sewing threads could reduce the heat aged break strength versus the greige yarn. This reduction can be seen in the increased rate constant for the beta degradation of the filament threads versus the filament yarn (Table VI). CONCLUSIONS This study shows that continuous filament PPTA sewing threads have higher strength after high temperature exposure than staple spun thread. Thus, they can provide a greater margin of safety in applications where such strength properties are critical, such as open flame resistant bedding. The strength loss upon thermal exposure of both continuous filament and staple spun yarns and sewing thread can be successfully described with a dual process kinetic model. The initial strength loss process occurs more rapidly and with higher activation energy than the second. It also proceeds to completion at some residual strength. It is hypothesized that internal water may be involved in the initial process. The second process proceeds throughout a 30 minute exposure with an activation energy consistent with previously published values for thermo-oxidative degradation. The second process rate constants for the staple spun products were an order of magnitude greater than those of the continuous filament products. REFERENCES [1] Yang, H. H., Aromatic High Strength Fibers,
Wiley & Sons, New York, 1989, Chapter II.
[2] Kwolek, S. L., U.S. Patent 3,671,542
[3] Kwolek, S. L., U.S. Patent 3,819,587
[4] Blades, H., U.S. Patent 3,767,756
[5] Blades, H., U.S. Patent 3,869,429
[6] Auerbach, I., “Kinetics for the Tensile Strength Degradation of Nylon and Kevlar Yarns”, Journal of Applied Polymer Science, 37, 2213 (1989).
[7] Knoff, W. F., Koralek, A. S., Eareckson, W. M., “Prediction of Long Term Strength Retention of Kevlar Aramid Fibers in Aqueous Environments”, Annual Meeting of the Marine Technology Society, September 7-9, 1994, Washington, D.C.
[8] Rabek, J. F., “Comprehensive Chemical Kinetics”, Vol. 14, Elsevier Scientific Publishing Company, Amsterdam, 1975, p. 473ff.
[9] Parimala, H. V. and Vijayan, K., “Effect of thermal exposure on the tensil properties of Kevlar fibres”, J. Mat. Sci. Ltrs., 12, 99 (1993).
[10] Mead, J. W., Mead, K. E., Auerbach, I., Ericksen, R. H., “Accelerated Aging of Nylon 66 and Kevlar 29 in Elevated Temperature,Elevaed Humidity, Smog and Ozone”, Ind. Eng. Chem. Prod. Res. Dev., 21, 158 (1982).
[11] Li, Xin-Gui and Huang, Mei-Rong, “Thermal Degradation of Kevlar Fiber by High Resolution Thermogravimetry”, Journal of Applied Polymer Science, 71, 565 (1999).
[12] Wu, Z., Li, F., et al, “The Thermal Degradation Mechanism and Thermal Mechanical Properties of Two High Performance Heterocyclic Polymer Fibers”, Journal of Thermal Analysis and Calorimetry, 59, 361 (2000).
[13] Brown, J. R. and Hodgeman, K. C., “An e.s.r. study of the thermal degradation of Kevlar 49 aramid”, Polymer, 23 365 (1982).
[14] Dobb M. G., Johnson D. J., Saville B. P., “Compressional Behavior of Kevlar Fibers”, Polymer, 22, 961 (1981).
[15] Greenwood J. M., Rose, P. G., “Compressive behavior of Kevlar 49 fibres and composites”, J. Mat. Sci., 9, 1809 (1974)
[16] Deteresa S. J., Farris R. J., Porter R. S., “Behavior of an Aramid Fiber Under Uniform Compression”, Polym. Composites, 3(2), 57 (1982).
[17] Yang H. H., Kevlar Aramid Fiber, Wiley & Sons, New York, 1993.
[18] Hearle J. W. S., High-Performance Fibres, Woodhead Publishing, Ltd., Cambridge, England, 2001.
[19] Edmunds R, Wadee M, “On kink banding in individual PPTA fibres”, Comp. Sci. Tech. 65, 1284 (2005
AUTHORS’ ADDRESS Walter R. Hall, III; Warren F. Knoff, Ph.D. DuPont Advanced Fiber Systems 5401 Jefferson Davis Highway Richmond, VA 23226 USA