HEAT TRANSFER ANALYSIS IN A TURBOCHARGER TURBINE: AN EXPERIMENTAL AND COMPUTATIONAL EVALUATION A. Romagnoli and R. Martinez-Botas 1 Department of Mechanical Engineering Imperial College London SW7 2AZ Exhibition Road London, UK ABSTRACT This paper presents the performance of a turbocharger under non-adiabatic conditions in order to assess the impact of heat transfer. A commercial turbocharger was installed on a 2.0 liter diesel engine and measurements were conducted for a range of engine speeds and loads. The test results enabled to assess the impact of the engine on the temperature distribution of the bodies constituting the turbocharger, quantify the heat fluxes through the turbocharger and evaluate their effects on the deterioration of compressor performance. A 1-D heat transfer model was also developed and validated against the experimental measurements. The algorithms calculate the heat transferred through the turbocharger by means of lump capacitances. Compressor maps were then generated for a range of speeds and temperatures of the exhaust gases at the inlet to turbine and the efficiency drop associated with heat transfer was quantified. Based on the data generated by the model, a new correlation for the compressor non-adiabatic efficiency was found by means of a multiple regression analysis; the work is based on a statistical description of the different parameters that affect the heat transfer model. Keywords: heat transfer, turbocharger, performance, non adiabatic NOMENCLATURE C Absolute velocity [m/s] D External Diameter [m] c p Specific heat of air [J/Kg·K] h Heat coefficient 1 Corresponding author: Ricardo Martinez-Botas, [email protected]| Tel. +44 (0) 20 7594 7241 | Fax: +44 (0) 20 7823 8845
Transcript
HEAT TRANSFER ANALYSIS IN A TURBOCHARGER TURBINE AN
EXPERIMENTAL AND COMPUTATIONAL EVALUATION
A Romagnoli and R Martinez-Botas1
Department of Mechanical Engineering
Imperial College London
SW7 2AZ Exhibition Road
London UK
ABSTRACT
This paper presents the performance of a turbocharger under non-adiabatic conditions
in order to assess the impact of heat transfer A commercial turbocharger was installed on a
20 liter diesel engine and measurements were conducted for a range of engine speeds and
loads The test results enabled to assess the impact of the engine on the temperature
distribution of the bodies constituting the turbocharger quantify the heat fluxes through the
turbocharger and evaluate their effects on the deterioration of compressor performance
A 1-D heat transfer model was also developed and validated against the experimental
measurements The algorithms calculate the heat transferred through the turbocharger by
means of lump capacitances Compressor maps were then generated for a range of speeds and
temperatures of the exhaust gases at the inlet to turbine and the efficiency drop associated
with heat transfer was quantified Based on the data generated by the model a new
correlation for the compressor non-adiabatic efficiency was found by means of a multiple
regression analysis the work is based on a statistical description of the different parameters
that affect the heat transfer model
Keywords heat transfer turbocharger performance non adiabatic
In the past years there has been increased interest and attention on turbochargers
technology driven by engine demand Turbochargers are widely used in diesel engines they
represent a key enabling technology to achieve highly downsized engines for both
compression ignition and spark ignition technology Extensive research on turbochargers
resulted in a significant understanding of their aerodynamic behavior In this manner
optimization of design procedures have been demonstrated closely coupled with the
development of simulation tools Similar efforts have not been employed on the heat transfer
area in turbochargers Clearly as engine developers try to meet stringent demands any
affordable raise in engine efficiency is highly regarded The approach of this paper tries to
contribute yet in a simplified manner to raise the level of the heat transfer analysis Amongst
the main causes that have discouraged efforts on this topic lack of understanding of the heat
effects as well as the high costs associated with testing facilities Although researchers have
shown that heat transfer is not small the compression and expansion process within
turbochargers are still considered to be adiabatic
Rautenberg et al [1] and Rautenberg and Krammer [2] investigated the influence of
heat transfer from the turbine (hot side) to the compressor (cold side) They found that the
heat transferred to the compressor increases the compressor outlet temperature increases the
compressor outlet temperature compared if the compressor was adiabatic Shaaban and
Seume [3] identified the main parameters affecting the deterioration of the compressor
efficiency in hot conditions through a theoretical and experimental investigation The
compressor peripheral Mach number was found to be one of the most important parameters
affecting the turbocharger non-adiabatic performance Shaaban [4] also proposed an
analytical solution for determining the temperature distribution along the bearing housing
taking into account the heat dissipated by free convection to the surroundings the heat
conduction to the bearing housing and the forced convection to the oil The results of this
approach enabled them to determine the exit temperature in the turbine to within plusmn198
Hagelstein et al [5] assumed that the heat transferred during the compression and expansion
process can be neglected without affecting the global result Similarly to Jung et al [6]
Cormerais et al [7] proposed a heat transfer model to determine the temperature difference
between the exhaust and intake manifold This model did not need to be fitted with constants
but only took into account the convective heat transfer within the bearing housing
Seume [3] and Abdelhamid et al [8] measured the turbocharger performance at low
rotational speeds developing a method to predict the turbine and compressor performance in
non-adiabatic conditions Chapman et al [9] developed a finite element analysis of a
turbocharger to determine the heat fluxes going through the main bodies The results of this
analysis showed that the external heat transfer from the turbine is two orders of magnitude
larger than that occurring in the compressor Bohn et al [10] [11] and Heuer et al [12] carried
out an experimental and computational analysis on a turbocharger at different operating
points Beyond the standard measurements to determine the main performance parameters
the surface temperature of the turbine and the compressor casings were measured These
results were set as boundary conditions for a numerical calculation A parametric study was
carried out for different turbine inlet temperatures and mass flow rates The results of the
calculation used a one dimensional Nusselt number that enabled the prediction of heat
transfer within the compressor Although the heat transfer calculation through the proposed
Nusselt number proved to be satisfactory for different operating conditions the analysis did
not lead to good agreement with experimental results when applied to different turbochargers
In order to get a good prediction the Nusselt number had to be fitted with experimental
results for each turbocharger [6] Baines et al [13] proposed a heat transfer network model of
a turbocharger based on tests conducted on three different turbochargers A set of heat
transfer coefficient values was found using conventional convective heat transfer correlations
These coefficients showed to be independent of the turbocharger model and the calculation
of the heat transfer within the turbocharger could be performed with good approximation
2 BACKGROUND AND OBJECTIVES
Aim of this research is to provide an insight into the heat transfer process occurring
within a turbocharger This analysis relies on the results of an experimental and
computational analysis carried out at Imperial College London A commercial turbocharger
was installed on a 20 liter diesel engine and tested for a range of engine speeds and loads
varying from 1000 from to 3000 rpm and 16 Nm to 250 Nm respectively Beyond the
standard measurements necessary to determine the operating points of the compressor and
turbine the turbocharger was instrumented with additional thermocouples measuring the
surface temperatures of the turbine and compressor casings in a number of points The test
results enable to quantify the heat fluxes through the turbocharger and to evaluate their
impact on the compressor performance Based on the experimental results a validated 1-D
heat transfer model was then generated to predict the compressor non-adiabatic efficiency By
doing this it is then possible to assess the compressor non-adiabatic efficiency by mean of
regression analysis Regression analysis is used to predict a continuous dependent variable
from a number of independent variables In engineering it is usually adopted to determine the
coefficients in problems related with forced convection So far a similar approach has not
been used to characterize the turbocharger performance The main benefit of regression
analysis is that the contribution of each parameter can rapidly be quantified Potentially this
could be very useful to turbine designers and software developers in the selection of
turbochargers providing the best compromise in relation to the input parameters However it
must be considered that this method is valid and can be applied as long as experimental data
can be used for model validation
3 NON-ADIABATIC EFFICIENCY
In order to assess the effects of heat transfer on the compressor efficiency in common
with other researchers the non-adiabatic efficiency is introduced [3] This efficiency
represents the apparent compressor efficiency measured under non-adiabatic operating
conditions and it is defined as the ratio between the isentropic and the actual enthalpy rise
ηdiaC differs from the adiabatic efficiency in which the adiabatic enthalpy rise is taken into
account
As reported by Casey et al [14] [15] the use of the isentropic enthalpy rise is not
justified when dealing with heat transfer process A reversible non-adiabatic flow is no longer
isentropic and therefore it is inappropriate to use the isentropic process as the reference of the
ideal work required by a perfect non-adiabatic compressor In the work reported here this
consideration can in some way be bypassed when considering the actual compression process
within the impeller (1rarr2adi) as if it was adiabatic The external heat addition instead can
then be split into two parts the heat added before (qcbefore) and after (qcafter) compression
(Fig1) In this way the initial and the final state of the compression are the same as those of a
complete non-adiabatic process (1rarr2) and hence Eq (1) can be used with no ambiguity2
4 EXPERIMENTAL INVESTIGATION
41 Experimental setup
The following discussion provides essential information on the experimental facility
layout A schematic diagram of engine test rig is shown in Fig 2 while in Fig 3 a general
2 The compressor efficiency in this paper is usually referred as relative efficiency this is defined as the ratio between the compressor peak
efficiency as per the cold map and the efficiencies measured under non-adiabatic conditions
overview of the engine is also given An eddy current dynamometer (Borghi amp Saveri FE260-
S) was used to keep the engine load constant at a desired value The engine was connected to
it via a Universal-Joint (U-J) shaft (Clarke Transmissions TRSZV131001) The dynamometer
was water cooled with water passing inside the stator to dissipate the generated heat The
engine was air cooled by a 30 KW water-to-air heat exchanger (AKG T4) Moreover a
standard air-to-air intercooler with minor modifications was used to cool the air just before
the inlet manifold The engine was operated via an instrumentation rack (Test Automation Ltd
series 2000)
Figure 4 shows the instrumented turbocharger In order to support the thermocouples
on the turbine and compressor casings two semi-circular plates were fixed onto the
turbocharger and ceramic felt and washers were used to avoid conductive effects Once the
turbocharger was installed on the engine two additional frames were added to support the
isothermal connector strips On overall the following measurements were taken
- Inlet and exit air temperature and pressure to the compressor
- Inlet and exit exhaust gas temperature and pressure to the turbine
- Inner and outer casing temperatures of the compressor and turbine
- Surface temperature of the exhaust manifold and bearing housing
- Inlet and exit temperature of the cooling oil
- Air and oil flow rate
- Shaft speed
42 Test conditions setup
The turbocharger under study was tested at constant load points for a range of engine
speeds and loads Measurements were obtained for engine speeds between 1000 and 3000
rpm at a step of 500 rpm for each engine speed the load applied was varied from 16 to 250
Nm The test conditions are summarised in Table 1
43 Experimental results
Surface temperature of the compressor and turbine casing
The inner and outer wall temperatures of the turbine and compressor casings were
measured at the Engine Top and External side for each engine speed and load Table 2
summarises the results for each engine speed From Table 2 it can be seen that the surface
temperatures of the compressor and turbine casings are not uniform they tend to decrease
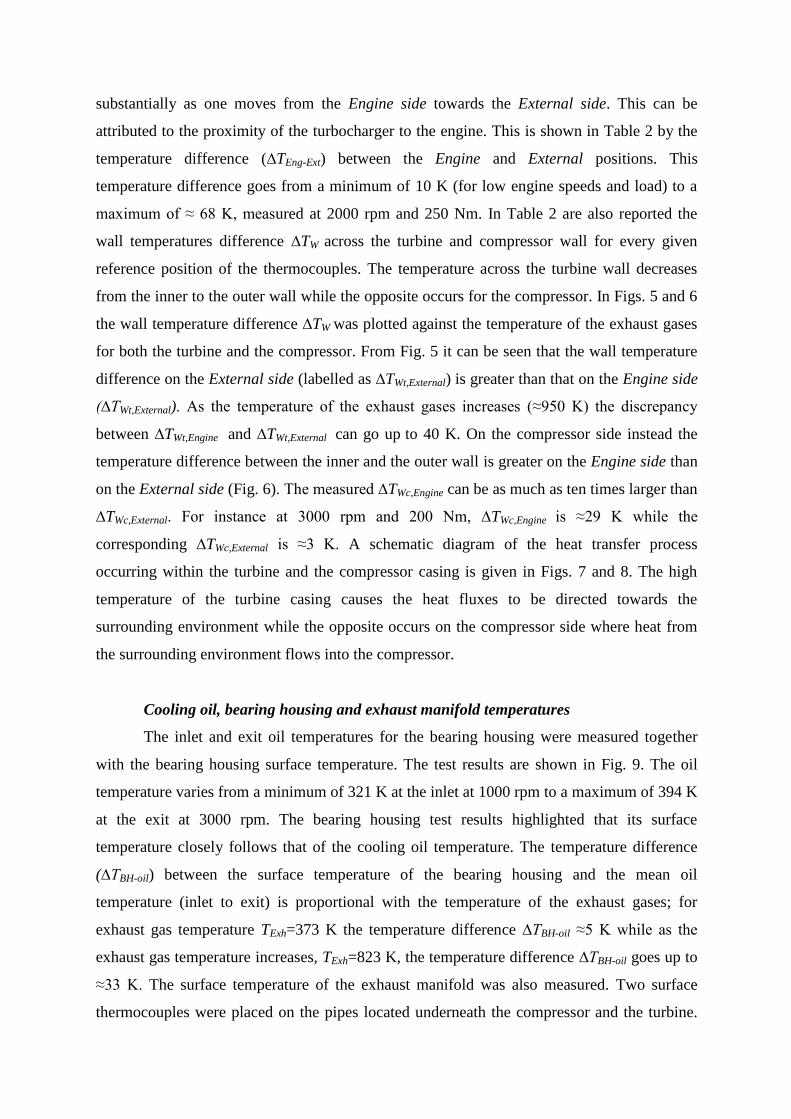
substantially as one moves from the Engine side towards the External side This can be
attributed to the proximity of the turbocharger to the engine This is shown in Table 2 by the
temperature difference (∆TEng-Ext) between the Engine and External positions This
temperature difference goes from a minimum of 10 K (for low engine speeds and load) to a
maximum of asymp 68 K measured at 2000 rpm and 250 Nm In Table 2 are also reported the
wall temperatures difference ∆TW across the turbine and compressor wall for every given
reference position of the thermocouples The temperature across the turbine wall decreases
from the inner to the outer wall while the opposite occurs for the compressor In Figs 5 and 6
the wall temperature difference ∆TW was plotted against the temperature of the exhaust gases
for both the turbine and the compressor From Fig 5 it can be seen that the wall temperature
difference on the External side (labelled as ∆TWtExternal) is greater than that on the Engine side
(∆TWtExternal) As the temperature of the exhaust gases increases (asymp950 K) the discrepancy
between ∆TWtEngine and ∆TWtExternal can go up to 40 K On the compressor side instead the
temperature difference between the inner and the outer wall is greater on the Engine side than
on the External side (Fig 6) The measured ∆TWcEngine can be as much as ten times larger than
∆TWcExternal For instance at 3000 rpm and 200 Nm ∆TWcEngine is asymp29 K while the
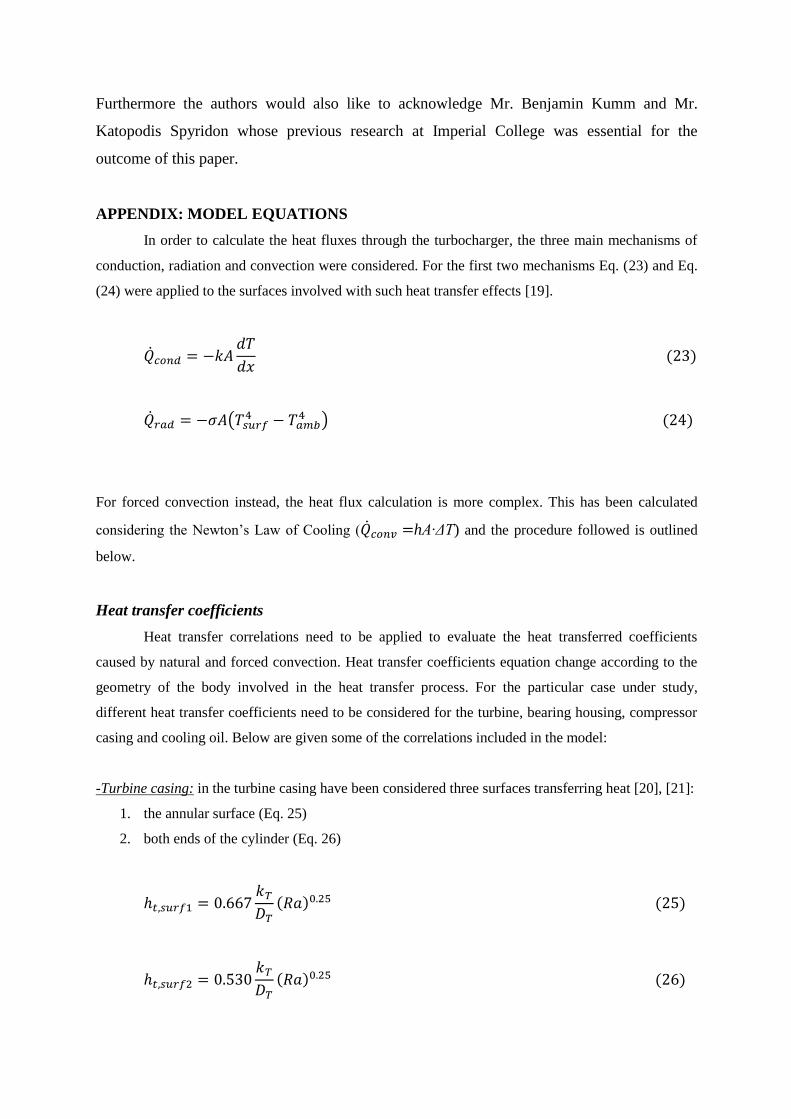
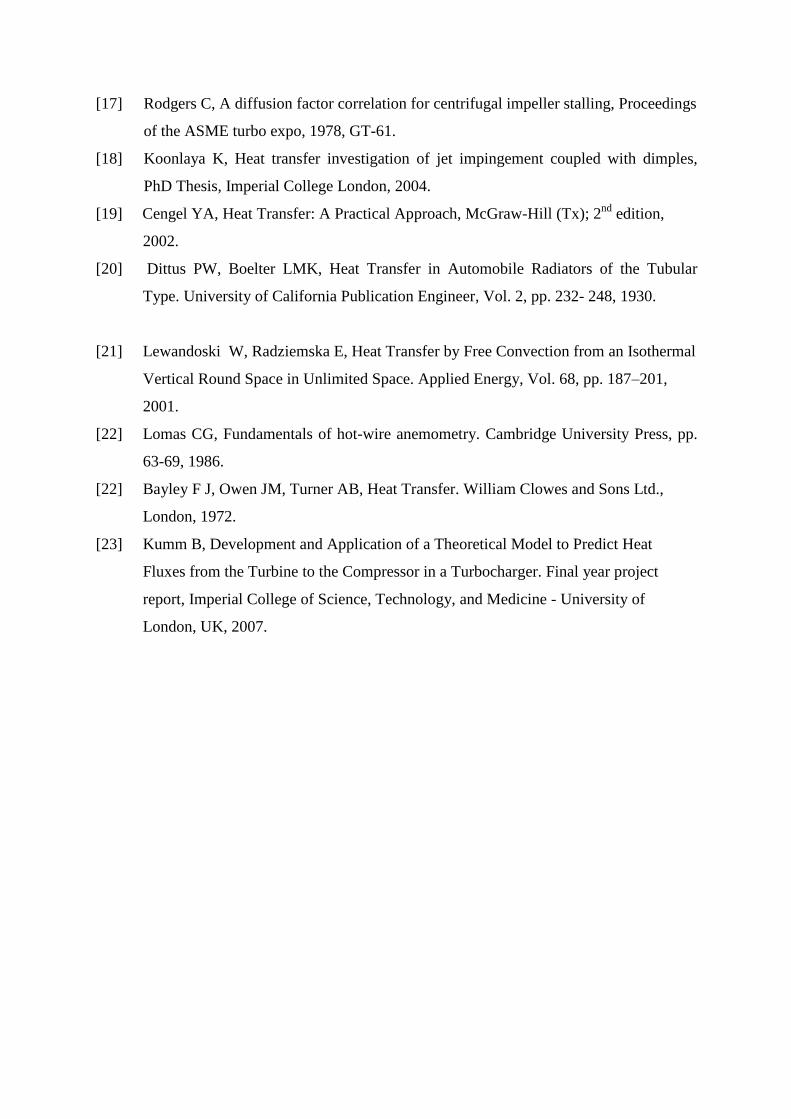
corresponding ∆TWcExternal is asymp3 K A schematic diagram of the heat transfer process
occurring within the turbine and the compressor casing is given in Figs 7 and 8 The high
temperature of the turbine casing causes the heat fluxes to be directed towards the
surrounding environment while the opposite occurs on the compressor side where heat from
the surrounding environment flows into the compressor
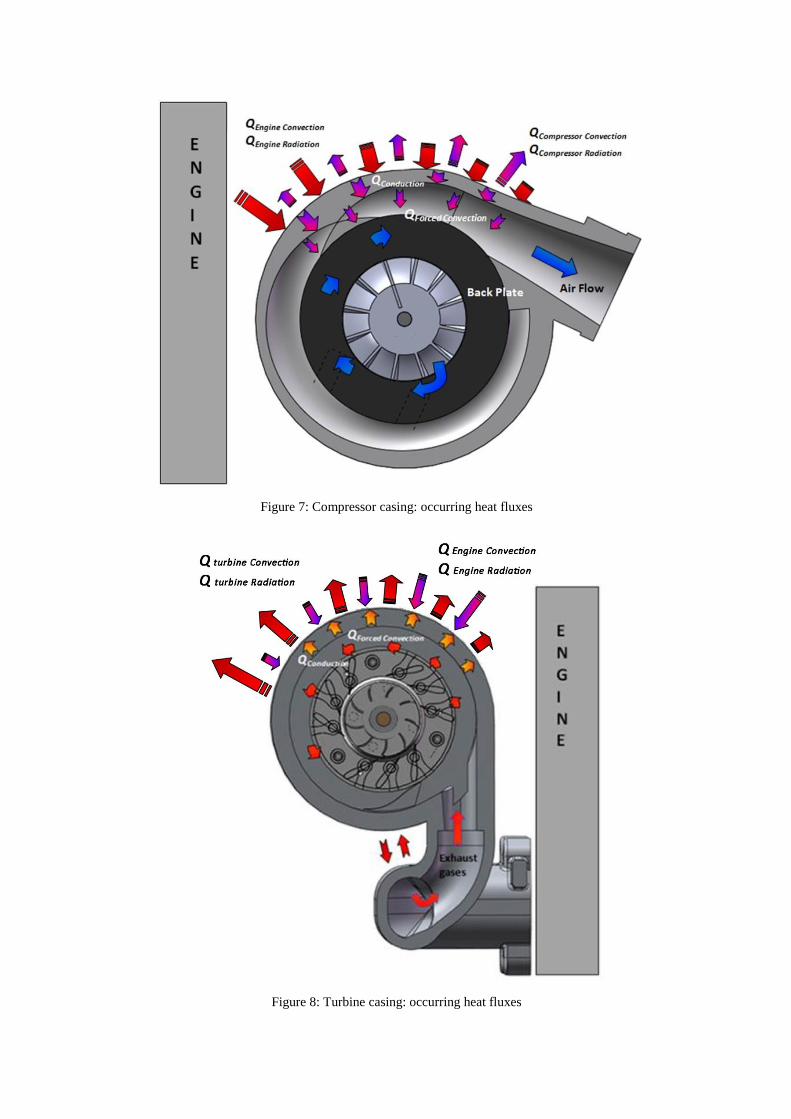
Cooling oil bearing housing and exhaust manifold temperatures
The inlet and exit oil temperatures for the bearing housing were measured together
with the bearing housing surface temperature The test results are shown in Fig 9 The oil
temperature varies from a minimum of 321 K at the inlet at 1000 rpm to a maximum of 394 K
at the exit at 3000 rpm The bearing housing test results highlighted that its surface
temperature closely follows that of the cooling oil temperature The temperature difference
(∆TBH-oil) between the surface temperature of the bearing housing and the mean oil
temperature (inlet to exit) is proportional with the temperature of the exhaust gases for
exhaust gas temperature TExh=373 K the temperature difference ∆TBH-oil asymp5 K while as the
exhaust gas temperature increases TExh=823 K the temperature difference ∆TBH-oil goes up to
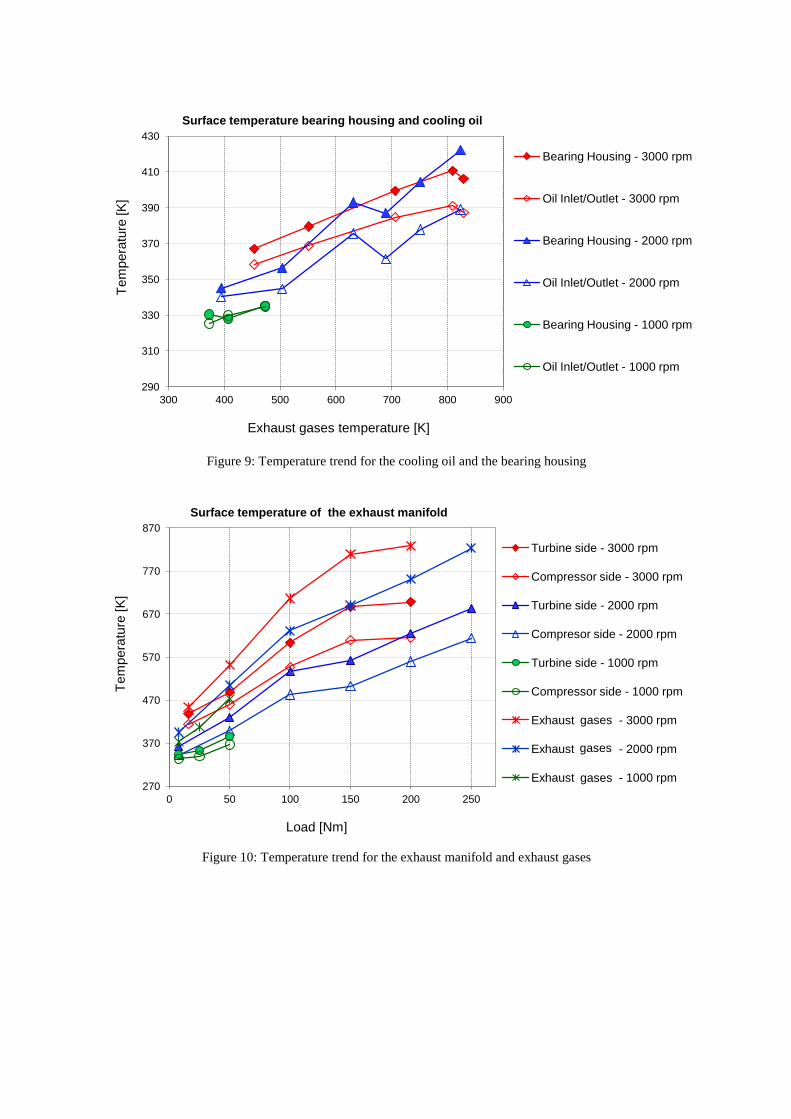
asymp33 K The surface temperature of the exhaust manifold was also measured Two surface
thermocouples were placed on the pipes located underneath the compressor and the turbine
The measured temperatures are shown in Fig 10 together with those of the exhaust gases
From Fig 10 it can be seen that the difference between the surface temperature of the pipe on
the turbine side and that of the exhaust gases varies from a few degrees at low loads up to
around 130 K at higher loads Such a temperature difference is even more severe for the pipe
on the compressor side where a maximum temperature drop of almost 200 K was measured
One of the main challenges in engine calculations is the need to find a correlation for
the compressor exit temperature for different operating conditions This temperature
represents a boundary condition for the combustion analysis in the engine cylinders and hence
if it was possible to establish a unique correlation between the exhaust gases and the
compressor exit temperatures it would then be possible to calculate the compressor non-
adiabatic efficiency A solution to this issue is proposed here
In the standard turbochargers configuration the bearing housing is directly coupled to
the compressor casing through a plate bolted on to the so called compressor back-plate see
Fig 13 If one assumes that all of the heat transferred to the air after compression is
transferred through the compressor back-plate then the plate temperature is equal to the
surface temperature of the bearing housing and Eq (3) becomes
(3)
By solving for T2 one obtains Eq (4)
All the terms of Eq (4) are known except T2 and TBH The former can be derived considering
the non-adiabatic compression process of Fig 1 Here the heat transfer process was simplified
into three paths (1rarr1 1rarr2 2rarr2) In reality only a small amount of heat is transferred
before compression since the incoming air goes through a very short passage (inducer inlet
pipe) Hence the temperature T2 can be assumed to be similar to the temperature T2adi that
would occur if the compression process was fully adiabatic (1rarr2adirarr2) as given in Eq (5)
For TBH instead we can refer to the experimental results of Figs 11 and 12 The exit
temperature to the compressor seems to exhibit a linear trend with the temperature of the
exhaust gases (dashed red line in Fig 12) Such a trend was also observed for the surface
temperature of the bearing housing for which the test measurements showed that TBH and the
temperature of the exhaust gases are linearly related (dashed red line in Fig 11) Therefore
since the temperature of the exhaust gases is known it is possible to correlate the temperature
of the bearing housing to the temperature of the exhaust gases as follows
where grad is the gradient of the trend line By including Eq (5) and Eq (6) into Eq (4)
the exit temperature to the compressor (T2) under non-adiabatic conditions can be
calculated as given in Eq (7)
The outcomes of Eq (7) are shown in Fig 11 in which the measured and the
calculated compressor exit temperatures are reported their absolute deviation is also shown
The overall agreement of the computed temperatures is good over the whole range of test
conditions The absolute deviation between the predicted and measured temperatures is no
bigger than 2-3 Such a deviation remains slightly over the uncertainty range associated
with thermocouples indicated by a dashed black line in the same figure
Compressor non-adiabatic efficiency and exit flow temperature
The measured non-adiabatic compressor performance was compared with that
extrapolated by the cold compressor maps provided by the manufacturer From Fig 12 it can
be noticed that the overall deterioration of the compressor efficiency in hot conditions is
severe over the whole range of temperatures of the exhaust gases This is well shown in
Table 3 where the compressor efficiency in adiabatic and non-adiabatic conditions is given
The absolute relative deviation3 ∆η between the efficiencies goes from a minimum of asymp 17
to a maximum of asymp 30 The scatter of the compressor non-adiabatic efficiencies as the
exhaust gas temperature increases seems to suggest that there is no direct correlation between
the two In fact one would expect that the deterioration of the efficiency increased with an
increase of the exhaust gas temperature at the turbine entry This is not always the case since
the compressor efficiency in non-adiabatic conditions besides being dependent on the
exhaust gas temperature is also affected by other physical properties like the mass flow rate
and the rotational speed
5 HEAT TRANSFER MODEL
This section describes the outcomes of a 1-D heat transfer model The implementation
of heat transfer models for turbochargers involves the quantification of a large number of
parameters that complicates the analysis Here we tried to simplify the approach A detailed
quantification of the heat transfer process within the turbocharger would require a full 3-D
conjugate heat transfer analysis In the model described below the heat fluxes through the
turbocharger were evaluated by means of well known correlations available for heat
conduction radiation and convection The process was validated against experimental data
51 Turbocharger Model
A reduced order turbocharger model developed consisting of an assembly of bodies of
known geometry parameters Such simplified model was obtained by means of progressive
steps firstly a full 3D-CAD model of the turbocharger was developed and then by analysis of
the overall turbocharger configuration the geometry was simplified to an assembly of three
cylindrical bodies representing the turbine the bearing housing and the compressor scroll
(refer to Fig 13-a and b)
Fig 14 shows the cross section of the 1-D model together with the main heat transfer
paths The exhaust gases coming from the combustion flow into the turbine exchange heat
by forced convection to the turbine casing and to the bearing housing (QtrarrBH) Due to the
gradient existing between the inner and outer surface of the turbine casing heat is conducted
through the wall and dissipated by radiation (Qtrad) and free convection (Qtconv) to the
surrounding environment At the same time the air that flows through the rotor expands and
3 Relative deviation defined as
as a consequence the pressure drops and the temperature decreases heat transfer occurs to the
blades and subsequently to the shaft The turbine exit temperature is therefore calculated as
the sum of the temperature drop due to the expansion and the heat transferred to the shaft
(QtrarrS) In the bearing housing the heat is dissipated by forced convection to the oil (QoilrarrBH)
and through free convection (QBHconv) and radiation (QBHrad) to the environment In the shaft
the heat is dissipated only by forced convection to the oil (QSrarroil) note that the heat generated
by friction within the bearing housing is not considered here While the gases expand in the
turbine cold air flows into the compressor The inlet air is heated up by the shaft (QSrarrair) and
compressed in the impeller with a consequent rise in temperature and pressure After the
compression the air flows into the diffuser where the gas is further heated up by forced
convection to the back-plate (Qcrarrair) natural convection (Qcconv) and radiation (Qcrad)
52 Model Flow Chart
Figure 15 provides the flow chart of the model The input parameters for the
turbocharger model are the performance parameters extrapolated by the ldquocoldrdquo maps the oil
flow rate and the temperature of the exhaust gases The control parameter for the whole
calculation is the temperature of the exhaust gases leaving the turbine (T04) In order to start
the calculation an initial assumption on the exit temperature of the exhaust gases (T04) and the
heat added before compression (qcbefore) and expansion (qtbefore) was made With the initial
estimated values of qcbefore and qtbefore the heat fluxes going through the turbocharger can be
evaluated On the basis of the calculation a new evaluation for qcbefore and qtbefore is made
according from the newly computed temperatures These two new values for the heat transfer
are compared with those calculated initially and if the convergence is not satisfied a new
estimation for qcbefore and qtbefore will be made until the convergence is satisfied As with the
heat the exit temperature to the turbine (T04) and the compressor (T02) are calculated and a
comparison is then made between two consecutive values until convergence is satisfied Once
the calculation is converged the non-adiabatic efficiencies are finally computed
53 Model Validation
The simulation results are compared with those obtained through experimental results
Additionally the capability of the model to capture the effects of heat transfer for different
rotational speeds and temperatures of the exhaust gases was also evaluated Four rotational
speeds were selected from the compressor cold maps and input into the model together with
four different temperatures of the exhaust gases The non-adiabatic efficiency maps could
then be generated and the data used for statistical analysis
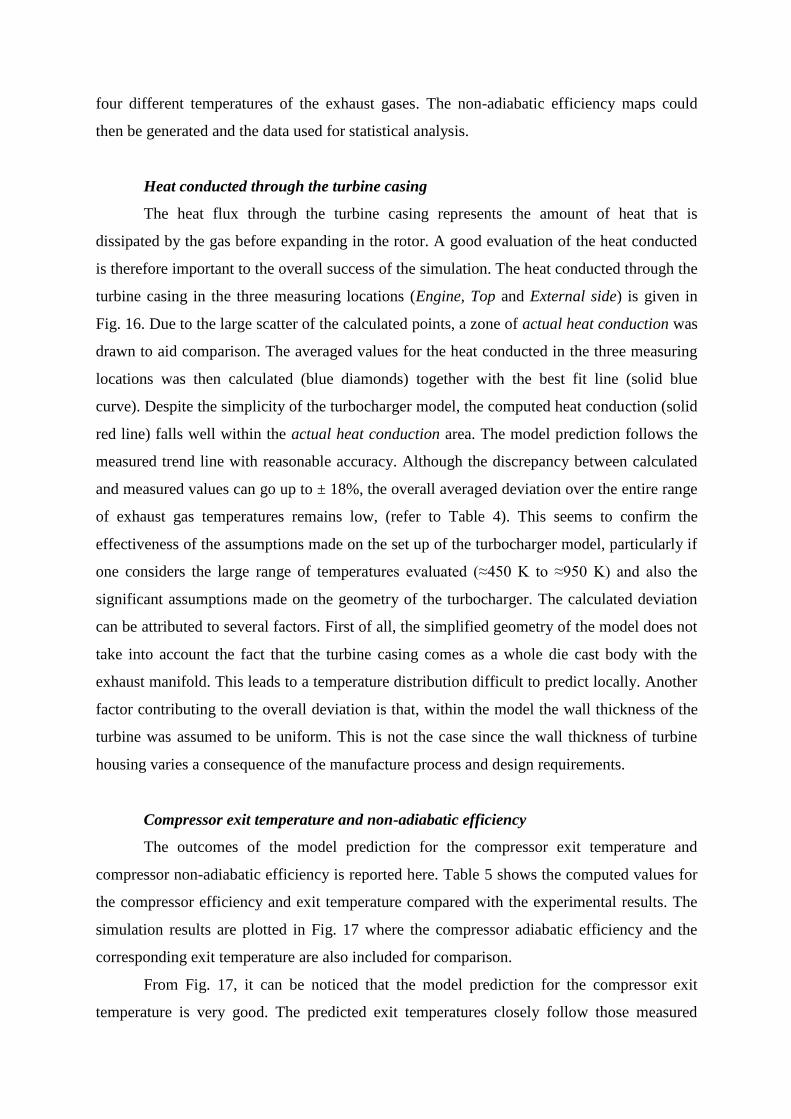
Heat conducted through the turbine casing
The heat flux through the turbine casing represents the amount of heat that is
dissipated by the gas before expanding in the rotor A good evaluation of the heat conducted
is therefore important to the overall success of the simulation The heat conducted through the
turbine casing in the three measuring locations (Engine Top and External side) is given in
Fig 16 Due to the large scatter of the calculated points a zone of actual heat conduction was
drawn to aid comparison The averaged values for the heat conducted in the three measuring
locations was then calculated (blue diamonds) together with the best fit line (solid blue
curve) Despite the simplicity of the turbocharger model the computed heat conduction (solid
red line) falls well within the actual heat conduction area The model prediction follows the
measured trend line with reasonable accuracy Although the discrepancy between calculated
and measured values can go up to plusmn 18 the overall averaged deviation over the entire range
of exhaust gas temperatures remains low (refer to Table 4) This seems to confirm the
effectiveness of the assumptions made on the set up of the turbocharger model particularly if
one considers the large range of temperatures evaluated (asymp450 K to asymp950 K) and also the
significant assumptions made on the geometry of the turbocharger The calculated deviation
can be attributed to several factors First of all the simplified geometry of the model does not
take into account the fact that the turbine casing comes as a whole die cast body with the
exhaust manifold This leads to a temperature distribution difficult to predict locally Another
factor contributing to the overall deviation is that within the model the wall thickness of the
turbine was assumed to be uniform This is not the case since the wall thickness of turbine
housing varies a consequence of the manufacture process and design requirements
Compressor exit temperature and non-adiabatic efficiency
The outcomes of the model prediction for the compressor exit temperature and
compressor non-adiabatic efficiency is reported here Table 5 shows the computed values for
the compressor efficiency and exit temperature compared with the experimental results The
simulation results are plotted in Fig 17 where the compressor adiabatic efficiency and the
corresponding exit temperature are also included for comparison
From Fig 17 it can be noticed that the model prediction for the compressor exit
temperature is very good The predicted exit temperatures closely follow those measured
experimentally with a difference no larger than few degrees The absolute difference (refer to
Table 5) for the predicted exit temperatures is not larger than 5 K and on the overall the
averaged deviation from the experimental data is asymp25 K This is only slightly above the
uncertainty range associated with experimental measurements and it shows the effectiveness
of the assumptions made on the model geometry and the occurring heat fluxes Nevertheless
such a good prediction does not correspond to an equally good prediction for the compressor
efficiency On the efficiency side the model prediction seems to be less accurate than that
exhibited for the temperature The scatter of data of the computed efficiency from that
measured experimentally remains within asymp3 percentage points for most of the operating
conditions considered here This can mainly be attributed to the error propagation associated
with the computed exit temperature that makes the predicted non-adiabatic efficiency to
deviate more from that measured experimentally However on the overall the prediction for
the compressor non-adiabatic efficiency remains within an acceptable range and it enables to
extend our simulation to different operating conditions with good degree of confidence
Model qualitative validation
As the experimental data was obtained on a turbocharger installed on a real engine it
was not possible to control all the turbocharger parameters so as to obtain a wide range of
pressures In order to overcome such a limitation the performance parameters from the
turbocharger cold maps were extrapolated for four different rotational speeds For each of
these the non-adiabatic efficiencies were calculated for five different temperatures of the
exhaust gases as given in Table 6 The outcomes of the model calculation are given in Figs
18 to 21 The compressor non-adiabatic efficiency and the corresponding exit temperatures
are reported against the mass flow rate for each condition of Table 6
From Figs 18 to 21 it can be seen that the efficiency drop associated with increasing
heat transfer is very well captured by the model At high rotational speed the predicted
compressor efficiency does not deviate substantially from that measured in cold conditions
This is clearly seen in Fig 18 where at 1633 revsradicK and TExh=550 K the efficiency drop is
only asymp3 while it goes up to asymp10 for TExh=950 K This is fully consistent with the
experimental findings [4] for which it was found that at high rotational speeds the effects of
heat transfer on compressor performance is negligible The experimental evidence also
showed that as the rotational speed drops to low values the temperature effect becomes
dominant This is also well captured by the model In fact as the temperature increases the
compressor performance decreases consistent with experimental evidence At high rotational
speeds for which the temperature effect on the compressor performance is not important the
predicted non-adiabatic efficiencies do not vary substantially to one another (Figs 18 and 19)
At 550 K the computed exit temperature to the compressor is almost equivalent to that
calculated in adiabatic conditions As the temperature of the exhaust gases increases (550 K
to 950 K) the temperature rise to the compressor varies by only asymp10 K On the contrary at
lower rotational speeds (Figs 20 and 21) the effect of temperature on efficiency is more
relevant and this corresponds to large variation in the compressor performance as the
temperature increases
6 STATISTICAL ANALYSIS
In order to complete the analysis on heat transfer the data generated by the model was
used to assess the compressor non-adiabatic performance by means of a regression analysis
In order to perform the regression analysis the following steps were taken
1 Identify the minimum number of parameters that better describe the compressor
efficiency in non-adiabatic conditions
2 Perform the multiple regression analysis determine the regression coefficients and
evaluate the goodness of fit through the evaluation of conventional fit parameters
3 Discuss the consistency of the regression response with the experimental findings and
assess the capability of the statistical approach for the calculation of the compressor
efficiency
61 Parameters definition
In order to run a statistical analysis a number of significant parameters responding to
Eq (8) must be identified
(8)
where xi are the explanatory variables (independent parameters) and is the response
variable In a compressor map a given point is uniquely defined by a pair of non-dimensional
parameters selected amongst efficiency pressure ratio mass flow and speed For the purpose
of this research the pressure ratio PR and the rotational speed given in terms of Mach number
were selected However a third parameter accounting for the heat transferred to the
compressor must be included in the analysis This was identified in the form of ldquotemperature
parameterrdquo A more detailed description of the parameters can be found below
1 Pressure ratio (PR) in order to determine a point in a conventional compressor map at
least two parameters must be known The pressure ratio was identified as an independent
parameter It is defined as the ratio between the stagnation pressures at the inlet and exit
to the compressor as given in Eq (9)
(9)
2 Mach number (M) this is the local Mach number at the exit to the impeller blade row
The compressor impeller used for the current research has backward swept blades (blade
angle ) and the velocity triangle is given in Fig 22 The ideal case of a
perfectly guided flow for radial blades was also considered here in order to quantify the
effects of blade geometry and slip on the overall compressor performance The absolute
velocities for both the backward swept and radial blade impeller can be calculated as
given in Eq (10) and Eq (11)
(10)
(11)
where is the tangential velocity the meridional component of the absolute
velocity and the slip factor calculated with the Stanitz correlation [16] The Mach
number is then given in Eq (12)
Shabaan et al [3] demonstrated that the parameters that are relevant to the heat transfer
process within a compressor are the peripheral Mach number ( ) the
flow coefficient ( ) the slip factor and the blade angle at the impeller
outlet ( ) It can be demonstrated that the local Mach number M2adi is a function of all
the parameters indicated above and it can be developed to yield to Eq (13)
where
is defined as the work input factor [17] and for and Eq(13) reduces
to the particular case of a perfectly guided radial blade impeller
Eq (13) and Eq (15) were obtained for backward swept (with ) and radial blade
impeller (with ) From Eq (13) it can be seen as M2adi contains the effects of the
main parameters involved in the heat transfer process The benefit of using the local
Mach number is that it reduces the number of variables to be used in a parametric
analysis thus simplifying the calculation of the compressor non-adiabatic performance
3 Temperature parameter (TP) this parameter was introduced in order to take into account
the effects of heat transfer on the compressor efficiency The heat transferred within a
turbocharger is mainly generated by the exhaust gases entering the turbine After
exchanging heat with the turbine housing the flow will then expand in the rotor leaving
the turbine with lower temperature (T04) On the compressor side instead heat from the
turbine to the compressor is mainly transferred through the bearing housing that in turn
will cause a rise in the compressor exit temperature (T02) We can then infer that the exit
temperatures to both the compressor and the turbine are associated with the heat
exchanged within the turbocharger and therefore the ratio between T02 and T04 was
included in the regression analysis as a non- dimensional parameter as given in Eq (16)
62 Multiple regression analysis
After having defined the xi explanatory variables Eq (17) assumes the form
(17)
The general computational problem that needs to be solved in multiple regression analysis is
to fit a line to a number of points In the multivariate case when there is more than one
independent variable the multiple regression procedure will estimate a linear equation of the
form
(18)
The expression in Eq (18) is ready for multiple regression operation with pressure
ratio parameter (PR) which required a logarithmic transformation since a certain skewness
was observed in the plot of residuals
Prior to the multiple regression analysis the single linear regression analysis for each
explanatory variable was performed The results of regression are reported in Table 7 which
contains the essential statistics that help explain the obtained coefficient The squared value
of the Mach number was also included as an additional since the regression response ( ) is
expected to have some curvature given that the compressor efficiency curve usually shows a
parabolic trend
The multiple regression analysis was run with the software ldquoOrigin Ccopy
rdquo [18] the
results for both backward swept and radial blade impeller are provided in Table 8 The final
expression for Eq (18) is given in Eq (19) and Eq (20)
(19)
(20)
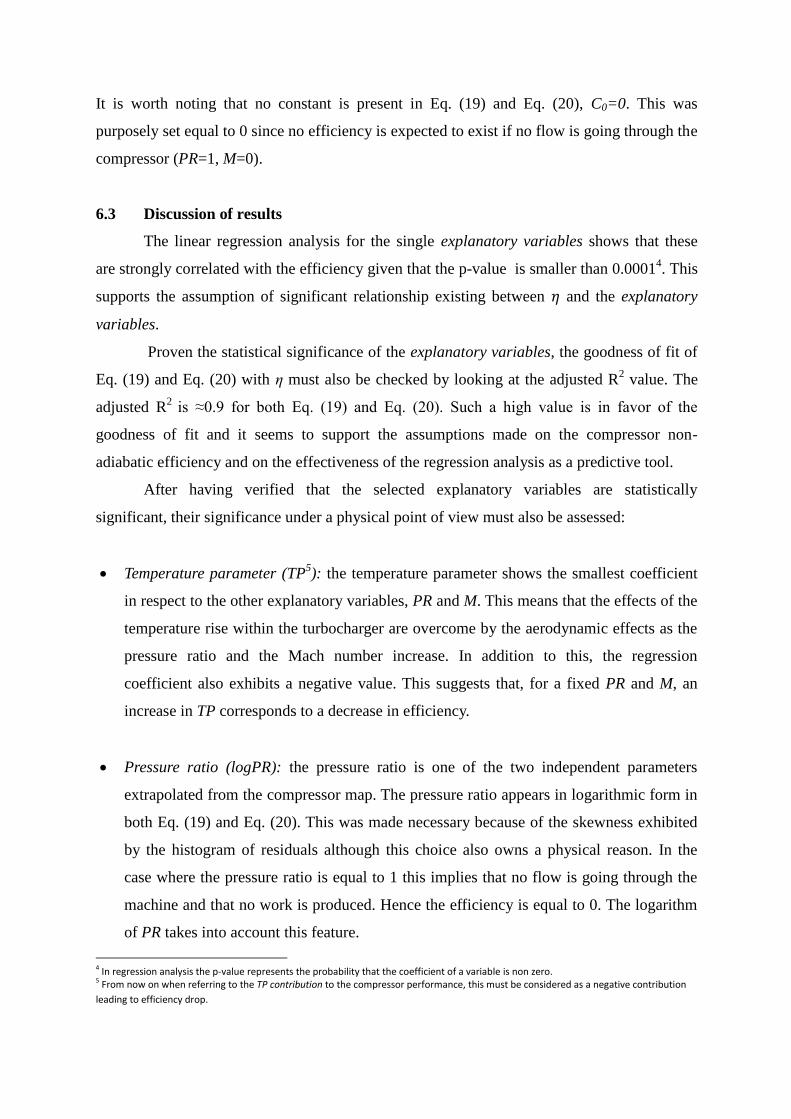
It is worth noting that no constant is present in Eq (19) and Eq (20) C0=0 This was
purposely set equal to 0 since no efficiency is expected to exist if no flow is going through the
compressor (PR=1 M=0)
63 Discussion of results
The linear regression analysis for the single explanatory variables shows that these
are strongly correlated with the efficiency given that the p-value is smaller than 000014 This
supports the assumption of significant relationship existing between and the explanatory
variables
Proven the statistical significance of the explanatory variables the goodness of fit of
Eq (19) and Eq (20) with η must also be checked by looking at the adjusted R2 value The
adjusted R2
is asymp09 for both Eq (19) and Eq (20) Such a high value is in favor of the
goodness of fit and it seems to support the assumptions made on the compressor non-
adiabatic efficiency and on the effectiveness of the regression analysis as a predictive tool
After having verified that the selected explanatory variables are statistically
significant their significance under a physical point of view must also be assessed
Temperature parameter (TP5) the temperature parameter shows the smallest coefficient
in respect to the other explanatory variables PR and M This means that the effects of the
temperature rise within the turbocharger are overcome by the aerodynamic effects as the
pressure ratio and the Mach number increase In addition to this the regression
coefficient also exhibits a negative value This suggests that for a fixed PR and M an
increase in TP corresponds to a decrease in efficiency
Pressure ratio (logPR) the pressure ratio is one of the two independent parameters
extrapolated from the compressor map The pressure ratio appears in logarithmic form in
both Eq (19) and Eq (20) This was made necessary because of the skewness exhibited
by the histogram of residuals although this choice also owns a physical reason In the
case where the pressure ratio is equal to 1 this implies that no flow is going through the
machine and that no work is produced Hence the efficiency is equal to 0 The logarithm
of PR takes into account this feature
4 In regression analysis the p-value represents the probability that the coefficient of a variable is non zero 5 From now on when referring to the TP contribution to the compressor performance this must be considered as a negative contribution
leading to efficiency drop
Mach number (M) this parameter is present both in linear and quadratic form The
regression coefficient for M is the biggest in both Eq (19) and Eq (20) This means that
the compressor performance is strongly dependent on the Mach number and that the
effects of the heat transfer diminish as the rotational speed increases Again this is
consistent with the experimental findings [4] which showed that there is no significant
difference between the adiabatic and the non-adiabatic compressor performance at high
rotational speeds
It must be mentioned that looking at the magnitude of the regression coefficients does not
help to give their real contribution to the overall compressor performance Each term of Eq
(19) and Eq (20) is given by the combination of the regression coefficients and the
explanatory variables Therefore it is necessary to look at the range into which the
explanatory variables vary in order to assess their contribution to the compressor efficiency
Typical values for M logPR and TP are given in Table 9 The explanatory variable M despite
showing a large value of the regression coefficient varies within a small range (05 to 12)
The opposite occurs for the temperature parameter for which the small contribution given by
its regression coefficient is in somehow compensated by a larger value of TP
In Fig 23 a 3-D plot of the contribution (in percentage points) of each parameter to
the compressor non-adiabatic efficiency is given for both the backward swept and radial blade
impeller The Mach number is by far the most significant parameter and its value remains
above 70 for the whole range of speeds and temperatures The temperature parameter TP
decreases with speed while the opposite occurs for PR In Fig 24 this is even more evident
The explanatory variables were plotted against the rotational speed and each point in the plot
represents the average value of the corresponding parameter over the whole range of exhaust
gases temperatures (550 K to 950 K) Although the average is not entirely representative of
the TP values (for which the temperature change has a large impact) this does not largely
affect M and PR From Fig 24 it can be gathered that the Mach number accounts for the
largest portion of the compressor non-adiabatic efficiency Its trend remains fairly constant
across the entire speed range meaning that its weight on the overall compressor efficiency is
almost independent on speed (see Table 10) TP and PR instead represent a smaller portion of
the efficiency TP exhibits a decreasing trend with speed and at high speeds it is no larger than
asymp10 This is more evident in Fig 25 where TP was plotted against temperature for constant
speed lines
In Figs 23 and 24 the effect of geometry on the explanatory variables is also given
For the backward swept blade impeller the contribution of the Mach number Mbs remains
above that of the radial impeller Mr The reason is found in the deviation of the absolute
velocity (C2adi) from the perfectly guided flow conditions and hence in a lower value of the
Mach number (refer to Fig 22) On the other hand the pressure ratio PRr for the backward
swept blade impeller compensates for such a deficit of the Mach number (Mr) and therefore
the calculated values of PRr are bigger than those calculated for the back swept (PRbs) In
Table 10 a quantification of the impact of geometry on the explanatory variables is provided
The Mach number difference goes from asymp3 to asymp6 (in absolute value) as the
speed increases Such a difference is partly compensated by the pressure ratio for which
values of not larger than asymp4 were calculated (in absolute value) No variation instead
was observed for the temperature parameter TP that remains unchanged over the whole range
of speeds This suggests that TP is insensitive to the geometry and it can be readily explained
by looking at the definition of TP in which no geometry parameter is present
64 Geometry effects on heat transfer
The current research was based on the test data available for a single turbocharger
Even though the validity of the analysis remains unaltered this would imply that this analysis
is insensitive to the turbocharger size This is not the case in reality as the heat transfer
occurring within a turbocharger strongly depends on the geometry of the bodies involved in
it In order to quantify what is the impact of geometry on the compressor performance two
parameters were identified as the most significant on heat transfer the compressor casing
diameter (D) and the distance between the compressor and the turbine here defined as
bearing housing length (BHL)
1 Bearing housing length (BHL) heat from the turbine side travels through the bearing
housing towards the compressor This parameter is mainly denoting the space available
for the heat transfer dissipation by convection in the oil bearing assembly
2 Compressor casing diameter (D) the air within the compressor is mainly heated up by
forced convection with the casing The size of the compressor casing is therefore crucial
to determine the surface area available to the flow for heat exchange
A non-dimensional parameter defined as the ratio between BHL and D was then introduced
in the regression analysis
Since no experimental data were available BHL and D were scaled by plusmn15 plusmn30 from
those of the turbocharger previously studied Different values of LD were calculated by
scaling alternatively BHL and D These are reported in Table 11 The first row was obtained
by fixing D to its original value and scaling BHL The opposite was done in the second row
The model was then run for the same range of speeds and temperatures as in Table 6 and the
impact of LD on the compressor efficiency was then assessed The regression equation
including LD is given in Eq (22) By the analysis of Eq (22) it can be inferred that the
impact of geometry on the overall compressor performance is not small The regression
coefficient for BHL is significant if compared to the others and its contribution to the
compressor efficiency ranges between asymp1 and asymp24 as reported in Table 11
(22)
In Fig 26 the variation of LD is plotted against its contribution to the overall efficiency It
can be noticed as the impact of LD on the compressor efficiency increases with LD This
suggests that BHL and D are inversely related to each other An increase in BHL is beneficial
to the compressor efficiency since a lower amount of heat is transferred to the compressor On
the other hand the role played by D on the compressor efficiency is less clear In fact a
decrease in D corresponds to a reduced amount of surface area available to the flow for heat
exchange
7 CONCLUSIONS
This paper reported the outcomes of the investigation on heat transfer in
turbochargers The turbocharger under study was tested at constant load points for a range of
engine speeds Measurements were obtained for engine speeds between 1000 and 3000 rpm at
a step of 500 rpm for each engine speed the load applied was varied from 16 to 250 Nm The
surface temperatures of three main bodies constituting the turbocharger (turbine and
compressor casing bearing housing) were measured in 17 stations
The test results showed that the engine has a large impact on surface temperature of
the turbine and compressor casing and also that the surface temperatures of both the turbine
and the compressor vary linearly with the temperature of the exhaust gases A temperature
gradient was also measured between the inner and the outer wall on the turbine side this
moves outward while the opposite occurs for the compressor The surface temperature of the
bearing housing was found to vary consistently with that of the cooling oil with a
temperature difference of about asymp30 K Similar trend to that of the bearing housing and the oil
was found for the surface temperature of the exhaust manifold with a temperature difference
of up to asymp130K on the turbine side The compressor non-adiabatic efficiency was also
evaluated the deviation from that measured under adiabatic conditions goes from 17 to
30 as the rotational speed and air flow rate decreases Based on the experimental results an
experimental correlation linking the compressor exit temperature with the exhaust gas
temperature was proposed the calculated temperature was found to agree well with the
experimental results with a discrepancy no larger than 3
A 1-D model of the turbocharger was developed and validated against the
experimental results The validation against test results showed that the trend of the heat
transferred through the turbine casing is well captured the compressor exit temperature could
be predicted with an uncertainty no greater than 5 K while an averaged deviation of about 3
was found for the compressor non-adiabatic efficiency
Based on the maps generated by the model a multiple regression analysis was carried
out for the compressor non-adiabatic efficiency In this analysis the following explanatory
variables were chosen absolute compressor exit Mach number (M2adi) the compression ratio
(PR) and the temperature parameter (TP) The high values of the adjusted R2asymp 09 showed
that the compressor non-adiabatic efficiency can be fitted with good degree of approximation
by means of the selected parameters The Mach number was found to contribute for asymp80 of
the overall efficiency the temperature parameter for asymp20 while the pressure ratio only few
percentage points The impact of the geometry on the compressor non-adiabatic efficiency
was also assessed this was found to account for about asymp2 of the overall compressor
efficiency
ACKNOWLEDGEMENTS
The authors would like to acknowledge Ricardo plc Ford Motor Company Ltd and
University of Brighton This consortium along with Imperial College is part of a funded
program (TSB-UK) named VERTIGO (Virtual Emission Research Tools and Integration)
Furthermore the authors would also like to acknowledge Mr Benjamin Kumm and Mr
Katopodis Spyridon whose previous research at Imperial College was essential for the
outcome of this paper
APPENDIX MODEL EQUATIONS
In order to calculate the heat fluxes through the turbocharger the three main mechanisms of
conduction radiation and convection were considered For the first two mechanisms Eq (23) and Eq
(24) were applied to the surfaces involved with such heat transfer effects [19]
For forced convection instead the heat flux calculation is more complex This has been calculated
considering the Newtonrsquos Law of Cooling ( hAmiddotΔT) and the procedure followed is outlined
below
Heat transfer coefficients
Heat transfer correlations need to be applied to evaluate the heat transferred coefficients
caused by natural and forced convection Heat transfer coefficients equation change according to the
geometry of the body involved in the heat transfer process For the particular case under study
different heat transfer coefficients need to be considered for the turbine bearing housing compressor
casing and cooling oil Below are given some of the correlations included in the model
-Turbine casing in the turbine casing have been considered three surfaces transferring heat [20] [21]
1 the annular surface (Eq 25)
2 both ends of the cylinder (Eq 26)
-Bearing housing surface the heat transfer on the bearing housing is similar to that on the annular
surface of the turbine casing with the main difference that unlike the turbine casing (where the surface
was treated as isothermal) the heat transfer coefficient in the bearing housing varies in the axial
direction [22]
-Compressor casing the compressor casing was modeled as a disc (in the paper referred as
compressor Back-Plate) with the internal diameter equal to the external diameter of the bearing
housing The temperature was assumed to vary only along the radius Similarly to the turbine round
plate the same correlation for the Nusselt number and the heat transfer coefficient was included in the
model6
-Compressor and turbine on the inside of the compressor and turbine volute there is significant
forced convection The volute is modelled as a straight pipe and the heat transfer coefficient can be
calculated from the Nusselt number when D2 is chosen for the characteristic length
Temperature distribution and heat fluxes calculation
The next step involved is the evaluation of the temperature distributions in the turbine casing
the shaft the bearing housing and the compressor casing For reasons of space only the shaft case will
be provided here [23]
-Shaft The radial variation of the temperature was omitted since the shaft has a small diameter and
high thermal conductivity hence the temperature difference along the radius is lower than the axial
temperature variation In addition to this the internal energy was considered to be constant since the
model was developed as steady state The energy balance for an infinitesimal element of the shaft then
simplifies to Eq (29) and it is shown in Fig 27
(29)
Please note that the y direction in the Eq (27) was introduced to show that the compressor back-plate is normal to the axial direction of
the turbocharger The addition of an extra frame of reference might lead the reader to consider the model solution as a 2-D problem This is
not the case as the heat transfer model remains unaltered and it lies on the assumption of 1-D analysis
The term can be expressed by use of the Taylor and the heat transferred to the oil ( and
the axial derivative of the conductive heat flux can be rewritten by mean of Fourierrsquos law This leads
to Eq (30) for the axial distribution of heat along the shaft
To solve this differential equation of second order two boundary conditions have to be provided A
similar approach was followed for the other parts constituting the turbocharger model Two main
assumptions were made The first is that the the effective temperature of the gas corresponds to the
average temperature at the inlet and the exit to the rotor while the second is that the heat transfer
coefficients n both ends of the shaft is assumed to be equal to those of the turbine (x=LS) and the
compressor (x=0) The final amount of heat delivered by the shaft to the air is then given in Eq (31)
REFERENCES
[1] Rautenberg M Mobarak A Malobabic M Influence of heat transfer between turbine
and compressor on the performance of small turbochargers Int Gas Turbine
Congress 1983 IGTC-73
[2] Rautenberg M Krammer N On the thermodynamics of non-adiabatic compression
and expansion processes in turbomachines 1984 Proceedings of the 5th
International
Conference for Mechanical Power Engineering Cairo
[3] Shaaban S Seume JR Analysis of turbocharger non-adiabatic performance 2006
Proceedings of the 8th
international conference on turbochargers and Turbocharging
London C647027
[4] Shaaban S Experimental investigation and extended simulation of turbocharger non-
adiabatic performance PhD Thesis University of Hannover 2004
[5] Hagelstein D Beyer B Seume JR Rautenberg M Heuristical view on the non-
adiabatic coupling system of combustion engine and turbocharger 2002 Proceedings
of the 7th
International conference on turbochargers and turbocharging London
C602015
[6] Jung M Ford R Glover K Collings N Christen U Watts M Parameterization and
transient validation of a variable geometry turbocharger for mean-value modeling at
low and medium speed-load points SAE Powertrain and fluid systems conference
San Diego 2002 SAE 2002-01-2729
[7] Cormerais M Hetet JF Chesse P Maiboom A Heat transfer analysis in a
turbocharger compressor Modeling and experiments SAE world congress Detroit
2006 SAE 2006-01-0023
[8] Abdelhamid S Berndt R Grigoriadis P Hagelstein D Nickel J Pucher H Seume JR
Advanced presentation and extrapolation of turbocharger maps as a boundary
condition of the engine process simulation 2003 Stuttgart international symposium
on motor vehicles and engines Stuttgart
[9] Chapman KS Nguru R Shultz J Simplified methodology to correct turbocharger
field measurements for heat transfer and other effects Final Report for gas research
institute 2002 GRI-020156
[10] Bohn D Heuer T Kusterer K Conjugate flow and heat transfer investigation of a
turbocharger Part i - numerical results Proceedings of ASME turbo expo Atlanta
2003 GT2003-38445
[11] Bohn D Moritz N Wolff M Conjugate flow and heat transfer investigation of a turbo
charger Part ii - experimental results Proceedings of ASME turbo expo Atlanta
2003 GT-2003-38849
[12] Heuer T Engels B Wollscheid P Thermomechanical analysis of a turbocharger based
on conjugate heat transfer Proceedings of ASME turbo expo Reno-Tahoe (Nevada)
2005 GT 2005-68059
[13] Baines N Wygant KD Antonis D The analysis of heat transfer in automotive
turbochargers Proceedings of the ASME turbo expo Orlando 2009 GT2009-59353
[14] Casey MV Schlegel M Performance estimation of turbocharger compressor at low
pressure ratios Institute of thermal turbomachinery (ITSM) University of Stuttgart
2008
[15] Casey MV Fesich TM On the efficiency of compressors with adiabatic flows
Proceedings of the ASME turbo expo Orlando 2009 GT 2009-59015
[16] Stanitz JD Some theoretical aerodynamic investigations of impellers in radial and
mixed flow centrifugal compressors Proceedings of the ASME turbo expo 1952 pp
74- 473
[17] Rodgers C A diffusion factor correlation for centrifugal impeller stalling Proceedings
of the ASME turbo expo 1978 GT-61
[18] Koonlaya K Heat transfer investigation of jet impingement coupled with dimples
PhD Thesis Imperial College London 2004
[19] Cengel YA Heat Transfer A Practical Approach McGraw-Hill (Tx) 2nd
edition
2002
[20] Dittus PW Boelter LMK Heat Transfer in Automobile Radiators of the Tubular
Type University of California Publication Engineer Vol 2 pp 232- 248 1930
[21] Lewandoski W Radziemska E Heat Transfer by Free Convection from an Isothermal
Vertical Round Space in Unlimited Space Applied Energy Vol 68 pp 187ndash201
2001
[22] Lomas CG Fundamentals of hot-wire anemometry Cambridge University Press pp
63-69 1986
[22] Bayley F J Owen JM Turner AB Heat Transfer William Clowes and Sons Ltd
London 1972
[23] Kumm B Development and Application of a Theoretical Model to Predict Heat
Fluxes from the Turbine to the Compressor in a Turbocharger Final year project
report Imperial College of Science Technology and Medicine - University of
London UK 2007
FIGURES
Figure 1 Compression diagram
Figure 2 Test rig layout (Kyartos 2006)
Figure 3 Test rig overview (Kyartos 2006)
Figure 4 Instrumented turbocharger
EXTERNAL SIDE
TOP
ENGINE SIDE
Oil Inlet Temperature
Oil Exit Temperature
Turbine Side Temp Exh Manifold
Compressor Side Temp Exh Manifold
Speed Sensor
Oil Flow Sensor
Figure 5 Turbine casing inner - outer wall temperature difference in the three locations
Engine Top and External side
Figure 6 Compressor casing outer - inner wall temperature difference in the three locations
Engine Top and External side
0
10
20
30
40
50
60
70
300 400 500 600 700 800 900 1000
∆T
wt [K
]
Exhaust gases temperature [K]
Turbine casing temperature difference between inner and outer wall
∆TwtEngine
∆TwtTop
∆TwtExternal
asymp40 K
∆Twt= Twinner-Twouter
0
5
10
15
20
25
30
35
250 350 450 550 650 750 850 950 1050
∆T
wc [K
]
Exhaust gases temperature [K]
Compressor casing temperature difference between outer and inner wall
∆TwcEngine
∆TwcTop
∆TwcExternal
asymp29 K
∆Twc= abs(Twcinner-Twciouter)
Figure 7 Compressor casing occurring heat fluxes
Figure 8 Turbine casing occurring heat fluxes
Figure 9 Temperature trend for the cooling oil and the bearing housing
Figure 10 Temperature trend for the exhaust manifold and exhaust gases
290
310
330
350
370
390
410
430
300 400 500 600 700 800 900
Tem
pera
ture
[K
]
Exhaust gases temperature [K]
Surface temperature bearing housing and cooling oil
Bearing Housing - 3000 rpm
Oil InletOutlet - 3000 rpm
Bearing Housing - 2000 rpm
Oil InletOutlet - 2000 rpm
Bearing Housing - 1000 rpm
Oil InletOutlet - 1000 rpm
270
370
470
570
670
770
870
0 50 100 150 200 250
Tem
pera
ture
[K
]
Load [Nm]
Surface temperature of the exhaust manifold
Turbine side - 3000 rpm
Compressor side - 3000 rpm
Turbine side - 2000 rpm
Compresor side - 2000 rpm
Turbine side - 1000 rpm
Compressor side - 1000 rpm
Exhaust gasses - 3000 rpm
Exhaust gasses - 2000 rpm
Exhaust gasses - 1000 rpm
gases
gases
gases
Figure 11 Compressor exit temperature
Figure 12 Adiabatic vs non-adiabatic compressor efficiency and exit temperature
0
3
6
9
12
15
18
21
24
273
293
313
333
353
373
393
413
433
453
360 560 760 960
Devia
tion [
]
Tem
pera
ture
[K
]
Exhaust gases temperature [K]
Prediction compressor exit temperature
Measured Compressor Exit Temperature
Predicted Compressor Exit Temperature
Surface Temperature Bearing Housing
Deviation
Measurements Uncertainty plusmn 15degC
300
350
400
450
500
00
01
02
03
04
05
06
07
08
09
10
500 600 700 800 900 1000
Com
pre
ssor
exit t
em
pera
ture
[K
]
Com
pre
ssor
rela
tive e
ffic
iency
ηc
Exhaust gases temperature [K]
Comparison adiabatic vs non-adiabatic compressor efficiency and exit temperature
Adiabatic efficiency
Non adiabatic efficiency
Adiabatic exit temperature
Non adiabatic exit temperature
Figure 13 Physical Model - A Real model of the turbocharger - B Simplified geometry included in the 1-D
Table 11 LD values for different combination of BHL and D
Variable +15 -15 +30 -30
BHL (Dfixed) LD=0 43
ηvar asymp 18
LD=031
ηvar asymp13
LD=048
ηvar asymp19
LD=026
ηvar asymp10
D (BHLfixed) LD=032
ηvar asymp132
LD=044
ηvar asymp18
LD=028
ηvar asymp10
LD=053
ηvar asymp24
L Length [m]
k Thermal conductivity [WmK]
M Mach number
Mu Peripheral Mach number
MFP Mass flow parameter [(Kgs)middotradicKPa]
Mass flow rate [Kgs]
N Pseudo-dimensional speed [revsmiddotradicK]
Nu Nusselt number
PR Pressure ratio
rpm Revolution per minute [revmin]
q Specific amount of heat transfer [JKg]
Heat flux [Js]
R Universal gas constant [JKmol]
Ra Rayleigh number
T Temperature [K]
U Blade speed [ms]
x Axial direction Explanatory variable
GREEKS
γ Ratio of specific heat
η Efficiency
σ Boltzmann constant [JK]
μ Slip factor
ρ Density [Kgm3]
Flow coefficient
θ Tangential component
NUMBERS
0 Total conditions
1 Inlet to the compressor
1 Inlet to the impeller
2 Exit to the compressor
2 Exit to the compressor impeller
4 Exit to the turbine
SUBSCRIPTS
adi Adiabatic
after State after compression or expansion
B Blade
BH Bearing Housing
BP Back-plate
before State before compression or expansion
bs Back-swept
c Compressor
conv Convection
cond Conduction
dia Non-adiabatic
Exh Exhaust
fc Forced convection
is isentropic
m Meridional
r Radial
rad Radiation
S Shaft
surf Surface
t Turbine
W Wall
Wc Wall compressor
Wt Wall turbine
INTRODUCTION
In the past years there has been increased interest and attention on turbochargers
technology driven by engine demand Turbochargers are widely used in diesel engines they
represent a key enabling technology to achieve highly downsized engines for both
compression ignition and spark ignition technology Extensive research on turbochargers
resulted in a significant understanding of their aerodynamic behavior In this manner
optimization of design procedures have been demonstrated closely coupled with the
development of simulation tools Similar efforts have not been employed on the heat transfer
area in turbochargers Clearly as engine developers try to meet stringent demands any
affordable raise in engine efficiency is highly regarded The approach of this paper tries to
contribute yet in a simplified manner to raise the level of the heat transfer analysis Amongst
the main causes that have discouraged efforts on this topic lack of understanding of the heat
effects as well as the high costs associated with testing facilities Although researchers have
shown that heat transfer is not small the compression and expansion process within
turbochargers are still considered to be adiabatic
Rautenberg et al [1] and Rautenberg and Krammer [2] investigated the influence of
heat transfer from the turbine (hot side) to the compressor (cold side) They found that the
heat transferred to the compressor increases the compressor outlet temperature increases the
compressor outlet temperature compared if the compressor was adiabatic Shaaban and
Seume [3] identified the main parameters affecting the deterioration of the compressor
efficiency in hot conditions through a theoretical and experimental investigation The
compressor peripheral Mach number was found to be one of the most important parameters
affecting the turbocharger non-adiabatic performance Shaaban [4] also proposed an
analytical solution for determining the temperature distribution along the bearing housing
taking into account the heat dissipated by free convection to the surroundings the heat
conduction to the bearing housing and the forced convection to the oil The results of this
approach enabled them to determine the exit temperature in the turbine to within plusmn198
Hagelstein et al [5] assumed that the heat transferred during the compression and expansion
process can be neglected without affecting the global result Similarly to Jung et al [6]
Cormerais et al [7] proposed a heat transfer model to determine the temperature difference
between the exhaust and intake manifold This model did not need to be fitted with constants
but only took into account the convective heat transfer within the bearing housing
Seume [3] and Abdelhamid et al [8] measured the turbocharger performance at low
rotational speeds developing a method to predict the turbine and compressor performance in
non-adiabatic conditions Chapman et al [9] developed a finite element analysis of a
turbocharger to determine the heat fluxes going through the main bodies The results of this
analysis showed that the external heat transfer from the turbine is two orders of magnitude
larger than that occurring in the compressor Bohn et al [10] [11] and Heuer et al [12] carried
out an experimental and computational analysis on a turbocharger at different operating
points Beyond the standard measurements to determine the main performance parameters
the surface temperature of the turbine and the compressor casings were measured These
results were set as boundary conditions for a numerical calculation A parametric study was
carried out for different turbine inlet temperatures and mass flow rates The results of the
calculation used a one dimensional Nusselt number that enabled the prediction of heat
transfer within the compressor Although the heat transfer calculation through the proposed
Nusselt number proved to be satisfactory for different operating conditions the analysis did
not lead to good agreement with experimental results when applied to different turbochargers
In order to get a good prediction the Nusselt number had to be fitted with experimental
results for each turbocharger [6] Baines et al [13] proposed a heat transfer network model of
a turbocharger based on tests conducted on three different turbochargers A set of heat
transfer coefficient values was found using conventional convective heat transfer correlations
These coefficients showed to be independent of the turbocharger model and the calculation
of the heat transfer within the turbocharger could be performed with good approximation
2 BACKGROUND AND OBJECTIVES
Aim of this research is to provide an insight into the heat transfer process occurring
within a turbocharger This analysis relies on the results of an experimental and
computational analysis carried out at Imperial College London A commercial turbocharger
was installed on a 20 liter diesel engine and tested for a range of engine speeds and loads
varying from 1000 from to 3000 rpm and 16 Nm to 250 Nm respectively Beyond the
standard measurements necessary to determine the operating points of the compressor and
turbine the turbocharger was instrumented with additional thermocouples measuring the
surface temperatures of the turbine and compressor casings in a number of points The test
results enable to quantify the heat fluxes through the turbocharger and to evaluate their
impact on the compressor performance Based on the experimental results a validated 1-D
heat transfer model was then generated to predict the compressor non-adiabatic efficiency By
doing this it is then possible to assess the compressor non-adiabatic efficiency by mean of
regression analysis Regression analysis is used to predict a continuous dependent variable
from a number of independent variables In engineering it is usually adopted to determine the
coefficients in problems related with forced convection So far a similar approach has not
been used to characterize the turbocharger performance The main benefit of regression
analysis is that the contribution of each parameter can rapidly be quantified Potentially this
could be very useful to turbine designers and software developers in the selection of
turbochargers providing the best compromise in relation to the input parameters However it
must be considered that this method is valid and can be applied as long as experimental data
can be used for model validation
3 NON-ADIABATIC EFFICIENCY
In order to assess the effects of heat transfer on the compressor efficiency in common
with other researchers the non-adiabatic efficiency is introduced [3] This efficiency
represents the apparent compressor efficiency measured under non-adiabatic operating
conditions and it is defined as the ratio between the isentropic and the actual enthalpy rise
ηdiaC differs from the adiabatic efficiency in which the adiabatic enthalpy rise is taken into
account
As reported by Casey et al [14] [15] the use of the isentropic enthalpy rise is not
justified when dealing with heat transfer process A reversible non-adiabatic flow is no longer
isentropic and therefore it is inappropriate to use the isentropic process as the reference of the
ideal work required by a perfect non-adiabatic compressor In the work reported here this
consideration can in some way be bypassed when considering the actual compression process
within the impeller (1rarr2adi) as if it was adiabatic The external heat addition instead can
then be split into two parts the heat added before (qcbefore) and after (qcafter) compression
(Fig1) In this way the initial and the final state of the compression are the same as those of a
complete non-adiabatic process (1rarr2) and hence Eq (1) can be used with no ambiguity2
4 EXPERIMENTAL INVESTIGATION
41 Experimental setup
The following discussion provides essential information on the experimental facility
layout A schematic diagram of engine test rig is shown in Fig 2 while in Fig 3 a general
2 The compressor efficiency in this paper is usually referred as relative efficiency this is defined as the ratio between the compressor peak
efficiency as per the cold map and the efficiencies measured under non-adiabatic conditions
overview of the engine is also given An eddy current dynamometer (Borghi amp Saveri FE260-
S) was used to keep the engine load constant at a desired value The engine was connected to
it via a Universal-Joint (U-J) shaft (Clarke Transmissions TRSZV131001) The dynamometer
was water cooled with water passing inside the stator to dissipate the generated heat The
engine was air cooled by a 30 KW water-to-air heat exchanger (AKG T4) Moreover a
standard air-to-air intercooler with minor modifications was used to cool the air just before
the inlet manifold The engine was operated via an instrumentation rack (Test Automation Ltd
series 2000)
Figure 4 shows the instrumented turbocharger In order to support the thermocouples
on the turbine and compressor casings two semi-circular plates were fixed onto the
turbocharger and ceramic felt and washers were used to avoid conductive effects Once the
turbocharger was installed on the engine two additional frames were added to support the
isothermal connector strips On overall the following measurements were taken
- Inlet and exit air temperature and pressure to the compressor
- Inlet and exit exhaust gas temperature and pressure to the turbine
- Inner and outer casing temperatures of the compressor and turbine
- Surface temperature of the exhaust manifold and bearing housing
- Inlet and exit temperature of the cooling oil
- Air and oil flow rate
- Shaft speed
42 Test conditions setup
The turbocharger under study was tested at constant load points for a range of engine
speeds and loads Measurements were obtained for engine speeds between 1000 and 3000
rpm at a step of 500 rpm for each engine speed the load applied was varied from 16 to 250
Nm The test conditions are summarised in Table 1
43 Experimental results
Surface temperature of the compressor and turbine casing
The inner and outer wall temperatures of the turbine and compressor casings were
measured at the Engine Top and External side for each engine speed and load Table 2
summarises the results for each engine speed From Table 2 it can be seen that the surface
temperatures of the compressor and turbine casings are not uniform they tend to decrease
substantially as one moves from the Engine side towards the External side This can be
attributed to the proximity of the turbocharger to the engine This is shown in Table 2 by the
temperature difference (∆TEng-Ext) between the Engine and External positions This
temperature difference goes from a minimum of 10 K (for low engine speeds and load) to a
maximum of asymp 68 K measured at 2000 rpm and 250 Nm In Table 2 are also reported the
wall temperatures difference ∆TW across the turbine and compressor wall for every given
reference position of the thermocouples The temperature across the turbine wall decreases
from the inner to the outer wall while the opposite occurs for the compressor In Figs 5 and 6
the wall temperature difference ∆TW was plotted against the temperature of the exhaust gases
for both the turbine and the compressor From Fig 5 it can be seen that the wall temperature
difference on the External side (labelled as ∆TWtExternal) is greater than that on the Engine side
(∆TWtExternal) As the temperature of the exhaust gases increases (asymp950 K) the discrepancy
between ∆TWtEngine and ∆TWtExternal can go up to 40 K On the compressor side instead the
temperature difference between the inner and the outer wall is greater on the Engine side than
on the External side (Fig 6) The measured ∆TWcEngine can be as much as ten times larger than
∆TWcExternal For instance at 3000 rpm and 200 Nm ∆TWcEngine is asymp29 K while the
corresponding ∆TWcExternal is asymp3 K A schematic diagram of the heat transfer process
occurring within the turbine and the compressor casing is given in Figs 7 and 8 The high
temperature of the turbine casing causes the heat fluxes to be directed towards the
surrounding environment while the opposite occurs on the compressor side where heat from
the surrounding environment flows into the compressor
Cooling oil bearing housing and exhaust manifold temperatures
The inlet and exit oil temperatures for the bearing housing were measured together
with the bearing housing surface temperature The test results are shown in Fig 9 The oil
temperature varies from a minimum of 321 K at the inlet at 1000 rpm to a maximum of 394 K
at the exit at 3000 rpm The bearing housing test results highlighted that its surface
temperature closely follows that of the cooling oil temperature The temperature difference
(∆TBH-oil) between the surface temperature of the bearing housing and the mean oil
temperature (inlet to exit) is proportional with the temperature of the exhaust gases for
exhaust gas temperature TExh=373 K the temperature difference ∆TBH-oil asymp5 K while as the
exhaust gas temperature increases TExh=823 K the temperature difference ∆TBH-oil goes up to
asymp33 K The surface temperature of the exhaust manifold was also measured Two surface
thermocouples were placed on the pipes located underneath the compressor and the turbine
The measured temperatures are shown in Fig 10 together with those of the exhaust gases
From Fig 10 it can be seen that the difference between the surface temperature of the pipe on
the turbine side and that of the exhaust gases varies from a few degrees at low loads up to
around 130 K at higher loads Such a temperature difference is even more severe for the pipe
on the compressor side where a maximum temperature drop of almost 200 K was measured
One of the main challenges in engine calculations is the need to find a correlation for
the compressor exit temperature for different operating conditions This temperature
represents a boundary condition for the combustion analysis in the engine cylinders and hence
if it was possible to establish a unique correlation between the exhaust gases and the
compressor exit temperatures it would then be possible to calculate the compressor non-
adiabatic efficiency A solution to this issue is proposed here
In the standard turbochargers configuration the bearing housing is directly coupled to
the compressor casing through a plate bolted on to the so called compressor back-plate see
Fig 13 If one assumes that all of the heat transferred to the air after compression is
transferred through the compressor back-plate then the plate temperature is equal to the
surface temperature of the bearing housing and Eq (3) becomes
(3)
By solving for T2 one obtains Eq (4)
All the terms of Eq (4) are known except T2 and TBH The former can be derived considering
the non-adiabatic compression process of Fig 1 Here the heat transfer process was simplified
into three paths (1rarr1 1rarr2 2rarr2) In reality only a small amount of heat is transferred
before compression since the incoming air goes through a very short passage (inducer inlet
pipe) Hence the temperature T2 can be assumed to be similar to the temperature T2adi that
would occur if the compression process was fully adiabatic (1rarr2adirarr2) as given in Eq (5)
For TBH instead we can refer to the experimental results of Figs 11 and 12 The exit
temperature to the compressor seems to exhibit a linear trend with the temperature of the
exhaust gases (dashed red line in Fig 12) Such a trend was also observed for the surface
temperature of the bearing housing for which the test measurements showed that TBH and the
temperature of the exhaust gases are linearly related (dashed red line in Fig 11) Therefore
since the temperature of the exhaust gases is known it is possible to correlate the temperature
of the bearing housing to the temperature of the exhaust gases as follows
where grad is the gradient of the trend line By including Eq (5) and Eq (6) into Eq (4)
the exit temperature to the compressor (T2) under non-adiabatic conditions can be
calculated as given in Eq (7)
The outcomes of Eq (7) are shown in Fig 11 in which the measured and the
calculated compressor exit temperatures are reported their absolute deviation is also shown
The overall agreement of the computed temperatures is good over the whole range of test
conditions The absolute deviation between the predicted and measured temperatures is no
bigger than 2-3 Such a deviation remains slightly over the uncertainty range associated
with thermocouples indicated by a dashed black line in the same figure
Compressor non-adiabatic efficiency and exit flow temperature
The measured non-adiabatic compressor performance was compared with that
extrapolated by the cold compressor maps provided by the manufacturer From Fig 12 it can
be noticed that the overall deterioration of the compressor efficiency in hot conditions is
severe over the whole range of temperatures of the exhaust gases This is well shown in
Table 3 where the compressor efficiency in adiabatic and non-adiabatic conditions is given
The absolute relative deviation3 ∆η between the efficiencies goes from a minimum of asymp 17
to a maximum of asymp 30 The scatter of the compressor non-adiabatic efficiencies as the
exhaust gas temperature increases seems to suggest that there is no direct correlation between
the two In fact one would expect that the deterioration of the efficiency increased with an
increase of the exhaust gas temperature at the turbine entry This is not always the case since
the compressor efficiency in non-adiabatic conditions besides being dependent on the
exhaust gas temperature is also affected by other physical properties like the mass flow rate
and the rotational speed
5 HEAT TRANSFER MODEL
This section describes the outcomes of a 1-D heat transfer model The implementation
of heat transfer models for turbochargers involves the quantification of a large number of
parameters that complicates the analysis Here we tried to simplify the approach A detailed
quantification of the heat transfer process within the turbocharger would require a full 3-D
conjugate heat transfer analysis In the model described below the heat fluxes through the
turbocharger were evaluated by means of well known correlations available for heat
conduction radiation and convection The process was validated against experimental data
51 Turbocharger Model
A reduced order turbocharger model developed consisting of an assembly of bodies of
known geometry parameters Such simplified model was obtained by means of progressive
steps firstly a full 3D-CAD model of the turbocharger was developed and then by analysis of
the overall turbocharger configuration the geometry was simplified to an assembly of three
cylindrical bodies representing the turbine the bearing housing and the compressor scroll
(refer to Fig 13-a and b)
Fig 14 shows the cross section of the 1-D model together with the main heat transfer
paths The exhaust gases coming from the combustion flow into the turbine exchange heat
by forced convection to the turbine casing and to the bearing housing (QtrarrBH) Due to the
gradient existing between the inner and outer surface of the turbine casing heat is conducted
through the wall and dissipated by radiation (Qtrad) and free convection (Qtconv) to the
surrounding environment At the same time the air that flows through the rotor expands and
3 Relative deviation defined as
as a consequence the pressure drops and the temperature decreases heat transfer occurs to the
blades and subsequently to the shaft The turbine exit temperature is therefore calculated as
the sum of the temperature drop due to the expansion and the heat transferred to the shaft
(QtrarrS) In the bearing housing the heat is dissipated by forced convection to the oil (QoilrarrBH)
and through free convection (QBHconv) and radiation (QBHrad) to the environment In the shaft
the heat is dissipated only by forced convection to the oil (QSrarroil) note that the heat generated
by friction within the bearing housing is not considered here While the gases expand in the
turbine cold air flows into the compressor The inlet air is heated up by the shaft (QSrarrair) and
compressed in the impeller with a consequent rise in temperature and pressure After the
compression the air flows into the diffuser where the gas is further heated up by forced
convection to the back-plate (Qcrarrair) natural convection (Qcconv) and radiation (Qcrad)
52 Model Flow Chart
Figure 15 provides the flow chart of the model The input parameters for the
turbocharger model are the performance parameters extrapolated by the ldquocoldrdquo maps the oil
flow rate and the temperature of the exhaust gases The control parameter for the whole
calculation is the temperature of the exhaust gases leaving the turbine (T04) In order to start
the calculation an initial assumption on the exit temperature of the exhaust gases (T04) and the
heat added before compression (qcbefore) and expansion (qtbefore) was made With the initial
estimated values of qcbefore and qtbefore the heat fluxes going through the turbocharger can be
evaluated On the basis of the calculation a new evaluation for qcbefore and qtbefore is made
according from the newly computed temperatures These two new values for the heat transfer
are compared with those calculated initially and if the convergence is not satisfied a new
estimation for qcbefore and qtbefore will be made until the convergence is satisfied As with the
heat the exit temperature to the turbine (T04) and the compressor (T02) are calculated and a
comparison is then made between two consecutive values until convergence is satisfied Once
the calculation is converged the non-adiabatic efficiencies are finally computed
53 Model Validation
The simulation results are compared with those obtained through experimental results
Additionally the capability of the model to capture the effects of heat transfer for different
rotational speeds and temperatures of the exhaust gases was also evaluated Four rotational
speeds were selected from the compressor cold maps and input into the model together with
four different temperatures of the exhaust gases The non-adiabatic efficiency maps could
then be generated and the data used for statistical analysis
Heat conducted through the turbine casing
The heat flux through the turbine casing represents the amount of heat that is
dissipated by the gas before expanding in the rotor A good evaluation of the heat conducted
is therefore important to the overall success of the simulation The heat conducted through the
turbine casing in the three measuring locations (Engine Top and External side) is given in
Fig 16 Due to the large scatter of the calculated points a zone of actual heat conduction was
drawn to aid comparison The averaged values for the heat conducted in the three measuring
locations was then calculated (blue diamonds) together with the best fit line (solid blue
curve) Despite the simplicity of the turbocharger model the computed heat conduction (solid
red line) falls well within the actual heat conduction area The model prediction follows the
measured trend line with reasonable accuracy Although the discrepancy between calculated
and measured values can go up to plusmn 18 the overall averaged deviation over the entire range
of exhaust gas temperatures remains low (refer to Table 4) This seems to confirm the
effectiveness of the assumptions made on the set up of the turbocharger model particularly if
one considers the large range of temperatures evaluated (asymp450 K to asymp950 K) and also the
significant assumptions made on the geometry of the turbocharger The calculated deviation
can be attributed to several factors First of all the simplified geometry of the model does not
take into account the fact that the turbine casing comes as a whole die cast body with the
exhaust manifold This leads to a temperature distribution difficult to predict locally Another
factor contributing to the overall deviation is that within the model the wall thickness of the
turbine was assumed to be uniform This is not the case since the wall thickness of turbine
housing varies a consequence of the manufacture process and design requirements
Compressor exit temperature and non-adiabatic efficiency
The outcomes of the model prediction for the compressor exit temperature and
compressor non-adiabatic efficiency is reported here Table 5 shows the computed values for
the compressor efficiency and exit temperature compared with the experimental results The
simulation results are plotted in Fig 17 where the compressor adiabatic efficiency and the
corresponding exit temperature are also included for comparison
From Fig 17 it can be noticed that the model prediction for the compressor exit
temperature is very good The predicted exit temperatures closely follow those measured
experimentally with a difference no larger than few degrees The absolute difference (refer to
Table 5) for the predicted exit temperatures is not larger than 5 K and on the overall the
averaged deviation from the experimental data is asymp25 K This is only slightly above the
uncertainty range associated with experimental measurements and it shows the effectiveness
of the assumptions made on the model geometry and the occurring heat fluxes Nevertheless
such a good prediction does not correspond to an equally good prediction for the compressor
efficiency On the efficiency side the model prediction seems to be less accurate than that
exhibited for the temperature The scatter of data of the computed efficiency from that
measured experimentally remains within asymp3 percentage points for most of the operating
conditions considered here This can mainly be attributed to the error propagation associated
with the computed exit temperature that makes the predicted non-adiabatic efficiency to
deviate more from that measured experimentally However on the overall the prediction for
the compressor non-adiabatic efficiency remains within an acceptable range and it enables to
extend our simulation to different operating conditions with good degree of confidence
Model qualitative validation
As the experimental data was obtained on a turbocharger installed on a real engine it
was not possible to control all the turbocharger parameters so as to obtain a wide range of
pressures In order to overcome such a limitation the performance parameters from the
turbocharger cold maps were extrapolated for four different rotational speeds For each of
these the non-adiabatic efficiencies were calculated for five different temperatures of the
exhaust gases as given in Table 6 The outcomes of the model calculation are given in Figs
18 to 21 The compressor non-adiabatic efficiency and the corresponding exit temperatures
are reported against the mass flow rate for each condition of Table 6
From Figs 18 to 21 it can be seen that the efficiency drop associated with increasing
heat transfer is very well captured by the model At high rotational speed the predicted
compressor efficiency does not deviate substantially from that measured in cold conditions
This is clearly seen in Fig 18 where at 1633 revsradicK and TExh=550 K the efficiency drop is
only asymp3 while it goes up to asymp10 for TExh=950 K This is fully consistent with the
experimental findings [4] for which it was found that at high rotational speeds the effects of
heat transfer on compressor performance is negligible The experimental evidence also
showed that as the rotational speed drops to low values the temperature effect becomes
dominant This is also well captured by the model In fact as the temperature increases the
compressor performance decreases consistent with experimental evidence At high rotational
speeds for which the temperature effect on the compressor performance is not important the
predicted non-adiabatic efficiencies do not vary substantially to one another (Figs 18 and 19)
At 550 K the computed exit temperature to the compressor is almost equivalent to that
calculated in adiabatic conditions As the temperature of the exhaust gases increases (550 K
to 950 K) the temperature rise to the compressor varies by only asymp10 K On the contrary at
lower rotational speeds (Figs 20 and 21) the effect of temperature on efficiency is more
relevant and this corresponds to large variation in the compressor performance as the
temperature increases
6 STATISTICAL ANALYSIS
In order to complete the analysis on heat transfer the data generated by the model was
used to assess the compressor non-adiabatic performance by means of a regression analysis
In order to perform the regression analysis the following steps were taken
1 Identify the minimum number of parameters that better describe the compressor
efficiency in non-adiabatic conditions
2 Perform the multiple regression analysis determine the regression coefficients and
evaluate the goodness of fit through the evaluation of conventional fit parameters
3 Discuss the consistency of the regression response with the experimental findings and
assess the capability of the statistical approach for the calculation of the compressor
efficiency
61 Parameters definition
In order to run a statistical analysis a number of significant parameters responding to
Eq (8) must be identified
(8)
where xi are the explanatory variables (independent parameters) and is the response
variable In a compressor map a given point is uniquely defined by a pair of non-dimensional
parameters selected amongst efficiency pressure ratio mass flow and speed For the purpose
of this research the pressure ratio PR and the rotational speed given in terms of Mach number
were selected However a third parameter accounting for the heat transferred to the
compressor must be included in the analysis This was identified in the form of ldquotemperature
parameterrdquo A more detailed description of the parameters can be found below
1 Pressure ratio (PR) in order to determine a point in a conventional compressor map at
least two parameters must be known The pressure ratio was identified as an independent
parameter It is defined as the ratio between the stagnation pressures at the inlet and exit
to the compressor as given in Eq (9)
(9)
2 Mach number (M) this is the local Mach number at the exit to the impeller blade row
The compressor impeller used for the current research has backward swept blades (blade
angle ) and the velocity triangle is given in Fig 22 The ideal case of a
perfectly guided flow for radial blades was also considered here in order to quantify the
effects of blade geometry and slip on the overall compressor performance The absolute
velocities for both the backward swept and radial blade impeller can be calculated as
given in Eq (10) and Eq (11)
(10)
(11)
where is the tangential velocity the meridional component of the absolute
velocity and the slip factor calculated with the Stanitz correlation [16] The Mach
number is then given in Eq (12)
Shabaan et al [3] demonstrated that the parameters that are relevant to the heat transfer
process within a compressor are the peripheral Mach number ( ) the
flow coefficient ( ) the slip factor and the blade angle at the impeller
outlet ( ) It can be demonstrated that the local Mach number M2adi is a function of all
the parameters indicated above and it can be developed to yield to Eq (13)
where
is defined as the work input factor [17] and for and Eq(13) reduces
to the particular case of a perfectly guided radial blade impeller
Eq (13) and Eq (15) were obtained for backward swept (with ) and radial blade
impeller (with ) From Eq (13) it can be seen as M2adi contains the effects of the
main parameters involved in the heat transfer process The benefit of using the local
Mach number is that it reduces the number of variables to be used in a parametric
analysis thus simplifying the calculation of the compressor non-adiabatic performance
3 Temperature parameter (TP) this parameter was introduced in order to take into account
the effects of heat transfer on the compressor efficiency The heat transferred within a
turbocharger is mainly generated by the exhaust gases entering the turbine After
exchanging heat with the turbine housing the flow will then expand in the rotor leaving
the turbine with lower temperature (T04) On the compressor side instead heat from the
turbine to the compressor is mainly transferred through the bearing housing that in turn
will cause a rise in the compressor exit temperature (T02) We can then infer that the exit
temperatures to both the compressor and the turbine are associated with the heat
exchanged within the turbocharger and therefore the ratio between T02 and T04 was
included in the regression analysis as a non- dimensional parameter as given in Eq (16)
62 Multiple regression analysis
After having defined the xi explanatory variables Eq (17) assumes the form
(17)
The general computational problem that needs to be solved in multiple regression analysis is
to fit a line to a number of points In the multivariate case when there is more than one
independent variable the multiple regression procedure will estimate a linear equation of the
form
(18)
The expression in Eq (18) is ready for multiple regression operation with pressure
ratio parameter (PR) which required a logarithmic transformation since a certain skewness
was observed in the plot of residuals
Prior to the multiple regression analysis the single linear regression analysis for each
explanatory variable was performed The results of regression are reported in Table 7 which
contains the essential statistics that help explain the obtained coefficient The squared value
of the Mach number was also included as an additional since the regression response ( ) is
expected to have some curvature given that the compressor efficiency curve usually shows a
parabolic trend
The multiple regression analysis was run with the software ldquoOrigin Ccopy
rdquo [18] the
results for both backward swept and radial blade impeller are provided in Table 8 The final
expression for Eq (18) is given in Eq (19) and Eq (20)
(19)
(20)
It is worth noting that no constant is present in Eq (19) and Eq (20) C0=0 This was
purposely set equal to 0 since no efficiency is expected to exist if no flow is going through the
compressor (PR=1 M=0)
63 Discussion of results
The linear regression analysis for the single explanatory variables shows that these
are strongly correlated with the efficiency given that the p-value is smaller than 000014 This
supports the assumption of significant relationship existing between and the explanatory
variables
Proven the statistical significance of the explanatory variables the goodness of fit of
Eq (19) and Eq (20) with η must also be checked by looking at the adjusted R2 value The
adjusted R2
is asymp09 for both Eq (19) and Eq (20) Such a high value is in favor of the
goodness of fit and it seems to support the assumptions made on the compressor non-
adiabatic efficiency and on the effectiveness of the regression analysis as a predictive tool
After having verified that the selected explanatory variables are statistically
significant their significance under a physical point of view must also be assessed
Temperature parameter (TP5) the temperature parameter shows the smallest coefficient
in respect to the other explanatory variables PR and M This means that the effects of the
temperature rise within the turbocharger are overcome by the aerodynamic effects as the
pressure ratio and the Mach number increase In addition to this the regression
coefficient also exhibits a negative value This suggests that for a fixed PR and M an
increase in TP corresponds to a decrease in efficiency
Pressure ratio (logPR) the pressure ratio is one of the two independent parameters
extrapolated from the compressor map The pressure ratio appears in logarithmic form in
both Eq (19) and Eq (20) This was made necessary because of the skewness exhibited
by the histogram of residuals although this choice also owns a physical reason In the
case where the pressure ratio is equal to 1 this implies that no flow is going through the
machine and that no work is produced Hence the efficiency is equal to 0 The logarithm
of PR takes into account this feature
4 In regression analysis the p-value represents the probability that the coefficient of a variable is non zero 5 From now on when referring to the TP contribution to the compressor performance this must be considered as a negative contribution
leading to efficiency drop
Mach number (M) this parameter is present both in linear and quadratic form The
regression coefficient for M is the biggest in both Eq (19) and Eq (20) This means that
the compressor performance is strongly dependent on the Mach number and that the
effects of the heat transfer diminish as the rotational speed increases Again this is
consistent with the experimental findings [4] which showed that there is no significant
difference between the adiabatic and the non-adiabatic compressor performance at high
rotational speeds
It must be mentioned that looking at the magnitude of the regression coefficients does not
help to give their real contribution to the overall compressor performance Each term of Eq
(19) and Eq (20) is given by the combination of the regression coefficients and the
explanatory variables Therefore it is necessary to look at the range into which the
explanatory variables vary in order to assess their contribution to the compressor efficiency
Typical values for M logPR and TP are given in Table 9 The explanatory variable M despite
showing a large value of the regression coefficient varies within a small range (05 to 12)
The opposite occurs for the temperature parameter for which the small contribution given by
its regression coefficient is in somehow compensated by a larger value of TP
In Fig 23 a 3-D plot of the contribution (in percentage points) of each parameter to
the compressor non-adiabatic efficiency is given for both the backward swept and radial blade
impeller The Mach number is by far the most significant parameter and its value remains
above 70 for the whole range of speeds and temperatures The temperature parameter TP
decreases with speed while the opposite occurs for PR In Fig 24 this is even more evident
The explanatory variables were plotted against the rotational speed and each point in the plot
represents the average value of the corresponding parameter over the whole range of exhaust
gases temperatures (550 K to 950 K) Although the average is not entirely representative of
the TP values (for which the temperature change has a large impact) this does not largely
affect M and PR From Fig 24 it can be gathered that the Mach number accounts for the
largest portion of the compressor non-adiabatic efficiency Its trend remains fairly constant
across the entire speed range meaning that its weight on the overall compressor efficiency is
almost independent on speed (see Table 10) TP and PR instead represent a smaller portion of
the efficiency TP exhibits a decreasing trend with speed and at high speeds it is no larger than
asymp10 This is more evident in Fig 25 where TP was plotted against temperature for constant
speed lines
In Figs 23 and 24 the effect of geometry on the explanatory variables is also given
For the backward swept blade impeller the contribution of the Mach number Mbs remains
above that of the radial impeller Mr The reason is found in the deviation of the absolute
velocity (C2adi) from the perfectly guided flow conditions and hence in a lower value of the
Mach number (refer to Fig 22) On the other hand the pressure ratio PRr for the backward
swept blade impeller compensates for such a deficit of the Mach number (Mr) and therefore
the calculated values of PRr are bigger than those calculated for the back swept (PRbs) In
Table 10 a quantification of the impact of geometry on the explanatory variables is provided
The Mach number difference goes from asymp3 to asymp6 (in absolute value) as the
speed increases Such a difference is partly compensated by the pressure ratio for which
values of not larger than asymp4 were calculated (in absolute value) No variation instead
was observed for the temperature parameter TP that remains unchanged over the whole range
of speeds This suggests that TP is insensitive to the geometry and it can be readily explained
by looking at the definition of TP in which no geometry parameter is present
64 Geometry effects on heat transfer
The current research was based on the test data available for a single turbocharger
Even though the validity of the analysis remains unaltered this would imply that this analysis
is insensitive to the turbocharger size This is not the case in reality as the heat transfer
occurring within a turbocharger strongly depends on the geometry of the bodies involved in
it In order to quantify what is the impact of geometry on the compressor performance two
parameters were identified as the most significant on heat transfer the compressor casing
diameter (D) and the distance between the compressor and the turbine here defined as
bearing housing length (BHL)
1 Bearing housing length (BHL) heat from the turbine side travels through the bearing
housing towards the compressor This parameter is mainly denoting the space available
for the heat transfer dissipation by convection in the oil bearing assembly
2 Compressor casing diameter (D) the air within the compressor is mainly heated up by
forced convection with the casing The size of the compressor casing is therefore crucial
to determine the surface area available to the flow for heat exchange
A non-dimensional parameter defined as the ratio between BHL and D was then introduced
in the regression analysis
Since no experimental data were available BHL and D were scaled by plusmn15 plusmn30 from
those of the turbocharger previously studied Different values of LD were calculated by
scaling alternatively BHL and D These are reported in Table 11 The first row was obtained
by fixing D to its original value and scaling BHL The opposite was done in the second row
The model was then run for the same range of speeds and temperatures as in Table 6 and the
impact of LD on the compressor efficiency was then assessed The regression equation
including LD is given in Eq (22) By the analysis of Eq (22) it can be inferred that the
impact of geometry on the overall compressor performance is not small The regression
coefficient for BHL is significant if compared to the others and its contribution to the
compressor efficiency ranges between asymp1 and asymp24 as reported in Table 11
(22)
In Fig 26 the variation of LD is plotted against its contribution to the overall efficiency It
can be noticed as the impact of LD on the compressor efficiency increases with LD This
suggests that BHL and D are inversely related to each other An increase in BHL is beneficial
to the compressor efficiency since a lower amount of heat is transferred to the compressor On
the other hand the role played by D on the compressor efficiency is less clear In fact a
decrease in D corresponds to a reduced amount of surface area available to the flow for heat
exchange
7 CONCLUSIONS
This paper reported the outcomes of the investigation on heat transfer in
turbochargers The turbocharger under study was tested at constant load points for a range of
engine speeds Measurements were obtained for engine speeds between 1000 and 3000 rpm at
a step of 500 rpm for each engine speed the load applied was varied from 16 to 250 Nm The
surface temperatures of three main bodies constituting the turbocharger (turbine and
compressor casing bearing housing) were measured in 17 stations
The test results showed that the engine has a large impact on surface temperature of
the turbine and compressor casing and also that the surface temperatures of both the turbine
and the compressor vary linearly with the temperature of the exhaust gases A temperature
gradient was also measured between the inner and the outer wall on the turbine side this
moves outward while the opposite occurs for the compressor The surface temperature of the
bearing housing was found to vary consistently with that of the cooling oil with a
temperature difference of about asymp30 K Similar trend to that of the bearing housing and the oil
was found for the surface temperature of the exhaust manifold with a temperature difference
of up to asymp130K on the turbine side The compressor non-adiabatic efficiency was also
evaluated the deviation from that measured under adiabatic conditions goes from 17 to
30 as the rotational speed and air flow rate decreases Based on the experimental results an
experimental correlation linking the compressor exit temperature with the exhaust gas
temperature was proposed the calculated temperature was found to agree well with the
experimental results with a discrepancy no larger than 3
A 1-D model of the turbocharger was developed and validated against the
experimental results The validation against test results showed that the trend of the heat
transferred through the turbine casing is well captured the compressor exit temperature could
be predicted with an uncertainty no greater than 5 K while an averaged deviation of about 3
was found for the compressor non-adiabatic efficiency
Based on the maps generated by the model a multiple regression analysis was carried
out for the compressor non-adiabatic efficiency In this analysis the following explanatory
variables were chosen absolute compressor exit Mach number (M2adi) the compression ratio
(PR) and the temperature parameter (TP) The high values of the adjusted R2asymp 09 showed
that the compressor non-adiabatic efficiency can be fitted with good degree of approximation
by means of the selected parameters The Mach number was found to contribute for asymp80 of
the overall efficiency the temperature parameter for asymp20 while the pressure ratio only few
percentage points The impact of the geometry on the compressor non-adiabatic efficiency
was also assessed this was found to account for about asymp2 of the overall compressor
efficiency
ACKNOWLEDGEMENTS
The authors would like to acknowledge Ricardo plc Ford Motor Company Ltd and
University of Brighton This consortium along with Imperial College is part of a funded
program (TSB-UK) named VERTIGO (Virtual Emission Research Tools and Integration)
Furthermore the authors would also like to acknowledge Mr Benjamin Kumm and Mr
Katopodis Spyridon whose previous research at Imperial College was essential for the
outcome of this paper
APPENDIX MODEL EQUATIONS
In order to calculate the heat fluxes through the turbocharger the three main mechanisms of
conduction radiation and convection were considered For the first two mechanisms Eq (23) and Eq
(24) were applied to the surfaces involved with such heat transfer effects [19]
For forced convection instead the heat flux calculation is more complex This has been calculated
considering the Newtonrsquos Law of Cooling ( hAmiddotΔT) and the procedure followed is outlined
below
Heat transfer coefficients
Heat transfer correlations need to be applied to evaluate the heat transferred coefficients
caused by natural and forced convection Heat transfer coefficients equation change according to the
geometry of the body involved in the heat transfer process For the particular case under study
different heat transfer coefficients need to be considered for the turbine bearing housing compressor
casing and cooling oil Below are given some of the correlations included in the model
-Turbine casing in the turbine casing have been considered three surfaces transferring heat [20] [21]
1 the annular surface (Eq 25)
2 both ends of the cylinder (Eq 26)
-Bearing housing surface the heat transfer on the bearing housing is similar to that on the annular
surface of the turbine casing with the main difference that unlike the turbine casing (where the surface
was treated as isothermal) the heat transfer coefficient in the bearing housing varies in the axial
direction [22]
-Compressor casing the compressor casing was modeled as a disc (in the paper referred as
compressor Back-Plate) with the internal diameter equal to the external diameter of the bearing
housing The temperature was assumed to vary only along the radius Similarly to the turbine round
plate the same correlation for the Nusselt number and the heat transfer coefficient was included in the
model6
-Compressor and turbine on the inside of the compressor and turbine volute there is significant
forced convection The volute is modelled as a straight pipe and the heat transfer coefficient can be
calculated from the Nusselt number when D2 is chosen for the characteristic length
Temperature distribution and heat fluxes calculation
The next step involved is the evaluation of the temperature distributions in the turbine casing
the shaft the bearing housing and the compressor casing For reasons of space only the shaft case will
be provided here [23]
-Shaft The radial variation of the temperature was omitted since the shaft has a small diameter and
high thermal conductivity hence the temperature difference along the radius is lower than the axial
temperature variation In addition to this the internal energy was considered to be constant since the
model was developed as steady state The energy balance for an infinitesimal element of the shaft then
simplifies to Eq (29) and it is shown in Fig 27
(29)
Please note that the y direction in the Eq (27) was introduced to show that the compressor back-plate is normal to the axial direction of
the turbocharger The addition of an extra frame of reference might lead the reader to consider the model solution as a 2-D problem This is
not the case as the heat transfer model remains unaltered and it lies on the assumption of 1-D analysis
The term can be expressed by use of the Taylor and the heat transferred to the oil ( and
the axial derivative of the conductive heat flux can be rewritten by mean of Fourierrsquos law This leads
to Eq (30) for the axial distribution of heat along the shaft
To solve this differential equation of second order two boundary conditions have to be provided A
similar approach was followed for the other parts constituting the turbocharger model Two main
assumptions were made The first is that the the effective temperature of the gas corresponds to the
average temperature at the inlet and the exit to the rotor while the second is that the heat transfer
coefficients n both ends of the shaft is assumed to be equal to those of the turbine (x=LS) and the
compressor (x=0) The final amount of heat delivered by the shaft to the air is then given in Eq (31)
REFERENCES
[1] Rautenberg M Mobarak A Malobabic M Influence of heat transfer between turbine
and compressor on the performance of small turbochargers Int Gas Turbine
Congress 1983 IGTC-73
[2] Rautenberg M Krammer N On the thermodynamics of non-adiabatic compression
and expansion processes in turbomachines 1984 Proceedings of the 5th
International
Conference for Mechanical Power Engineering Cairo
[3] Shaaban S Seume JR Analysis of turbocharger non-adiabatic performance 2006
Proceedings of the 8th
international conference on turbochargers and Turbocharging
London C647027
[4] Shaaban S Experimental investigation and extended simulation of turbocharger non-
adiabatic performance PhD Thesis University of Hannover 2004
[5] Hagelstein D Beyer B Seume JR Rautenberg M Heuristical view on the non-
adiabatic coupling system of combustion engine and turbocharger 2002 Proceedings
of the 7th
International conference on turbochargers and turbocharging London
C602015
[6] Jung M Ford R Glover K Collings N Christen U Watts M Parameterization and
transient validation of a variable geometry turbocharger for mean-value modeling at
low and medium speed-load points SAE Powertrain and fluid systems conference
San Diego 2002 SAE 2002-01-2729
[7] Cormerais M Hetet JF Chesse P Maiboom A Heat transfer analysis in a
turbocharger compressor Modeling and experiments SAE world congress Detroit
2006 SAE 2006-01-0023
[8] Abdelhamid S Berndt R Grigoriadis P Hagelstein D Nickel J Pucher H Seume JR
Advanced presentation and extrapolation of turbocharger maps as a boundary
condition of the engine process simulation 2003 Stuttgart international symposium
on motor vehicles and engines Stuttgart
[9] Chapman KS Nguru R Shultz J Simplified methodology to correct turbocharger
field measurements for heat transfer and other effects Final Report for gas research
institute 2002 GRI-020156
[10] Bohn D Heuer T Kusterer K Conjugate flow and heat transfer investigation of a
turbocharger Part i - numerical results Proceedings of ASME turbo expo Atlanta
2003 GT2003-38445
[11] Bohn D Moritz N Wolff M Conjugate flow and heat transfer investigation of a turbo
charger Part ii - experimental results Proceedings of ASME turbo expo Atlanta
2003 GT-2003-38849
[12] Heuer T Engels B Wollscheid P Thermomechanical analysis of a turbocharger based
on conjugate heat transfer Proceedings of ASME turbo expo Reno-Tahoe (Nevada)
2005 GT 2005-68059
[13] Baines N Wygant KD Antonis D The analysis of heat transfer in automotive
turbochargers Proceedings of the ASME turbo expo Orlando 2009 GT2009-59353
[14] Casey MV Schlegel M Performance estimation of turbocharger compressor at low
pressure ratios Institute of thermal turbomachinery (ITSM) University of Stuttgart
2008
[15] Casey MV Fesich TM On the efficiency of compressors with adiabatic flows
Proceedings of the ASME turbo expo Orlando 2009 GT 2009-59015
[16] Stanitz JD Some theoretical aerodynamic investigations of impellers in radial and
mixed flow centrifugal compressors Proceedings of the ASME turbo expo 1952 pp
74- 473
[17] Rodgers C A diffusion factor correlation for centrifugal impeller stalling Proceedings
of the ASME turbo expo 1978 GT-61
[18] Koonlaya K Heat transfer investigation of jet impingement coupled with dimples
PhD Thesis Imperial College London 2004
[19] Cengel YA Heat Transfer A Practical Approach McGraw-Hill (Tx) 2nd
edition
2002
[20] Dittus PW Boelter LMK Heat Transfer in Automobile Radiators of the Tubular
Type University of California Publication Engineer Vol 2 pp 232- 248 1930
[21] Lewandoski W Radziemska E Heat Transfer by Free Convection from an Isothermal
Vertical Round Space in Unlimited Space Applied Energy Vol 68 pp 187ndash201
2001
[22] Lomas CG Fundamentals of hot-wire anemometry Cambridge University Press pp
63-69 1986
[22] Bayley F J Owen JM Turner AB Heat Transfer William Clowes and Sons Ltd
London 1972
[23] Kumm B Development and Application of a Theoretical Model to Predict Heat
Fluxes from the Turbine to the Compressor in a Turbocharger Final year project
report Imperial College of Science Technology and Medicine - University of
London UK 2007
FIGURES
Figure 1 Compression diagram
Figure 2 Test rig layout (Kyartos 2006)
Figure 3 Test rig overview (Kyartos 2006)
Figure 4 Instrumented turbocharger
EXTERNAL SIDE
TOP
ENGINE SIDE
Oil Inlet Temperature
Oil Exit Temperature
Turbine Side Temp Exh Manifold
Compressor Side Temp Exh Manifold
Speed Sensor
Oil Flow Sensor
Figure 5 Turbine casing inner - outer wall temperature difference in the three locations
Engine Top and External side
Figure 6 Compressor casing outer - inner wall temperature difference in the three locations
Engine Top and External side
0
10
20
30
40
50
60
70
300 400 500 600 700 800 900 1000
∆T
wt [K
]
Exhaust gases temperature [K]
Turbine casing temperature difference between inner and outer wall
∆TwtEngine
∆TwtTop
∆TwtExternal
asymp40 K
∆Twt= Twinner-Twouter
0
5
10
15
20
25
30
35
250 350 450 550 650 750 850 950 1050
∆T
wc [K
]
Exhaust gases temperature [K]
Compressor casing temperature difference between outer and inner wall
∆TwcEngine
∆TwcTop
∆TwcExternal
asymp29 K
∆Twc= abs(Twcinner-Twciouter)
Figure 7 Compressor casing occurring heat fluxes
Figure 8 Turbine casing occurring heat fluxes
Figure 9 Temperature trend for the cooling oil and the bearing housing
Figure 10 Temperature trend for the exhaust manifold and exhaust gases
290
310
330
350
370
390
410
430
300 400 500 600 700 800 900
Tem
pera
ture
[K
]
Exhaust gases temperature [K]
Surface temperature bearing housing and cooling oil
Bearing Housing - 3000 rpm
Oil InletOutlet - 3000 rpm
Bearing Housing - 2000 rpm
Oil InletOutlet - 2000 rpm
Bearing Housing - 1000 rpm
Oil InletOutlet - 1000 rpm
270
370
470
570
670
770
870
0 50 100 150 200 250
Tem
pera
ture
[K
]
Load [Nm]
Surface temperature of the exhaust manifold
Turbine side - 3000 rpm
Compressor side - 3000 rpm
Turbine side - 2000 rpm
Compresor side - 2000 rpm
Turbine side - 1000 rpm
Compressor side - 1000 rpm
Exhaust gasses - 3000 rpm
Exhaust gasses - 2000 rpm
Exhaust gasses - 1000 rpm
gases
gases
gases
Figure 11 Compressor exit temperature
Figure 12 Adiabatic vs non-adiabatic compressor efficiency and exit temperature
0
3
6
9
12
15
18
21
24
273
293
313
333
353
373
393
413
433
453
360 560 760 960
Devia
tion [
]
Tem
pera
ture
[K
]
Exhaust gases temperature [K]
Prediction compressor exit temperature
Measured Compressor Exit Temperature
Predicted Compressor Exit Temperature
Surface Temperature Bearing Housing
Deviation
Measurements Uncertainty plusmn 15degC
300
350
400
450
500
00
01
02
03
04
05
06
07
08
09
10
500 600 700 800 900 1000
Com
pre
ssor
exit t
em
pera
ture
[K
]
Com
pre
ssor
rela
tive e
ffic
iency
ηc
Exhaust gases temperature [K]
Comparison adiabatic vs non-adiabatic compressor efficiency and exit temperature
Adiabatic efficiency
Non adiabatic efficiency
Adiabatic exit temperature
Non adiabatic exit temperature
Figure 13 Physical Model - A Real model of the turbocharger - B Simplified geometry included in the 1-D
Table 11 LD values for different combination of BHL and D
Variable +15 -15 +30 -30
BHL (Dfixed) LD=0 43
ηvar asymp 18
LD=031
ηvar asymp13
LD=048
ηvar asymp19
LD=026
ηvar asymp10
D (BHLfixed) LD=032
ηvar asymp132
LD=044
ηvar asymp18
LD=028
ηvar asymp10
LD=053
ηvar asymp24
It is worth noting that no constant is present in Eq (19) and Eq (20) C0=0 This was
purposely set equal to 0 since no efficiency is expected to exist if no flow is going through the
compressor (PR=1 M=0)
63 Discussion of results
The linear regression analysis for the single explanatory variables shows that these
are strongly correlated with the efficiency given that the p-value is smaller than 000014 This
supports the assumption of significant relationship existing between and the explanatory
variables
Proven the statistical significance of the explanatory variables the goodness of fit of
Eq (19) and Eq (20) with η must also be checked by looking at the adjusted R2 value The
adjusted R2
is asymp09 for both Eq (19) and Eq (20) Such a high value is in favor of the
goodness of fit and it seems to support the assumptions made on the compressor non-
adiabatic efficiency and on the effectiveness of the regression analysis as a predictive tool
After having verified that the selected explanatory variables are statistically
significant their significance under a physical point of view must also be assessed
Temperature parameter (TP5) the temperature parameter shows the smallest coefficient
in respect to the other explanatory variables PR and M This means that the effects of the
temperature rise within the turbocharger are overcome by the aerodynamic effects as the
pressure ratio and the Mach number increase In addition to this the regression
coefficient also exhibits a negative value This suggests that for a fixed PR and M an
increase in TP corresponds to a decrease in efficiency
Pressure ratio (logPR) the pressure ratio is one of the two independent parameters
extrapolated from the compressor map The pressure ratio appears in logarithmic form in
both Eq (19) and Eq (20) This was made necessary because of the skewness exhibited
by the histogram of residuals although this choice also owns a physical reason In the
case where the pressure ratio is equal to 1 this implies that no flow is going through the
machine and that no work is produced Hence the efficiency is equal to 0 The logarithm
of PR takes into account this feature
4 In regression analysis the p-value represents the probability that the coefficient of a variable is non zero 5 From now on when referring to the TP contribution to the compressor performance this must be considered as a negative contribution
leading to efficiency drop
Mach number (M) this parameter is present both in linear and quadratic form The
regression coefficient for M is the biggest in both Eq (19) and Eq (20) This means that
the compressor performance is strongly dependent on the Mach number and that the
effects of the heat transfer diminish as the rotational speed increases Again this is
consistent with the experimental findings [4] which showed that there is no significant
difference between the adiabatic and the non-adiabatic compressor performance at high
rotational speeds
It must be mentioned that looking at the magnitude of the regression coefficients does not
help to give their real contribution to the overall compressor performance Each term of Eq
(19) and Eq (20) is given by the combination of the regression coefficients and the
explanatory variables Therefore it is necessary to look at the range into which the
explanatory variables vary in order to assess their contribution to the compressor efficiency
Typical values for M logPR and TP are given in Table 9 The explanatory variable M despite
showing a large value of the regression coefficient varies within a small range (05 to 12)
The opposite occurs for the temperature parameter for which the small contribution given by
its regression coefficient is in somehow compensated by a larger value of TP
In Fig 23 a 3-D plot of the contribution (in percentage points) of each parameter to
the compressor non-adiabatic efficiency is given for both the backward swept and radial blade
impeller The Mach number is by far the most significant parameter and its value remains
above 70 for the whole range of speeds and temperatures The temperature parameter TP
decreases with speed while the opposite occurs for PR In Fig 24 this is even more evident
The explanatory variables were plotted against the rotational speed and each point in the plot
represents the average value of the corresponding parameter over the whole range of exhaust
gases temperatures (550 K to 950 K) Although the average is not entirely representative of
the TP values (for which the temperature change has a large impact) this does not largely
affect M and PR From Fig 24 it can be gathered that the Mach number accounts for the
largest portion of the compressor non-adiabatic efficiency Its trend remains fairly constant
across the entire speed range meaning that its weight on the overall compressor efficiency is
almost independent on speed (see Table 10) TP and PR instead represent a smaller portion of
the efficiency TP exhibits a decreasing trend with speed and at high speeds it is no larger than
asymp10 This is more evident in Fig 25 where TP was plotted against temperature for constant
speed lines
In Figs 23 and 24 the effect of geometry on the explanatory variables is also given
For the backward swept blade impeller the contribution of the Mach number Mbs remains
above that of the radial impeller Mr The reason is found in the deviation of the absolute
velocity (C2adi) from the perfectly guided flow conditions and hence in a lower value of the
Mach number (refer to Fig 22) On the other hand the pressure ratio PRr for the backward
swept blade impeller compensates for such a deficit of the Mach number (Mr) and therefore
the calculated values of PRr are bigger than those calculated for the back swept (PRbs) In
Table 10 a quantification of the impact of geometry on the explanatory variables is provided
The Mach number difference goes from asymp3 to asymp6 (in absolute value) as the
speed increases Such a difference is partly compensated by the pressure ratio for which
values of not larger than asymp4 were calculated (in absolute value) No variation instead
was observed for the temperature parameter TP that remains unchanged over the whole range
of speeds This suggests that TP is insensitive to the geometry and it can be readily explained
by looking at the definition of TP in which no geometry parameter is present
64 Geometry effects on heat transfer
The current research was based on the test data available for a single turbocharger
Even though the validity of the analysis remains unaltered this would imply that this analysis
is insensitive to the turbocharger size This is not the case in reality as the heat transfer
occurring within a turbocharger strongly depends on the geometry of the bodies involved in
it In order to quantify what is the impact of geometry on the compressor performance two
parameters were identified as the most significant on heat transfer the compressor casing
diameter (D) and the distance between the compressor and the turbine here defined as
bearing housing length (BHL)
1 Bearing housing length (BHL) heat from the turbine side travels through the bearing
housing towards the compressor This parameter is mainly denoting the space available
for the heat transfer dissipation by convection in the oil bearing assembly
2 Compressor casing diameter (D) the air within the compressor is mainly heated up by
forced convection with the casing The size of the compressor casing is therefore crucial
to determine the surface area available to the flow for heat exchange
A non-dimensional parameter defined as the ratio between BHL and D was then introduced
in the regression analysis
Since no experimental data were available BHL and D were scaled by plusmn15 plusmn30 from
those of the turbocharger previously studied Different values of LD were calculated by
scaling alternatively BHL and D These are reported in Table 11 The first row was obtained
by fixing D to its original value and scaling BHL The opposite was done in the second row
The model was then run for the same range of speeds and temperatures as in Table 6 and the
impact of LD on the compressor efficiency was then assessed The regression equation
including LD is given in Eq (22) By the analysis of Eq (22) it can be inferred that the
impact of geometry on the overall compressor performance is not small The regression
coefficient for BHL is significant if compared to the others and its contribution to the
compressor efficiency ranges between asymp1 and asymp24 as reported in Table 11
(22)
In Fig 26 the variation of LD is plotted against its contribution to the overall efficiency It
can be noticed as the impact of LD on the compressor efficiency increases with LD This
suggests that BHL and D are inversely related to each other An increase in BHL is beneficial
to the compressor efficiency since a lower amount of heat is transferred to the compressor On
the other hand the role played by D on the compressor efficiency is less clear In fact a
decrease in D corresponds to a reduced amount of surface area available to the flow for heat
exchange
7 CONCLUSIONS
This paper reported the outcomes of the investigation on heat transfer in
turbochargers The turbocharger under study was tested at constant load points for a range of
engine speeds Measurements were obtained for engine speeds between 1000 and 3000 rpm at
a step of 500 rpm for each engine speed the load applied was varied from 16 to 250 Nm The
surface temperatures of three main bodies constituting the turbocharger (turbine and
compressor casing bearing housing) were measured in 17 stations
The test results showed that the engine has a large impact on surface temperature of
the turbine and compressor casing and also that the surface temperatures of both the turbine
and the compressor vary linearly with the temperature of the exhaust gases A temperature
gradient was also measured between the inner and the outer wall on the turbine side this
moves outward while the opposite occurs for the compressor The surface temperature of the
bearing housing was found to vary consistently with that of the cooling oil with a
temperature difference of about asymp30 K Similar trend to that of the bearing housing and the oil
was found for the surface temperature of the exhaust manifold with a temperature difference
of up to asymp130K on the turbine side The compressor non-adiabatic efficiency was also
evaluated the deviation from that measured under adiabatic conditions goes from 17 to
30 as the rotational speed and air flow rate decreases Based on the experimental results an
experimental correlation linking the compressor exit temperature with the exhaust gas
temperature was proposed the calculated temperature was found to agree well with the
experimental results with a discrepancy no larger than 3
A 1-D model of the turbocharger was developed and validated against the
experimental results The validation against test results showed that the trend of the heat
transferred through the turbine casing is well captured the compressor exit temperature could
be predicted with an uncertainty no greater than 5 K while an averaged deviation of about 3
was found for the compressor non-adiabatic efficiency
Based on the maps generated by the model a multiple regression analysis was carried
out for the compressor non-adiabatic efficiency In this analysis the following explanatory
variables were chosen absolute compressor exit Mach number (M2adi) the compression ratio
(PR) and the temperature parameter (TP) The high values of the adjusted R2asymp 09 showed
that the compressor non-adiabatic efficiency can be fitted with good degree of approximation
by means of the selected parameters The Mach number was found to contribute for asymp80 of
the overall efficiency the temperature parameter for asymp20 while the pressure ratio only few
percentage points The impact of the geometry on the compressor non-adiabatic efficiency
was also assessed this was found to account for about asymp2 of the overall compressor
efficiency
ACKNOWLEDGEMENTS
The authors would like to acknowledge Ricardo plc Ford Motor Company Ltd and
University of Brighton This consortium along with Imperial College is part of a funded
program (TSB-UK) named VERTIGO (Virtual Emission Research Tools and Integration)
Furthermore the authors would also like to acknowledge Mr Benjamin Kumm and Mr
Katopodis Spyridon whose previous research at Imperial College was essential for the
outcome of this paper
APPENDIX MODEL EQUATIONS
In order to calculate the heat fluxes through the turbocharger the three main mechanisms of
conduction radiation and convection were considered For the first two mechanisms Eq (23) and Eq
(24) were applied to the surfaces involved with such heat transfer effects [19]
For forced convection instead the heat flux calculation is more complex This has been calculated
considering the Newtonrsquos Law of Cooling ( hAmiddotΔT) and the procedure followed is outlined
below
Heat transfer coefficients
Heat transfer correlations need to be applied to evaluate the heat transferred coefficients
caused by natural and forced convection Heat transfer coefficients equation change according to the
geometry of the body involved in the heat transfer process For the particular case under study
different heat transfer coefficients need to be considered for the turbine bearing housing compressor
casing and cooling oil Below are given some of the correlations included in the model
-Turbine casing in the turbine casing have been considered three surfaces transferring heat [20] [21]
1 the annular surface (Eq 25)
2 both ends of the cylinder (Eq 26)
-Bearing housing surface the heat transfer on the bearing housing is similar to that on the annular
surface of the turbine casing with the main difference that unlike the turbine casing (where the surface
was treated as isothermal) the heat transfer coefficient in the bearing housing varies in the axial
direction [22]
-Compressor casing the compressor casing was modeled as a disc (in the paper referred as
compressor Back-Plate) with the internal diameter equal to the external diameter of the bearing
housing The temperature was assumed to vary only along the radius Similarly to the turbine round
plate the same correlation for the Nusselt number and the heat transfer coefficient was included in the
model6
-Compressor and turbine on the inside of the compressor and turbine volute there is significant
forced convection The volute is modelled as a straight pipe and the heat transfer coefficient can be
calculated from the Nusselt number when D2 is chosen for the characteristic length
Temperature distribution and heat fluxes calculation
The next step involved is the evaluation of the temperature distributions in the turbine casing
the shaft the bearing housing and the compressor casing For reasons of space only the shaft case will
be provided here [23]
-Shaft The radial variation of the temperature was omitted since the shaft has a small diameter and
high thermal conductivity hence the temperature difference along the radius is lower than the axial
temperature variation In addition to this the internal energy was considered to be constant since the
model was developed as steady state The energy balance for an infinitesimal element of the shaft then
simplifies to Eq (29) and it is shown in Fig 27
(29)
Please note that the y direction in the Eq (27) was introduced to show that the compressor back-plate is normal to the axial direction of
the turbocharger The addition of an extra frame of reference might lead the reader to consider the model solution as a 2-D problem This is
not the case as the heat transfer model remains unaltered and it lies on the assumption of 1-D analysis
The term can be expressed by use of the Taylor and the heat transferred to the oil ( and
the axial derivative of the conductive heat flux can be rewritten by mean of Fourierrsquos law This leads
to Eq (30) for the axial distribution of heat along the shaft
To solve this differential equation of second order two boundary conditions have to be provided A
similar approach was followed for the other parts constituting the turbocharger model Two main
assumptions were made The first is that the the effective temperature of the gas corresponds to the
average temperature at the inlet and the exit to the rotor while the second is that the heat transfer
coefficients n both ends of the shaft is assumed to be equal to those of the turbine (x=LS) and the
compressor (x=0) The final amount of heat delivered by the shaft to the air is then given in Eq (31)
REFERENCES
[1] Rautenberg M Mobarak A Malobabic M Influence of heat transfer between turbine
and compressor on the performance of small turbochargers Int Gas Turbine
Congress 1983 IGTC-73
[2] Rautenberg M Krammer N On the thermodynamics of non-adiabatic compression
and expansion processes in turbomachines 1984 Proceedings of the 5th
International
Conference for Mechanical Power Engineering Cairo
[3] Shaaban S Seume JR Analysis of turbocharger non-adiabatic performance 2006
Proceedings of the 8th
international conference on turbochargers and Turbocharging
London C647027
[4] Shaaban S Experimental investigation and extended simulation of turbocharger non-
adiabatic performance PhD Thesis University of Hannover 2004
[5] Hagelstein D Beyer B Seume JR Rautenberg M Heuristical view on the non-
adiabatic coupling system of combustion engine and turbocharger 2002 Proceedings
of the 7th
International conference on turbochargers and turbocharging London
C602015
[6] Jung M Ford R Glover K Collings N Christen U Watts M Parameterization and
transient validation of a variable geometry turbocharger for mean-value modeling at
low and medium speed-load points SAE Powertrain and fluid systems conference
San Diego 2002 SAE 2002-01-2729
[7] Cormerais M Hetet JF Chesse P Maiboom A Heat transfer analysis in a
turbocharger compressor Modeling and experiments SAE world congress Detroit
2006 SAE 2006-01-0023
[8] Abdelhamid S Berndt R Grigoriadis P Hagelstein D Nickel J Pucher H Seume JR
Advanced presentation and extrapolation of turbocharger maps as a boundary
condition of the engine process simulation 2003 Stuttgart international symposium
on motor vehicles and engines Stuttgart
[9] Chapman KS Nguru R Shultz J Simplified methodology to correct turbocharger
field measurements for heat transfer and other effects Final Report for gas research
institute 2002 GRI-020156
[10] Bohn D Heuer T Kusterer K Conjugate flow and heat transfer investigation of a
turbocharger Part i - numerical results Proceedings of ASME turbo expo Atlanta
2003 GT2003-38445
[11] Bohn D Moritz N Wolff M Conjugate flow and heat transfer investigation of a turbo
charger Part ii - experimental results Proceedings of ASME turbo expo Atlanta
2003 GT-2003-38849
[12] Heuer T Engels B Wollscheid P Thermomechanical analysis of a turbocharger based
on conjugate heat transfer Proceedings of ASME turbo expo Reno-Tahoe (Nevada)
2005 GT 2005-68059
[13] Baines N Wygant KD Antonis D The analysis of heat transfer in automotive
turbochargers Proceedings of the ASME turbo expo Orlando 2009 GT2009-59353
[14] Casey MV Schlegel M Performance estimation of turbocharger compressor at low
pressure ratios Institute of thermal turbomachinery (ITSM) University of Stuttgart
2008
[15] Casey MV Fesich TM On the efficiency of compressors with adiabatic flows
Proceedings of the ASME turbo expo Orlando 2009 GT 2009-59015
[16] Stanitz JD Some theoretical aerodynamic investigations of impellers in radial and
mixed flow centrifugal compressors Proceedings of the ASME turbo expo 1952 pp
74- 473
[17] Rodgers C A diffusion factor correlation for centrifugal impeller stalling Proceedings
of the ASME turbo expo 1978 GT-61
[18] Koonlaya K Heat transfer investigation of jet impingement coupled with dimples
PhD Thesis Imperial College London 2004
[19] Cengel YA Heat Transfer A Practical Approach McGraw-Hill (Tx) 2nd
edition
2002
[20] Dittus PW Boelter LMK Heat Transfer in Automobile Radiators of the Tubular
Type University of California Publication Engineer Vol 2 pp 232- 248 1930
[21] Lewandoski W Radziemska E Heat Transfer by Free Convection from an Isothermal
Vertical Round Space in Unlimited Space Applied Energy Vol 68 pp 187ndash201
2001
[22] Lomas CG Fundamentals of hot-wire anemometry Cambridge University Press pp
63-69 1986
[22] Bayley F J Owen JM Turner AB Heat Transfer William Clowes and Sons Ltd
London 1972
[23] Kumm B Development and Application of a Theoretical Model to Predict Heat
Fluxes from the Turbine to the Compressor in a Turbocharger Final year project
report Imperial College of Science Technology and Medicine - University of
London UK 2007
FIGURES
Figure 1 Compression diagram
Figure 2 Test rig layout (Kyartos 2006)
Figure 3 Test rig overview (Kyartos 2006)
Figure 4 Instrumented turbocharger
EXTERNAL SIDE
TOP
ENGINE SIDE
Oil Inlet Temperature
Oil Exit Temperature
Turbine Side Temp Exh Manifold
Compressor Side Temp Exh Manifold
Speed Sensor
Oil Flow Sensor
Figure 5 Turbine casing inner - outer wall temperature difference in the three locations
Engine Top and External side
Figure 6 Compressor casing outer - inner wall temperature difference in the three locations
Engine Top and External side
0
10
20
30
40
50
60
70
300 400 500 600 700 800 900 1000
∆T
wt [K
]
Exhaust gases temperature [K]
Turbine casing temperature difference between inner and outer wall
∆TwtEngine
∆TwtTop
∆TwtExternal
asymp40 K
∆Twt= Twinner-Twouter
0
5
10
15
20
25
30
35
250 350 450 550 650 750 850 950 1050
∆T
wc [K
]
Exhaust gases temperature [K]
Compressor casing temperature difference between outer and inner wall
∆TwcEngine
∆TwcTop
∆TwcExternal
asymp29 K
∆Twc= abs(Twcinner-Twciouter)
Figure 7 Compressor casing occurring heat fluxes
Figure 8 Turbine casing occurring heat fluxes
Figure 9 Temperature trend for the cooling oil and the bearing housing
Figure 10 Temperature trend for the exhaust manifold and exhaust gases
290
310
330
350
370
390
410
430
300 400 500 600 700 800 900
Tem
pera
ture
[K
]
Exhaust gases temperature [K]
Surface temperature bearing housing and cooling oil
Bearing Housing - 3000 rpm
Oil InletOutlet - 3000 rpm
Bearing Housing - 2000 rpm
Oil InletOutlet - 2000 rpm
Bearing Housing - 1000 rpm
Oil InletOutlet - 1000 rpm
270
370
470
570
670
770
870
0 50 100 150 200 250
Tem
pera
ture
[K
]
Load [Nm]
Surface temperature of the exhaust manifold
Turbine side - 3000 rpm
Compressor side - 3000 rpm
Turbine side - 2000 rpm
Compresor side - 2000 rpm
Turbine side - 1000 rpm
Compressor side - 1000 rpm
Exhaust gasses - 3000 rpm
Exhaust gasses - 2000 rpm
Exhaust gasses - 1000 rpm
gases
gases
gases
Figure 11 Compressor exit temperature
Figure 12 Adiabatic vs non-adiabatic compressor efficiency and exit temperature
0
3
6
9
12
15
18
21
24
273
293
313
333
353
373
393
413
433
453
360 560 760 960
Devia
tion [
]
Tem
pera
ture
[K
]
Exhaust gases temperature [K]
Prediction compressor exit temperature
Measured Compressor Exit Temperature
Predicted Compressor Exit Temperature
Surface Temperature Bearing Housing
Deviation
Measurements Uncertainty plusmn 15degC
300
350
400
450
500
00
01
02
03
04
05
06
07
08
09
10
500 600 700 800 900 1000
Com
pre
ssor
exit t
em
pera
ture
[K
]
Com
pre
ssor
rela
tive e
ffic
iency
ηc
Exhaust gases temperature [K]
Comparison adiabatic vs non-adiabatic compressor efficiency and exit temperature
Adiabatic efficiency
Non adiabatic efficiency
Adiabatic exit temperature
Non adiabatic exit temperature
Figure 13 Physical Model - A Real model of the turbocharger - B Simplified geometry included in the 1-D