Page 1
Scholars' Mine Scholars' Mine
Doctoral Dissertations Student Theses and Dissertations
Spring 2013
Heat transfer and bubble dynamics in bubble and slurry bubble Heat transfer and bubble dynamics in bubble and slurry bubble
columns with internals for Fischer-Tropsch synthesis of clean columns with internals for Fischer-Tropsch synthesis of clean
alternative fuels and chemicals alternative fuels and chemicals
Moses Odongo O. Kagumba
Follow this and additional works at: https://scholarsmine.mst.edu/doctoral_dissertations
Part of the Chemical Engineering Commons
Department: Chemical and Biochemical Engineering Department: Chemical and Biochemical Engineering
Recommended Citation Recommended Citation Kagumba, Moses Odongo O., "Heat transfer and bubble dynamics in bubble and slurry bubble columns with internals for Fischer-Tropsch synthesis of clean alternative fuels and chemicals" (2013). Doctoral Dissertations. 2032. https://scholarsmine.mst.edu/doctoral_dissertations/2032
This thesis is brought to you by Scholars' Mine, a service of the Missouri S&T Library and Learning Resources. This work is protected by U. S. Copyright Law. Unauthorized use including reproduction for redistribution requires the permission of the copyright holder. For more information, please contact [email protected] .
Page 3
i
HEAT TRANSFER AND BUBBLE DYNAMICS IN BUBBLE AND SLURRY
BUBBLE COLUMNS WITH INTERNALS FOR FISCHER-TROPSCH SYNTHESIS
OF CLEAN ALTERNATIVE FUELS AND CHEMICALS
by
MOSES ODONGO O. KAGUMBA
A DISSERTATION
Presented to the Faculty of the Graduate School of the
MISSOURI UNIVERSITY OF SCIENCE AND TECHNOLOGY
In Partial Fulfillment of the Requirements for the Degree
DOCTOR OF PHILOSOPHY
in
CHEMICAL ENGINEERING
2013
Approved by
Muthanna H. Al-Dahhan, Advisor
Pathasakha Neogi
Joseph Smith
Douglas Ludlow
Shoaib Usman
Page 4
ii
2013
Moses Odongo O. Kagumba
All Rights Reserved
Page 5
iii
ABSTRACT
Synthesis gas, a mixture of CO and H2 obtained from coal, natural gas and
biomass are increasingly becoming reliable sources of clean synthetic fuels and
chemicals and via Fischer-Tropsch (F-T) synthesis process. Slurry bubble column reactor
is the reactor of choice for the commercialization of the F-T synthesis. Even though the
slurry bubble column reactors and contactors are simple in structures, their design, scale-
up, operation, and performance prediction are still challenging and not well understood
due to complex interaction of phases. All the studies of heat transfer have been performed
without simultaneously investigating the bubble dynamics adjacent to the heat transfer
surfaces, particularly in slurry with dense internals.
This dissertation focuses on enhancing the understanding of the role of local and
overall gas holdup, bubble passage frequency, bubble sizes and bubble velocity on the
heat transfer characteristics by means of a hybrid measurement technique comprising an
advanced four-point optical probe and a fast response heat transfer probe used
simultaneously, in the presence and absence of dense internals. It also seeks to advance a
mechanistic approach for estimating the needed parameters for predicting the heat
transfer rate in two phase and three phase systems.
The results obtained suggest that the smaller diameter internals gives higher heat
transfer coefficient, higher local and overall gas holdup, bubble passage frequency and
specific interfacial area but smaller bubble sizes and lower axial bubble velocities. The
presence of dense internals enhances the heat transfer coefficient in both the large and
smaller columns, while increased column diameter increases the heat transfer coefficient,
axial bubble velocity, local and overall gas holdup, bubble chord lengths and specific
interfacial area. Addition of solids (glass beads) leads to increased bubble chord lengths
and increase in axial bubble velocity, but a decrease in local and overall gas holdup, a
decrease in bubble passage frequency and decrease in the heat transfer coefficient.
Further, a mechanistic assessment of the dependence of the heat transfer
coefficient on the bubble dynamics shows that the contact time needed in the heat transfer
coefficient estimation is indeed a function of the bubble passage frequency and local gas
holdup. Hence the variation of the heat transfer coefficient with contact time is via bubble
passage frequency and local gas phase holdup, which are related with sizes and velocity.
Page 6
iv
ACKNOWLEDGMENTS
A little over four and a half years of my graduate studies seem to have come to an
end. Many have crossed my path during this endeavor and contributed directly or
indirectly in my work. When I first met with Prof, Muthanna. H. Al-Dahhan in early
2009 as my academic and research advisor, I knew making friends with chemical reactors
was inevitable. It has been an excellent opportunity working under him who sees an
opportunity in every challenge. I sincerely thank him for his insightful thoughts,
encouragement, advice and valuable suggestions throughout the journey.
I wish to express my sincere gratitude to all my Ph.D. committee members, Prof.
J. Smith, Prof. P. Neogi, Prof. D. Ludlow and Prof. S. Usman for finding the time to be
on my Ph.D. dissertation committee. I also wish to thank the funding agency which made
this work possible. To the Chemical Engineering staff, thank you for answering my
questions and clearing my doubts. Special thanks to Adam Lenz. To my labmates, past
and present thank you for your numerous help and support.
I am eternally indebted to my parents, family, and friends for their support and
encouragement throughout this endeavor. To my elder brother Jackson, for the sacrifices,
unwavering support, belief in me and constant encouragement even when nothing seemed
possible, I am forever grateful. To my dad who instilled the sense of hard work in me, to
my mom for her unbounded love and support you remained the pillar of this work. To my
wife, Celline, I owe you probably more than I can ever pay back, without you none of
this could have been achieved. To our lovely girls Gloria and Ashley, days turned into
years but you never doubted I would be home with you soon. You were all the motivation
I had to get this work done. I dedicate this dissertation to you.
Page 7
v
TABLE OF CONTENTS
Page
ABSTRACT … ................................................................................................................. iii
ACKNOWLEDGMENTS ................................................................................................. iv
LIST OF ILLUSTRATIONS .............................................................................................. x
LIST OF TABLES .......................................................................................................... xvii
NOMENCLATURE ...................................................................................................... xviii
SECTION
1. INTRODUCTION ...................................................................................................... 1
1.1. ENERGY CONCERNS, FISCHER-TROPSCH AND SLURRY BUBBLE
COLUMNS……………………………………………………………………. 1
1.2. MOTIVATION AND RESEARCH OBJECTIVES ........................................... 8
1.3. THESIS STRUCTURE ..................................................................................... 13
2. BACKGROUND AND LITERATURE SURVEY ................................................. 15
2.1. BUBBLE DYNAMICS IN BUBBLE AND SLURRY BUBBLE COLUMNS15
2.2. HEAT TRANSFER IN BUBBLE AND SLURRY BUBBLE COLUMNS ..... 24
2.3. EFFECT OF SCALE IN BUBBLE AND SLURRY BUBBLE
COLUMNS…………………………………………………………………...38
2.4. SUMMARY ...................................................................................................... 47
3. EFFECT OF DENSE HEAT EXCHANGING INTERNALS ON BUBBLE
DYNAMICS IN BUBBLE AND SLURRY BUBBLE COLUMNS ...................... 49
3.1. MEASUREMENTS TECHNIQUE .................................................................. 49
3.1.1. Four-Point Fiber Optical Probe .............................................................. 50
3.1.2. Data Processing and Optical Probe Signal Analysis .............................. 53
Page 8
vi
3.2. IMPACT OF INTERNALS SIZE AND CONFIGURATION ON LOCAL
GAS HOLDUP AND BUBBLE PROPERTIES IN 6” BUBBLE COLUMN 57
3.2.1. Experimental System and Setup ............................................................. 57
3.2.2. Results and Discussion ........................................................................... 61
3.2.2.1. Overall and local gas holdup..................................................... 61
3.2.2.2. Bubble passage frequency ..........................................................69
3.2.2.3. Specific interfacial area..............................................................73
3.2.2.4. Bubble chord length ...................................................................77
3.2.2.5. Axial bubble velocity .................................................................83
3.3. IMPACT OF SOLIDS LOADING AND DENSE INTERNALS ON
BUBBLE PROPERTIES IN 6” AND 18” BUBBLE COLUMNS .................. 88
3.3.1. Scope ...................................................................................................... 88
3.3.2. Experimental System .............................................................................. 91
3.3.3. Results and Discussion ........................................................................... 96
3.3.3.1. Local gas holdup and overall gas holdup .................................. 97
3.3.3.2. Specific interfacial area........................................................... 104
3.3.3.3. Bubble passage frequency ....................................................... 108
3.3.3.4. Bubble chord length ................................................................ 111
3.3.3.5. Axial bubble velocity .............................................................. 116
3.4. REMARKS .................................................................................................... 121
4. IMPACT OF SOLIDS LOADING AND DENSE INTERNALS ON THE
HEAT TRANSFER COEFFICIENT IN BUBBLE AND SLURRY BUBBLE
COLUMNS ........................................................................................................... 125
4.1. SCOPE ............................................................................................................ 125
4.2. EXPERIMENTAL SYSTEM ......................................................................... 126
4.3. RESULTS AND DISCUSSION ..................................................................... 129
Page 9
vii
4.3.1. Instantaneous Heat Transfer Coefficient .............................................. 130
4.3.2. Effect of Solids Loading and Superficial Gas Velocity on Heat
Transfer Coefficient ............................................................................. 132
4.3.3. Effect of Solids Loading on Heat Transfer Coefficient and its Radial
Variation .............................................................................................. 139
4.3.4. Comparison of the Heat Transfer Coefficient Measurements with
Existing Data ........................................................................................ 143
4.3.5. Effect of Dense Internals and Gas Velocity on Heat Transfer
Coefficient without Solids ................................................................... 146
4.3.6. Effect of Dense Internals and Solids Loading on the Heat Transfer
Coefficient ............................................................................................ 151
4.4. MIMICKED HEAT EXCHANGING INTERNALS HEAT TRANSFER
PROBE…………………………………………………………………..…155
4.4.1. Scope………………………………………………………………...155
4.4.2. Assessment of Advanced Mimicked Heat Exchanging Internals
Heat Transfer Probes...………………………………………..……..157
4.5. SUMMARY ……………….. ..................................................................... 161
5. MECHANISTIC ASSESSMENT OF HEAT TRANSFER COEFFICIENT
BASED ON BUBBLE DYNAMICS…...................................................................... 164
5.1. SCOPE ……………….. ................................................................................ 164
5.2. EXPERIMENTAL SETUP ……………….. ................................................ 171
5.3. CONTACT TIME MODELING DEVELOPMENT ……………….. ......... 173
5.4. FILM THICKNESS ESTIMATION ……………….. .................................. 176
5.5. RESULTS AND DISCUSSION ……………….. ........................................ 178
5.5.1. Contact Time Results and Discussion .................................................. 178
5.5.2. Film Thickness Results and Discussion ............................................... 181
5.5.3. Heat Transfer Coefficient Results and Discussion ……………….. .... 187
Page 10
viii
5.5.4. Heat Transfer Coefficient and Bubble Dynamics
Distribution……………….. ................................................................ 191
5.6. REMARKS……………….. .......................................................................... 193
6. EFFECT OF SCALE ON THE HEAT TRANSFER COEFFICIENT AND
BUBBLE DYNAMICS IN BUBBLE AND SLURRY BUBBLE COLUMNS .. 195
6.1. SCOPE ……………….. ................................................................................ 195
6.2. EXPERIMENTAL SETUP ……………….. ................................................ 198
6.3. RESULTS AND DISCUSSION ……………….. ........................................ 202
6.3.1. Effect of Column Diameter on the Heat Transfer Coefficient and
Bubble Dynamics in Columns without Internals without Solids ........ 202
6.3.1.1 Effect of column diameter on heat transfer coefficient ............202
6.3.1.2 Effect of column diameter on local and overall gas holdup .....206
6.3.1.3 Effect of column diameter on bubble passage frequency and
specific interfacial area .............................................................208
6.3.1.4 Effect of column diameter on the radial profiles of axial liquid
velocity in empty columns and no solids ..................................211
6.3.2. Effect of Column Diameter on the Heat Transfer Coefficient and
Bubble Dynamics in Columns without Internals with Solids .............. 213
6.3.2.1. Effect of column diameter on the heat transfer coefficient ......213
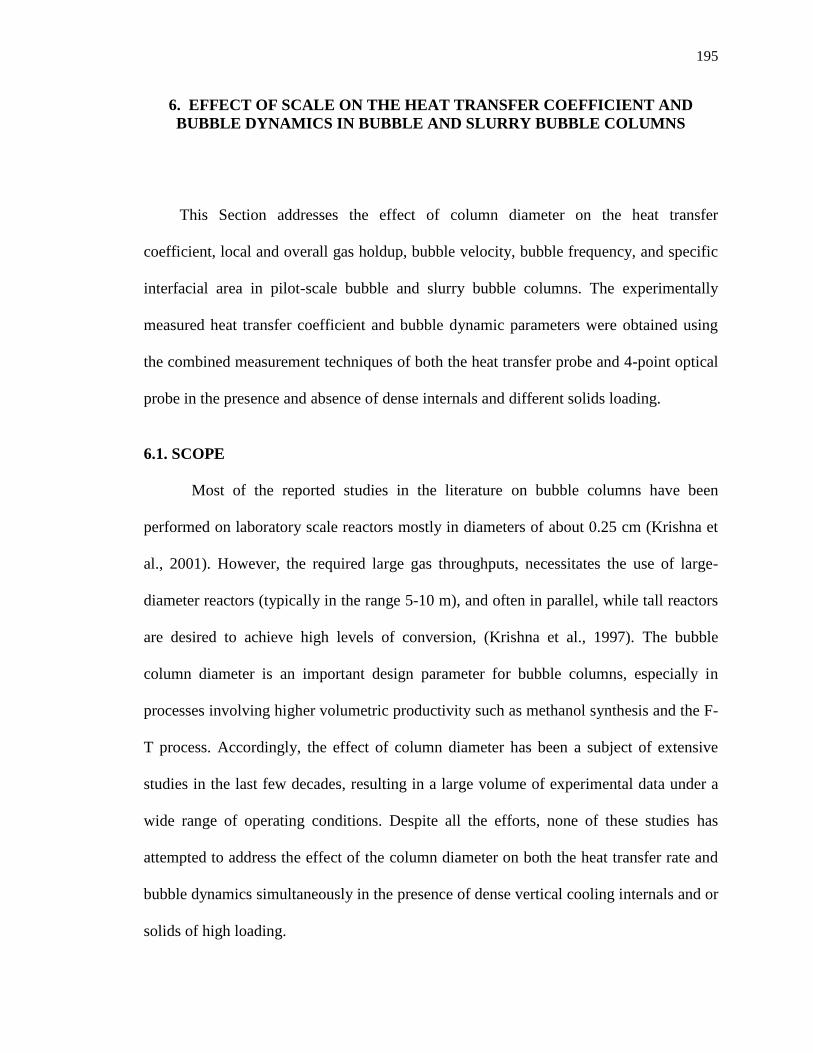
6.3.2.2. Effect of column diameter on the local gas holdup ................ 215
6.3.2.3. Effect of column diameter on bubble passage frequency and
specific interfacial area ........................................................... 216
6.3.2.4. Effect of column diameter on the axial bubble velocity ......... 218
6.3.3. Effect of Column Diameter on the Heat Transfer Coefficient and
Bubble Dynamics in Columns Equipped with Dense Internals ........... 219
6.3.3.1. Effect of column diameter on the heat transfer
coefficient .................................................................................219
6.3.3.2. Effect of column diameter on the local gas holdup ................. 220
Page 11
ix
6.3.3.3. Effect of column diameter on the bubble passage frequency
and specific interracial area .....................................................221
6.3.4. Development of Heat Transfer Coefficient Empirical Correlation
for Columns without Internals ............................................................ 222
6.4. REMARKS ..................................................................................................... 225
7. CONCLUDING REMARKS AND RECOMMENDATIONS ............................. 227
7.1. CONCLUDING REMARKS ……………….. ............................................. 227
7.1.1. Bubble Dynamics ................................................................................. 227
7.1.2. Heat Transfer Coefficient ..................................................................... 229
7.1.3. Effect of Column Diameter ................................................................. 230
7.2. RECOMMENDATION FOR FUTURE WORK ……………….. ............... 230
APPENDICES
A. HEAT TRANSFER STUDIES SUMMARY ........................................................ 232
B. THE HEAT TRANSFER COEFFICIENT MEASUREMENT TECHNIQUE
PROCEDURE ....................................................................................................... 238
C. ADDITIONAL RESULTS OF BUBBLE DYNAMICS IN BUBBLE AND
SLURRY BUBBLE COLUMNS .......................................................................... 243
D. DEVELOPMENT OF EMPIRICAL CORRELATIONS ..................................... 250
BIBLIOGRAPHY ........................................................................................................... 255
VITA……………………. .............................................................................................. 269
Page 12
x
LIST OF ILLUSTRATIONS
Figure Page
1.1. Variety and changing dynamics of nonpetroleum feedstocks .................................... 3
1.2. Established slurry bubble column reactor configuration with internal cooling for
Fischer-Tropsch synthesis ........................................................................................... 5
1.3. Synthesis gas utilization into fuels and chemicals ...................................................... 8
2.1. Bubble properties at z/D=5.1 for different spargers at Ug = 30 cm/s (Xue, 2004) .. 17
2.2. Gas holdup radial profiles at different axial positions at, Ug = 30 cm/s
(Xue, 2004) ............................................................................................................... 17
2.3. Configuration of internals covering 5 % of column’s cross-sectional area
(Chen et al., 1999) .................................................................................................... 19
2.4. Schematic representation of enhanced large scale liquid recirculation and
reduced small scale liquid recirculation in bubble columns ................................... 20
2.5. Different configurations of internals bundles covering (a) 20 %, (b) 15 %,
and (c) 10 % of the total column’s Cross-sectional Area (Youssef, 2010) .............. 22
2.6. Effect of vertical internals on the local gas holdup (Youssef and Al-Dahhan,
2009) ........................................................................................................................ 23
2.7. Contact time between liquid elements and the film under various operating
conditions .................................................................................................................. 28
2.8. Bubble wake enhancd heat transfer coefficient (a) Experimental system, (b)
Effect of bubble size on instantaneous heat transfer coefficient due to the passage
of bubble in liquid for probe located at center, r/R (-) = 0.0
(Kumar and Fan, 1994) ............................................................................................ 30
2.9. Effect of internals and actual gas velocity on the heat-transfer coefficients at
the column center .................................................................................................... 36
2.10. Effect of solids loading and gas velocity on the heat-transfer coefficients
at the column center ................................................................................................. 38
2.11. Radial profiles of (a) liquid velocity in 0.051 diameter column (b) liquid velocity
in 1 m (c) gas velocity in 0.051 m diameter column and (d) gas velocity in 1 m
diameter column ...................................................................................................... 43
2.12. Overall gas holdup as a function of column diameter and superficial gas
velocity (Forret et al., 2006) ................................................................................... 45
3.1. Configurations of four-point optical probe (a) Optical probe tips (b) Side view of
four poins probe tips (c) TEM image of finished tip , (d) top view of four
points probe tip ......................................................................................................... 52
Page 13
xi
3.2. Fiber optic coupling scheme and probe tip with the probe response to a bubble
strike (a) Fiber optic coupling and probe tip (b) Bubble striking four-point
optical probe tips ....................................................................................................... 53
3.3. The Physical Situation of the Bubble Velocity and Chord Length Measurements
(Xue, 2004) ............................................................................................................. 54
3.4. Schematic diagram of the experimental system with dense internals in 6-inch
column ...................................................................................................................... 59
3.5. Internals configurations covering 25 % CSA (a) 0.5-inch diameter (b) 1-inch
diameter..................................................................................................................... 60
3.6. Effect of dense internals (0.5 inch diameter) on (a) Overall gas holdup and
(b) Local gas holdup at r/R(-) = 0.0, with superficial gas velocity based on the
total cross sectional area and free cross-sectional area of the column ...................... 63
3.7. Effect of size of internals on radial profiles of local gas holdup at Ug = 3 cm/s (a)
Ug based on free cross-sectional area (b) Ug based on total cross-sectional area .... 64
3.8. Effect of size of internals on radial profiles of local gas holdup at Ug = 45 cm/s
(a) Ug based on free cross-sectional area. (b) Ug based on total cross-
sectional area ............................................................................................................. 67
3.9. Optical probe measurements comparison with literature correlation of Schweitzer
et al., 2001 in bubble column with 0.5-inch diameter internals with superficial gas
velocity based on (a) free cross-sectional area (b) total cross-sectional
area ........................................................................................................................... 70
3.10. Effect of size of internals on radial profiles on bubble passage frequency at
Ug = 45 cm/s (a) Ug based on free cross-sectional area. (b) Ug based on total
cross-sectionalm area ............................................................................................... 72
3.11. Effect of size of internals on Specific interfacial area at r/R (-) = 0.0, with Ug
based on free cross-sectional area ............................................................................ 74
3.12. Variation of overall gas holdup with superficial gas velocity with fine and coarse
sparger ...................................................................................................................... 75
3.13. Effect of size of internals and configuration on radial profiles of specific
interfacial area at Ug = 45 cm/s based free cross-sectional area .............................. 76
3.14. Effect of size of internals and configuration on the bubble chord length
distributions at r/R(-) = 0.0, (a) at Ug = 3 cm/s based free cross-sectional area
(b) at Ug = 45 cm/s based on free cross-sectional area (c) large-scale
view of Figure(b), (Equation 3.8) ........................................................................... 79
3.15. Effect of size of internals and configuration on the bubble chord length
distributions at r/R(-) = 0.5, (a) at Ug = 3 cm/s based free cross-sectional area (b)
at Ug = 45 cm/s based on free cross-sectional area (c) large-scale view
of Figure(b), (Equation 3.8) .................................................................................... 81
Page 14
xii
3.16. Effect of size of internals and configuration on the bubble chord length
distributions at r/R(-) = 0.9, (a) at Ug = 3 cm/s based free cross-sectional area
(b) at Ug = 45 cm/s based on free cross-sectional area (c) large-scale view
of Figure(b), (Equation 3.8) .................................................................................... 82
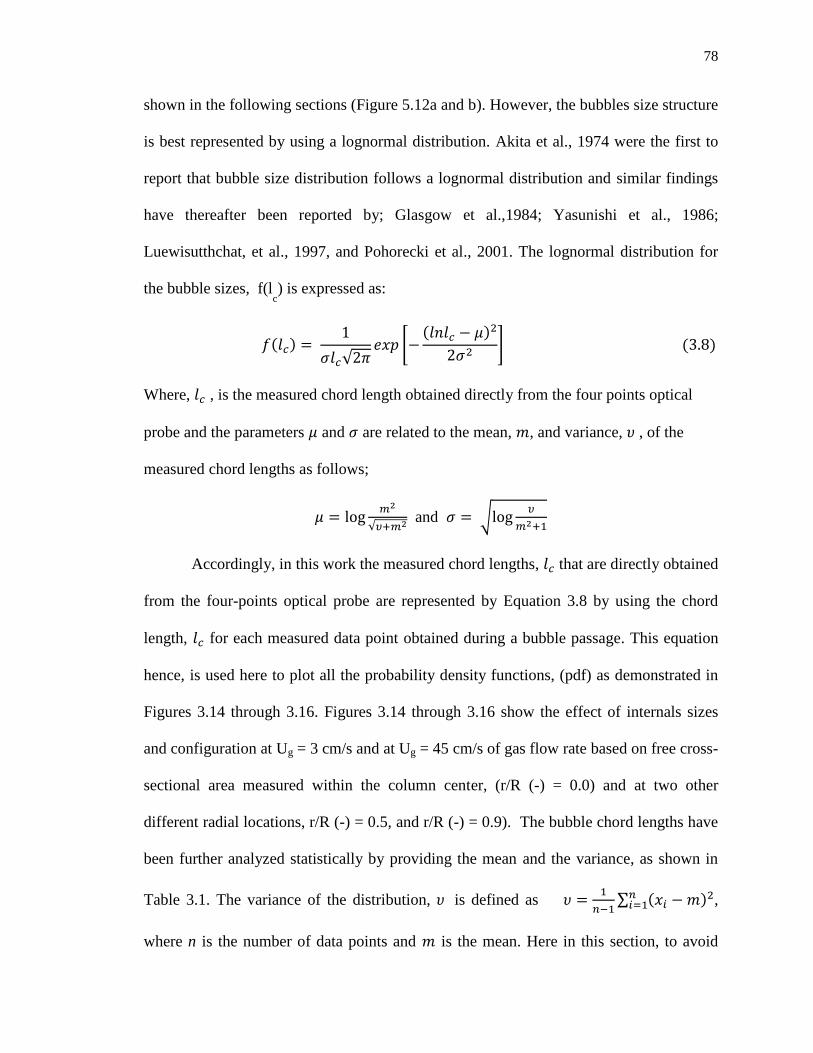
3.17. Effect of size of internals and configuration on the axial bubble velocity
distributions at r/R(-) = 0.0 (a) Ug = 3 cm/s based on free cross-sectional area
(b) Ug = 45 cm/s based on free cross-sectional area .............................................. 86
3.18. Effect of size of internals and configuration on the axial bubble velocity
distributions at r/R(-) = 0.5 (a) Ug = 3 cm/s based on free cross-sectional area
(b) Ug = 45 cm/s based on free cross-sectional area .......................................... 87
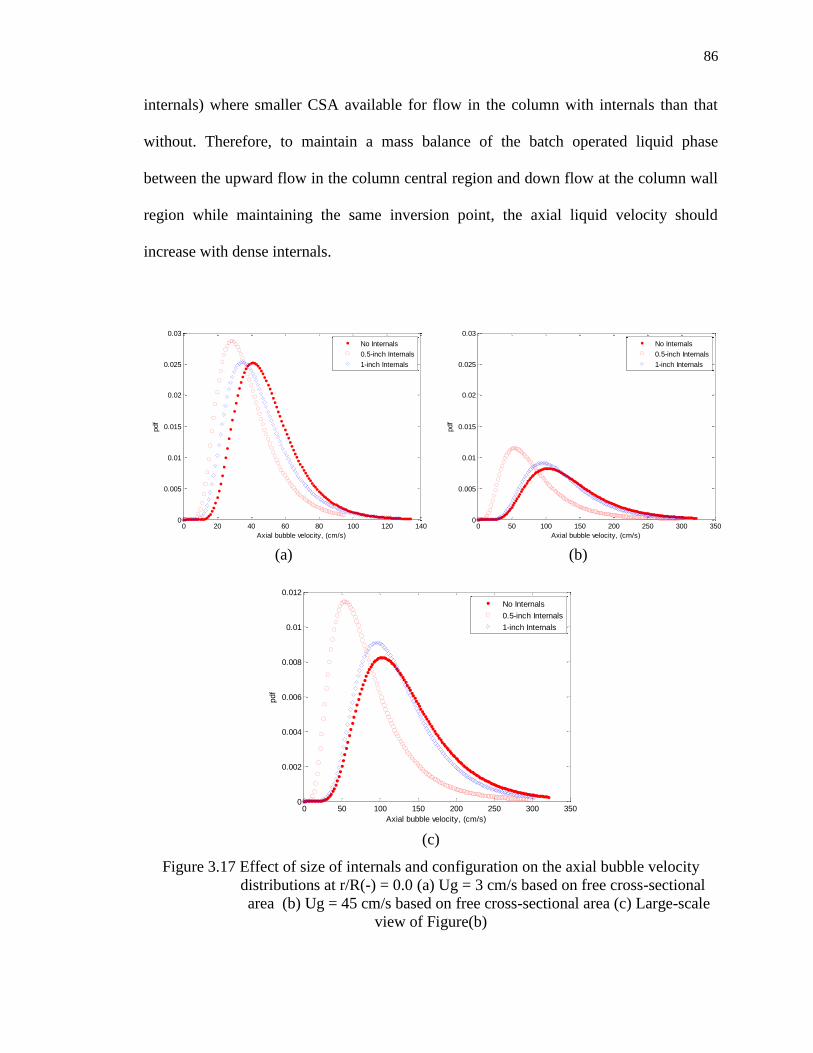
3.19. Effect of size of internals and configuration on the axial bubble velocity
distributions at r/R(-) = 0.9 (a) Ug = 3 cm/s based on free cross-sectional area
(b) Ug = 45 cm/s based on free cross-sectional area ............................................... 88
3.20. Schematic diagram of the pilot plant experimental setups ...................................... 94
3.21. Dense Internals Configuration and Details of Gas Distributor for both 6-inch and
18-inch diameter columns ........................................................................................ 95
3.22. Experimental setup photos (a)18-inch diameter column (b)18-inch with
dense internals (left) and 6-inch column with dense internals ................................ 96
3.23. Effect of solids loading, dense internals and superficial gas velocity on Overall
gas holdup at r/R(-) = 0.0. (a) Based on free cross-sectional area (b) Based
on total cross-sectional area ..................................................................................... 98
3.24. Effect of solids loading, dense internals and superficial gas velocity on local gas
holdup at r/R(-) = 0.0. (a) Based on free cross-sectional area (b) Based on
total cross-sectional area ........................................................................................ 101
3.25. Effect of solids loading and dense internals on radial profiles of local gas
holdup in 18-inch column based on the free cross-sectional area at (a)
Ug = 30 cm/s andb) Ug = 45 cm/s ........................................................................ 103
3.26. Effect of solids loading, dense internals and superficial gas velocity on Specific
interfacial area in 6-inch column at r/R = 0.0 (a)Based on free cross-sectional
area (b) Based on total cross-sectional area ........................................................... 106
3.27. Effect of solids loading and dense internals on radial profiles of specific
interfacial area in 18-inch column at Ug = 30 cm/s based on the free cross-
sectional area ......................................................................................................... 108
3.28. Effect of solids loading, dense internals and superficial gas velocity on
Bubble passage frequency at column center, r/R = 0.0. (a) Based on free
cross-sectional area (b) Based on total cross-sectional area .............................. 109
3.29. Effect of solids loading and dense internals on radial profiles of bubble passage
frequency in 18-inch column at Ug = 30 cm/s based on the free cross-sectional
area ......................................................................................................................... 111
Page 15
xiii
3.30. Effect of solids loading in the absence of internals on bubble chord length
distribution at dimensionless radius r/R(-) = 0.0 in 6-inch column (a) At
Ug = 3 cm/s (b) At Ug = 20 cm/s (c) Enlarged scale of (b), (Equation 3.8) ......... 113
3.31. Effect of solids loading in the presence of internals on bubble chord length
distribution at dimensionless radius r/R(-) = 0.0 in 6-inch column (a) at
Ug = 3 cm/s (b) at Ug = 20 cm/s, (Equation 3.8) ............................................ 114
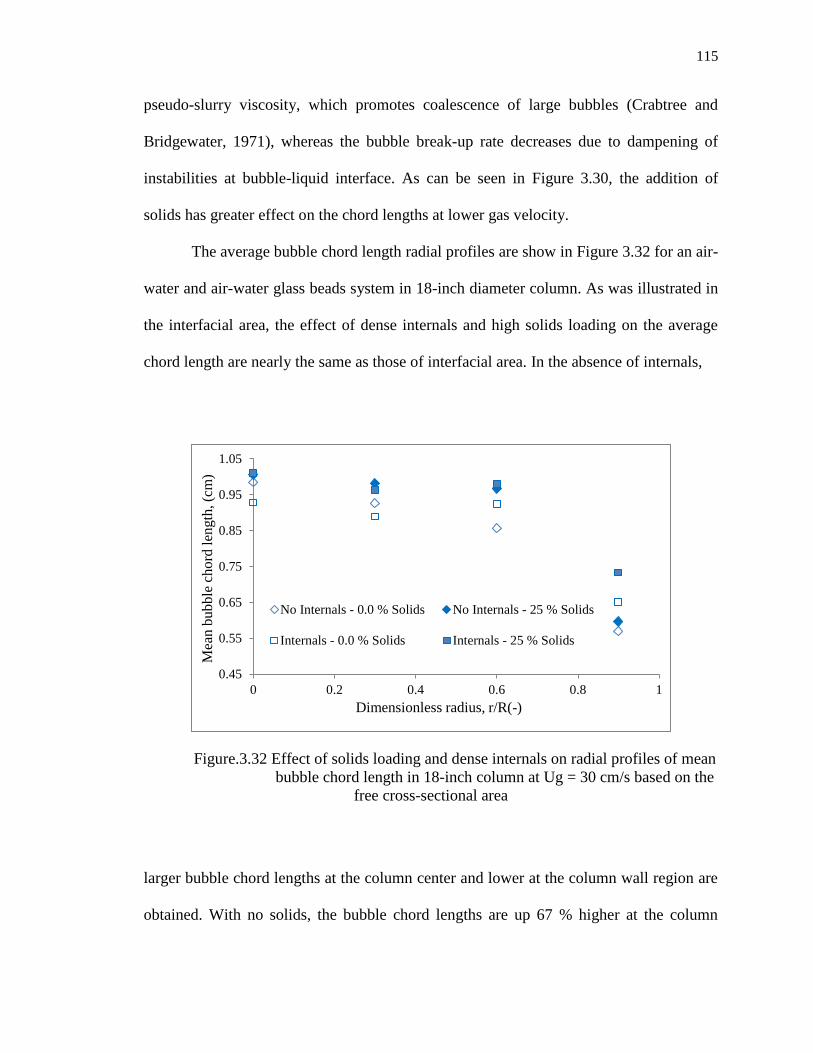
3.32. Effect of solids loading and dense internals on radial profiles of mean
bubble chord length in 18-inch column at Ug = 30 cm/s based on the free
cross-sectional area ................................................................................................ 115
3.33. Effect of solids loading, internals and superficial gas velocity on axial bubble
velocity (a) Ug-based on free cross-sectional area (b) Ug-based on total cross-
sectional area .......................................................................................................... 118
3.34. Effect of solids loading and dense internals on the radial profiles of (a) bubble
rise velocity (b) downward bubble velocity at Ug = 45 cm/s based on free
cross-sectional area in 18-inch diameter column .................................................. 120
3.35. Effect of solids loading and dense internals on radial profiles of axial
bubble velocity in 18-inch diameter column at Ug = 30 cm/s based on the
free cross-sectional area ....................................................................................... 121
4.1. Heat transfer probe assembly ................................................................................. 128
4.2. Instantaneous heat transfer coefficient signal (a) at 3 cm/s (b) at 20 cm/s
(c) fluctuation comparison at 3 cm/s and at 20 cm/s at r/R=0.0 in 6-inch
diameter column...................................................................................................... 131
4.3. Effect of solids volume fraction and superficial gas velocity on heat transfer
coefficient at r/R=0.0 in 6-inch bubble column ...................................................... 133
4.4. Effect of solids loading and superficial gas velocity in 6-inch diameter column on
(a)Local gas holdup (b)Bubble passage frequency (c) Mean bubble chord length
(d) Axial bubble velocity ........................................................................................ 135
4.5. Effect of solids loading and superficial gas velocity in 18-inch diameter column
on (a) Local gas holdup (b) Bubble passage frequency (c) Mean bubble chord
length (d) Axial bubble velocity ............................................................................ 136
4.6. Effect of solids volume fraction on radial profiles of heat transfer coefficient at
r/R=0.0 in 6-inch bubble column ........................................................................... 140
4.7. Effect of solids volume fraction on radial profiles of heat transfer coefficient at
r/R=0.0 in 18-inch bubble column at Ug = 45 cm/s ............................................... 141
4.8. Effect of solids loading on the local gas holdup radial profiles in 18-inch
diameter empty column at 45 cm/s ......................................................................... 142
4.9. Effect of solids loading on bubble chord length probability distributions in
empty columns at r/R(-) = 0.0 (a) 6-inch diameter (b) 18-inch diameter,
(Equation 3.8) ........................................................................................................ 142
Page 16
xiv
4.10. Comparison of the heat transfer coefficients measured in this work with
the reported data in air-water bubble column at the column center,
r/R (-) = 0.0 ........................................................................................................... 145
4.11. Effect of Internals on the radial profiles of the heat transfer coefficient in 6-inch
bubble column Ug based on free CSA without solids .......................................... 147
4.12. Effect of Internals on the radial profiles of the heat transfer coefficient in 18-inch
bubble column Ug based on free CSA without solids .......................................... 148
4.13. Effect of dense internals on the radial profiles of local gas holdup at different
superficial gas velocities based on free CSA in (a) 6-inch diameter column and
(b) 18-inch diameter column without solids ......................................................... 149
4.14. Impact of internals and solids loading in 6-inch bubble column on heat
transfer coefficient at r/R(-)= 0.0 with Ug based on free cross-sectional
area ........................................................................................................................ 152
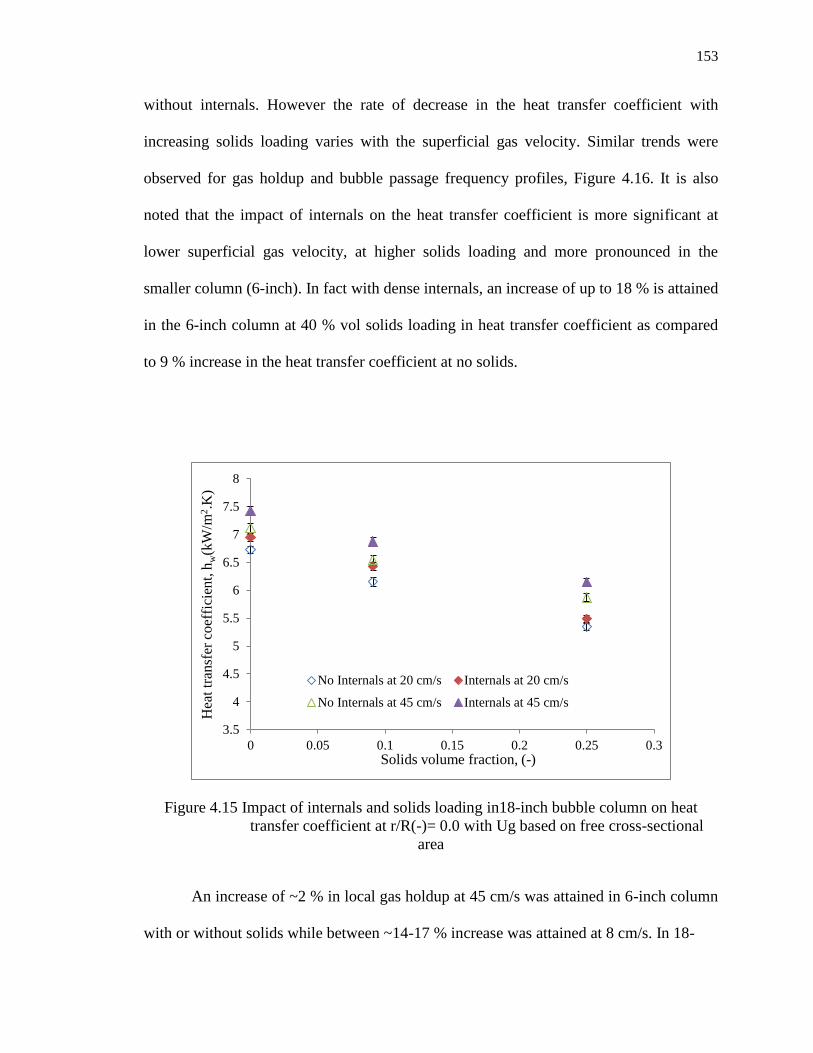
4.15. Impact of internals and solids loading in 18-inch bubble column on heat
transfer coefficient at r/R(-)= 0.0 with Ug based on free cross-sectional
area ........................................................................................................................ 153
4.16. Impact of internals and solids loading on bubble dynamic parameters (a) local
gas holdup in 6-inch column (b) local gas holdup in 18-inch column
(c) bubble passage frequency in 6-inch column (b) bubble passage frequency in
18-inch column ..................................................................................................... 154
4.17. Advanced mimicked extended rod heat transfer surface probes (a) Image photos
of half inch and one inch rods and (b) Image photo of the heat transfer rod
among internals in the column ............................................................................... 156
4.18. Comparison between the data obtained by embedded probe on the half- inch
internal rod and those measured by single L-shaped probe at z/D = 5.1 in 6-
inch column for an air-water system ...................................................................... 158
4.19. Comparison between the data obtained by embedded probe on the one-inch
internal rod and those measured by single L-shaped probe at z/D = 3.1 in 18-
inch column for an air-water system ..................................................................... 159
4.20. Comparison between the data obtained by embedded probe on the one-inch
internal rod and those measured by the half-inch internal at z/D = 5.1 in 6-inch
column for an air-water-glass beads system ( 25 % vol.) .................................... 160
5.1. Consecutive film and unsteady state surface renewal mechanism, ...................... 168
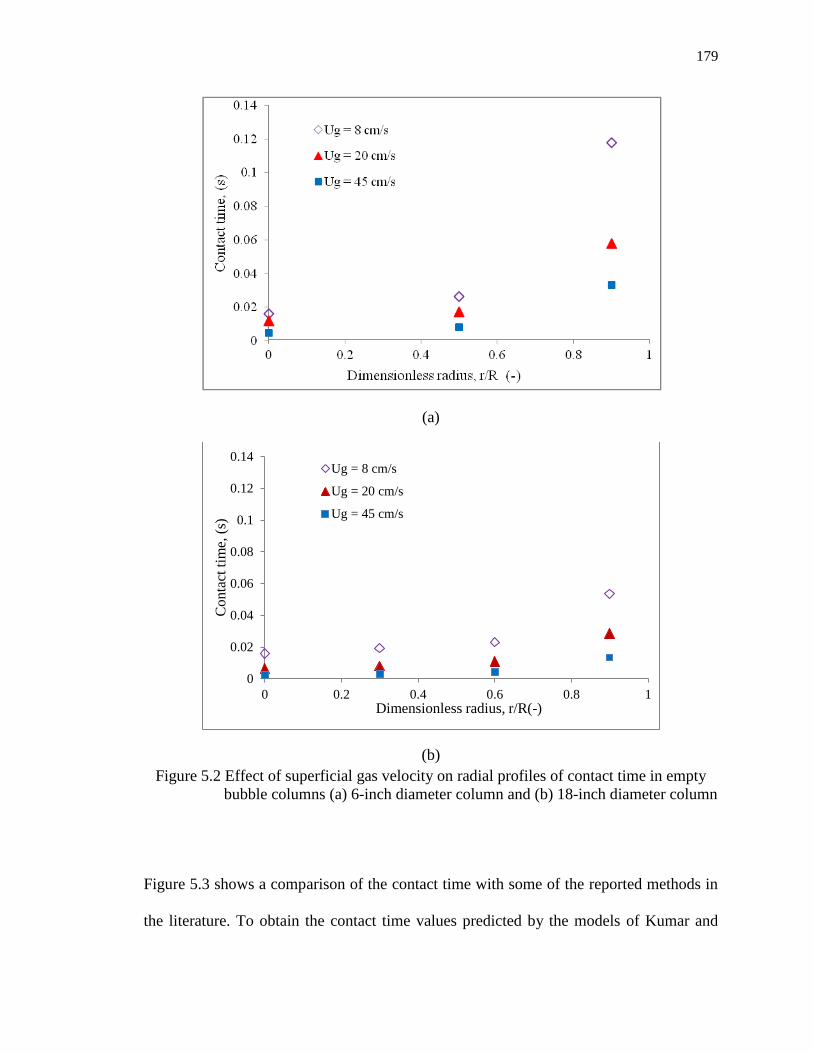
5.2. Effect of superficial gas velocity on radial profiles of contact time in empty
bubble columns (a) 6-inch column and (b) 18-inch column ................................. 179
5.3. Contact time comparison with the reported models for air water system in the
literature at the column center, r/R (-) = 0.0 for 18-in diameter column .............. 180
5.4. Distribution of the predicted contact time in 18-inch bubble column at r/R (-)
= 0.0 (a) at Ug = 8 cm/s (b) at Ug = 20 cm/s (c) Enlarged view of (a) ................. 182
Page 17
xv
5.5. Effect of superficial gas velocity on radial profiles of estimated film thickness in
18-inch empty bubble column ................................................................................ 183
5.6. A parity plot of the estimated film thickness (Equation, 5.26) vs film thickness
estimated from correlations of Kumar and Fan, 1994, Yang et al., 2000 and Li
and Prakash, 2001 in bubble column ..................................................................... 184
5.7. Distribution of the estimated boundary layer thickness in 18-inch bubble column
at r/R (-) = 0.0 (a) at Ug = 8 cm/s (b) at Ug = 20 cm/s .......................................... 186
5.8. Effect of superficial gas velocity on radial profiles of predicted heat transfer
coefficient in 18-inch empty bubble column ......................................................... 187
5.9. Comparison of the predicted heat transfer coefficient with the measured
heat transfer coefficient values in 18-inch bubble column without internals ........ 189
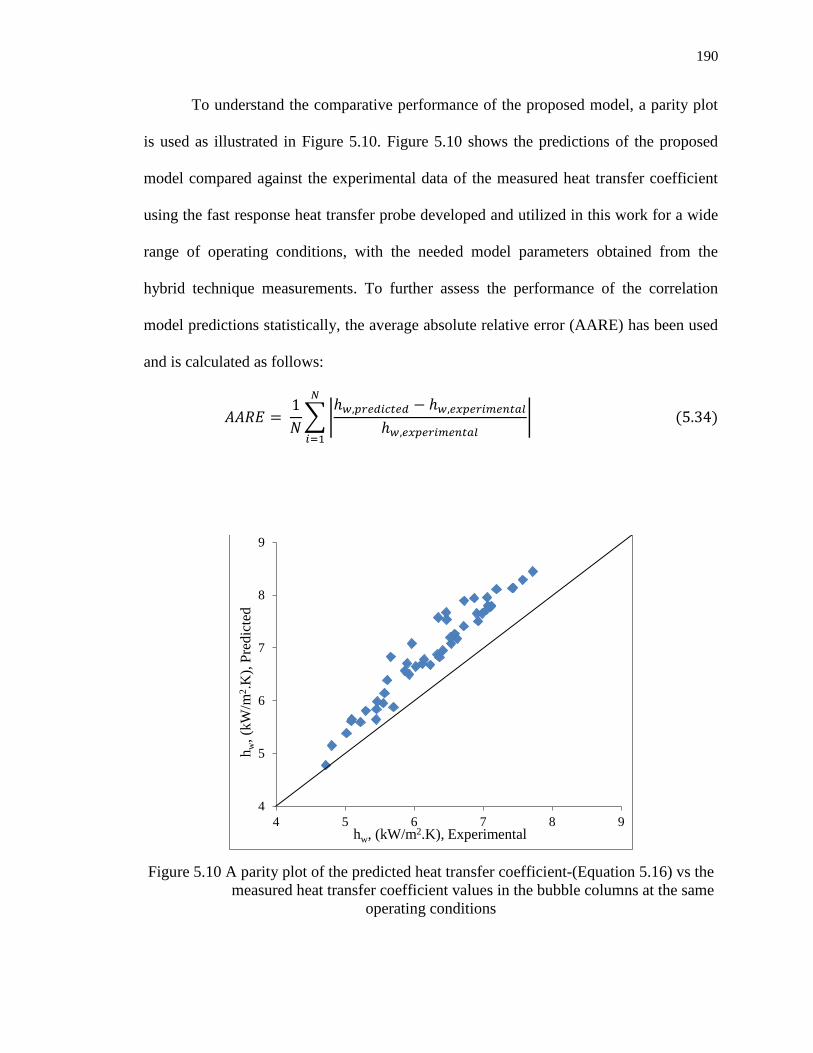
5.10. A parity plot of the predicted heat transfer coefficient-(Equation 5.13) vs the
measured heat transfer coefficient value in bubble column at the same
operating conditions ............................................................................................... 190
5.11. Histogram for the distribution of predicted heat transfer coefficient in 18-inch
empty bubble column at r/R = 0.0 (a) Ug = 8 cm/s. (b). Ug = 20 cm/s ............ 192
5.12. Histogram for the distribution of bubble chord lengths in 18-inch empty
bubble column at r/R = 0.0 (a) Ug = 8 cm/s. (b). Ug = 20 cm/s ....................... 192
5.13. Histogram for the distribution of axial bubble velocity in 18-inch empty
bubble column at r/R = 0.0 (a) Ug = 8 cm/s. (b). Ug = 20 cm/s ....................... 193
6.1. Schematic of the experimental structure and mimicked dense heat
exchanging internals in both the 6-inch diameter column and 18-inch
diameter column.................................................................................................. 199
6.2. Effect of column diameter and superficial gas velocity on measured heat
transfer coefficient for an air-water system without internal ................................ 203
6.3. Effect of column diameter on bubble properties (a) Local gas holdup (b)
Bubble passage frequency (c) Mean bubble chord length and (d) Axial
bubble velocity at the column center, (r/R = 0.0) for an air-water system
without internals at different superficial gas velocities ........................................ 204
6.4. Effect of column diameter on radial profiles of heat transfer coefficient at
different superficial gas velocities for an air-water system without
internals ................................................................................................................ 206
6.5. Effect of column diameter and superficial gas velocity on overall gas
holdup ................................................................................................................... 207
6.6. Effect of column diameter on the radial profiles of local gas holdup at different
gas velocities in empty columns for air-water systems ........................................ 208
6.7. Effect of Column diameter on the radial profiles of (a) Bubble passage
frequency and (b) Specific interfacial area at different gas velocities in empty
columns for air-water systems ............................................................................. 210
Page 18
xvi
6.8. Effect of column diameter on the radial profiles of axial liquid velocity in
empty columns and no solids at Ug = 45 cm/s ..................................................... 213
6.9. Effect of column diameter on the radial profiles of heat transfer coefficient
in empty columns for air-water-glass beads systems at Ug = 45 cm/s ................. 214
6.10. Effect of column diameter on the radial profiles of local gas holdup
in empty columns for air-water-glass beads systems at Ug = 45 cm/s ................. 216
6.11. Effect of column diameter on the radial profiles of (a) Bubble passage frequency
and (b) Specific interfacial area in empty columns for air-water-glass
beads systems at Ug = 45 cm/s ............................................................................. 217
6.12. Effect of column diameter and solids loading on the radial profiles of axial
bubble velocity at Ug = 45 cm/s ......................................................................... 219
6.13. Effect of column diameter on the radial profiles of heat transfer coefficient
at Ug = 45 cm/s based on free CSA ...................................................................... 220
6.14. Effect of column diameter on the radial profiles of local gas hold up
at Ug = 45 cm/s based on free CSA ....................................................................... 221
6.15. Effect of column diameter on the radial profiles of bubble passage frequency
at Ug = 45 cm/s based on free CSA ....................................................................... 222
Page 19
xvii
LIST OF TABLES
Table Page
3.1. Statistical measures for the chord length distributions in 6-inch diameter column
at different radial locations, with and used in Equation 3.8 .............................. 83
3.2. Statistical parameters for the axial bubble velocity distributions 6-inch diameter
column at different radial locations ………………….……………….……………89
3.3. Internals size selection in 6-inch column for comparison in 18-inch column .......... 95
3.4. Experimental conditions for impact of solids and dense internals on bubble
dynamics for 6-inch column and 18-inch column .................................................... 97
3.5. Statistical measures of the bubble chord length distribution in 6-in column at
different conditions, with and used in Equation 3.8 ........................................ 114
4.1. Statistical parameters for the bubble chord length distribution 6-inch and
18-inch columns with and without solids .............................................................. 143
6.1. Experimental conditions for the effect of column diameter .................................. 201
Page 20
xviii
NOMENCLATURE
Symbol Description
a Specific interfacial area, cm2
/cm3
Free cross-sectional area of the column, m2
Cp Heat capacity, kJ/(kg.K)
D Column diameter, m
db
Bubble diameter, cm
Dc Column diameter, m
Di
Inner diameter, m
ID
Inner diameter, m
dl
Bubble chord length, cm
Do
Outer diameter, m
DR
Ratio of gas and liquid/slury phase densities, dimensionless
Dr
Ratio of gas phase density to liquid/slurry phase, dimensionless
ds
Sauter mean bubble diameter, cm
tube diameter, cm
Eo Etovos number, dimensionless
f Frequency, Hz
Fr Froude number, dimensionless
g Gravity constant, m.s-2
h Heat transfer coefficient, W/(m2
.K)
Page 21
xix
H Height of liquid, m
have
Time averaged heat transfer coefficient, W/(m2
.K)
hw
Time averaged heat transfer coefficient, W/(m2
.K)
Hd
Dynamic height, m
hi
Instantaneous heat transfer coefficient, W/(m2
.K)
HS
Static height, m
hw,max
Maximum heat transfer coefficient, W/(m2
.K)
k Thermal conductivity, W/(m.K)
kLa Volumetric mass transfer coefficient, s
-1
L Column length, m
L Length of probe, m
lc bubble chord length, cm
m mean of lognormal distribution
Mo Morton number, dimensionless
N Length of time series, dimensionless
n Sampling number
N Sampling number
Nu Nusselt number, dimensionless
Pe Peclet number, dimensionless
Pr Prandtl’s number, dimensionless
q Heat flux across the sensor, (kW/(m2
. K))
Page 22
xx
r Radial location in the column, m
R Radius of column, m
Re Reynolds number, dimensionless
St Stanton Number, dimensionless
T Length of time series, s
T Total sampling time, s
t time, s
tl
Contact time, s
Tb Bulk temperature, K
tc
Contact time, s
tR
Inter-tube gap, cm
Ti
Contact time between by bubble and probe measured by tip i
Ts Surface temperature of the probe, K
tube pitch, m
Ub
Bubble velocity, m/s
UB∞
Terminal bubble rise velocity, m.s-1
UG
Superficial gas velocity, m.s-1
Ug
Superficial gas velocity, m.s-1
Ug,L
Large bubble rise velocity, m/s
Ug,sm
Small bubble rise velocity, m/s
UL
Superficial liquid velocity, m.s-1
Page 23
xxi
Ulb
Large bubble rise velocity, m.s-1
Usb
Small bubble rise velocity, m.s-1
Uslip
Slip velocity, m.s-1
Vc
Circulation velocity, m/s
Vg
Superficial gas velocity, m/s
We Weber number, dimensionless group
x thickness of the tube, m
y Distance from wall, m
Z Axial distance above the gas distributor, m
z Axial position, m
Z/D Dimensionless height above distributor
Greek Letters
Cross-sectionally averaged gas holdup, dimensionless
Overall gas hold up, dimensionless
μ Mean of a time-series, dimension of time-series
θ Contact time, s
σ Standard deviation of a time series, dimension of time-series
Surface tension, dyne.cm-1
τ Sampling period, s
ρg
Gas phase density, kg m-3
Page 24
xxii
ρL
Liquid phase density, kg m-3
ρS
Solids phase density, kg m-3
ρSL
Slurry phase density, kg m-3
σL
Liquid surface tension, N m-1
μL
Liquid viscosity, kg m-1
s-1
α Thermal diffusivity, m2
/s
δ Film thickness, m
δ0
Viscous sublayer thickness, m
εg
local gas holdup, dimensionless
εg,l
Large bubble gas holdup, dimensionless
εg,sm
Small bubble gas holdup, dimensionless
εg,T
Time based gas holdup, dimensionless
φ Angle between bubble velocity vector and the normal vector of the
bubble’s symmetry plane
φs
Volume based solids loading, vol.%
ϕ Angle between the projection of the normal vector on the xy plane and the
x axis
μ Mean of log-normal distribution
Viscosity, Pa.s
ν Kinetic viscosity, m2
/s
Page 25
xxiii
variance of log-normal distribution
θ Angle between the normal vector of the bubble’s symmetry plane to the
probe’s axial direction
ρ phase density, kg m-3
τ Sampling time, (s)
Subscripts
avg Average
d Downward
Exp. Experimental data
g Gas phase
G Gas phase
l Liquid phase
L Liquid phase
Large bubble
max Maximum
Pred. Predicted value
s Solid phase
sl Slurry phase
sm Small bubble
u Upward
Abbreviations
AARD Average Absolute Relative Difference
AARE Average Absolute Relative Error
Page 26
xxiv
ANN Artificial Neural Network
ARD Absolute Relative Difference
BTL Biomass to liquids
CARPT Computer Automated Radioactive Particle Tracking
CFD Computational Fluid Dynamics
CREL The chemical reaction engineering laboratory (Washington University)
CSA Cross-Sectional Area,
CT Computed Tomography
CTL Coal to Liquids
DAQ Data acquisition
DGD Dynamic Gas Disengagement
ECT Electrical Capacitance Tomography
EIA Energy Information Administration
FT Fischer-Tropsch
GTL Gas-to-Liquids
ID Inner diameter
NDG Nuclear Gauge Densitometry
PDF Probability Density Function
PIV Particle imaging velocimetry
SBC Slurry bubble column
SBCR Slurry bubble column reactor
SCHF Standard Cubic Feet per Hour
TKE Turbulent kinetic energy
Page 27
1
1. INTRODUCTION
1.1. ENERGY CONCERNS, FISCHER-TROPSCH AND SLURRY BUBBLE
COLUMNS
Energy is a fundamental driver of economic development and a major contributor
to people’s quality of life. It sustains the living standards of developed countries to a high
level of comfort and convenience while at the same time leads people out of poverty in
the developing world. For instance, according to the World Health Organization (WHO)
report 2012, access to electricity increases life expectancy, reduces infant mortality,
facilitates education and improves productivity. Thus energy provides a window to the
wider world. Therefore, there is no doubt that energy is fundamental to our development
and a stable and sustainable energy supply is one of the major issues of this Century. In
fact, the combination of increased energy demand and declining petroleum supply can be
a threat to political and economic stability, and even likely to lead to further shifts
towards coal and non-conventional oil fuels from energy sources such as natural gas and
biomass
Economic growth in the developing countries over the past decade, the expanding
world population, and an increase in the purchasing power of individuals has lead to the
increase in energy demand globally. Over the same decade, new technologies for
recovering crude oil, changes in the yields of existing crude oil fields, and a global
increase in exploration have expanded the number and variety of crude oil types (U.S.
Energy Information Administration | International Energy Outlook, June/2012). Global
production of natural gas, coal, biomass and biofuel is growing rapidly due to the
Page 28
2
increasing price of fossil fuels, growing environmental concerns, and considerations with
regards to the security and diversification of energy supply.
During the past 25 years, the production of liquid fuels has changed from being based
on petroleum primarily to using a wide range of feedstock as well as completed products
from numerous sources around the globe. Changes in environmental regulatory policies
have resulted in the use of feedstocks other than crude oil, such as natural gas and
renewable biomass, and a renewed interest in the use of other feedstocks such as coal.
According to the U.S. Energy Information Administration | International Energy
Outlook, 2007, the global energy demand is projected to grow in the region of 50 % by
2030 which is approximately 2.3 % annually for the next 18 years. Oil remains the single
dominant energy source for the transport sector; however it cannot meet the ever
increasing demand indefinitely and sufficiently. Thus the oil demand, supply security and
price concerns also occasioned by the latest turmoil that has been witnessed in the
Middle-East (which has nearly 67 % of the worlds proven crude oil) has led to renewed
interest in coal, natural gas, and biomass as alternative feedstock for the production of
clean transportation fuels and chemicals. The variety and changing dynamics of
petroleum and nonpetroleum feedstocks and the resulting end-use products are illustrated
in Figure 1.1.
Natural gas, coal, and biomass are set to play an ever-increasing role if the energy
challenge is to be met effectively. In the recent history, Natural gas, Coal, and Biomass
have taken significant market share from petroleum feedstocks, correlated with shifts in
product yields, a trend that is expected to continue in the future, along with further
diversification into non-petroleum fossil feedstocks. In 2000, nearly all liquid fuels were
Page 29
3
derived from petroleum. Since then, however, the share of petroleum has dropped while
the shares of biomass and other non-fossil fuels have increased. According to the U.S.
Energy Information Administration | International Energy Outlook, June/2012, (Figure
1.1) the demand for natural gas, biomass, and coal combined is projected to account for
nearly 60 % of the total energy demand by 2035.
Figure 1.1 Variety and changing dynamics of nonpetroleum feedstocks
(Source : U.S. Energy Information Administration | International
Energy Outlook, June/2012)
Synthesis gas (Syngas) (a mixture of CO and H2) produced via gasification of
coal, natural gas and biomass are increasingly becoming reliable sources of energy and
chemicals. The Fischer-Tropsch (F-T) synthesis process is a well proven technology for
making synthetic fuels and chemicals derived from syngas obtained from coal, natural
Page 30
4
gas, and biomass which are more environmentally friendly alternatives to the petroleum.
The F-T process was first developed by Franz Fischer and Hanz Tropsch in Germany in
the 1920s and 1930s at the Kaiser-Wilhelm (presently Max Plank) Institute for Coal
Research in Mülheim. The F-T chemistry is based on making longer chains of
hydrocarbons from a mixture of CO and H2 at elevated pressure and temperature and in
the presence of a catalyst, usually cobalt or iron depending on the raw material. The
excess heat generated from the reaction has typically been removed by heat exchanging
fluid such as water tubes that carry water; other reactor is trickle bed in shell and tubes
configuration where water flows in the shell. In reality, any source of carbon can be used
to generate the synthesis gas. The first step in the FT process is the production of the
synthesis gas, which is usually carried out by the gasification of coal or biomass or the
conversion of natural gas by steam or other method of reforming. The manufacture of the
synthesis gas is of prime importance, since it comprises the most capital-intensive part of
the Fischer-Tropsch commercial process (Geerlings, 1999).
In the F-T process, syngas is passed after cleaning through a suspension of small
(< 150 micron) solid catalyst particles in molten wax. To achieve economically high
space-time yields, high slurry concentration (typically (30-40 % vol.), (Krishna et al.,
1997) needs to be employed, while to suspend such high quantity of solids, high energy
input is needed which is provided by high superficial gas velocity consequently giving
rise to higher productivity. Figure 1.2 shows a schematic of a typical slurry bubble
column used in the Fischer-Tropsch synthesis process.
Page 31
5
Slurry bubble column reactor has been demonstrated to be the reactor of choice
for the clean utilization and conversion of syngas and commercialization of the F-T
synthesis due to it’s advantages over other multiphase flow reactors, particularly trickle
Figure 1.2 Established slurry bubble column reactor configuration with internal cooling
for Fischer-Tropsch synthesis
bed reactors that have been also utilized for F-T synthesis in the form of shell and tubes
configuration where the heat is removed by water passing through the shell. Multiphase
reactors and contactors in general are widely used in the chemical, petroleum, and
bioprocessing industries among others for gas liquid operations and for heterogeneous
reactions such as gas-liquid, gas-solid, liquid-solid, gas-liquid-liquid and gas-liquid-solid
Page 32
6
reactions. Bubble and slurry bubble columns, three-phase fluidized bed reactors, stirred
tank reactors, packed bed reactors, rotating disk contactors, and monolith reactors, and
ebulated bed reactors are some of the multiphase reactors currently used in the chemical
industry.
Bubble columns (BC) and slurry bubble columns (SBC) have several advantages
over other conventional multiphase reactors giving them an edge as gas-liquid and gas-
liquid-solid contactors and reactors. Among the desired characteristics of slurry bubble
column reactors (Kolbel and Ralek, 1980; Deckwer, 1980; Tang and Fan, 1990;
Karamanev et al., 1992; Deckwer and Schumpe, 1993; Kluytmans et al., 2001;
Degaleesan et al. 2001; Joshi, J.B 2001; Dudukovic, M.P., 2002; Li and Prakash, 2002;
Li et al., 2003; Barghi et al., 2004 ) are;
Uniformity in temperature and high rate of heat transfer and mass transfer
characteristics due to strong mixing and phase interactions.
Simple to construct structures which do not involve mechanically moving parts;
hence competitive investment, operating and maintenance costs, and
High durability of the catalyst.
Online catalyst addition and withdrawal ability and plug-free operation are other
advantages that render slurry bubble columns as an attractive reactor choice.
Conceptually, a slurry bubble column reactor (SBCR) is a vertical cylindrical
vessel in which gas containing one or more reactants (e.g syngas for F-T processes) is
sparged through a liquid containing liquid reactant(s) and or products (F-T processes) and
a finely dispersed solids catalyst. The solid particles are suspended and dispersed by the
liquid movement induced by the bubble motion. The bubble and slurry bubble columns
Page 33
7
are extensively used as multiphase contactors and reactors in chemical, petrochemical,
biochemical, pharmaceutical, metallurgical, and mineral industrial processes (Carra and
Morbidelli 1987, Deckwer, 1992, Deckwer and Alper 1980, Fan 1989, Dudukovic et al.,
1999, Holladay et al., 1978). Examples of such processes besides F-T synthesis are the
partial oxidation of ethylene to acetaldehyde, wet-air oxidation (Deckwer, 1992),
hydrogenation of maleic acid (MAC), hydro conversion of heavy oils and petroleum
feedstocks, cultivation of bacteria, cultivation of mold fungi, production of single cell
protein, animal cell culture (Lehmann and Hammer 1978), and liquid phase methanol
synthesis (LPMeOH) (Wender, 1996).
Even though the slurry bubble column reactors are simple in design and
structures, their design, scale-up, operation, and prediction and understanding of their
performance are still challenging and not well understood due to the complexity in the
interaction among the phases (gas-liquid-solid). For instance, numerous design and
operating variables, physicochemical and thermodynamic properties of the fluids together
affect the various hydrodynamic and transport parameters such as of heat and mass. In
order to accomplish high efficiency reaction systems that offer lower capital and
operational costs for syngas conversion into high-value fuels and chemicals via Fischer-
Tropsch processes, further investigations of the fluid dynamics and transport properties
are needed. Figure 1.3 illustrates the utilization of Syngas obtained from coal, biomass
and natural gas into clean fuels and chemicals.
From economics point of view, heat transfer, and high volumetric productivity, a
high catalyst loading is desired. For optimal product yield, Slurry bubble column reactors
must be operated at high gas velocities in the churn turbulent flow regime. Hence, the
Page 34
8
gas-liquid interfacial dynamics control the hydrodynamics and the flow pattern of the
system provided that the SBCR is operating at liquid superficial velocity in the order of
magnitude smaller than the superficial gas velocity and the catalyst particles are not
excessively heavy and ~50 µ in size.
Figure 1.3 Synthesis gas utilization into fuels and chemicals
1.2. MOTIVATION AND RESEARCH OBJECTIVES
Removal of large quantities of excess generated heat by the exothermic synthesis
reactions is one of the major challenges facing FT synthesis, whereas one of the most
Methanol-Gasoline
Coal
Biomass Air Separation Natural Gas
Gasification Steam/Natural
Gas Reformation
Purification
Liquid Methanol Synthesis Fischer-Tropsch Synthesis
O2
• GTL Naphtha
• GTL Diesel
• GTL Base Oils
Gasoline
H2 + CO H
2 + CO
Page 35
9
desired characteristics in the operation of bubble and slurry bubble columns is the high
heat transfer rate. Therefore, the slurry bubble column is the most suited reactor for the
syngas conversion via the FT process. If the heat is not removed sufficiently, catalyst
poisoning and deactivation might occur due to local heating that creates hotspots and
carbon deposition on the catalyst that renders the catalyst inactive. Particularly the cobalt
based F-T catalysts, like many other systems lose their activity with time on stream, (van
Berge et al., 1997). The heat transfer rate is influenced by a number of parameters
including design and operating conditions as well as physical properties of the
liquid/slurry. More specifically bubble dynamics including local and overall phase hold
ups, bubble velocity, bubble sizes, interfacial area and bubble frequency, superficial gas
velocity, and liquid circulation velocity all of which are interrelated and highly
interactive thus controlling the bubble column performance.
The majority of industrial multiphase flow systems and processes requires
different forms of heat supply or heat removal particularly when isothermal or near
isothermal operation is desired. Most of these processes involve heat transfer between
different configurations of immersed heat transfer surfaces or jacket surfaces and the
surrounding gas-liquid or gas-liquid-solid systems. Therefore, there is a need for proper
design of heat removal in these reactor systems to allow optimal temperature control for
desired product quality and yield (Duduković et al., 2002) and also to avoid a broad
product spectrum. In industry, various designs and configurations of internals or means of
supplying or removing heat have been developed including vertical or horizontal
internals, jackets at the wall, among others. The internals are of different types and are
required in a number of industrial applications of bubble columns to achieve the desired
Page 36
10
mixing or to remove the heat of reaction so as to maintain the desired temperature and
near isothermal conditions of operation.
Examples of these applications include Fischer-Tropsch synthesis process for
clean alternative fuels and chemicals production from natural gas, coal and biomass,
liquid-phase methanol synthesis, (LMeOH), oxidation, hydrogenations, and production of
dimethyl ether (DME). However a few studies have shown that the presence of internals
can alter the column hydrodynamics and mixing patterns (Youssef and Al-Dahhan, 2009;
Larachi et al., 2006; and Chen et al., 1999). The altered column hydrodynamics might not
only have significant influence on the reactor performance but also the heat and mass
transfer characteristics.
The generated or removed heat can be transferred directly from the surfaces that
generate or receive the heat to the contacting medium of gas-liquid or gas-liquid-solid.
Gas-liquid and gas-liquid-solid systems are characterized by high heat-transfer rate and
hence, these systems have widespread use as reactors and contactors. Bubble and slurry
bubble column reactors are characterized by high heat-transfer rate and hence these
systems have widespread use as reactors and contactors.
Heat transfer from solid surfaces to gas-liquid and gas-liquid-solid systems have
been studied experimentally and analytically in the literature (Kim and Kang, 1997, Hulet
et al., 2009, Kumar and Fan; 1994, Yang et al., 2000, Kumar et al., 1992 among others).
However, all these studies have been performed without simultaneously investigating the
bubble properties adjacent to the heat transfer surfaces. It has been shown fundamentally
that there is strong tie and interactions between heat transfer rate from or to the surface
and the bubble dynamics adjacent to the surface in bubble columns since bubble
Page 37
11
dynamics affect the renewal rate of liquid and slurry elements on the heat transfer surface
(Wu, 2007 and Kumar et al., 1992). Hence, turbulence and mixing that are induced by
gas bubbles play important role in heat transfer in gas-liquid and gas-liquid-solid
systems. Both experimental and theoretical results reported in the literature (Li and Fan,
2001; Yang et al., 2000; Kumar and Fan 1994; Wasan and Ahluwalia, 1969) suggest that
there is a series of film and surface renewal that govern the heat exchange between a
surface and flowing fluid. Therefore, there is a need to investigate heat transfer rate and
bubble dynamics simultaneously and to use the obtained data to mechanistically assess
the dependence of heat transfer coefficient on the multiple bubble properties; Including,
local and overall gas holdup, bubble passage frequency, specific interfacial area, axial
bubble velocity (both upward and downward), bubble sizes as well as the bubble
directions.
Even though the slurry bubble column reactors are simple in design and
structures, their design, scale-up, operation, prediction and understanding the
performance of the bubble and slurry bubble column reactors are still challenging and not
well understood due to the complexity in the interaction among the phases (gas-liquid-
solid). For instance, numerous design and operating variables, physicochemical and
thermodynamic properties of the fluids together affect the various hydrodynamic and
transport parameters. To achieve high volumetric throughput the use of large diameter
reactors (typically, > 5 m) are required, which by means is almost two orders of
magnitude larger than most of the laboratory scale columns and reactors. Heat removal
internals may be installed in the bubble columns during the design and construction,
while addition of solids is inevitable if high product yield is to be achieved. The flow
Page 38
12
structure would be greatly altered in the larger column, nor stay the same with inserted
internals while the physical properties of the fluid/slurry and the general rheology of the
suspension would be altered by the added solids (Van Baten and Krishna, 2004; Krishna
and Morreto, 1999; Saxena, et al., 1989.
Therefore, in order to accomplish high efficiency reaction systems that offer
lower capital and operational costs for syngas conversion into high-value fuels and
chemicals via Fischer-Tropsch processes, further investigations of the fluid dynamics and
transport properties such as of heat and mass need to be done.
Accordingly, the main objective of this work is to investigate the effect of bubble
dynamics on the heat transfer coefficient in bubble columns and slurry bubble columns
equipped with mimicked dense heat exchanging internals using a hybrid measurement
technique consisting of a fast response heat transfer probe for heat transfer coefficient
and four-points fiber optic probe for bubble dynamics. In order to achieve this objective,
the following tasks have been set.
Task 1. Study the effect of dense (25 % cross-sectional area, CSA ) internals and
solids loading (up to 40 % vol) on bubble dynamics and heat transfer coefficient in
two pilot scales bubble and slurry bubble columns (6-inch diameter and 18-inch
diameter.)
Task 2. Assessment of the mechanistic analysis of the heat transfer coefficient and its
distribution based on bubble properties and their distribution in the studied bubble
and slurry bubble columns. Performing also evaluation of the reported correlations
against the obtained data.
Page 39
13
Task 3. Investigating the effect of column diameter on the bubble dynamics and on
heat transfer coefficient in bubble and slurry bubble columns using 6-inch and 18-
inch diameter bubble columns with and without internals
In order to accomplish the stated objective and tasks, detailed experimental
investigations have been performed on the heat transfer coefficient measurements and
bubble properties including local and overall gas hold-up, bubble velocity (both axial and
radial), bubble passage frequency, specific interfacial area, and bubble sizes.
1.3. THESIS STRUCTURE
This dissertation consists of the following seven sections:
Section 1 introduces the energy concerns and the F-T synthesis process as an
alternative solution towards cleaner liquid fuels and chemicals from alternative
feedstocks which are more abundant resources than oil. It also outlines the relevance of
slurry bubble columns to the FT process. The motivation and research objective for this
study as well as the tasks are also presented in this chapter.
Section 2 presents the pertinent literature review to this work. It critically
evaluates and highlights the previous work on bubble dynamics, heat transfer and scale-
up issues.
In Section 3, the results obtained from the investigated effects of different sizes
and hence configurations of dense internals occupying the same cross-sectional area
(CSA) on the bubble dynamics in 6-inch diameter column are presented. In the same
chapter, the impact of solids loading and dense internals on the bubble dynamics
Page 40
14
investigated in 6-inch diameter column and in 18-inch diameter column are reported and
discussed.
Section 4 discusses the impact of dense internals in two pilot scales bubble
columns on the investigated heat transfer coefficient in light of the bubble dynamics
presented in Section3.
In Section 5, the heat transfer coefficient is mechanistically examined. A contact
time model that depends only on the bubble dynamics is proposed and used in a
mechanistic equation to predict the heat transfer coefficient.
Section 6 discusses and highlights the effect of scale and diameter of slurry
bubble column on the bubble dynamics as well as heat transfer coefficient in bubble and
slurry bubble columns equipped with the dense mimicked heat exchanging internals.
Finally, Section 7 summarizes the conclusions drawn from different sections of
the entire study and presents recommendations for future work on bubble dynamics and
heat transfer studies in slurry bubble columns with dense internals.
Appendices are then annexed to provide further details of operating procedures,
and additional results.
Page 41
15
2. BACKGROUND AND LITERATURE SURVEY
2.1. BUBBLE DYNAMICS IN BUBBLE AND SLURRY BUBBLE COLUMNS
The knowledge of bubble properties, including local and overall gas holdup,
bubble velocity, bubble size, bubble frequency and specific interfacial area, is of great
importance for the proper design and operation of bubble columns. Besides, the bubble
properties play key roles in determining the heat and mass transfer rates in bubble
columns (Yang et al., 2000; Kumar et al., 1992; Kumar and Fan, 1994; Wu, 2007;
Jhawar, 2011). Many researchers in the past decades have extensively studied the bubble
and slurry bubble columns (SBCs) experimentally and also modeled the behavior of
SBCs. However, most of these studies on bubble dynamics in bubble columns have been
focused on overall gas hold-up and bubble sizes (Luo et al., 1999; Bouaifi et al., 2001;
Shimizu et al., 2000; Anabtawi et al., 2002; Wang et al., 2003; Forret et al., 2003; Tang
and Heindel, 2003; and Veera et al., 2004).
The first comprehensive study of bubble properties in bubble columns was done
by Xue, 2004. In his work conducted in 16.2 cm diameter bubble column at pressures up
to 1.0 MPa, and superficial gas velocity, up to 60 cm/s, and with three different gas
spargers, he studied both overall and local gas hold-up, bubble frequency, bubble
velocity, bubble chord length (which is characteristic of bubble sizes) and the specific
interfacial area. It was established that the radial profiles of local gas holdup, specific
interfacial area, mean bubble velocity, and bubble frequency profiles exhibit the same
trends. The radial profiles evolve from flat at low superficial gas velocity to highly
parabolic at high superficial gas velocity. The effects of axial position, pressure, spargers,
Page 42
16
and elevation in the column were also investigated. Xue et al., 2008, and Xue, 2004
showed that the effect of sparger diminishes at higher gas velocities in the fully
developed flow region. Besides, Xue, 2004 also demonstrated that higher pressure leads
to the evolution of smaller bubbles with low bubble velocity and enhanced frequency,
hence higher residence time, consequently increasing both the overall and local gas
holdup. Within the fully developed flow region at axial position z/D ≥ 2.0, above the gas
distributor, the bubble properties did not exhibit any significant change. Figure 2.1 and
Figure 2.2 compare some of the obtained bubble properties with different spargers and at
different axial positions respectively
Unfortunately this work was carried out in empty bubble column thus the effect of
dense internals which are encountered in exothermic systems such as the F-T Synthesis
process cannot be deduced from this work. Furthermore, solids influence on the bubble
dynamics was not examined, neither was the effect of scale.
It is noteworthy to mention that most of the studies in the literature on the effects
of operating and design variables on the hydrodynamic parameters and transport of heat
and mass have been performed in empty bubble and slurry bubble columns, (Wu, 2007;
Youssef, 2010; and Youssef and Al-Dahhan, 2009). Therefore, the effects of heat
exchanging internals on the hydrodynamic and transport parameters have not been well
understood. Only a limited number of studies have been carried out in bubble and slurry
bubble columns equipped with heat exchanging internals.
Page 43
17
Figure 2.1 Bubble properties at z/D=5.1 for different spargers at Ug = 30 cm/s (from
Xue, 2004)
Figure 2.2 Gas holdup radial profiles at different axial positions at, Ug = 30 cm/s (from
Xue, 2004)
Pradhan et al., 1993 used two types of internals (helical coils and a vertical
straight tube bundle) in a 0.102 m diameter and 2.5 m height Plexiglas column and
superficial gas velocities of up to 9 cm/s to investigate the effect of volume fraction of
internals on overall gas holdup. The volume fractions covered by the internals
0
0.1
0.2
0.3
0.4
0.5
0.6
-1 -0.5 0 0.5 1
Radial position, r/R
Gas h
old
up
sparger#1
sparger#2
sparger#3
-20
-10
0
10
20
30
40
50
60
70
80
90
-1 -0.5 0 0.5 1
Radial position, r/R
Mean
bu
bb
le v
elo
cit
y (
cm
/s)
sparger#1
sparger#2
sparger#3
0
0.1
0.2
0.3
0.4
0.5
0.6
-1 -0.5 0 0.5 1
Radial Position (r/R)
Ga
s H
old
up
z/D=8.5
z/D=5.1
z/D=1.7
Page 44
18
configurations varied from 0.014 to 0.193 were studied, and their results showed that gas
holdup increased with an increase of volume fractions. In addition, helical coils provided
higher gas holdup than vertical tubes. The difference was attributed to large intertube
gaps for the vertical tube internals that provided more space for larger bubbles escape,
thus decreasing the gas holdup, unlike the helical coil internals in which only smaller
gaps were present. They claimed that the gas holdup enhancement of up to 55 % was
achieved when the helical coil internals was used. However, the range of the superficial
gas velocity used is still in the transition flow regime and cannot suspend sufficiently the
large quantities of solids used in the F-T synthesis process.
Chen et al., 1999 using gamma ray computed tomography (CT) and computer
automated radioactive particle tracking (CARPT) techniques, investigated the effect of
internals on gas holdup, liquid velocity, turbulent stresses and eddy diffusivities both
radial and axial in a 0.44 m diameter column. The column was equipped with internals
similar to those used in industrial scale units covering 5 % of the column’s total cross-
sectional area to mimic liquid phase methanol (LPMeOH) synthesis using both air-water
and air-drakeoil 10 and superficial gas velocities from 2-10 cm/s. The configuration of
the internals used is shown in Figure 2.3. They reported that internals covering 5 % of the
total column cross-sectional area have no significant effect on liquid recirculation
velocity, while gas holdup increases slightly. The turbulent stresses and eddy diffusivities
were lower in the presence of internals. In this work the range of superficial gas velocity
covered was low. Thus it is not possible to evaluate with confidence the effect of
internals at high superficial gas velocity that would guarantee a high volumetric
productivity as desired especially in the FT process. Furthermore, the low cross-sectional
Page 45
19
area internals cannot effectively remove the generated heat from a highly exothermic
processes, hence the need to evaluate the impact of dense internals. In addition the
observed changes in the gas holdup and turbulent parameters could have come from the
increased mass flow rate of the gas since the gas velocity was calculated based on the
total cross-sectional area thus same amount of mass for smaller cross- sectional area.
Figure 2.3 Configuration of internals covering 5 % of column’s Cross-Sectional Area
(from Chen et al., 1999)
Forret et al., 2003 studied the effect of internals on liquid dispersion and liquid
mixing in a 1 m diameter bubble column, with internals occupying 22 % of the column
cross-sectional area (CSA) and superficial gas velocity of 15 cm/s. They used a basic
tracer technique and also, assessed a 1D-axial dispersion model (ADM) on the empty
column and developed a 2D model to account for the effect of internals on the liquid
mixing. They observed a decrease in the liquid fluctuating velocity and an enhancement
Page 46
20
of large scale liquid recirculation with internals. Thus the presence of internals
significantly affects both large scale recirculation and local dispersion as illustrated in
Figure 2.4.
Figure 2.4 Schematic representation of enhanced large scale liquid recirculation and
reduced small scale liquid recirculation in bubble columns (a) Empty column
(b) with internals (from Forret et al., 2003)
Larachi et al., 2006 studied the effect of internals and their configuration on
bubble column hydrodynamics using computational fluid dynamics (CFD). They used
vertical heat-exchange tubes with occluded cross-sectional area ranging between 2 to
16.2 %, and tubes of 1 inch diameter arranged in a triangular pitch configuration.
Transient 3-D computational fluid dynamic simulations were carried out for five bubble
column internals geometries. The study revealed that circulation and mixing patterns in
bubble columns with internals were affected in a very complex manner by the inserted
tubes. They concluded that in the presence of internals, the large-scale and coherent
meandering gas winding around, as observed in hollow bubble columns, could not be
sustained and were replaced by smaller pockets whose size was dictated by the inter-tube
Page 47
21
gaps. They also reported that gap scale was important in the longitudinal funneling of
liquid flow. A sharp decrease of the liquid kinetic turbulent energy upon insertion of the
heat-exchange tubes in the bubble column was also observed. They assumed a constant
bubble size (neglecting coalescence/dispersion effects) and a steady drag force as the sole
interfacial force (neglecting all other forces such as lift, wall, and turbulent diffusion).
Whereas the occluded column cross-sectional area was reasonably high, these CFD
results were not evaluated and validated against any benchmark experimental data due to
the lack of such data. Further work which utilizes solids is still required.
Recently, Youssef and Al-Dahhan, 2009 and Youssef, 2010 did the first
systematic and comprehensive study of bubble properties in bubble columns equipped
with mimicked dense heat-exchanging internals. The studies were conducted in two
bubble columns of diameter 0.19 m and 0.44 m with superficial gas velocity varied
between 3 - 45 cm/s. The internals used were of different configurations with cross-
sectional area covering 0 - 24.5 % of columns total cross-sectional area. The details of
internals bundles and configurations used in the 0.44 m bubble column are shown in
Figure 2.5. The detailed studies were carried out on overall gas holdup and local gas
holdup radial profiles, bubble velocity, bubble sizes as well as specific interfacial area.
They reported enhanced overall gas holdup with increased percentage coverage of
column cross-sectional area by internals which was also consistent with the findings of
Bernemann, 1989. With dense internals that obstructed high fraction of the column, an
increase in the gas holdup radial profiles was observed as illustrated in Figure 2.6. The
internals also led to higher bubble break-up rate giving rise to smaller bubble chord
Page 48
22
lengths. Thus increased specific interfacial area between the gas and liquid phases was
higher for systems equipped with internals. No significant differences were noted on the
Figure 2.5 Different configurations of internals bundles covering (a) 20 %, (b) 15 %,
and (c) 10 % of the total column’s cross-sectional area
(from Youssef, 2010).
bubble velocity probability distributions at the column’s center between the case of no
internals and that of 25 % CSA internals, particularly at high superficial gas velocity.
However, at the 0.44 m diameter column’s wall region, a higher probability of bubbles
Page 49
23
moving downward was obtained with nearly no bubbles moving upwards at the wall
region. This work (Youssef, 2009) provided a greater insight on the detailed impact of
internals on bubble properties in bubble columns. However it was limited to air-water
systems while the FT synthesis involves a three-phase system. Therefore, it is imperative
that studies be conducted which mimic the 3-phase FT conditions to guarantee the
validity of their results. Moreover, it is important to discuss in further detail the
utilization of superficial gas velocity for open area only and how this affects the bubble
dynamics. For the latter to be achieved, investigations using the superficial velocity need
to be compared with the results from the data at superficial gas velocity for open area
only and further validation be done for systems containing solids.
Figure 2.6 Effect of vertical internals on the local gas holdup at Ug = 20 cm/s
(from Youssef and Al-Dahhan, 2009)
Page 50
24
2.2. HEAT TRANSFER IN BUBBLE AND SLURRY BUBBLE COLUMNS
Proper design of the heat removal surfaces such as cooling tubes is crucial in
order to maintain catalyst activity, reaction integrity, and product quality in bubble
columns. A number of processes carried out in bubble and slurry bubble columns are
highly exothermic, for instance the Fischer-Tropsch synthesis process is a highly
exothermic process with a heat of reaction in the order of -172 kJ/mol of CO converted
(Maretto and Krishna, 1999).
Heat transfer in two and three-phase gas suspension reactors as well as heat
transfer from the solid surfaces have been investigated by several researchers both
experimentally and analytically in the literature (Baker et al., 1978; Deckwer et al., 1980;
Kato et al., 1981; Chiu and Ziegler, 1983; Kang et al., 1985; Kim et al., 1986; Magiliotou
et al., 1988; Saxena et al., 1990a, b and 1992, Kantarci et al., 2005b). Majority of these
studies have been captured in the past several reviews about the fundamental heat transfer
studies in gas-liquid and gas-liquid-solid systems. Including the reviews published by
Pandit and Joshi, 1986; Kim and Laurent, 1991; Saxena and Chen, 1994; Saxena, 1995;
Nigam and Schumpe, 1996; Kim and Kang, 1997; Li and Prakash, 2001; Kantarci et al.,
2005; Hulet et al., 2009 and most recently an overview of heat transfer in a slurry bubble
column by Jhawar and Prakash, 2012, include the details of heat transfer experimental
investigations in multiphase flow systems, particularly bubble and slurry bubble columns.
In this section, the key studies on heat transfer most relevant to of this work are
reviewed and critically highlighted.
Korte, 1987 studied in details heat transfer from horizontal and vertical tube
bundles with an embedded heat transfer probe in three different columns of 0.12 m i.d.
Page 51
25
(4.5 m high), 0.196 m i.d. (6.8 m high) and 0.45 m i.d (6.2 m high), and concluded that
the bundle’s density and configuration has extensive effect on the heat transfer
coefficient. Different liquids were also used in the studies and it was shown that even
with high viscosity liquids, (which can be mimicked by addition of solid particles to the
liquid), which promote coalescence of bubbles, and dampen the bubble instabilities, the
presence of internals may inhibit any decrease on the values of the heat transfer
coefficient by enhancing the bubble break-up rate. Korte, 1987 correlated his results for
the tube bundles taking into account the internals by the following equation:
[( )
]
(
)
(
)
where is the free cross-sectional area of the column, is the tube pitch (m), and
(m), the tube diameter with the dimensionless numbers based on the following
definitions:
,
,
, and
.
Korte, 1987 in his studies also used a microturbine velocimeter to determine the
liquid velocity through the columns. However in this work, generally heat transfer
coefficients were measured on the basis of the measurement of energy input using a slow-
response assembly probe (Saxena and Chen, 1994). Wu and Al-Dahhan, 2011; Wu et al.,
2007; Wu, 2007 and Abdulmohsin and Al-Dahhan, 2012 claimed that in this
methodology, error in the calculation of heat flux based on the energy input is inevitable
because the heat losses in heating up all the surrounding materials, including the
connecting fittings and/or column wall, were also counted into the heat transferred from
the heat source to the bulk flow. Furthermore, detailed hydrodynamics studies were not
Page 52
26
conducted in order to elucidate the dependence of heat transfer rate on the bubble
properties.
Saxena, 1989, Saxena et al., 1989, 1990, and 1991 did numerous heat transfer
studies in two phase-flows and three-phase flow systems equipped with mimicked heat
exchanging internals with in-built heaters. The main parameters in their studies included
column diameter, particle sizes and fines, solids concentration, the superficial gas
velocity, bed temperature and the number and configuration of the internals. Saxena,
1989, using 0.108 m diameter column and glass beads as solids reported that the gas
holdup decreased with solids loading at higher superficial gas velocities while the heat
transfer coefficient initially increased rapidly with increasing Ug and then reached an
asymptotic value. They also reported that heat transfer coefficient was consistently higher
with solids loading, and with decreased liquid and pseudo-slurry viscosity. However,
when they used different sizes of glass beads (50, 119, 143 μm) at concentrations of 0
and 10 wt. %, with the gas and liquid phases consisting of air and water, they reported
that the gas hold-up and heat transfer coefficient were both independent of the particle
diameter and solids concentration.
Westermeyer, 1992 studied heat transfer in bubble columns. Their studies were an
extension of the work done by Korte, 1987 where they introduced the solids in the same
systems. They also used a conductivity probe to measure the radial solids phase hold-up.
They concluded that the heat transfer coefficient increased with decreasing liquid
viscosity but independent of column diameter. The experimental data of their results were
correlated by the following equation;
(( )
) [
]
(2.2)
Page 53
27
where
and the rest of the dimensionless numbers defined the same way
as Korte, 1987.
Yang et al., 2000, conducted heat transfer studies in slurry bubble columns at
elevated pressures up to 4.2 MPa and temperatures up to 81 0C using nitrogen as the gas
phase, Paratherm NF heat-transfer fluid as the liquid phase, and 53 µm glass beads as the
solids. The solids concentrations were varied up to 35 vol %, while the superficial gas
velocities up to 20 cm/s was used. They examined the effect of gas velocity, solids
concentration, pressure and temperature on the heat transfer coefficient. They noted that
the variation of heat transfer coefficient with pressure and temperature was due to the
counteracting effects of the liquid and pseudo-slurry viscosity, bubble sizes, and gas
holdup. They reported an increase in heat-transfer coefficient in slurry bubble column
with temperature and solids loading and appreciable decrease with an increase in
pressure. Even-though in this work the bubble sizes were not measured, the decrease in
heat-transfer coefficient with pressure was attributed to the decreased bubble sizes,
increased liquid viscosity, and increased gas holdup as the pressure increases.
Yang et al., 2000 also used a consecutive film and surface renewal model that will
be discussed later in chapter 5 to analyze their heat-transfer results. On the basis of the
model they claimed that the main resistance to heat-transfer in high pressure slurry
bubble columns lies within a fluid film surrounding the heating surface. However, they
assumed that the liquid elements move at the same velocity as the bubbles around the
heat transfer resistance film and thus the contact time between the liquid elements and the
film is equal to the contact time between the bubbles and the film, when the bubble
motion is considered as the driving force of the liquid elements. In their study, the contact
Page 54
28
time between the liquid elements and heat transfer resistance film was estimated from;
where is the contact time, is the vertical length of the heat flux sensor, and
is the bubble rise velocity. Figure 2.7 illustrates the variation of the estimated contact
time with bubble rise velocity according to Yang et al., 2000. Their study also did not
elucidate the effect of radial location. It should be noted that the bubble velocity in
bubble or slurry bubble columns are both axial (upward and downward) and radial and
bubble-turbulence induced heat transfer only depends on the bubble passage and not
direction. Using the bubble rise velocity as the only determinant of the contact time is
likely to overestimate the heat transfer coefficient.
Figure 2.7 Contact time between liquid elements and the film under various operating
conditions (from Yang et al., 2000)
Kumar et al., 1992 and Kumar and Fan, 1994 studied the effect of bubbles and
their sizes on the instantaneous heat-transfer rate in gas-liquid and gas-liquid-solid
Page 55
29
systems. They reported that when a single bubble is injected into liquid or liquid-solid
systems the heat-transfer rate through the bubble wake is enhanced. Figure 2.8 illustrates
the system set-up used and the effect of bubble sizes on the instantaneous heat transfer
coefficient due to the passage of bubble in a liquid for probe located at the column center.
They found that the wake is proportional to bubble size and maximum heat transfer
occurs in the wake region a short distance behind the bubble in the upward flow. The
observed heat transfer enhancement was thus attributed to the bubble wake created by the
bubble(s) passing over the heat transfer surface. Larger bubbles would have larger wakes
and stronger vortices associated with the wake, thereby enhancing the rate of heat
transfer. The strong vortices and turbulence in the bubble wake region increase the heat-
transfer surface renewal rate. They demonstrated that the heat transfer rate is proportional
to the bubble sizes. These studies did not elucidate the effect of larger bubble population
as they were limited to single bubbles or a chain of bubbles. They also did not cover the
range of gas velocities suitable for most commercial applications. Moreover the
measurements were limited to column center and thus no local variations in the heat
transfer rates were reported. However, at any superficial gas velocity, a large population
of bubbles is evolved with a range of velocities (Xue, 2004; Youssef and Al-Dahhan,
2009), which is the case in a real system of commercial interest.
Li and Prakash, 1997 studied the instantaneous and time-averaged heat transfer
coefficients as well as averaged gas holdups in a 0.28 m diameter slurry bubble column
for air-water and air-water-glass beads (35 µm) system. The influence of high superficial
gas velocities (up to 0.35 m/s) and high solids concentrations (up to 40 vol %) were
investigated. A decrease in gas holdup with increasing slurry concentrations was reported
Page 56
30
Figure 2.8 Bubble wake enhanced heat transfer coefficient (a) Experimental system and
(b) Effect of bubble size on instantaneous heat transfer coefficient due to the
passage of bubble in liquid for probe located at center, r/R (-) = 0.0 (from
Kumar and Fan, 1994).
(a)
(b)
Page 57
31
and a rapid rate of decline at high superficial gas velocities. The instantaneous local heat
transfer measurements were analyzed to study the bubble behavior in the regions near the
wall and at the center for different solids concentrations. They reported larger bubbles in
the column wall region in three phase system as compared to the solid-free system. The
average heat transfer coefficient decreased with increasing slurry concentrations, contrary
to what Yang et al., 2000, observed with the same type of solids but different gas and
liquid phases. The heat transfer coefficient was always lower at the wall than at the
center.
Kolbel et al., 1958 reported the first correlation to predict the heat transfer in
bubble columns. Their studies were conducted in 9.2 cm and 29.2 cm bubble columns
with superficial gas velocity varied from 1 – 10 cm/s. They measured the heat transfer
from a wall in bubble column based on certain thermal output generated by a heating
cartridge in a metal cylinder. They supposed that the heat transfer enhancement produced
by the gas bubble in bubble columns was related to the removal of stagnant liquid
portions (boundary layer) from the heat transfer surface. They attributed the heat transfer
resistance to wall boundary layer. They argued that the boundary layer decreases and
becomes independent of gas velocity at very low gas velocities and are not broken up.
This claim however seem to be contrary to others. Where, the boundary layer grows with
reduction in gas velocity and or liquid velocity, but instead diminishes with increase in
gas velocity to become nearly independent with further increase. Based on their
experimental data they proposed the following correlations:
for (2.3)
for (2.4)
Page 58
32
Where is the tube diameter,
is the gas Reynolds number,
is
the Nusselt number based on tube diameter, , with the heat transfer coefficient, ,
liquid thermal conductivity, , the superficial gas velocity, , and liquid viscosity, .
Whereas the correlation accounts for the liquid system properties, the gas velocity used is
not beneficial to processes which require high volumetric productivity such as the
Fischer-Tropsch synthesis. The effect of solids and or heat exchanging internals was also
not examined. Besides, the mode of heat transfer measurement was based on the thermal
output. This method is prone to large errors since even the heat used in heating up the
column walls and fittings are assumed to be transferred to the medium, as explained
earlier on.
Kast, 1962 indicated that the concept of heat transfer through the boundary layer
plays negligible or no role in the bubble agitated systems such as bubble columns. By
analyzing the fluid motion around a bubble in the upward flow Kast, 1962 proposed the
first semi-theoretical correlation to estimate the heat transfer coefficient in bubble
columns.
(2.5)
They proposed the constant values as, = 0.1, a = 1, b = 1, c = 2 and m= -0.22. Many
researchers (KoIbel et al., 1964; Burkel, 1972; Shaykhutdinov et al., 1971; Hart, 1976;
Steiff and Weinspach, 1978) have modified the values of the constants to fit their
experimental data. In this analysis, a fluid element in the front of a rising bubble receives
radial momentum and thus moves towards the heating surface. This lateral transport of
mass resulting from axial motion of the bubble weakens and breaks up, the boundary
layer (thin film lying parallel to and covering the heat transfer surface) at the wall
Page 59
33
surface. Whereas from Kast’s point of view this indicates that the boundary layer heat
transfer enhancement is negligible, it should be construed that the phenomena of bubble-
wake induced heat transfer enhancement due to surface renewal rate plays crucial role in
the heat transfer in bubble columns as will be illustrated in Section 5.
Deckwer, 1980 by applying the surface renewal theory (Higbie, 1935) of
interphase mass transfer and Kolmogoroff’s theory of isotropic turbulence improved the
theoretical interpretation of the heat transfer model proposed by Kast, 1962 and obtained
the values of the constants of Kast's correlation as f = 1, a = 1, b = 1, c = 2, m = -0.25.
This correlation was extended to gas-liquid-fine solid systems (slurry bubble columns) by
Deckwer et al., 1980. Using the surface renewal model analysis, Deckwer, 1980 argued
that the occurrence of fast radial exchange flow rates can be regarded as lateral eddy
diffusivity with radial mass dispersion. Thus owing to the radial eddy diffusivity, there
does not exist boundary layer at the wall at all, instead it is reasonable that in the vicinity
of wall surface there is irregular back and forth but steady flow of fluid eddies from the
bulk to the wall. According to this analysis, the fluid element stays in contact with the
heat transfer surface then leaves to enter the bulk medium. Hence, applying the surface
renewal theory of interface mass transfer Higbie, 1935 and a 1-D unsteady state heat
conduction equation,
With the boundary/initial conditions;
Page 60
34
The average heat transfer coefficient during the contact time between the fluid eddy
and the heat transfer surface can be calculated as follows;
√(
)
with the contact time estimated as
This model (Kast’s, 1962) suggests that there is no stagnant film on the heat transfer
surface hence no resistance due to the boundary layer thickness. The contact time
estimation approach may contain large errors since the estimation of the bubble diameter
is not easy. In fact at higher superficial gas velocity encountered in the churn turbulent
flow regime that is of great commercial interest, the bubbles have no definite geometric
shape making estimating their diameter extremely difficult.
Wu, 2007 and Wu and Al-Dahhan, 2011 demonstrated in a 0.16 m ID bubble
column the variation of heat transfer coefficient with superficial gas velocity up to 30
cm/s, pressure up to 10 bar and solids loading up to 25 % by volume. They observed that
the heat transfer coefficient increases with superficial gas velocity, but the rate of
increase slows significantly at high range of superficial gas velocity. At the same gas
flow rate they noted an increase of heat transfer coefficient with solids loading and a
reversed trend with pressure. Based on a wide data bank of heat transfer coefficient
spanning over 30 years, they proposed an artificial neural network (ANN) based
correlation for predicting the heat transfer rate. They also proposed the following power
law correlation based on their experimental data.
(2.8)
With dimensionless groups as;
Page 61
35
,
,
,
Generally, the centerline heat transfer coefficient values were higher than at the
wall with the radial profiles being flatter at increased pressure. They also mimicked the
heat exchanging internals by using inbuilt cartridge heaters on the internal in order to
assess the effect of internals on the heat transfer coefficient. The internals used in this work
covered very low cross-sectional area (5 % CSA). The presence of internals led to slight
increase in the heat transfer coefficient and this was attributed to the changes in bubble
dynamics and hydrodynamics owing to altered flow field. They strongly recommended
further studies of heat transfer, bubble dynamics and hydrodynamics in slurry bubble
columns equipped with dense internals for better understanding of commercial operations
with heat exchanging internals. Though both the heat transfer studies as well as detailed
bubble dynamics studies were conducted, the heat transfer measurements were done at
separate times from the bubble dynamics measurements hence the direct link between the
bubble dynamics could not be elucidated. It should also be noted that the observed effect of
internals could be misleading since higher gas mass rate was employed with the internals.
The need to use superficial gas velocity based on open cross-sectional area for the flow is
essential in order to assert the reported internals effect. Furthermore, detailed studies of effect
of dense internals on the bubble dynamics (Youssef and Al-Dahhan, 2009 and Youssef,
2010) have shown that internals with low CSA coverage have no significant effect on the
bubble dynamics, hence the need for more studies with dense internals.
Abdulmohsin and Al-Dahhan, 2012 recently reported the effect of heat
exchanging internals on the heat-transfer coefficient from a 0.19 m diameter bubble
column for an air−water system with superficial gas velocities varying from 3 to 20 cm/s
using a fast response heat-transfer probe. In their study, they examined the effect of
Page 62
36
internals occupying 0 % (empty column), 5 % (simulating methanol synthesis), and 22 %
(simulating Fischer−Tropsch synthesis) of the column cross-sectional area. Their results
indicate that the presence of a high percentage of internals causes an increase in the heat-
transfer coefficient at the same gas velocity that is based on free cross-sectional area for
flow. Figure 2.9 (Abdulmohsin and Al-Dahhan, 2012) illustrates the effect of internals
and gas velocity on the heat transfer coefficient. The method of determining the
Figure 2.9 Effect of internals and actual gas velocity on the heat-transfer coefficients at
the column center (from Abdulmohsin and Al-Dahhan, 2012)
superficial gas velocity when the internals was used does not allow for proper
comparison since the same mass flow rate was employed as for empty column, then
back-calculated for the corresponding Ug with internals. This work was also limited to
two phase-systems and effect of scale was also not examined. In order to assess the
Page 63
37
dependence of heat transfer coefficient on bubble dynamics, there is still need to carry
out measurements simultaneously of both the heat transfer coefficient and bubble
properties at the same time and same location while utilizing the gas flow rate that is
based on the free area for flow only.
Most recently, Jhawar and Prakash, 2012 and Jhawar, 2011 studied local heat
transfer and column hydrodynamics in a 0.15 m ID bubble column with and without
solids in the presence of internals of different configurations and superficial gas velocity
covering homogenous, transition, and churn turbulent flow regimes. Local heat transfer
variations were measured with a fast response probe capable of capturing bubble
dynamics as well as detecting local flow direction. Glass beads averaging 49 μm in size
was used as the solids with loading varied up to 20 % by volume. Different
configurations of internals were used occupying 6 % of the cross-sectional area of the
column and water as the liquid phase. They observed a decrease in the heat transfer
coefficient with increase in the slurry concentration. Figure 2.10 shows the variation of
heat transfer coefficient at the center of bubble column without internals measured by
Jhawar, 2011. They also demonstrated that the internals configuration had significant
effect on the steepness of the radial profiles of both the liquid velocity and heat transfer
coefficient. With the tube bundle type of configuration the heat transfer coefficient had
steeper radial profiles and the rate of decrease in the heat transfer coefficient with slurry
was affected by internals configuration. From this work, the hydrodynamics studies were
limited to liquid velocity and overall gas holdup thus, many other bubble properties
including bubble velocity, frequency, sizes, and the local gas holdup radial profiles which
Page 64
38
control the column hydrodynamics and consequently their effect on the heat transfer
coefficient were not investigated or reported.
Figure 2.10 Effect of solids loading and gas velocity on the heat-transfer coefficients at
the column center (from Jhawar, 2011)
2.3. EFFECT OF SCALE IN BUBBLE AND SLURRY BUBBLE COLUMNS
The prevailing market oil prices determines the profitability of FT synthesis
process, while to be economically viable and independent of market oil prices, capital
expenditure (CAPEX) of such process needs to be equal to or below $20 000 Barrels/day
of installment cost (Shaikh and Al-Dahhan, 2010). The scale-up of slurry bubble column
reactor for Fischer-Tropsch synthesis can only be achieved with successful and proper
description of hydrodynamics and transports phenomena as a function of reactor scale. A
comprehensive approach, which consists of improved catalyst selectivity and efficiency
in FT synthesis and economies of scale in larger reactor sizes, is needed to achieve this
Page 65
39
goal. The economies of scale demands reduced risk in scale up to build large diameter
reactors, which in turn necessitates reliable similarity criteria. A vast majority of studies
in bubble and slurry bubble columns have been done on small diameter columns and only
a few have been done in bubble columns of diameter greater than 0.308 m and even much
fewer on effect of scale. Of the studies conducted on the effect of scale and column
diameter only those which are pertinent to this work are examined in this section.
Wilkinson et al., 1992 carried out experiments in two sizes of bubble columns for
a number of liquids at pressures between 0.1 and 2.0 MPa. Using their experimental
results as well as extensive literature data, the extent of the effect of column dimensions
on gas holdup were determined, both at low and high pressures (which is of importance
to scale-up). They also claimed that none of the published empirical gas holdup
correlations incorporates accurately the influence of gas density. Therefore, a new
improved gas hold-up equation was developed that incorporates the influence of gas and
liquid properties with an average error of approximately 10 %. It also discussed the
extent of the influence of pressure on other important design parameters such as the
interfacial area, the liquid volumetric mass transfer coefficient, and gas and liquid
mixing. According to this study, the gas holdup was found to be nearly independent of
the column dimensions and the sparger layout (for low as well as high pressures)
provided that: (1) the column diameter is larger than 15 cm; (2) the column height to
diameter ratio is in excess of 5; and (3) the hole diameter of the sparger is larger than 1–2
mm.
Degaleesan, 1997 addressed scale-up issues from the experimental data of fluid
dynamics obtained using computer automated radioactive particle tracking (CARPT) in
Page 66
40
bubble columns of 14 cm, 19 cm and 44 cm diameter operated in the churn-turbulent
flow regime. Based on her experimental data and literature information, she developed
correlations for predicting the mean liquid recirculation velocity and average eddy
diffusivities in air-water atmospheric systems. Degaleesan, 1997 also using a unified
characterization of churn-turbulent bubble columns, proposed a scale up methodology
that enables the estimation of the mean liquid recirculation velocity and average eddy
diffusivities in bubble columns operated in the churn-turbulent flow regime, higher
pressure and temperature all which are of industrial importance, using data generated
from the air-water systems. She claimed that any gas–liquid/slurry would exhibit the
similar hydrodynamic behavior as air–water system if both the systems have the same
overall gas holdup. It was suggested that hydrodynamics and mixing at the equivalent
superficial gas velocity, in an atmospheric air–water system that results in the same
overall gas holdups would represent the hydrodynamics and mixing in scaled up hot unit
The equations and scale up methodology of churn-turbulent bubble columns
which she proposed require the knowledge of and substantial experimental data for
additional bubble properties including the bubble velocity, bubble frequency and bubble
sizes among other parameters.
Inga and Morsi, 1997 working on a similar experimental unit as Behkish, 2004
extrapolated the results of laboratory scale stirred tank reactor to design industrial scale
slurry bubble column based on similarity of the relative importance of mass transfer
resistance in the overall reaction resistances, defined in terms of a dimensionless
parameter, which represents the balance between the mass transfer coefficient and rate
of consumption, pseudo kinetic constant for first order. Accordingly, maintaining the
Page 67
41
same in two reactors will result in the same reactant concentration and catalyst activity
and thereby the conversion and selectivity in two reactors.
Fan et al., 1999 carried out experiments in a high-pressure high-temperature
system of 2- inch and 4- in diameter columns. Using a vast range of data collected from
both the literature and their own experimental data over a wide range of flow conditions,
they proposed an empirical correlation which predicts the overall gas holdup in slurry
bubble columns of different scales in terms of the following three dimensionless
numbers; slurry Morton number, ( );
( )
, ⁄ , ⁄ . They suggested that
maintaining these dimensionless groups the same in two systems would lead to similar
overall gas holdup and hence mixing and hydrodynamics. This approach is similar to
Degaleesan, 1997. They also employed a similarity rule which is revealed for the overall
hydrodynamics of high-pressure slurry bubble columns, which takes into account the
operating conditions (such as high pressure), the maximum stable bubble size, and the
physical properties of the gas, liquid, and solids. The heat transfer characteristics under
high pressures were also investigated and a consecutive film and surface renewal model
used to characterize the heat transfer mechanism. It should be noted from this work that
the experimental work done were limited to very small columns thus extension of the
findings to larger columns of industrial interest cannot be confidently achieved.
Safoniuk et al., 1999 and Macchi et al., 2001, employed dynamic similitude
approach in which ratios of all forces acting on corresponding fluid particles and
boundary surfaces in the two systems are constant. In this mechanism, they presented a
scale-up method for three phase fluidized beds with the aid of the Buckingham pi
Page 68
42
theorem, which yielded five dimensionless numbers that have a significant effect on
overall gas holdup. These dimensionless groups are Morton number, (
)
Etovos number, ( ) , Reynolds number,
⁄ ; Density ratio ⁄ ; and Superficial gas and liquid velocity ratio, ⁄ .
Later, Macchi et al., 2001 tested the scaling approach of Safoniuk et al., 1999 in three
phase fluidized beds where aqueous solution of glycerol (a liquid mixture) was used as
the liquid phase in one column and silicone oil (a pure liquid) in the other. It was
observed that, whenever five dimensionless numbers were the same in these systems, the
overall gas holdups were within 11 % of root mean standard deviations. Macchi et al.,
2000 concluded that matching these five dimensionless numbers is inadequate to ensure
hydrodynamic similarity
Van Baten et al., 2003 developed a scale-up procedure that relies on the use of
computational fluid dynamics (CFD), with Eulerian descriptions of the gas and slurry
phases. Interactions between the bubbles and the slurry were taken into account by means
of a momentum exchange, or drag, coefficient; this coefficient is estimated from the
experimental measurements of gas holdup in a column of 0.051m diameter. They
proposed a modified strategy for the use of CFD approach to scale up bubble column
reactors. The drag coefficient and bubble diameter were calculated utilizing only overall
gas holdup data in small diameter column (5.1 cm). The CFD model was first validated
by comparison with the measured overall gas holdup data for a range of superficial gas
velocities. Figure 2.11 illustrates a comparison for different column diameters, the radial
distribution of the liquid and gas (bubble) velocities. However, the validation of CFD
simulation results with experiments in large diameter columns was not established.
Page 69
43
Figure 2.11 Radial profiles of (a) liquid velocity in 0.051 diameter column (b) liquid
velocity in 1 m (c) gas velocity in 0.051 m diameter column and (d) gas
velocity in 1 m diameter column (from Van Baten et al., 2003)
Zhang and Zhao, 2006 presented a scale up methodology that takes care of
hydrodynamics in cold flow units, catalyst performance evaluation in an autoclave, and
process investigation in a pilot-scaled circulating slurry bubble column reactor. Their
experiments were conducted in columns ranging from 4.2 cm – 10 cm in diameters. A
new suite of tools for developing low-temperature methanol synthesis in circulating
(a) (b)
(c) (d)
Page 70
44
slurry bubble reactors was explored in their study. They proposed a strategy that tied flow
behavior and catalysis studies with that of process engineering which involved studying
hydrodynamics in cold flow units, catalyst performance evaluation in an autoclave, and
process investigation in pilot-scale continuous slurry bubble column reactor. It should be
noted that while their studies included cold mockups and hot units they did not provide
any guidelines regarding hydrodynamic similarity in cold and hot unit nor any results
with successful scale-up were shown. Besides the column sizes used were relatively
smaller than desired in commercial FT systems and variation in the presence of dense
internals is still missing.
Forret et al., 2006 using 0.15 m, 0.40 m and 1 m diameter bubble columns
presented the effects of scale and the presence of internals on hydrodynamic
characteristics, for scale-up purposes based on experiments in cold mockups. They
worked out a scale-up methodology based on phenomenological models that require the
knowledge of overall gas holdup, center-line liquid velocity, and axial dispersion. Two
methods were proposed to predict scale effect on liquid velocity: an empirical correlation
proposed in the literature and a phenomenological model. They reconfirmed that the
overall gas holdup is independent of the column’s diameter for columns larger than 15
cm in diameter (Figure 2.12). They obtained the liquid phase velocity profile using a) an
empirical correlation for the center-line liquid velocity as a function of gas velocity and
column diameter, and b) the simplified one-dimensional two-fluid model accompanied by
adjustment of the turbulent viscosity as a function of column diameter and gas velocity.
Page 71
45
Figure 2.12 Overall gas holdup as a function of column diameter and superficial gas
velocity (from Forret et al., 2006)
Further they proposed a two-dimensional (2D) model to estimate the dispersion
coefficient in large columns, taking into account both the axial dispersion and the radial
dispersion. Whereas their study also included some data in columns equipped with
internals, the cross-sectional area occupied by the internals remained low and the effect
of solids especially the high solids loading on the measured parameters were not
evaluated.
Recently, Shaikh and Al-Dahhan, 2010 proposed a hypothesis for hydrodynamic
similarity that can be subsequently used for scale-up of bubble column reactors. Their
findings were mainly supported by experimental work carried out in a 0.162 m diameter
column using water and a mixture of C9–C11 to account for the effect of varying liquid
physical properties by gamma-ray computed tomography (CT) and computer automated
Page 72
46
radioactive particle tracking (CARPT) techniques. They proposed a hypothesis that takes
into account both global (by matching overall gas holdup) as well as local hydrodynamics
(by matching time-averaged radial profile/cross-sectional distribution of gas holdup) to
maintain similarity in two systems. They also demonstrated that similarity based only on
global hydrodynamics does not necessarily ensure similar mixing and turbulence in two
systems. They claimed that the hydrodynamic similarity can be obtained by matching the
commonly used dimensionless groups as were also evaluated at the experimental
conditions. They recommended that such evaluation of the demonstrated methodology be
further extended to study its utility in different column diameters. The validity of such
methodology in bubble columns equipped with dense internals is yet to be checked.
The most recent work on scale effect in bubble columns was done by Youssef,
2010. They proposed a scaling methodology based on the reactor compartmentalization
approach by using the heat exchanging tubes to create column wall of 6-inch diameter
and compared the findings with those of solid column wall of same diameter, conducted
by Xue, 2004 and found close match. The proposed reactor compartmentalization
methodology, which has various issues and uncertainties (Youssef, 2010), still needs to
be evaluated and validated in systems of at least two different physico-chemical
properties and solids for reliability of the scaling method.
The studies captured above on scale-up have at least one of the following
drawbacks: (1) Examined global parameters only and mainly the overall gas holdup; (2)
Mostly applicable to the homogenous flow regime; (3) Did not account for the presence
of dense internals and solids; (4) they are based on dynamic similarity but with no actual
Page 73
47
scaling validation; (5) they are missing experimental validation in large scale units
particularly the CFD simulations studies; (6) limited to hydrodynamics studies.
2.4. SUMMARY
As noted from the foregoing review, the role of bubble dynamics on the heat
transfer coefficient in bubble and slurry bubble columns is undisputed. The following
observations and conclusions can be made on the state of knowledge on the relevant heat
transfer and bubble dynamics studies in bubble and slurry bubble columns.
Bubble dynamics and heat transfer coefficient have been studied separately under
different operating conditions, thus the need for simultaneous measurements and
evaluation of heat transfer and bubble dynamics at the same time.
Most of the studies in the literature on the effects of operating and design
variables on the hydrodynamic and transport parameters have been performed in empty
bubble and slurry bubble columns. Hence the need to study the hydrodynamics and
transport parameters, such as heat and mass in columns inserted with mimicked dense
heat exchanging internals.
Most of the previous studies reported time-averaged heat transfer coefficients
obtained with slow response probes, which are unable to detect instantaneous variations
in the heat transfer rate, besides the heat transfer coefficients were measured on the basis
of the energy input (Saxena and Chen, 1994). In this approach the results were prone to
large errors since the energy used in heating up the column walls, column base and
fittings are counted as part of the heat transferred to the flowing liquid/fluid medium.
Hence adopting heat transfer measurement that is based on the measurement of the direct
Page 74
48
heat flux using fast-response probe (Prakash et al., 1997; Wu et al., 2007) could be more
appropriate.
In bubble columns equipped with internals, effect of internals was evaluated
based on same gas volumetric flow rate as empty column, hence the observed and
reported effects could be attributed to more kinetic energy introduced in to the system by
high mass of the gas that creates greater turbulence in the system. Hence the need to use
same mass gas flow rate evaluated on free cross-sectional area open for the flow only.
No heat transfer and bubble dynamics studies have been reported in the literature
for measurements conducted at the same time in bubble columns and slurry bubble
columns equipped with dense (25 % CSA) internals that mimic the 3-phase FT synthesis
operation system.
Whereas the diameter of internals play crucial role in bubble columns and slurry
bubble columns, the diameter effect of internals occupying the same CSA remains largely
uninvestigated in the reported bubble dynamics studies or heat transfer studies.
To the best of our knowledge, no study in the literature has examined through
simultaneous measurements the dependence of heat transfer coefficient on bubble
dynamics and at the same time in bubble and slurry bubble columns with or without
mimicked dense heat exchanging internals together with their radial distributions. Thus,
this forms the backbone of the current study as indicated in Section 1.2. Hence, this study
is focused on the effect of solids loading and dense internals on the heat transfer rate and
bubble dynamics in bubble columns of 6-inch and 18-inch diameter.
Page 75
49
3. EFFECT OF DENSE HEAT EXCHANGING INTERNALS ON BUBBLE
DYNAMICS IN BUBBLE AND SLURRY BUBBLE COLUMNS
The installation of internals is the most suitable way of removing excess heat
generated by exothermic process reactions such the FT synthesis and LPMeOH synthesis
since they (internals) provide both reasonable ratio of reaction volume to heat transfer
area and they preclude the need for either an external heat exchanger or large and
expensive slurry pumps (Carleton, 1967, Balamurugan and Subbaro, 2006). In Section 2
it was demonstrated that no single study has been reported in the literature on bubble
dynamics in bubble columns or slurry bubble columns equipped with dense internals of
different diameters, covering the same cross-sectional area. The effect of solids loading in
the presence of dense internals is yet to be reported too. The current section of this study
seeks to address this missing knowledge to provide a benchmarking database for future
studies in this direction and in view of modeling and scaling of systems with dense
internals. As described in Section 3.1.1, four point optical probe is utilized for the
measuring of the bubble dynamics and the local gas holdup, while the overall gas holdup
is visually estimated from the method of bed expansion.
3.1. MEASUREMENTS TECHNIQUE
In this work combined measurements technique has been used to measure
simultaneously the heat transfer coefficient and bubble dynamics. The combined
measurements have been achieved by using a hybrid probe which conceptually consists
of two independently fabricated probes, namely the advanced four-point fiber optical
probe and a fast response heat transfer probe. The advanced four-points fiber optical
Page 76
50
probe was used to measure the bubble properties which include local gas hold up, bubble
passage frequency, axial bubble velocity (upward and downward), specific interfacial
area, as well as the bubble chord lengths which is characteristic of bubble sizes. The fast
response heat transfer probe was used to measure the heat flux from which the heat
transfer coefficient can be estimated. The details of the fast response heat transfer probe
will be highlighted later in Section 4 and the heat transfer measurement procedures
detailed in Appendix B. Therefore, in this section only the details of four-point optical
probe is discussed
3.1.1. Four-Point Fiber Optical Probe. The four-point optical probe has been
successfully used in gas-liquid and gas-liquid- solid systems (Xue, 2004; Xue et al.,
2008; Wu, 2007; Youssef and Al-Dahhan, 2009 and, Youssef, 2010). It is an excellent
tool to use in systems including those with internals, solids and fines. As mentioned
above, it can provide insight into the bubble characteristics (local gas holdup, bubble
chord length, specific interfacial area, bubble frequency, bubble velocity (both radial and
axial) among other properties, adjacent to the axial cooling tubes frequently used in
industrial applications. It can provide local information on the effect of solids loading on
bubble properties as well. Though originally developed and successfully implemented in
gas-liquid systems, it was observed during the data acquisition in the current study that
far high signal to noise ratio was achieved with solids loading than in gas-liquid systems
only.
The four points optical probe used in the current study is an advanced version of
the one originally developed and employed by Frijlink, 1987 at Kramers laboratory in the
Department of Multiscale Physics at the Technical University of Delft in the Netherlands.
Page 77
51
It was refined by Xue et al., 2003, Xue, 2004; and Xue et al., 2008 in the Chemical
Reaction Engineering Laboratory (CREL) at Washington University in Saint Louis, who
developed and validated a new data processing algorithm in columns without internals. It
has since been used and further validated by Wu et al., 2007 and Wu, 2007 in three phase
systems and Youssef and Al-Dahhan, 2009, and Youssef, 2010 who extended it to bubble
columns equipped with dense internals structure at the same laboratory. The four points
probe consists of four tips, three of which are of the same length and form an equilateral
triangle. The fourth central tip is positioned through the geometric centre of this triangle
measuring about 2.0 mm longer than the three peripheral tips. Each fiber consists of three
layers: a quartz glass core having a refraction index of 1.45 and a diameter of 200 µm, a
silicon cladding to make the diameter of 380 µm and a further protective layer of Teflon
making the overall diameter of 600 µm. The cladding and Teflon layers are removed
from the last centimeters of the probe. Figure 3.1 shows the four points optical probe tips,
views and configurations, while Figure 3.2 shows the fiber optic coupling scheme and
probe tip with the probe response to a bubble strike.
Each optical fiber sensitive part is shaped by over-heating it, resulting in a round
shaped glass core end much like Figure 3.1c. The manufacturing of the probe has been
done in our laboratory at Missouri University of Science and Technology (Missouri S&T)
which is equipped with all the needed tools and equipment. The light is sent into each
fiber by a Laser Emitting Diode (LED) of wave-length 680 nm via standard glass fiber
connectors and is detected by a photodiode. Due to the difference in refractive index
between liquid and the gas phase, when the fiber tip is in a liquid medium, most of the
Page 78
52
Figure 3.1 Configurations of four-point optical probe (a) Optical probe tips (b) Side
view of four points probe tip (c) TEM image of finished tip, (d) Top view
of four points probe tip
light is refracted into the liquid and very little light is sent back up the fiber. However,
when the tip is in the gas bubble, most of the light is reflected and travels back into the
coupler that channels about 50 % of the reflected light into a photodiode (see Figure 3.2
a) which finally transforms the light photons into a voltage much like in Figure 3.1 b.
Finally, the voltage signals are collected by a data acquisition board (PowerDAQ PD2-
MFS-8-1M/12) at a sampling frequency of 40 kHz. This data acquisition board was
purchased from United Electronics Industries.
(a)
(b)
(c) (d)
Page 79
53
Figure 3.2 Fiber optic coupling scheme and probe tip with the probe response to a
bubble strike (a) Fiber coupling and probe tip (b) Bubble striking four-
point optical probe tips
3.1.2. Data Processing and Optical Probe Signal Analysis: From the captured
signal with a probe response to bubble strike such as illustrated in Figure 3.2(b), the
bubble parameters already stated can be determined by following the algorithm advanced
by Xue, 2004. In this section the algorithm for extracting the bubble velocity, bubble
chord length, specific interfacial area and the local gas holdup is presented.
For a single bubble movement, the bubble velocity vector aligns itself with the
bubble orientation due to the balance of the forces on bubbles and the shape flexibility of
gas bubbles (Xue, 2004; Xue et al., 2008; Wu, 2007). However, in churn-turbulent flow
regime, sometimes the direction of bubble’s motion changes significantly due to the
strong turbulence, thus the bubble velocity vector might deviate from the normal vector
of the bubble’s symmetry plane by an angle . Such a deviation may cause errors in the
bubble velocity vector and bubble chord length measured by the four-point optical probe.
The sketches of the physical situation of the bubble velocity and chord length
measurements in churn-turbulent flow are as shown in Figure 3.3 (Xue, 2004).
gas
liquid
Page 80
54
(a) (b)
(c)
Figure 3.3 The physical situation of the bubble velocity and chord length measurements
(from Xue, 2004)
In order to obtain the bubble velocity and chord length particularly in the churn-
turbulent flow regime that is desired in the LPMeOH synthesis and FT process the
following procedure is adopted as proposed by Xue, 2004 and Xue et al., 2008. Using the
v
Tip2
B
D
Tip3
Tip1
Tip0 A
n
C
z
x
z’
y
y’
x’
n
n
v
O
x’
v
z’
y’
Tip3 T1
Tip2
Tip0
z1’/cos
Q P
z1’
Page 81
55
central tip, (Tip0) as the reference for each bubble strike, it can be derived from Figure
3.3c that the time intervals between the instant when a bubble hits the central Tip0 and
when it hits each of the other peripheral tips, Tip i, with i=1,2,3 are:
cosv
coszsinsinycossinx
v
cos/z
2
TTt 111
'
110
1 (3.1a)
cosv
coszsinsinycossinx
v
cos/z
2
TTt 222
'
220
2 (3.1b)
cosv
coszsinsinycossinx
v
cos/z
2
TTt 333
'
330
3 (3.1c)
where is the angle between the normal vector (vector in Figure 3.3b) of the bubble’s
symmetry plane to the probe’s axial direction, and is the angle between the projection
of the normal vector on the xy plane and the x axis (Figure 3.3b). As shown in Figure
3.3b, the xyz coordinate system is transformed to x’y’z’ system with its z’-axis in the
direction of the bubble’s normal vector, . With four variables (v, , and ) and three
equations (Equations 3.1a, 3.1b, 3.1c), it is only possible to obtain , and the product
cosv instead of each of the variables separately. Once the bubble velocity is known,
the bubble chord length Li pierced by tip i is simply given by the product cosTv i ,
thus,
cos( )i iL v T (3.2)
While in Figure 3.3a, the chord length from the point where the probe’s central tip hits
the bubble’s surface, A, is AC, with the product cosTv 0 actually being the distance
Page 82
56
AD. Hence, in the case where the bubble velocity vector does not align with the bubble’s
orientation, the determined bubble velocity vector and bubble chord length contain a
systematic error. However, the error is small when the value of is small.
For the measurement of the specific interfacial area between the bubble and the
liquid for each bubble strike, Kataoka et al., 1986 derived the equation for specific
interfacial area as;
N vT
acos
11 (3.3)
Where N is the total number of the gas-liquid interfaces passing though the probe during
the measurement time T, and is the angle between the velocity vector and the normal
vector of the gas-liquid interface. According to Xue, 2004, the equations describing the
velocity of the bubble’s surface section pierced by the four-point probe are;
cos
cossinsincossin 1111
v
zyxt (3.4a)
cos
cossinsincossin 2222
v
zyxt (3.4b)
cos
cossinsincossin 333
3
v
zyxt (3.4c)
The unknowns in these equations are now and cos( )v , and the three equations can
be solved numerically to find cos( )v which is the needed component in Kataoka’s
equation to directly determine interfacial area without assuming the bubble geometry.
Page 83
57
The overall gas holdup defined as the ratio of volume of the gas-liquid mixture
occupied by the gas. The local gas holdup can be defined in a similar way but at an
infinitesimal volume within the reactor. By invoking the ergodic principle, which states
that “the ensemble average is equivalent to the time average”, the spatially (volume)
averaged local gas holdup can be replaced by its equivalent time-averaged local gas
holdup and thus estimated using the following equation:
,G
G local
G L
t
t t
(3.5)
Where and is the time the probe spends in the gas bubbles and liquid respectively.
The details for the local gas holdup estimation are presented in Section 5.
3.2. IMPACT OF INTERNALS SIZE AND CONFIGURATION ON LOCAL GAS
HOLDUP AND BUBBLE PROPERTIES IN 6” BUBBLE COLUMN
Whereas the impact of internals on bubble dynamics have been investigated
comprehensively by only one researcher, (Youssef and Al-Dahhan, 2009), no studies
have been reported in the open literature on the effect of dense internals with different
diameters and covering the same cross-sectional area and hence configuration on bubble
properties. Therefore in this section, the effect of size of internals on bubble dynamics is
discussed for a 6-inch diameter column.
3.2.1. Experimental System and Setup. The experiments were carried out in a
Plexiglas column of 0.14 m in diameter and 1.83 m in height. The dynamic bed height
was estimated visually and maintained at a constant level of about 1.56 m (z/D = 11.3)
above the gas distributor by adjusting the amount of liquid loaded in the column. All the
measurements were done at z/D = 5.6 which represents the fully developed flow region.
Page 84
58
At this height above the distributor, the bubble properties remain nearly unchanged as it
falls within the fully developed flow region. This height was chosen since the
experimental results show that within this flow region, bubble properties including gas
holdup, bubble velocity, specific interfacial area, and bubble frequency are independent
of axial position (Ong et al., 2009, Xue, 2004).
A schematic diagram of the experimental setup is shown in Figure 3.4. In this
work, the gas phase used was compressed oil-free dry air passed through filters and
introduced continuously from the bottom of the column with the flow regulated by a set
of calibrated rotameters. The high range rotameters were custom made and purchased
from Brooks Instruments (1024NL0D1AA3F9C00001 and 1024NP0A1AA5F9C00001)
with the capacity to deliver between 330-3,200 SCFH and 2,000 - 19,000 SCFH of air,
respectively. While the lower range rotameter (FL-1501A-B) was purchased from Omega
Engineering Inc. with air flow capacity of 0.317-3.17 SCFM. This set of rotameters gives
the gas flow rate that covers both the bubble flow regime and churn turbulent flow
regime. The compressed air was supplied by industrial scale high capacity air compressor
purchased from Ingersoll Rand. It is a two stage rotary screw type air compressor, which
can deliver compressed air at the rate of 44 100 CFH and at a pressure up to 200 psig.
Soft filtered tap water was used as liquid phase.
Perforated plate with 121 holes and diameter of 1.32 mm arranged in a triangular
pattern with a total free area of 1.09 % was used as the gas distributor which yields an
intermediate flow condition characterized by the dimensionless capacitance number Nc
defined by; (Kumar and Kuloor, 1970; Tsuge and Hibino, 1983).
When Nc is smaller than 1, the gas flow rate through the orifice is constant, which is
Page 85
59
Figure 3.4 Schematic diagram of the experimental system with dense internals in 6-inch
column
Page 86
60
characterized as constant flow conditions. When Nc is larger than 9, the gas flow rate
yields a variable pressure, and is dependent on the pressure difference between the gas
chamber and bubble. The capacitance number in this case was 1.65 that lies between 1-9.
The experiments were carried out at a range of superficial gas velocities covering
homogenous flow regime, transition flow regime and the churn turbulent flow regimes.
The superficial gas velocities were varied from 0.03 to 0.45 m/s based on both the total
cross-sectional area (CSA) of the column and also based on the free cross-sectional area.
Two different sizes of internals were used in each case covering 25 % of the column
cross-sectional area that simulates the Fischer-Tropsch synthesis process. For reference
and to form a basis for comparison, experiments and measurements were also done on
empty bubble columns. The internals used in this study were vertical Plexiglas rods of
0.5-inch and 1-inch diameter. The configurations of the internals design used are shown
in Figure 3.5.
Figure 3.5 Internals configurations covering 25 % CSA (a) 0.5-inch diameter (b) 1-inch
diameter
(a) (b)
Page 87
61
For superficial gas velocity calculations, the free cross-sectional area of the column was
determined from the following relation;
{
} {
} {
}
3.2.2 Results and Discussion. Even though combined measurements approach
was used to simultaneously measure both the bubble dynamics and the heat flux at the
same time, only the bubble dynamics results are presented and discussed in this section.
Whereas a few studies have examined the impact of internals on bubble dynamics, the
mode of determining the gas flow rate and hence the gas velocity into the column has
remained questionable. The use of empty cross-sectional area (open cross-sectional area
available for flow only) is emphasized in calculating the superficial gas velocity in order
to determine the effect of internals which should be free from the influence of the higher
mass rate of the gas which may result when the cross-sectional area of empty column is
used in calculating the superficial gas velocity.
3.2.2.1 Overall and local gas holdup. Overall gas holdup may be defined as the
volume fraction of gas in the gas-liquid dispersion (Joshi J.B, 1998). It is one of the
important design parameters in the bubble and slurry bubble column reactors. It not only
governs the overall reactor performance but also determines the volume of the reactor
since it is the fraction of the column volume occupied by the gas phase. The local spatial
variation of the gas holdup is yet another key parameter of the gas holdup since it gives
rise to pressure variation radially and axially leading to varied strengths in the large scale
and small scale liquid re-circulations which are important aspects for both mass and heat
transfer in bubble and slurry bubble columns. It should be noted that the overall gas
Page 88
62
holdup was measured in the Plexiglas columns by visual observation using the bed
expansion approach in the lab. Other means or technique may be adopted for opaque
systems such as the stainless steel columns in which visualization may not be possible.
Local gas holdup at an interrogation point is the fraction of an infinitesimal
volume around this point that is occupied by the gas phase (Drew, 1983; Kumar, 1994).
While the overall phase holdup is important in determining the gas phase residence time
and the system pressure drop, the local void fraction provides information about the
phase interactions, the interfacial areas, and phase recirculation; which are all related to
the heat transfer mechanisms. Consequently, local gas holdup and its distribution have
been identified as among the most important parameters that govern liquid recirculation
in bubble column operation. Figure 3.6 illustrates the influence of superficial gas velocity
based on both the free cross-sectional area and total cross-sectional area of the column on
the overall gas holdup (Figure 3.6a) and local gas holdup (Figure 3.6b) at the center of
the column, r/R(-) = 0.0. It is evident that the effect is significant when the Ug is based on
the empty column’s cross-section area. This result shows that the dense internals have
little effect on the overall gas holdup and local gas holdup at the center of the column,
r/R(-)= 0.0 particularly at higher gas velocities. However, the observed enhancement at
superficial gas velocity based on total cross-sectional area can be attributed to same mass
flow rate of the gas as that of empty column passing through a smaller cross-sectional
area. To quantify the reproducibility of measurements the use of error bars have been
made which show very little deviations. Thus for the purposes of clarity, the error bars
have not been plotted in most of the subsequent bubble dynamics figures. Figure 3.7
shows the effect of different diameters of internals on radial profiles of local gas holdup
Page 89
63
with gas velocities based on free cross-sectional area (Figure 3.7a) and also based on total
cross-sectional area (Figure 3.7b) at Ug = 3 cm/s (bubbly flow regime).
(a)
(b)
Figure 3.6 Effect of dense internals (0.5 inch diameter) on (a) Overall gas holdup and (b)
Local gas holdup at r/R(-) = 0.0, with superficial gas velocity based on the
total cross-sectional area and free cross-sectional area of the column
0
5
10
15
20
25
30
35
40
45
0 10 20 30 40 50
No Internals
Internals- Ug Based on Free CSA
Internals- Ug Based on Total CSA
Superficial gas velocity, Ug(cm/s)
Over
all
gas
ho
ldu
p, (%
)
0
10
20
30
40
50
60
70
0 10 20 30 40 50
No Internals
Internals-Ug Based on Free CSA
Internals-Ug Based on Total CSA
Superficial gas velocity, Ug(cm/s)
Loca
l gas
ho
ldu
p, (%
)
Page 90
64
(a)
(b)
Figure 3.7 Effect of size of internals on radial profiles of local gas holdup at Ug = 3 cm/s
(a) Ug based on free cross-sectional area (b) Ug based on total cross-
sectional area
As noted in Section 2, most of the bubble dynamics studies including gas holdup
were conducted in empty bubble columns. When the columns are inserted with internals,
the flow rate of the gas into the system should be employed based on the free area of the
column cross-section available for the flow in order to assess the effect of internals only.
It is observed that when 25 % of the cross-sectional area is occupied by internals the local
Page 91
65
gas hold-up is enhanced by up to 40 % at Ug = 3 cm/s at the column center (r/R = 0.0),
with 0.5-internals giving higher values which are also within 5 % of the values obtained
with 1-inch internals. Close to the column wall region regardless of the cross-sectional
area used in calculating the superficial gas velocity, the internals have little effect. A key
observation that has been made is that in the bubbly flow regime (Ug = 3cm/s), the 1-inch
internals enhances the local gas holdup in the middle region between the column center
and the column wall by between 25 % and 20 % more than the 0.5-inch internals when
the gas velocity is based on free CSA and total CSA, respectively. Therefore in the
homogenous (bubbly) flow regime, the difference caused by the dense internals on the
local gas hold up is significant. Consequently the local gas holdup results obtained in the
empty columns operated in the bubbly (homogenous) flow regime cannot be extrapolated
to columns equipped with dense internals
Figure 3.8 shows the effect of different diameters of internals on radial profiles of
local gas holdup with gas velocities based on free cross-sectional area (Figure 3.8a) and
also based on total cross-sectional area (Figure 3.8b) at Ug = 45 cm/s, which is in the
churn turbulent flow regime. At Ug = 45 cm/s based on free cross-sectional area the gas
holdup is enhanced by up to 6 % close to the column wall region with 1-inch diameter
internals. Elsewhere along the radial locations, the enhancement of local gas holdup by
different internals sizes lie within 3 % of each other, with average increase of less than 2
% for both the 0.5-inch diameter and 1-inch diameter internals. However, when the Ug is
based on total cross-sectional area then the effect is noticeably higher. The local gas
holdup is increased by up to 17 % at the column center by 0.5-inch diameter internals
with a mean increase in radial gas holdup of 12 % when 0.5-inch diameter internals are
Page 92
66
used. Up to 21 % increase is attained closer to the column wall by 1-inch internals and
radial average increase of 13 % in the local gas holdup with the same (1-inch) internals.
Again this is due to same mass of gas flow rate introduced through smaller cross-
sectional area in the case of dense internals
It is obvious therefore that whereas the presence of internals affects the flow field
behavior in bubble columns, the gas holdup enhancement attributable to higher break up
rates due to dense internals is negligible at higher superficial gas velocity. Youssef and
Al-Dahhan, 2009, reported enhanced bubbles breakup rate when the gas velocity is based
on total cross-sectional area, where same volumetric flow of gas flowing through a
smaller cross-section of the column with dense internals compared to that without
internals. The same volumetric flow rate of gas through smaller cross-section would yield
higher gas velocity inside the column with internals. This higher gas velocity inside the
column with internals would give rise to large population of bubbles with higher bubble
passage frequency and hence higher gas holdup is obtained.
Also worth mentioning is the fact that at the column core region within r/R(-)
, the 0.5-inch diameter internals gave consistently higher gas holdup while 1-inch
diameter internals gave higher values at r/R(-) = 0.9. Thus local gas holdup radial profiles
obtained with 0.5-inch diameter internals are steeper than those obtained with 1-inch
diameter internals. Hence, higher large-scale liquid recirculation velocity is expected with
0.5-inch internals which needs to be experimentally evaluated. In this case the heat
transfer rates obtained with 0.5-internals is likely to be higher than those obtained with 1-
inch diameter internals or no internals, which is experimentally evaluated in Section 4.4.
Page 93
67
(a)
(b)
Figure 3.8 Effect of size of internals on radial profiles of local gas holdup at
Ug = 45 cm/s (a) Ug based on free cross-sectional area. b) Ug based
on total cross-sectional area
From this section, it can be concluded that in the churn turbulent flow regime at
very high gas velocity, Ug = 45 cm/s, the overall gas holdup or local gas holdup results
0
10
20
30
40
50
60
70
0 0.2 0.4 0.6 0.8 1
No Internals
0.5 inch Internals
1 inch Internals
Dimensionless radius, r/R(-)
Loca
l gas
hold
up, (%
)
0
10
20
30
40
50
60
70
0 0.2 0.4 0.6 0.8 1
No Internals
0.5 inch Internals
1 inch Internals
Dimensionless radius, r/R(-)
Loca
l gas
hold
up, (%
)
Page 94
68
obtained from investigations in empty bubble columns can be extrapolated to columns
with dense internals. This can be achieved by matching the superficial gas velocity in
columns with dense internals to those of empty columns by using the gas velocity based
on the free cross-sectional area available for flow.
In order to assess the performance of the four-point optical fiber probe in this
work, the radial profiles of gas holdup obtained by the probe was compared with those
predicted by correlation of Schweitzer et al., 2001 (Equation 3.6) which was obtained
based on experiments performed in smaller columns (D ≤ 0.4 m) without internals.
{ ( (
)
) ( (
)
) ( (
)
)} (3.6)
Where is the cross-sectional average gas holdup and the only required input. Futher
comparison was made with the correlation of Wu and Al-Dahhan, 2001 (Equation 3.7a)
that was developed based on extensive gas holdup and radial gas holdup profiles acquired
in the Chemical Reaction Engineering Laboratory (CREL) by using gamma ray
Computed Tomography (CT) in columns ranging in diameter from 0.19-0.44 m.
(
) [ (
)
]
( )
( )
Where, is indicative of the steepness of the gas holdup profiles, is indicative of the
gas holdup value near the column wall and is the cross-sectional average gas holdup.
Page 95
69
Kumar, 1994 has shown that the cross-sectional average gas holdup measured at
heights above the distributor larger than 4 to 5 column diameters is in close agreement
with the overall gas holdup in the column. Thus the overall gas holdup estimated by
visual observation using the bed expansion approach in the current work is utilized in
Equation 3.5 and Equation 3.6 to predict the radial profiles of the gas holdup. The
comparison is made between the four-point optical probe measurements in this study and
predicted radial profiles. Figure 3.9 shows the comparison at 8 cm/s and at 45 cm/s of
superficial gas velocity based on free CSA (Figure 3.9a) and also based on total CSA
(Figure 3.9b). A close match between the radial profiles obtained by measurements and
using predictions from the correlations was realized. The main conclusion that can be
drawn is that the influence of internals on the gas holdup in bubble column can as well be
determined by estimating the gas holdup in empty bubble columns at same superficial gas
velocity equivalent to that in the column with internals estimated based on free CSA.
While the effect of the configuration and diameter of internals is only significant at lower
range of gas velocity.
3.2.2.2 Bubble passage frequency. The bubble passage frequency may be
defined as the number of bubbles that pass through a unit volume in space within the
reactor in a unit time. In order to quantify the bubble passage frequency in the current
work, the total number of bubbles that hit the probe’s central tip was divided by the total
sampling time. For the bubble passage frequency and specific interfacial area, the effect of
internals diameter and configuration on bubble properties is presented only for the churn
Page 96
70
(a)
(b)
Figure 3.9 Optical probe measurements comparison with literature correlations in bubble
column with 0.5- inch diameter internals with superficial gas velocity based
on (a) Free cross-sectional area (b) Total cross-sectional area
turbulent bubble column operation since trends similar to those of local gas holdup were
observed for the low range of gas velocity as discussed for local gas holdup at Ug = 3
0
10
20
30
40
50
60
70
0 0.2 0.4 0.6 0.8 1
Probe 45 cm/s Schweitzer et al. 45 cm/s
Wu and Al-Dahhan 45 cm/s Probe 8 cm/s
Schweitzer et al. 8 cm/s Wu and Al-Dahhan 8 cm/s
Dimensionless radius, r/R(-)
Lo
cal
gas
ho
ldu
p, (%
)
0
10
20
30
40
50
60
70
0 0.2 0.4 0.6 0.8 1
Probe 45 cm/s Schweitzer et al. 45 cm/s
Wu and Al-Dahhan 45 cm/s Probe 8 cm/s
Schweitzer et al. 8 cm/s Wu and Al-Dahhan 8 cm/s
Dimensionless radius, r/R(-)
Loca
l gas
hold
up, (%
)
Page 97
71
cm/s. Additional results at 3 cm/s are available in Appendix C-1. Only a few studies have
examined the bubble passage frequency in bubble columns, (Choi and Lee, 1992; Xue,
2004; Wu, 2007; Shin et al., 2009, and Youssef and Al-Dahhan, 2010). However, none
has examined the effect of size of internals and the internals configuration on bubble
passage frequency.
Figure 3.10 shows the radial profiles of bubble passage frequency for different
diameters of internals with superficial gas velocity (45 cm/s) based on both free CSA
(Figure 3.10a) and total CSA (Figure 3.10b). Similar profiles were obtained at 20 cm/s
and 30 cm/s and have not been re-plotted here. Like gas holdup, the radial bubble
frequency, is governed by bubble slip velocity generated by the net radial force and
turbulent dispersion. Choi and Lee, 1992 reported that the bubble frequency is influenced
by the gas holdup, bubble size, bubble rise velocity as well as the intensity of the liquid
turbulence. It is evident from Figure 3.10, that the bubble passage frequency is
significantly increased when column is inserted with internals particularly the 0.5-inch
internals. The intertube gap, for the 0.5-inch internals is much smaller than that of 1-
inch internals (less than half of that of 1-inch). This restricts the coalescence of bubbles
and enhances the bubble break-up rate thus many bubbles appear in the column per unit
time. It is also noted that when 1-inch diameter internals are used and the superficial gas
velocity is based on free CSA, up to 49 % increase in bubble passage frequency is
obtained close to the column wall region with a cross-sectional radial average increase of
9.2 %. While for 0.5-inch diameter internals an average increase of 40 % is attained with
twice as many bubbles in wall region than without the internals. A similar trend is
Page 98
72
observed when the superficial gas velocity is based on total CSA where the average
increase when 0.5-inch internals are used is 30 % higher than with 1-inch internals.
(a)
(b)
Figure 3.10 Effect of size of internals on radial profiles of bubble passage frequency
at Ug = 45 cm/s (a) Ug based on free cross-sectional area (b) Ug based on
total cross-sectional area.
0
20
40
60
80
100
120
0 0.2 0.4 0.6 0.8 1
No Internals
0.5 inch Internals
1 inch Internals
Dimensionless radius, r/R(-)
Bu
bble
pas
sage
freq
uen
cy, (s
-1)
0
20
40
60
80
100
120
0 0.2 0.4 0.6 0.8 1
No Internals
0.5 inch Internals
1 inch Internals
Dimensionless radius, r/R(-)
Bubble
pas
sage
freq
uen
cy, (s
-1)
Page 99
73
3.2.2.3 Specific interfacial area. According to Sehabiague, 2012, specific
interfacial area is usually defined as the ratio of the surface of the gas bubbles per unit
liquid-phase volume. In bubble and slurry bubble columns, the overall mass transfer rate
per unit volume of the dispersion is governed by the liquid-side mass transfer coefficient,
kLa since kLa << kGa (Lye et al., 2001) hence the volumetric mass transfer coefficient kLa
is the key parameter needed in order to determine the bubble column reactor
performance. Behkish, 2004 studied the volumetric liquid-side mass transfer coefficient,
kLa, using the transient physical gas absorption technique in the cold and hot slurry
bubble column reactors (SBCRs). He reported that the kLa values in the slurry bubble
column reactors were found to vary only due to the alteration of the gas-liquid interfacial
area, a. Similar conclusions were arrived at by Fan et al., 1985, and Kantarci et al., 2004.
Thus, a proper knowledge of the specific gas-liquid interfacial area and the radial
distribution is required for proper design and optimal operation of bubble and slurry
bubble column reactors.
Figure 3.11 shows the effect of internals size and configuration on the specific
interfacial. The specific interfacial area has been found to increase with superficial gas
velocity. The change in specific interfacial area with respect to superficial gas velocity is
higher at low range of Ug (0 – 10 cm/s) and gets lower or less at higher range of Ug (10 –
45 cm/s), see Figure 3.11. Similar trend was also reported from the experimental
findings of Xue, 2004 and Xue et al., 2008 and various empirical correlations and CFD
models of several researchers including, Krishna and Van Baten, 2003; Behkish et al.,
Page 100
74
Figure 3.11 Effect of size of internals size on specific interfacial area
at r/R(-) = 0.0, with Ug based on free cross-sectional area.
2002; and Akita and Yoshida, 1974. With increasing superficial gas velocity, more
bubbles appear in the column. Xue, 2004 and Youssef and Al-Dahhan, 2009 reasoned
that the population of bubbles increases with superficial gas velocity, at the same time the
bubbles breakup rate and coalescence is enhanced. The coalescence of bubbles leads to
formation of larger bubbles, at the same time the population of small bubbles also
increase significantly that gives rise to many bubbles in the column hence increased
interfacial area with the superficial gas velocity.
It is noteworthy that the profiles of specific interfacial area exhibit local
maximum then continues to rise with the superficial gas velocity. Local maxima are
characteristic of the region or range of superficial gas velocity where the flow regime
transitions into churn turbulent from the transition flow regime range. A similar trend has
Page 101
75
been reported before for the overall gas holdup measurements, from which the three flow
regimes can also be identified (Jhawar and Prakash, 2007; Krishna et al., 1997). Figure
3.12 obtained from Jhawar and Prakash, 2007 compares the gas holdups obtained with
two types of spargers, a fine and a coarse sparger, with a fine sparger showing clearly this
Figure 3.12 Variation of overall gas holdup with superficial gas velocity with fine and
coarse sparger. (Obtained from: Jhawar and Prakash, 2007)
range where a local maximum occurs for the overall gas holdup. Therefore with a local
maxima occurring at the same superficial gas velocity, it is possible that specific
interfacial area can be used to pin-point where the flow regime changes from transition
flow into the churn turbulent flow, Figure 3.11. Use of dense internals leads to
enhancement of the specific interfacial area, with 0.5-inch diameter internals exhibiting
greater enhancement. As noted earlier the tube pitch for 0.5-inch internals restrict the
Page 102
76
maximum bubble sizes which can pass between the tubes hence higher break-up rate
leading to smaller bubbles with higher specific interfacial area per unit volume. The
radial profiles of the specific interfacial area at Ug = 45 cm/s is shown in Figure 3.13.
Like the gas hold-up, the 0.5-inch diameter internals have steeper radial profiles of
specific interfacial area compared with empty column or with 1-inch diameter internals.
Figure 3.13 Effect of size of internals and configuration on radial profiles of specific
interfacial area at Ug = 45 cm/s based free cross-sectional area
With 0.5-inch diameter internals an increase of 15 % is attained at the column
core region, (
) while 7 % increase is attained with 1-inch diameter internals at
the same region. Closer to the column wall, the interfacial area is increased by 10 % and
20 % with 0.5-inch and 1-inch diameter internals respectively. Previous studies by
Youseff and Al-Dahhan, 2009, Xue, 2004 Xue et al., 2008 and Wu, 2007 on bubble
Page 103
77
passage frequency have demonstrated that an increase in bubble frequency leads to an
increase in gas holdup and specific interfacial area.
It was found that a larger interfacial area existed at the column’s center than in the
region near the wall which is similar to the findings of Xue et al., 2008. This difference is
due to enhanced rates of breakup and coalescence among bubbles in the central region of
the column in the churn turbulent flow regime, which was confirmed by the bubble
frequency measured by the probe. An increase in bubble frequency leads to an increase in
specific interfacial area. Speaking generally, an increase in bubble frequency leads to an
increase in gas holdup and specific interfacial area.
3.2.2.4 Bubble chord length. By taking into account the column hydrodynamics,
mass transfer, kinetics, and bubble-bubble interaction, Bauer and Eigenberger, 2001
demonstrated that in multiscale modeling the change in local bubble size, due to mass
transfer with reaction, and change in local mass fluxes between the gas and liquid phases
can significantly change the hydrodynamics of the bubble column. Thus it is necessary to
examine the bubble sizes which are characterized by the bubble chord lengths in this
work. Bubble chord lengths have been used as the characteristic length for bubble sizes
by a number of researchers, (Choi and Lee, 1992; Schweitzer et al., 2001; Xue, 2004;
Xue et al., 2008; Wu, 2007; Shin et al., 2009; Youssef and Al-Dahhan, 2009 and
Youssef, 2010). Whereas the mean of the chord length has been used as the characteristic
bubble size, it does not give the correct picture of the size of bubbles in the system.
Therefore, the use of bubbles chord lengths distribution has been adopted in this work
and reporting the mean bubble chord lengths where necessary. A large population of
smaller bubbles and smaller population of large bubbles was noted by histogram plot as
Page 104
78
shown in the following sections (Figure 5.12a and b). However, the bubbles size structure
is best represented by using a lognormal distribution. Akita et al., 1974 were the first to
report that bubble size distribution follows a lognormal distribution and similar findings
have thereafter been reported by; Glasgow et al.,1984; Yasunishi et al., 1986;
Luewisutthchat, et al., 1997, and Pohorecki et al., 2001. The lognormal distribution for
the bubble sizes, f(lc) is expressed as:
√ [
]
Where, , is the measured chord length obtained directly from the four points optical
probe and the parameters and are related to the mean, , and variance, , of the
measured chord lengths as follows;
√ and √
Accordingly, in this work the measured chord lengths, that are directly obtained
from the four-points optical probe are represented by Equation 3.8 by using the chord
length, for each measured data point obtained during a bubble passage. This equation
hence, is used here to plot all the probability density functions, (pdf) as demonstrated in
Figures 3.14 through 3.16. Figures 3.14 through 3.16 show the effect of internals sizes
and configuration at Ug = 3 cm/s and at Ug = 45 cm/s of gas flow rate based on free cross-
sectional area measured within the column center, (r/R (-) = 0.0) and at two other
different radial locations, r/R (-) = 0.5, and r/R (-) = 0.9). The bubble chord lengths have
been further analyzed statistically by providing the mean and the variance, as shown in
Table 3.1. The variance of the distribution, is defined as
∑
,
where n is the number of data points and is the mean. Here in this section, to avoid
Page 105
79
confusion with the parameters in equation 3.8, mean and variance are represented by
and and summarized in Table 3.1. At Ug = 3 cm/s the size of bubbles exhibits a narrow
distribution which indicates near uniform size in the column while in churn turbulent
flow regime, at Ug = 45 cm/s, a wide bubble size distribution is observed.
(a) (b)
(c)
Figure 3.14 Effect of size of internals and configuration on the bubble chord length
distributions at r/R(-) = 0.0, (a) at Ug = 3 cm/s based on free cross
sectional area (b) at Ug = 45 cm/s based on free cross-sectional
area (c) large-scale view of Figure(b), (Equation 3.8)
0.2 0.4 0.6 0.8 1 1.2 1.4 1.6 1.8 2
0.5
1
1.5
2
2.5
3
chordlength, (cm)
pdf
No Internals
0.5-inch Internals
1-inch Internals
0.5 1 1.5 2 2.5 3 3.5 4 4.5 5 5.5 6
0.5
1
1.5
2
2.5
3
chordlength, (cm)
pdf
No Internals
0.5-inch Internals
1-inch Internals
0.2 0.4 0.6 0.8 1 1.2 1.4 1.6 1.8 2
0.5
1
1.5
2
2.5
3
chordlength, (cm)
pdf
No Internals
0.5-inch Internals
1-inch Internals
Page 106
80
At low gas velocity, smaller bubbles with near uniform size form in the column
and in this regime there is little or no coalescence hence a narrow size range while at high
superficial gas velocity, there is enhanced bubble coalescence as well as bubble break-up
which gives rise to larger bubbles as well as smaller ones. However the population of
smaller bubbles has also been observed to increase significantly hence a wider range in
distribution of the bubble sizes as evidenced from the mean and variance shown in Table
3.1. With 0.5-inch dense internals at low gas velocity (3 cm/s) at the column center, the
chord length distribution exhibit lower mean value of 0.4730 cm as compared to 0.4946
cm of 1-inch diameter internals and 0.5182 cm for empty column. This finding suggests
that the bubble size gets smaller when high density internals are used. Moreover, the
mean chord lengths for the 1-inch internals and empty column cases are close to each
other, implying that the effect of 1-inch internals is nearly negligible. Similar trends are
also observed at the other radial locations. At high superficial gas velocity (45 cm/s),
there is higher probability of getting smaller bubbles with dense internals than without
internals. The probability increases further or at least shifts towards smaller values of
chord lengths with 0.5-inch diameter internals relative to the 1-inch diameter internals.
This difference is attributed to much higher break-up rate enhancement with 0.5-
inch internals than with 1-inch for similar reasons discussed in preceding sections.
Similar observation was made by Youssef and Al-Dahhan, 2009. In the churn turbulent
flow regime, the influence of dense internals on bubble sizes becomes less. From the
mean of the chord lengths presented, it was found that an average decrease of 6 % is
obtained with 0.5-inch internals at 45 cm/s while up to 12 % average increment is
Page 107
81
obtained at 3 cm/s. This can be attributed to higher turbulence of the system brought
about by the incoming gas where the breakage and coalescence of the bubbles is due to
the churning of the system and the internals contribution becomes negligible.
(a) (b)
(c)
Figure 3.15 Effect of size of internals and configuration on the bubble chord length
distributions at r/R(-) = 0.5, (a) at Ug = 3 cm/s based on free cross-
sectional area (b) at Ug = 45 cm/s based on free cross-sectional area
(c) large-scale view of Figure(b), (Equation 3.8)
0.2 0.4 0.6 0.8 1 1.2 1.4 1.6 1.8 2
0.5
1
1.5
2
2.5
3
chordlength, (cm)
pdf
No Internals
0.5-inch Internals
1-inch Internals
0.5 1 1.5 2 2.5 3 3.5 4 4.5 5 5.5 6
0.5
1
1.5
2
2.5
3
chordlength, (cm)
pdf
No Internals
0.5-inch Internals
1-inch Internals
0.2 0.4 0.6 0.8 1 1.2 1.4 1.6 1.8 2
0.5
1
1.5
2
2.5
3
chordlength, (cm)
pdf
No Internals
0.5-inch Internals
1-inch Internals
Page 108
82
(a) (b)
(c)
Figure 3.16 Effect of size of internals and configuration on the bubble chord length
distributions at r/R(-) = 0.9, (a) at Ug = 3 cm/s based on free cross-
sectional area (b) at Ug = 45 cm/s based on free cross-sectional area
(c) large-scale view of Figure(b) (Equation 3.8)
0.2 0.4 0.6 0.8 1 1.2 1.4 1.6 1.8 2
0.5
1
1.5
2
2.5
3
chordlength, (cm)
pdf
No Internals
0.5-inch Internals
1-inch Internals
0.5 1 1.5 2 2.5 3 3.5 4 4.5 5 5.5 6
0.5
1
1.5
2
2.5
3
chordlength, (cm)
pdf
No Internals
0.5-inch Internals
1-inch Internals
0.2 0.4 0.6 0.8 1 1.2 1.4 1.6 1.8 2
0.5
1
1.5
2
2.5
3
chordlength, (cm)
pdf
No Internals
0.5-inch Internals
1-inch Internals
Page 109
83
Table 3.1 Statistical measures for the chord length distributions in 6-inch diameter
column at different radial locations, with and used in Equation 3.8
r/R(-) = 0.0
Ug = 3 cm/s Ug = 45 cm/s
Mean ( ) Variance ( ) Mean ( ) Variance ( )
No Internals 0.5082 0.03941 0.8534 3.4010
0.5-inch Internals 0.4470 0.0369 0.8123 2.822
1-inch Internals 0.4746 0.0444 0.8466 3.3611
r/R(-) = 0.5
Ug = 3 cm/s Ug = 45 cm/s
Mean ( ) Variance ( ) Mean ( ) Variance ( )
No Internals 0.4841 0.0841 0.7939 1.2717
0.5-inch Internals 0.3749 0.1301 0.8029 2.0185
1-inch Internals 0.4507 0.0565 0.8226 2.1087
r/R(-) = 0.9
Ug = 3 cm/s Ug = 45 cm/s
Mean ( ) Variance ( ) Mean ( ) Variance ( )
No Internals 0.4250 0.0357 0.7252 1.0789
0.5-inch Internals 0.3971 0.0270 0.6099 1.3369
1-inch Internals 0.4398 0.0412 0.6421 1.1281
3.2.2.5. Axial bubble velocity. The quality of mixing in bubble and slurry bubble
columns is governed by among other factors the gas phase residence time in bubble and
slurry bubble columns. The residence-time and its distribution in the reactor must be
Page 110
84
controlled so that the desired reactions go as far as possible without the occurrence of
undesirable reaction(s) to significant levels, while at the same time ensuring large mass
and heat transfer rates, high degree of mixing, complete suspension of the catalyst
particles and high reactor productivity (Raje et al., 1997). Furthermore controlling the gas
phase reactant residence time is essential in order to avoid a broad product spectrum.
Since the velocity of the gas phase in the bubble column usually differs from the other
phases (liquid/solids), the volumetric flow rate fraction of the gas phase is not equal to its
corresponding holdup, and hence the slip velocity, , between the gas and the liquid is
introduced to account for this difference. According to Behkish, 2004, for a semi-batch
process the slip velocity is given by
The bubble velocity , at any given location depends on mainly two factors: the local
liquid velocity, and the local slip velocity, at that location, (Gupta, 1998 and
Hamed, 2012).
(3.10)
Thus, not only operating variables such as superficial gas velocities, solid catalysts
loading and physical properties of the liquid mixture but also design parameters such as
internals presence, size and configurations affect the bubble velocity since the internals
will alter the intensity of large-scale liquid recirculating velocity.
For consistency, the bubble velocity results are shown in terms of their
distribution. In this work the axial bubble velocity was estimated from both the upward
and downward bubble velocities at the same point. The downward bubble velocity was
measured by flipping the optical fiber probe to face up while the upward bubble velocity
Page 111
85
was measured by the probe facing downward. The probability density function (pdf) of
the axial bubble velocity is then obtained by dividing the number of bubbles which have
a particular velocity by the total number of bubbles that hit all the four tips of the optical
fiber probe during the sampling period. Details of how the axial bubble velocities were
obtained are given in Section 3.3.3.5. Figures 3.17 through 3.19 show the effect of
internals size and configuration on the distribution of the axial bubble velocity in 6-inch
bubble column at r/R(-) = 0.0 and at two other radial locations, with gas velocity based on
the free cross-sectional area of the column at 3 cm/s and 45 cm/s. The axial bubble
velocity distribution is analyzed further statistically by using the mean and variance of
the distribution.
At Ug = 3 cm/s the 0.5-inch internals reduces the axial bubble velocity by ~ 20 %
while the 1-inch internals gives a reduction of 10 % as reflected from the mean of the
axial bubble velocity distribution in Table 3.2. This difference is attributed to larger space
between the 1-inch internals relative to those of 0.5-inch internals. However in the churn
turbulent flow regime (Ug = 45 cm/s) a relatively smaller decrease of about 6 % was
observed with 0.5-inch internals and 1-inch internals. From the overall gas hold up and
the local gas holdup radial profiles discussed earlier, there is a near match in column
without internals and that with dense internals by applying gas velocity based on free
CSA. Al-Mesfer, 2013 experimentally demonstrated that even though such similarity in
both the overall and local gas holdup, (i.e radial profiles of local gas holdup) was
attained; it is not possible to show similarity in the liquid recirculation velocity at such
high gas velocities. This has been attributed to the non-similarity in the design and
configuration between these columns (one without internals while the other with dense
Page 112
86
internals) where smaller CSA available for flow in the column with internals than that
without. Therefore, to maintain a mass balance of the batch operated liquid phase
between the upward flow in the column central region and down flow at the column wall
region while maintaining the same inversion point, the axial liquid velocity should
increase with dense internals.
(a) (b)
(c)
Figure 3.17 Effect of size of internals and configuration on the axial bubble velocity
distributions at r/R(-) = 0.0 (a) Ug = 3 cm/s based on free cross-sectional
area (b) Ug = 45 cm/s based on free cross-sectional area (c) Large-scale
view of Figure(b)
0 20 40 60 80 100 120 1400
0.005
0.01
0.015
0.02
0.025
0.03
Axial bubble velocity, (cm/s)
pdf
No Internals
0.5-inch Internals
1-inch Internals
0 50 100 150 200 250 300 3500
0.005
0.01
0.015
0.02
0.025
0.03
Axial bubble velocity, (cm/s)
pdf
No Internals
0.5-inch Internals
1-inch Internals
0 50 100 150 200 250 300 3500
0.002
0.004
0.006
0.008
0.01
0.012
Axial bubble velocity, (cm/s)
pdf
No Internals
0.5-inch Internals
1-inch Internals
Page 113
87
(a) (b)
(c)
Figure 3.18 Effect of size of internals and configuration on the axial bubble velocity
distributions at r/R(-) = 0.5 (a) Ug = 3 cm/s based on free cross-sectional
area (b) Ug = 45 cm/s based on free cross-sectional area (c) Large-scale
view of Figure(b)
0 20 40 60 80 100 1200
0.005
0.01
0.015
0.02
0.025
0.03
0.035
0.04
0.045
Axial bubble velocity, (cm/s)
pdf
No Internals
0.5-inch Internals
1-inch Internals
0 50 100 150 200 250 300 3500
0.005
0.01
0.015
0.02
0.025
0.03
0.035
0.04
0.045
Axial bubble velocity, (cm/s)
pdf
No Internals
0.5-inch Internals
1-inch Internals
0 50 100 150 200 250 300 3500
0.002
0.004
0.006
0.008
0.01
0.012
Axial bubble velocity, (cm/s)
pdf
No Internals
0.5-inch Internals
1-inch Internals
Page 114
88
(a) (b)
(c)
Figure 3.19 Effect of size of internals and configuration on the axial bubble velocity
distributions at r/R(-) = 0.9 a) Ug = 3 cm/s based on free cross-sectional
area (b) Ug = 45 cm/s based on free cross-sectional area (c) Large-scale
view of Figure(b)
3.3. IMPACT OF SOLIDS LOADING AND DENSE INTERNALS ON BUBBLE
PROPERTIES IN 6” AND 18” BUBBLE COLUMNS
3.3.1. Scope. In bubble and slurry bubble column reactors and contactors, the size
of the solid particles ranges from 5 to 150 μm, with solids loading up to 50 % volume
0 20 40 60 80 100 1200
0.01
0.02
0.03
0.04
0.05
0.06
Axial bubble velocity, (cm/s)
pdf
No Internals
0.5-inch Internals
1-inch Internals
0 50 100 150 200 250 300 3500
0.01
0.02
0.03
0.04
0.05
0.06
Axial bubble velocity, (cm/s)
pdf
No Internals
0.5-inch Internals
1-inch Internals
0 50 100 150 200 250 300 3500
0.002
0.004
0.006
0.008
0.01
0.012
0.014
0.016
Axial bubble velocity, (cm/s)
pdf
No Internals
0.5-inch Internals
1-inch Internals
Page 115
89
(Krishna et al., 1997). The gas phase contains one or more reactants, while the liquid
phase usually contains product and/or reactants and in some cases inerts. The solid
particles are typically catalyst or the catalyst carrier. In the bubble and slurry bubble
column reactors (B/SBCRs), momentum is transferred from the faster, upward moving
Table 3.2 Statistical parameters for the axial bubble velocity distributions 6-inch
diameter column at different radial locations
r/R(-) = 0.0
Ug = 3 cm/s Ug = 45 cm/s
Mean ( ) Variance ( ) Mean ( ) Variance ( )
No Internals 50.89 348.33 135.23 3724
0.5-inch Internals 38.36 314.94 125.47 2288
1-inch Internals 45.15 382.37 125.01 3002
r/R(-) = 0.5
Ug = 3 cm/s Ug = 45 cm/s
Mean ( ) Variance ( ) Mean ( ) Variance ( )
No Internals 47.06 424.41 118.29 5291
0.5-inch Internals 40.34 105.99 110.34 1709
1-inch Internals 39.88 256.25 105.22 2471
r/R(-) = 0.9
Ug = 3 cm/s Ug = 45 cm/s
Mean ( ) Variance ( ) Mean ( ) Variance( )
No Internals 39.81 457.48 80.76 3079
0.5-inch Internals 34.91 59.38 77.95 1006
1-inch Internals 39.80 290.30 84.85 2363
Page 116
90
gas phase to the slower liquid or slurry phase. The operating superficial gas velocity is in
the range of 1-50 cm/s while the liquid superficial velocity in the range of 0 to 2 cm/s
which is an order of magnitude lower than the superficial gas velocity. Hence, the
hydrodynamics and transport in such reactors are mainly controlled by the gas flow.
One of the main disadvantages of bubble column reactors is significant back-
mixing, which can reduce product conversion and selectivity, and also induce a broad
product spectrum. The significant back-mixing requires to be reduced if not completely
eliminated. Among the means of eliminating such problem is the reactor modification in
the design of bubble column reactors; including the addition of internals and or baffles
(Deckwer, 1991), or use of sieve plates (Maretto and Krishna, 2001).
The investigation of the impact of solids loading and dense internals is extremely
useful. For one, the optimum amount of catalyst to be employed for maximum reactor
performance is of particular interest. Pohorecki et al., 2001 observed that the bubble
dynamics at conditions of industrial interest may show different behavior than at
laboratory conditions. Thus, one needs to know in detail the fluid dynamics and mixing
characteristics at the conditions similar to those of industrial interest, not only in
laboratory scale systems of 6-inch diameter but also in pilot scale unit such as of 18-inch
diameter. This can be achieved either by performing experiments at the industrial
conditions using the real system or by mimicking the industrial system at laboratory
operating conditions. With the latter option being more attractive due to limitations
encountered in laboratory studies.
Glass beads with an average size of 150 μm and particle density of 2500 kg/m3
were selected as the solids phase. The main reason was the fact that a few research have
Page 117
91
been successfully done using 150 μm glass beads as the solids phase in slurry bubble
column using an (air-water-glass beads system), (Rados, 2003, Wu, 2007), forming a
basis for comparison. Besides the glass-beads are more safe to use and environmentally
benign. The density of the glass beads is also close to the apparent density (density of
solids filled with liquid in its pores) of FT catalyst, i.e., 2200 kg/m3, which has a mean
size of 70-90 μm, with 45 % of the solids 90 μm and above. Thus these glass beads
present an opportunity to study the effect of non-porous solids close in density to that of
FT catalyst that can provide a benchmark for future studies on porous FT catalyst.
3.3.2. Experimental System. The experimental set up and system used in this
section is highlighted. The experimental set up is made up of 6-inch (0.14 m) diameter
and 18-inch (0.44 m) diameter columns mounted with threaded ports to implement probe
and sensor measurements. The heat flux and surface temperature sensor measurements
will be discussed in Section 4. For the 6-inch diameter column, measurement conditions
are the same as those described in Section 3.2.1. with 0.5-inch diameter Plexiglas rods as
internals. A schematic diagram of the experimental system is shown in Figure. 3.20. The
experiments in the 18-inch (Dc = 0.44 m) column were conducted in a pilot scale bubble
column made of Plexiglas. The pilot scale had a 0.44 m inside diameter and 3.66 m
height with dynamic bed height in all the experiments, maintained constant at a level of
about 2.67 m (z/D = 6.0) above the gas distributor by adjusting the amount of liquid, and
liquid-solids loaded in the column. In this study, compressed filtered oil-free dry air
introduced continuously from the bottom of the column was used as the gas phase. Soft
filtered tap water was used as liquid phase. Glass beads with an average size of 150 µm
and density of 2500 kg/m3 was used as the solids phase. The solids loading was based on
Page 118
92
the wet volume and the concentrations varied between 0 % vol – 40 % vol in the 6-inch
diameter column while 0 % vol – 25 % vol solids loading was used in the 18-inch
diameter column because of large amounts of solids required for same % vol. and hence
40 % vol would be too much for 18-inch column.
A steel perforated plate with 241 holes of 3 mm diameter each, distributed in a
square pitch and with a total free area of 1.09 % was used as the gas distributor. The
superficial gas velocities were from 0.03 to 0.45 m/s based on the total cross-sectional
area (CSA), (see additional results in appendix A) as well as free cross-sectional area.
The free cross-sectional area was employed in this work for two main reasons. The first
was to get the effect of dense internals only and not the effect of higher gas velocity
inside the column where same mass flow rate of the column without internals is used in
that with internals by using total cross-sectional area of the column. The second reason
was to examine whether the column without internals, results can be extrapolated to the
one with dense internals by matching the same gas velocity based on free cross-sectional
area available for flow. The internals used in this study were vertical Plexiglas rods
which occupy 25 % of the column cross-sectional area that simulates the Fischer-Tropsch
synthesis process. The internals used in the 18-inch column were 1-inch in diameter. 0.5-
inch diameter internals was chosen over the 1-inch diameter internals in the 6-inch
column since the 0.5-inch internals have comparable intertube gaps to column diameter
as the intertube gaps in the 1-inch diameter internals used in the 18-inch column as
illustrated in Table 3.3. The details of the configurations of the internals used in 6-inch
and 18-inch diameter columns are shown in Figure 3.21 while the photos of the bubble
and slurry bubble columns used in this work are shown in Figure 3.22.
Page 119
93
Combined measurements technique comprising an advanced heat transfer probe
and four-points optical probe was used to simultaneously measure the local heat flux and
the local bubble properties, including local gas hold up, bubble passage frequency, axial
bubble velocity, specific interfacial area, as well as the bubble chord lengths which is
characteristic of bubble sizes. However in this section only the bubble properties are
reported, while the heat transfer coefficient results will be discussed in Section 4. The
local measurements by the probe were taken at seven dimensionless radial positions; r/R
(-) = 0.0, ± 0.3, ± 0.6, ± 0.9. Since there was near axis-symmetry, only results on one half
(+ r/R) have been reported. Similarly local measurements by the probe were taken in 6-
inch column at five dimensionless radial positions; r/R (-) = 0.0, ± 0.5, ± 0.9, and in some
cases including r/R = ± 0.3 but only results on one half (+ r/R) have been reported. Due
to the smaller nature of the column, fewer radial positions of measurements were taken in
the 6-inch column, though it is still possible to get measurements at more radial points.
Table 3.4 shows the selected experimental conditions for both the 6-inch and 18-inch
diameter columns whose results are reported here in Section 3.3.3
Page 120
94
Figure 3.20 Schematic diagram of the pilot plant experimental setups (Not drawn to scale)
94
Page 121
95
Figure 3.21 Dense internals configuration and details of gas distributor for both 6-inch
and 18-inch diameter columns.
Table 3.3. Internals size selection in 6-inch column for comparison in 18-inch column
Column diameter (Dc) Tube diameter (tD) Inter-tube gap (tR) tR/ Dc
14 cm
1.27 cm 0.60 cm 0.0430
2.54 cm 1.22 cm 0.0873
44 cm 2.54 cm 1.60 cm 0.0360
Page 122
96
(a) (b)
Figure 3.22 Experimental setup photos (a) 18-inch diameter column no internals (b) 18-
inch with dense internals (left) and 6-inch column with dense internals
3.3.3. Results and Discussion. In this section, the effects of solids loading and
dense internals, occupying 25 % of the cross-sectional area on bubble dynamics is
highlighted for two pilot scale bubble columns 6-inch and 18-inch in diameters. The
measurement technique and algorithm is the same as detailed in Section 3.1.1.
Page 123
97
Table 3.4 Experimental conditions for impact of solids and dense internals on bubble
dynamics for 6-inch column and 18-inch column
Column
diameter (m)
Radial location
r/R (-)
Internals
(% CSA)
Solids loading
(% vol.)
Dc = 0.14
r/R (-) = 0.0, ± 0.5, ± 0.9 0.0 0.0
r/R (-) = 0.0, ± 0.5, ± 0.9 25 % 0.0
r/R (-) = 0.0, ± 0.5, ± 0.9 0.0 9.1 %
r/R (-) = 0.0, ± 0.5, ± 0.9 25 % 9.1 %
r/R (-) = 0.0, ± 0.5, ± 0.9 0.0 25 %
r/R (-) = 0.0, ± 0.5, ± 0.9 25 % 25 %
r/R (-) = 0.0, ± 0.5, ± 0.9 0.0 40 %
r/R (-) = 0.0, ± 0.5, ± 0.9 25 % 40 %
Dc = 0.44
r/R (-) = 0.0, ± 0.3, ± 0.6, ± 0.9 0.0 0.0
r/R (-) = 0.0, ± 0.3, ± 0.6, ± 0.9 25 % 0.0
r/R (-) = 0.0, ± 0.3, ± 0.6, ± 0.9 0.0 25 %
r/R (-) = 0.0, ± 0.3, ± 0.6, ± 0.9 25 % 25 %
3.3.3.1 Local gas holdup and overall gas holdup. As mentioned earlier,
gas holdup is one of the most important operating parameters because it not only governs
phase fraction and gas-phase residence time but is also crucial for mass transfer between
liquid and gas. Gas holdup depends chiefly on gas flow rate, but also to a great extent on
the gas-liquid or gas-liquid-solids system involved. Figure 3.23 shows the effect of solids
Page 124
98
(a)
(b)
Figure 3.23 Effect of solids loading, dense internals and superficial gas velocity on
overall gas holdup (a) Based on free cross-sectional area (b) Based on
total cross-sectional area
loading and presence and absence of dense internals on overall gas holdup for different
gas velocities in 6-inch diameter column, while Figure 3.24 illustrates the effect of solids
15
20
25
30
35
40
45
50
0 0.1 0.2 0.3 0.4 0.5
No Internals at Ug = 20 cm/s Internals at Ug = 20 cm/s
No Internals at Ug = 30 cm/s Internals at Ug = 30 cm/s
No Internals at Ug = 45 cm/s Internals at Ug = 45 cm/s
Solids volume fraction, (-)
Over
all
gas
ho
ldu
p, (%
)
15
20
25
30
35
40
45
50
0 0.1 0.2 0.3 0.4 0.5
No Internals at Ug = 20 cm/s Internals at Ug = 20 cm/s
No Internals at Ug = 30 cm/s Internals at Ug = 30 cm/s
No Internals at Ug = 45 cm/s Internals at Ug = 45 cm/s
Solids volume fraction, (-)
Over
all
gas
ho
ldu
p, (%
)
Page 125
99
loading and presence of dense internals on local gas holdup at different gas velocities at
the center (r/R = 0.0) of 6-inch diameter column. A comparison is also made when the Ug
is based on free cross-sectional area and when the Ug based on total cross-sectional area
of the column.
It is clearly noticed that the gas holdup is increased with increasing superficial gas
velocity for all solids concentration. With increasing Ug from 20-45 cm/s, an increase of
40 % in overall gas holdup in empty column with no solids but up to 60 % increase is
realized when 40 % vol solids are used. With dense internals, an increase in gas velocity
from 20 – 45 cm/s based on free cross-sectional area leads to an increase in overall gas
holdup by 35 % at no solids and up to 40 % when 40 % vol solids are used. This increase
is due to increment in number of bubbles with increasing gas flow rate as determined by
Youssef and Al-Dahhan, 2009 and Chen et al., 1999. They argued that with increasing
superficial gas velocity the bubbles coalescence is enhanced, leading to a growth in
number of large bubbles while at the same time the break-up rate also goes up giving rise
to many smaller bubbles.
When dense internals are used and Ug = 20 cm/s based on free cross-sectional
area, a 3 % increase in overall gas holdup is realized at 9.1 % volume solids or no solids
and up to 20 % increase is obtained for 25 % volume solids or more. While the dense
internals and at Ug = 45 cm/s based on free cross-sectional area, leads to less than 3 %
increase in overall gas holdup at all the solids loading. When Ug = 20 cm/s based on total
cross-sectional area, the dense internals increases the overall gas holdup by 15 % at no
solids or low solids loading (9.1 % vol solids) and up to 40 % at higher solids loading,
(40 % vol solids). However, 3 % and 10 % increase in overall gas holdup is attained at
Page 126
100
low (9.1 % vol solids) or no solids and at higher solids loading, (40 % vol solids)
respectively at 45 cm/s based on total cross-sectional area.
On the other hand, it was found that the local gas holdup decreases with increase
in the solids loading. This can be attributed to increased pseudo-slurry viscosity, which
promotes coalescence of large bubbles (Crabtree and Bridgewater, 1971, Li and Prakash,
1997), whereas the bubble break-up rate decreases due to dampening of instabilities at
bubble-liquid interface. In addition, the possibility of formation of smaller bubbles which
lead to the increase in the rise velocity and reduce the residence time of the bubbles as a
result the gas holdup would be reduced (Kara et al., 1982; Koide et al., 1984; Li and
Prakash, 1987, and Saxena et al., 1989). The presence of dense internals, that occupy 25
% of the column CSA, leads to general increase in the local gas hold-up regardless of the
solids loading. This trend is due to the enhancement of bubble brake up which yields
relatively smaller bubbles, with higher bubble passage frequency and lower velocity
hence higher residence time in the column and enhanced gas holdup. Similar reasoning
was also advanced by Youssef and Al-Dahhan, 2009. However the effect of internals on
gas holdup starts to diminish at gas velocities ≥30 cm/s. With solids, effect of internals is
more pronounced compared to without solids as earlier discussed.
Figure 3.25 shows the radial profiles of gas holdup in 18-inch bubble column for
the systems of air-water and air-water-glass beads without internals and with dense
internals at Ug = 30 cm/s (Figure 3.25a) and at Ug = 45 cm/s (Figure 3.25b). The gas
holdup is high in the center and low near the wall of the column as seen from in Figure
3.25, with the slope increasing continuously towards the column wall. With no solids and
Page 127
101
without internals, the slope of the gas holdup radial profile at the column wall region,
(r/R≥0.6) is up to 5.4 times that at the column center region (r/R≤ 0.3) at Ug = 45 cm/s.
(a)
(b)
Figure 3.24 Effect of solids loading, dense internals and superficial gas velocity on local
gas holdup in 6-inch diameter column at r/R(-) = 0.0. (a) Based free cross-
sectional area (b) Based on total cross-sectional area
5
15
25
35
45
55
65
0 0.1 0.2 0.3 0.4 0.5
No Internals at Ug = 20 cm/s Internals at Ug = 20 cm/s
No Internals at Ug = 30 cm/s Internals at Ug = 30 cm/s
No Internals at Ug = 45 cm/s Internals at Ug = 45 cm/s
Solids volume fraction, (-)
Loca
l gas
ho
ldu
p, (%
)
5
15
25
35
45
55
65
0 0.1 0.2 0.3 0.4 0.5
No Internals at Ug = 20 cm/s Internals at Ug = 20 cm/sNo Internals at Ug = 30 cm/s Internals at Ug = 30 cm/sNo Internals at Ug = 45 cm/s Internals at Ug = 45 cm/s
Solids volume fraction, (-)
Lo
cal
gas
hold
up, (%
)
Page 128
102
With dense internals and no solids, the slope at r/R≥0.6 is 8 times that at the
column center region at r/R≤ 0.3 at the same Ug 45 cm/s. When 25 % vol solids are used,
without internals, the slope of the gas holdup radial profile at the column wall region,
(r/R≥0.6) is about 5 times that at the column center region (r/R≤ 0.3) at Ug = 45 cm/s.
While with the dense internals the slope at r/R≥0.6 is 7.2 times that at the column center
region at r/R≤ 0.3 at the same Ug. This kind of holdup distribution in the bubble column
does not contradict the results obtained by CT scans in smaller diameter bubble columns
(Kumar, 1994, Kumar et al., 1995, 1997, Rados, 2003) and also confirmed by other
measurements obtained by Menzel et al., 1990; Franz et al., 1984; Goren et al., 1996, and
Hebrard et al., 1996. Large bubbles are formed when solids are used due to increased
pseudo-slurry viscosity than that of pure water, thus the gas holdup in the air- water-glass
beads system without and with dense internals is lower than that in the air-water system.
It is also noted that the high solids used does not have significant change on the steepness
of the radial gas holdup. Rados, 2003 using the same type of glass beads as used in the
current work observed from the CT scans that even-though there was a decrease in radial
profiles of gas holdup with increased solids loading up to 35 % by weight, the steepness
of the radial profiles only had slight decrease. Han, 2007 observed that the FT catalyst
was found to exhibit significant differences from the 150 μm glass beads in profiles of
gas holdup, solids velocity, and turbulence parameters which were reported by Rados,
2003.
Page 129
103
(a)
(b)
Figure 3.25 Effect of solids loading and dense internals on radial profiles of local
gas holdup in 18-inch diameter column with Ug based on the free
cross-sectional area at (a) Ug = 30 cm/s and (b) Ug = 45 cm/s
However the use of dense internals leads to increased steepness of the radial gas
holdup profiles regardless of the solids loading. As discussed above, gas holdup in a
5
15
25
35
45
55
65
0 0.2 0.4 0.6 0.8 1
No Internals - 0.0 % Solids Internals - 0.0 % Solids
No Internals - 25 % Solids Internals - 25 % Solids
Dimensionless radius, r/R(-)
Lo
cal
gas
ho
ldu
p, (%
)
5
15
25
35
45
55
65
0 0.2 0.4 0.6 0.8 1
No Internals - 0.0 % Solids Internals - 0.0 % Solids
No Internals - 25 % Solids Internals - 25 % Solids
Dimensionless radius, r/R(-)
Loca
l gas
hold
up, (%
)
Page 130
104
bubble column is high in the center and low at the wall and this leads to a gross liquid
circulation throughout the column with liquid flowing up in the center and down near the
wall. This kind of flow behavior was also demonstrated by Chen et al., 1999.
It has been observed that the difference in the radial local gas holdup is the
driving force behind the large-scale liquid recirculation, (Chen et al., 1999, Forret et al.,
2003). Thus the presence dense internals would lead to higher large-scale liquid
recirculation velocity while the glass bead solids may not have profound effect on the
large-scale liquid recirculation velocity, as there is little change on the driving force. As
will be discussed in Section 4, the solids loading effect on the heat transfer could be due
to a number of factors, including its role on determining the bubble sizes, frequency,
bubble velocity and holdup. Finally the local and overall gas holdup studied in empty
columns can be extrapolated to columns with dense internals in 6-inch at no and low (9.1
% vol) solids loading or at Ug ≥ 30 cm/s. However this extrapolation is not possible for
18-inch diameter column.
3.3.3.2 Specific interfacial area. As mentioned earlier the knowledge of mass
transfer rates in bubble columns is essential for determining the maximum overall rates
that can be supported in the heterogeneous flow regimes of operating bubble columns,
which is of commercial interest. The overall volumetric gas-liquid mass transfer
coefficient, kLa is the limiting thus an important design parameter for bubble columns,
particularly in processes that involve the absorption of gases in organic liquids such as
methanol synthesis and the F-T process which are at the core of this study. Thus it is
necessary that the specific interfacial area a, be determined in order to obtain the liquid
side volumetric mass transfer coefficient. Even though the gas-liquid interfacial area has
Page 131
105
been a subject of studies in the past decades giving rise to dozens of publications, the
influence of solids loading and the effect of dense vertical cooling internals on specific
interfacial area is still missing in the open literature, particularly in the flow regime of
commercial interest.
Figure 3.26 illustrate the effect of solids loading on the profiles of specific
interfacial area at different gas velocities with and without dense internals in a 6-inch
bubble column. It is obviously noticed that specific interfacial area decreases with
increasing solids loading, a trend that is similar to that of local gas holdup as expected.
For the three cases of superficial gas velocity presented, (Figure 3.26), similar trends
have been noted. When 9.1 % vol solids are used without internals, a decrease of 8 % in
interfacial area is attained while 11 % decrease is noted when dense internals area used at
Ug = 45 cm/s based on free CSA. At higher solids loading, 40 % vol. a decrease of 18 %
is obtained in empty column but up to 21 % decrease in interfacial area is attained in the
presence of dense internals. The observed decrease is due to an increase in bubble
coalescence, where larger bubbles are formed which give rise to a decreased specific
interfacial area per unit volume hence the decrease in total interfacial area (Zahradnick et
al., 1992). Thus the large coalesced bubbles have a lower interfacial area per unit
volume.
It is noteworthy that increasing the superficial gas velocity leads to dramatic
increase in the bubble coalescence rate. But the breakup rate of these larger bubbles also
significantly increase, thus, the population of smaller bubbles increase faster than those of
large bubbles, leading to increased interfacial area with superficial gas velocity.
Page 132
106
(a)
(b)
Figure 3.26 Effect of solids loading, dense internals and superficial gas velocity on
specific interfacial area in 6-inch column at r/R = 0.0. (a) Based on free
cross-sectional area (b) Based on total cross-sectional area.
For instance, increasing gas velocity from 20 cm/s to 45 cm/s in empty column leads to
an increase in specific interfacial area by 40 % at no solids to 30 % with high solids
0.5
1
1.5
2
2.5
3
3.5
4
4.5
0 0.1 0.2 0.3 0.4 0.5
No Internals at Ug = 20 cm/s Internals at Ug = 20 cm/s
No Internals at Ug = 30 cm/s Internals at Ug = 30 cm/s
No Internals at Ug = 45 cm/s Internals at Ug = 45 cm/s
Solids volume fraction, (-)
Sp
ecif
ic i
nte
rfac
ial ar
ea, (c
m2/c
m3)
0.5
1
1.5
2
2.5
3
3.5
4
4.5
0 0.1 0.2 0.3 0.4 0.5
No Internals at Ug = 20 cm/s Internals at Ug = 20 cm/s
No Internals at Ug = 30 cm/s Internals at Ug = 30 cm/s
No Internals at Ug = 45 cm/s Internals at Ug = 45 cm/s
Solids volume fraction, (-)
Spec
ific
inte
rfac
ial
area
, (c
m2/c
m3)
Page 133
107
loading (40 % vol solids). In the presence of dense internals, same increase in Ug leads to
an increase in the interfacial area by 35 % at no solids and 22 % at high solids loading.
Therefore the effect of superficial gas velocity is more pronounced in the empty column
regardless of the solids use. The presence of dense internals was found to increase the
specific interfacial area for all the gas velocities regardless of solids loading. An average
increase of 23 % is attained with internals at Ug = 20 cm/s and average increase of 16 %
is attained at Ug = 45 cm/s based on free CSA. This could be attributed to the reduction
in bubble sizes, and restricted formation of larger bubbles. Hence, many smaller bubbles
appear in the column which have higher interfacial area in a unit volume hence a higher
specific interfacial area per unit volume.
The effect of dense internals and high solids loading, (25 vol %) on the radial
profiles of the specific interfacial area in the 18-inch column is shown in Figure 3.27. It is
noted that at high solids loading the interfacial area remains higher in the center of the
column and lower at the wall region. With dense internals up to 30 % and 20 % decrease
in interfacial area is achieved in the column center and column wall region, respectively.
While between 35 % and 17 % decrease is obtained in empty column at the same radial
locations. On the other hand, little or no effect of internals in the wall region without
solids but up to 16 % increase in interfacial area is achieved at the column center with no
solids. With 25 % vol solids loading, again the effect of internals is up to 15 % higher in
the wall region and 10 % in the column center.
Page 134
108
Figure.3.27 Effect of solids loading and dense internals on radial profiles of
specific interfacial area in 18-inch column at Ug = 30 cm/s based
on the free cross-sectional area
3.3.3.3 Bubble passage frequency. Bubble passage frequency is a count of the
number of bubbles that pass through a given space in the duration of sampling. It is
obtained by dividing the number of bubbles that hit the fiber probe’s central tip by
sampling time. Figure 3.28 shows the influence of solids loading and dense internals on
the bubble passage frequency in the 6-inch pilot scale bubble column. While bubble
coalescence and breakup play a significant role in determining gas holdup, bubble size
and the size distribution, gas-liquid interfacial area, bubble velocity and the distribution
which govern the performance of gas-liquid contractors. Thus the bubble breakup and
coalescence is responsible for the bubble passage frequency across the column cross-
section and thus have effect not only on the mass transfer but on the heat transfer as well.
0.5
1
1.5
2
2.5
3
3.5
4
4.5
0 0.2 0.4 0.6 0.8 1
No Internals - 0.0 % Solids Internals - 0.0 % Solids
No Internals - 25 % Solids Internals - 25 % Solids
Dimensionless radius, r/R(-)
Sp
ecif
ic in
terf
acia
l ar
ea, (c
m2/c
m3)
Page 135
109
Thus the use of solids and internals as has been demonstrated in the previous sections
will have profound effect on the bubble passage frequency.
(a)
(b)
Figure 3.28 Effect of solids loading, dense internals and superficial gas velocity on
bubble passage frequency at column center, r/R = 0.0 with superficial gas
velocity (a) Based on free cross-sectional area and (b) Based on total
cross-sectional area
0
20
40
60
80
100
120
140
0 0.1 0.2 0.3 0.4 0.5
No Internals at Ug = 20 cm/s Internals at Ug = 20 cm/s
No Internals at Ug = 30 cm/s Internals at Ug = 30 cm/s
No Internals at Ug = 45 cm/s Internals at Ug = 45 cm/s
Solids volume fraction, (-)
Bubble
pas
sage
freq
uen
cy, (s
-1)
0
20
40
60
80
100
120
140
0 0.1 0.2 0.3 0.4 0.5
No Internals at Ug = 20 cm/s Internals at Ug = 20 cm/s
No Internals at Ug = 30 cm/s Internals at Ug = 30 cm/s
No Internals at Ug = 45 cm/s Internals at Ug = 45 cm/s
Bu
bb
le p
assa
ge
freq
uen
cy, (s
-1)
Solids volume fraction, (-)
Page 136
110
When 9.1 % vol solids are used without internals, a decrease of 10 % in bubble
passage frequency is attained while 21 % decrease is noted when dense internals are used
at Ug = 45 cm/s based on free CSA. At higher solids loading, (40 % vol.) a decrease of
18 % is obtained in empty column but up to 21 % decrease in interfacial area is attained
in the presence of dense internals. The observed decrease can be attributed to fewer
bubbles resulting from the enhanced coalescence of the bubbles. The high solids loading
enhances the bubble coalescence and reduces the bubble breakup rate which leads to a
lower number of bubbles in a space, hence the observed decrease bubble passage
frequency with solids loading. This is consistent with the interfacial area and the gas
holdups presented and explained before.
With increased superficial gas velocity, the bubble population is dramatically
increased. This leads to higher bubble passage frequency. Increasing superficial gas
velocity from 20 cm/s to 45 cm/s in empty column leads to an increase in bubble passage
frequency by 75 % at no solids and 55 % with high solids loading (40 % vol solids). In
the presence of dense internals, similar increase in Ug leads to an increase in bubble
passage frequency by 70 % at no solids and 43 % at high solids loading. Again it is noted
that the effect superficial gas velocity is more pronounced in the empty column
regardless of the solids use. When the column is inserted with dense internals the bubble
passage frequency is enhanced for all the gas velocities regardless of solids loading. With
an average increase of 24 % is at Ug = 20 cm/s and an average increase of 17 % is
attained at Ug = 45 cm/s based on free CSA. When the column is inserted with the dense
internals, the maximum bubble sizes which can be formed is restricted by the tubes, thus
more smaller bubbles appear in a unit space, regardless of the solids loading.
Page 137
111
The radial profiles of bubble passage frequency in 18-inch column and the effect
solids loading and dense internals is shown in Figure 3.29. The local gas holdup, specific
interfacial area and bubble passage frequency have similar distribution with and without
internals, irrespective of solids use. While the large bubbles move towards the column
center, they entrain with them smaller bubbles that also move at averagely the same
bubble velocity as large ones. However, mainly small bubbles tend to enter the wall zone
and move with the downward liquid flow.
Figure 3.29 Effect of solids loading and dense internals on radial profiles of
bubble passage frequency in 18-inch column at Ug = 30 cm/s
based on the free cross-sectional area
3.3.3.4 Bubble chord length. Bubble sizes is apparently one of the most
important parameters in the gas-liquid reactors and contactors since it controls almost all
the other bubble parameters; local and over gas holdup, bubble velocity, the gas phase
0
20
40
60
80
100
120
140
160
0 0.2 0.4 0.6 0.8 1
No Internals - 0.0 % Solids No Internals - 25 % Solids
Internals - 0.0 % Solids Internals - 25 % Solids
Bubble
pas
sage
freq
uen
cy, (s
-1)
Dimensionless radius, r/R(-)
Page 138
112
residence time in terms of the bubble velocity, among others. To characterize the bubble
size distribution, the Sauter mean diameter is widely used as the most representative
average diameter. This however is far from the real phenomenon as the bubbles only
have definite and semi-definite shape in the homogenous flow regime. This operating
regime is of little benefit to industrial processes such as the methanol synthesis and F-T
processes. Thus a representation of a characteristic bubble size is adopted of bubble
chord-lengths. To represent the raw measured chord length data, equation 3.8 is used as
was described in section 3.2.2.4. The effect of solids loading on the distribution of the
measured bubble chord lengths by the 4-point optical probe in the absence of internals is
shown in Figure 3.30 while the effect of solids loading in the presence of dense internals
is shown in Figure 3.31. In this work, the bubbles produced at the studied gas velocities
were such that a large number of disintegrated bubbles with smaller chord lengths and a
small number of coalesced large bubbles, that leads to a very asymmetric bubble size
distribution. Many authors (e.g., Luewisutthichat et al., 1997 and Pohorecki et al., 2001)
have reported the bubble chord length distributions to be best represented by a log-
normal distribution, with its upper value at the maximum bubble size. Such a distribution
were also reported by Akita and Yoshida, 1974; and,Youssef and Al-Dahhan, 2009;
among others.
The bubble chord length distributions have been analyzed statistically by
providing the mean and the variance, as shown in Table 3.5. It can be seen that there is a
higher probability of lower chord lengths at lower gas velocity. The addition of solids
increases not only the mean but also the spread of the bubble chord length distribution.
Without internals the mean of the distribution at Ug = 3 cm/s is 0.4729 with no solids and
Page 139
113
it is increased to 0.5800 when 25 % vol solids are used. This implies that the formation of
smaller bubbles dominates giving rise to a higher probability of small chord lengths.
When 25 % vol solids are used, larger bubbles are formed which coexist with smaller
ones leading to a wider spread in the size distribution. Increase in solids loading increases
(a) (b)
(c)
Figure 3.30 Effect of solids loading in the absence of internals on bubble chord length
distribution at dimensionless radius r/R(-) = 0.0 in 6-inch column (a) At Ug
= 3 cm/s (b) At Ug = 20 cm/s (c) Enlarged scale of (b), (Equation 3.8)
0 1 2 3 4 5 6 70
0.5
1
1.5
2
2.5
3
chordlength,(cm)
pdf
No solids at 3 cm/s
25 vol % at 3 cm/s
0 1 2 3 4 5 6 70
0.5
1
1.5
2
2.5
3
chordlength,(cm)
pdf
No solids at 20 cm/s
25 vol % at 20 cm/s
0 2 4 6 8 10 12 140
0.2
0.4
0.6
0.8
1
1.2
1.4
chordlength,(cm)
pdf
No solids at 20 cm/s
25 vol % at 20 cm/s
Page 140
114
(a) (b)
Figure 3.31 Effect of solids loading in the presence of dense internals on bubble chord
length distribution at dimensionless radius r/R(-) = 0.0. in 6-inch column
with superficial gas velocity based on free cross-sectional area (a) at Ug
= 3 cm/s (b) at Ug = 20 cm/s, (Equation 3.8)
Table 3.5 Statistical measures of the bubble chord length distribution in 6-in column at
r/R = 0.0 at different conditions with and used in Equation 3.8
Ug (cm/s) Solids loading Internals Mean ( ) Variance ( )
3 cm/s
0.0 % vol 0.0 % CSA 0.4729 0.0319
25 % vol 0.0 % CSA 0.5451 0.6340
0.0 % vol 25 % CSA 0.4437 0.0303
25 % vol 25 % CSA 0.4763 0.3465
20 cm/s
0.0 % vol 0.0 % CSA 0.9171 1.1611
25 % vol 0.0 % CSA 0.9941 1.3875
0.0 % vol 25 % CSA 0.8434 0.7856
25 % vol 25 % CSA 0.8748 0.1642
0 1 2 3 4 5 6 70
0.5
1
1.5
2
2.5
3
chordlength,(cm)
pdf
Internals No solids at 3 cm/s
Internals 25 vol % at 3 cm/s
0 1 2 3 4 5 6 70
0.5
1
1.5
2
2.5
3
chordlength,(cm)
pdf
Internals No solids at 20 cm/s
Internals 25 vol % at 20 cm/s
Page 141
115
pseudo-slurry viscosity, which promotes coalescence of large bubbles (Crabtree and
Bridgewater, 1971), whereas the bubble break-up rate decreases due to dampening of
instabilities at bubble-liquid interface. As can be seen in Figure 3.30, the addition of
solids has greater effect on the chord lengths at lower gas velocity.
The average bubble chord length radial profiles are show in Figure 3.32 for an air-
water and air-water glass beads system in 18-inch diameter column. As was illustrated in
the interfacial area, the effect of dense internals and high solids loading on the average
chord length are nearly the same as those of interfacial area. In the absence of internals,
Figure.3.32 Effect of solids loading and dense internals on radial profiles of mean
bubble chord length in 18-inch column at Ug = 30 cm/s based on the
free cross-sectional area
larger bubble chord lengths at the column center and lower at the column wall region are
obtained. With no solids, the bubble chord lengths are up 67 % higher at the column
0.45
0.55
0.65
0.75
0.85
0.95
1.05
0 0.2 0.4 0.6 0.8 1
No Internals - 0.0 % Solids No Internals - 25 % Solids
Internals - 0.0 % Solids Internals - 25 % Solids
Mea
n b
ubble
chord
len
gth
, (c
m)
Dimensionless radius, r/R(-)
Page 142
116
center than wall region and 63 % higher at the column center than the wall region when
25 % vol solids are used. In the presence of dense internals the chord length at the
column center is 42 % higher than at the wall region without solids and up to 38 % higher
with 25 % vol solids. This variation in bubble chord lengths reinforces the earlier
observations noted with the interfacial area, bubble frequency and gas holdup profiles.
3.3.3.5 Axial bubble velocity. The bubble velocity in bubble columns has been
erroneously taken to mean the bubble rise velocity, but bubbles in bubble columns move
downward as well. Besides, radial motion is also exhibited by the bubbles. In light of the
bubble wake heat transfer enhancement, the turbulence generated plays the crucial role.
The heat-transfer enhancement due to the passage of gas bubbles is caused by the bubble
wake which is primarily responsible for the rapid heat transfer surface renewal of fluid on
the heat-transfer surface irrespective of the bubble direction. Hence, in this work the
magnitude of the axial bubble velocity for both upward bubble velocity and downward
bubble velocity are considered. To measure the downward bubble velocity, the optical
probe was flipped to face upward at the same point of measurement of the upward
bubbles. The probability density function (pdf) of the axial bubble velocity is then
obtained by dividing the number of bubbles which have a particular velocity upward or
downward by the total number of bubbles that hit all the four tips of the optical fiber
probe during the sampling period. The axial bubble velocity is obtained as follows;
And
∑
∑
Page 143
117
Where is the axial bubble velocity, is the average value of the
downward bubble velocity, obtained with probe pointing upward, is the average value
of the bubble rise velocity, obtained with probe pointing downward, is the
instantaneous downward bubble velocity, is the instantaneous upward bubble
velocity, is the downward bubble passage frequency,
is the upward bubble passage
frequency with the bubble number of bubbles moving downward and the bubble
number of bubbles moving upward, is the sampling time with probe facing upward
while is the sampling time with the probe pointing downward.
Figure 3.33 shows the effect of dense internals, high solids loading and the
superficial gas velocity on the profiles of axial bubble velocity in the laboratory scale 6-
inch diameter column based on both the free cross-sectional area (Figure 3.33a) and
based on total cross-sectional area (Figure 3.33.b). The increase in solids loading
increases the bubble velocity in both bubbly (Ug = 3 cm/s) and churn turbulent (Ug = 20
cm/s, 45 cm/s) flow regimes. Similar trend was observed by Li and Prakash, 1997. This
increment is attributed to change in the slurry properties, where increased pseudo-slurry
viscosity promotes the bubble coalescence (Crabtree and Bridgewater, 1971) and hence
increase in the bubble sizes as discussed under other bubble properties in the preceding
section.
With the Ug based on free cross-sectional area, dense internals lower the axial
bubble velocity by 25 % on the average at Ug = 3 cm/s and 3.4 % at 20 cm/s but leads to
an average increase of 6 % at 45 cm/s. Based on total cross-sectional area the dense
Page 144
118
internals reduces the velocity by 16 % at 3 cm/s while an increase of 5 % and 8.1 %
average in axial bubble velocity is attained at 20 cm/s and 45 cm/s respectively. The
(a)
(b) Figure 3.33 Effect of solids loading, internals and superficial gas velocity on axial
bubble velocity (a) Based on free cross-sectional area (b) Based on total
cross-sectional area
0
20
40
60
80
100
120
140
160
0 0.1 0.2 0.3 0.4 0.5
No Internals at Ug = 3 cm/s Internals at Ug = 3 cm/s
No Internals at Ug = 20 cm/s Internals at Ug = 20 cm/s
No Internals at Ug = 45 cm/s Internals at Ug = 45 cm/s
Solids volume fraction, (-)
Axia
l B
ub
ble
vel
oci
ty, (c
m/s
)
0
20
40
60
80
100
120
140
160
180
0 0.1 0.2 0.3 0.4 0.5
No Internals at Ug = 3 cm/s Internals at Ug = 3 cm/s
No Internals at Ug = 20 cm/s Internals at Ug = 20 cm/s
No Internals at Ug = 45 cm/s Internals at Ug = 45 cm/s
Solids volume fraction, (-)
Ax
ial
bu
bble
vel
oci
ty, (c
m/s
)
Page 145
119
difference with internals is higher when Ug is based on total CSA due to same gas mass
flow rate used in the column with internals as that in column without internals in which
the gas/bubbles flow through a smaller CSA in column with internals. However the
difference becomes less when the Ug is based on free CSA. It is apparent from these
observations that it is not possible to extrapolate the bubble velocity obtained from empty
columns to those with dense internals when solids are utilized.
The effect of dense internals and high solids loading on the radial profiles of axial
bubble velocity with the superficial gas velocity based on the free cross-sectional area, in
the pilot-scale 18-inch diameter column is presented by first analyzing the effect of the
various components of the axial bubble velocity. Figure 3.34 shows the said effects on
the radial profiles of the upward bubble velocity, commonly referred to as bubble rise
velocity (Figure 3.34a) and the downward bubble velocity, (Figure 3.34b). Both the
bubble rise and downward bubble velocities exhibit parabolic radial profiles with the
bubble rise velocity highest at the column center and decreases towards the column wall.
On the contrary the downward bubble velocities are lowest at the column center and
highest at the column wall. The bubble rise velocity is increased by an average of 9 %
when 25 % vol solids are used in the absence of dense internals. However, when the
column is inserted with dense internals, 25 % vol of solids lead to an average of 6 %
increase in bubble rise velocity. The effect of solids loading on the downward bubble
velocity averages 11 % with or without internals.
The effect of dense internals and high solids loading on the radial profiles of
axial bubble velocity with the superficial gas velocity based on the free cross-sectional
area, in the pilot-scale 18-inch diameter column is shown in Figure 3.35. It is observed
Page 146
120
that the bubble rise velocity, (Figure 3.34a) is 5 % higher than the axial bubble velocity
on the average within r/R≤ 0.6 but up 50 % lower than the axial bubble velocity at the
(a)
(b)
Figure 3.34 Effect of solids loading and dense internals on the radial profiles of
(a) bubble rise velocity (b) downward bubble velocity at Ug = 45
cm/s based on free cross-sectional area in 18-inch diameter
column
20
40
60
80
100
120
140
160
180
200
220
0 0.2 0.4 0.6 0.8 1
No Internals - 0.0 % Solids Internals - 0.0 % Solids
No Internals - 25 % Solids Internals - 25 % Solids
Dimensionless radius, r/R(-)
Bubble
ris
e vel
oci
ty, (c
m/s
)
20
40
60
80
100
120
140
160
180
200
220
0 0.2 0.4 0.6 0.8 1
No Internals - 0.0 % Solids Internals - 0.0 % Solids
No Internals - 25 % Solids Internals - 25 % Solids
Dimensionless radius, r/R(-)
Do
wn
war
d b
ubble
vel
oci
ty, (c
m/s
)
Page 147
121
column wall. This trend can be attributed to higher passage frequency of bubbles moving
at higher velocities upwards in the core region and downward closer to the wall region. In
the empty column, 25 % vol solids lead to increased axial bubble velocity, with an
increase of 7 % at the center and 10 % at the column wall. A similar trend is observed
with dense internals where the increase of 6 % at the column center and up to 13 %
increase closer to column wall.
Figure 3.35 Effect of solids loading and dense internals on radial profiles of axial
bubble velocity in 18-inch diameter column at Ug = 45 cm/s based
on the free cross-sectional area
3.4. REMARKS
The impact of dense internals occupying 25 % of column cross-sectional area was
assessed in an air-water and air-water-glass beads (150 µm) system by using the four-point
optical probe in slurry bubble columns. Local gas holdup, bubble chord length, bubble
20
40
60
80
100
120
140
160
180
200
220
0 0.1 0.2 0.3 0.4 0.5 0.6 0.7 0.8 0.9 1
No Internals - 0.0 % Solids Internals - 0.0 % Solids
No Internals - 25 % Solids Internals - 25 % Solids
Dimensionless radius, r/R(-)
Axia
l bubble
vel
oci
ty, (c
m/s
)
Page 148
122
passage frequency, specific interfacial area, and axial bubble velocity were investigated
under different operating conditions under ambient pressure. With the increase in
superficial gas velocity, the local gas holdup, bubble chord length, bubble passage
frequency, specific interfacial area, and axial bubble velocity increased. Local gas
holdup, specific interfacial area, and apparent bubble frequency decreased with the
increase in solids loading, but increased with dense internals, though insignificantly for
gas holdup in the 6-inch column.
The impact of diameter of internals and different configurations of internals
covering the same cross-sectional area (25 % CSA) was investigated and quantified over
a wide range of superficial gas velocities and solids loading in 6-inch laboratory bubble
column. The use of both free area cross-sectional area available for the flow and total
cross-sectional area was used, to discriminate between the effect of higher gas velocity
inside the column and the actual effect of the dense internals. High density of internals
shows negligible effect on both overall and local gas holdup, an enhancement of bubble
passage frequency, increased interfacial area and a decrease in bubble velocity and
bubble chord length which was smaller with internals as result of an enhancement in
bubble break-up rate. A closer comparison revealed that the use of total cross-sectional
area for determining the gas flow rate gives a misleading effect. It shows that there is
effect on virtually all the bubble dynamic parameters. It is also important to mention that
the local and overall gas holdup studied in empty columns can be extrapolated to columns
with dense internals in 6-inch at no and low (9.1 % vol) solids loading or at Ug ≥ 30
cm/s.
Page 149
123
Consistently higher specific interfacial area, bubble frequency was noted with 0.5-
inch diameter internals, at the column center but lower elsewhere than with 1-inch
diameter column. However the insignificant difference in the local gas hold ups, indicate
that it is possible to extrapolate the local gas hold up results obtained from empty bubble
columns of similar size to extract the influence of dense internals on the same but the
effect of dense internals on the other bubble properties would still need to be done in
columns equipped with dense internals.
With the increase in solids loading, both the average bubble chord length and
bubble velocity bubble velocity increased though slightly. Based on bubble chord length
distribution in the column center, higher probability of larger bubbles was observed with
high solids loading with and without the dense internals with the effect being
significantly higher at lower gas velocity. It was also established that the bubble chord
length had a wider spread with increasing solids loading at lower gas velocity and a
reverse trend at higher gas velocity. In fact, a closer look at the mean of the bubble chord
length distributions (Table 3.1, 3.2 and 3.2) revealed that the effect of internals and solids
loading is much higher in the low gas velocity and negligible at very high gas velocity.
The effect of dense internals and high solids loading on the bubble dynamics in
the 18-inch diameter pilot-scale bubble column was assessed using the four-point optical
probe technique. In the 18-inch column when 25 % of the total CSA of the column is
obstructed by internals in the churn turbulent flow regime (Ug ≥ 30 based on free CSA),
an increase in the gas holdup radial profiles was observed, together with increased
steepness of the gas holdup radial profiles compared to the column without internals. This
would lead to higher large-scale liquid recirculation hence a likely increase in the
Page 150
124
transport parameters like both of heat and mass. The use of high solids loading leads to
lower gas holdup due to the enhanced bubble coalescence resulting in formation of larger
bubbles with lower specific interfacial area per unit volume, lower bubble passage
frequency as fewer bubbles appear in the column a unit time and slightly higher bubble
velocity. However one key observation also was that the high solids loading does not lead
to significant change in the steepness of the radial profiles of the local gas holdup, thus
little or no change in liquid/slurry recirculation might be induced by using high solids
loading with or without internals. The bubble chord length was smaller with internals as
result of an enhancement in bubble break-up rate. Finally a conclusion that can be drawn
from this study is that it is not possible to extrapolate any of the studied bubble
parameters form an empty 18-inch column to those with dense internals by matching gas
velocities regardless of solids use.
Page 151
125
4. IMPACT OF SOLIDS LOADING AND DENSE INTERNALS ON THE
HEAT TRANSFER COEFFICIENT IN BUBBLE AND SLURRY BUBBLE
COLUMNS
4.1. SCOPE
As detailed in Section 2, efforts have been made to study the heat transfer
coefficient in bubble and slurry bubble columns, but most of these studies were
conducted in two-phase systems. Also, most of the studies in the literature on the effects
of operating and design variables on the bubble dynamics and transport parameters
including the heat transfer rates and coefficients have been performed in empty bubble
and slurry bubble columns. Therefore, the effects of heat exchanging internals on the
bubble dynamics and transport parameters have not been well understood. The most
recent investigation of heat transfer coefficients in a bubble column with mimicked dense
heat exchanging internals occupying 22 % of CSA at conditions of high superficial gas
velocity was performed in a 0.19 m diameter column by Abdulmohsin and Al-Dahhan,
2012. But still the investigation was limited only to a two-phase system. Thus heat
transfer studies are yet to be reported for three-phase (gas- liquid-solid) system bubble
columns with dense internals.
The properties of liquid phase changes significantly when the solids/fines are
added particularly the liquid density, liquid viscosity, liquid thermal conductivity and
heat capacity. Addition of solid particles would increase or decrease the average
properties of suspension depending on solids properties (Deckwer et al., 1980). The role
of liquid viscosity on the heat transfer rate in multiphase systems is also well highlighted
in the literature (Kim and Kang, 1997). The use of solid catalysts to improve the yield in
Page 152
126
the FT process is inevitable. Therefore, in this chapter, the effects of operating parameters
on the heat transfer coefficient in an air-water-glass beads system bubble columns with
internals covering 25 % of the column CSA to mimic FT synthesis is examined.
4.2. EXPERIMENTAL SYSTEM
The combined measurement used in this work consists of two independently
fabricated probes: (1) Four points fiber optical probe, whose description and features are
described in Chapter 3 and further information and detailed algorithm and capabilities are
available elsewhere in Xue, 2004. The other is an advanced fast response (L-shaped) rod
type heat transfer probe, a modified version of the originally proposed heat transfer probe
by Li and Prakash, 1997.
The instantaneous heat flux was measured using a micro-foil heat flux sensor (11
mm × 11 mm × 0.08 mm) from RdF Corporation (No. 20453-1). The micro-foil heat flux
sensor was flush-mounted on the outer surface of a hollow brass cylinder. The micro-foil
sensor has both the heat flux sensor and thermocouple. Thus the micro-foil sensor can
measure both the local instantaneous heat flux from the probe to the bulk fluid and the
instantaneous surface temperature of the probe simultaneously. A small cylindrical
cartridge heater (Chromalox, model number CIR-1012) was installed inside the hollow
brass cylinder. The AC power was supplied to the cartridge heater through a variac to
regulate the supplied power in the range of 0 to 50 V. To complete the heat transfer probe
assembly, the tube and fittings are separated by Teflon, which reduces the heat loss
transferred from the heater to the connections. Two additional T-type thermocouples are
installed in the column to measure the bulk fluid temperature. The measured signals of
Page 153
127
the heat flux, in the range of microvolts, need to be amplified before being sent to the
data acquisition (DAQ) system. After amplification, the heat flux signals, together with
the signals from the thermocouples, were sampled at 50 Hz for between 60-90 seconds.
Since this work studied the local time-averaged heat transfer coefficient in the fully
developed region, the thermocouple probes were installed close to the heat transfer probe,
about 0.1 m in axial distance, (above and below it). Figure 4.1 shows the schematic of the
heat transfer probe and photo image of the L-shaped rod heat transfer probe.
The axial positions of the two thermocouples in the thermocouple probe were 6-
inches above and below the L-shaped heat flux probe. The averaged values of the
temperatures obtained by these thermocouples were representative of and used as the
bulk temperature. In addition to the L-shaped rod type probe, an advanced heat transfer
probe which mimics heat exchanging internals heat transfer surface has been employed in
this work as will be discussed in Section 4.3.
The combined probes (consisting of the heat transfer probe and four-point optical
probe) was mounted in the fully developed flow region of the columns for all the
measurements, with the optical probe mounted just off the surface of the heat flux sensor.
Only one axial location, in the fully developed flow region was used for all the
measurements since there is negligible variation on the bubble properties within this flow
region, (Xue, 2004). The combined probes were both fabricated in Professor Al-Dahhan’s
Lab in Missouri University of Science and Technology. This combination enables the
capture of the bubble dynamics simultaneously with the heat flux in the same vicinity.
The local measurements by the probe were taken at seven dimensionless radial positions
r/R (-) = ± 0.0, ± 0.3, ± 0.6, ± 0.9 and in some cases nine, including ± 0.5. Since there
Page 154
128
was axis-symmetry, only results on one half (+r/R) have been reported. Three to five test
runs were performed at each condition and average values reported.
(a)
(b)
Figure 4.1 Heat transfer probe assembly: (a) Schematic of the heat flux sensor and heater,
(b) Photo of the L-shaped rod heat transfer probe
According to Li and Prakash, 2001, to estimate the instantaneous heat flux and
instantaneous heat transfer coefficient measured by the sensor, equation 4.1 derived for
Page 155
129
liquid film heat transfer coefficient has been employed. From this equation, the
instantaneous heat transfer coefficient could be determined by measurement of heat flux
per unit area and the difference between surface temperature and the average
temperatures of the bulk fluid medium at a given time.
Where is the instantaneous local heat transfer coefficient,
is the instantaneous heat
flux per unit area across the sensor, is the instantaneous bulk temperature of the fluid
media, is the instantaneous temperature of the probe surface. Likewise, the time-
averaged heat transfer coefficient at a given location was estimated by averaging the
instantaneous heat transfer data collected after every 90s by equation 4.2.
∑
( )
Where, is the time-averaged heat transfer coefficient, and N is the total number of
the collected data. The value of N was selected to be 2 050 to ensure a stable value of
heat transfer coefficients.
4.3. RESULTS AND DISCUSSION
The effect of solids loading on the heat transfer coefficient is examined in 6-inch
laboratory scale and 18-inch pilot scale bubble columns without internals and with dense
internals in relation to the bubble properties discussed in Section 3. It should be noted
that the heat transfer coefficient results presented and discussed in this chapter was
obtained at the same time as the bubble properties discussed in Section 3. For purposes of
Page 156
130
clarity, selected relevant bubble dynamics results illustrated in chapter will be used
alongside the heat transfer results in this chapter.
4.3.1. Instantaneous Heat Transfer Coefficient. First, a time series of the
signals obtained from the instantaneous heat transfer coefficient is presented. Figure 4.2
shows the time series of the instantaneous heat transfer coefficient and fluctuations
measured at the column center, r/R(-) = 0.0 in 6-inch diameter column without internals
for an air-water system in the bubbly flow regime (Ug = 3 cm/s, Figure 4.2(a)) and in the
churn turbulent flow regime, (Ug = 20 cm/s, Figure 4.2(b)) and the signal fluctuations in
terms of (Figure 4.2c). where is the instantaneous heat transfer coefficient
and is the time averaged heat transfer coefficient. It is observed that the
instantaneous heat transfer coefficients obtained in bubbly region (3 cm/s) are
significantly lower and relatively uniform (less fluctuation) around the mean than in the
churn turbulent flow regime (20 cm/s). This is confirmed by higher fluctuation of the
signal in the churn turbulent flow regime than in the bubbly flow regime as shown in
Figure 4.2c and further evidenced by the mean and variances of the time averaged-
instantaneous heat transfer coefficient shown in Figure 4.2a and 4.2b. This increase in
instantaneous heat transfer coefficient with superficial gas velocity can be attributed to
increase in bubble passage frequency, increase in number of larger bubbles which
generate stronger liquid recirculation velocity thus increased bubble-wake-induced
turbulence as also pointed out by Li and Prakash, 1999. The lower fluctuation at lower
gas velocity is due the absence of fast moving bubbles and smaller bubbles which have
near uniform sizes and moving at an almost uniform velocity. On the other hand in the
churn turbulent flow regime, both smaller bubbles with lower velocity and larger bubbles
Page 157
131
that move with higher velocity co-exist thus creating turbulence of varied magnitudes and
different rates of heat transfer surface renewal. It should be pointed out that whereas it is
a common knowledge that smaller bubbles move at low velocities, some that are trapped
in the wake of larger bubbles move at the same velocity as the larger ones.
(a) (b)
(c)
Figure 4.2 Instantaneous heat transfer coefficient signal (a) at 3 cm/s (b) at 20 cm/s
(c) fluctuation comparison in terms of at r/R=0.0 in 6-inch
diameter column
4.2
4.6
5
5.4
5.8
6.2
6.6
0 40 80 120 160 200 240
Ug = 3 cm/s
hi(kW
/m2.K
)
Time, (s)
Mean = 4.701
Variance = 0.0196
4.2
4.6
5
5.4
5.8
6.2
6.6
0 40 80 120 160 200 240
Ug = 20 cm/s
hi (
kW
/m2.K
)
Time, (s)
Mean = 6.021
Variance = 0.0288
-0.6
-0.4
-0.2
0.0
0.2
0.4
0.6
0.8
0 40 80 120 160 200 240
Ug = 3 cm/s
Ug = 20 cm/s
Hea
t tr
ansf
er c
oef
fici
ent
flu
ctu
atio
n
Time, (s)
Page 158
132
4.3.2. Effect of Solids Loading and Superficial Gas Velocity on Heat Transfer
Coefficient. In order to achieve economically high space-time yields, high slurry
concentrations (typically 30-40 vol. %) need to be employed in the bubble column (Fox,
1990). The addition of solid particles which mimic the catalyst carrier in a commercial
process such as F-T synthesis into a liquid changes the average thermo physical
properties of the suspension and alters its apparent viscosity as well, Deckwer, 1980b.
From the studies on bubble populations in bubble columns conducted by Li and Prakash,
2000 it was reported that adding solids up to 20 % by vol of the gas-free slurry, led to
increased bubble rise velocity by about 20 %. These observations point to the fact that
solids presence in gas-liquid system alters the behavior of the flow in the system. In this
section the effect of solids loading up to 40 % vol on the heat transfer coefficient in 6-
inch laboratory-scale bubble column and in 18-inch pilot plant-scale bubble column are
investigated in connection with the discussed bubble properties in Section 3. Figures
from Section 3 are re-plotted here for clarity and demonstrating the inter-relationships.
Figure 4.3 shows the effect of solids loading and superficial gas velocity on the
heat transfer coefficient measured at the column center (r/R = 0.0) in 6-inch diameter
empty column (Figure 4.3a) and in 18-inch diameter empty column (Figure 4.3b). It is
observed that the heat transfer coefficient increases with increase in superficial gas
velocity regardless of the solids loading, then reaches a plateau. It is noted that the heat
transfer coefficient increases with superficial gas velocity and the rate of increase slows
down significantly at superficial gas velocities above 25 cm/s. Similar observations have
been made in the previous studies of Deckwer, 1980, Saxena et al., 1990, Li and Prakash,
Page 159
133
1997, Yang et al., 2000, Abdulmohsin et al., 2010, Abdulmohsin and Al-Dahhan, 2012,
Wu 2007, Wu et al, 2007, Wu and Al-Dahhan, 2011 and most recently Prakash, 2012.
(a)
(b)
Figure 4.3 Effect of solids volume fraction and superficial gas velocity on heat transfer
coefficient at r/R=0.0 in (a) 6-inch bubble column (b) 18-inch bubble column
Page 160
134
They noted that the rate of increase in heat transfer coefficient is high for gas velocities
less than 0.20 m/s and beyond this the increase becomes gradual.
Increasing superficial gas velocity leads to increased bubble frequency, bubble
population and gas hold-up as well as the bubble chord length (which is characteristic of
the bubble sizes) and axial bubble velocity as indicated in Section 3 and further illustrated
in Figures 4.4-4.5. Figure 4.4 shows the effect of solids loading and superficial gas
velocity on relevant bubble dynamics in 6-inch empty bubble column at the center of the
column (r/R = 0.0). While Figure 4.5 shows the effect in 18-inch diameter column at the
center of the column (r/R = 0.0). At Ug >25 cm/s the rate of increase in heat transfer
coefficient falls, in a similar way the as the local gas hold up (Figure 4.4a), bubble chord
length (Figure 4.4 c) as well as the axial bubble velocity (Figure 4.4d) but at a lower rate.
This is an indication that there exists a close tie between the heat transfer rate and the
bubble properties. It is important to point out that beyond Ug = 20 cm/s the bubble chord
lengths starts to decrease while the axial bubble velocity continues to increase albeit
negligibly. Bubbles break and coalesce, and the number of both large and small bubbles
increases and the bubble size distribution spreads wider than the relatively uniform
bubble size distribution in bubbly flow, (Figure 3.27). In the churn-turbulent flow regime
the increase in the number of small bubbles is faster than that of large bubbles, so the
mean bubble chord length decreases slightly with Ug as illustrated in Figure 4.5c and
Figure 4.5c. However the axial bubble velocity continues to increase which indicates that
the many smaller bubbles produced are trapped in the wake of larger bubbles which move
at higher velocity thus a slight increase in the axial velocity despite a slight fall in bubble
chord lengths with Ug.
Page 161
135
(a) (b)
(c) (d)
Figure 4.4 Effect of solids loading and superficial gas velocity in 6-inch diameter
column on (a) Local gas holdup (b)Bubble passage frequency (c) Mean
bubble chord length (d) Axial bubble velocity
Whereas some researchers have reported that adding solid particles to gas-liquid
systems enhance the heat transfer coefficient, (Saxena et al., 1990; Deckwer et al., 1980;
Yang et al., 2000; Wu 2007, 2011), a few others have reported the reverse trend, (Li and
Prakash, 1997, Li, 1998; Jhawar 2011). Worth noting is that in these investigations,
0
10
20
30
40
50
60
0 10 20 30 40 50
No Solids 9.1 % vol
25 % vol 40 % vol
Superficial gas velocity, (cm/s)
Lo
cal
gas
ho
ldu
p, (%
)
0
20
40
60
80
100
0 10 20 30 40 50
No Solids 9.1 % vol
25 % vol 40 % vol
Superficial gas velocity, (cm/s)
Bu
bb
le p
assa
ge
freq
uen
cy,
(s-1
)
0.3
0.4
0.5
0.6
0.7
0.8
0.9
1
0 10 20 30 40 50
No Solids 9.1 % vol
25 % vol 40 % vol
Superficial gas velocity, (cm/s)
Mea
n b
ub
ble
ch
ord
len
gth
, (c
m)
0
20
40
60
80
100
120
140
160
0 10 20 30 40 50
No Solids 9.1 % vol
25 % vol 40 % vol
Superficial gas velocity, (cm/s)
Axia
l b
ub
ble
vel
oci
ty,
(cm
/s)
Page 162
136
(a) (b)
(c) (d)
Figure 4.5 Effect of solids loading and superficial gas velocity in 18-inch diameter
column on (a) Local gas holdup (b) Bubble passage frequency (c) Mean
bubble chord length (d) Axial bubble velocity
different liquids, gases and solids were used. It is therefore debatable whether the effect
of solids loading depends on the solids type and the gas-liquid system investigated.
According to the results obtained in the current work, it can be observed that the addition
of solids to the gas-liquid system leads to lower heat transfer coefficient, regardless of the
10
20
30
40
50
60
0 20 40 60
No solids
9.1 % vol
25 % vol
Superficial gas velocity, cm/s
Lo
cal
gas
ho
ldu
p, (%
)
0
40
80
120
160
200
240
0 10 20 30 40 50
No solids
9.1 % vol
25 % vol
Superficial gas velocity, cm/s)
Bu
bb
le p
assa
ge
freq
uen
cy,
(s-1
)
0.6
0.7
0.8
0.9
1
0 10 20 30 40 50
No solids
9.1 % vol
25 % vol
Superficial gas velocity, (cm/s)
Mea
n b
ub
ble
ch
ord
len
gth
, (c
m)
100
120
140
160
180
200
220
0 10 20 30 40 50
No solids
9.1 % vol
25 % vol
Superficial gas velocity, (cm/s)
Axia
l b
ub
ble
vel
oci
ty,
cm/s
)
Page 163
137
column diameter and superficial gas velocity, or radial location. Kumar et al., 1992
demonstrated that the local heat transfer coefficient has a direct connection to the bubble
sizes. They showed that the heat transfer coefficient increases with an increase in bubbles
size, since strong vortices are created behind the large bubbles hence intense mixing in
the wake region, a short distance behind the bubble is expected. The phenomena
encountered in the bubble columns correspond to the flow behavior at three flow regimes
as reported by Chen et al., 1994 with the increase in the superficial gas velocity in a
bubble column. Hence, at low superficial gas velocities, the heat transfer coefficients are
relatively small because of the small bubble size in the homogenous flow regime. With
increasing superficial gas velocity, the heat transfer coefficient increases due to the
increase in bubble sizes hence their velocity, and their numbers and passage frequency
over the heat transfer surface. This leads to an enhanced rate of the heat transfer surface
renewal. Luo et al., 1999 also pointed out that in the churn turbulent flow regime, bubble
coalescence and breakup rates come to equilibrium at a certain gas velocity thus the
magnitude of the increase slows down.
The heat transfer variations with slurry concentration are comparable with bubble
dynamics variations reported earlier on in Section 3 and Figures 4.4 and 4.5. Besides they
are also consistent with those of Gandhi et al., 1999. The gas holdups reported earlier on
and by several authors Saxena, 1989, Li and Prakash, 2001, decreased with increase in
slurry concentration and the rate of decrease slowed at slurry concentrations above 20 %.
These similarities in heat transfer and gas holdup variations suggest a role for underlying
bubbles behavior in the heat transfer coefficients and rates. Li and Prakash 2001,
attributed the decrease in heat transfer coefficient with solids to turbulence dampening
Page 164
138
effects of higher apparent viscosity of the slurry suspension. The addition of solids which
have higher thermal conductivity and higher heat capacity such as the glass beads used in
this work would lead to enhanced heat transfer coefficient, while increased slurry
viscosity would have a negative influence on the same, Jhawar, 2011. It has also been
documented by several researchers that the heat-transfer coefficient decreases with
increasing liquid viscosity in multiphase reactors, (Kang et al., 1985, Kim et al., 1986,
Kumar and Fan, 1994, Cho et al., 2002) regardless of the particle size.
The decrease in the heat-transfer rate observed in this work has been attributed to
an increase in the thermal boundary sublayer thickness around the heat transfer surface.
Addition of solids leads to increase in the thermal boundary layer thickness that is
responsible for the heat transfer resistance. The increased boundary layer results from
increased pseudo-slurry viscosity due to a decrease in turbulence and an increase in
viscous friction loss between the phases, thus increasing the resistance for conduction
heat transfer. From the mechanistic point of view as will be illustrated in the next chapter,
the conduction is required to occur before the convective heat transport occurs. Thus with
increased thermal boundary layer, the resistance to the conduction is increased.
Moreover, the particle movement is retarded with increasing viscosity, thereby reducing
their attack on the thermal boundary layer around the heating source, Jhawar, 2011,
consequently low rate of thermal layer renewal. It is also observed that axial bubble
velocity increases with increased solids loading. But the population of the bubbles and
the bubble passage frequency is greatly lowered with solids addition thus the frequency
with which the heat transfer surface is renewed is also reduced.
Page 165
139
Kumar and Fan, 1994 demonstrated that for a gas liquid and gas-liquid-solid
systems it is that a thin liquid film of uniform thickness exists at the heat transfer probe
surface and that the mass of fluid brought by the bubble wake is viewed to exchange heat
by unsteady-state conduction at the outer edge of the thin film. They further claimed that
the resistance to heat transfer is due to the thin film whose thickness depends on the
liquid properties and the local hydrodynamics, followed by penetration and unsteady-
state heating of a liquid mass element.
4.3.3. Effect of Solids Loading on Heat Transfer Coefficient and its Radial
Variation. Few studies have reported the effect of high solids loading on the radial
variation of the heat transfer coefficient, particularly in bubble columns operated at
higher superficial gas velocity which are all desired in commercial applications like in the
F-T synthesis process. Among the few reported studies include, Li and Prakash, 2001,
Wu et al., 2007. Figure 4.6 and Figure 4.7 illustrate the effect of solids volume fraction
and superficial gas velocity on radial profiles of the heat transfer coefficient in empty 6-
inch bubble column and 18-inch bubble columns at superficial gas velocity of 45 cm/s.
In both the columns, significant radial differences are observed. Higher heat
transfer values at the column center while close to the column wall, lower values of the
heat transfer coefficient are noted. Additional data were collected at more radial locations
to obtain the radial profiles of heat transfer coefficients in the bulk region for different
gas velocities and slurry concentrations. The radial variation can be attributed to higher
local turbulence generated by the large fast moving bubbles at the column center and
slower smaller bubbles moving closer to the column wall at all the reported gas velocities
and solids loading. Saxena et al., 1990 investigated in detail the effect of column
Page 166
140
diameter on heat transfer. They reported that heat transfer coefficient measured in a 30.0
cm diameter slurry bubble column was greater than in a 10.8 cm diameter slurry bubble
column. They attributed this increase to more intense mixing attained in larger column.
Further details on the differences and scale effect will be examined later in Section 6.
Figure 4.6 Effect of solids volume fraction on radial profiles of heat transfer coefficient
in 6-inch bubble column
The radial heat transfer coefficient variation is justified from the local gas holdup
radial profiles shown in Figure 4.8 and also as discussed in Section 3, Figures 3.22 and
3.26. Similar trends in profiles of other bubble properties were already discussed in
Section 3, (Figure 3.27, 3.29, 3.32 and 3.35) and are therefore not re-plotted here in this
section). Towards the center of the column, higher local gas holdup and higher bubble
3.5
4
4.5
5
5.5
6
6.5
7
7.5
8
0 0.2 0.4 0.6 0.8 1
No Solids at 20 cm/s No Solids at 45 cm/s
9.1 % vol at 45 cm/s 25 % vol at 45 cm/s
9.1 % vol at 20 cm/s 25 % vol at 20 cm/s
Diemnsionless radius, r/R(-)
Hea
t tr
ansf
er c
oef
fici
ent,
hw(k
W/m
2.K
)
Page 167
141
passage frequency hence higher rate of heat transfer surface renewal at the central region
of the column. With no solids, in the 6-inch column the radial profiles are nearly flatter in
central region with a 2.5 % decrease in the heat transfer coefficient from r/R = 0.0 to r/R≤
0.5 then a sharp (9 %) decline in the column wall region (r/R ≥ 0.6) on the average.
Similar trends but steeper profiles, 5.3 % decrease at the column core (r/R ≤ 0.5) and 14
% decrease at (r/R ≥ 0.6) are observed in the 18-inch diameter column.
Figure.4.7 Effect of solids volume fraction on radial profiles of heat transfer coefficient
in 18-inch bubble column at Ug = 45 cm/s
With increasing the slurry concentration, the bubble sizes (Table 4.1) become
larger Figure 4.4c, Figure 4.5c and the probability of getting smaller bubbles decreases or
shifts to larger values of the bubble chord lengths, Figure 4.9. Figure 4.9 shows the
3.5
4
4.5
5
5.5
6
6.5
7
7.5
8
0 0.2 0.4 0.6 0.8 1
No solids 9.1 % vol 25 % vol
Dimensionless radius, r/R (-)
Hea
t tr
ansf
er c
oef
fici
ent,
hw(k
W/m
2.K
)
Page 168
142
distribution of the bubble sizes in terms of the bubble chord lengths in 6-inch diameter
empty column (Figure 4.9a) and in 18-inch diameter empty column (Figure 4.9b) under
Figure 4.8 Effect of solids loading on the local gas holdup radial profiles in 18-inch
diameter empty column at 45 cm/s
(a) (b)
Figure 4.9 Effect of solids loading on bubble chord length probability distributions in
empty columns at r/R(-) = 0.0 in (a) 6-inch diameter (b) 18-inch diameter
(Equation 3.8)
0
10
20
30
40
50
60
0 0.2 0.4 0.6 0.8 1
No solids 9.1 % vol 25 % vol
Dimensionless radius, r/R(-)
Loca
l gas
ho
ldu
p, (%
)
0 0.5 1 1.5 2 2.5 3 3.5 40
0.2
0.4
0.6
0.8
1
1.2
1.4
1.6
1.8
2
chordlength, (cm)
pdf
No solids
9.1 % vol
25 % vol
0 0.5 1 1.5 2 2.5 3 3.5 40
0.2
0.4
0.6
0.8
1
1.2
1.4
1.6
1.8
2
chordlength, (cm)
pdf
No solids
9.1 % vol
25 % vol
Page 169
143
different solids loading. The figures 4.9a, b were plotted based on the criterion presented
in Section 3.2.2.4. Further statistical analysis is done of the distributions as shown in
Table 4.1 by providing the mean and variance.
Table 4.1 Statistical parameters for the bubble chord length distribution 6-inch and 18-
inch columns with and without solids
Column Solids loading Mean Variance
6-inch
No Solids 0.7199 1.1418
9.1 % vol 0.8263 1.4261
25 % vol 0.9828 2.4682
18-inch
No Solids 0.8026 1.9784
9.1 % vol 0.8196 1.9974
25 % vol 0.8245 2.7559
4.3.4. Comparison of the Heat Transfer Coefficient Measurements with
Existing Data. There have been a large number of investigations on experimental
measurement of heat transfer coefficient. A wide range of gas velocity, column diameter
together with different gas–liquid and gas–liquid–solid systems have been studied in the
published literature. A summary of these studies has been given by Hulet et al., 2009.
Additional studies are also summarized in Appendix-A. It should be noted that the major
effort has been on correlating the heat transfer data by means of empirical or semi-
Page 170
144
empirical correlations but the use of these expression is limited to the experimental
conditions on which they are based. In order to understand the comparative performance
of these correlations, these have been plotted and illustrated in Figure 4.10. Figure 4.10
further shows a comparison between the measured time averaged heat transfer
coefficients in this work taken at the column center r/R (-) = 0.0 for air-water 6-inch
bubble column within the fully developed flow region (Z/D = 5.6) and the literature for
both reported values and correlation predictions under atmospheric pressure and the
reported values at similar operating conditions of Jhawar 2011, Wu et al., 2007; Li and
Prakash, 1997; Schluter et al., 1995; Saxena et al., 1990; and Verma, 1989.
Verma, 1989 studied heat transfer rate in a 0.11 m diameter column with a height
of 1.7 m equipped with a heat transfer surface that was 2 cm diameter and 33 cm long
located within z/D = 5.2 -10.7 above the gas distributor. It was also observed that the heat
transfer coefficient increased with increasing Ug and became all but nearly constant
above a gas velocity of 0.12 m/s. Furthermore, the heat transfer coefficient was found to
be independent of probe location within the sampling zone of z/D = 5.2-10.7. Based on
the assumption that the heat transfer occurs by conduction to a thin boundary layer of
liquid at the heat transfer surface, the authors experimental data was used for comparison
in this work. Their results though generally lower than the measured in this work, lie
within close range to each other as well as those measured by Wu, 2007 in a 16 cm
diameter air-water bubble column and Jhawar, 2011 in a 28 cm diameter air-water bubble
column using a similar probe as the one used in this work. In fact the values lie within 3
% an indication of higher level of accuracy and consistency. Schlüter et al., 1995 did not
give the details of the experimental method used, thus it is hard to evaluate why their
Page 171
145
results are larger than the measured values in this work or even to the others. The results
in this work and those reported by Verma, 1989 Saxena et al., 1990, and Li and Prakash,
1997 were obtained using immersed cylindrical heaters. As reported by Saxena et al.,
1990, column diameter can affect the heat transfer coefficient, and the heat transfer
coefficient increases with the increase of the column diameter in a bubble column
without internals.
Figure 4.10 Comparison of the heat transfer coefficients measured in this work with the
reported data in air-water bubble column at the column center, r/R (-) = 0.0
The heat transfer coefficient shows strong dependence on superficial gas velocity
at low values up to 15 cm/s and weaker dependence at higher superficial gas velocities
for all the correlations and measurements compared. The reported difference could be
Page 172
146
attributed to difference in flow region over which such experiments were done, column
diameters, or experimental and system conditions, limited data were used for the
development of the correlation as well as the sparger effects. Abdulmohsin and Al-
Dahhan, 2012 also claimed that such variation in measured heat transfer coefficient could
be attributed to many uncertainties caused by different measurement techniques (probe)
used and different operating and design conditions applied in these reported studies.
4.3.5. Effect of Dense Internals and Gas Velocity on Heat Transfer
Coefficient without Solids. Most of the studies in bubble columns on transport
parameters and hydrodynamics have been performed in empty bubble columns. Only a
few researchers have reported the effect of internals on heat transfer coefficient in bubble
columns including; (Saxena et al., 1990b; Saxena et al., 1992b; Schluter et al., 1995,
Jhawar, 2011 and Abdulmohsin and Al-Dahhan, 2012). But the effect of dense internals
that occupy higher CSA is still not evaluated and reported under the conditions that
mimics an FT process. Thus the need to examine effect of dense internals on heat transfer
coefficients in three-phase slurry bubble columns column such as those desired in the FT
process. Figure 4.11 illustrates the effect of dense internals on the heat transfer
coefficient and their radial profiles in 6-inch diameter bubble column.
The superficial gas velocity was calculated based only on the free cross-sectional
area for the flow. It can be observed that under the same operating conditions and gas
velocity, the heat transfer coefficient obtained in the presence of dense internals
occupying 25 % of the column cross-section are higher than those obtained in the empty
bubble column. Figure 4.12 shows similar profiles for the effect of dense internals on the
heat transfer coefficient in 18-inch diameter bubble column. The systematic and detailed
Page 173
147
studies illustrated in Section 3 has shown that with the hybrid probe in the same column
and internals, small bubbles are formed with narrow range in size distribution, (Figure
3.31) while the coalescence to form larger bubbles are prevented from forming when the
dense internals are used. Even though the smaller bubbles have lower rise velocity, their
frequency is significantly increased and have higher residence time in the system thus
enhanced holdup.
Figure 4.11 Effect of Internals on the radial profiles of the heat transfer coefficient in 6-
inch bubble column Ug based on free CSA without solids
With higher gas holdup and bubble frequency, the rate of heat transfer surface
renewal will be increased thus the observed increase in heat transfer coefficient with
inclusion of dense internals. To illustrate the corresponding effect of the dense internals
3.5
4
4.5
5
5.5
6
6.5
7
7.5
0 0.2 0.4 0.6 0.8 1
No Internals at 8 cm/s Internals at 8 cm/s
No Internals at 20 cm/s Internals at 20 cm/s
Hea
t tr
ansf
er c
oef
fici
ent h
w (
kW
/m2.K
)
Dimensionless radius, r/R(-)
Page 174
148
on the radial profiles of bubble dynamics, only the gas holdup radial profiles are used
since the radial profiles of the other bubble dynamic properties are more or less similar to
those of gas holdup. Figure 4.13 shows the effect of dense internals on the local gas
holdup radial profiles in 6-inch diameter column (Figure 4.13a) and in 18-inch diameter
column (Figure 4.13b).
Figure 4.12 Effect of Internals on the radial profiles of the heat transfer coefficient in
18-inch bubble column Ug based on free CSA without solids
Studies in the current work reveal that the presence of dense internals increased
the heat transfer coefficient in the column center by up to 8.5 % and 10 % in the 6-inch
and 18-inch diameter columns, respectively, at lower superficial velocity (8 cm/s). At
higher superficial gas velocity (20 cm/s) the dense internals enhanced the heat transfer
3.5
4
4.5
5
5.5
6
6.5
7
7.5
0 0.2 0.4 0.6 0.8 1
No internals 8 cm/s Internals 8 cm/s
No internals 20 cm/s Internals 20 cm/s
Dimensionless radius, r/R (-)
Hea
t tr
ansf
er c
oef
fici
ent,
hw(k
W/m
2.K
)
Page 175
149
(a)
(b)
Figure 4.13 Effect of dense internals on the radial profiles of local gas holdup at different
superficial gas velocities based on free CSA in (a) 6-inch diameter column
and (b) 18-inch diameter column without solids
coefficient by up to 4.8 % and 2.8 % in the 6-inch and 18-inch diameter columns
respectively. It is apparent from these observations that the influence of dense internals is
5
10
15
20
25
30
35
40
45
50
0 0.2 0.4 0.6 0.8 1
No Internals at 8 cm/s
Internals at 8 cm/s
No Internals at 20 cm/s
Internals at 20 cm/s
Dimensionless radius, r/R(-)
Lo
cal
gas
ho
ldu
p, (%
)
5
10
15
20
25
30
35
40
45
50
0 0.2 0.4 0.6 0.8 1
No Internals at 8 cm/s
Internals at 8 cm/s
No Internals at 20 cm/s
Internals at 20 cm/s
Dimensionless radius, r/R(-)
Loca
l gas
hold
up, (%
)
Page 176
150
more significant at lower superficial gas velocities and become smaller in the higher
range (churn turbulent flow regime) of gas velocity. The effect of dense internals on the
bubble dynamics discussed in details in Chapter 3 reveal effect much like those on the
heat transfer coefficient. As illustrated in Figure 4.13, the impact of dense internals on the
local gas holdup radial profiles is more significant at lower superficial gas velocity (Ug =
8 cm/s). The local gas holdup is increased by 7 % at the column center and up to 22 % at
the column wall region at 8 cm/s in 6-inch diameter column while an increase of 3 % at
the column center and 18 % at the column wall region at 20 cm/s in 6-inch column. In
18-inch diameter column, the dense internals enhances the local gas holdup by 20 % at
the column center and 37 % at the column wall region at 8 cm/s. At higher superficial gas
velocity, 20 cm/s, dense internals enhanced the local gas holdup by 13 % at the column
center and 21 % at the column wall region in 18-inch diameter.
Abdulmohsin and Al-Dahhan, 2012 also reported similar findings in heat transfer
coefficient for an air-water system for studies conducted in 8-inch diameter column. They
reported that compared with an empty bubble column (without internals), no significant
effect was noted with internals covering low CSA of the column at 5 % of the total CSA
at the same superficial gas velocity. However, when the internals coverage was increased
to 22 % of the cross-sectional area, the heat transfer coefficient was enhanced by up to
19 % at low superficial gas velocity (0.03 m/s), while the effect of dense internals was
smaller at high superficial gas velocity (0.2 m/s). Nevertheless, a key finding here is that
the empty column results of heat transfer coefficient for a gas-liquid system can be
extrapolated to those with dense internals if the Ug based on the free CSA is used.
Page 177
151
Forret et al., 2003 also in their liquid dispersion studies in large bubble column
with and without internals observed that the presence of internals gave rise to higher
liquid backmixing due to large scale liquid recirculation intensity enhancement. Thus the
dense internals would lead to better mixing that enhances the heat transfer rate. The
resulting higher bubbles breakup rate and enhanced liquid recirculation velocity will also
improve the wake enhanced heat transfer rates. Heat transfer measurements at different
radial locations carried out by Li and Prakash, 1997 and Prakash et al., 2001 reported
that the column center heat transfer coefficients were higher than the ones closer to the
column wall heat transfer coefficients, due to the fact that large bubbles collect more
dominantly at the center region. Besides that, obviously there existed more turbulence in
the center as compared to near wall, due to possible wall effects.
4.3.6. Effect of Dense Internals and Solids Loading on the Heat Transfer
Coefficient. From the two-phase studies in bubble columns, Kolbel et al., 1958, Zaidi et
al., 1990 involving liquids of different viscosities, the effect of using different liquids
with different viscosity as well as liquid phase thermal conductivity and heat capacity
have demonstrated significant effect on the heat transfer rates. It is commonly accepted
that the heat-transfer coefficient for gas-liquid and gas-liquid-solid increases with an
increase in the gas velocity, the size of particles, and the thermal conductivity and heat
capacity of the liquid, but decreases with an increase in the liquid viscosity (Kim and
Laurent, 1991). Addition of solid particles would increase or decrease the average
properties of suspension depending on solids, (Jhawar and Prakash, 2011). Previous
studies on heat transfer in gas-liquid and gas-liquid-solid systems indicated that an
increase in the liquid viscosity decreases the heat-transfer coefficient (Kato et al., 1981;
Page 178
152
Kang et al., 1985; Deckwer, 1980; Kumar and Fan, 1994). The decrease in the heat-
transfer coefficient with increasing liquid viscosity is possibly due to the fact that the
thickness of the laminar sublayer in turbulent flow increases with liquid viscosity. Also
the rate of surface renewal could be decreased. Figure 4.14 and Figure 4.15 show the
variation of heat transfer coefficient in 6-inch and 18-inch diameter bubble columns
respectively, without internals and with dense internals occupying 25 % of the column
CSA at different superficial gas velocities based on the free cross-sectional area of the
column.
Figure 4.14 Impact of internals and solids loading in 6-inch bubble column on heat
transfer coefficient at r/R(-)= 0.0 with Ug based on free cross-sectional
area
It is evident from the figures that the heat transfer coefficient decreases with
increase in slurry concentration in bubble columns with dense internals (25 %) and
3
3.5
4
4.5
5
5.5
6
6.5
7
7.5
0 0.1 0.2 0.3 0.4 0.5
No Internals at 8 cm/s Internals at 8 cm/s
No Internals at 45 cm/s Internals at 45 cm/s
Solids volume fraction, (-)
Hea
t tr
ansf
er c
oef
fici
ent,
hw(k
W/m
2.K
)
Page 179
153
without internals. However the rate of decrease in the heat transfer coefficient with
increasing solids loading varies with the superficial gas velocity. Similar trends were
observed for gas holdup and bubble passage frequency profiles, Figure 4.16. It is also
noted that the impact of internals on the heat transfer coefficient is more significant at
lower superficial gas velocity, at higher solids loading and more pronounced in the
smaller column (6-inch). In fact with dense internals, an increase of up to 18 % is attained
in the 6-inch column at 40 % vol solids loading in heat transfer coefficient as compared
to 9 % increase in the heat transfer coefficient at no solids.
Figure 4.15 Impact of internals and solids loading in18-inch bubble column on heat
transfer coefficient at r/R(-)= 0.0 with Ug based on free cross-sectional
area
An increase of ~2 % in local gas holdup at 45 cm/s was attained in 6-inch column
with or without solids while between ~14-17 % increase was attained at 8 cm/s. In 18-
3.5
4
4.5
5
5.5
6
6.5
7
7.5
8
0 0.05 0.1 0.15 0.2 0.25 0.3
No Internals at 20 cm/s Internals at 20 cm/s
No Internals at 45 cm/s Internals at 45 cm/s
Solids volume fraction, (-)
Hea
t tr
ansf
er c
oef
fici
ent,
hw(k
W/m
2.K
)
Page 180
154
(a) (b)
(c) (d)
Figure 4.16 Impact of internals and solids loading on bubble dynamic parameters
(a) local gas holdup in 6-inch column (b) local gas holdup in 18-inch
column (c) bubble passage frequency in 6-inch column (d) bubble
passage frequency in 18-inch column
inch diameter column, an increase in local gas holdup of between 3-9 % was attained at
45 cm/s while between 10 – 14 % increases at 20 cm/s. With the highest increase in both
5
15
25
35
45
55
65
0 0.1 0.2 0.3 0.4 0.5
No Internals at Ug = 8 cm/s
Internals at Ug = 8 cm/s
No Internals at Ug = 45 cm/s
Internals at Ug = 45 cm/s
Solids volume fraction, (-)
Lo
cal
gas
ho
ldu
p, (%
)
5
15
25
35
45
55
65
0 0.1 0.2 0.3
No Internals at Ug = 8 cm/s
Internals at Ug = 8 cm/s
No Internals at Ug = 45 cm/s
Internals at Ug = 45 cm/s
Solids volume fraction, (-)
Lo
cal
gas
ho
ldu
p, (%
)
10
30
50
70
90
110
130
150
170
190
0 0.1 0.2 0.3 0.4 0.5
No Internals at Ug = 8 cm/s
Internals at Ug = 8 cm/s
No Internals at Ug = 45 cm/s
Internals at Ug = 45 cm/s
Solids volume fraction, (-)
Bu
bb
le p
assa
ge
freq
uen
cy,
(s-1
)
10
30
50
70
90
110
130
150
170
190
0 0.1 0.2 0.3
No Internals at Ug = 8 cm/s
Internals at Ug = 8 cm/s
No Internals at Ug = 45 cm/s
Internals at Ug = 45 cm/s
Solids volume fraction, (-)
Bu
bb
le p
assa
ge
freq
uen
cy,
(s-1
)
Page 181
155
columns attained at the highest solids loading used. Similar trends were observed for the
bubble passage frequency.
As will be illustrated in Section 5, the heat transfer phenomenon is a sequential
process where thermal diffusion occurs followed by convection into the bulk. The
thermal boundary layer known as the film thickness is increased with solids addition.
Increase in this layer leads to resistance in diffusive heat transfer. The increase in
apparent suspension viscosity due to addition of particles also results in reduced
turbulence, and decreased rate of surface renewal because of the solid particles
dampening on the bubble wake turbulence (Li and Prakash, 1997).
It was demonstrated in Section 3 (see Figure 3.22) that the addition of glass-
beads, solids only changes slightly the radial profiles of the gas hold up. Thus the
resulting effect on the intensity of large-scale liquid recirculation velocity would be not
significant. Thus, change in the rate of heat transfer due to addition of such solids could
be mainly attributed to decreased turbulence in the gas-liquid-solids system since the
glass bead solids lower the gas hold up and bubble passage frequency.
Finally, the hybrid probe used in this work gives an insight to further understand
the underlying reason for the observed increase in heat transfer coefficient with the
insertion of internals regardless of the solids loading.
4.4. MIMICKED HEAT EXCHANGING INTERNALS HEAT TRANSFER
PROBE
4.4.1. Scope. As discussed before, the heat transfer coefficient measurements
have been conducted by many researchers using flat plate type or rod assembly of the
Page 182
156
heat transfer probes. In this section, of this work, heat transfer surface is simulated by
using the modified rod type of heat transfer probe which is installed vertically in the
mimicked heat exchanging tube (internals). A mimicked heat exchanging internals and
heat transfer probe assembly is shown in Figure 4.17.
(a)
(b)
Figure 4.17 Advanced mimicked extended rod heat transfer surface probes (a) Image
photos of half inch and one inch rods and (b) Image photo of the heat
transfer rod among internals in the column
1-inch
diameter
internal
0.5-inch
diameter
internal probe
Temperature/Heat flux sensor
Page 183
157
Two diameter tubes of heat transfer surface probes were simulated. The two
consist of extended heat transfer probes, with stainless steel tubes 1/2” OD and 1” OD
rods. Supporting honey-combed structures for holding the dense internals were used to
keep these advanced mimicked heat transfer surface probes together. In order to
investigate the role of different sizes of internals that occupy the same CSA (25 % of
CSA) and hence configuration on heat transfer coefficient, the two diameters were used
as discussed in Section 3. It should be noted that such measurements of the heat transfer
coefficient were carried out at the same time as the bubble dynamic measurements.
The stainless steel tubes used in mimicked extended heat transfer surface probes
were of the same length as the Plexiglas internals (1.83 m), and both ends of the stainless
steel tubes were sealed by threaded caps (which can be any material, brass or Teflon
caps) to avoid leaking. The heat transfer coefficient measurement elements are embedded
at axial Z/D= 5.1 distance on the extended heat transfer probes above the gas distributor
in 6 inch column and Z/D= 3.1 above the gas distributor in 18-inch column. The selected
Z/D represent the fully developed flow region. To minimize heat loss by conduction, the
elements were connected by Teflon fittings and rubber O-rings on the ends to avoid
seepage into the cartridge heater that would compromise its functionality. These elements
were designed adjustable to different axial locations, however owing to the technicality
associated with the internals removal and position readjustments, in 18 inch column, only
one axial position was chosen within the fully developed flow region Z/D= 3.1 above the
gas distributor.
4.4.2. Assessment of Advanced Mimicked Heat Exchanging Internals Heat
Transfer Probes. For comparison purposes with the results obtained from the L-shaped
Page 184
158
heat transfer probe, the experiments were conducted in the air-water systems under
ambient pressure in both 6-inch diameter column and the 18-inch diameter column and in
the presence of dense internals. Though the experimental investigations were also
performed on the effect of different axial locations in the 6-inch column, three axial
positions all within the fully developed flow region, the observed differences even with
the dense internals are within the margin of experimental error, thus not reported here.
The results obtained by the elements for the air-water system are shown in Figure 4.18 in
6-inch column in which half inch dense internals were used while Figure 4.19 for the 18-
inch column air-water system in which 1-inch dense internals were utilized. The standard
deviations were noted to be less than 0.114 (kW/m2.K) in 6-inch diameter heat transfer
surface probes.
(a) (b)
Figure. 4.18 Comparison between the data obtained by embedded probe on the half-inch
internal rod and those measured by single L-shaped probe at z/D = 5.1 in
6-inch column for an air-water system at (a) column center (b) column
wall region
4
4.5
5
5.5
6
6.5
7
7.5
8
0 10 20 30 40 50
L-ProbeElement in-1/2 - Inch
Superficial gas velocity, Ug (cm/s)
Hea
t tr
ansf
er c
oef
fici
ent,
hw
(k
W/m
2.K
)
4
4.5
5
5.5
6
6.5
7
7.5
8
0 10 20 30 40 50
L-Probe
Element in-1/2 - Inch
Superficial gas velocity, Ug(cm/s)
Hea
t tr
ansf
er c
oef
fici
ent,
hw
(kW
/m2.K
)
Page 185
159
For both the columns it is observed that the heat transfer coefficient obtained by
the elements (mimicked internal probe) is higher than those measured by the L-shaped
rod probe at the same position with dense internals. However, the average deviation over
the whole range of superficial gas velocity (based on free cross-sectional area) is less than
8 % in 6-inch column (i.e between 4 - 9 %) and less than 5 % in the 18-inch column (i.e
between 3 – 6 %), with deviations being highest at lower gas velocity in the two columns.
The deviations were even smaller closer to the wall region in both the columns.
(a) (b)
Figure. 4.19 Comparison between the data obtained by embedded probe on the one-inch
internal rod and those measured by single L-shaped probe at z/D = 3.1 in
18-inch column for an air-water system at (a) column center (b) column
wall region
It is clear that when the heat transfer probe is embedded on the internals,
consistently higher values of the heat transfer coefficient were relative to the L-shaped
rod heat transfer probe in both the columns irrespective of the radial location of the probe
were obtained. Thus it is necessary that the use of embedded heat transfer probes on the
4
4.5
5
5.5
6
6.5
7
7.5
8
0 10 20 30 40 50
L-Probe
Element in-1 - Inch
Superficial gas velocity, Ug(cm/s)
Hea
t tr
ansf
er co
effi
cien
t, h
w(k
W/m
2.K
)
4
4.5
5
5.5
6
6.5
7
7.5
8
0 10 20 30 40 50
L-Probe
Element in-1 - Inch
Superficial gas velocity, Ug(cm/s)
Hea
t tr
ansf
er c
oef
fici
ent,
hw
(kW
/m2
.K)
Page 186
160
internals be adopted for the heat transfer measurements in columns inserted with dense
mimicked heat exchanging internals.
To assess the effect of different diameter of dense internals occupying the same
cross-sectional area on the heat transfer coefficient, a comparison is made for the
measurements obtained using the advanced mimicked extended heat transfer rods of half-
inch diameter and one-inch diameter rods. Figure 4.20 shows a comparison of
measurements obtained by the elements in 6-inch column using half inch diameter
internals and 1-inch diameter internals both covering 25 % cross-sectional area of the
column for air-water-glass beads with the solids loading at 25 % volume. It is noted from
(a) (b)
Figure 4.20 Comparison between the data obtained by embedded probe on the one-inch
internal rod and those measured by the half-inch internal at z/D = 5.1 in
6-inch column for an air-water-glass beads system ( 25 % vol.) at (a)
column center (b) column wall region
Figure 4.20 that half-inch internals gave consistently higher heat transfer coefficient
values at the column center and close to the column wall region. This is expected as
4
4.5
5
5.5
6
6.5
7
7.5
8
0 10 20 30 40 50
Element in-1/2 - Inch
Element in-1 - Inch
Hea
t tr
ansf
er c
oef
fici
ent,
hw(k
W/m
2.K
)
Superficial gas velocity, Ug(cm/s)
4
4.5
5
5.5
6
6.5
7
7.5
8
0 10 20 30 40 50
Element in-1/2 - Inch
Element in-1 - Inch
Hea
t tr
ansf
er c
oef
fici
ent,
hw(k
W/m
2.K
)
Superficial gas velocity, Ug(cm/s)
Page 187
161
depicted from the bubble properties discussed in Section 3 and illustrated by Figures 3.7,
3.8, 3.10 and Figures 3.13-3.18.
4.5. SUMMARY
Hybrid measurements technique for heat transfer coefficient and bubble dynamics
was developed and successfully implemented in a 0.14 m ID bubble and 0.44 m ID
bubble and slurry bubble columns. The effects of superficial gas velocity, dense internals,
solids loading, and radial probe location on heat transfer coefficients were investigated.
For the first time, the heat transfer coefficient has been studied in connection with bubble
dynamics under conditions that mimic F-T reaction process with dense internals
occupying 25 % CSA and high solids loading up to 40 % by volume. The findings and
conclusions are summarized as follows:
The heat transfer coefficient increases with superficial gas velocity, although at
higher superficial gas velocities, particularly beyond 20 cm/s the rate of increase is
considerably small. When the operating conditions are maintained constant, the heat
transfer coefficient in the center of the column is larger than those near the wall region,
and the differences at higher superficial gas velocities are smaller than those at low
superficial gas velocities.
The heat transfer coefficient obtained in empty column for gas-liquid system can
be extrapolated to columns equipped with dense internals occupying 25 % of the CSA.
For gas-liquid-solids (glass-beads) systems, the heat transfer coefficient obtained
in empty 6-inch diameter column cannot be extrapolated for 6-inch diameter column
equipped with dense internals occupying 25 % of the CSA due to significant differences
Page 188
162
obtained even when the gas velocity was based on free CSA. The extrapolation can be
done for 18-inch column from the results in empty column to the column equipped with
dense internals, using Ug based on free CSA. For the 6-inch column, some of the bubble
properties such as local gas holdup and axial bubble velocity can be extrapolated only at
higher gas velocities, (≥ 20 cm/s) while the other bubble parameters such as bubble
passage frequency and bubble sizes cannot be extrapolated.
With dense internals occupying 25 % of the CSA, the heat transfer coefficient
increases, although the increase is more pronounced at low superficial gas velocities, a
similar scenario as those of the bubble properties.
At low solids loading, the heat transfer coefficient in the slurry bubble column
behaves nearly like that in a two-phase system. However, with further increase in solids
loading, a decrease in the heat transfer coefficient was observed but the fall slows down
beyond 25 % solids by volume.
The radial profile of heat transfer coefficients becomes flat towards the column
core and changes only slightly with increasing solids loading, much like the gas holdup
and bubble velocity, bubble sizes and bubble passage frequency radial profiles.
To assess the effect of internals on the heat transfer coefficient, new mimic heat
exchanging internals with attached heat transfer coefficient measurement elements were
constructed and assessed. Smaller diameter internals provided higher heat transfer rate as
compared to the larger diameter elements. The impact of smaller diameter internals was
equally and consistently higher on the bubble properties assessed in details in Section 3.
It is also worth to note that the embedded heat transfer probe on the internals gave
consistently higher values relative to the L-shaped rod heat transfer probe in both the
Page 189
163
columns irrespective of the radial location of the probe. Thus the use of advanced
embedded heat transfer probes on the internals would be necessary for the heat transfer
measurements in slurry bubble columns inserted with dense mimicked heat exchanging
internals.
Page 190
164
5. MECHANISTIC ASSESSMENT OF HEAT TRANSFER COEFFICIENT
BASED ON BUBBLE DYNAMICS
5.1. SCOPE
In order to predict the heat transfer rates and coefficients in bubble and slurry
bubble columns, several correlations have proposed. These correlations have been
developed based on either experimental studies on heat transfer in bubble columns or
based on bubble dynamics studies. Thus the heat transfer studies have been performed
separately from bubble dynamics studies under different operating conditions. However,
as discussed in Section 2, and the previous chapters, bubble dynamics and heat transfer
are closely related. Detailed critical review of the studies on heat transfer coefficient and
bubble dynamics and hydrodynamics point at closely knit relation between the bubble
dynamics and the heat transfer rate in two-phase and three-phase systems in general and
bubble and slurry bubble columns in particular. Thus, there is a need to mechanistically
asses how the heat transfer phenomenon in bubble columns is affected by different
bubble properties that govern the flow behavior, including local gas holdup, bubble
passage frequency, bubble velocity, bubble sizes, as well as their directions. In this
chapter a systematic mechanism for predicting the heat transfer coefficient is presented
and analyzed.
Turbulence and mixing that are induced by gas bubbles play important role in
heat and mass transfer in gas-liquid and gas-liquid-solid systems. The high heat-transfer
rate in multiphase flow systems particularly bubble and slurry bubble columns is mainly
due to bubble induced turbulence (Yang et al., 2000, Kumar et al., 1992). Both
experimental and theoretical results reported in the literature suggest that there is a series
Page 191
165
of film and surface renewal that govern the heat exchange between a heat transfer surface
and flowing fluid adjacent to the surface (Karst, 1962; Wasan and Ahluwalia, 1969; Yang
et al., 2000; Kumar and Fan, 1994).
The film theory was first proposed by Nernst, 1904. It has been applied to both
heat and mass transfer with some success. According to this model, steady-state mass
transfer and hence heat transfer occurs by molecular diffusion across a stagnant, or
laminar film at the interface between phases where the fluid is turbulent. The mass
transferred across a unit area of the interface per unit time is assumed to be proportional
to the concentration gradient between the bulk fluid and the interface such that
Where is the molecular diffusivity, is the effective film thickness, is the average
concentration in the bulk fluid and the average concentration in the interface, is the
rate of mass transferred across a unit area of the interface and =
is the mass transfer
coefficient. The analogous form of heat transfer can be derived in a similar manner that
would give the heat flux, and the heat transfer coefficient as
Where is the thermal diffusivity, is the effective film thickness, and are the
average temperature of the bulk fluid and of the interface respectively, the heat flux per
unit area and
is the heat transfer coefficient. This model indicates a linear
relationship between mass flux and the molecular diffusivity, and hence the heat flux
and the thermal diffusivity, . It (the model) also oversimplifies the actual conditions
near a phase boundary. Furthermore, the concept of the theory supposes that there exists a
Page 192
166
stagnant film of a definite but unknown thickness. Therefore according to Azbel, 1981
this theory’s main weakness is the introduction of a uniform film of thickness, .
Based on Fick’s second law of unsteady diffusion (Higbie, 1935), proposed the
penetration theory where mass or heat transfer is observed as time-dependent non-steady
state process. The non-steady state phenomenon was not accounted for by the film
theory. Mass transfer and heat transfer are assumed to occur during the repeated contacts
of matter (gas/solid) with the liquid interface. Fresh liquid elements continually replace
those interacting with the interface. During each contact period between the liquid
element and the interface, mass or heat is transferred to the element. According to this
theory, the contact time of the small eddies with the interface, is so short that the steady
state characteristics do not develop therefore the transfer of heat or mass is by unsteady-
state molecular diffusion. Besides, all the eddies are assumed to stay in contact with the
interface for same length of time ( ) during which diffusion of matter (heat and mass)
occurs into the eddy which can be described for a 1-D system by Equation 5.3;
Hence, the average heat transfer coefficient during the contact time between the fluid
eddy and the heat transfer surface can be calculated as follows;
{
Then the average heat transfer coefficient, according to Higbie, 1935 becomes
√(
)
Danckwerts, 1951 modified the penetration theory, (Higbie, 1935) and came up with the
surface renewal model in-order to account for the different times of contact by different
Page 193
167
eddies which have different sizes. Thus the fluid elements can have a surface residence
time ranging from zero to infinity. Hence the average heat transfer coefficient becomes;
√
Where is the fractional rate of surface renewal by the elements, a parameter not easy to
determine.
Research conducted to investigate the characteristics of liquid film both
experimentally and theoretically suggest that a thin film lies between a solid surface and
the flowing fluid over the solid surface; Cooper, 1969, Moriyama and Inoue, 1996, Shedd
& Newell, 2004. Thus to predict the heat transfer coefficient, using the film theory alone
would not be appropriate due to its shortcoming stated earlier-on. While using the
penetration theory alone would not be sufficient since different eddies have a distribution
in the contact time. Surface renewal model would be more appropriate but on it’s on, the
presence of the stagnant liquid film would not be accounted for. Thus combining both the
surface renewal and film theory is the most appropriate mechanism of estimating the heat
transfer rate.
Accordingly, Wasan and Ahluwalia, 1969 developed a mechanistic model to
predict heat transfer coefficient based on a mechanism where heat-transfer enhancement
due to bubble passage expressed in terms of film theory and unsteady-state consecutive
surface renewal model (also known as the modified penetration theory). Such mechanism
suggests that there is a thin film of uniform thickness, δ, lying parallel to and covering the
heat transfer surface. Due to the bubble motion around the film, a liquid element is
moved to the outer surface of film from the bulk. In this case, heat is transferred to the
element by unsteady state conduction during the contact period and then washed away. A
Page 194
168
short time later another fluid element is moved to the same surface and the process
repeats. Figure 5.1 illustrates the consecutive film and unsteady state surface renewal heat
transfer mechanism from the heating source into the bulk fluid.
Figure 5.1 Consecutive film and unsteady state surface renewal mechanism, (modified
from, Wasan and Ahluwalia, 1969)
This proposed approach differs from the concepts of the combination of film-
penetration theory where the later recommended film theory for long contact times and
penetration theory for short contact times. In Wasan and Ahluwalia's, 1969 approach, a
uniform film (thinner than would be predicted by film theory alone) is regarded to lie
adjacent to the heat transfer surface and a mass of fluid exchanges heat by unsteady state
conduction at the outer edge of such film. Hence, there is a dynamic change of the
temperature of the interface between the film and the fluid element. According to this
approach, Wasan and Ahluwalia, 1969 developed a mechanistic model to predict heat
Film Bulk fluid
δ Fluid mass
Tw
T0
Heat
Bubbles
Page 195
169
transfer coefficient from heat exchanging surface to flowing gas-liquid and gas-liquid-
solid mediums as outlined below.
In such approach, the temperature of the fresh fluid element coming from the bulk
to outer surface of the film is assumed to be uniform and equal to the bulk fluid
temperature at time (t) = 0. By assuming no energy storage in the film, the instantaneous
heat transfer rate to the fluid mass was given as
(
)
( ) (5.5)
Where, is the distance within the fluid mass measured from the edge of the film, and
the film with a uniform film thickness , and the heat transfer coefficient, .
The two dimensional unsteady state equation for heat conduction to the fluid mass is;
(
) (5.6)
Where is the thermal diffusivity given by,
. By assuming an infinitely long heat
source, which is normal to the heat flux direction, equation (5.6) can be simplified as
follows:
(5.7)
By using the Laplace transform the solution of equation (5.7) becomes
√ √ (5.8)
As , √ , thus .
So equation (5.7) becomes
√ (5.9)
When equation (5.5) is transformed with respect to time, t, it yields;
Page 196
170
(
) ( ) (5.10)
Differentiating equation (5.9) with respect to y then substitution into equation (5.10) and
solving for gives;
√(
)
[
] (5.11)
Substituting from equation (5.11) into equation (5.9) gives
√
√(
)
[
] (5.12)
Solving equation (5.8), combing its final equation with equation (5.5) and setting
yield:
[(
) (
)
√
] (5.13)
By taking inverse Laplace transform, substituting , combining and utilizing
equations 5.14, 5.15 and 5.16, equation 5.17 below will be obtained.
The total heat transfer over the contact time period is .
∫
(5.14)
The overall heat transfer rate is the average over the contact time of the instantaneous
heat transfer rate:
∫
(5.15)
Also with
(5.16)
Page 197
171
Accordingly, Wasan and Ahluwalia, 1969 proposed equation (5.17) for modeling the
average heat transfer coefficient, which depends on the film thickness δ, contact
time, , and the physical properties, and α.
√
[
√
] (5.17)
where, and α are thermal conductivity and thermal diffusivity of the liquid or slurry,
respectively.
This model (equation 5.17) has been successfully used to predict the heat transfer
coefficient in two-phase and three-phase flow systems (Kumar et al., 1992; Kumar and
Fan, 1994; Li and Prakash, 1997; Yang et al., 2000). This model (Equation 5.17) can give
local heat transfer coefficient by locally having different estimated and δ. The
needed film thickness, δ, and the contact time , have been estimated by different
investigators using the few available empirical correlations. In this work, the needed
contact time will be developed, and the parameters related to it are examined.
5.2. EXPERIMENTAL SETUP
In order to illustrate the heat transfer in a mechanistic manner and based on the
discussed model above, a simultaneous measurements of both the heat transfer coefficient
and bubble dynamics were conducted in two scales of Plexiglas columns. The smaller
scale was a 0.14 m inside diameter and 1.8 m height with dynamic bed height in all the
experiments, maintained constant at a level of 1.56 m (z/D = 11.16) above the gas
distributor by adjusting the amount of liquid loaded in the column. The larger scale
consisted of a 0.44 m inside diameter and 3.66 m height with dynamic bed height in all
Page 198
172
the experiments maintained constant at a level of 2.67 m (z/D = 6.0) above the gas
distributor by adjusting the amount of liquid loaded in the column. In this study,
compressed filtered oil-free dry air introduced continuously from the bottom of the
columns was used as the gas phase. Soft filtered tap water was used as liquid phase. Glass
beads with an average size of 150 µm and density of 2500 kg/m3 was used as the
solids/fines phase. The solids loading was based on the wet volume and the
concentrations varied between 0 % vol – 25 % vol.
In both units perforated plates with triangular pitch hole pattern (6-inch column)
and square pitch hole pattern (18-inch column) with a total free area of 1.09 % was used
as the gas distributors. The superficial gas velocities were from 0.03 to 0.45 m/s based on
free cross-sectional area of the column covering both the bubbly and churn turbulent flow
regimes. The internals used in this study were vertical Plexiglas rods of 0.5-inch and 1-
inch diameter (in the small scale column and the large scale column, respectively)
occupying 25 % of the column cross-sectional area that simulates the Fischer-Tropsch
synthesis process. The schematics of both the columns used, the internals used and and
the general features of the experimental systems is the same as discussed in Sections 3-4.
Combined probes consisting of both advanced four-point optical probe and a fast
response heat transfer were used to simultaneously measure the local heat flux and
surface temperature and the local bubble properties, including local gas hold up, bubble
passage frequency, axial bubble velocity, specific interfacial area, as well as the bubble
chord lengths which is characteristic of bubble sizes.
Page 199
173
5.3. CONTACT TIME MODELING DEVELOPMENT
One of the two needed parameters in the mechanistic Equation (5.17) is the
contact time, ) between the fluid element and the thin film. Due to the limitation in
the measurements and the unavailability of techniques, only a few models for the
estimation of the contact time between the liquid elements and the thin film have been
proposed. Kumar and Fan, 1994 assumed that the absolute bubble rise velocity can be
taken as an estimate of the characteristic velocity of a fluid element near the heat transfer
surface. They obtained the absolute bubble rise velocity by following each bubble frame
by frame in the video recording over a certain distance. Therefore, during the heat-
transfer enhancement by the bubble wake, the time available for heating by conduction
before each fluid element passes the heat-transfer surface may be approximated. They
assumed that all the fluid elements renew the probe surface at the same rate hence there is
no distribution of residence time, which is in line with the penetration theory (Higbie,
1935). Thus, they proposed equation (5.18) to estimate the contact time in gas-liquid
(bubble columns) and gas-liquid-solid (slurry bubble columns) systems.
(5.18)
where is the vertical length of the heat flux sensor and is the bubble rise velocity. So
during this time, unsteady heat conduction occurs and starts at a distance from the heat
transfer surface equivalent to the thickness of the thin film. One of the main drawbacks of
this approach is that the video can only be used for transparent medium at very low gas
velocity, hence minimized applicability in systems requiring higher gas velocities
Yang et al., 2000 alongside Kumar and Fan, 1994 assumed that the contact time is
equal to the contact time between the bubbles and the film and used the same equation
Page 200
174
proposed by the latter (Equation 5.18). While using a cylindrical rod-type of the heat
transfer probe, Li and Prakash, 2001 assumed that the contact time, can be modeled as;
(5.19)
Where is the diameter of the cylindrical probe while is the rise velocity of large
bubbles. These approaches only provided single values for the contact time to obtain
single averaged value of heat transfer coefficient using the mechanistic model of
Equation (5.17). However, in the multiphase flow systems particularly bubble and slurry
bubble columns, at a particular superficial gas velocity, populations of bubbles and their
properties (velocity, size, passage frequency, specific interfacial area, local gas holdup)
exist (Xue et al., 2004, Youssef and Al-Dahhan, 2009). Unfortunately accounting for this
distribution has not been reported in the open literature. Theoretically with a reasonable
measurement approach, the distribution in the contact time can be obtained from the
above models.
In this work the distribution in the contact time estimation, boundary layer
estimation and heat transfer coefficient calculations using Equation (5.17) is assessed
using new approach in estimating contact time. In the measurements of local gas hold-up,
a number of studies have been done by fiber optical probes. Schweitzer et al, 2001 using
2 points optical fibers to measure local gas holdup in fluidized beds and slurry bubble
columns, demonstrated that the optical probe spends different amount of time in the gas
phase as it does in the liquid and pseudo-slurry phase. Detailed experimental studies by
Xue et al., 2004; Wu, 2007 and, Youssef and Al-Dahhan, 2009 have shown that the
optical probe stays for different times in the liquid as it does in the gas bubbles.
Moreover, the quantities of heat transfer coefficient and bubble dynamics vary along the
Page 201
175
diameter or radial and the height of the column (containment of the gas-liquid and gas-
liquid-solid systems).
Accordingly, local gas holdup is defined as the fraction of volume occupied by
gas within a certain volume of interest within the fluid mixture (Xue, 2004, Schweitzer et
al., 2001),
(5.20)
This same definition can be extended to local gas holdup for pseudo-slurry mixture as
well. By invoking the ergodic hypothesis, which states that “the ensemble average is
equivalent to the time average,” the spatially (volume) averaged local holdup can be
replaced by its equivalent time-averaged local holdup which is the ratio of the time the
probe tip spends in the gas bubbles to the sampling period thus.
(5.21)
Where and are the local gas holdup, time the fiber probe tip spends in the
bubble and time the probe spends in the liquid, respectively, during a sampling time .
Over such sampling time , bubbles hit the fiber probe tip. The average time spent by
the probe tip inside a bubble, is given by:
(5.22)
Similarly the average time the probe spends in the liquid element, becomes
(5.23)
Where, is the local liquid holdup
(5.24)
Page 202
176
Substituting Equations (5.22) and (5.24) into Equation (5.23) gives the contact time
between the thin film and the liquid element as:
( )
( )
⁄
⁄ (5.25)
It is worth noting that
is the inverse bubble passage frequency over the
optical fibers tip and hence, over the heat transfer probe surface when the optical probe
tips are mounted just off the heat flux sensor. This approach indeed shows that the
contact time is a function of the local liquid holdup or gas holdup as and
bubble passage frequency. Consequently, the variation of heat transfer coefficient with
the contact time is via the bubble passage frequency and the local phase holdups that are
determined by the bubble velocity, bubble sizes and the gas-liquid specific interfacial
area. Since by the hybrid measurements, local gas holdup and local bubble passage
frequency can be obtained, it is therefore possible to obtain the mean local contact time.
5.4. FILM THICKNESS ESTIMATION
The other parameter required in the mechanistic equation is the film thickness; δ.
The film thickness accounts for the heat transfer resistance. Border diffusion layer model
developed by Azbel, 1981, which is a modified film theory has been used by Kumar and
Fan, 1994 and Yang et al., 2000 to predict the film thickness, δ. In this work, this model
is used. According to this model, the distribution of the diffusing matter (mass or heat) in
a turbulent stream has a four-layer structure. Namely, the diffusion sublayer δ, which is
also known as the thermal boundary layer and is in contact with the solid interface,
followed by the laminar viscous sublayer δ0, then turbulent boundary layer and finally the
Page 203
177
main turbulent stream. According to Azbel, 1981 the relation between the diffusion
sublayer and the viscous sublayer is;
δ (
) ⁄
, (5.26)
where ν is the kinematic viscosity and α the thermal diffusivity. According to the
experimental data for liquid-solid interface flows, it has been found that 3 (Azbel,
1981). The thickness of laminar viscous sublayer, can be estimated by solving the
Prandtl’s boundary-layer equations; (Schlichting, 1968)
(5.27)
(5.28)
With the boundary conditions
Where U(x,t) is considered a known unsteady state potential flow to determine the
pressure distribution, according to Schlichting, 1968. Thus using the square dimensions
of the heat flux sensor utilized in this work as L=0.011 m leads to the thickness of
laminar sublayer as follows
(5.29)
Hence the film thickness also known as the thermal boundary layer, δ can be calculated
by combining Equations (5.26) and (5.29):
(5.30)
0
1-=
2
2
y
v
x
u
y
uv
x
p
y
uv
x
uu
t
u
t)U(x,u :y
0;vu :0
y
4/30Re
68.8 L
3/14/3 PrRe
68.8 L
Page 204
178
Where the Reynold’s number, and Prandtl’s number, are defined as
with the axial bubble velocity , bubble chord length ,
the liquid density, , liquid thermal conductivity, , liquid viscosity, and the specific
heat capacity of the liquid, .
Using equations (5.25), for contact time and (5.30), for film thickness into the
mechanistic equation (5.17) the predicted heat transfer coefficient can be obtained. It is
also possible that rather than single values calculated for the mean, a distribution of the
heat transfer coefficient can also be obtained.
5.5. RESULTS AND DISCUSSION
5.5.1. Contact Time Results and Discussion. Figures 5.2a, b show the contact
time radial profiles obtained from the measured bubble properties in the 6-inch and 18-
inch empty bubble columns respectively, at different superficial gas velocities. As
indicated in the above section, the contact time is estimated in this work from the bubble
passage frequency and local gas holdup, all of which are interrelated to the bubble sizes
and bubble velocity. From Figure 5.2 it can be seen that the contact time slope increases
continuously towards the column wall for both the 6-inch and 18-inch bubble columns
yielding much like parabolic profiles similar to the measured heat transfer coefficient and
the reported bubble velocity, frequency, local holdup and specific interfacial area. This is
an indication that the contact time determines the heat transfer rate as it depends on these
bubble properties. Close to the wall, higher contact times are estimated due to lower
bubble passage frequency and low gas holdup. The low gas holdup and low bubble
passage frequency leads to a lower rate of the heat transfer surface renewal.
Page 205
179
(a)
(b)
Figure 5.2 Effect of superficial gas velocity on radial profiles of contact time in empty
bubble columns (a) 6-inch diameter column and (b) 18-inch diameter column
Figure 5.3 shows a comparison of the contact time with some of the reported methods in
the literature. To obtain the contact time values predicted by the models of Kumar and
0
0.02
0.04
0.06
0.08
0.1
0.12
0.14
0 0.2 0.4 0.6 0.8 1
Ug = 8 cm/s
Ug = 20 cm/s
Ug = 45 cm/s
Conta
ct t
ime,
(s)
Dimensionless radius, r/R(-)
Page 206
180
Fan, 1994 and Li and Prakash, 2001, the length L, of the heat flux sensor and the
diameter of the heat transfer probe used in the current work has been utilized while the
bubble rise velocity measured by the four-points optical probe used in this work has been
used. As noted earlier on, at superficial gas velocities beyond 15 cm/s, the bubble
velocity does not change significantly. Thus the two models give relatively close values
to each other and remain nearly constant at 20 cm/s or more, since the length of the heat
flux and probe diameter are fixed, the only determinant of the contact time becomes the
bubble velocity. This represents clear shortcoming of such approach in estimating the
contact time because the contact time is expected to vary (decrease) with increased
superficial gas velocity where the mixing and circulation get enhanced. On the other
hand, the proposed model predicts lower contact times at higher range of superficial gas
Figure 5.3 Contact time comparison with the reported models for air water system in the
literature at the column center, r/R (-) = 0.0 in 18-inch diameter column
Page 207
181
velocity than those of the other two models of Kumar and Fan, 1994 and Li and Prakash,
2000. This difference can be attributed to the proposed model being able to capture the
change in contact time due to enhanced mixing and recirculation along with bubble
coalescence and breakage. Further increase in local gas holdup and bubble passage
frequency with superficial gas velocity is also reflected.
The distribution of estimated contact time is illustrated in Figure 5.4 for an 18-
inch empty bubble column at r/R (-) = 0 at two superficial gas velocities. The
significantly small variances point to the fact that there is little spread in the local holdup
and bubble passage frequency at the point of measurements thus narrow contact time
distribution. However, relatively wide spread in the contact time is observed at higher gas
velocity. This is due to the fact that at higher gas velocity, both the population of larger
and smaller bubbles up relative to lower gas velocity. Thus it is expected that the heat
transfer coefficient variation due to variation in contact time has a wider spread at higher
gas velocity.
The proposed contact time model, (equation 5.25) is simple but requires both the
measurements of bubble passage frequency as well as local gas holdup. An equation to
estimate the contact time is further proposed in Appendix D based on the model data.
5.5.2. Film Thickness Results and Discussion. For gas-liquid and gas-liquid-
solid systems it is believed that a thin liquid film of thickness, δ exists at the probe
surface and the mass of fluid brought by the bubble wake is viewed to exchange heat by
unsteady-state conduction at the outer edge of the film. The resistance to heat transfer is
due to the film (whose thickness depends on the liquid properties and the local
hydrodynamics) followed by penetration and unsteady-state heating of an element of the
Page 208
182
fluid. Thus, before the heat released from the probe can propagate very far in the lateral
direction, it is swept into the wake. The fluid elements brought by the bubble wake of
each bubble renew the probe surface, and the temperature of the fluid element sweeping
the outer surface of the film is assumed.
(a) (b)
(c)
Figure 5.4 Distribution of the predicted contact time in 18-inch bubble column at r/R (-) =
0.0 (a) at Ug = 8 cm/s (b) at Ug = 20 cm/s (c) Entire view of (a)
0 0.02 0.04 0.06 0.08 0.1 0.120
20
40
60
80
100
120
contact time,(s)
pdf
contact time distribution at 8 cm/s
0 0.02 0.04 0.06 0.08 0.1 0.120
20
40
60
80
100
120
contact time,(s)
pdf
contact time distribution at 20 cm/s
0 0.05 0.1 0.15 0.2 0.25 0.3 0.35 0.4 0.45 0.50
5
10
15
20
25
30
35
40
45
contact time,(s)
pdf
contact time distribution at 8 cm/s
Mean = 0.0159
Variance = 0.00005184 Mean = 0.006004
Variance = 0.00008281
Page 209
183
Figure 5.5 illustrates the radial profiles of the estimated film thickness in 18-inch bubble
column using Equation 5.30 and based on the bubble properties measured by the
combined measurements technique. Even though maximum film thickness is obtained
close to the column wall just like the contact time, with minimum at the column center,
radial profiles are not necessarily similar. Increasing Ug from 8 cm/s to 45 cm/s leads to
a decrease of film thickness by ~ 21 % and 9 % at the column center and wall region
respectively with an average decrease of 15 %. At the lower gas velocity (8 cm/s), the
wall region is also noted to have up to twice the film thickness at the column center and
up to 2.4 times at higher gas velocity (45 cm/s). These variations can be attributed to
higher local axial bubble velocity and liquid velocity and hence more intensity of mixing
which gives rise to smaller at the column center and at higher superficial gas velocity.
Figure 5.5 Effect of superficial gas velocity on radial profiles of estimated film thickness
in 18-inch empty bubble column.
Page 210
184
A parity plot obtained for the estimated film thickness for all the conditions of
operation employed in this work (Equation 5.30) with the film thickness estimated using
other correlations in the literature is shown in Figure 5.6. The other correlations used
were as follows;
Kumar and Fan, 1994 and Yang et al., 2000 both used the equation;
(5.31)
Figure 5.6 A parity plot of the estimated film thickness (Equation, 5.30) vs film thickness
estimated from correlations of Kumar and Fan, 1994, Yang et al., 2000 and
Li and Prakash, 2001 in bubble column
0
0.02
0.04
0.06
0.08
0.1
0.12
0.14
0 0.02 0.04 0.06 0.08 0.1 0.12 0.14
Fil
m t
hic
knes
s -
oth
er c
orr
elat
ions,
(m
m)
Film thickness - estimated, (mm)-Equation 5.30
3/14/3 PrRe
14.6 L
Page 211
185
They both defined Reynolds number and Prandtl’s number, respectively, as
, with L being the vertical length of the heat transfer probe
and the bubble rise velocity. In this case the length of the heat flux sensor used in the
current work has been utilized and the average upward bubble velocity measured by the
four-point optical probe in the hybrid measurement has been used as the bubble rise
velocity.
Li and Prakash, 2001 used a similar equation as above,
where is the probe diameter and is the Reynolds number based on the diameter of
the probe and defined as
with being the bubble rise
velocity of large bubbles. To obtain the bubble rise velocity of large bubbles, only the
upward bubble velocity of the bubbles whose chord lengths were larger than the mean
chord lengths were used. It is apparent that the differences between the predictions are
due largely to the Reynolds numbers. The statistical difference between estimated film
thickness the correlations of Kumar and Fan, 1994, Yang et al., 2000 and Li and Prakash,
2001 predictions are represented in terms of the average absolute relative difference
(AARD) and absolute relative difference (ARD) and are defined as follows;
∑|
|
|
|
Page 212
186
It was determined that the film thickness predicted by other correlations (Kumar and Fan,
1994, Yang et al., 2000 and Li and Prakash 2001) those estimated in the current work
(Equation, 5.26) lie close to each other with an AARD of 15 %.
At any given superficial gas velocity, bubbles are formed of different sizes which
move at different velocities hence a distribution in the bubble velocities and bubbles sizes
(which are characterized by the bubble chord lengths). The distribution plots of the axial
bubble velocity are provided in Appendix C. In Equation 5.29, the Reynolds number is a
function of both axial bubble velocity and bubble chord lengths which have distributions.
Thus a distribution of estimated film thickness is obtained as shown in Figure 5.7. A near
statistical similarity is observed in the distributions with little difference in variance. As
expected smaller film thickness is obtained at Ug = 20 cm/s than at Ug = 8 cm/s
(a) (b)
Figure 5.7 Distribution of the estimated boundary layer thickness in 18-inch bubble
column at r/R (-) = 0.0 (a) at Ug = 8 cm/s (b) at Ug = 20 cm/s
0 0.05 0.1 0.15 0.2 0.250
5
10
15
20
25
30
Film thickness,(mm)
pdf
Film thickness distribution at 8 cm/s
0 0.05 0.1 0.15 0.2 0.250
5
10
15
20
25
30
Film thickness,(mm)
pdf
Film thickness distribution at 20 cm/s
Mean = 0.0400
Variance = 0.00042
Mean = 0.0354
Variance = 0.00064
Page 213
187
5.5.3. Heat Transfer Coefficient Results and Discussion. The effect of
superficial gas velocity on radial profiles of the predicted heat transfer coefficient is
presented here. Figure 5.8 compares the time averaged instantaneous heat transfer data
estimated by Equation 5.16 at different radial locations from the center to the column
wall for an air-water system for the gas velocity of 8 cm/s, 20 cm/s and 45 cm/s. It is
observed that steepness of the radial profiles with superficial gas velocity increases from
low gas velocity to higher gas velocity. For instance, at Ug = 8 cm/s the radial profile has
an average steepness of 1.2 towards the column wall and this increases to 2.0 at Ug = 20
cm/s and 2.4 at Ug = 45 cm/s. This is consistent with the results of discussed bubble
properties, such as Figure 4.10b. Higher values are thus predicted at the centre which
could be attributed to higher local turbulence generated by higher wake intensity due to,
higher gas holdup and bubble frequency, lower film thickness, faster moving bubbles in
Figure 5.8 Effect of superficial gas velocity on radial profiles of predicted heat transfer
coefficient in 18-inch empty bubble column
Page 214
188
the central region of the column. Further to that it has been demonstrated that large
bubbles move towards the column center with higher velocity while smaller bubbles
move closer to the wall region downwards at lower velocity. It has also been
demonstrated that the bubble passage frequency and gas holdup are much higher at
column center and increase towards the column center. This higher bubble frequency and
hold up leads to shorter contact times and thinner films on the heat transfer surface thus
enhancing the rate of renewal of the heat transfer surface.
It is worth to note at this point that there are several studies reported in the
literature about the parabolic profiles of the gas hold up as well as liquid velocity, (Hills,
1974; Ueyama et al., 1980; Nottenkamper et al., 1983, Wu and Al-Dahhan, 2001; Luo
and Svendsen, 1991, Shaikh, 2007). The parabolic shape of radial heat transfer profiles
are generally similar to radial profiles of gas holdup and liquid velocity reported in
literature studies, but it should be noted, however, that heat transfer is affected by both
liquid velocity and turbulence generated by bubbles among other bubble properties.
Hence, a direct comparison with gas holdup, liquid velocity or any other bubble property
profiles is not appropriate and may be misleading. The general however indicates that the
wall region is relatively free of large bubbles or faster moving chain of bubbles. Indeed
the measured bubble diameter is smaller near the wall region and larger in the center. The
smaller diameter bubbles near the wall would have smaller wakes associated with them,
resulting in a lower local heat transfer coefficient.
Figure 5.9 shows a comparison of the mean predicted heat transfer (Equation
5.16) coefficient values with the measured. The predicted heat transfer coefficients were
obtained based on the bubble properties measured at the same time as the measurements
Page 215
189
of the heat transfer coefficient using the heat transfer probe. At 8 cm/s the predicted heat
transfer coefficient shown in Figure 5.10 are 7.3 % and 6.1 % higher than measured at the
column center region (r/R≤0.3) and at the column wall region (r/R≥0.6), respectively.
These differences increase further with gas velocity. At 45 cm/s an increase of 11.3 %
and 9 % is noted. At the column center and higher gas velocity, much shorter contact
times are estimated by the new model. At such short contact times, shorter than the
response time of the heat flux probe, the heat transfer wake-enhanced phenomenon
cannot be captured by the heat transfer probe. At the column wall region, relatively
longer contact times are estimated. Nevertheless, the estimated heat transfer coefficient
still fall within 12 % of the measured ones.
Figure 5.9 Comparison of the predicted heat transfer coefficient (Equation 5.16) with the
measured heat transfer coefficient values in 18-inch bubble column without
internals
3
4
5
6
7
8
9
0 0.2 0.4 0.6 0.8 1
Experimental at Ug = 8 cm/s Predicted at Ug = 8 cm/s
Experimental at Ug = 45 cm/s Predicted at Ug = 45 cm/s
Dimensionless radius, r/R (-)
Hea
t tr
ansf
er c
oef
fici
ent,
hw (
kW
/m2.K
)
Page 216
190
To understand the comparative performance of the proposed model, a parity plot
is used as illustrated in Figure 5.10. Figure 5.10 shows the predictions of the proposed
model compared against the experimental data of the measured heat transfer coefficient
using the fast response heat transfer probe developed and utilized in this work for a wide
range of operating conditions, with the needed model parameters obtained from the
hybrid technique measurements. To further assess the performance of the correlation
model predictions statistically, the average absolute relative error (AARE) has been used
and is calculated as follows:
∑|
|
Figure 5.10 A parity plot of the predicted heat transfer coefficient-(Equation 5.16) vs the
measured heat transfer coefficient values in the bubble columns at the same
operating conditions
4
5
6
7
8
9
4 5 6 7 8 9hw, (kW/m2.K), Experimental
hw, (k
W/m
2.K
), P
redic
ted
Page 217
191
A very good agreement within 13 % was found between the predicted and the
experimental values of heat transfer coefficient, in spite of the fact that the model over
predicts the heat transfer coefficient at all the evaluated conditions. One of the main
reasons why proposed model over predicts the heat transfer coefficient is that the new
approach of estimating the contact time (Equation 5.24) predicts up to very low values of
contact time. In fact, at 20 cm/s in 18-inch column, the estimated contact is 0.006, which
is almost an order of magnitude less than the response time of the heat flux and
temperature sensor.
5.5.4. Heat Transfer Coefficient and Bubble Dynamics Distribution. The
reported heat transfer coefficient in the open literature shows the average values only.
However in an industrial system at the same superficial gas flow rate, the values over
time vary significantly. With distributions in the measured bubble properties as well as in
both the contact time and film thickness, it is therefore possible that a distribution of the
predicted heat transfer coefficient can be obtained. The simulated distribution was
extracted from experimental data collected for a period of 90 seconds. In Figure 5.11 it is
demonstrated that there is distribution of heat transfer coefficient both at 8 cm/s and at 20
cm/s. In fact a wider distribution in the heat transfer coefficient is reported at higher
superficial gas velocity than lower gas velocity. Figure 5.12 and Figure 5.13 show the
histogram for probability distribution of bubble chord lengths and axial bubble velocity
respectively, at 8 cm/s and 20 cm/s in 18-inch diameter column without internals for an
air-water system. At higher gas velocity there is growth in population of both large and
small bubbles hence a wider spread of the bubble sizes (chord lengths). The different
sizes of bubbles move at different velocities that creates different intensities of the heat
Page 218
192
(a) (b)
Figure 5.11 Histogram of the probability distribution of predicted heat transfer coefficient
in 18-inch empty bubble column at r/R = 0.0 (a) Ug = 8 cm/s (b) Ug = 20
cm/s.
(a) (b)
Figure 5.12 Histogram of the probability distribution of bubble chord lengths in 18-inch
empty bubble column at r/R = 0.0 (a) Ug = 8 cm/s (b) Ug = 20 cm/s.
1 2 3 4 5 6 7 8 9 10 110
0.05
0.1
0.15
0.2
0.25
0.3
0.35Heat transfer coefficient distribution
hw
(kW/m2.K)
pro
babili
ty
1 2 3 4 5 6 7 8 9 10 110
0.05
0.1
0.15
0.2
0.25
0.3
0.35Heat transfer coefficient distribution
hw
(kW/m2.K)
pro
babili
ty
0 1 2 3 4 5 60
0.5
1
1.5Chord length probability distribution
chord length, (cm)
pro
babili
ty
0 1 2 3 4 5 60
0.5
1
1.5Chord length probability distribution
chord length, (cm)
pro
babili
ty
Mean = 6.4073
Variance = 1.0860
Mean = 7.5128
Variance = 2.2783
Mean = 0.742
Variance = 0.8427 Mean = 0.8690
Variance = 0.9837
Page 219
193
(a) (b)
Figure 5.13 Histogram of the probability distribution of the axial bubble velocity in 18-
inch empty bubble column at r/R = 0.0 (a) Ug = 8 cm/s (b) Ug = 20 cm/s.
transfer surface renewal rate. It should also be pointed out that some of the smaller
bubbles are entrained and dragged in the wake of larger ones and move at nearly same
velocity as of the large bubbles. The mean of the distribution of heat transfer coefficient
was found to be 1.8 % and 3.1 % higher than the predicted average at Ug = 8 cm/s and 20
cm/s, respectively
5.6. REMARKS
For the first time a correlation based on the local bubble properties has been
proposed and used to estimate the contact time needed in the mechanistic approach
equation and successfully implemented in the heat transfer estimation.
The mechanistic analysis shows that the contact time between the thin film and
the liquid elements is a function of the local phase holdup and bubble passage frequency
0 0.5 1 1.5 2 2.5 3 3.5 4 4.50
0.05
0.1
0.15
0.2
0.25
0.3
0.35
0.4Axial bubble velocity distribution
Ub,axial
(m/s)
pro
babili
ty
0 0.5 1 1.5 2 2.5 3 3.5 4 4.50
0.05
0.1
0.15
0.2
0.25
0.3
0.35
0.4Axial bubble velocity distribution
Ub,axial
(m/s)
pro
babili
ty
Mean = 1.532
Variance = 3.920
Mean = 1.8045
Variance = 5.371
Page 220
194
all which are dependent on other bubble properties such as the specific interfacial area,
bubble sizes and bubble velocity.
The heat transfer coefficient depends upon the combined effects of bubble
parameters including; bubble frequency, local gas hold-up, bubble velocity and their
distributions over the heating surface.
The variation of the local time averaged heat transfer coefficient with the contact
time is via the bubble passage frequency and the local phase hold-ups.
Page 221
195
6. EFFECT OF SCALE ON THE HEAT TRANSFER COEFFICIENT AND
BUBBLE DYNAMICS IN BUBBLE AND SLURRY BUBBLE COLUMNS
This Section addresses the effect of column diameter on the heat transfer
coefficient, local and overall gas holdup, bubble velocity, bubble frequency, and specific
interfacial area in pilot-scale bubble and slurry bubble columns. The experimentally
measured heat transfer coefficient and bubble dynamic parameters were obtained using
the combined measurement techniques of both the heat transfer probe and 4-point optical
probe in the presence and absence of dense internals and different solids loading.
6.1. SCOPE
Most of the reported studies in the literature on bubble columns have been
performed on laboratory scale reactors mostly in diameters of about 0.25 cm (Krishna et
al., 2001). However, the required large gas throughputs, necessitates the use of large-
diameter reactors (typically in the range 5-10 m), and often in parallel, while tall reactors
are desired to achieve high levels of conversion, (Krishna et al., 1997). The bubble
column diameter is an important design parameter for bubble columns, especially in
processes involving higher volumetric productivity such as methanol synthesis and the F-
T process. Accordingly, the effect of column diameter has been a subject of extensive
studies in the last few decades, resulting in a large volume of experimental data under a
wide range of operating conditions. Despite all the efforts, none of these studies has
attempted to address the effect of the column diameter on both the heat transfer rate and
bubble dynamics simultaneously in the presence of dense vertical cooling internals and or
solids of high loading.
Page 222
196
Previous work has revealed that the presence of internals alters the flow field and
has effects on the liquid velocity profiles (Bernemann, 1989; Chen et al., 1999, and Forret
et al., 2003), bubble dynamics (Youssef, 2010, Chapter 3 of this work), bubble velocity
profiles (Hamed, 2012), and turbulent intensities (Chen et al., 1999 and Forret et al,
2003), heat transfer coefficient, (Abdulmohsin and Al-Dahhan, 2012; Chapter 4 of this
work). Several studies in the literature also indicate that increasing column diameter
affects the hydrodynamics and hence the transport parameters such as heat transfer and
mass transfer rates (Kolbel et al., 1958; Koide et al., 1979; Degaleesan, 1997; Li and
Prakash, 2000; Krishna, 2000; Krishna et al., 2001; and Krishna and van Baten, 2002;).
Although bubble columns are relatively simple in mechanical construction, the
task of extrapolating small diameter columns behavior to larger ones is always
challenging, delicate and difficult. The extrapolation of data obtained in laboratory scale
units to the commercial scale reactors requires a systematic approach based on the
understanding of the scaling principles of bubble dynamics and of the behavior of two-
phase dispersions and three-phase dispersions in large scale columns. Shaikh and Al-
Dahhan, 2010; observed that the key to such extrapolation is the proper understanding of
the complex hydrodynamic behavior because the dispersion and interfacial heat and mass
transfer which often limit the chemical reaction rates are closely related to fluid dynamics
of the system through gas–liquid contact area and the turbulence properties of the flow.
Thus, the influence of the diameter on the hydrodynamics is important so that the
design correlations and models developed at laboratory scale can be extrapolated and
confidently used to the satisfaction of the industrial scale needs. Whereas several
researchers have investigated the influence of scale on gas hold-up, Shah et al., 1982;
Page 223
197
Greary and Rice, 1992; Vandu and Krishna to mention a few, little attention has been
paid to the influence of scale on other hydrodynamic parameters such as the bubble sizes,
bubble velocity, local gas holdup as well as heat transfer. As outlined in chapter 3 and by
a few other researchers, Xue et al., 2008; Wu, 2007 and Youssef and Al-Dahhan, 2009,
these bubble properties are closely related. Hence, an understanding of the column
diameter effect on their variation together with the accompanying influence on the heat
transfer rates and coefficient in bubble and slurry bubble columns still requires close
scrutiny.
For the commercial design or scale-up of the slurry bubble column reactor, an
understanding of the flow behavior of bubbles with increasing column diameter is
essential, because the similarity of bubble properties should be adjusted with increasing
column diameter. It has been generally understood that in dynamic flow systems such as
slurry bubble column reactors, the hydrodynamic stability and similarity have to be
controlled and adjusted to provide the heterogeneous reactants with plausible conditions
for effective contacting and reaction (Behkish et al., 2007; Zhang Zhao, 2006; Mirzaei et
al., 2006; Duvenhage and Shingles, 2002; Gandhi et al., 1999).
Though bubble columns are easy to construct, the complexity of flow patterns and
mixing in bubble columns, optimal design and sound scale-up procedures are still not
fully understood (Deckwer and Schumpe, 1993; Li and Prakash, 2002). Furthermore, the
flow behavior changes dramatically with the inclusion of heat exchanging internals,
(Youssef, 2010; Bernemann, 1989; Shah et al., 1978; and Kafarov, 1975). Whereas
bubble dynamics and heat transfer rate in bubble columns have been subjects of studies
for decades, only a handful have investigated the effects of bubble properties on the heat
Page 224
198
transfer coefficient on columns of different sizes, including (Saxena et al., 1989, Jhawar
2012). However, not a single work has been reported in the open literature (at least within
our knowledge) on the effect of column diameter as well as solids loading effects on the
bubble dynamics and subsequently their effect on the heat transfer coefficient in bubble
columns equipped with dense heat exchanging internals. Therefore the core of this work
is to experimentally assess the effect of column diameter and solids volume fraction on
the heat transfer coefficient and bubble dynamics including the local and overall gas
holdup, axial bubble velocity, specific interfacial area and bubble passage frequency. In
order to achieve this, a combined measurements technique is used as described in the
experimental section. Both the heat flux and the bubble dynamics are measured
simultaneously to avoid effects of changing experimental operating conditions.
In this chapter, the effect of bubble column diameter on bubble dynamics and heat
transfer characteristics in slurry bubble columns is presented and analyzed based on
mainly data obtained from the experimental work done in 6-inch and 18-inch bubble
columns. The two different column diameters were used at atmospheric pressure and
room temperature to study overall and local gas hold-up, bubble velocity, bubble
frequency, and bubble chord-lengths, and the heat transfer coefficient.
6.2. EXPERIMENTAL SETUP
The experiments were conducted in two scales of Plexiglas columns. The smaller
scale was a 6-inch (0.14 m) inside diameter and 1.8 m height with dynamic bed height in
all the experiments, maintained constant at a level of 1.56 m (z/D = 11.16) above the gas
distributor by adjusting the amount of liquid, and liquid-solids loaded in the column. The
Page 225
199
Figure 6.1 Schematic of the experimental structure and mimicked dense heat exchanging internals in both the 6-inch diameter column
and 18-inch diameter column
199
Page 226
200
larger scale consisted of an 18-inch (0.44 m) inside diameter and 3.66 m height with
dynamic bed height in all the experiments, maintained constant at a level of 2.67 m (z/D
= 6.0) above the gas distributor by adjusting the amount of liquid, and liquid-solids
loaded in the column. A typical schematic diagram of the experimental setup for all the
experimental work in this study with dense internals is shown in Figure.6.1. In this
study, compressed filtered oil-free dry air introduced continuously from the bottom of the
columns was used as the gas phase. Soft filtered tap water was used as liquid phase. Glass
beads with an average size of 150 µm and density of 2500 kg/m2 was used as the
solids/fines phase. The solids loading is based on the wet volume-which is the volume of
the glass beads together with the liquid in the pores. Since the glass beads used is
nonporous, the wet volume was simply same as the volume of non-soaked beads and the
concentrations varied between 0 % vol – 25 % vol. The solids volume fraction was
defined as;
In both units perforated plates with triangular pitch hole pattern (6-inch column)
and square pitch hole pattern (18-inch column) with a total free area of 1.09 % was used
as the gas distributors. The superficial gas velocities were from 0.03 to 0.45 m/s based on
free cross-sectional area of the column covering both the bubbly and churn turbulent flow
regimes. The superficial gas velocities were from 0.03 to 0.45 m/s based on the free
cross-sectional area (CSA) of the column available for the flow.
The internals used in this study were vertical Plexiglas rods of 0.5 inch and 1 inch
diameter (in the small scale column and the large scale column respectively) occupying
25 % of the column cross-sectional area that simulates the Fischer-Tropsch synthesis
Page 227
201
process. Combined probes was used to simultaneously measure the local heat flux and
surface temperature and the local bubble properties, including local gas hold up, bubble
passage frequency, axial bubble velocity, specific interfacial area, as well as the bubble
chord lengths which is characteristic of bubble sizes. The description of the combined
probes has been given in Section 3 and Section 4.
The experimental conditions for the bubble dynamics and heat transfer
measurements employed covered a wide range of superficial gas velocities in the
homogenous and churn turbulent flow regimes, in the presence and absence of dense
internals as summarized in Table 6.1 using an air-water system and air-water glass-beads
system.
Table 6.1 Experimental conditions for the effect of column diameter
Dc (m) Internals (% CSA) Solids (% vol) Radial Positions
0.14 0.0 % 0.0 % r/R(-) = 0.0, 0.3, 0.5, 0.6, 0.9
0.14 0.0 % 9.1 % r/R(-) = 0.0, 0.3, 0.5, 0.6, 0.9
0.14 0.0 % 25 % r/R(-) = 0.0, 0.3, 0.5, 0.6, 0.9
0.14 25 % 0.0 % r/R(-) = 0.0, 0.3, 0.5, 0.6, 0.9
0.14 25 % 9.1 % r/R(-) = 0.0, 0.3, 0.5, 0.6, 0.9
0.14 25 % 25 % r/R(-) = 0.0, 0.3, 0.5, 0.6, 0.9
0.44 0.0 % 0.0 % r/R(-) = 0.0, 0.3, 0.5, 0.6, 0.9
0.44 0.0 % 9.1 % r/R(-) = 0.0, 0.3, 0.5, 0.6, 0.9
0.44 0.0 % 25 % r/R(-) = 0.0, 0.3, 0.5, 0.6, 0.9
0.44 25 % 0.0 % r/R(-) = 0.0, 0.3, 0.5, 0.6, 0.9
Page 228
202
Table 6.1 Experimental conditions for the effect of column diameter (cont.)
0.44 25 % 9.1 % r/R(-) = 0.0, 0.3, 0.5, 0.6, 0.9
0.44 25 % 25 % r/R(-) = 0.0, 0.3, 0.5, 0.6, 0.9
6.3. RESULTS AND DISCUSSION
In order to elucidate the effects of column diameter on heat transfer coefficient
and bubble dynamics, the heat transfer data as well as bubble dynamics data of this study
obtained in two pilot scale bubble columns of 6-inch (0.14 m) and 18-inch, (0.44 m)
diameters are compared against each other. The effect of column diameter on the heat
transfer coefficient is presented in light of the observed variation of the different bubble
properties with the column diameter.
6.3.1. Effect of Column Diameter on the Heat Transfer Coefficient and
Bubble Dynamics in Columns without Internals and without Solids. First, the effect
of column diameter is discussed for empty bubble columns without solids. This should
form a basis of comparison when solids are used.
6.3.1.1. Effect of column diameter on the heat transfer coefficient. The effect
of column diameter on heat transfer coefficient has been studied by a few researchers
including Jhawar and Prakash, 2011 and Saxena et al., 1989, 1990. To analyze the effect
of column diameter on the heat transfer coefficient, the experimental data obtained from
this study in two diameter columns are compared against each other. Figure 6.2 shows a
comparison of the measured local time-averaged heat transfer coefficients in 6-inch and
those obtained in 18-inch empty bubble columns for air-water systems in this work.
Page 229
203
While Figure 6.3 shows the effect of column diameter and superficial gas velocity on the
related bubble properties. It is noted that in both the columns, the heat transfer coefficient
increases sharply up to Ug = 25 cm/s beyond which the rate of increase slows down.
Increasing superficial gas velocity leads to increased bubble frequency, and bubble
population and gas hold-up as well as the bubble chord length (which is characteristic of
the bubble sizes) and axial bubble velocity. Below Ug = 25 cm/s, an increase in Ug leads
to an average increase of 9 % and 7.5 % in the heat transfer coefficient in 6-inch and 18-
inch columns, respectively. While from 25 cm/s onwards an average increase of 1.3 %
and 1.8 % in the heat transfer coefficient in 6-inch and 18-inch columns respectively are
attained. Similar trends have been observed in the related bubble dynamics shown in
Figure 6.3.
Figure 6.2 Effect of column diameter and superficial gas velocity on measured heat
transfer coefficient for an air-water system without internals
3
3.5
4
4.5
5
5.5
6
6.5
7
7.5
8
0 10 20 30 40 50
6-Inch-No Solids
18-Inch-No Solids
Superficial gas velocity, (cm/s)
Hea
t tr
ansf
er c
oef
fici
ent,
hw(k
W/m
2.K
)
Page 230
204
(a) (b)
(c) (d)
Figure 6.3 Effect of column diameter on bubble properties (a) Local gas holdup
(b) Bubble passage frequency (c) Mean bubble chord length and
(d) Axial bubble velocity at the column center, (r/R = 0.0) for an air-
water system without internals at different superficial gas velocities
Whereas the local gas holdup and bubble passage frequency in both 6-inch and
18-inch columns increase almost linearly with the gas velocity, the mean bubble chord
length increases with Ug until it is in deep churn-turbulent flow and then remains almost
identical with increasing Ug. A sharp increase in the chord length with Ug is realized in
the 6-inch column compared to the 18-inch at lower gas velocities. Similarly the increase
20
25
30
35
40
45
50
55
60
0 10 20 30 40 50
No Solids-6-Inch
No Solids-18-Inch
Superficial gas velocity, (cm/s)
Lo
cal gas
ho
ldu
p, (%
)
40
60
80
100
120
140
160
180
200
0 10 20 30 40 50
No Solids-6-Inch
No Solids-18-Inch
Superficial gas velocity, (cm/s)
Bu
bb
le p
assa
ge
freq
uen
cy,
(s-1
)
0.5
0.6
0.7
0.8
0.9
0 10 20 30 40 50
No Solids-6-Inch
No Solids-18-Inch
Superficial gas velocity, (cm/s)
Mea
n b
ub
ble
ch
ord
len
gth
, (c
m)
40
60
80
100
120
140
160
180
200
0 10 20 30 40 50
No Solids-6-Inch
No Solids-18-Inch
Superficial gas velocity, (cm/s)
Axia
l b
ub
ble
vel
oci
ty,
(cm
/s)
Page 231
205
in gas velocity below 25 cm/s leads to an average increase in axial bubble velocity of 15
% and 8 % in 6-inch and 18-inch columns respectively. Beyond Ug = 25 cm/s an average
increase in axial bubble velocity of 2.4 % and 1.6 % in 6-inch and 18-inch columns are
attained.
The effect of the column diameter on the radial profiles of heat transfer
coefficient at higher superficial gas velocities for an air-water system is shown in Figure
6.4. The heat transfer coefficient radial profiles obtained in the 18-inch column are
generally larger than those in the 6-inch at the same operating condition with the
difference getting smaller towards the column wall region. At 20 cm/s, the larger column
has up to 10 % higher heat transfer coefficient at the column core region (r/R ≤ 0.3) and
2.5 % at the column wall region (r/R≥ 0.6). At 45 cm/s the difference is even more, with
14 % higher at the column core region, r/R ≤ 0.3 and 9 % higher at the column wall
region, r/R≥ 0.6. This can be attributed to higher mixing intensity achieved in the larger
column with increased gas velocity relative to the smaller column. Similar findings have
been reported by other researchers including; Jhawar and Prakash, 2011; Saxena, 1990.
Saxena et al., 1989 used a 1.9 cm diameter probe of conventional design placed at
column center and compared the results obtained in the central region of bubble columns
of 0.108 m and 0.305 m diameter. These authors observed a similar increase in heat
transfer with column diameter and attributed it to better mixing achieved with large
diameter.
The enhancement of the heat transfer coefficient with increased column diameter
can be attributed to combined effects of; (i) increased gas holdup, Figure 6.5-6.6 ii)
increased bubble passage frequency, Figure 6.7a, iii), increased specific interfacial area
Page 232
206
per unit volume, Figure 6.7b iv) increased bubble velocity Figure 6.8 as well as, v)
increased axial liquid circulation velocity (Figure 6.8), a subject of other study in our
laboratories, Al-Mesfer, 2013. The effects of the column diameter on the overall gas
holdup and on the radial profiles of the relevant bubble dynamics are discussed in the
next section (Section 6.3.1.2-6.3.1.3).
Figure 6.4 Effect of column diameter on radial profiles of heat transfer coefficient
at different superficial gas velocities for an air-water system without
internals
6.3.1.2. Effect of column diameter on the local and overall gas holdup. The
overall gas holdup was determined by bed expansion method as described in Section 3. A
comparison of the overall gas holdup measured in the two columns shows that the overall
gas hold up is higher in the larger column for all the superficial gas velocities Figure 6.6.
The difference diminishes at low gas velocity, but remains significant in the churn
4
4.5
5
5.5
6
6.5
7
7.5
0 0.2 0.4 0.6 0.8 1
No Solids-6-Inch at 20 cm/s No Solids-18-Inch at 20 cm/s
No Solids-6-Inch at 45 cm/s No Solids-18-Inch at 45 cm/s
Dimensionless radius, r/R(-)
Hea
t t
ransf
er c
oef
fici
ent,
hw(k
W/m
2.K
)
Page 233
207
turbulent flow regime. The estimated overall gas holdup in the larger column is higher
than that in smaller column. A few findings reported in the literature point to a decrease
in overall gas holdup with column diameter, Krishna et al., 1997. Wu, 2007 indicated that
the column diameter effect ceases for columns of diameter greater than 15 cm.
Figure 6.5 Effect of column diameter and superficial gas velocity on overall gas holdup.
The radial profiles of the local gas holdup are shown in Figure 6.6 to give insight
into how the column diameter affects the local variations in gas holdup. At 20 cm/s up to
12 % higher gas holdup is attained in 18-inch column than in the 6-inch at the column
core region while a 19 % higher at the column wall region, with an average radial gas
holdup increase of 16 %. When the gas velocity is increased to 45 cm/s, higher gas
holdup which is 10 % more than in the smaller column is attained at the column core
while up to 30 % higher gas holdup is attained in the larger column than the smaller
0
10
20
30
40
50
0 10 20 30 40 50
No Solids-6-Inch
No Solids-18-Inch
Superficial gas velocity, Ug(cm/s)
Over
all
gas
hold
up, (%
)
Page 234
208
column in the column wall region, with 22 % higher gas holdup on the average attained
than in the 6-inch column. This indicates that with the overall increase in bubbles
population with gas velocity, the growth in number of smaller bubbles which tend to
move closer to the column wall is much higher in the larger column than in the smaller
column.
Figure 6.6 Effect of column diameter on the radial profiles of local gas holdup at different
gas velocities in empty columns for air-water systems
6.3.1.3. Effect of column diameter on the bubble passage frequency and
specific interfacial area. Few studies have examined the bubble passage frequency in
bubble columns, (Xue, 2004, Wu, 2007, Shin et al., 2009, and Youssef and Al-Dahhan,
2010). However, only Shin et al., 2008, reported the effect of column diameter on the
bubble passage frequency. Figure 6.7 presents the effect of column diameter on the radial
5
15
25
35
45
55
65
0 0.2 0.4 0.6 0.8 1
No Solids-6-Inch at 20 cm/s No Solids-18-Inch at 20 cm/s
No Solids-6-Inch at 45 cm/s No Solids-18-Inch at 45 cm/s
Dimensionless radius, r/R(-)
Loca
l gas
hold
up, (%
)
Page 235
209
profiles of bubble passage frequency (Figure 6.7a) and Specific interfacial area (Figure
6.7b) at different gas velocities in bubble columns for air-water systems. It is observed
that the bubble passage frequency is significantly higher in the column of larger diameter
particularly at the column core. This is due to large population of bubbles injected in the
larger column. The radial profiles of bubble passage frequency, like gas holdup is
governed by bubble slip velocity generated by the net radial force and turbulent
dispersion, thus most of the bubbles move towards column center.
Measurements spanning the diameter of the column show that higher interfacial
area exists in the center of the column with gradual decrease towards the column wall
region. Since the bubble frequency, gas holdup, and specific interfacial area are
interwoven parameters, one can confidently expect that an increase in both gas holdup
and interfacial area will result with an increase in bubble passage frequency. It is clear
from Figure 6.7b that the interfacial area increases with superficial gas velocity. The
specific interfacial area largely depends on the shape of the bubbles. Ellipsoidal, spherical
cap, and skirted bubbles (Bhaga and Weber, 1981), as well as very irregular bubble
shapes, are found deep in the churn turbulent flow regime as a result of coalescence and
break-up phenomena, hence the higher interfacial area at 45 cm/s relative to 20 cm/s.
It was found that larger interfacial area existed at the column’s center than in the
region near the wall, which is similar to the findings of Xue, 2004, Xue et al., 2008,
Youssef and Al-Dahhan, 2009 and Youssef, 2010. This difference is due to enhanced
rates of breakup and coalescence among bubbles in the central region of the column in
the churn turbulent flow regime, which was confirmed by the bubble frequency measured
by the optical probe, shown in Figure 6.7a. An increase in bubble passage frequency
Page 236
210
(a)
(b)
Figure 6.7 Effect of Column diameter on the radial profiles of (a) Bubble passage
frequency and (b) Specific interfacial area at different gas velocities in
empty columns for air-water systems
leads to increase in specific interfacial area. The same trend was observed and explained
by Wu, 2007 in empty bubble columns. The rate of bubble coalescence and breakup is
0
20
40
60
80
100
120
140
160
180
200
0 0.2 0.4 0.6 0.8 1
No Solids-6-Inch at 20 cm/s
No Solids-18-Inch at 20 cm/s
No Solids-6-Inch at 45 cm/s
No Solids-18-Inch at 45 cm/s
Dimensionless radius, r/R(-)
Bu
bb
le p
assa
ge
freq
uen
cy, (s
-1)
0
0.5
1
1.5
2
2.5
3
3.5
4
4.5
5
5.5
0 0.2 0.4 0.6 0.8 1
No Solids-6-Inch at 20 cm/s No Solids-18-Inch at 20 cm/s
No Solids-6-Inch at 45 cm/s No Solids-18-Inch at 45 cm/s
Dimensionless radius, r/R(-)
Spec
ific
inte
rfac
ial
area
, cm
2/c
m3)
Page 237
211
more intense in the larger diameter column due to higher turbulence and mixing attained.
This is further confirmed by the more steep radial profiles of gas holdup in the 18-inch
column. Hence higher interfacial area is attained in the 18-inch column than in the 6-inch
at the studied gas velocities. In fact at 20 cm/s the 18-inch diameter gave a radial average
of 37 % higher interfacial area. While up to 81 % higher radial specific interfacial area
was attained in the 18-inch than the 6-inch column at 45 cm/s. Thus the effect of column
diameter on the interfacial area increases with the superficial gas velocity in empty
columns.
6.3.1.4. Effect of column diameter on the radial profiles of axial liquid
velocity. It has been demonstrated by Gupta, 2002 and Hamed, 2012 that at any given
location (r,Z), the axial bubble velocity , depends mainly on two factors: the local
liquid velocity, and the local slip velocity, at that location, (Equation 6.2).
(6.2)
While a number of studies have reported the variation of the liquid axial velocity with
increased column diameter, (Degaleesan, 1997; Forret et al., 2003; and Krishna and Sie,
2000). Forret et al., 2006 demonstrated that the axial liquid circulation velocity increased
with column diameter. The increase in column diameter increases turbulence which
causes an increase in the liquid velocities (Kumar, 1994 and Degaleesan, 1997). In order
to demonstrate the column diameter effect on the large scale axial liquid velocity profiles,
the following equation proposed by Wu and Al-Dahhan, 2001 for bubble columns
without solids is employed;
[ (
)
] (6.3)
Page 238
212
With the value of the liquid velocity radial profile steepness parameter, m and wall
holdup parameter, c obtained from the following dimensionless groups which were
determined by fitting the experimental data of computer automated radioactive particle
tracking (CARPT) data. The correlation was developed based on the data obtained in
(6.4a)
(6.4b)
( )
( )
columns without internals. Where LOV is the centerline axial liquid velocity in the bubble
column which can be obtained from either experiments or correlations. In the current
work, the centerline liquid velocity has been determined using the correlation of Riquarts,
1981 (Equation 6.5). Since it is not only easy to use but also gives centerline liquid
velocity which is in close agreement with a good number of correlations in the literature,
more so the artificial neural network (ANN) of Shaikh, 2007 that uses data obtained at a
wide range of operating and design conditions in bubble columns.
(
)
Since liquid measurement was not carried out in the current work, only the simulations
obtained from the correlation have been presented.
Figure 6.8 illustrates the simulated radial profiles of the axial liquid velocities for
6-inch and 18-inch columns without solids or internals. The axial liquid velocity in the
18-inch column is significantly higher than that of 6-inch column. Particularly at the
column center ~ 1.7 times that of the 6-inch column. With such increase in the axial
liquid velocity with column diameter, an enhanced mixing is attained in the larger
Page 239
213
column. Therefore higher rate of the heat transfer surface renewal is attained in the larger
column than the 6-inch hence, higher heat transfer coefficient as shown in figure 6.4.
Figure 6.8 Effect of column diameter on the radial profiles of axial liquid velocity in
empty columns and no solids at Ug = 45 cm/s.
6.3.2. Effect of Column Diameter on the Heat Transfer Coefficient and
Bubble Dynamics in Columns without Internals with Solids. Having discussed the
effect of column diameter in empty column with no solids, this section focuses on the
effect of column diameter for empty bubble columns with solids.
6.3.2.1. Effect of column diameter on the heat transfer coefficient. Whereas,
some researchers have reported increase in heat transfer coefficient with addition of
solids, Kölbel et al., 1960; Deckwer et al., 1980; Saxena et al., 1989c, Saxena and Chen,
0 0.1 0.2 0.3 0.4 0.5 0.6 0.7 0.8 0.9-1.5
-1
-0.5
0
0.5
1
1.5
Dimensionless radius,r/R(-)
Axia
l liq
uid
velo
city,
(m/s
)
No solids 6-inch
No solids 18-inch
Page 240
214
1994; Yang et al., 2000, others have reported a decrease in heat transfer coefficient.
Jhawar and Prakash, 2011 using glass beads similar to those used in this work as the
solid/fines with air as the gas phase and water as liquid phase, demonstrated that the heat
transfer coefficient decreases with increase in solids loading. This corroborates the earlier
findings of Michael and Reichert, 1981 and of Li and Prakash, 1997, 2001.
Figure 6.9 illustrates the effect of column diameter at different solids loading on
the heat transfer coefficient at Ug = 45 cm/s. In this work a decrease in heat transfer
coefficient was observed with increasing solids fraction in both the large and small
column as illustrated in Figure 6.9. Although for air-water-glass beads system solids
loading (addition of glass beads) leads to increase in bubble sizes with higher velocities,
the increased solids loading leads to an increase in the boundary layer thickness
which increases resistance to the heat transfer rate Li and Prakash, 2001. Furthermore the
Figure 6.9 Effect of column diameter on the radial profiles of heat transfer
coefficient in empty columns for air-water-glass beads system at
Ug = 45 cm/s
3
3.5
4
4.5
5
5.5
6
6.5
7
7.5
8
0 0.2 0.4 0.6 0.8 1
No Solids-6-Inch Solids-25 % vol-6-Inch
No Solids-18-Inch Solids-25 % vol-18-Inch
Hea
t tr
ansf
er c
oef
fici
ent,
hw(k
W/m
2.K
)
Dimensionless radius, r/R(-)
Page 241
215
increase in apparent slurry viscosity due to addition of the solids results in lower
turbulence, because of the small solid particles dampening on the bubble wake induced
turbulence. Besides, the hydrodynamic boundary layer thickness increase would have a
negative impact on heat transfer coefficient (Jhawar, 2012). These observed phenomena
of reduced turbulence can be as a result of decreased local gas holdup, (Figure 6.10),
decreased bubbles population and bubble passage frequency (Figure 6.10b), and a
decrease in specific interfacial area (Figure 6.11) with addition of solids. Thus the
combined influence of bubbles passage frequency, specific interfacial area, and gas
holdup dominates leading to decreased heat transfer coefficient. With 25 % solids
loading, the heat transfer obtained in the 18-inch column is 5.7 % higher on the average
than those obtained in the 6-inch diameter column while without solids, 4.3 % higher heat
transfer coefficient than in the 6-inch was obtained in the 18-inch column averagely.
6.3.2.2. Effect of column diameter on the local gas holdup. Figure 6.10 shows
the effect of column diameter on the radial profiles of local gas holdup. At 25 % solids,
the radial local gas holdup obtained in 18-inch column is 23 % higher than in the 6-inch
column on the average with least effect at the column center and highest at the column
annulus region. Without solids the influence of the column diameter is even greater with
a radial average of 26 % higher in the larger column. Though the use of solids leads to a
general decrease in gas holdup, the slope of the gas holdup radial profiles is slightly
increased. A 5.6 % increase in the slope of the gas holdup in 6-inch column while an
increase of 7 % was realized in the 18-inch when 25 % vol solids was used. This
variation is likely to enhance the intensity of the large-scale liquid/slurry recirculation to
Page 242
216
some extent. Thus the influence of the column diameter becomes more pronounced on
the heat transfer coefficient when the solids are used.
Figure 6.10 Effect of column diameter on the radial profiles of local gas holdup in empty
columns for air-water-glass beads systems at Ug = 45 cm/s
6.3.2.3. Effect of column diameter on bubble passage frequency and specific
interfacial area. The bubble passage frequency radial profiles have similar trends as
those of local gas holdup with and without solids. Figure 6.11 illustrates the effect of
column diameter on the bubble passage frequency (Figure 6.11a) and specific interfacial
area (Figure 6.11b) for empty columns with and without solids. In the 18-inch column the
bubble passage frequency is twice that in the 6-inch column almost at each of the radial
locations, without solids or with 25 % vol solids. The specific interfacial area is noted to
decrease with the solids loading. This is due to an increase in bubble coalescence forming
0
10
20
30
40
50
60
0 0.2 0.4 0.6 0.8 1
No Solids-6-Inch Solids-25 % vol-6-Inch
No Solids-18-Inch Solids-25 % vol-18-Inch
Dimensionless radius, r/R(-)
Loca
l gas
ho
ldu
p, (%
)
Page 243
217
(a)
(b)
Figure 6.11 Effect of column diameter on the radial profiles of (a) Bubble passage
frequency and (b) Specific interfacial area in columns for air-water-glass
beads systems at Ug = 45 cm/s
larger bubbles hence a decrease in total interfacial area (Zahradnick et al., 1992). With
increasing column diameter, increased interfacial area is observed much like of the gas
0
20
40
60
80
100
120
140
160
180
200
0 0.2 0.4 0.6 0.8 1
No Solids-6-Inch
Solids-25 % vol-6-Inch
No Solids-18-Inch
Solids-25 % vol-18-Inch
Dimensionless radius , r/R(-)
Bu
bb
le p
assa
ge
freq
uen
cy, (s
-1)
0
1
2
3
4
5
0 0.2 0.4 0.6 0.8 1
No Solids-6-Inch No Solids-18-Inch
Solids-25 % vol-6-Inch Solids-25 % vol-18-Inch
Dimensionless radius, r/R(-)
Spec
ific
in
terf
acia
l ar
ea, (c
m2/c
m3)
Page 244
218
holdup and the bubble passage frequency. Without solids, the specific interfacial area
obtained in the 18-inch column is 51 % higher than those of 6-inch at the column core
region. However when 25 % solids are used, the 18-inch column gives 65 % higher
interfacial area than the 6-inch column at the core region. In both cases the interfacial
area obtained at the column wall region in the 18-inch almost twice those in the 6-inch
column. This confirms the trends obtained with the local gas hold up in the preceding
section. The higher specific interfacial area obtained in the larger column could be
attributed to higher breakup rate due to greater turbulence that gives large bubbles
population with higher frequency.
6.3.2.4. Effect of column diameter on the axial bubble velocity. The axial
bubble velocities defined as magnitude of the velocity of bubbles moving parallel to the
column orientation were obtained as outlined in Section 3.3.3.5. Figure 6.12 presents the
effect of column diameter and solids loading on the radial profiles of the axial bubble
velocity in the two pilot scale bubble columns for air-water and air-water glass beads
systems as obtained by the 4-point optical probe. It is observed that without solids, the
axial bubble velocity in the larger column is up to 50 % higher than that of the smaller
scale column at the column center, r/R = 0.0 and up to 63 % higher at the column wall
region. When 25 % vol. solids are used, the larger column gave 45 % higher axial bubble
velocity at the column center than in the 6-inch and up 71 % higher close to the wall
region. The enhancement of liquid circulation caused by the increase in column diameter
(Kumar, 1994, Degaleesan, 1997, and Hamed, 2012) enhances gas circulation, hence the
higher axial bubble velocity. Moreover, with the solids, the increase in the column
Page 245
219
diameter allows the formation of larger bubbles (Figure 6.3c) that churn at higher axial
bubble velocities than in smaller diameter column.
Figure 6.12 Effect of column diameter and solids loading on the radial profiles of
axial bubble velocity at Ug = 45 cm/s
6.3.3. Effect of Column Diameter on the Heat Transfer Coefficient and
Bubble Dynamics in Columns Equipped with Dense Internals. In the highly
exothermic reactions such as the FT synthesis process, the removal of the heat generated
by the chemical reaction is necessary. Thus there is need to examine the effect of column
diameter with internals as presented in this section.
6.3.3.1. Effect of column diameter on the heat transfer coefficient. To
demonstrate the effect of column diameter in the presence of dense internals, the empty
column results were used for reference. Figure 6.13 shows the radial profiles of the heat
60
100
140
180
220
0 0.2 0.4 0.6 0.8 1
No Solids-6-Inch
Solids-25 % vol-6-Inch
No Solids-18-Inch
Solids-25 % vol-18-Inch
Dimensionless radius, r/R(-)
Axia
l bubble
vel
oci
ty, (c
m/s
)
Page 246
220
transfer coefficient in two columns, 6-inch and 18-inch diameter at Ug = 45 cm/s based
on free CSA without solids. In the presence of dense internals, at the column centre
region, the 18-inch column gave ~7 % higher values of the heat transfer coefficient than
Figure 6.13 Effect of column diameter on radial profiles of the heat transfer coefficient at
Ug = 45 cm/s based on free CSA.
6-inch column. While at the column wall region, r/R = 0.9, about 3 % higher values were
obtained with an average of 6.2 % higher heat transfer coefficient in the 18-inch than the
6-inch column. Without internals, the 18-inch column gave ~5.6 % higher values on the
average than the 6-inch diameter column. These findings are consistent with the reported
bubble dynamics in sections 6.3.3.2-6.3.3.4.
6.3.3.2. Effect of column diameter on the local gas holdup. The effect of
column diameter on local gas holdup radial profiles in columns with dense internals and
4
4.5
5
5.5
6
6.5
7
7.5
8
0 0.2 0.4 0.6 0.8 1
No Internals-6-Inch Internals-6-Inch
No Internals-18-Inch Internals-18-Inch
Dimensionless radius r/R(-)
Hea
t tr
ansf
er c
oef
fici
ent,
hw(k
W/m
2.K
)
Page 247
221
without solids at Ug = 45 cm/s based on the free CSA is shown in Figure 6.14. The local
gas holdup obtained with the 18-inch column is 23 % higher on the average than those of
6-inch without internals. In the presence of dense internals, the gas holdup is ~ 25 %
higher in the 18-inch column averagely than the 6-inch column
Figure 6.14 Effect of column diameter on the radial profiles of local gas holdup at
Ug = 45 cm/s based on free CSA.
6.3.3.3. Effect of column diameter on bubble passage frequency. When the
columns are inserted with dense internals, the radial profiles of both the bubble passage
frequency and the specific interfacial area are not significantly changed. However like the
local gas holdup with and without solids, the larger column gave higher values. Figure
6.14 illustrates the effect of column diameter on the bubble passage frequency for
columns equipped with dense internals at Ug = 45 cm/s based on free CSA. In the 18-
5
15
25
35
45
55
65
0 0.2 0.4 0.6 0.8 1
No Internals-6-Inch Internals-6-Inch
No Internals-18-Inch Internals-18-Inch
Dimensionless radius, r/R(-)
Lo
cal
gas
ho
ldu
p, (%
)
Page 248
222
inch column the bubble passage frequency is twice that in the 6-inch column without
internals and 1.86 times that of 6-inch on the average when dense internals are used.
Figure 6.15 Effect of column diameter on the radial profiles of bubble passage frequency
at Ug = 45 cm/s based on free CSA.
6.3.4. Development of Heat Transfer Coefficient Empirical Correlation for
Columns without Internals. While there exists several empirical and semi-empirical
correlations in the literature for heat transfer coefficient prediction in bubble columns,
most of these correlations provide only the wall-region heat transfer coefficient.
Numerous correlations have been proposed in the past for the prediction of heat transfer
coefficients. These correlations are summarized elsewhere in Wu, 2007 and Hulet et al.,
2009. However, these correlations can predict well only at their own studied experimental
conditions, which were mainly in smaller columns ~ 8 cm diameter operated in the
20
60
100
140
180
220
0 0.2 0.4 0.6 0.8 1
No Internals-6-Inch Internals-6-Inch
No Internals-18-Inch Internals-18-Inch
Dimensionless radius, r/R(-)
Bubble
pas
sage
freq
uen
cy, (s
-1)
Page 249
223
homogenous flow regime and hence not much benefit to systems that desire operation in
the heterogeneous flow regime such as FT process and Liquid phase methanol synthesis.
To aid the design and scale-up of bubble column and slurry bubble column
reactors, there is need for empirical or semi-empirical correlation that can predict heat
transfer coefficients over a wide range of operating conditions, involving solids and thus
slurry system with wide range in physical properties of liquid, alongside the column size
(diameter). In this work, power-law empirical correlation has been developed. In order to
develop the empirical correlations of heat transfer coefficient in bubble and slurry bubble
columns, only data obtained in the current work of heat transfer coefficients measured in
two columns of 6-inch (0.14 m) diameter and 18-inch (0.44 m) diameter. The
experimental measurements were conducted in two and three phase systems covering
wide range of both liquid/slurry properties and gas flow rates, and accounts for the
different liquid properties. Deckwer, 1980 was the first to propose the heat transfer
coefficient relation as follows;
(
)
(
)
Or in terms of dimensionless numbers, generally is given as;
Different researchers have subsequently defined the dimensionless groups and modified
the coefficient and the exponents , in equation 6.7 to fit their experimental data,
(Yang et al., 2000, Wu, 2007). Similarly, the form that fits the measured heat transfer
coefficient experimental data of the current work has been proposed, (Equation 6.8) for
the center-line heat transfer coefficient. The correlation proposed in this work estimates
the centerline heat transfer coefficient in bubble and slurry bubble columns and the
Page 250
224
power law final form was selected based on the least square regression method as
follows;
[(
) (
) (
)
]
The center-line was chosen as the point of reference in developing the above equation,
(Equation 6.8) since the heat transfer coefficient at the column center has been found to
be the highest along a radial direction. Based on the radial profiles of heat transfer
coefficients measured, and discussed in the current work, the is ~ 16 % higher the
wall region heat transfer coefficient. Besides it ( ) is ~7 % higher than radial average
heat transfer coefficient. Hence it can provide useful indication and close approximation
from an engineering point of view.
All the units are consistently in cgs. The effective slurry viscosity, thermal
conductivity, density, and heat capacity, can be evaluated from the physical
properties of both the solid and liquid as follows;
To estimate the thermal conductivity of the slurry, the equation proposed by Tareef
(1940) can be adopted;
While for high solids loading (>5 vol %), a widely tested semi-theoretical correlation of
Vand, 1948 that has also been recommended by Suh and Deckwer, 1989 based on their
analysis of heat transfer coefficients in three-phase fluidized beds can be employed in
calculating the apparent slurry viscosity.
Page 251
225
[
]
The properties of the collected parameters such as column diameter, and liquid-
solid suspension are shown in Appendix D, Table D-1. A parity plot for the measured and
the estimated heat transfer coefficient is also given in Appendix D. The relative error
produced by the correlation, (Equation 6.8) (6 %) is less than that of the proposed
mechanistic model highlighted in Section 5, (13 %). This difference is attributed to the
fact that Equation 6.8 was developed by fitting to the measured heat transfer coefficient
data while the mechanistic model has no fitting.
6.4. REMARKS
The variation of heat transfer coefficient and bubble dynamics with column
diameter in bubble and slurry bubble columns equipped with dense internals occupying
25 % of the CSA was examined based on the data of this study obtained by using
combined measurements technique.
The higher heat transfer coefficient is reported in the larger column regardless of
solids or internals use. With the effect of column diameter being more pronounced in the
column core region. Similar trends on the effect of the bubble dynamics have also been
realized. The local and overall gas holdup, specific interfacial area, bubble passage
frequency, bubble sizes and the axial bubble velocity is increased with increase in column
diameter.
The observed increase in heat transfer coefficient in the central region of column
is related to increase in the large scale liquid circulation velocity with column diameter
Page 252
226
which can in turn be related to increase in the axial bubble velocities of large bubbles.
Besides, higher gas holdup and bubble passage frequency attained in the larger column
lead to enhanced heat transfer rate due to increased heat transfer surface renewal.
A general heat transfer coefficient correlation which accounts for column
diameter effects and the liquid and gas physical properties on the heat transfer has been
proposed to predict the center line heat transfer coefficient in bubble and slurry bubble
columns.
Page 253
227
7. CONCLUDING REMARKS AND RECOMMENDATIONS
In this section concluding remarks and summary of the key findings of this work
alongside with recommendations for future work in bubble columns with and without
dense internals are presented.
7.1. CONCLUDING REMARKS
This work has investigated the heat transfer coefficients and bubble dynamics in
bubble columns without internals and with dense internals both under two-phase and
three-phase systems that mimic cold flow conditions of the FT process. Among the
outstanding features of this work is that for the first time, a combined measurements
technique that consists of four-point fiber optical probe and fast response heat transfer
probe was developed and used simultaneously to capture both the heat transfer coefficient
and the bubble dynamics at the same time. The effect of dense internals and high solids
loading on bubble dynamics and heat transfer coefficient was assessed in pilot scale
bubble columns. Columns of different scales were utilized to assess the effect of column
diameter in both in the presence and absence of dense internals. Besides, a contact time
needed in the mechanistic equation for the heat transfer coefficient prediction was
developed based on the local bubble properties.
7.1.1. Bubble Dynamics. The impact of dense internals, internals size and
configuration and high solids loading was assessed on the bubble dynamic parameters
including local and overall gas holdup, bubble chord length, bubble passage frequency,
specific interfacial area, and axial bubble velocity and radial bubble velocity. The overall
and local gas holdup, bubble sizes, bubble passage frequency, specific interfacial area,
Page 254
228
and axial bubble velocity increased with superficial gas velocity, regardless of solids
loading or internals use. However the overall and local gas holdup, specific interfacial
area, and bubble passage frequency decreased with the increase in solids loading. Slight
increase in axial bubble velocity and bubble sizes was attained with the increase in solids
loading. Analysis of the distribution of the bubble chord lengths in the column center
showed that a wider spread with increasing solids loading was attained than with no
solids with effect of solids loading being significantly higher at lower range than higher
range of superficial gas velocity. It was also noted that the probe measurements with
upward and downward orientation are necessary for the bubble dynamic study,
particularly towards the column wall region and high superficial gas velocities where
more bubbles move downward than those moving upwards.
The internals size and configuration were also noted to have notable effect on the
bubble properties. With dense small sized internals smaller bubble sizes with higher
specific interfacial area in a unit volume and higher bubble passage frequencies were
attained, the overall gas holdup and local gas hold up were only but slightly enhanced
which is within the margin of error while the axial bubble velocity was slightly reduced.
More difference in the centerline and the wall region was noted with the local gas holdup
thus higher intensity of large scale liquid recirculation expected with smaller sized
internals.
This work also found that it is possible to extrapolate the local and overall gas
holdup studies from the empty bubble columns to those equipped with the dense internals
by matching the gas velocity based on the free cross-sectional area available for the flow.
Particularly in the 6-inch diameter column where the gas holdups are within 3 % of each
Page 255
229
other. In the 18-inch column, the internals were found to enhance the local and overall
gas holdup therefore extrapolation may not be possible. It was also established that the
addition of solids does not have significant impact on the radial profiles of the local gas
holdup.
The larger diameter column exhibited higher values than the 6-inch column for all
the measured bubble properties at the same operating conditions.
7.1.2. Heat Transfer Coefficient. Heat transfer coefficient measurement
methodology was simultaneously employed alongside bubble dynamics measurements.
The measurements were first verified in air-water system and then extended to air-water-
glass beads systems with and without internals to mimic the cold flow conditions of the
Fischer-Tropsch synthesis process. The heat transfer coefficient was noted to increase
with increase in superficial gas velocity, with the rate of increase being higher at lower
superficial gas velocity and then the increase becomes significantly small from 20 cm/s.
Consistently higher heat transfer coefficient was obtained at the column center relative to
the column wall regions as well as other radial locations for all the operating conditions,
with or without solids and regardless of internals presence. These findings were found to
be consistent with those already reported by other researchers.
The presence of dense internals was found to enhance the heat transfer coefficient
with the effect being higher at lower superficial gas velocity. The heat transfer coefficient
obtained in empty column for gas-liquid system can be extrapolated to columns equipped
with dense internals occupying 25 % of the CSA since the enhancement of the heat
transfer coefficient with the internals was relatively small up to 5 %.
Page 256
230
7.1.3. Effect of Column Diameter. The column diameter was found to have
effect on the heat transfer coefficient as well all the bubble dynamic parameters including
overall and local gas holdup, bubble passage frequency, specific interfacial area, bubble
chord length and the axial bubble velocity. Larger column diameter was found to increase
the heat transfer coefficient, enhance the local and overall gas holdup, bubble passage
frequency, bubble chord lengths and axial bubble velocity, with and without internals or
solids.
7.2. RECOMMENDATION FOR FUTURE WORK
The current work was limited to ambient temperature and pressure while the liquid
phase methanol synthesis (LPMeOH) synthesis and FT synthesis involve a 3-phase
system running at high pressure and temperature. Therefore, it is important to adopt
a study where mimic FT conditions are applied on both heat transfer and bubble
dynamics to assure the validity of the findings and results of the current work.
The studies of heat transfer coefficient and bubble dynamics still need to be done
with different gas-liquid-solids systems since some studies have reported increase in
heat transfer coefficient while others a decrease and it is thought the different
phenomena observed can be attributed to different gas-liquid-solid systems
employed.
This work presents a deep insight on the influence of dense internals and high solids
loading on the heat transfer coefficient and bubble dynamics in bubble columns.
However as a first step this study was limited to the air-water-glass beads system. It
is therefore recommended to use hydrocarbon system which is of industrial interest.
Page 257
231
In future studies, a computational fluid dynamics (CFD) should be implemented to
examine and validate the experimental data obtained from the four-point optical
probe and integrate the heat transfer to it to simulate. Information obtained from the
hybrid measurements technique in the current work provides detailed understanding
of the relation between heat transfer and bubble dynamics and also positions CFD as
an alternative method for obtaining essential information regarding the performance
of bubble and slurry bubble columns.
The effect of different configurations and sizes of dense internals on both heat
transfer and bubble dynamics still need to be examined in columns of larger
diameters such as 18-inch diameter column.
The effect of height of internals above the surface of gas distributor needs to be
investigated along with different configurations and sizes of sparger (gas distributor)
on the heat transfer coefficient and bubble dynamics.
Integrate the measurements and findings of the current work with those obtained
from Computed Tomography (CT), which gives gas holdup distribution and flow
regime identification and the Radioactive Particle Tracking (RPT) technique that
gives turbulent parameters, liquid velocity, phase residence time and eddy
diffusivity.
A single probe that combines both the heat transfer coefficient and the bubble
dynamics measurements needs to be developed and implemented
Page 258
232
APPENDIX A
HEAT TRANSFER STUDIES SUMMARY
Page 259
233
Table A.1 Summary of heat transfer and hydrodynamics studies in bubble and slurry bubble columns with vertical internals.
Author(s)
System used
Column and sparger features
Internals specifications
Investigated subject
and/or parameters
Kölbel and
Langheim,
1958
(US
2,852,350)
CO+H2-watery
solution of
Fe(NO3)3 and
Cu(NO3)2
1.4 m diameter – 12 m height
360 pipes that reduces to 270 at 3 m above the
gas inlet, to 180 after 3 further meters and finally
to 90 by moving 3 more meters higher.
Improvement of cooling
system design
Kölbel and
Ackermann,
1958
(US
2,853,369)
Gas-slurry (no
details given)
Applicable to any column with
diameter 30 cm up to 3m and
above, and more than 1.5 m in
height
Vertical shafts (circular or hexagonal) with
cooling tubes within or in between the circular
shafts or various arrangements within the
hexagonal ones
Overcoming the liquid
recirculation “rolling
movement” and
backmixing
Carleton et
al., 1967
Nitrogen-water
and oxygen-
cobalt catalyzed
sodium sulphite
wide range of column diameters as well as packing materials and sizes Gas holdup, pressure
drop, gas and liquid
RTD, and interfacial area
Voyer and
Miller, 1968
Nitrogen-water
and Nitrogen-
NaOH solution
5.5” diameter-0.67 to 7.8ft/
sieve plate (5% free area, 0.15”
diameter holes at ½” triangular
pitch)
½” 6 mesh cylindrical screen packing and ½” 6
mesh corrugated screen packing (corrugated and
each layer perpendicular to the next one).
Interfacial area
Shah et al.,
1978
Nitrogen-water
Glass: 6.35 cm diameter/sparger
details not specified
6, 16 and 23 glass rods (0.004m diameter); 2 and
4 glass rods (0.011 m diameter); 1 glass rod
(0.032 m diameter); 1, 2, and 4 screen baskets
(0.019 m diameter) and 1 screen basket (0.038 m
diameter). The smaller baskets were a) empty, b)
filled with 0.0032 m polyethylene packing and c)
Gas holdup and
backmixing
233
Page 260
234
filled with 0.0159 m diameter glass rods. The
larger baskets were a) and b) same as above and
c) filled with 0.032 m diameter rod. (Rods were
all 1.143 m tall)
Kölbel and
Ralek, 1980
Syngas-catalyst
slurry
Not Specified
Vertical honeycombed shafts with cooling pipes
arranged centrally around or in corners
Liquid backmixing and
catalyst efficiency
O’Dowd et
al., 1987
Nitrogen-water-
glass spheres
10.8 cm diameter column – 1.94
m height/perforated plate with
72 holes of 0.001 m diameter
Internal baffles: 5 vertical rods (1 central and 4
around at 90 deg. each)of 0.019m diameter and
1.88 m height
Solids dispersion
coefficient, local gas
holdup and bubble size
and interfacial area
Yamashita,
1987
Air-water system
31 cm diameter/single nozzle of
60 mm diameter downwards on
central axis (10 cm above
bottom)
Single rod of 6 mm diameter (hanging 36.5 cm
above bottom)
Overall gas holdup
Multi rods and pipes:
Small separation *(6mm):
18, 44, 70 and 85 internals of
14mm diameter.
Large separation (≥8mm):
37, 28, 21 and 10 internals of
22mm diameter.
9 internals of 60 mm diameter.
9 internals of 48 mm diameter.
16 cm diameter/single nozzle of
27.6 mm diameter horizontally
on side wall (10 cm above
bottom)
Single pipe and rod (sitting on bottom)
Multi rods and pipes:
Large separation *(≥8mm):
2 internals of 14, 22, 38 and 20
mm diameter
5, 6, and 11 internals of 22 mm
234
Page 261
235
diameter
8 cm diameter/single nozzle of
10 mm diameter horizontally on
side wall (4.2 cm above bottom)
Single pipe and rod
Saxena et al.,
1991
Nitrogen-
Therminol 66-red
iron oxide
powder
10.8 cm diameter/perforated
plate
Single cylindrical probe (19, 31.8, and 50.8 mm
diameter) and bundle of 7 tubes of 19 mm
diameter each in a triangular pitch of 36.5 mm
Heat transfer, gas holdup
Saxena et al.,
1992
Air-water
Air-water-glass
beads
30.5 cm diameter – 3.3 m
height/perforated plate of 0.8mm
diameter orifices in square
arrangement of 9.5 mm pitch
5, 7, and 37 Stainless Steel tubes (the latter in 3
bundles of 3 concentric hexagonal rows) of 19
mm diameter each and the pitch is 36.5 mm
Overall gas holdup
Saxena and
Rao, 1993
Nitrogen-
Therminol-
Magnetite
Same as Saxena et al. (1992) 37 Stainless Steel tubes in a bundle of 19 mm
diameter each in equilateral pitch of 36.5 mm
Overall gas holdup
Saxena and
Chen, 1994
Air-water Same as Saxena et al. (1991)
Same as Saxena et al.(1992)
1 and 7 tubes bundle Hydrodynamics and heat
transfer
Air-water-solids
(glass beads (50
μm), magnetite
(37.5, 49, 58, 69,
90.5 μm), red
iron oxide
powder (1.02,
2.38μm))
Nitrogen-
Therminol
Nitrogen-
Therminol-Solids
(red iron oxide
(1.7 μm),
magnetite (28,
36.6, 37μm)
Same as Saxena et al. (1991)
Nitrogen-
Therminol
Nitrogen-
Therminol-Solid
Same as Saxena et al. (1992) 37 tubes bundle, pitch as Saxena et. al. (1992)
235
Page 262
236
Pradhan et
al., 1993
Air-aqueous
CMC solution
0.102m diameter column – 2.5
m height/64 holes of 1.5mm
diameter each in a 1.2 cm
triangular pitch
Helical coils (made of 6mm Co tube) of 3.5 cm
and/or 6.8 cm diameter in 2.5 cm pitch and
bundles of vertical straight tubes (Stainless Steel
with 1.2, 1.5, and 2.0 cm outer diameters)
Overall gas holdup and
pressure drop
Chen et al.,
1999
Air-water
Air-Drakeoil
18” (44cm) diameter/301 holes
of 0.77mm diameter each on 14
concentric circular rings at 1.5
cm apart
16 Aluminum tubes of 1” diameter each in two
bundles at r/R=0.39 and 0.61
Gas holdup and its radial
profile, liquid
recirculation velocity,
turbulent stresses and
eddy diffusivities
De et al.,
1999
Air-sodium
sulphate
Air-butanol
Air-glycerine
0.05 m diameter column – 2.5 m
height/plate sparger
Helical coils of 3.5 cm diameter and straight
tubes of 1.2 cm and 1.5 cm diameter
Overall gas holdup
Maretto and
Krishna,
2001
Syngas-paraffin
C16H34-Co based
catalayst
7 m diameter – 30 m dispersion
height
Vertical cooling tubes and spacer sieve trays Reactor productivity and
reaction kinetics
modeling
Forret et al.,
2003
Air-water 1 m diameter/perforated plate:
312 holes of 2mm diameter and
50 mm pitch
56 tubes of 63 mm diameter each and a 10.8 cm
square pitch
Liquid mixing-axial
dispersion coefficient
Larachi et
al., 2006
Air-water Simulated lab scale 19 cm
diameter and pilot scale 100 cm
diameter
Tubes of 1” diameter and triangular pitch in 4
arrangements: dense (253 tubes), sparse (31
tubes), star/wall clearance (121 tubes), star/core
clearance (132 tubes)
CFD simulations (gas
holdup, liquid axial
velocity and turbulent
kinetic energy)
Balamurugan
and
Subbarao,
2006
Gas (Air) – liquid
(NA)
15 cm diameter/perforated plate
with 126 holes of 0.2 cm
diameter each in 1 cm square
pitch
21 and 41 Stainless Steel helical springs of 1.9
cm coil diameter made of 0.5 mm wire
Bubble size and holdup
Youssef and
Al-Dahhan,
2009
Air-water 0.19 m diameter – 2 m
height/perforated plate: 225
holes of 1.32 mm diameter,
arranged in a triangular pitch,
with a total free area of 1.09%.
12 and 48 Plexiglas rods of ½” diameter each
located in two concentric circles and in
triangular pitch, respectively
Gas holdup and its radial
profile, and bubble
dynamics.
Abdulmohsin Air-water 0.19 m diameter – 2 m 12 and 48 Plexiglas rods of ½” diameter each Heat transfer coefficient
236
Page 263
237
and Al-
Dahhan,
2012
height/perforated plate: 225
holes of 1.32 mm diameter,
arranged in a triangular pitch,
with a total free area of 1.09%.
located in two concentric circles and in
triangular pitch, respectively
and its radial profile.
Jhawar and
Prakash,
2011
Air-water-glass
beads
0.15 m diameter and 2.5 m high/
sintered steel plate
distributor
15 tube bundle (0.95 cm OD) located within 10
cm radius
Column diameter, heat
transfer, center-line
liquid velocity, overall
gas holdup, bubble rise
velocity
Youssef et
al., 2013
Air-water 0.45 m diameter – 3.8 m
height/perforated plate: 241
holes of 3 mm diameter,
arranged in a triangular pitch,
with a total free area of 1.09%.
16 Plexiglas rods of 1” diameter each in two
concentric circles and 17 and 27 cm triangular
pitch, respectively (5 % CSA occupied)
75 Plexiglas rods of 1” diameter triangular pitch,
respectively
Hydrodynamics in pilot
scale column: Effect of
internals on Gas holdup
and its radial profile,
interfacial area, bubble
chord lengths
237
Page 264
238
APPENDIX B
THE HEAT TRANSFER COEFFICIENT MEASUREMENT TECHNIQUE
PROCEDURE
Page 265
239
Scope
In this work, a combined measurement of both the heat transfer coefficient and
bubble dynamics was utilized. To investigate the heat transfer coefficients in bubble and
slurry bubble columns, with and without dense internals, the following section outlines
the sequence of operation as well as the technical information for heat transfer studies
and measurements.
B.1 Components of the heat transfer coefficient measurement technique
1. Heat transfer probe
The detailed structure of the heat transfer probe is outlined in Chapter 4. The
sensitivity of the probe is 0.02s, thermal resistance of 0.003 oF ft
2-hr/BTU, and heat
capacity values of 0.01 BTU
oF/ft
2-hr of the micro-foil heat flux sensor No. 20453-
1(G161) are as provided on the information sheet available from the manufacturer (RdF
Corporation, 23 Elm Ave. Hudson, NH 03051 USA 800-445-8367, 603-882-5195 FAX
603-882-6925). The sensor is designed for heat flow levels up to 50 BTU/ft2
-sec., and
operating temperature ranges from -300 0
F to + 400 0F, with an accuracy of ± 3 %.
2. Thermocouple probe
The thermocouple probe contains a set of three T-type thermocouples purchased
from Omega Engineering Inc. each of whose specifications are (TMTSS-125U-12). Each
thermocouple is a subminiature transition joint probe (type T, 0.125" O.D. stainless steel
sheath, 12" length, ungrounded junction), with the work temperature of up to 500 o
F.
3. Amplifier
Since the signal of the heat flux sensor is in the range of microvolts amplication
of the measured signals was done by using an amplifier JH4300-AC obtained from JH
Page 266
240
Technology, Inc.. The guaranteed operating temperature of the amplifier was in the range
-10 ~ +60 o
C, and the temperature stability of ~ ± (0.02 % span +1.3 microvolts) per o
C,
or better. The data acquisition period is suggested to be no longer than 60 minutes due to
the effect of the operating temperature on the amplifier.
4. DC power supply
The DC power supply used in the experiments is a HY 5003 model manufactured
by RSR Electronics, Inc.. The regulated output voltage is 0-50V, and the regulated output
current is 0-3A. The voltage indication accuracy is ±1% +2 digits, and the current
indication accuracy is ±2%+2 digits.
5. Data acquisition instruments
The data acquisition instruments were produced by National Instruments
Corporation, including a SCXI-1000 chassis block, SCXI-1102 module kit, SCXI-1303
terminal block, SCXI-1349 with a 2m cable, and NI PCI-6281 multifunction I/O board.
All the components were assembled and connected after the purchase, and the data
acquisition program was also developed on LabVIEW launch pad and implemented using
LabVIEW software.
B.2 Operating and DAQ procedures of heat transfer probe technique
During the experiments using the heat transfer probe technique, the following procedures
were followed:
Mount the heat transfer probe and thermocouple probe to the ports of the slurry
bubble column at the desired axial location and the radial positions.
Tighten the fittings to prevent the liquid leaks through the connection points.
Page 267
241
Properly connect the power input lines of the heater in the heat transfer probe to
the DC power supply.
Connect the thermocouple wires (blue-Pos. (+), red-Neg.(-)) of the microfilm
sensor to one of the channels numbered from 0 to 7 in the SCXI-1303 terminal
block.
Connect the heat flux sensor wires (white-Pos.(+), red-Neg.(-)) to the input of the
amplifier, and then connect the output of the amplifier to one of the channels
numbered from 8 to 32 in the SCXI-1303 terminal block.
Connect the thermocouple wires of the thermocouple probe to one of the channels
numbered from 0 to 7 in the SCXI-1303 terminal block.
Load the required amount of liquid and solid into the slurry bubble column.
Operate the slurry bubble column at the designed condition for about 20 minutes,
and then switch on the power of the chassis (SCXI-1000) and start the
temperature measurement program on the PC.
When the system reaches steady state, collect the temperature data several (3-5)
times to obtain the average the temperature difference between the probe surface
and the bulk.
Switch on the DC power supply of the heater and the power of the amplifier, and
then start the heat flux measurement program on the PC.
After 20-30 minutes, when the signal of heat flux becomes stable, collect both the
heat flux data and temperature data simultaneously using the heat flux
measurement program. At this point the measurement is complete
Page 268
242
Once the data acquisition is completed, each of the files can be opened and
viewed in Ms Excel or MATLAB.
Page 269
243
APPENDIX C
ADDITIONAL RESULTS OF THE BUBBLE DYNAMICS IN BUBBLE AND
SLURRY BUBBLE COLUMNS
Page 270
244
Scope
Bubble dynamics in bubble and slurry bubble columns was assessed in Section 3
in columns with dense internals and without internals. The aim of this section is to
provide additional bubble dynamics data and contact time data for the proposed
mechanistic model.
C.1 Bubble Passage Frequency and Specific interfacial area
The observed effects of size and configuration of internals on the bubble passage
frequency and specific interfacial area are consistent with those of local gas holdup at the
same gas velocity as discussed under Section 3. Higher bubble passage frequency is
obtained when internals are used. The half-inch internals provide consistently highest
bubble passage frequency at all radial locations regardless of the area used for calculating
the gas velocity.
(a)
0
5
10
15
20
25
0 0.2 0.4 0.6 0.8 1
No Internals
0.5 inch Internals
1 inch Internals
Dimensionless radius, r/R(-)
Bu
bb
le p
assa
ge
freq
uen
cy, (s
-1)
Page 271
245
(b)
Figure C.1. Effect of size of internals on radial profiles of (a) Bubble passage frequency
(b) Specific interfacial area at Ug = 3 cm/s
C.2. Impact of Internals on the contact time in bubble and slurry bubble columns
The impact of internals on the contact time predicted by the model, (Equation
5.21) vs the superficial gas velocity for 6-inch column at r/R = 0.0 is shown in Figure
C.2. with superficial gas velocity based on both the total CSA and free CSA of the
column. A significant difference is noticed on the effect of internals at lower gas velocity
which becomes less with increasing gas velocity. This is consistent with the bubble
dynamics that were discussed in Section 3 of this dissertation. It was pointed out that the
effect of internals was significant at lower superficial gas velocity (based on free CSA or
total CSA) on both the bubble passage frequency and local gas holdup and negligible at
higher gas velocity.
0
0.2
0.4
0.6
0.8
1
1.2
1.4
1.6
0 0.2 0.4 0.6 0.8 1
No Internals
0.5-inch Internals
1-inch Internals
Dimensionless radius, r/R(-)
Sp
ecif
ic i
nte
rfac
ial ar
ea, (c
m2/c
m3)
Page 272
246
Figure C.2. Effect of internals on the predicted contact time in 6-inch column at
r/R(-) = 0.0
Figure C.3. Effect of internals on radial profiles of predicted contact time at gas velocity,
8 cm/s
0
0.01
0.02
0.03
0.04
0.05
0.06
0.07
0 10 20 30 40 50
No Internals
Internals based on total CSA
Internals based on free CSA
Superficial gas velocity, Ug(cm/s)
Co
nta
ct t
ime,
(s)
0
0.02
0.04
0.06
0.08
0.1
0.12
0.14
0 0.2 0.4 0.6 0.8 1
No internals
Internals-Gas velocity based on total CSA
Internals- Gas velocity based on free CSA
Dimensionless radius, r/R(-)
Conta
ct t
ime,
(s)
Page 273
247
Figure C.4 Effect of internals on radial profiles of predicted contact time at gas velocity,
20 cm/s
Figure C.5. Effect of solids volume fraction on the contact time at r/R = 0.0 in 6 Inch
bubble column
0
0.01
0.02
0.03
0.04
0.05
0.06
0.07
0.08
0 0.2 0.4 0.6 0.8 1
No internals
Internals-Gas velocity based on total CSA
Internals- Gas velocity based on free CSA
Dimensionless radius, r/R(-)
Co
nta
ct t
ime,
(s)
0
0.02
0.04
0.06
0.08
0.1
0.12
0 10 20 30 40 50
No Solids 9.1 % vol
25 % vol 40 % vol
Superficial gas velocity, Ug(cm/s)
Conta
ct t
ime,
(s)
Page 274
248
Figure C.6. Combined effect of internals and solids volume fraction on contact time in
6-inch bubble column at r/R (-) = 0.0
Figure C.7. Impact of solids volume fraction on contact time in 18-inch column at
r/R(-) = 0.0
0
0.01
0.02
0.03
0.04
0.05
0.06
0.07
0 0.1 0.2 0.3 0.4 0.5
No Internals at Ug = 8 cm/s Internals at Ug = 8 cm/s
No Internals at Ug = 30 cm/s Internals at Ug = 30 cm/s
Solids volume fraction, (-)
Co
nta
ct t
ime,
(s)
0
0.005
0.01
0.015
0.02
0.025
0 10 20 30 40 50
No solids
9.1 % vol
25 % vol
Superficial gas velocity, Ug(cm/s)
Conta
ct t
ime,
(s)
Page 275
249
Figure C.8. Effect of internals on radial profiles of the estimated contact time in 18-inch
column
Figure C.9. Combined effect of internals and solids volume fraction on the radial profiles
of the contact time in 18-inch column at Ug = 45 cm/s based on free CSA
0
0.005
0.01
0.015
0.02
0.025
0.03
0 0.2 0.4 0.6 0.8 1
No Internals at 20 cm/s Internals at 20 cm/s
No Internals at 45 cm/s Internals at 45 cm/s
Dimensionless radius, r/R(-)
Co
nta
ct t
ime,
(s)
0
0.005
0.01
0.015
0.02
0.025
0.03
0 0.2 0.4 0.6 0.8 1
No Internals at 9.1 % vol Internals at 9.1 % vol
No Internals at 25 % vol Internals at 25 % vol
Conta
ct t
ime,
(s)
Dimensionless radius, r/R (-)
Page 276
250
APPENDIX D
DEVELOPMENT OF EMPIRICAL CORRELATIONS
Page 277
251
D.1. Empirical Correlation for Heat Transfer Prediction in Slurry Bubble Columns
Based on the generated database from the experimental measurements using the
heat transfer probe, (part of the combined measurements technique) a power law
correlation has therefore been developed. The power law correlation was selected based
on the least square regression method, with the final form as follows,
[(
) (
) (
)
]
Table D.1. Parameters collected in the database
Parameters Range
Column diameter 0.1397 -0.4445 m
Superficial gas velocity 0.03 - 0.45 m/s
Density of liquid-solid suspension 998-134 kg/m3
Viscosity of liquid-solid suspension 0.0005-0.0587 Pa.S
Heat capacity of liquid-solid suspension 2224-4183 J/kg.K
Thermal conductivity of liquid-solid suspension 0.6-0.634 w/(m.K)
Internals (% CSA) 0.0 % CSA, 25 % CSA
Figure D.1 shows a parity plot of the predicted heat transfer coefficient vs the
experimental (measured) heat transfer coefficient. The Absolute Average Relative Error
(AARE) was found to be 6 %, which implies a close match between the predictions and
measurements. Where the AARE was defined as follows;
Page 278
252
∑|
|
Figure D.1. A parity plot of the proposed correlation vs experimental heat transfer
coefficient
D.2 Empirical Correlation for Contact Time needed in the Mechanistic Equation of
Heat Transfer
According to the mechanistic model for the contact time estimation proposed in
Section 5, the contact time is a function of both local gas holdup and bubble passage
frequency. The local gas holdup can be estimated from the empirical correlations or the
artificial neural network correlations available in the literature, (Degaleesan, 1998,
Shaikh 2007). However the bubble passage frequency cannot easily be obtained due to
lack of correlations. Thus, attempt has been made to see if the contact time, can be
5
5.5
6
6.5
7
7.5
8
5 5.5 6 6.5 7 7.5 8
Experimental hc, (kW/m2.K)
Pro
po
sed C
orr
elat
ion, h
c(kW
/m2.K
)
Page 279
253
represented by an empirical correlation with parameters that can easily be obtained such
as local gas holdup. Based on the data obtained from the combined measurements
technique, the measured local bubble properties have been used to propose the following
straight forward equation for predicting the contact time between fluid elements and the
thin film at any local point in the column.
Where, is the local gas holdup. Assessment of the performance of the proposed
contact time correlation, (Equation D.3) relative to that of the mechanistic contact time
model is done by using a parity plot. Figure D.2 shows the parity plot of the predicted
contact time using the mechanistic model of the current work vs. proposed contact time
based on data of the mechanistic model.
Figure D.2. A parity plot of the predicted contact time vs the mechanistic model
0
0.005
0.01
0.015
0.02
0.025
0.03
0 0.005 0.01 0.015 0.02 0.025 0.03
Model Prediction, tc(s)
Co
rrel
atio
n P
redic
tion, t c
(s)
Page 280
254
The Absolute Average Relative Error (AARE) was found to be 33 %. Where the AARE
has been defined as;
∑|
|
The resulting error is significant particularly at higher values of the contact times. It is
obvious that correlating the contact time with local gas holdup alone is not adequate.
Therefore, further evaluation of the relationship between the contact time and other key
parameters that can describe the effects of bubbles properties such as passage frequency
need to be examined. Accordingly, development of a modified correlation for the contact
time is recommended.
Page 281
255
BIBLIOGRAPHY
1. A. Mirzaei, M. Faizi and R. Habibpour, Applied Catalysis, 306, 98 (2006).
2. Abdulmohsin, R., and Al-Dahhan, M., 2012 Impact of internals on the heat
transfer coefficient in a bubble column, Industrial & Engineering Chemistry
Research. 51, 2874−2881
3. Akita, K. and Yoshida, F., 1974. Bubble size, interfacial area, and liquid-phase
mass transfer coefficient in bubble columns. Ind. Eng. Chem. Process Des.
Develop., 13(1), 84-91.
4. Al Mesfer K.M. “Effect of Dense Heat Exchanging Internals on the
Hydrodynamics of Bubble Column Reactors using Non-invasive Measurement
Techniques”, Ph.D. Thesis, Missouri University of Science and Technology,
Rolla, MO, 2013.
5. Anabtawi MZA, Abu-Eishah SI, Hilal N, Nabhan NBW. Hydrodynamic studies in
both bi-dimensional and three-dimensional bubble columns with a single sparger.
Chem Eng Process 2002; 1:1–6.
6. Azbel, D., 1981. Two-phase flows in chemical engineering. Cambridge
University Press, Cambridge.
7. Baker, C.G.J., E.A. Armstrong and M.A. Bergougnou, Heat Transfer in Three
Phase Fluidized Beds, Powder Technol. 21, 195-204 (1978).
8. Balamurugan, V. and Subbaro, D. bubble size and holdup in bubble columns with
vibrating internals, AIChE Spring National Meeting (2006).
9. Barghi, S., Prakash, A., Margaritis, A. and Bergougnou, M.A., 2004. Flow regime
identification in a slurry bubble column from gas holdup and pressure fluctuation
analysis. The Canadian Journal of Chemical Engineering. 82, 865-870.
10. Bauer, M., and Eigenberger, G., Multiscale Modeling of Hydrodynamics, Mass
Transfer and reaction in Bubble Column Reactors, Chemical Engineering
Science, Vol. 56, (2001), pp. 1067-1074.
11. Behkish A, Men Z, Inga RJ, Morsi BI. Mass transfer characteristics in a large-
scale slurry bubble column reactor with organic liquid mixtures. Chem Eng Sci
2002; 57:3307–24.
Page 282
256
12. Behkish, A., Hydrodynamic and Mass Transfer Parameters in large-scale Slurry
Bubble Column Reactors, Ph.D. Thesis, University of Pittsburgh, Pittsburg, PA,
2004.
13. Behkish, R. Lemoine, L. Sehabiague, R. Oukaci and B. I. Morsi, Chem. Eng. J.,
128, 69, 2007.
14. Bernemann, K., 1989. On the hydrodynamics and mixing of the liquid phase in
bubble columns with longitudinal tube bundles, Ph.D. Thesis, University of
Dortmund, Germany.
15. Bhaga D., and Weber M. E., 1981. Bubbles in viscous liquids: shapes, wakes and
velocities, J Fluid Mech, 105: 61-85.
16. Bouaifi M, Hebrard G, Bastoul D, Roustan M. A comparative study of gas
holdup, bubble size, interfacial area and mass transfer coefficients in stirred gas–
liquid reactors and bubble columns. Chem Eng Process 2001; 40:97–111.
17. Carleton, A. J.; Flain, R. J.; Rennie, J.; Valentin, H. H., Some properties of a
packed bubble column, Chemical Engineering Science, 22, 1839-1845, 1967.
18. Carra, Sergio; Morbidelli, Massimo, 1987. Gas-liquid reactors. Chemical
Industries (Dekker), 26 (Chem. React. React. Eng.), 545-666.
19. Chen, J., P., Gupta, S., Degaleesan, M. H., AI-Dahhan, M. P., Dudukovic and B.
A., Toseland, 1998, Gas holdup distributions in large-diameter bubble columns
measured by computed tomography', Flow Measurement and Instrumentation,
9(2), 91-101.
20. Chen, J.; Li, F.; Degaleesan, S.; Gupta, P.; Al-Dahhan, M. H.; Dudukovic, M. P.;
Toseland, B. A. Fluid Dynamic Parameters in Bubble Columns with Internals.
Chem. Eng. Sci. 1999, 54 (13-14), 2187–2197.
21. Chen, R.C., Reese, J., Fan, L.-S., 1994. Flow structure in a three-dimensional
bubble column and three-phase fluidized bed. AIChE. Journal 40, 1093–1104.
22. Chiu, T.M. and E.N. Ziegler, "Heat Transfer in Three Phase Fluidized Beds",
AlChE J. 29, 677-685, 1983.
23. Cho, Y. J.; Woo, K. J.; Kang, Y.; Kim, S. D. Dynamic characteristics of heat
transfer coefficient in pressurized bubble columns, Chemical Engineering and
Processing. 41 (2002) 699-/706.
24. Choi K.H. and Lee K.W. Behavior of Gas Bubbles in a Concentric Cylindrical
Airlift Column, Korean J. of Chem. Eng., 1992 9(2), 66-73
Page 283
257
25. Cooper, M. G. (1969). The microlayer and bubble growth in nucleate pool
boiling, International Journal of Heat and Mass Transfer, 12, 915-933.
26. Crabtree, J.R., and Bridgewater, J.; Chem. Eng. Sci. 1971, 20 (839).
27. D.W. Holladay, C.W. Hancher, D.D. Chilcote, and C.D. Scott, Biodegradation of
phenolic waste liquors in stirred-tank, columnar and fluidized-bed bioreactors,
Proc. IChE Symp. Ser., 74, 241–252, 1978.
28. Danckwerts, P. V., 1951. Significance of liquid-film coefficients in gas
absorption. Journal of Industrial and Engineering Chemistry (Washington, D. C.),
43 1460-1467.
29. Deckwer, W. D.; Louisi, Y.; Zaldi, A.; Ralek, M. Hydrodynamic properties of the
Fischer_Tropsch slurry process. Ind. Eng. Chem. Process Des. Dev. 1980b, 19,
699–708.
30. Deckwer, W.-D. and Schumpe, A., 1993. Improved tools for bubble column
reactor design and scale-up. Chemical Engineering Science 48, 889–911.
31. Deckwer, W.D., On the Mechanism of Heat Transfer in Bubble Column Reactor,
Chem. Eng. Sci. 35, 1341-1 346 (1980a).
32. Deckwer, W.-D., 1992. Bubble column reactors, Chichester.
33. Deckwer, W.-D.; Alper, E. Katalytische suspensions reacktoren. Chem. Eng.
Technol. 1980, 52, 219–228.
34. Degaleesan S, Dudukovic M, Pan Y. Experimental study of gas induced liquid-
flow structures in bubble columns. AIChE J 2001;47: 1913–31.
35. Degaleesan, S., “Fluid Dynamic Measurements and Modeling of Liquid Mixing
in Bubble Columns,” D.Sc. Thesis, Washington University, St. Louis, MO (1997).
36. Diesterwerg, G., Fuhr, H., and Reher, P., (1978), Die Bayer-Turmbiologie,
Industrieabwasser, 7.
37. Drew, D. A., 1983, Mathematical Modeling of two-phase flows, Ann. Rev. Fluid
Mech., 15,261-291.
38. Dudukovic, M. P.; Larachi, F.; Mills, P. L. Multiphase reactors revised. Chem.
Eng. Sci. 1999, 54, 1975–1995.
39. Dudukovic, M.P., Opaque multiphase flows: experiments and modeling. Expt.
Ther. Flu. Sci., 26 (6-7), 747-761, 2002.
Page 284
258
40. Ellenberger, J. and Krishna, R., A unified approach to the scale-up of gas-solid
fluidized bed and gas-liquid bubble column reactors. Chem. Eng. Sci., 49 (24B),
5391 5411, 1994.
41. F. Fischer, H. Tropsch, Brennstoff-Chem. 4 (1923) 276.
42. Fan L. S, Matsuura A, Chern SS. Hydrodynamic characteristics of a gas–liquid–
solid fluidized bed containing a binary mixture of particles. AIChE J 1985;
31:1801–10.
43. Fan, L.-S. Gas-liquid-solid fluidization engineering; Butterworths Series in
Chemical Engineering: Boston, MA, 1989.
44. Fan, L.-S., G. Q. Yang, D. J. Lee, K. Tsuchiya and X. Luo, Some Aspects of
High-Pressure Phenomena of Bubbles in Liquids and Liquid-Solid Suspensions,
Chem. Eng. Sci. 54, 4681, 1999.
45. Forret A, Schweitzer J-M., Gauthier T, Krishna R, Scweich D. Influence of scale
on the hydrodynamics of bubble column reactors: an experimental study in
columns of 0.1, 0.4 and 1 m diameters. Chem Eng Sci 2003; 58:719–24.
46. Forret, A., Schweitzer, J. M., Gauthier, T., Krishna, R., and Schweich, D., 2006.
Scale up of slurry bubble reactors, Oil & Gas Science and Technology, 61(3),
443-458.
47. Forret, A.; Schweitzer, J. M.; Gauthier, T.; Krishna, R.; Schweich, D. Liquid
dispersion in large diameter bubble columns, with and without internals. Can. J.
Chem. Eng. 2003, 81, 360–366.
48. Fox, J. M., Fischer-Tropsch Reactor Selection, Catal. Lett., 7, 281, 1990.
49. Franz, K., Borner, T., Kantorek, H.J., & Buchholz, R. (1984). Flow structures in
bubble columns. German Chemical Engineering, 7, 365}374.
50. Frijlink, J.J., 1987. Physical aspects of gassed suspension reactors. Ph. D. Thesis,
Delft University of Technology, Delft, The Netherlands
51. Gandhi, A. Prakash and M. A. Bergougnou, Powder Technol., 80 (1999).
52. Gandhi, B., A. Prakash and M.A. Bergougnou, Effects of Sparger Height and
Orifice Orientation on Solids Dispersion in a Slurry Bubble Column, Can. J. of
Chem. Eng. 77, 383-391 (1999).
53. Geary, N.W. and Rice, R.G., Circulation and Scale-up in bubble columns. AIChE
J., 38 (1), 76-82, 1992.
Page 285
259
54. Geerlings, J.J.C., Wilson, J.H., Kramer, G.J., Kuipers, H.P.C.E., Hoek, A.,
Huisman, H.M., Fischer-Tropsch Technology – From Active Site to Commercial
Process,” Applied Catalysis A: General, Vol. 186, (1999), pp. 27-40.
55. Groen, J.S., Oldeman, R.G.C., Mudde, R.F., & Van Den Akker, H.E.A. (1996).
Coherent structure and axial dispersion in bubble column reactors. Chemical
Engineering Science, 51(10), 2511}2520.
56. Gupta, P., 2002. Churn-turbulent bubble columns - experiments and modeling.
D.Sc. Thesis, Washington University in St. Louis, Saint Louis, MO, USA.
57. Gupta, P., Ong, B. C., Al-Dahhan, M. H., Dudukovic, M. P., and Toseland, B. A.,
2001. Hydrodynamics of churn turbulent bubble columns: gas-liquid recirculation
and mechanistic modeling, Catalysis today, 64, 253-269.
58. Hanning Li. Heat Transfer and Hydrodynamics in a Three-Phase Slurry Bubble
Column. Ph.D. Thesis, The University of Western Ontario London, Ontario
Canada, 1998.
59. Hebrard, G., Bastoul, D., & Roustan, M. (1996). Influence of the gas sparger on
the hydrodynamic behaviour of bubble columns. Transactions of the Institution of
Chemical Engineers, 74 (Part A), 406}414.
60. Highbie, R., Trans. AIChE, 31, 365 (1935)
61. Hills, J.H., Radial Non-Uniformity of Velocity and Voidage in a Bubble
Column", Trans. Instn. Chem. Engrs. 52, 1-9 (1974).
62. Hulet, C., Clement, P., Tochon, P., Schweich, D., Dromard, N., and Anfray, J.,
2009. Literature Review on Heat Transfer in Two and Three-Phase Bubble
Columns, Int. J. Chem. Reactor Eng., 7.
63. IEO, 2007. International Energy Outlook, Department of Energy. Washington,
DC, USA.
64. IEO, 2012. International Energy Outlook, Department of Energy. Washington,
DC, USA.
65. Inga, J. R. and B. I. Morsi, Effect of Catalyst Loading on Gas/Liquid Mass
Transfer in a Slurry Reactor: A Statistical Experimental Approach, Can. J. Chem.
Eng. 75(5), 872–881 (1997).
66. J. Chen, P. Gupta, S. Degaleesan, M.H. Al-Dahhan, M.P. Dudukovic, B.A.
Toseland, Flow Meas. Instr. 9 (1998) 91.
67. J. Duvenhage and T. Shingles, Catalysis Today, 71, 301 (2002).
Page 286
260
68. Jhawar, A.K, Effects of Internals Configurations on Heat Transfer and
Hydrodynamics in Bubble Columns – With and Without Solid Particles. Ph.D.
Thesis, The University of Western Ontario London, Ontario, Canada, 2011.
69. Jhawar, A.K., Prakash, A., 2007. Analysis of local heat transfer coefficient in
bubble column using fast response probes. Chemical Engineering Science. 62,
7274-7281.
70. Jhawar, A.K., Prakash, A., 2012. Heat Transfer in a Slurry Bubble Column
Reactor: A Critical Overview. Ind. Eng. Chem. Res. 51, 1464-1473.
71. Joshi, J.B., Computational flow modelling and design of bubble column reactors.
Chem. Eng. Sci., 56, 5893-5933, 2001.
72. Joshi, J.B.; Veera U P.; Prasad, V. C.; Phanikumar, D.V.; Deshphande, N. S.;
Thakre, S.S. and Thorat, B.N. Gas Hold-up structure in bubble column reactors.
PINSA 64, A, No.4, July,1998, 441-567
73. K. Zhang and Y. Zhao, Chem. Eng. Sci., 61, 1459 (2006).
74. Kafarov, V.V., Kruglik, A.E., and Trofimov, V.I., 1975. Comparative evaluation
of the effect of installation of some standard heat exchangers in bubble-type
columns on the average gas content and structure of liquid-phase streams.
75. Kang, Y., I.S. Suh and S.D. Kim, Heat Transfer Characteristics of Three Phase
Fluidized Beds, Chem. Eng. Comm. 34, 1-13 (1985).
76. Kantarci, N., Borak, F., and Ulgen, K.O. Bubble column reactors. Process
Biochemistry 40 (2005a): 2263 - 2283.
77. Kantarci, N., Ulgen, K.O., and Borak, F. "A study on hydrodynamics and heat
transfer in a bubble column with yeast and bacterial cell suspensions." The
Canadian Journal of Chemical Engineering 83.August (2005b): 764 - 773.
78. Karamanev, D., Nagamune, T., and Endo, I., Hydrodynamic and mass transfer
study of a gas-liquid-solid draft tube spouted bed bioreactor. Chem. Eng. Sci., 47
(13-14), 3581-3588, 1992.
79. Kato, Y., K. Uchida, T. Kago and S. Morooka, "Liquid Holdup and Heat Transfer
Coefficient between Bed and Wall in Liquid-Solid and Gas-Liquid-Solid
Fluidized Beds", Powder Technol. 28, 173-1 79 (1981).
80. Kemoum, A., Rados, N., Al-Dahhan, M., Dudukovic, M., Mills, P., Leib, T., and
Lerou, J., “Gas Holdup in a Trayed Cold-Flow Bubble Column”, Chem. Eng. Sci,
56, 1197-1205 (2001).
Page 287
261
81. Kim, S. D.; Kang, Y.; Kwon, H. K. Heat transfer characteristics in two- and three
phase slurry-fluidized beds. AIChE J. 1986, 32, 1397–1400.
82. Kim, S. D.; Laurent, A. The State of Knowledge on Heat Transfer in Three-Phase
Fluidized Beds. Int. Chem. Eng. 1991, 31, 284.
83. Kim, S.D., Kang, Y., 1997. Heat and mass transfer in three-phase fluidized-bed
reactors – an overview. Chemical Engineering Science. 52, 3639-3660.
84. Kluytmans, J.H.J., van Wachem, B.G.M., Kuster, B.F.M., Schouten, J.C., 2001.
Gas holdup in a slurry bubble column: influence of electrolyte and carbon
particles. Industrial Engineering Chemical Research 40, 5326–5333.
85. Kölbel, H., Borchers, E., and Martins, J. "Wärmeübergang in blasensäulen. III.
Messungen an gasdurchströmten suspensionen." Chemie Ingenieur Technik 32.2
(1960): 84 - 88.
86. Kolbel, H.; Ralek, M. Catal. Rev. Eng. Sci. 1980, 21, 225.
87. Korte, H., 1987. Heat transfer in bubble columns with and without internals,
Ph.D. Thesis, University of Dortmund, Germany.
88. Krishna R, Van Baten J. M. “Mass transfer in bubble columns.” Catal Today
2003; 79–80:67–75.
89. Krishna R., (2000), “A Scale-up Strategy for a Commercial Scale Bubble Column
Slurry Reactor for Fischer-Tropsch Synthesis.” Oil and Gas Science and Tech. 55
(4) 359-393.
90. Krishna, R. and Sie, S.T., Design and Scale-Up of the Fischer-Tropsch Bubble
Column Slurry Reactor. Fuel Process Technol., 64 (1-3), 73-105, 2000.
91. Krishna, R. and van Baten J.M., “A strategy for scaling up the Fischer–Tropsch
bubble column slurry reactor,” Topics in Catalysis Vol. 26, Nos. 1–4, December
2003.
92. Krishna, R., Deswart, J.W.A., Ellenberger, J., Martina, G.B., and Maretto, C., Gas
Holdup in Slurry Bubble-Columns - Effect of Column Diameter and Slurry
Concentrations. AIChE J., Vol 43 (Iss 2), 311-316, 1997.
93. Krishna, R., J. M. van Baten, M. I. Urseanu and J. Ellenberger, “Design and
Scale-Up of the Bubble Column Slurry Reactor for Fischer-Tropsch
Synthesis,” Chem. Eng. Sci. 56, 537–545 (2001).
Page 288
262
94. Krishna, R., Van Baten, J.M., and Urseanu, M.I., Scale effects on the
hydrodynamics of bubble columns operating in the homogeneous flow regime.
Chem. Eng. Tech., 24 (5), 451-458, 2001.
95. Kumar S., Kusakabe K., Raghunathan., K, Fan, L.S. Mechanism of Heat Transfer
in Bubbly Liquid and Liquid-Solid Systems: Single Bubble Injection. AIChE J.,
1992, 38(5), 733-741.
96. Kumar, B.S., Moslemian, D., & DudukovicH, M.P. (1995). A gamma ray
tomographic scanner for imaging void fraction distribution in bubble columns.
Flow Measurement and Instrument, 6(1), 61}73.
97. Kumar, R., and N. R. Kuloor, “The formation of bubbles and drops,” Advances in
Chemical Engineering, 8, 255 (1970).
98. Kumar, S. B., 1994, Computed tomographic measurements of void fraction and
modeling of the flow in bubble columns, Ph.D. Thesis, Florida Atlantic
University.
99. Kumar, S., Fan, L. S., 1994., "Heat Transfer Characteristics in Viscous Gas-
Liquid and Gas-Liquid-Solid System," AICHE J., 40, 745-755
100. Kumar, S.B., Moslemian, D., & DudukovicH, M.P. (1997). Gas holdup
measurements in bubble columns using computed tomography. The American
Institute of Chemical Engineers Journal, 43(6), 1414}1425.
101. Larachi, F.; Desvigne, D.; Donnat, L.; Schweich, D. Simulating the effects of
liquid circulation in bubble columns with internals. Chem. Eng. Sci. 2006, 61
(13), 4195–4206.
102. Lehman, J. and Hammer, J., (1978), Continuous fermentation in tower fermentor,
I European congress on biotechnology, Interlaken, Part 1, 1.
103. Li H., Prakash, A., Margaritis, A., and Bergougnou, M.A., 2003. Effects of
micron-size particles on hydrodyanamics and local heat transfer in a slurry bubble
column. Powder Technonlgy, 133, 171-184.
104. Li, H., and Prakash, A. "Heat transfer and hydrodynamics in a three-phase slurry
bubble column." Industrial Engineering Chemistry and Research 36 (1997): 4688-
4694.
105. Li, H., and Prakash, A., 2001. Survey of heat transfer mechanisms in a slurry
bubble column. The Canadian Journal of Chemical Engineering, 79, 717-725.
Page 289
263
106. Lin, T.J., and Fan, L.S. "Heat transfer and bubble characteristics from a nozzle in
high-pressure bubble columns." Chemical Engineering Science 54 (1999): 4853 -
4859.
107. Luewisutthchat, W.; Tsutsumi, A.; Yoshida, K. Bubble characteristics in
multiphase flow systems: bubble sizes and size distributions. J. Chem. Eng. Jpn.
1997, 30 (3), 461 466.
108. Luo X, Lee DJ, Lau R, Yang G, Fan L. Maximum stable bubble size and gas
holdup in high-pressure slurry bubble columns. AIChE J 1999; 45:665–680.
109. Luo, Hean; Svendsen, Hallvard F., (1991). Turbulent circulation in bubble
columns from eddy viscosity distributions of single-phase pipe flow, Can. J. of
Chem.
110. Macchi, A., H. Bi, J. R. Grace, C. A. McKnight and L. Hackman, “Dimensional
Hydrodynamic Similitude in Three-Phase Fluidized Beds,” Chem. Eng. Sci. 56,
6039–6045 (2001).
111. Magiliotou, M., Y. Chen and L.S. Fan, "Bed-Immersed Object Heat Transfer in a
Three Phase Fluidized Bed", AlChE J. 34, 1043-1 047 (1988).
112. Maretto, C., and Krishna, R. "Modelling of a bubble column slurry reactor for
Fischer-Tropsch synthesis." Catalysis Today 52 (1999): 279 - 289.
113. Menzel, T., in der Weide, T., Staudacher, O., Wein, O., & Onken, U. (1990).
Reynolds shear stress for modeling of bubble column reactors. Industrial &
Engineering Chemistry Research, 29(6), 988}994.
114. Michael, R., and Reichert, K.H. "Heat transfer of polyethylene-hydrocarbon
dispersions in bubble column reactors." The Canadian Journal of Chemical
Engineering 59.October (1981): 602 - 605.
115. Mohamed Hamed “Hydrodynmaics, Mixing, and Mass Transfer in Bubble
Columns with internals” Ph.D. Thesis, Washington University: Saint Louis,
Missouri, 2012.
116. Moriyama, K. & Inoue, A. (1996). Thickness of the liquid film formed by a
growing bubble in a narrow gap between two horizontal plates, Transactions of
the ASME, 118, 132-139.
117. Nernst, W.Z. Phys.Chem., 47, 52 (1904)
118. Nigam, K.D.P.; Schumpe, A. Three-Phase Sparged Reactors; Overseas Publishers
Association B.V.: Amsterdam, 1996.
Page 290
264
119. Nottenkamper, R., A. Steiff and P.M. Weinpach, "Experimental Investigation of
Hydrodynamics of Bubble Columns", Ger. Chem. Eng. 6, 147-155 (1983).
120. Ong, B. C., Gupta, P., Youssef, A., Al-Dahhan, M. and Dudukovic, M. P., 2009.
Computed Tomographic Investigation of the Influence of Gas Sparger Design on
Gas Holdup Distribution in a Bubble Column, Ind. Eng. Chem. Res., 48, 58–68.
121. P.J. van Berge, R.C. Everson, Stud. Surf. Sci. Catal. 107 (1997) 207.
122. Pohorecki, R.; Moniuk, W.; Zdrojkowski, A.; Bielski, P. Hydrodynamics of a
pilot plant column under elevated temperature and pressure. Chem. Eng. Sci.
2001, 56, 1167–1174.
123. Pradhan, A. K.; Parichia, R.; K.; De, P. Gas hold-up in non Newtonian solutions
in a bubble column with internals. Can. J. Chem. Eng. 1993, 71, 468–471.
124. Prakash A, Margaritis A, Li H. Hydrodynamics and local heat transfer
measurements in a bubble column with suspension of yeast. Biochem Eng J
2001;9:155 63.
125. Raje, A., Inga, J.R., Davis, B., “Fischer-Tropsch Synthesis: Process
Considerations Based on Performance of Iron-based Catalysts,” Fuel, Vol. 76,
(1997), pp. 273-280.
126. Riquarts, H. P. (1981). A physical model for axial mixing of the liquid phase for
heterogeneous flow regime in bubble columns. German Chemical Engineering, 4,
18}23.
127. S. Barghi, A. Prakash, A. Margaritis, M. A. Mergougnou, Can. J. Chem. Eng.
2004, 82, 865.
128. S.B. Kumar, N. Devanathan, D. Moslemian, M.P. Dudukovic, Chem. Eng. Sci. 49
(1994) 5637.
129. Safoniuk, M., J. R. Grace, L. Hackman and C. A. McKnight, “Use of
Dimensional Similitude for Scale-Up of Hydrodynamics in Three-Phase Fluidized
Bed,” Chem. Eng. Sci. 54, 4961–4966 (1999).
130. Saxena SC, Rao NS, Saxena AC. "Heat Transfer and Gas Holdup Studies in a
Bubble Column: Air-Water-Glass Bead System", Chem. Eng. Commun. 96, 31-
55 (1990a).
131. Saxena SC, Rao NS, Saxena AC. "Heat Transfer and Gas Holdup Studies in a
Bubble Column: Air-Water-Sand System", Can. J. Chem. Eng. 70, 33-41 (1992).
Page 291
265
132. Saxena SC, Rao NS, Saxena AC. "Heat Transfer from a Cylindrical Probe
Immersed in a Three Phase Slurry Bubble Column", Chem. Eng. J. 44, 141-156
(1990b).
133. Saxena, S.C., and Chen, Z.D. "Hydrodynamics and heat transfer of baffled and
unbaffled slurry bubble columns." Reviews in Chemical Engineering 10.3,4
(1994): 195 - 400.
134. Saxena, S.C., Verma, A.K., Vadivel, R., and Saxena, A.C. "Heat transfer from a
cylindrical probe in a slurry bubble column." International Communications in
Heat and Mass Transfer 16.2 (1989c): 267 - 281.
135. Schlichting, H., "Boundary Layer Theory", McCraw-Hill, New York, NY (1968).
136. Schlüter, S., Steiff, A., Weinspach, P.-M., 1995. Heat transfer in two- and three-
phase bubble column reactors with internals. Chemical Engineering and
Processing, 34, 157-72.
137. Schweitzer J.M., Bayle, J., Gauthier, T (2001) “ Local gas hold-up measurements
in fluidized bed and slurry bubble column”, Chemical Engineering Science 56,
1103-1110.
138. Sehabiague L., Modeling, Scaleup and Optimization of Slurry Bubble Column
Reactors for Fischer-Tropsch Synthesis, Ph.D. Thesis, University of Pittsburgh,
Pittsburg, PA, 2012.
139. Shah, Y. T., Ratway, C. A., and Mcilvried, H. G., 1978. Back-mixing
characteristics of a bubble column with vertically suspended tubes, Transactions
of the Institution of Chemical Engineers, 56(2), 107-112.
140. Shah, Y.T., Kelkar, B.G., Godbole, S.P., Deckwer, W.D. “Design Parameters
Estimations for Bubble Column Reactors,” AIChE, Journal, Vol. 28, (1982), pp.
353-379.
141. Shaikh, A., 2007. Bubble and slurry bubble column reactors for syngas to liquid
fuel conversion: mixing, flow regime transition, and scale-up, D.Sc. Thesis,
Washington University in St. Louis, Saint Louis, MO, USA.
142. Shedd, T. A. & Newell, T. A. (2004). Characteristics of the liquid film and
pressure drop in horizontal, annular, two-phase flow through round, square and
triangular tubes, Journal of Fluid Engineering, 126, 807-817.
143. Shimizu K, Takada S, Minekawa K, Kawase Y. Phenomenological model for
bubble column reactors: prediction of gas holdups and volumetric mass transfer
coefficients. Chem Eng J 2000; 78:21–8.
Page 292
266
144. Shin I. S., Son S.M., Kim U. Y., Kang Y., Kim S. D., and Jung H. 2009.,
“Multiple effects of operating variables on the bubble properties in three-
phase slurry bubble columns.” Korean J. Chem. Eng., 26(2), 587-591.
145. Suh, I.S. and W.D. Deckwer, "Unified Correlation of Heat Transfer Coefficient in
Three-Phase Fluidized Beds", Chem. Eng. Sci. 44, 1455-1 458 (1989).
146. Tang C, Heindel TJ. Time-dependent gas holdup variation in an air–water bubble
column. Chem Eng Sci 2004; 59:623–32.
147. Tang, W.T. and Fan, L.S., Gas-liquid mass transfer in a three-phase fluidized bed
containing low density particles. Ind. Eng. Chem. Res., 29 (1), 128-133, 1990.
148. Tareef, B.M., "Thermal Conductivity of Colloidal Systems", Colloidal J. of USSR
6, 545 (1940).
149. Tsuge, H., and S. Hibino, “Bubble formation from an orifice submerged in
liquids,” Chem. Eng. Comm., 22, 63 (1983).
150. Ueyama, K., S. Morooka, K. Koid, H. Kaji and T. Miyauchi, "Behavior of Gas
Bubbles in Bubble Columns", Ind. Eng. Chem. Proc. Des. Dev. 19,592-599
(1980)
151. Van Baten J. M., and Krishna R. Scale effects on the Hydrodynamics of Bubble
Columns Operating in the Heterogeneous Flow Regime. Chemical Eng. Research
and Design, 2004, 82(A8): 1043–1053
152. Vand, V., "Viscosity of Solutions and Suspensions", J. Phys. Chem. 52, 277
(1948).
153. Vandu, C.O. and Krishna, R., Influence of scale on the volumetric mass transfer
coefficient in bubble columns. Chem. Eng. and Proc., 43, 575-579, 2004a.
154. Vandu, C.O. and Krishna, R., Volumetric mass transfer coefficients in slurry
bubble columns operating in the churn-turbulent flow regime. Chem. Eng. and
Proc., 43, 987- 995, 2004b.
155. Veera UP, Kataria KL, Joshi JB. Effect of superficial gas velocity on gas hold-up
profiles in foaming liquids in bubble column reactors. Chem Eng J 2004; 99:53–8.
156. Verma, A.K., 1989, Heat transfer mechanism in bubble columns. Chem Eng J, 42:
205–208.
157. Vinit P. C. Hydrodynamics and Mass Transfer in Slurry Bubble Columns: Scale
and Pressure Effects. Ph.D. Thesis, Eindhoven University of Technology, The
Netherlands, 2007.
Page 293
267
158. Wang S, Arimatsu Y, Koumatsu K, Furumato K, Yoshimato M, Fukunaga K, et
al. Gas holdup, liquid circulating velocity and mass transfer properties in a mini-
scale external loop airlift bubble column. Chem Eng Sci 2003; 58:3353–60.
159. Wasan, D. T.; Ahluwalia, M. S. Consecutive Film and Surface Renewal
Mechanism for Heat and Mass Transfer from a Wall. Chem. Eng. Sci. 1969, 24,
1535.
160. Wender, I., 1996. Reactions of Synthesis Gas, Fuel Processing Technology, 48,
189-297.
161. Wilkinson, P. M., A. P. Spek and L. L. van Dierendonck, “Design Parameters
Estimation for Scale-Up of High Pressure Bubble Columns,” AIChE J. 38(544),
(1992).
162. Wu, C. Heat Transfer and Bubble Dynamics in Slurry Bubble Columns for
Fischer Tropsch Clean Alternative Energy, Ph.D. Thesis, Washington University:
Saint Louis, MO, 2007.
163. Wu, C., Al-Dahhan, M.H., and Prakash, A. "Heat transfer coefficients in a high
pressure bubble column." Chemical Engineering Science 62.1-2 (2007): 140 -147.
164. Xue, J. Bubble velocity, size and interfacial area measurements in bubble
columns, Ph.D. Thesis, Washington University, Saint Louis, MO, 2004.
165. Xue, J., Al-Dahhan, M., Dudukovic, M., P., and Mudde, R., F., 2008. Bubble
velocity, size, and interfacial area measurements in a bubble column by four-
point optical probe, AIChE J., 54(2), 350-363.
166. Yagi, H. and Yoshida, F. Oxygen Absorption in Fermenters-Effects of
Surfactants, Antifoaming Agents, and Sterilized Cells. J. Ferment. Tech., 52, 905-
916, 1974.
167. Yang, G. Q.; Luo, X.; Lau, R.; Fan, L. S. Heat-Transfer Characteristics in Slurry
Bubble Columns at Elevated Pressures and Temperatures. Ind. Eng. Chem. Res.
2000, 39, 2568-2577
168. Yang, G.Q. and Fan, L.S., Axial liquid mixing in high-pressure bubble columns.
AIChE J., 49 (8), 1995-2008, 2003.
169. Yasunishi, A.; Fukuma, M.; Muroyama, K. Measurement of behavior of gas
bubbles and gas holdup in a slurry bubble column by a dual
electroresistivity probe method. J. Chem. Eng. Jpn. 1986, 19 (5), 444–449.
Page 294
268
170. Youssef Ahmed A. Fluid Dynamics and Scale-up of Bubble Columns with
internals, Ph.D. Thesis, Washington University: Saint Louis, MO, 2010.
171. Youssef Ahmed A.; Al-Dahhan M.H.; Impact of Internals on the Gas Holdup and
Bubble Properties of a Bubble Column. Ind. Eng. Chem. Res. 2009, 48, 8007–
8013.
172. Yuanxin Wu, and M. H. Al-Dahhan “Prediction of axial liquid velocity profile in
bubble columns” Chemical Engineering Science 56 (2001) 1127}1130.
173. Zahradnik, J.; Drapal, L.; Kastanek, F.;Reznickova, J. Hydrodynamics and mass
transfer characteristics of sectionalized aerated slurry reactors. Chem. Eng.
Process., 31, 263-272, 1992.
174. Zaidi, A., Deckwer, W.D., Mrani, A., and Benchekchou, B. "Hydrodynamics and
heat transfer in three-phase fluidized beds with highly viscous pseudoplastic
solutions." Chemical Engineering Science 45.8 (1990): 2235 - 2238.
175. Zhang, K. and Y. Zhao, “A Scale-Up Strategy for Low-Temperature Methanol
Synthesis in a Circulating Slurry Bubble Reactor,” Chem. Eng. Sci. 61, 1459–
1469 (2006).
Page 295
269
VITA
Moses Odongo O. Kagumba was born in Migori, Kenya on November 21, 1978.
In May 2004, he received a BSc. with Honors in Chemistry and Mathematics from the
University of Nairobi, Nairobi, Kenya. After teaching Chemistry and Mathematics for 3.5
years, at Mbita High School, he joined Missouri University of Science and Technology,
(Missouri S&T), formally UMR for masters degree program in Chemistry. After 2
semesters before completing the masters program, he switched to Chemical Engineering
in June of 2009 at Missouri S&T. In April 2013, he received his Ph.D. in Chemical
Engineering from Missouri University of Science and Technology, Rolla, Missouri, USA.
He has had conference publication and a number of presentations; including at the
American Institute of Chemical Engineers 2012 annual conference. He has been a
member of American Institute of Chemical Engineers, (AIChE) since May 2010.
Listed below are the publication and presentations he has given among others.
Publications
M.O. Kagumba, Y. Abdulaziz, and M.H. Al-Dahhan, “Effect of Internals and
Solids Loading on Bubble Dynamics in Slurry Bubble Columns”. 2012 AIChE
Annual Meeting, October 28-November 2, David L. Lawrence Convention
Center, Pittsburgh PA, U.S.A
Presentations
M.O. Kagumba, and M.H. Al-Dahhan, “Combined Heat Transfer Coefficient and
Bubble Dynamics Measurements in Bubble Columns: Assessment of a
Mechanistic Approach”, 2012 AIChE Annual Meeting, October 28-November 2,
David L. Lawrence Convention Center, Pittsburgh PA, U.S.A
M.O. Kagumba, Y. Abdulaziz, and M.H. Al-Dahhan, “Effect of Internals and
Solids Loading on Bubble Dynamics in Slurry Bubble Columns”. 2012 AIChE
Annual Meeting, October 28-November 2, David L. Lawrence Convention
Center, Pittsburgh PA, U.S.A
Stoyan Nedeltchev*, Moses Kagumba and Muthanna Al-Dahhan “Flow Regime
Identification in a Bubble Column with a Conically-Shaped Inlet Based On
Optical Probe Data and Different Entropies” 1st International Symposium on
Multiscale Multiphase Process Engineering October 4‐7, 2011, Ishikawa
Prefecture Japan