Case Study - August 2003 heatwave Europe More than 20,000 people died after a record-breaking heatwave left Europe sweltering between June - August 2003. Temperatures were 20-30% higher than the seasonal average over most of the continent (Figure 1). Extreme maximum daily temperatures of 35-40°C were recorded during July and August in many Central and Southern Countries (e.g. German down to Turkey) and remained high for at least 2 weeks. In Switzerland, June was the hottest month ever recorded (records began 250 years ago), and a new record of 41.5°C was set on August 11. Temperatures were +5.4°C above average in Geneva. Because the air was dry, there was also little rainfall. Source: UNEP – Impacts of the summer 2003 heat wave in Europe. http://www.unisdr.org/files/1145_ewheatwave.en.pdf
Transcript
Case Study - August 2003 heatwave Europe More than 20,000 people died after a record-breaking heatwave left Europe sweltering between June - August 2003. Temperatures were 20-30% higher than the seasonal average over most of the continent (Figure 1). Extreme maximum daily temperatures of 35-40°C were recorded during July and August in many Central and Southern Countries (e.g. German down to Turkey) and remained high for at least 2 weeks. In Switzerland, June was the hottest month ever recorded (records began 250 years ago), and a new record of 41.5°C was set on August 11. Temperatures were +5.4°C above average in Geneva. Because the air was dry, there was also little rainfall. Source: UNEP – Impacts of the summer 2003 heat wave in Europe. http://www.unisdr.org/files/1145_ewheatwave.en.pdf
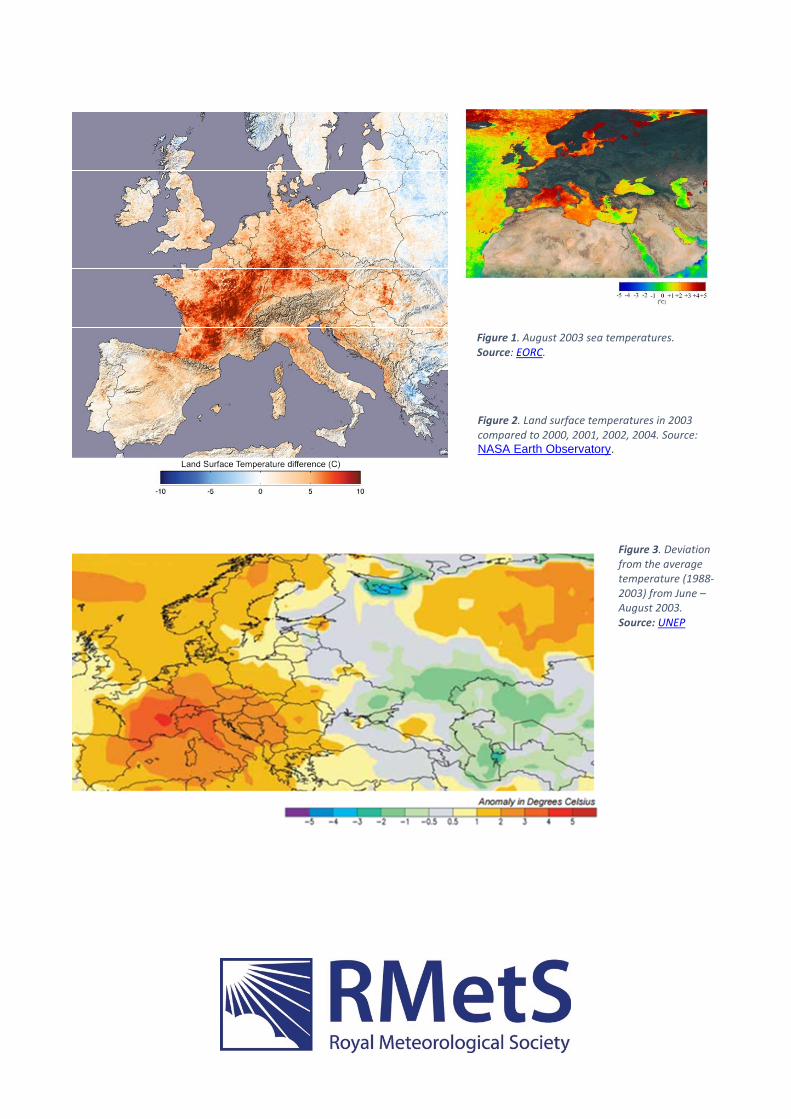
Figure 3. Deviation from the average temperature (1988-2003) from June – August 2003. Source: UNEP
Figure 1. August 2003 sea temperatures. Source: EORC.
Figure 2. Land surface temperatures in 2003 compared to 2000, 2001, 2002, 2004. Source: NASA Earth Observatory.
What caused the heatwave? High pressure over Western Europe persisted for several weeks and created Easterly winds that brought hot, dry air from the interior of the continent, and Southerly winds that brought very hot, dry air up from North Africa. With little moisture in the air, the skies were generally cloudless, allowing insolation to further heat the land and sea.
Consequences Physical � Low river flows and lake levels
The River Danube in Serbia fell to its lowest level in 100 years. Bombs and tanks from World War 2, which had been submerged under water for decades, were revealed, causing a danger to people swimming in the rivers. Reservoirs and rivers used for public water supply and hydro-electric schemes either dried up or ran extremely low.
� Forest fires The lack of rainfall meant very dry conditions occurred over much of Europe. Forest fires broke out in many countries. In Portugal 215,000 hectares of forest were destroyed (an area the same size as Luxembourg). A Secondary impact was the estimated millions of tonnes of topsoil that were eroded in the year after the fires as the protection of the forest cover was removed. This made river water quality poor when the ash and soil washed into rivers.
Figure 5 Visible light Satellite image showing how much sunlight is being reflected. Notice that the cloud West of France and the UK must be very thin as it does not show up in the IR image (Fig 3.). 2pm, 5 August 2003. Source: Met Office
Figure 4. Infrared (IR) Satellite image showing land temperature (darker = hotter) and cloud cover (whiter = thicker) in Europe. 2pm, 5 August 2003. Source: Met Office
� Melting glaciers
Extreme snow and glacier-melt in the European Alps led to increased rock and ice falls in the mountains. Glaciers lost 5 times more water than normal, some losing nearly 10% of their ice.
Social / Human � Increased mortality
The death toll is estimated to have exceeded 30,000 people, making the heat wave the deadliest natural disaster for 50 years. About 15,000 people died due to the heat in France, which led to a shortage of space to store dead bodies in mortuaries. Temporary mortuaries were set up in refrigeration lorries. There were also heat-related deaths in the UK (2,000), Portugal (2,100), Italy (3,100), Holland (1,500) and Germany (300). The elderly were the most affected, though deaths caused by drowning increased in a wide-range of ages (as people tried to cool off). Usually after a winter flu epidemic, for example, there is a corresponding dip in mortality after the peak because many of the people who died were extremely ill or frail and in fact only died a few weeks earlier than they would have done without the flu. After the heatwave, there wasn’t a dip – it affected people who wouldn’t otherwise have died soon.
� Heat-related illness o Heat-stroke
On very hot days our bodies may not be able to keep cool enough by sweating, and our core body temperature may rise. Unless we can cool off at night our bodies struggle to cope and it can lead to headaches, dizziness and even death.
Figure 6. Visible light satellite image of forest fires in Southern Portugal and Spain, September 2003. Fires are red dots – the largest in the South West shows smoke blowing out over the Atlantic. Source: Met Office.
o Dehydration This is the loss of water from our bodies. It can cause tiredness and problems with breathing and heart rates.
o Sunburn Damage to the skin which can be painful and may increase the risks of getting skin cancer.
� Energy o Production
Nuclear reactors in France had to shut when the water level of rivers that provided cooling water became too low, or the temperatures became too high. Some reactors were given permission to exceed limits and harmed the river ecosystem by discharging water that was too hot. UNEP
o Use Energy demand soared as people used AC and refrigeration units needed more energy to keep food cold.
� Air pollution It is thought that one third of the deaths caused by the heatwave in the UK were caused by poor air quality.
� Crime Hot weather is linked to increased street violence and attacks, and rioting is more likely, though the relationship is complicated and not well understood.
Environmental � Infrastructure
Heat waves stress infrastructure and make failures more likely. o Physical infrastructure such as water and electricity networks can fail under high demand
and affect a large number of people e.g. If water supplies are affected hose-pipe bans may be enforced, and eventually water may be cut off to homes.
o Service/emergency infrastructure can be overwhelmed and staff themselves made prone to heat illnesses because of overwork; the capacity of hospitals, Doctors surgeries, mortuaries can all be exceeded. In both cases patient safety is affected.
� Tourism Good weather can increase tourism. If the weather is too extreme, though, it can cause problems that reduce tourist numbers.
� Farming Both the quantity and quality of harvests fell in affected areas as plants did not receive enough water. Many chickens, pigs and cows died, animal fodder production fell 30-60%, the cereal (e.g. wheat) harvest fell by 23 million tonnes. Secondary effects in the following months were soil
erosion, flooding, and feed/seed price increases. Although food prices rose, European farming lost about 13.1 billion euros.
� Transport Some railway tracks buckled in the heat. The London Underground became unbearable. Some road surfaces melted. Low river levels prevented some boats from sailing.
Responses Short-term � Weather forecasts provide the general public and governments with advance warning of extreme
weather. This allows simple preparations to be completed and precautions to be taken. � Restrictions can minimise impacts on stressed infrastructure. E.g. speed limits on railways (if rails
may buckle), hose-pipe bans to conserve water. � Advisory advertising helps people to understand what they can do to help themselves, and what
they should and shouldn’t do while the extreme weather persists – simple actions such as drinking plenty of water, wearing cool clothing, and staying in the shade in the middle of the day. This is most effective when it reaches the most people, so would be on TV/radio, online, in newspapers, and on social media.
Long-term � Aid
France requested aid from the European Union to deal with the effects. � Planning
Public water supply shortages occurred in several countries, including the UK and Croatia, which led to a temporary ban on using hose pipes. The French government has made efforts to improve its prevention, surveillance and alert system for people such as the elderly living alone.
� Flexible working Workers around Europe altered their working hours. Some refuse collectors started earlier to pick up rapidly decomposing rubbish from the streets and avoid the heat of the day.
UK Historic heatwaves Figure 7 The Guardian, 4 August 1990
10 August 1911 (36.7°C) Temperatures topped 100 Fahrenheit, breaking previous records, according to a meteorological correspondent writing for the Manchester Guardian. The report also noted how torrid the weather was in London, the only relief coming from a gentle breeze from the north. 13 July 1923 (34.4°C) Experts predicted no let-up, eight days into the heatwave of 1923. The paper described the outlook as 'perspiring'. 19 August 1932 (35.6°C) In central London, thermometers recorded 33°C (91.4F), while in the suburbs it was only slightly cooler. On the continent they were 'roasting', according to reports, as temperatures in cities like Paris reached 32°C (89.6F) in the shade. 27 July 1933 (34.4°C) As the heatwave ends, reports warn about ‘hurricanes’ from central Europe. 29 June 1957 (34.4°C) A month of solid sunshine, with temperatures nearing 36°C (96.8F), comes to an end with the arrival of thunder storms and heavy rain. 5 July 1959 (34.4°C) While the southern half of the country enjoyed a full day of sunshine on the hottest day of the year, day trippers to northern coastal resorts were sent home early as torrential rain followed a sunny start. 3 July 1976 (35.9°C) Baking hot temperatures led to severe water shortages, promoting the Labour government to encourage people to share their bath water. The Observer's Sue Arnold took to London's streets to see how people were adjusting to living in a hot country. 3 August 1990 (37.1°C) Cheltenham records the UK's highest ever temperature, breaking the 1911 record. A postmistress in Nailstone in Leicestershire says that villagers were sticking their heads in the post office cold cabinet to cool down. 1 August 1995 (35.2°C) The UK had enjoyed fine weather all summer with temperatures peaking at the start of August (35.2ºC/95.36F).
10 August 2003 (38.5°C) The Met Office confirms a new record for the highest-ever temperature recorded was in Brogdale, Kent, where it reached 38.5°C (101.3F). Temperatures in parts of the UK are set to climb beyond 30°C (86F) later today. Source: https://www.theguardian.com/theguardian/from-the-archive-blog/2014/jul/18/heatwave-weather-summer-temperatures
BBC news article: Sizzling temperatures break UK record(August 2003) � The heat has brought with it violent thunder storms, heavy rain and lightning across northern
England and the Midlands. � More than 20 people were injured after being struck by lightning.
o Fourteen were hurt when lightning struck a football match in a leisure centre in Birmingham on Sunday afternoon.
o One woman was directly hit and had a heart attack, while others were treated for burns, eye injuries and shock.
o In Lancashire, two Brownies were slightly injured when lightning struck between them at a camp near Blackburn.
o Another six people were injured when lightning struck at an agriculture show in Corley, Warwickshire.
� Roads to the south and west coasts were jammed on Sunday as motorists headed to and from the seaside.
o Resorts including Clacton-on-Sea in Essex and Tenby in Pembrokeshire said there were no spare beds at all in hotels and B&Bs.
o At Bournemouth in Dorset, the coastline was crammed to capacity with about 100,000 sun lovers and "no spare sand".
o Brighton beaches were crowded and chaotic, with the sea front office saying: "There have been lots of lost children, pier jumpers, drunks and other shenanigans which we are dealing with."
� The Met Office's chief weather forecaster Nigel Reed explained [that] "The longer a hot spell lasts the higher the temperature gets each day, typically about a degree each day. In the years to come, as the earth's atmosphere does heat up through global warming, we would expect to see these hot weather events happening with greater frequency.”
� Delays on the railways continue due to speed restrictions imposed by Network Rail at noon each day while temperatures remain above 30°C.
Source : Original article with images http://news.bbc.co.uk/1/hi/uk/3138865.stm
Internet sources � http://www.metoffice.gov.uk/learning/learn-about-the-weather/weather-phenomena/case-
studies/heatwave an overview of the 2003 heat wave � Quite complex but lots of info on impacts and (short-/longer-term) responses, pages 24-31
� Straight-forward advice on short-term responses. http://www.redcross.org.uk/What-we-do/Preparing-for-disasters/How-to-prepare-for-emergencies/Heatwaves
� Simpler advice, with emphasis on the elderly http://www.ageuk.org.uk/Documents/EN-GB/Information-guides/AgeUKIL1_staying_cool_in_a_heatwave_inf.pdf?dtrk=true
� Simple advice from the government (short term responses) https://www.gov.uk/government/uploads/system/uploads/attachment_data/file/525361/Beattheheatkeepcoolathomechecklist.pdf
� Human impacts and responses from the NHS http://www.nhs.uk/Livewell/Summerhealth/Pages/Heatwave.aspx
� Met Office advice – Short or Long term response (planning)? http://www.metoffice.gov.uk/public/weather/heat-health/#?tab=heatHealth
� Short-term responses from the BBC http://www.bbc.co.uk/newsbeat/article/36833946/heatwave-myths-the-tips-and-tricks-that-help-you-keep-your-cool
� Short term responses from the Daily Telegraph newspaper http://www.telegraph.co.uk/news/weather/11707933/Heatwave-advice-2015-how-to-cope-with-the-UK-weather.html
� Short-term responses from the Guardian newspaper https://www.theguardian.com/uk-news/2015/jun/30/britains-heatwave-how-to-cope
Temperature records broken at Met Office weather stations, August 2003. (Temperatures in °C)
Site Date Max. Date Max. Date Max. Date Max. Jersey Airport 5 34.8 Jersey St Helier 5 34.2 9 36 Wisley (Surrey) 5 33.9 6 36.1 10 37.8 Guernsey Airport 5 33.7 Valley (Anglesey) 5 33 Gravesend-Broadness (Kent) 6 36.4 10 38.1 Greenwich Observatory (London) 6 36.3 9 36 10 37.5 Kew Royal Botanic Gardens (London) 6 36.1 9 36 10 38.1 Cambridge Guildhall (Cambridgeshire) 6 36 10 37.5 Enfield (London) 9 36.4 10 37.8 Met Office London 9 36 10 37.6 Brogdale near Faversham (Kent) 10 38.5 Heathrow (London) 10 37.9 Northolt (London) 10 37.7 St. James's Park (London) 10 37.6 East Malling (Kent) 10 37.4 Cavendish (Suffolk) 10 37.3 Northwood (London) 10 37
Activity Using the information above and the links to internet sources, complete notes under the following headings in relation to the causes, effects and response to the heatwave in the UK.