Alaska DePartment of fish and Game Division of Wildlife Conservation federal Aid in Wildlife Restoration Research Performance RePort I JulY 1998- 30 June 1999 ImPacts of Heavy Huntini! Pressure on the DensitY and Demoi!raPhics · of Brown Bear PoPulations in Southcentral Alaska J Ward Testa William P TaYlor Sterline D Miller Gerhard Kraus Grant W-27-2 Study 4.26 December 1999
Transcript
Alaska DePartment of fish and Game Division of Wildlife Conservation
federal Aid in Wildlife Restoration Research Performance RePort
I JulY 1998- 30 June 1999
ImPacts of Heavy Huntini! Pressure on the DensitY and Demoi!raPhics ·of Brown Bear
PoPulations in Southcentral Alaska J Ward Testa
William PTaYlor Sterline D Miller
Gerhard Kraus Grant W-27-2 Study 4.26
December 1999
STATE OF ALASKA Tony Knowles, Governor
DEPARTMENT OF FISH AND GAME Frank Rue, Commissioner
DIVISION OF WILDLIFE CONSERVATION Wayne L. Regelin, Director
Persons intending to cite this material should receive permissiOn from the author(s) and/or the Alaska Department of Fish and Game. Because most reports deal with preliminary results of continuing studies, conclusions are tentative and should be identified as such. Please give authors credit.
Free copies of this report and other Division of Wildlife Conservation publications are available to the public. Please direct requests to our publications specialist:
The Alaska Department of Fish and Game administers all programs and activities free from discrimination based on race, color, national origin, age, sex, religion, marital status, pregnancy, parenthood, or disability. The department administers all programs and activities in compliance with Title VI of the Civil Rights Act of 1964, Section 504 of the Rehabilitation Act of 1973, Title II of the Americans with Disabilities Act of 1990, the Age Discrimination Act of 1975, and Title IX of the Education Amendments of 1972.
If you believe you have been discriminated against in any program, activity, or facility, or if you want further information please write to ADF&G, P.O. Box 25526, Juneau, AK 99802-5526; U.S. Fish and Wildlife Service, 4040 N. Fairfield Drive, Suite 300, Arlington, VA 22203 or O.E.O., U.S. Department of the Interior, Washington DC 20240.
For information on alternative formats for this and other department publications, please contact the department ADA Coordinator at (voice) 907465-4120, (TDD) 907-465-3646, or (FAX) 907-465-2440.
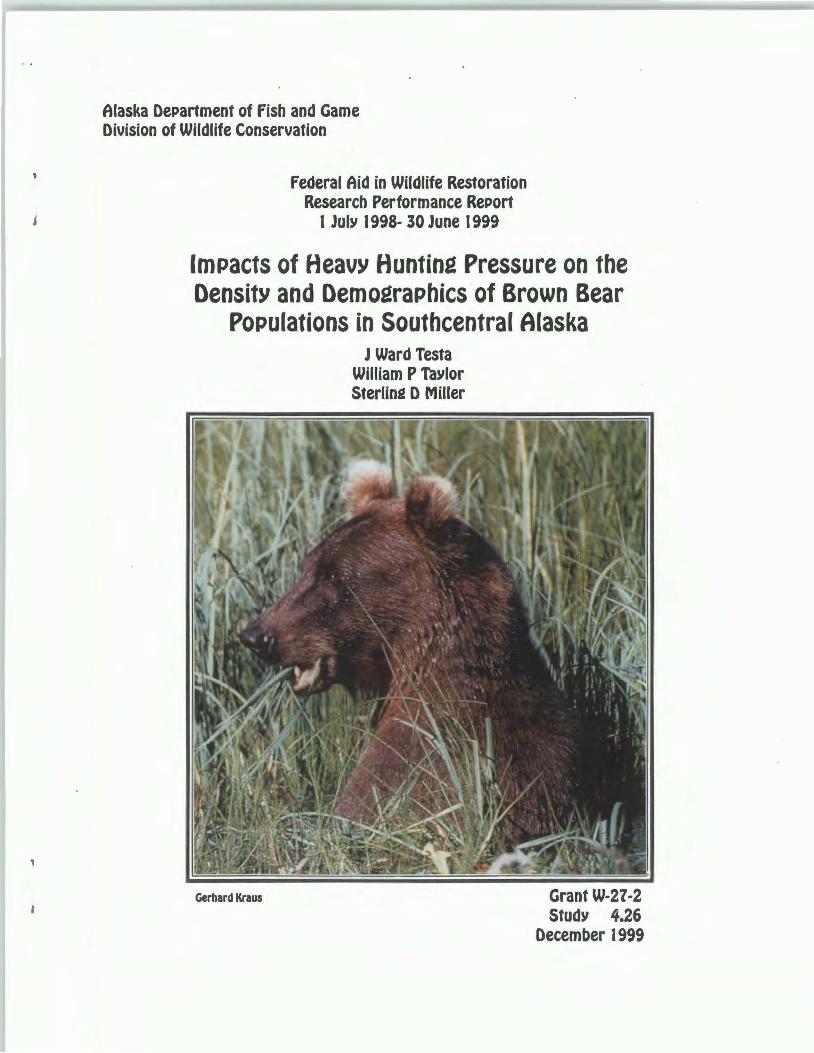
COVER Photographer/travel writer Gerhard Kraus lives in the German Alps and specializes in northern countries of the world. He has spent much time hiking Alaska's major trails and canoeing Alaska's rivers. Kraus has written books about Scandinavia and over 100 articles about trekking, mountaineering, canoeing, cycling, and cross-country skiing. He currently writes for Nordis magazine. In this photograph Kraus captures an alert yet restful brown bear.
TITLE: Impacts of Heavy Hunting Pressure on the Density and Demographics of Brown Bear Populations in Southcentral Alaska
PERIOD: 1 July 1998-30 June 1999
AUTHORS: J Ward Testa, William P Taylor, and Sterling D Miller
SUMMARY
From 18 May-1 June, 1998, we applied a Capture-Mark-Resight (CMR) technique to brown bears in a 2150 square kilometer portion of Game Management Unit (GMU) 13A following guidelines developed by Miller et al. (1997). The study area was chosen to represent habitats ranging from high mountain ridges in the Talkeetna Mountains to lower elevation (800 m) spruce bog in the Lake Louise Flats. It was also chosen to encompass important concentrations of calving moose and caribou in the drainages of Tyone Creek and the Oshetna, Little Oshetna and Black Rivers. The average densities of independent bears, bears 2': 2 years old, and all bears during the 5 survey days were 21.3 (95% CI = 18.3-25.9), 21.3 (18.47-25.6), and 27.49 (25.230.7). All of these categorizations have some tendency to underestimate variability expressed by 95% confidence intervals, especially due to the dependence of certain observations (e.g., sibling groups, sows with 2-year-old cubs, and sows with younger cubs). The density of brown bears in the Nelchina Study Area appears to be very similar to that in southeastern GMU 13E and is among the higher estimates for brown bears in Interior and northern Alaska.
CONTENTS
SUMMARY ..................................................................................................................................... i
BACKGROUND The Board of Game has set a 50% reduction of brown bear numbers in Game Management Unit 13A as an objective to improve survival of moose calves. An estimate of bear density is necessary in order to monitor effects of liberalized bear regulations and provide a baseline for the reduction in bear numbers. It also is an important component of our understanding of predatorprey relations in GMU 13. From 18 May-1 June, 1998, we applied a Capture-Mark-Resight (CMR) technique to brown bears in a 2150 square kilometer portion of GMU 13A following guidelines developed by Miller et al. (1997). The estimation of bear density this spring was the culmination of a 3-year effort begun by Sterling Miller with 2 years of premarking in 1996 and 1997 (Miller 1997).
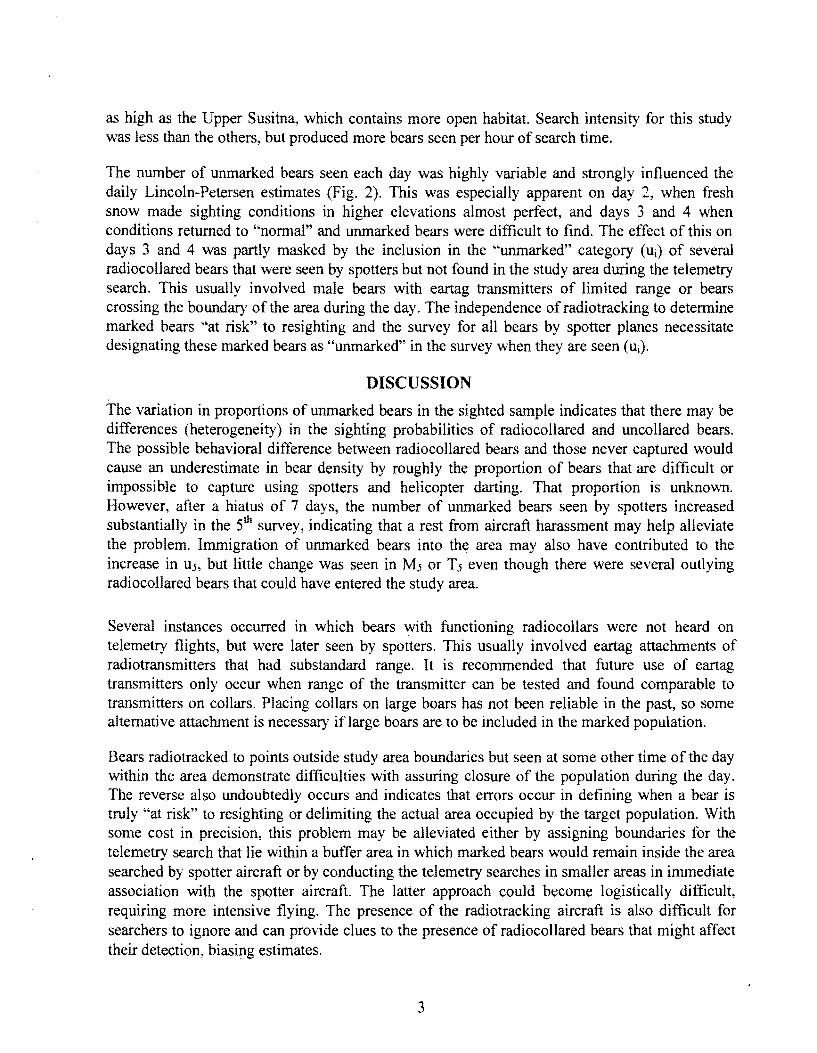
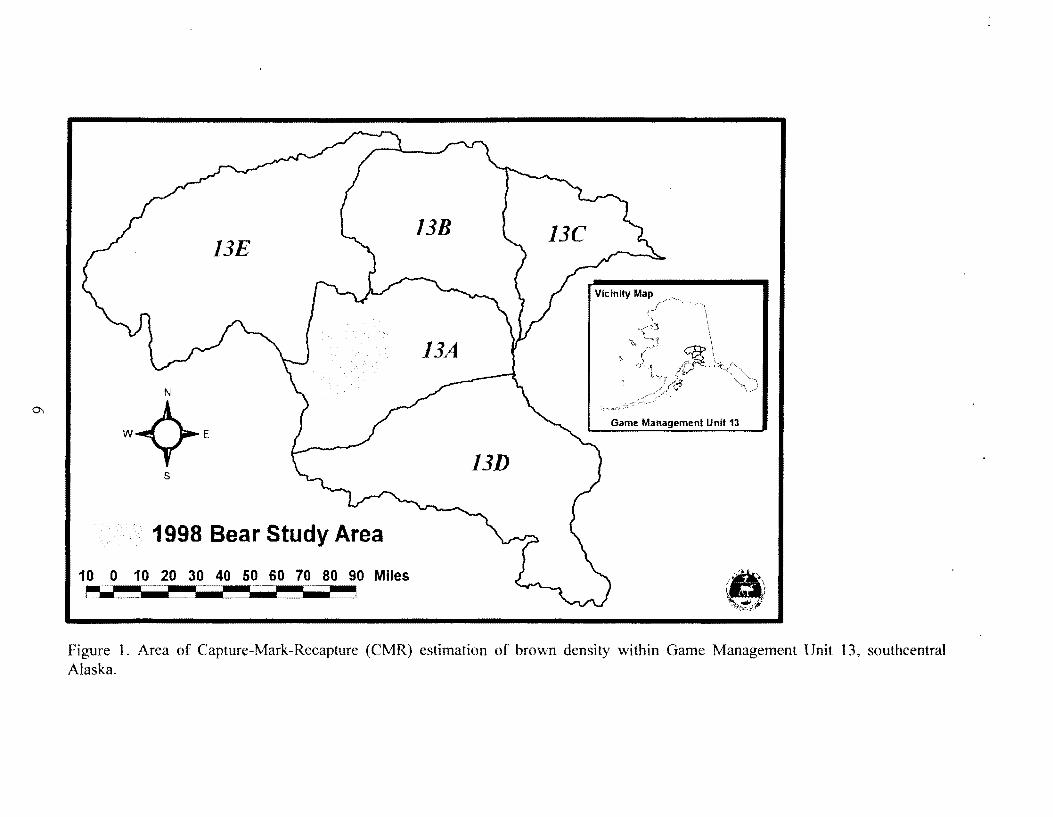
STUDY AREA The study area for density estimation was chosen to represent habitats ranging from high mountain ridges in the Talkeetna Mountains to lower elevation (800 m) spruce bog in the Lake Louise Flats (Fig. 1 ). It was also chosen to encompass important concentrations of calving moose and caribou in the drainages ofTyone Creek and the Oshetna, Little Oshetna and Black Rivers. A recent estimate of brown bear density was made in the SE part of GMU 13E (S.D. Miller 1995), and the density of brown bears in this part of GMU 13A was expected to be similar, based on similar rates and patterns of moose calf mortality (Testa 1997).
METHODS CMR methods require that animals with radiocollars be found within the study area boundary on the day (i) of each survey by an observer using a radio receiver and fixed-wing aircraft. These animals were considered "marks at risk," M;, and this number was determined each day of the survey by a pilot/observer team that was not involved in subsequent visual searching that day. The remaining planes searched for all bears that crew could find visually to determine whether bears were collared with functioning radiocollars (marked bears seen, or m;) or "unmarked" (u;). The key assumptions were that marked and unmarked bears each day were equally sightable, and
this was partly assured by making the aerial searching and telemetry determination of marks at risk independent of one another. Neither needs to be exhaustive, but precision is increased by increasing Mi and m,. Premarking of female bears was done in 1996 and 1997, but the density estimate was planned to include ongoing marking of boars and sows during the density estimates (Miller 1997).
RESULTS
We began flying surveys and capturing additional bears on 19 May. Wind in the mountains forced us to stop flying when only 70% and 50% of the survey was completed on 19 and 20 May. Conditions on both days were poor, with poor lighting, gusty winds, and partial, blotchy snow cover on much of the area. No survey was possible on 21 May, though we did capture work. The survey on 22 May was 90% complete when ongoing drizzle turned to snow and ice, forcing planes home. Because the unsurveyed portions were small (only 2 of 10 survey areas were incomplete) in relation to normal bear movements and the distribution of collared and uncollared bears, this survey was considered adequate to meet the assumption of equal sightability. On the following day (23 May) there was 6-1 0" of new snow on the entire area. Tracking conditions in the higher elevations made sighting probabilities there near perfect, yet conditions in the lower hills with higher vegetation and numerous moose and caribou remained difficult for spotters. Following the airplane crash of Webb and Bowen that day, we halted operations for a day to regroup and began again on May 24. Spotting conditions were, again, difficult in middle elevations where snow or ground was patchy, but sighting probabilities of bears were good in comparison to other studies (Miller et al. 1997). We completed field operations from Mendeltna on May 25, but elected to mount 1 more survey without helicopter captures a week later. This was done to address a concern with small numbers of uncollared bears seen in the last 2 surveys, a possible indication of sighting heterogeneity that would bias population estimates (see Discussion section). After a weather delay, we completed the final survey on 1 June.
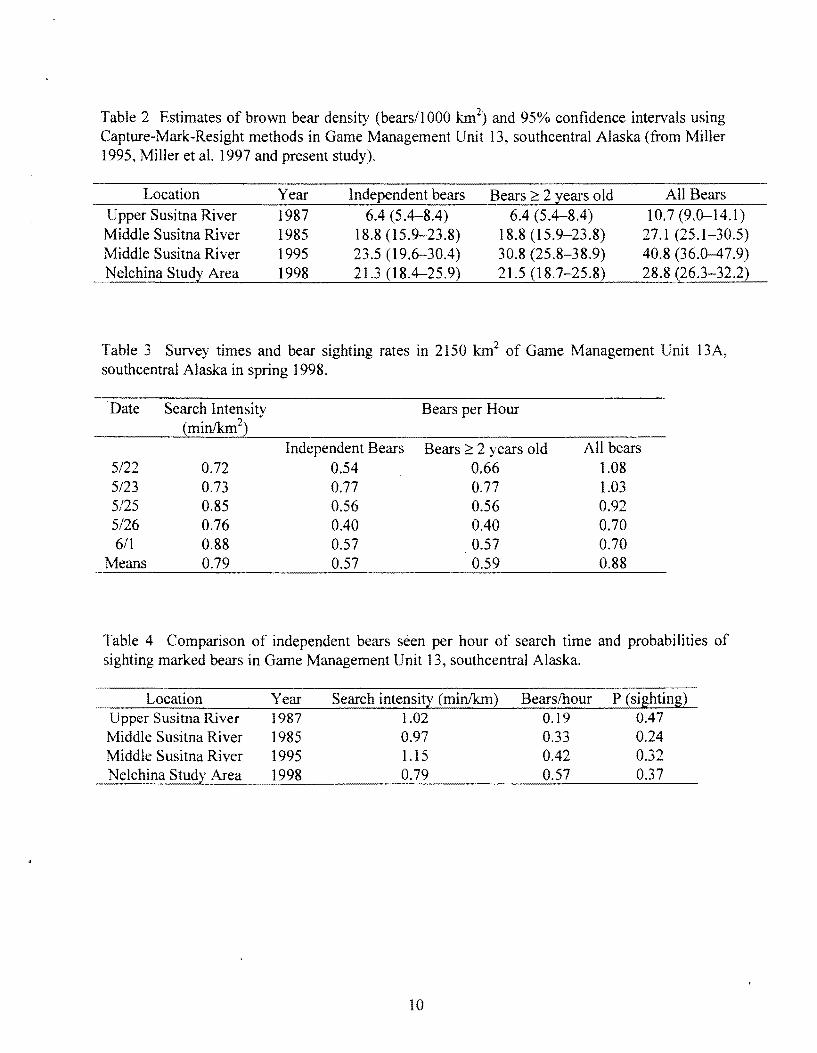
Bears captured and seen each day are shown in Table 1. Results using the Immigration-Emigration Joint Hypergeometric Estimator (IEJHE) described by White (1996) and Miller et al. (1997) are given in Table 2. The average densities of independent bears, bears 2:: 2 years old, and all bears during the 5 survey days were 21.3 (95% CI 18.3-25.9), 21.6 (18.726.3), and 27.49 (25.2-30.7). Miller et al. (1997) discussed the merits of each categorization. All have some tendency to underestimate variability expressed by 95% confidence intervals, especially due to the dependence of certain observations (e.g., sibling groups, sows with 2-yearold cubs, and sows with younger cubs). The density of independent brown bears in the Nelchina Study Area appears to be very similar to that in southeastern GMU 13E, where Miller (1995) performed a CMR estimation in 1995, and is among the higher estimates for brown bears in Interior and northern Alaska (Miller et al. 1997).
Search intensity and bears seen per hour of search time on each survey day are shown in Table 3. Search parameters from the 4 most recent CMR estimates in GMU 13 are compared in Table 4. Sighting probability of marked bears was somewhat better than that for the Middle Susitna study area, which contains more extensive stands of boreal forest than the Nelchina Study Area, but not
2
as high as the Upper Susitna, which contains more open habitat. Search intensity for this study was less than the others, but produced more bears seen per hour of search time.
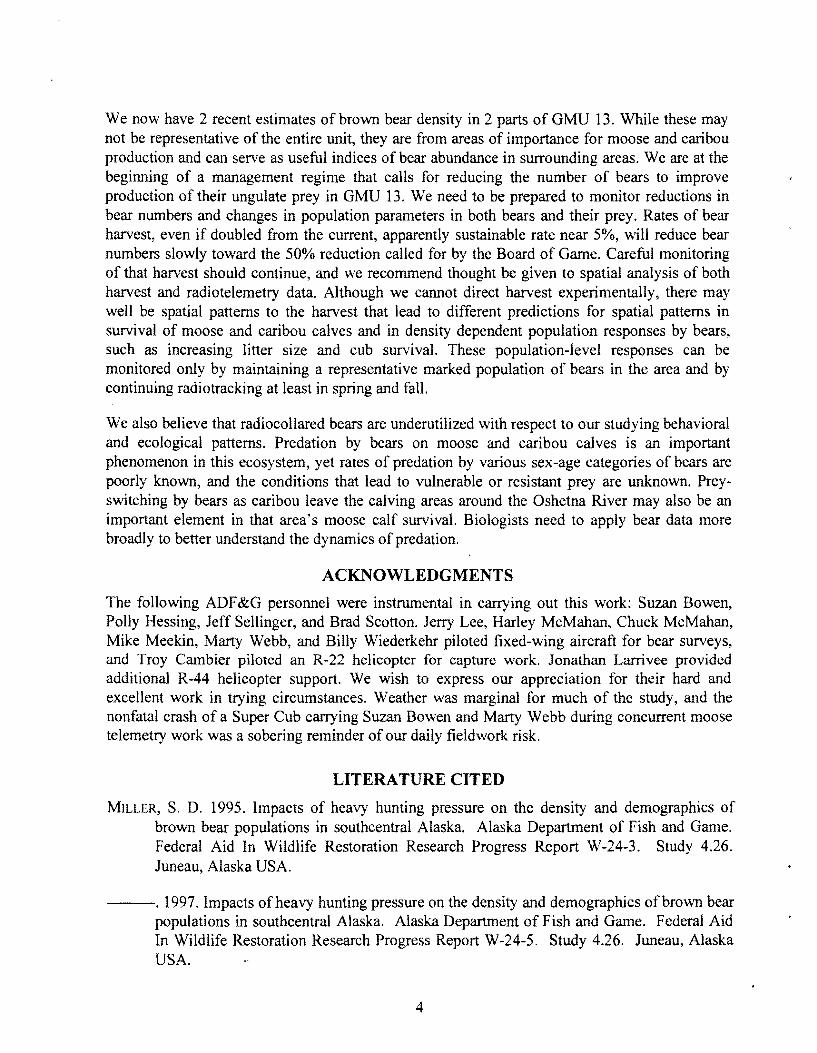
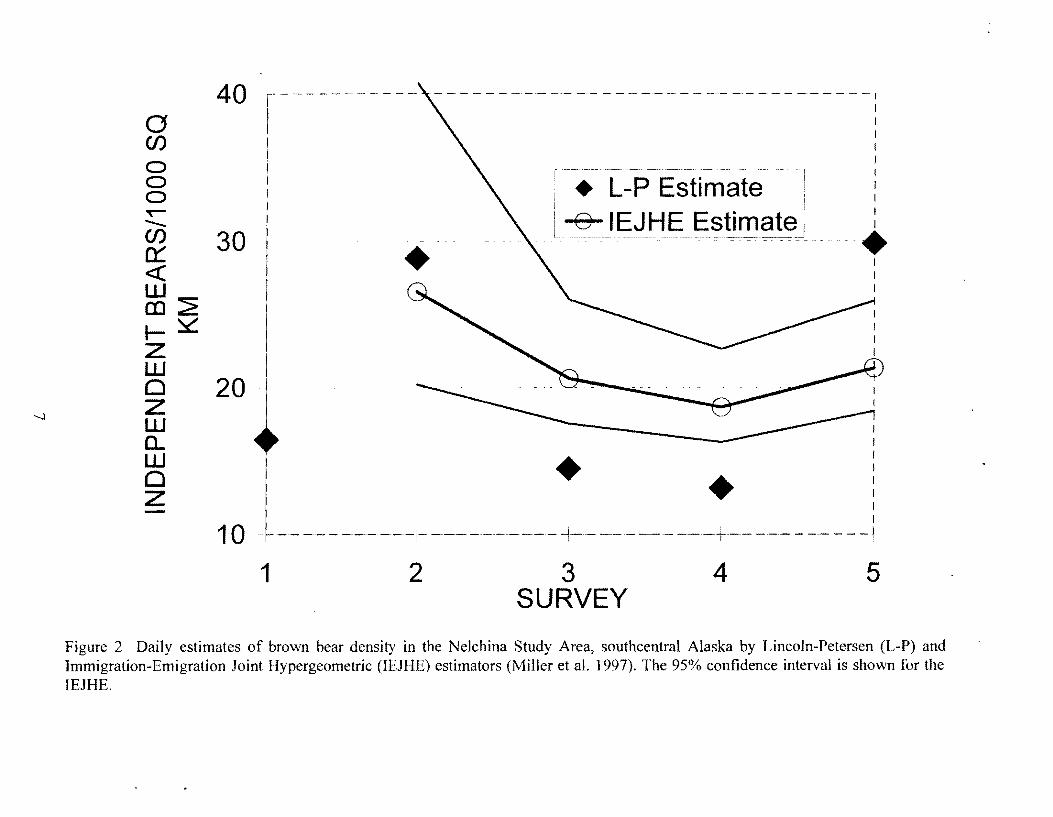
The number of unmarked bears seen each day was highly variable and strongly influenced the daily Lincoln-Petersen estimates (Fig. 2). This was especially apparent on day 2, when fresh snow made sighting conditions in higher elevations almost perfect, and days 3 and 4 when conditions returned to "normal" and unmarked bears were difficult to find. The effect of this on days 3 and 4 was partly masked by the inclusion in the "unmarked" category (ui) of several radiocollared bears that were seen by spotters but not found in the study area during the telemetry search. This usually involved male bears with eartag transmitters of limited range or bears crossing the boundary of the area during the day. The independence of radio tracking to determine marked bears "at risk" to resighting and the survey for all bears by spotter planes necessitate designating these marked bears as "unmarked" in the survey when they are seen ( ui).
DISCUSSION
The variation in proportions of unmarked bears in the sighted sample indicates that there may be differences (heterogeneity) in the sighting probabilities of radiocollared and uncollared bears. The possible behavioral difference between radiocollared bears and those never captured would cause an underestimate in bear density by roughly the proportion of bears that are difficult or impossible to capture using spotters and helicopter darting. That proportion is unknown. However, after a hiatus of 7 days, the number of unmarked bears seen by spotters increased substantially in the 5th survey, indicating that a rest from aircraft harassment may help alleviate the problem. Immigration of unmarked bears into the area may also have contributed to the increase in u5, but little change was seen in M5 or T 5 even though there were several outlying radiocollared bears that could have entered the study area.
Several instances occurred in which bears with functioning radiocollars were not heard on telemetry flights, but were later seen by spotters. This usually involved eartag attachments of radiotransmitters that had substandard range. It is recommended that future use of eartag transmitters only occur when range of the transmitter can be tested and found comparable to transmitters on collars. Placing collars on large boars has not been reliable in the past, so some alternative attachment is necessary if large boars are to be included in the marked population.
Bears radio tracked to points outside study area boundaries but seen at some other time of the day within the area demonstrate difficulties with assuring closure of the population during the day. The reverse also undoubtedly occurs and indicates that errors occur in defining when a bear is truly "at risk" to resighting or delimiting the actual area occupied by the target population. With some cost in precision, this problem may be alleviated either by assigning boundaries for the telemetry search that lie within a buffer area in which marked bears would remain inside the area searched by spotter aircraft or by conducting the telemetry searches in smaller areas in immediate association with the spotter aircraft. The latter approach could become logistically difficult, requiring more intensive flying. The presence of the radiotracking aircraft is also difficult for searchers to ignore and can provide clues to the presence of radiocollared bears that might affect their detection, biasi!lg estimates.
3
We now have 2 recent estimates of brown bear density in 2 parts of GMU 13. While these may not be representative of the entire unit, they are from areas of importance for moose and caribou production and can serve as useful indices of bear abundance in surrounding areas. We are at the beginning of a management regime that calls for reducing the number of bears to improve production of their ungulate prey in GMU 13. We need to be prepared to monitor reductions in bear numbers and changes in population parameters in both bears and their prey. Rates of bear harvest, even if doubled from the current, apparently sustainable rate near 5%, will reduce bear numbers slowly toward the SO% reduction called for by the Board of Game. Careful monitoring of that harvest should continue, and we recommend thought be given to spatial analysis of both harvest and radiotelemetry data. Although we cannot direct harvest experimentally, there may well be spatial patterns to the harvest that lead to different predictions for spatial patterns in survival of moose and caribou calves and in density dependent population responses by bears, such as increasing litter size and cub survival. These population-level responses can be monitored only by maintaining a representative marked population of bears in the area and by continuing radiotracking at least in spring and fall.
We also believe that radiocollared bears are underutilized with respect to our studying behavioral and ecological patterns. Predation by bears on moose and caribou calves is an important phenomenon in this ecosystem, yet rates of predation by various sex-age categories of bears are poorly known, and the conditions that lead to vulnerable or resistant prey are unknown. Preyswitching by bears as caribou leave the calving areas around the Oshetna River may also be an important element in that area's moose calf survival. Biologists need to apply bear data more broadly to better understand the dynamics of predation.
ACKNOWLEDGMENTS
The following ADF&G personnel were instrumental in carrying out this work: Suzan Bowen, Polly Hessing, Jeff Sellinger, and Brad Scotton. Jerry Lee, Harley McMahan, Chuck McMahan, Mike Meekin, Marty Webb, and Billy Wiederkehr piloted fixed-wing aircraft for bear surveys, and Troy Cambier piloted an R-22 helicopter for capture work. Jonathan Larrivee provided additional R-44 helicopter support. We wish to express our appreciation for their hard and excellent work in trying circumstances. Weather was marginal for much of the study, and the nonfatal crash of a Super Cub carrying Suzan Bowen and Marty Webb during concurrent moose telemetry work was a sobering reminder of our daily fieldwork risk.
LITERATURE CITED
MILLER, S. D. 1995. Impacts of heavy hunting pressure on the density and demographics of brown bear populations in southcentral Alaska. Alaska Department of Fish and Game. Federal Aid In Wildlife Restoration Research Progress Report W-24-3. Study 4.26. Juneau, Alaska USA.
---. 1997. Impacts of heavy hunting pressure on the density and demographics of brown bear populations in southcentral Alaska. Alaska Department of Fish and Game. Federal Aid In Wildlife Restoration Research Progress Report W-24-5. Study 4.26. Juneau, Alaska USA.
4
en R. Peterson, Senior StaffBiologist Division of Wildlife Conservation
--. G. C. WHITE, R. A. SELLERS, H.V. REYNOLDS, J.W. SCHOEN, K. TITUS, V.G. BARNES, JR., R.B. SMITH, R.R. NELSON, W.B. BALLARD, C.C. SCHWARTZ. 1997. Brown and black bear density estimation in Alaska using radiotelemetry and replicated mark-resight techniques. Wildlife Monographs 133: 1-55.
TEST A, J. W. 1997. Population dynamics of moose and predators in Game Management Unit 13. Alaska Department of Fish and Game. Federal Aid In Wildlife Restoration. Research Progress Report W-24-5. Study 1.49. Juneau, Alaska USA.
WHITE, G.C. 1996. NOREMARK: population estimation from mark-resighting surveys. Wildlife Society Bulletin 24: 50-52.
PREPARED BY:
J. Ward Testa Wildlife Biologist III
William P. Taylor Jr Wildlife Biologist III
Sterling D. Miller Wildlife Biologist III
Approved By:
5
N
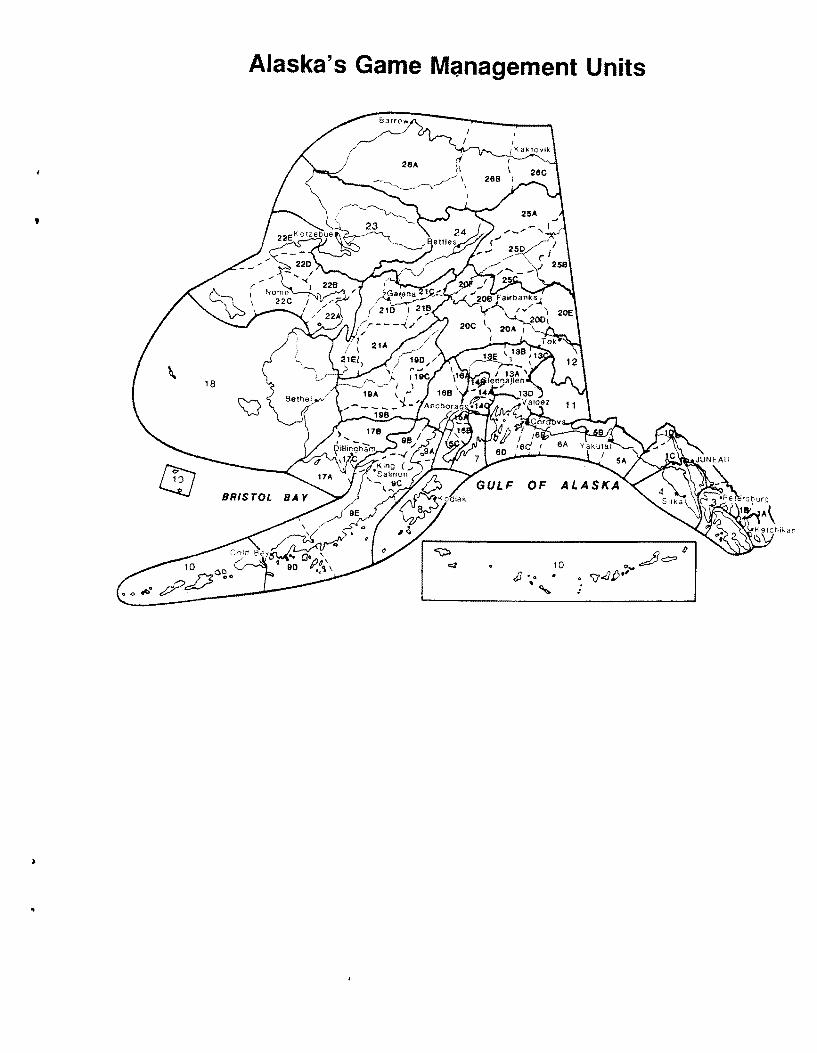
W~E Game Management Unit 13
I 3D s
1998 Bear Study Area
10 - 0 10 20 30 40 50 60 70 80 90 Milesi
I •\ ~ ~== I
!!\,,,~,.,--
Figure 1. Area of Capture-Mark-Recapture (CMR) estimation of brown density within Game Management 13, southcentral Alaska.
Figure 2 Daily estimates of brown bear density in the Nelchina Study Area, southcentral Alaska by Lincoln-Petersen (L-P) and Immigration-Emigration Joint Hypergeometric (IEJHE) estimators (Miller et al. 1997). The 95% confidence interval is shown for the IEJHE.
-- ------------ -------- ----------, I I
+ - ---,
L-P Estimate 1 I
-e-IEJHE Estimatej +
I I
+ +
....._)
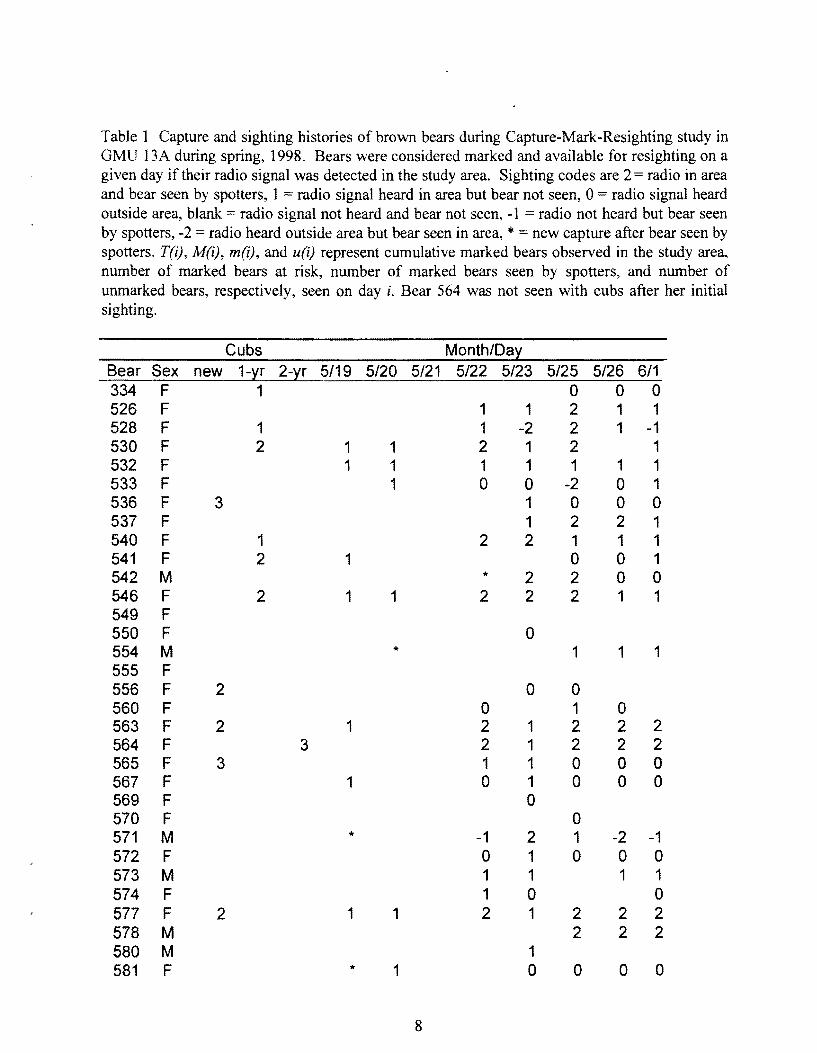
Table 1 Capture and sighting histories of brown bears during Capture-Mark-Resighting study in GMU 13A during spring, 1998. Bears were considered marked and available for resighting on a given day if their radio signal was detected in the study area. Sighting codes are 2 = radio in area and bear seen by spotters, 1 = radio signal heard in area but bear not seen, 0 radio signal heard outside area, blank = radio signal not heard and bear not seen, -1 = radio not heard but bear seen by spotters, -2 =radio heard outside area but bear seen in area, * new capture after bear seen by spotters. T(i), M(i), m(i), and u(i) represent cumulative marked bears observed in the study area, number of marked bears at risk, number of marked bears seen by spotters, and number of unmarked bears, respectively, seen on day i. Bear 564 was not seen with cubs after her initial sighting.
Cubs Month/Da1: Bear Sex new 1-~r 2-~r 5/19 5/20 5/21 5/22 5/23 5/25 5/26 6/1 334 F 1 0 0 0 526 F 1 1 2 1 1 528 F 1 1 -2 2 1 -1 530 F 2 1 1 2 1 2 1 532 F 1 1 1 1 1 1 1 533 F 1 0 0 -2 0 1 536 F 3 1 0 0 0 537 F 1 2 2 1 540 F 1 2 2 1 1 1 541 F 2 1 0 0 1 542 M * 2 2 0 0 546 F 2 1 1 2 2 2 1 1 549 F 550 F 0 554 M * 1 1 1 555 F 556 F 2 0 0 560 F 0 1 0 563 F 2 1 2 1 2 2 2 564 F 3 2 1 2 2 2 565 F 3 1 1 0 0 0 567 F 1 0 1 0 0 0 569 F 0 570 F 0 571 M * -1 2 1 -2 -1 572 F 0 1 0 0 0 573 M 1 1 1 1 574 F 1 0 0 577 F 2 1 1 2 1 2 2 2 578 M 2 2 2 580 M 1 581 F * 1 0 0 0 0
8
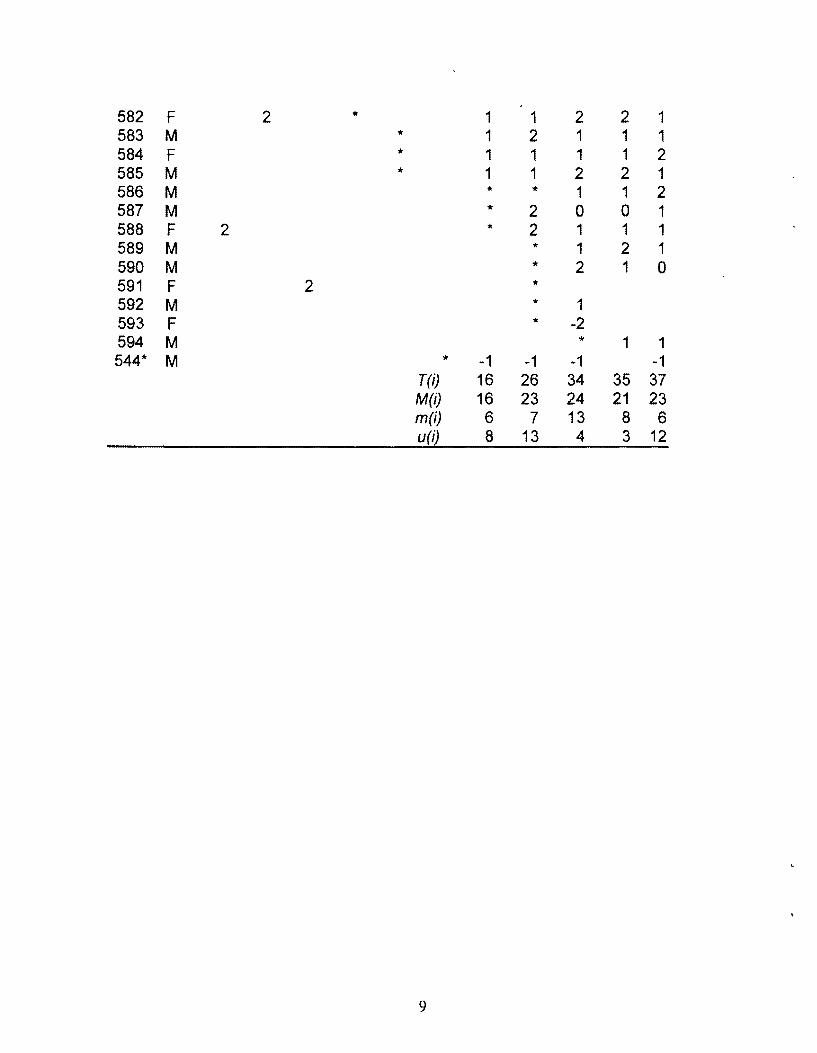
582 F 2 * 1 1 2 2 1 583 M * 1 2 1 1 1 584 F * 1 1 1 1 2 585 M * 1 1 2 2 1 586 M * * 1 1 2 587 M * 2 0 0 1 588 F 2 * 2 1 1 1 589 M * 1 2 1 590 M * 2 1 0 591 F 2 * 592 M * 1 593 F * -2 594 M * 1 1 544* M * -1 -1 -1 -1
Table 4 Comparison of independent bears seen per hour of search time and probabilities of sighting marked bears in Game Management Unit 13, southcentral Alaska.
Location Year Search intensity (minlkm} Bears/hour P (sighting} Upper Susitna River 1987 1.02 0.19 0.47 Middle Susitna River 1985 0.97 0.33 0.24 Middle Susitna River 1995 1.15 0.42 0.32 Nelchina Stud):: Area 1998 0.79 0.57 0.37
10
Alaska's Game Management Units
'
10 J1 • • •
'"
)
ilJLl ~
Z -~
'
The Federal Aid in Wildlife Restoration Program consists of funds from a 10% to 11% manufacturer's excise tax collected from the sales of handguns, sporting rifles, shotguns, ammunition, and archery equipment ~ The FederalAid program allots funds back to states through aformula based on each state's geographic area and number of paid bunting Ji- ~ cense holders.Alaska receives amaximum 5.% of revenues collected each ~ year. TheAlaska Department of Fish and Game uses federal aid funds to ( ..rQ help restore, conserve, and manage wild birds and mammals to benefit the public.These funds are also used to educate bunters to develop the skills, knowledge, and attitudes for responsible hunting. Seventy-fiVe percent of the funds for this report ar~ from Federal Aid.