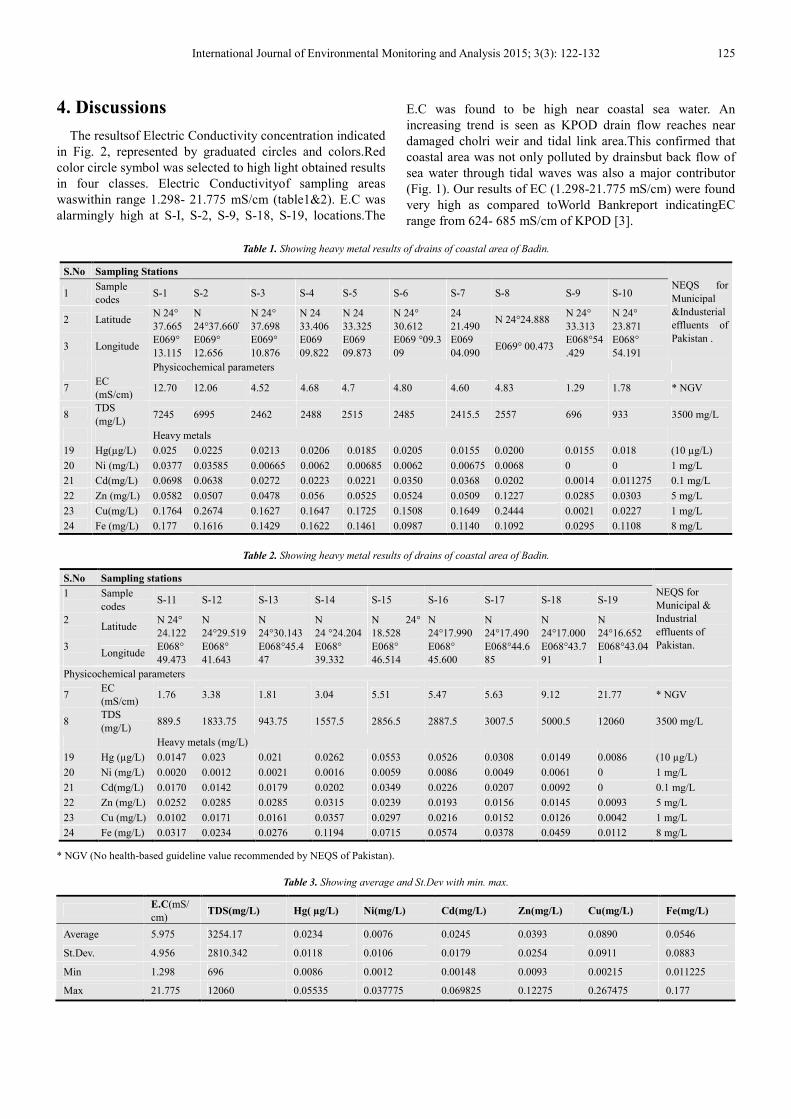
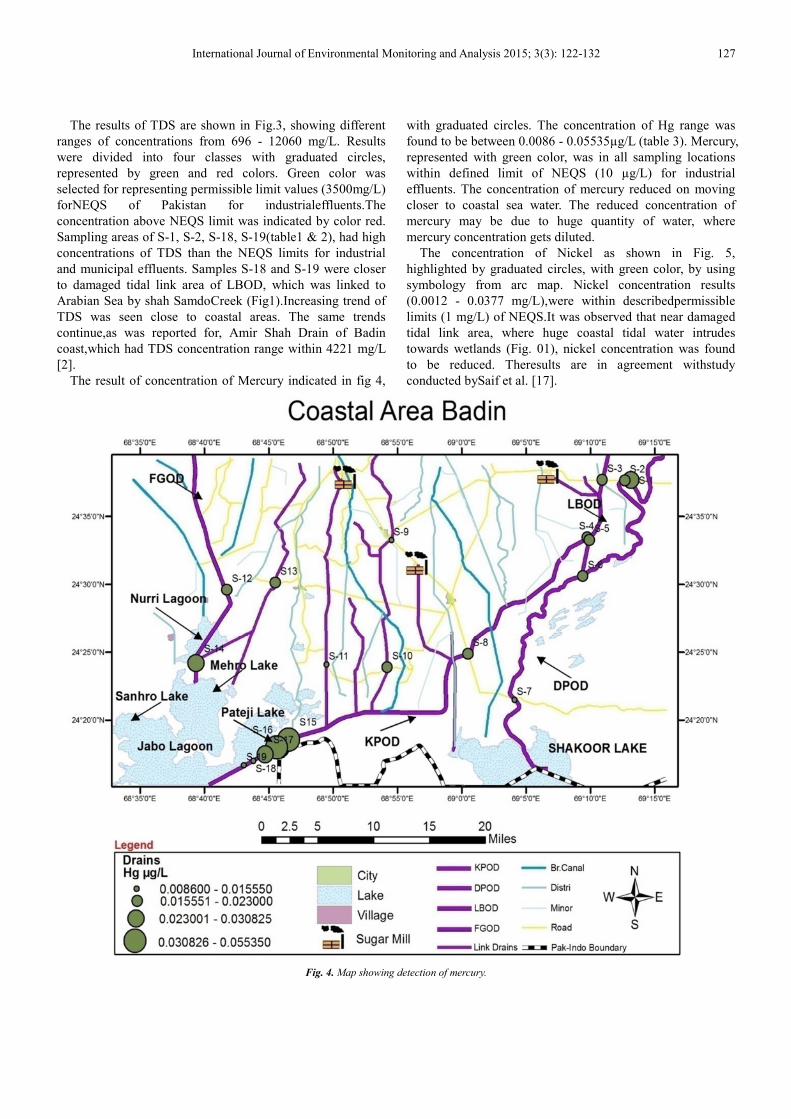
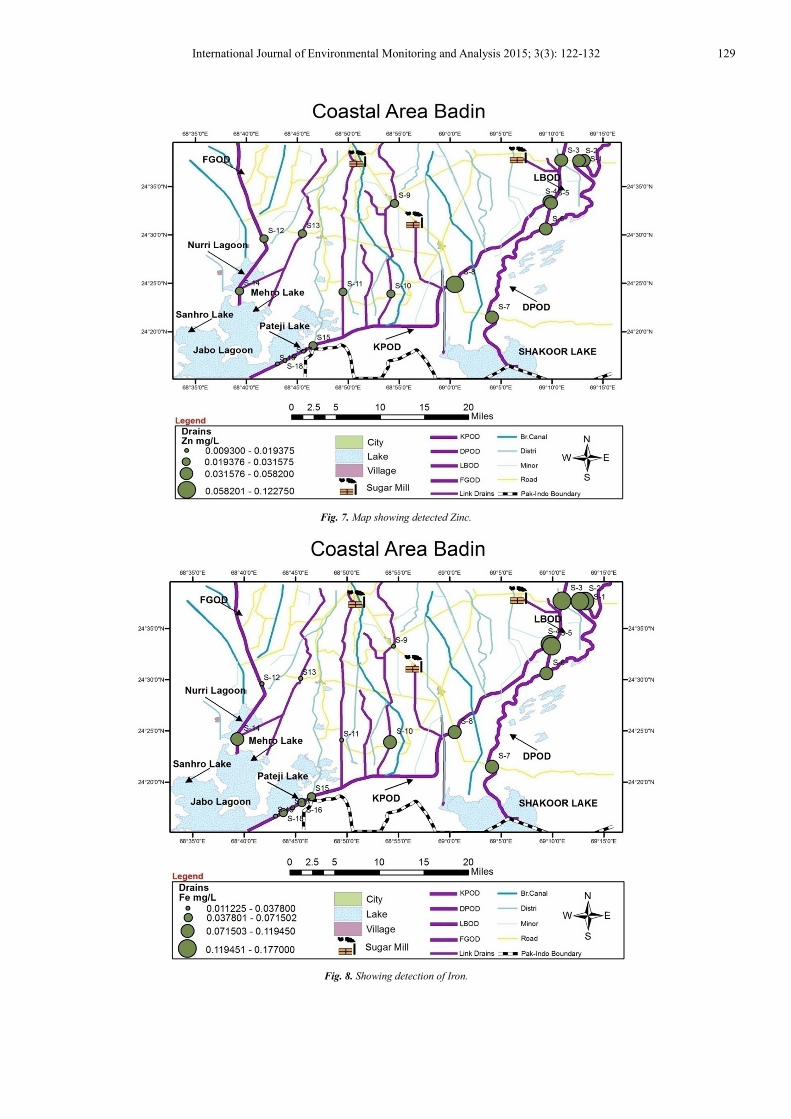
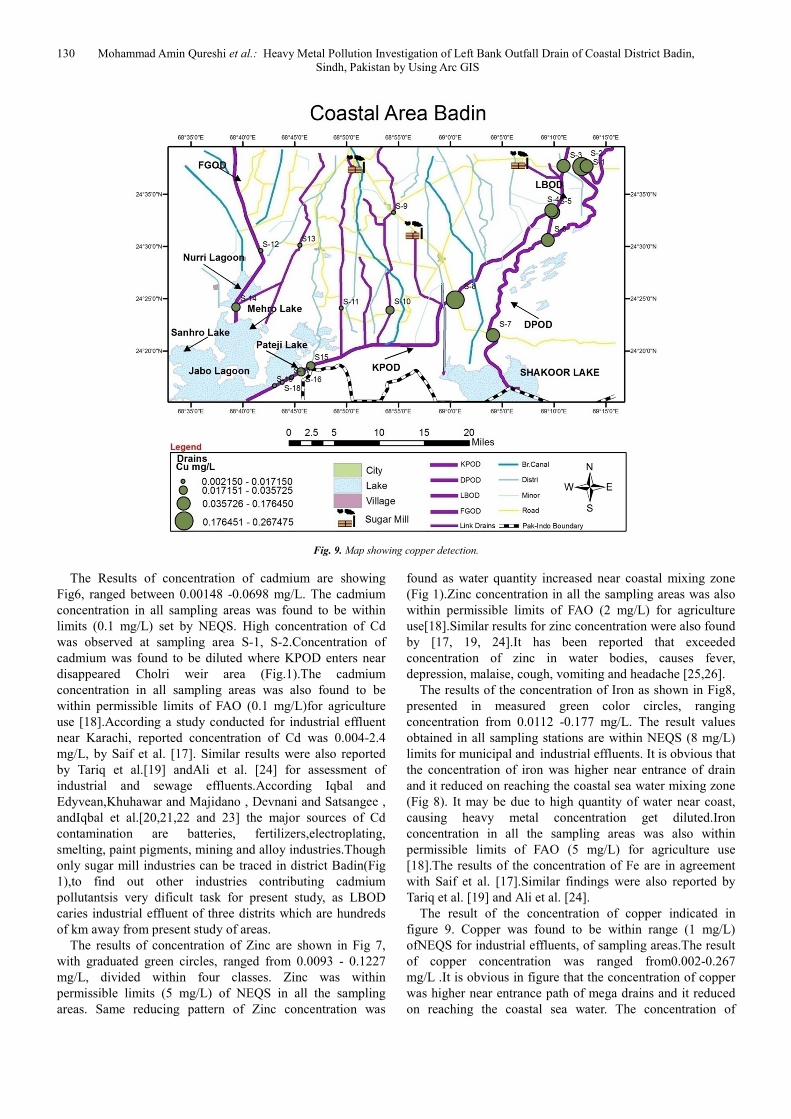
International Journal of Environmental Monitoring and Analysis 2015; 3(3): 122-132
Published online April 18, 2015 (http://www.sciencepublishinggroup.com/j/ijema)
doi: 10.11648/j.ijema.20150303.13
ISSN: 2328-7659 (Print); ISSN: 2328-7667 (Online)
Heavy Metal Pollution Investigation of Left Bank Outfall Drain of Coastal District Badin, Sindh, Pakistan by Using Arc GIS
Mohammad Amin Qureshi1, *
,Ghulam Murtaza Mastoi1, Zulfiqar Ali Laghari
2,
Khalid Hussain Lashari3, Fouzia Panhwar
4, Zameer Ali Palh
3
1Centre for Environmental Sciences, University of Sindh, Jamshoro, Sindh, Pakistan 2Department of Physiology, University of Sindh, Jamshoro, Pakistan 3Department of Fresh Water Biology and Fisheries, University of Sindh, Jamshoro, Pakistan 4Department of Pharmacology, University of Sindh, Jamshoro, Pakistan
Email address: [email protected](M. A.Qureshi)
To cite this article: Mohammad Amin Qureshi, Ghulam Murtaza Mastoi, Zulfiqar Ali Laghari, Khalid Hussain Lashari, Fouzia Panhwar, Zameer Ali Palh.
Heavy Metal Pollution Investigation of Left Bank Outfall Drain of Coastal District Badin, Sindh, Pakistan by Using Arc GIS. International
Journal of Environmental Monitoring and Analysis. Vol. 3, No. 3, 2015, pp. 122-132. doi: 10.11648/j.ijema.20150303.13
Abstract:Coastal district Badin of Sindh Pakistan is known as hub of pollution because of surface drain canal network,
which continuously carries industrial effluents, municipal wastes, pumped saline water and excess agriculture water of three
districts. Agriculture lands, ground water, lakes and Lagoons of the district have been contaminated with toxic heavy metals
due to improper infrastructure of Left Bank Outfall Drain. The object of this study was to study the pollution contributed by
drains of coastal areas of Badin. Nineteen samples of water were collected from different locations of drains on quarterly basis.
Arc GIS was applied for vector mapping. Average results of parameters were EC 5.975 ± 4.956 mS/cm , TDS 3254.17 ±
2810.342 mg/L, Hg 0.0234 ±0.0118 µg/L , Ni 0.0076 ±0.0106mg/L, Cd 0.0245±0.0179mg/L , Zn 0.0393±0.0254mg/L , Cu
0.0890 ± 0.0911 mg/L, Fe 0.0546 ±0.0883mg/L.The results indicated that all parameters were within National Environmental
Quality Standards (NEQS) limits of Pakistan for Industrial effluents. High concentration of TDS, and E.C, near thecoastal
sampling areas, confirmed that, sea water has been facilitated, with backward flow by same drains due to sea tides. Heavy
metal results were also within permissible limits of Food Agriculture Organization (FAO) for agriculture use. Drain water may
be used for saline agriculture purpose, if properly checked under Environmental Protection Act of Pakistan 1997.
Keywords: LBOD (Left Bank Outfall Drain),Coastal Area of Badin, GIS (Geographic Information System),
Industrial Effluent, KPOD (Kadhan Pateji Outfall Drain), DPOD (Dhoro Puran Outfall Drain)
1. Introduction
The river Indus of Pakistan irrigates 35.7 million acres of
land. The irrigation network system has also given rise to
water logging and salinity threats to agriculture, with passage
of time. The coastal areas have been adversely affected .The
Left bank outfall drain (LBOD) project was implemented
from 1987 to 1997. The project was to mitigate water logging
and salinity of 1.27 million acres of three districts, of Sindh
province. The LBOD initially was aimed to drain out pumped
saline water and agricultural runoff but municipal and
industrial wastewas also thrown in this drain.The coastal
district Badin became the final path way of this contaminated
water to Arabian Sea. LBOD has a total discharge capacity of
4400 cusec and flows throughout the year [1, 2, 3].
LBOD is bifurcated into two main surface drains named
KPOD (KadhanPateji Outfall Drain) and DPOD
(DhoroPuran Outfall Drain). DPOD discharges into Shakoor
Lake which is a joint Lakeof Pakistan and India
(Fig.1).KPOD, flows with damaged infra structurepath of
Tidal Link and Cholri Weir, reaches at Shah Samdo Creek
and finally joins ArabianSea. It contaminates all wetlands of
the coastal areas.Cholri weir and Tidal link, the important
components of LBOD were constructed to maintain wet
lands and high tides of sea. Both infrastructures became
completely damaged after cyclone of 1999[1, 2, 3, 4, 5,
6].Consequently sea tidal water got quick access to wards
International Journal of Environmental Monitoring and Analysis 2015; 3(3): 122-132 123
inland areas which was not possible before. Hence the
ecology of the coastal areas, mostly of wetlands, has been
completely changed since two decades[7, 8].The World Bank
was a major contributor of finance and technical assistance of
the mega project, LBOD. The World Bank’s Panel in 2005-6
reported that the failure of LBOD project was due to faulty
design, underestimating the extreme meteorological risks and
improper follow up of the recommended policies and
procedures[9, 10, 3].The Panel also concededthat the little
attention had been paid to the impacts on the environmentally
important and Ramsar recognized coastal lakes and lagoons
[10].This study was conducted to investigate the heavy metal
pollution, carried by LBOD and other link surface drains near
the coastal lines of Badin. At the same time to find out
pollution contributed by sea tidal water from Arabian
Sea.The results were compared with permissible limits of
NEQS of Pakistan for municipal and industrial effluent. The
results were interpreted by using Arc GIS application.
2. Experimental
2.1. History Background of Area of Study
Badin is positioned between 24º-5` to 25º-25` north
latitude and 68 21’ to 69 20’ east longitude [5].The district
joins in south with the Arabian Sea and Rann of Kutch. The
agriculture and agro based industry are the sources of
economy. Coastal district of Badin is a flat, flood prone land,
where required fresh canal water does not reach.The land and
groundwater are saline. Climate of this area is unreliableand
has proved to be very fatal to natives.Badin is situated in
Zone II with respect to cyclonic activity which suggests that
the district is exposed to tropical cyclones[2]. Stormy
cyclones, monsoon rains, earthquakes and droughtshave
aggravated already deteriorated conditions of the coastal
areas.
Ecological degradation of Badin coastal area is result of
neglecting attitude, considering this area, only a hub and
pathway for disposable liquid waste towards Arabian
Sea.Environmental, socio economical issues of these areas
have never been taken properly and seriously. Deteriorated
condition of this region is due to, two main surface drain
system introduced in this area in 1960s and 1980s. Kotri
Barrage drain system fromT.M.Khan,comprised of
KaroGhungro(1960) and FuleliGuni(1959) Outfall drains,
both drains, enter from west side of district,polluting coastal
wet lands.FulleliGuni outfalls drain ends into MehroLake.
KaroGhungro surface drainage System ends in Sanhro Lake.
Both lakes are part of Ramsar recognized Jabholagoon (Fig.
1).Both drains carrying sugar mill effluents along with
agriculture runoff, reducing bio life of wetlands[1, 2, 3, 6, 7].
The contaminated water of Kotri drain and LBOD, meet at
saline Cholri shallow lake. It is zone of mixed polluted water
(Fig. 1).A hub of pollution sink has been developed mostly
after the destruction of Cholri weir and disappearance of tidal
link after cyclone 1999[7].Costal tidal water strikes near
village Golo Mandhro boundary wall at present time (Fig1).
124 Mohammad Amin Qureshi et al.: Heavy Metal Pollution Investigation of Left Bank Outfall Drain of Coastal District Badin,
Sindh, Pakistan by Using Arc GIS
Fig. 1. Base map of area study.
2.2. Sample Collection
Nineteen surface drain water samples, with three replicates,
were collected from the coastal belt of district Badin, after
every three months (March, June, September and December)
throughout the year 2013. Samples were collected from 9 am
to 4 pm.
2.3. Method
Samples were collected in previously clean 1.5 L plastic
bottles, temperature of air and water, electric conductivity,
total dissolved salts, readings weretaken on the spot. Latitude
and longitude were recorded by using GPSeTrex Legend
Garmin. EC, TDS, of water samples was measured using pre
calibrated Orion 115 conductivity meter [11]. Iron, Copper,
Zinc, Cadmium, Nickel, Mercurry, concentrations were
determined using Flame Atomic Absorption Spectrophoto-
meter and Mercury by cold vapor method by Flame Atomic
Absorption Spectrophoto-meter (FAAS) [11].
GIS is apowerful tool for collecting, storing, organizing,
transforming and displaying data, for specific aims from the
real world [12, 13, 14].GIS is increasingly used in
Environmental pollution studies because of its ability in
spatial analysis and understanding thematic maps [15,
16].Arc GIS 9.2 software was used for mapping and data
interpretation. Arc GIS software was applied in this study as
an important analyzing tool. Based on the sampling locations,
with the utilization of coordinates of GPS, a point feature
map showing the position of sampling location was prepared.
By using Arc map of arc GIS software, Monitored water
quality data was stored as attribute table.Graduated symbols
and colors were selected using symbology option.
3. Result
Average results ( Table 3) of surface drains of coastal area
of Badin indicated the obtained % concentration range of
parameters studied were TDS(mg/L) 92.9 % , Hg
(µg/L)0.234 % , Ni (mg/L)0.76 % , Cd (mg/L) 24.5 % ,
Zn(mg/L) 0.786 % , Cu (mg/L) 8.9 % , Fe(mg/L)0.68 % in
comparison to defined limits of NEQS for Industrial effluents
of Pakistan.
International Journal of Environmental Monitoring and Analysis 2015; 3(3): 122-132 125
4. Discussions
The resultsof Electric Conductivity concentration indicated
in Fig. 2, represented by graduated circles and colors.Red
color circle symbol was selected to high light obtained results
in four classes. Electric Conductivityof sampling areas
waswithin range 1.298- 21.775 mS/cm (table1&2). E.C was
alarmingly high at S-I, S-2, S-9, S-18, S-19, locations.The
E.C was found to be high near coastal sea water. An
increasing trend is seen as KPOD drain flow reaches near
damaged cholri weir and tidal link area.This confirmed that
coastal area was not only polluted by drainsbut back flow of
sea water through tidal waves was also a major contributor
(Fig. 1). Our results of EC (1.298-21.775 mS/cm) were found
very high as compared toWorld Bankreport indicatingEC
range from 624- 685 mS/cm of KPOD [3].
Table 1. Showing heavy metal results of drains of coastal area of Badin.
S.No Sampling Stations
NEQS for
Municipal
&Industerial
effluents of
Pakistan .
1 Sample
codes S-1 S-2 S-3 S-4 S-5 S-6 S-7 S-8 S-9 S-10
2 Latitude N 24°
37.665
N
24°37.660 ̕
N 24°
37.698
N 24
33.406
N 24
33.325
N 24°
30.612
24
21.490 N 24°24.888
N 24°
33.313
N 24°
23.871
3 Longitude E069°
13.115
E069°
12.656
E069°
10.876
E069
09.822
E069
09.873
E069 °09.3
09
E069
04.090 E069° 00.473
E068°54
.429
E068°
54.191
Physicochemical parameters
7 EC
(mS/cm) 12.70 12.06 4.52 4.68 4.7 4.80 4.60 4.83 1.29 1.78 * NGV
8 TDS
(mg/L) 7245 6995 2462 2488 2515 2485 2415.5 2557 696 933 3500 mg/L
Heavy metals
19 Hg(µg/L) 0.025 0.0225 0.0213 0.0206 0.0185 0.0205 0.0155 0.0200 0.0155 0.018 (10 µg/L)
20 Ni (mg/L) 0.0377 0.03585 0.00665 0.0062 0.00685 0.0062 0.00675 0.0068 0 0 1 mg/L
21 Cd(mg/L) 0.0698 0.0638 0.0272 0.0223 0.0221 0.0350 0.0368 0.0202 0.0014 0.011275 0.1 mg/L
22 Zn (mg/L) 0.0582 0.0507 0.0478 0.056 0.0525 0.0524 0.0509 0.1227 0.0285 0.0303 5 mg/L
23 Cu(mg/L) 0.1764 0.2674 0.1627 0.1647 0.1725 0.1508 0.1649 0.2444 0.0021 0.0227 1 mg/L
24 Fe (mg/L) 0.177 0.1616 0.1429 0.1622 0.1461 0.0987 0.1140 0.1092 0.0295 0.1108 8 mg/L
Table 2. Showing heavy metal results of drains of coastal area of Badin.
S.No Sampling stations
NEQS for
Municipal &
Industrial
effluents of
Pakistan.
1
Sample
codes S-11 S-12 S-13 S-14 S-15 S-16 S-17 S-18 S-19
2
Latitude
N 24°
24.122
N
24°29.519
N
24°30.143
N
24 °24.204
N 24°
18.528
N
24°17.990
N
24°17.490
N
24°17.000
N
24°16.652
3
Longitude
E068°
49.473
E068°
41.643
E068°45.4
47
E068°
39.332
E068°
46.514
E068°
45.600
E068°44.6
85
E068°43.7
91
E068°43.04
1
Physicochemical parameters
7 EC
(mS/cm) 1.76 3.38 1.81 3.04 5.51 5.47 5.63 9.12 21.77 * NGV
8 TDS
(mg/L) 889.5 1833.75 943.75 1557.5 2856.5 2887.5 3007.5 5000.5 12060 3500 mg/L
Heavy metals (mg/L)
19 Hg (µg/L) 0.0147 0.023 0.021 0.0262 0.0553 0.0526 0.0308 0.0149 0.0086 (10 µg/L)
20 Ni (mg/L) 0.0020 0.0012 0.0021 0.0016 0.0059 0.0086 0.0049 0.0061 0 1 mg/L
21 Cd(mg/L) 0.0170 0.0142 0.0179 0.0202 0.0349 0.0226 0.0207 0.0092 0 0.1 mg/L
22 Zn (mg/L) 0.0252 0.0285 0.0285 0.0315 0.0239 0.0193 0.0156 0.0145 0.0093 5 mg/L
23 Cu (mg/L) 0.0102 0.0171 0.0161 0.0357 0.0297 0.0216 0.0152 0.0126 0.0042 1 mg/L
24 Fe (mg/L) 0.0317 0.0234 0.0276 0.1194 0.0715 0.0574 0.0378 0.0459 0.0112 8 mg/L
* NGV (No health-based guideline value recommended by NEQS of Pakistan).
Table 3. Showing average and St.Dev with min. max.
E.C(mS/
cm) TDS(mg/L) Hg( µg/L) Ni(mg/L) Cd(mg/L) Zn(mg/L) Cu(mg/L) Fe(mg/L)
Average 5.975 3254.17 0.0234 0.0076 0.0245 0.0393 0.0890 0.0546
St.Dev. 4.956 2810.342 0.0118 0.0106 0.0179 0.0254 0.0911 0.0883
Min 1.298 696 0.0086 0.0012 0.00148 0.0093 0.00215 0.011225
Max 21.775 12060 0.05535 0.037775 0.069825 0.12275 0.267475 0.177
126 Mohammad Amin Qureshi et al.: Heavy Metal Pollution Investigation of Left Bank Outfall Drain of Coastal District Badin,
Sindh, Pakistan by Using Arc GIS
Fig. 2. Map showing detection of E.C.
Fig. 3. Map showing TDS detection.
International Journal of Environmental Monitoring and Analysis 2015; 3(3): 122-132 127
The results of TDS are shown in Fig.3, showing different
ranges of concentrations from 696 - 12060 mg/L. Results
were divided into four classes with graduated circles,
represented by green and red colors. Green color was
selected for representing permissible limit values (3500mg/L)
forNEQS of Pakistan for industrialeffluents.The
concentration above NEQS limit was indicated by color red.
Sampling areas of S-1, S-2, S-18, S-19(table1 & 2), had high
concentrations of TDS than the NEQS limits for industrial
and municipal effluents. Samples S-18 and S-19 were closer
to damaged tidal link area of LBOD, which was linked to
Arabian Sea by shah SamdoCreek (Fig1).Increasing trend of
TDS was seen close to coastal areas. The same trends
continue,as was reported for, Amir Shah Drain of Badin
coast,which had TDS concentration range within 4221 mg/L
[2].
The result of concentration of Mercury indicated in fig 4,
with graduated circles. The concentration of Hg range was
found to be between 0.0086 - 0.05535µg/L (table 3). Mercury,
represented with green color, was in all sampling locations
within defined limit of NEQS (10 µg/L) for industrial
effluents. The concentration of mercury reduced on moving
closer to coastal sea water. The reduced concentration of
mercury may be due to huge quantity of water, where
mercury concentration gets diluted.
The concentration of Nickel as shown in Fig. 5,
highlighted by graduated circles, with green color, by using
symbology from arc map. Nickel concentration results
(0.0012 - 0.0377 mg/L),were within describedpermissible
limits (1 mg/L) of NEQS.It was observed that near damaged
tidal link area, where huge coastal tidal water intrudes
towards wetlands (Fig. 01), nickel concentration was found
to be reduced. Theresults are in agreement withstudy
conducted bySaif et al. [17].
Fig. 4. Map showing detection of mercury.
128 Mohammad Amin Qureshi et al.: Heavy Metal Pollution Investigation of Left Bank Outfall Drain of Coastal District Badin,
Sindh, Pakistan by Using Arc GIS
Fig. 5. Map showing areas for Ni detection.
Fig. 6. Map showing results of Cadmium detection.
International Journal of Environmental Monitoring and Analysis 2015; 3(3): 122-132 129
Fig. 7. Map showing detected Zinc.
Fig. 8. Showing detection of Iron.
130 Mohammad Amin Qureshi et al.: Heavy Metal Pollution Investigation of Left Bank Outfall Drain of Coastal District Badin,
Sindh, Pakistan by Using Arc GIS
Fig. 9. Map showing copper detection.
The Results of concentration of cadmium are showing
Fig6, ranged between 0.00148 -0.0698 mg/L. The cadmium
concentration in all sampling areas was found to be within
limits (0.1 mg/L) set by NEQS. High concentration of Cd
was observed at sampling area S-1, S-2.Concentration of
cadmium was found to be diluted where KPOD enters near
disappeared Cholri weir area (Fig.1).The cadmium
concentration in all sampling areas was also found to be
within permissible limits of FAO (0.1 mg/L)for agriculture
use [18].According a study conducted for industrial effluent
near Karachi, reported concentration of Cd was 0.004-2.4
mg/L, by Saif et al. [17]. Similar results were also reported
by Tariq et al.[19] andAli et al. [24] for assessment of
industrial and sewage effluents.According Iqbal and
Edyvean,Khuhawar and Majidano , Devnani and Satsangee ,
andIqbal et al.[20,21,22 and 23] the major sources of Cd
contamination are batteries, fertilizers,electroplating,
smelting, paint pigments, mining and alloy industries.Though
only sugar mill industries can be traced in district Badin(Fig
1),to find out other industries contributing cadmium
pollutantsis very dificult task for present study, as LBOD
caries industrial effluent of three distrits which are hundreds
of km away from present study of areas.
The results of concentration of Zinc are shown in Fig 7,
with graduated green circles, ranged from 0.0093 - 0.1227
mg/L, divided within four classes. Zinc was within
permissible limits (5 mg/L) of NEQS in all the sampling
areas. Same reducing pattern of Zinc concentration was
found as water quantity increased near coastal mixing zone
(Fig 1).Zinc concentration in all the sampling areas was also
within permissible limits of FAO (2 mg/L) for agriculture
use[18].Similar results for zinc concentration were also found
by [17, 19, 24].It has been reported that exceeded
concentration of zinc in water bodies, causes fever,
depression, malaise, cough, vomiting and headache [25,26].
The results of the concentration of Iron as shown in Fig8,
presented in measured green color circles, ranging
concentration from 0.0112 -0.177 mg/L. The result values
obtained in all sampling stations are within NEQS (8 mg/L)
limits for municipal and industrial effluents. It is obvious that
the concentration of iron was higher near entrance of drain
and it reduced on reaching the coastal sea water mixing zone
(Fig 8). It may be due to high quantity of water near coast,
causing heavy metal concentration get diluted.Iron
concentration in all the sampling areas was also within
permissible limits of FAO (5 mg/L) for agriculture use
[18].The results of the concentration of Fe are in agreement
with Saif et al. [17].Similar findings were also reported by
Tariq et al. [19] and Ali et al. [24].
The result of the concentration of copper indicated in
figure 9. Copper was found to be within range (1 mg/L)
ofNEQS for industrial effluents, of sampling areas.The result
of copper concentration was ranged from0.002-0.267
mg/L .It is obvious in figure that the concentration of copper
was higher near entrance path of mega drains and it reduced
on reaching the coastal sea water. The concentration of
International Journal of Environmental Monitoring and Analysis 2015; 3(3): 122-132 131
copper in all the sampling areas except S-2 and S-8 was
found within permissible limits of FAO (0.2 mg/L) for
agriculture use [18].According Elenhorn and Barceloux [27]
mostly water contamination of copper occurs due to
untreated industrial wastewater pollution.
5. Conclusion
Pollution caused by LBOD,and link drains of the coastal
areas of Badin have caused great problems. A positive
approach for understanding the situation was developed by
using GIS software. GIS maps revealed the extent of
concentration of contaminatingpollutantsof drains and link
drains of the coastal areas.Present study of drainsrevealed
that main LBOD, KPOD, DPOD as well as link drains are
carriers of pollutants including heavy metals.They bring
industrial effluents,along with, pumped saline water,
agriculture run off, and municipal waste water. Present study
indicated that heavy metals are present within NEQS limits
for municipal and industrial effluents of Pakistan.Low
detection of heavy metal concentration in KPOD and DPOD
is because of huge flow of water quantity exceeding 2000
cusecs, most of times. Therefore heavy metal concentration
gets diluted.It was observed that at near coastal wetlands, the
heavy metal pollutants were found in low concentration due
to presence of excess tidal sea water. The Phenomenon for
TDS and E.C was very opposite as compared with those of
heavy metals.All drains indicated that they are very saline.
High concentration of TDS, and E.C, near the coastal
sampling areas confirms that sea water has been facilitated
with backward flow by same drains due to sea tides.Poor
infrastructure of LBOD has polluted the coastal zone, mostly
due breaches in KPOD near zero point and completely
disappearance of tidal link and cholri weir infrastructures.
The results were found to be within limits of NEQS and FAO
for industrial and agriculture purposes respectively.Hence
water of LBOD can be used as a saline agriculture if other
contaminants checked properly according to NEQS of
Pakistan.
References
[1] SIDA,“Sindh Water Sector Improvement Project-I.Regional master plan of Indus delta and coastal zone. Revival of Natural Dhoras”Sindh Water Sector Improvement Plan for Left Bank of Indus, Delta and Coastal Zone, 2013.
[2] EIA,“Environmental Impact Assessment for Exploration Activities in Badin Concession” – Protected Area Final report, 2012.
[3] [3]LBOD,“Review of the performance of the Left Bank Outfall Drain Stage IKPOD, DPOD, Tidal Link and Cholri Weir” Report of the World BankInternational Panel Experts, POE Report,2005.
[4] M. Memon, M. S.Soomro , M. S. Akhtar,K.S. Memon“Drinking water quality assessment in Southern Sindh (Pakistan)” Journal of Environmental Monitoring Assessment,2010.doi: 10.1007/s10661-010-1616-z.
[5] IUCN,“District Vision Badin A Framework for Sustainable Development”2006.
[6] S.M. Leghari,S.I.H. Jafri,A .Mahar,K. H. Lashari ,S.S. Ali,T.M. Jahangir, and M.Y. Khuahawar“Limonological study of Sanhro,Mehro,Pateji and Cholri lakes of district Badin ,Sindh, Pakistan” Pakistan Journal BiologyScience,vol.3 pp1904-1909, 2000
[7] M.A. Qureshi and G.M.Mastoi“The physiochemistry of sugar mill effluent pollution of coastlines in Pakistan” Ecological Engineering,vol. 75pp 137–144, 2015
[8] [8]SIDA,“Sindh Water Sector Improvement Project-I. Regional master plan of Indus delta and coastal zone (WSIP-I), Preparation of regional plan for the left bank of Indus, Delta and Coastal Zone Main report final - Phase – II” Sindh Irrigation and Drainage Authority 2012.
[9] DDRMP,“District Badin: District Disaster Risk Management Plan Badin, Sindh Province Second Draft District Badin, Sindh” UNDP for DDRMP District Badin ,2007.
[10] NDP,“Management report and recommendation in response to the inspection panel investigation report Pakistan: National Drainage Program” Project International Bank for Reconstruction and Development, International Development Association 2006.
[11] APHA,“Standard Methods for the Examination of Water and Wastewater” 17th ed. American Public Health Association, Washington D C , 1989.
[12] P.A. Burrough,“Principles of Geographic Information System for land Resources Assessment Monograph on Soils and Resources Survey No. 2” Clarendon Press, Oxford, England 1986.
[13] H.M.Baalousha,“Mapping groundwater contamination risk using GIS and groundwater modeling: A case study from the Gaza Strip, Palestine” Arabian Journal of Geosciences,vol.4 pp 483 – 494, 2011.
[14] M.O. Arnous& A.E. El-Rayes,“An integrated GIS and hydro chemical approach to assess groundwater contamination in West Ismailia area, Egypt” Arabian Journal of Geosciencesvol. 6:pp2829- 2842, 2013.
[15] A. Facchinelli,E. Sacchi, L. Mallen,“Multivariate statistical and GIS-based approach to identify heavy metal sources in soils”. J. Environ. Pollut. Vol. 114,pp 313–324, 2001.
[16] F. Wang,“Quantitative Methods and Applications in GIS” Taylor & Francis, New York,2006.
[17] M. S. Saif, Midrar-ul-Haq , K.S.Memon,“Heavy Metals Contamination through Industrial Effluent to Irrigation Water and Soil in Korangi Area of Karachi Pakistan”Internationa Journal of Agrriculture andBiology, vol. 4pp 646–648,2005.
[18] A.A. Othman, S.A.Rabeh,M. Fayez,M, Monib,N.A. Hegazi,“El-Salam canal is a potential project reusing the Nile Delta drainage water for Sinai desert agriculture: Microbial and chemical water quality”Journal of Advance Research pp99-108,2012.
[19] M. Tariq, M. Ali, Z. Shah,“Characteristics of industrial effluents and their possible impactson quality of underground water”Soil & Environment,vol. 25pp 64-69,2006.
[20] M.Iqbal, R.G.J. Edyvean, “Loofah sponge immobilized fungal biosorbent a robust system for cadmium and other dissolved metal removal from aqueous solution” Chemosphere, vol. 61, pp 510–518,2005.
132 Mohammad Amin Qureshi et al.: Heavy Metal Pollution Investigation of Left Bank Outfall Drain of Coastal District Badin,
Sindh, Pakistan by Using Arc GIS
[21] M. Y. Khuhawar and S. A. Majidano,“An Investigation of Quality of Groundwater of TalukaNawabshah” Pakakistan Journalof Chemistery vol. 1(2)pp 65-71,2011.
[22] H. Devnani, S.P.Satsangee,“Green gold nano particle modified anthocyanin-based carbon paste electrode for voltammetric determination of heavy metals”International Journal of Environmental Science and Technology. 2014. DOI10.1007/s13762-014-0497-z
[23] M. Iqbal, A. Saeed, S.I. Zafar,“Hybrid biosorbent: an innovative matrix to enhance the biosorption of Cd(II) from aqueous solution” Journal of Hazard Materials.vol.148pp 47–55, 2007.
[24] H.M. Ali, E.M. EL-Mahrouk, F.A. Hassan, M.A.EL-Tarawy,“Usage of sewage effluent in irrigation of some
woody tree seedlings. Part 3: Swieteniamahagoni (L.) Jacq” Saudi Journal of Biology and Science,vol.18,pp 201–207. 2011.
[25] M. Shakirullah , I. Ahmed , K.Mehmood , A .Khan , H. Rehman , S. AlamA. A. Shah,“Physicochemical Study of Drinking Water from Dir Districts” Journal of Chemical Society of Pakistan vol. 27(4), pp 374-387,2005.
[26] S.Farid,M.K. Baloch and S.A. Ahmad ,“Water pollution: Major issue in urban areas” International Journal of Water Resources and Environmental Engineering vol. 4,pp55-65,2012.
[27] M. J. Ellenhorn,D.G.Barceloux,“Medical toxicology: diagnosis and treatment of human poisoning”, New York, Elsevier Science publishing company 1988.