ORIGINAL PAPER Heavy metals in the soils of the Arabian Gulf coast affected by industrial activities: analysis and assessment using enrichment factor and multivariate analysis Fahad I. Almasoud & Adel R. Usman & Abdullah S. Al-Farraj Received: 28 August 2013 /Accepted: 22 January 2014 # Saudi Society for Geosciences 2014 Abstract The concentrations of nine heavy metals (Fe, Mn, Zn, Cu, Ni, Cd, Cr, Co, and Pb) in soil samples of Arabian Gulf coast, Saudi Arabia, were investigated. Sediment Quality Guideline (SQGs), SQG-Quotient (SQG-Q), toxicity degree index (TDI), enrichment factor (EF), and multivariate analy- sis, including principle component analysis (PCA) and hier- archical cluster analysis (HCA), were used to measure heavy metals of concern in the study area and to identify their possible sources. The results showed that the concentrations of different heavy metals were 530–5,700 mg kg? 1 for Fe; 9– 150 mg kg −1 for Mn and 8–69 mg kg −1 for Zn; 1–21 mg kg −1 for Cu and not detectable—17 mg kg −1 for Ni; 6.9– 130 mg kg −1 for Cr and not detectable—5 mg kg −1 for Co; and not detectable—24 mg kg −1 for Pb. Based on SQGs, only the maximum and mean Cr concentrations of study area were in heavy and moderate rates of pollution, respectively. The values of SQG-Q and TDI revealed that the investigated sampling points showed the lowest potential of adverse bio- logical effects. The considerable number of collected soil samples has relatively higher EF values of 5–20 for Zn, Cu, Cr, and Pb, suggesting that these four metals may be derived from anthropogenic origin. Multivariate analysis also con- firmed this finding that the sources of Zn, Cu, and Pb resulted primarily from anthropogenic sources, whereas Co, Ni, Fe, and Mn were mainly attributed to lithogenic sources. It could be generally concluded that it is possible to use multivariate analyses in combination with EF values as useful tools to identify the natural or anthropogenic sources of heavy metals in soils. Keywords Heavy metals . Sediment Quality Guidelines (SQGs) . Principal component analysis (PCA) . Hierarchical cluster analysis (HCA) Introduction Among organic and inorganic pollutants, heavy metals are considered to be one of the main sources responsible for causing a significant negative impact on ecological quality of the costal environments (Jara-Marini et al. 2008; Fernandes et al. 2012; Bodin et al. 2013; Attia et al. 2012). Heavy metals can enter into the coastal environments from different sources including natural weathering processes and anthropogenic activities (Sadiq and Alam 1989; Sadiq et al. 1992; Krishna and Govil 2007; Badr et al. 2009; Venkatramanan et al. 2012; Garali et al. 2010; Madkour 2013; El-Sorogy et al. 2013). Anthropogenic sources not only lead to increasing heavy metals concentrations in the environment, but also it can cause an unnatural enrichment, leading to metal pollution of the surface soils. The soil enriched with heavy metals can signifi- cantly cause an adverse impact on the population via inhalation, ingestion and dermal contact. The soil-accumulated heavy metals can also pose potential long-term hazards to plants and to animals as well as humans that consume these plants (Singh and Kumar 2006). Furthermore, the heavy metals increases in F. I. Almasoud King Abdulaziz City for Science and Technology, AERI, Riyadh, Saudi Arabia e-mail: [email protected]A. R. Usman (*) : A. S. Al-Farraj Department of Soil Sciences, College of Food and Agricultural Sciences, King Saud University, Riyadh, Saudi Arabia e-mail: [email protected]A. R. Usman e-mail: [email protected]A. S. Al-Farraj e-mail: [email protected]A. R. Usman Department of Soils and Water, Faculty of Agriculture, Assiut University, Assiut 71526, Egypt Arab J Geosci DOI 10.1007/s12517-014-1298-x
Transcript
ORIGINAL PAPER
Heavy metals in the soils of the Arabian Gulf coast affectedby industrial activities: analysis and assessment using enrichmentfactor and multivariate analysis
Fahad I. Almasoud & Adel R. Usman &
Abdullah S. Al-Farraj
Received: 28 August 2013 /Accepted: 22 January 2014# Saudi Society for Geosciences 2014
Abstract The concentrations of nine heavy metals (Fe, Mn,Zn, Cu, Ni, Cd, Cr, Co, and Pb) in soil samples of ArabianGulf coast, Saudi Arabia, were investigated. Sediment QualityGuideline (SQGs), SQG-Quotient (SQG-Q), toxicity degreeindex (TDI), enrichment factor (EF), and multivariate analy-sis, including principle component analysis (PCA) and hier-archical cluster analysis (HCA), were used to measure heavymetals of concern in the study area and to identify theirpossible sources. The results showed that the concentrationsof different heavy metals were 530–5,700 mg kg? 1 for Fe; 9–150 mg kg−1 for Mn and 8–69 mg kg−1 for Zn; 1–21 mg kg−1
for Cu and not detectable—17 mg kg−1 for Ni; 6.9–130 mg kg−1 for Cr and not detectable—5 mg kg−1 for Co;and not detectable—24 mg kg−1 for Pb. Based on SQGs, onlythe maximum and mean Cr concentrations of study area werein heavy and moderate rates of pollution, respectively. Thevalues of SQG-Q and TDI revealed that the investigatedsampling points showed the lowest potential of adverse bio-logical effects. The considerable number of collected soilsamples has relatively higher EF values of 5–20 for Zn, Cu,
Cr, and Pb, suggesting that these four metals may be derivedfrom anthropogenic origin. Multivariate analysis also con-firmed this finding that the sources of Zn, Cu, and Pb resultedprimarily from anthropogenic sources, whereas Co, Ni, Fe,and Mn were mainly attributed to lithogenic sources. It couldbe generally concluded that it is possible to use multivariateanalyses in combination with EF values as useful tools toidentify the natural or anthropogenic sources of heavy metalsin soils.
Among organic and inorganic pollutants, heavy metals areconsidered to be one of the main sources responsible forcausing a significant negative impact on ecological qualityof the costal environments (Jara-Marini et al. 2008; Fernandeset al. 2012; Bodin et al. 2013; Attia et al. 2012). Heavy metalscan enter into the coastal environments from different sourcesincluding natural weathering processes and anthropogenicactivities (Sadiq and Alam 1989; Sadiq et al. 1992; Krishnaand Govil 2007; Badr et al. 2009; Venkatramanan et al. 2012;Garali et al. 2010; Madkour 2013; El-Sorogy et al. 2013).Anthropogenic sources not only lead to increasing heavymetals concentrations in the environment, but also it can causean unnatural enrichment, leading to metal pollution of thesurface soils. The soil enriched with heavy metals can signifi-cantly cause an adverse impact on the population via inhalation,ingestion and dermal contact. The soil-accumulated heavymetals can also pose potential long-term hazards to plants andto animals as well as humans that consume these plants (Singhand Kumar 2006). Furthermore, the heavy metals increases in
F. I. AlmasoudKing Abdulaziz City for Science and Technology, AERI, Riyadh,Saudi Arabiae-mail: [email protected]
A. R. Usman (*) :A. S. Al-FarrajDepartment of Soil Sciences, College of Food and AgriculturalSciences, King Saud University, Riyadh, Saudi Arabiae-mail: [email protected]
A. R. UsmanDepartment of Soils and Water, Faculty of Agriculture, AssiutUniversity, Assiut 71526, Egypt
Arab J GeosciDOI 10.1007/s12517-014-1298-x
soils or sediments are considered as a potential secondarysource for water pollution, especially with changes in environ-mental conditions (e.g., pH, redox potential, organic mattercontent, temperature, etc.; Nayek et al. 2013).
During the past few decades, discharging elevated levels ofheavy metals into the coastal and marine ecosystems of theArabian Gulf are becoming an increasingly serious problemthat threatens both the naturally marine ecosystems andhumans (Naser 2013). Since the Arabian Gulf is characterizedby a shallow and semi-enclosed basin, the impact of pollutantson marine environment as a result of intensive anthropogenicactivities may be significant (Pourang et al. 2005; Naser2013). Industrial and sewage effluents, and wastewater dis-charges from desalination plants are considered as anthropo-genic sources that may significantly contribute to damage theenvironment of Arabian Gulf (Sheppard et al. 2010; Naser2013). It has been reported that oil can also be considered as asignificant and chronic pollution source in the Gulf environ-ment (Naser 2013). Additionally, chimney emissions of manyindustrial complexes may contribute to the metal pollution inthe Gulf, leading to disturbance to the coastal environment(Sadiq and Alam 1989). In a study conducted on contamina-tion of marine sediment with heavy metals in the Arabian Gulfof Bahrain, Oman, Qatar, and the United Arab Emirates, DeMora et al. (2004) noted that there are elevated concentrationsof Cu, Hg, Pb, and Zn in Bahrain, mainly due to the industrialeffluents from there finery and other industries located on theeastern coastline in Bahrain. Additionally, they found higherconcentrations of Co, Cr, and Ni at Akkah beach on the eastcoast of the United Arab Emirates, attributing to the metal-richmineralogy of the region. The concentrations of heavy metalsin sediments from sub-tidal areas of the Iranian coastline of theArabian Gulf were studied by Pourang et al. (2005). Theyreported that the concentrations of Cd, Pb, and Ni in thesediments were significantly higher than global baselineconcentrations.
There is a rapidly industrial development on the coast ofthe Arabian Gulf in Saudi Arabia, which may be as regionalpollution source, causing a concern regarding the environ-mental quality. Therefore, the proper assessment of heavymetals pollution in the soils and sediments of the ArabianGulf in Saudi Arabia is a crucial issue to provide a successfulmanagement of marine ecosystems. In this context, the en-richment factor (EF) is considered as a convenient measure ofgeochemical trends and is applied for speculating onlithogenic or anthropogenic origin of heavy metals(Sutherland 2000). The quality guidelines of sediment(SQGs) were also applied to measure heavy metals of concernin the ecosystems of fresh water and coastal areas(MacDonald et al. 2000). The SQGs guidelines can be usedas an approach to assess to which degree the sediment-associated contaminants might have adverse impacts onaquatic organisms (MacDonald et al. 2000; Caeiro et al.
2005). The multivariate analysis such as the principal compo-nent analysis (PCA) and hierarchical cluster analysis (HCA)have been widely used in environmental studies to investigatethe origin of heavy metal in soils (Ratha and Sahu 1993;Abollino et al. 2002; Yongming et al. 2006; Luo et al. 2007;Praveena et al. 2007; Wu and Zhang 2010; Anju and Banerjee2012; Krami et al. 2013). Therefore, the objectives of thisstudy were (a) to determine the levels of heavy metals (Fe,Mn, Cd, Cr, Cu, Co, Ni, Pb, and Zn) in the coastal soils ofindustrial petrochemicals area at Arabian Gulf, Saudi Arabia;(b) to measure heavy metals of concern and toxicity degree inthe study area using the quality guidelines of sediment (SQGs)and SQG-Quotient (SQG-Q); (c) to evaluate the possiblerelationships among the investigated heavy metals in soil ofstudy area; and (d) to identify their natural or anthropogenicsources by using enrichment factor and multivariate analysis.
Material and methods
Sampling and analytical methods
This study was conducted on the coast of the Arabian Gulf ofJubail in Saudi Arabia, which is considered one of the largestindustrial cities in the Kingdom and the Middle East. Thisindustrial city includes many factories and located on theArabian Gulf coast at longitude (30–49°) E and latitudes(10–27°) N. Figure 1 presents study area.
Fifty-six soil samples were collected to represent the inves-tigated area that affected by the industrial petrochemicals.There are two groups of soil samples, first was under theinfluence of tide (tidal zone), while the second groups wasfar around 300 m from the tidal zone (out of the tidal zone).Soil samples were collected at sampling depth of 0–30 and30–60 cm. The disturbed soil samples for physico-chemicalanalyses as well as the total content of heavy metals werecollected from each sampling site by augur. The soil sampleswere kept in sealed polyethylene bags to avoid contaminationand immediately transported to the laboratory and preservedin a refrigerator. All soil samples were air-dried at roomtemperature (20–22 °C) and ground to pass through a 2-mmsieve. The particle size distribution was determined by thepipet method (Gee and Bauder 1994). Soil chemical propertieswere measured according to standard methods (Sparks 1996).Soil pH was measured using a glass electrode in a suspensionof 1:4 ratio of soil to water. Electrical conductivity (EC) wasmeasured in the soil extracts (1:4). Calcium carbonate contentwas determined volumetrically by measuring the CO2 volumeevolved from the reaction of HCl with soil carbonate using acalcimeter. The soil organic matter wasmeasured by oxidationusing a mixture of sulfuric acid and potassium dichromate,and the excess of dichromate was titrated with ferrous ammo-nium sulfate (Nelson and Sommers 1996).
Arab J Geosci
The total content of heavy metals (Fe, Mn, Zn, Cu, Cr, Co,Ni, Pb, and Cd) in the soil samples was determined afterdigestion using Hossner method (Hossner 1996). It is wellknown that heavy metals can be completely digested usingHossner method (total-total method), since this includes theuse of HF in addition to H2SO4-HClO4. This mixture isappropriate for dissolving silicates completely. Specifically,in the present study, 0.5 g of each soil sample was digestedusing HF-H2SO4-HClO4. After cooling, the digested solutionswere filtered using Watman 42, then brought to a total volumeof 50 mL with deionized water in a volumetric flask. Theconcentrations of total metal were analyzed using AAS. Forquality control, each collected soil sample was digested andanalyzed in four replicates. Q test was applied to excludeabnormal readings at a confidence level of 90 %.
Data calculation and analysis
The multivariate analysis including the PCA and HCA wasperformed to identify the relationship among investigated
metals in study area and their possible sources. The PCA,HCA, and Spearman’s correlation coefficient analysis wereperformed by using Statistica for Windows statistical software(Statsoft 1995). In the PCA, varimax raw was used as therotation method in the analysis to determine total variance andloading of investigated metals in the soil of the study area. TheHCAwas obtained by Ward’s method (Pearson’s r).
In the present study, the quality guidelines of sediment(SQGs) were applied to measure heavy metals of concern inthe study area (MacDonald et al. 2000). Moreover, two indi-ces were computed: the toxicity degree index (TDI; Jamshidi-Zanjani and Saeedi 2013) and Sediment Quality GuidelineQuotient (SQG-Q; Long and MacDonald 1998). The toxicitydegree is a recent index (TDI) suggested based on the resultsof multivariate statistical analysis of the data from the studyarea (Jamshidi-Zanjani and Saeedi 2013). The TDI was cal-culated using the following equation:
TDI ¼X
wi 1þ Ci=SQG−Qið Þð Þ2
27o 03' 18''N
26o55' 46''N
49o43' 56''E49o34' 18''E
Location of Study Area
0 2.5 5 Km
Sample No.3
Fig. 1 The location of study area and distribution of sampling points
Arab J Geosci
Where wi is the variable weight that was computed basedon the proportion of eigen values obtained from PCA results.Ci is metal concentration and SQG-Qi is the effect rangemedian (ERM) values of each metal. The TDI values consistof five categories: low toxic level (1 < TDI ≤ 1.5), low-median toxic level (1.5 < TDI ≤ 2), median toxic level(2 < TDI ≤ 3), median-high toxic level (3 < TDI ≤ 4),and high toxicity (TDI > 4).
The SQG-Q index was also calculated to assess thepotential for adverse biological effects of study area.The SQG-Q was calculated using the following equa-tions (Long and MacDonald 1998):
SQG−Q ¼X
ERM −Qi
� �=n
ERM−Qi ¼ Ci=ERM
Where n and Ci are the number and concentration of heavymetals, respectively. ERM-Qi is the effect range median con-centration suggested by Long et al. (1995) and MacDonaldet al. (1996). The SQG-Q values consist of four categories:lowest potential for adverse biological effect (SQG-Q ≤ 0.10),low-median potential for adverse biological effect (0.1 < TDI≤ 0.5), median-high potential for adverse biological effect (0.5< SQG-Q ≤ 1.5), and highest potential for adverse biologicaleffect (SQG-Q > 1.5).
To assess the level of metal enrichment and to speculate themetal origin in soil samples of study area, enrichment factor(EF) was computed using the following equation (Sutherland2000):
EFm ¼ Cm soilð Þ=CFe soilð Þ� �
= Cm earth crustð Þ=CFe earth crustð Þ� �
Where Cm(soil sample) is content of the examined metal in thesoil sample; CFe(soil sample) is content of the reference metal(Fe) in the soil sample; Cm(earth crust) is content of the examinedmetal in the earth crust; and CFe(earth crust) is content of thereferenced metal (Fe) in the earth crust. The EF values consistof five categories: deficiency tominimal (EF < 2), moderate (2< EF < 5), significant (5 < EF < 20), very high (20 < EF < 40),and extremely high enrichment (EF > 40).
In addition to the calculation of EF values, the lithogenicheavy metal content was calculated by the following equation(Hernandez et al. 2003):
Where [M]lithogenic is the lithogenic heavy metal content;[Fe]sample is the total content of Fe in soil samples; and ([M]/
[Fe])lithogenic is the ratio in the earth’s crust. The anthropogenicheavy metal content was calculated by the following equation:
M½ �anthropogenic ¼ M½ �total − M½ �lithogenic
Where [M]anthropogenic is the anthropogenic heavy metalcontent and [M]total is the total content of heavy metal mea-sured in soil samples.
Results and discussion
Physico-chemical properties of soil samples
Some physico-chemical properties of the studied soil samplesare presented in Table 1. The pH values of soil samples rangedbetween 6.3 and 9.2 with an average value of 7.7, suggestingalkaline conditions for the most soil samples. The EC valuesranged between 0.2 and 12.3 dSm−1, indicating that the stud-ied soil samples were significantly affected by salinity of seawater. The texture of studied soil samples is mainly dominatedby sand fraction, ranged from 73 % to 92 %. The content oforganic matter (OM) and calcium carbonate (CaCO3) variedin the studied soil samples from 0.1 to 2.6 % with an averageof 1.4 % and from 0.5 to 69 % with an average of 1.4 %,respectively.
Soil heavy metal concentrations and quality guidelines
Data in Table 2 show the minimum, maximum, mean, stan-dard deviation, coefficients of variation, and skewness ofheavy metals (Fe, Zn, Cu, Ni, Cr, Co, Cd, Mn, and Pb) at soilsampling depth of 0–30 and 30–60 cm. Among all heavymetals, the concentrations of Cd were not detectable in all soilsamples. The minimum, maximum, and mean concentrationsof all investigated heavy metals (except for Cr) are lower thantheir corresponding values of the common range in soil ac-cording to Lindsay (1979). In the case of Cr, its minimum andmaximum concentrations are higher than those of common
Table 1 Physico-chemical soil properties
Characteristic Max Min Average Std CV
p H 9.2 6.3 7.7 0.6 7.4
EC (dSm−1 ) 12.3 0.2 1.8 2.1 119.3
O.M% 2.6 0.1 1.4 0.6 38.4
CaCO3 % 69 0.5 25 22 88
Clay % 16 6 9 2.6 29
Silt % 14 2 2.5 1.7 69
Sand % 92 73 88.5 3.4 3.8
Arab J Geosci
range in soil. Additionally, the maximum concentrations of Crare higher than the geochemical background in average shale.It was observed generally that the mean heavy metal
concentrations in soil samples of 0–30 cm depth are closedwith those of 30–60 cm depth.Moreover, at the sites out of thetidal zone, the minimum, maximum, and mean concentrations
Table 2 Minimum, maximum and average content of heavy metals in soil samples of study area
Sampling sites Heavy Metals
Fe Mn Zn Cu Ni Cr Co Pbmg kg−1
Tidal zone
0–30 cm Max 4100 120 46 18 6 130 ND 12
Min 530 9 8 1 ND 7.5 ND 1.1
Mean 1800 36 21 5 1 34 – 4
SD 972 29.8 9.83 4.27 2.06 33.5 – 2.61
CV, % 55 83 47 86 175 98 – 66
Skewness 1.04 2.12 1.21 2.7 1.48 2.23 – 2.11
30–60 cm Max 4100 93 44 11 6 110 ND 24
Min 770 11 8 2 ND 6.9 ND ND
Mean 1800 38 22 5 2 42 – 5.2
SD 854 24.6 9.77 3.13 2.25 30.7 – 6.56
CV, % 46 65 45 65 112 73 – 125
Skewness 1.28 1.03 0.98 1.01 0.48 1.00 – 2.35
Out of the tidal zone
0–30 cm Max 5400 140 52 21 10 120 5 9.1
Min 1800 35 11 3 ND 20 ND 1.5
Mean 3400 78 25 6 6 69 0.9 4.3
SD 1015 31.9 11.5 4.74 2.67 33.9 1.88 2.11
CV, % 29 41 46 74 46 49 200 49
Skewness 0.58 0.66 1.25 2.46 −0.40 0.27 1.62 0.71
30–60 cm Max 5700 150 69 11 17 93 4 20
Min 680 12 9 2 ND 8.1 ND 0.42
Mean 3000 70 23 5 5 55 1 4.5
SD 1377 39.6 16.0 2.28 4.45 24.3 1.85 4.73
CV, % 46 56 69 44 81 45 166 105
Skewness 0.22 0.55 2.10 0.58 1.38 −0.29 1.15 2.75
Common rangea Max 55000 3000 300 100 500 1000 40 200
ND not detectable, SQG sediment quality guidelines, TEL threshold effect level, ERL the effect range low, PEL probable effect level, ERM the effectrange mediana Lindsay 1979; b Turekian and Wedepohl (1961); cMacDonald et al. 2000; dMacDonald et al. 1996
Arab J Geosci
of most heavy metals (especially at 0–30 cm depth) are higherthan those of soil samples collected along the tidal zone.
The raw data of studied metals were strongly positivelyskewed, with skewnesses much higher than 0, indicating someextremely high values (Wu and Zhang 2010). It may alsoindicate that the investigated heavy metals positively skewtoward their lower values. The coefficients of variation formetals were between 29 % and 200 %. These obtained vari-ations in soil total metal content and coefficients of skew-nesses suggest that these heavy metals may be related todifferent sources.
Numerical sediment quality guidelines (SQGs) have beenused to determine the ecotoxicological sensibility of contam-inants in marine and coastal ecosystem and to identify con-taminants of concern in aquatic ecosystems (MacDonald et al.1996; 2000). Based on the SQGs, sediments can be catego-rized into three classes: non-polluted, moderately polluted andheavily polluted. The results showed that the soil samples inthe study area were in non-polluted for the investigated heavymetals (except Cr; Table 2). The data showed that the maxi-mum Cr concentrations were in heavy rate of pollution, but itsmean concentrations were in moderate rate of pollution. Tohave a better insight on the adverse biological effects of eachcontaminant, the obtained data should be compared with thefollowing SQGs including: threshold effect levels (TEL),probable effect levels (PEL), the effect range low (ERL),and the effect range median (ERM) for each metal (Longet al. 1995; MacDonald et al. 1996). Our results indicated thatonly the maximum concentrations of Cr were found to beabove threshold effect concentrations (TEL and ERL) as wellas above PEL (Table 2). Furthermore, its average concentra-tions were found to be above the TEL. Therefore, the adverseeffect by Cr on dwelling organisms might be expected.
To have a more realistic measure of predicted toxicity, themean SQG quotients (SQG-Q) were calculated based on theeffect range median (ERM; Long and MacDonald 1998;Jamshidi-Zanjani and Saeedi 2013; Usman et al. 2013). Inthe present study, the SQG-Q was determined as the mean ofthe ERM-Qi for Zn, Cu, Cr, Ni, and Pb, which have thereported values of ERM. This quotient was classified aslowest potential of adverse biological effect (SQG-Q ≤ 0.1),low-medium potential of adverse biological effect (0.1 <SQG-Q ≤ 0.5), medium-high potential of adverse biologicaleffect (0.5 < SQG-Q ≤ 1.5), or high (SQG-Q > 1.5) potentialof adverse biological effect (Long andMacDonald 1998). Ourresults revealed that the most investigated sampling points atsoil sampling depths of 0–30 and 30–60 cm showed thelowest potential of adverse biological effects (Fig. 2), suggest-ing no toxic impacts or significant risk to the biota.
In the present study, the recent proposed index of toxicitydegree (TDI) was also calculated based on ERM and theresults of multivariate statistical analysis (PCA) of the datafrom the study area (Jamshidi-Zanjani and Saeedi 2013).
Results of TDI are shown in Fig. 2. The values of this indexin all investigated sampling points of study area were less than1, indicating that soil samples of study area have no potentialof toxic effect on biota. It was also observed that there is a highpositive significant correlation between SQG-Q and TDI at 0–30 cm depth (r2=0.94) and 30–60 cm depth (r2=0.92) of studyarea (data not shown). Similarly, Jamshidi-Zanjani and Saeedi(2013) found high value of r2 (0.81) between these twoindices, suggesting that TDI may be a more realistic measureof predicted toxicity and more capability to differentiate areaswith different pollution extents.
Enrichment factor (EF) and heavy metals origin
The EF is a convenient measure of geochemical trends and isapplied for speculating on lithogenic or anthropogenic originof heavy metals (Sutherland 2000; Ye et al. 2011). The max-imum, minimum, and mean results of EF values are presentedin Fig. 3. From the obtained data, the heavy metals of the tidalzone at soil sampling depth of 0–30 and 30–60 cm have EFvalues, respectively, (3.5–29) and (2.2–23) for Zn, (1.3–19)and (0.99–14) for Cu, (0.0–1.9) and (0.0–2.7) for Ni, (2.8–12)and (3.4–21) for Cr, (0.75 to 1.9) and (0.73–1.7) for Mn, and(1.9–27) and (0–32) for Pb. Meanwhile, the EF values of theout of the tidal zone at soil sampling depth of 0–30 and 30–60 cm were, respectively, amounted to (2.8–18) and (2.1–19)for Zn, (0.89–7.8) and (0.71–10) for Cu, (0–2.1) and (0.0–2.9)for Ni, (2.8–16) and (4.5–12) for Cr, (0–4.7) and (0.0–5.7) forCo, (0.83–1.8) and (0.87–1.9) for Mn, and (1.3–9.9) and(0.62–23) for Pb. Some researchers suggest that heavy metalswith EF values less than 2 were not a major concern contam-inant (Han et al. 2006; Ye et al. 2011). In this context, the EFvalues for Co (in 71–100 % of soil samples), Ni (in 86–100 %of soil samples) andMn (in all the soil samples) were less than2 (Fig. 4), suggesting that their contaminations may be not amajor concern. However, few number of soil samples (out ofthe tidal zone) has EF values 2–5 for Co and Ni, indicatingmoderate enrichment. By contrast, the considerable number ofcollected soil samples in the surface and subsurface layers hasrelatively higher EF values 5–20 for Zn, Cu, Cr, and Pb.Additionally, around 10–15 % of samples reached very highenrichment (20<EF<40) for Zn and Pb. This indicates that asevere degree of Zn, Cu, Cr, and Pb contamination may bepossible in the study area. The obtained variations in EFvalues may be as a result of the difference in the magnitudeof input for each metal in the soil. Generally, it was observedthat the maximum EF values of Zn, Cu, Cr, and Pb in the soilsamples at out of the tidal zone were higher than those at thetidal zone. This suggests that the soil samples located farthestaway from the coastal and near the activities of petrochemicalindustries may have high potential to enrich soil with suchheavy metals.
Arab J Geosci
0
0.02
0.04
0.06
0.08
0.1
0.12
0 2 4 6 8 10 12 14
SQ
G-Q
Sampling points
Tidal zone 0-30 cm depth
30-60 cm depth
0
0.02
0.04
0.06
0.08
0.1
0.12
0.14
0 2 4 6 8 10 12 14
SQ
G-Q
Sampling points
Out of the tidal zone0-30 cm depth
30-60 cm depth
0
0.1
0.2
0.3
0.4
0 2 4 6 8 10 12 14
Toxi
city
deg
ree
ind
ex (T
DI)
Sampling points
Tidal zone 0-30 cm depth
30-60 cm depth
0
0.1
0.2
0.3
0.4
0 2 4 6 8 10 12 14
Toxi
city
deg
ree
ind
ex (T
DI)
Sampling points
Out of the tidal zone 0-30 cm depth
30-60 cm depth
Fig. 2 Sediment quality guideline quotient (SQG-Q) and the toxicity degree index (TDI) of soil samples
Fig. 3 EF values for heavy metals at tidal and out of the tidal zone
Arab J Geosci
It has been speculated that a value of EF≤2 indicates thatheavy metal may be as a result of crustal materials or natural
weathering processes. Meanwhile, soil samples having EFvalues greater than 2 suggest that a significant portion of the
0
20
40
60
80
100
Zn Cu Ni Cr Co Mn Pb
% o
f so
il sa
mp
les
Heavy metals
Tidal zone (30-60 cm depth)
EF 2
EF 2
0
20
40
60
80
100
Zn Cu Ni Cr Co Mn Pb
% o
f so
il sa
mp
les
Heavy metals
Tidal zone (0-30 cm depth)
EF 2
EF 2
0
20
40
60
80
100
Zn Cu Ni Cr Co Mn Pb
% o
f so
il sa
mp
les
Heavy metals
Out of the tidal zone(0-30 cm depth)
EF 2
EF 2
0
20
40
60
80
100
Zn Cu Ni Cr Co Mn Pb
% o
f so
il sa
mp
les
Heavy metals
Out of the tidal zone (30-60 cm depth)
EF 2
EF 2
Fig. 4 % of soil samples having EF values less or greater than 2
13.4%
86.6%
Zn
40.7%
59.3%
Cu
16.9%
83.1%
Cr
14.8%
85.2%
PbLith
Anth
21.6%
78.4%
55.8%44.2%
15.4%
84.6%
27.6%
72.4%
Lith
Anth
Out of the tidal zone
Tidal zone
Fig. 5 Lithogenic (Lith) and anthropogenic (Anth) proportion of the tidal and out of the tidal zone regardless soil sampling depth
Arab J Geosci
heavy metal is delivered from non-crustal materials and theenrichment is mainly due to anthropogenic inputs (Hernandezet al. 2003). Therefore, the percentage of investigated sampleshaving EF values greater than 2 in the study area calculatedand represented in Fig. 4, which indicates that the heavymetals of Ni, Co, and Mn in all soil samples may be as a resultof crustal materials or natural weathering processes. On theother hand, the heavy metals of Zn, Cu, Cr, and Pb having EFvalues greater than 2 in the most soil samples, indicating thatthese heavy metals may be enriched as a result of
anthropogenic inputs. In addition, the calculated lithogenicand anthropogenic proportion of these four metals in the studyarea confirms this finding (Fig. 5). The mean values of an-thropogenic proportion of these metals in the investigatedareas regardless soil sampling depth were amounted to 78.4–86.6 % for Zn, 44.2–59.3 % for Cu, 83.1–84.6 % for Cr, and72.4–85.2 % for Pb. The value of 50 % can be considered as aminimum value for anthropogenic contribution. In this con-text, our results indicate that the soil samples showed a highersignificant anthropogenic contribution for Zn, Cr, and Pb thanfor Cu. Generally, it can be speculated that these four metals ofthe studied area are originated from anthropogenic sources,revealing that the environmental metal contamination of in-dustrial activities might be occurred. The emissions fromindustrial chimneys of petrochemicals in the study area maybe a possible source for heavy metals. Chemical and petro-chemical industries have been identified as large emitters forheavy metals. Previously, it has been reported that heavymetals such as Cd, Pb, Cr, and As are the most abundantmetals found in soils around chemical and petrochemical sites(Kabir et al. 2012), mainly due to refining operations andburning of residual oils. Overall, it is possible that the marineenvironment can be polluted with heavy metals, attributing tothe industrial and human activities (Badr et al. 2009; Zhanget al. 2012; Usman et al. 2013). Several other researchers haveevaluated heavy metal contamination in sediments from someRed Sea coastal areas, Kingdom of Saudi Arabia (Badr et al.2009; Usman et al. 2013). They found that the sedimentsamples were enriched with some heavy metals such as Cd,Cu, Zn, Pb, Ni, and Mn, mainly due to discharging uncon-trolled industrial and sewage wastes. In other reports, it hasbeen suggested that accumulation of heavy metals (Cu, Zn,Cr, and Pb) in sediments might be attributed to the aquacultureactivities (Zhang et al. 2012). The contamination of marineenvironment with heavymetals such as Zn, Cu, Cr, and Pb can
Table 3 The Spearman correlation coefficients (r) among various metalsat soil sampling depth of 0–30 cm and 30–60 cm
Heavy metals
Zn Cu Ni Cr Co Mn Pb
0–30 cm depth
Zn 1
Cu 0.59* 1
Ni 0.17 0.41* 1
Cr 0.24 0.35 0.61* 1
Co 0.22 0.26 0.53* 0.42* 1
Mn 0.25 0.39* 0.78* 0.85* 0.52* 1
Pb −0.39* −0.15 −0.02 0.13 −0.11 0.04 1
Fe 0.26 0.45* 0.81* 0.88* 0.52* 0.97* 0.04
30–60 cm depth
Zn 1
Cu 0.33 1
Ni 0.16 0.37 1
Cr −0.14 −0.18 0.60* 1
Co 0.19 0.21 0.54* 0.25 1
Mn 0.01 −0.08 0.79* 0.82* 0.46* 1
Pb −0.44* −0.01 0.15 0.07 −0.04 −0.03 1
Fe −0.01 0.06 0.84* 0.85* 0.53* 0.96* 0.04
Table 4 Rotated component ma-trix of soil samples using varimaxraw rotation
generally be attributed to boat exhaust emissions, antifoulingchemicals used in boat paints, sewage effluents, chemical andoil leakage, and discharges of reject water and effluents from adesalination plant (Badr et al. 2009; Zhang et al. 2012; Usmanet al. 2013; Naser 2013).
Multivariate statistical analysis and correlation study
The correlation study showed that significant positive corre-lations among various metals in soil samples of study area(Table 3). According to Spearman’s coefficient, Ni, Co, Cr,and Cu are significantly correlated with Fe and Mn at soilsampling depth of 0–30 and 30–60 cm (0.39<r<0.88),except for Cu at 30–60 cm depth. Ni, Cr, and Co are
also significantly correlated with each other. Additionally,Zn showed significant positive correlation with the Cu at0–30 cm depth (r=0.59). By contrast, Zn showed sig-nificant negative correlation with the Pb at 0–30 cmdepth (r=−0.39) and 30–60 cm depth (r=−0.44).
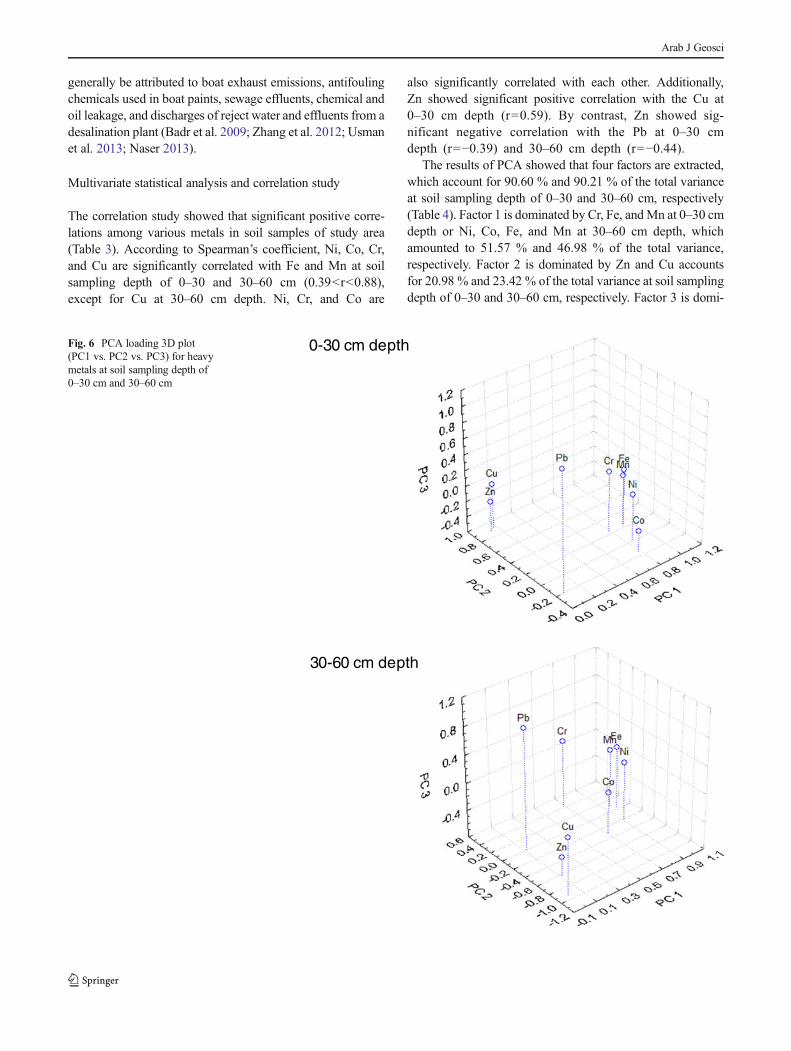
The results of PCA showed that four factors are extracted,which account for 90.60 % and 90.21 % of the total varianceat soil sampling depth of 0–30 and 30–60 cm, respectively(Table 4). Factor 1 is dominated by Cr, Fe, andMn at 0–30 cmdepth or Ni, Co, Fe, and Mn at 30–60 cm depth, whichamounted to 51.57 % and 46.98 % of the total variance,respectively. Factor 2 is dominated by Zn and Cu accountsfor 20.98 % and 23.42 % of the total variance at soil samplingdepth of 0–30 and 30–60 cm, respectively. Factor 3 is domi-
0-30 cm depth
30-60 cm depth
Fig. 6 PCA loading 3D plot(PC1 vs. PC2 vs. PC3) for heavymetals at soil sampling depth of0–30 cm and 30–60 cm
Arab J Geosci
nated only by Pb accounting for 11.90% of the total variances.However, Factor 4 is dominated only by Ni at 0–30 cm depthor only by Cr at 30–60 cm depth accounting for less than 8 %of the total variance. The 3D plot of the PCA showed that theinvestigated heavy metals come from different sources(Fig. 6). These data indicate that there is high loading of somemetals such as Fe, Mn, Ni, Co, and Cr at 0–30 cm depth andFe, Mn, Ni, and Co at 30–60 cm depth. Based on theHCA, the investigated heavy metals are grouped intodifferent clusters (Fig. 7). It was observed that there is acluster containing Fe and Mn, which may be associatedwith some heavy metals such as Ni, Co, or Cr.Moreover, the correlation coefficients between them arealso found to be significant. This finding may revealthat these heavy metals are from the same sources. Inthis context, Fe, Mn, Ni, and Co originated fromlithogenic source, as indicated by EF values (EF≤2).The high obtained loading of these metals and theirsignificant positive correlations with Fe and Mn suggests thatMn and Fe oxides/hydroxides in soil might play a majorrole in soil metal distribution. Similarly, Chen et al. (2008)
found that Co, Cr, Ni, and Mn had significantly positivecorrelations with Al2O3, Fe2O3, and SiO2 of the soils, indicat-ing that the source of these heavy metals was mainly con-trolled by soil-forming factors. This could further confirmtheir natural sources.
An obtained correlation between Cu and Zn in PCA andcorrelation analyses is an indicator for another commonsource of the two metals. It was also observed that Pb standsalone (component 3) in PCA analysis and did not showsignificant positive correlation with other metals, suggestingprobably another different source. Similarly, the HCA indi-cates that these three metals of Zn, Cu, and Pb were alsogrouped into two clusters: (a) Zn and Cu, and (b) Pb, whichhave EF values greater than 2, indicating that these heavymetals may be originated from anthropogenic sources.Though the EF values of Cr are greater than 2 and its possibleorigin is anthropogenic; the concentrations of Cr are signifi-cantly correlated with Fe and Mn that is of lithogenic origin.Therefore, this finding speculates that Cr in soil may becontrolled by both natural and anthropogenic sources. Ourresults generally suggest that Zn, Cu, Cr, and Pb can be
0-30 cm depth
30-60 cm depth
Fig. 7 Cluster dendogram forheavy metals by Ward’s method(Pearson’s r) at soil samplingdepth of 0–30 cm and 30–60 cm
Arab J Geosci
affected by anthropogenic activities, whereas Fe, Mn, Co, andNi can be controlled by original materials and thereforeinterpreted as natural sources.
Conclusions
The results of the study showed that only Cr concentrationsare higher than those of the soil common range as well as thegeochemical background in average shale. Based on the ob-tained data of EF values, PCA, HCA, and correlation analysis,the soil samples of study area may be enriched with someheavy metals such as Zn, Cu, Cr, and Pb, which are defined asanthropogenic sources. By contrast, Ni, Co, Mn, and Fe maybe originated from the soil parent materials and natural pro-cess. It should be mentioned that it is possible to use multi-variate analyses in combination with EF values as useful toolto investigate the origin of heavy metal in soils. Future studiesshould focus on investigation of speciation, leachibility, andbioavailability of heavy metals in such soils of the ArabianGulf coast affected by industrial activities.
References
Abollino O, Aceto M, Malandrino M, Mentasti E, Sarzanini C, Petrella F(2002) Heavy metals in agricultural soils from Piedmont, Italy.Distribution, speciation and chemometric data treatment.Chemosphere 49:545–557
Anju M, Banerjee DK (2012) Multivariate statistical analysis of heavymetals in soils of a Pb–Zn mining area, India. EnvironMonit Assess184:4191–4206
Attia OEA, Abu Khadra AM, Nawwar AH, Radwan GE (2012) Impactsof human activities on the sedimentological and geochemical char-acteristics of Mabahiss Bay, North Hurghada, Red Sea, Egypt. ArabJ Geosci 5:481–499
Badr NBE, El-Fiky AA,Mostafa AR, Al-Mur BA (2009) Metal pollutionrecords in core sediments of some Red Sea coastal areas, Kingdomof Saudi Arabia. Environ Monit Assess 155:509–526
Bodin N, N’Gom-Kâ R, Kâ S, Thiaw OT, Tito de Morais L, Le Loc’h F,Rozuel-Chartier E, Auger D, Chiffoleau J-F (2013) Assessment oftrace metal contamination in mangrove ecosystems from Senegal,West Africa. Chemosphere 90:150–157
Caeiro S, Costa MH, Ramos TB, Fernandes F, Silveira N, Coimbra A,MedeirosG, PainhoM (2005) Assessing heavymetal contaminationin Sado Estuary sediment: an index analysis approach. Ecol Indic 5:151–169
Chen T, Liu X, Zhu M, Zhao K, Wu J, Xu J, Huang P (2008)Identification of trace element sources and associated risk assess-ment in vegetable soils of the urbane rural transitional area ofHangzhou, China. Environ Pollut 151:67–78
DeMora S, Fowler SW,Wyse E, Azemard S (2004) Distribution of heavymetals in marine bivalves, fish and coastal sediments in the Gulf andGulf of Oman. Mar Pollut Bull 49:410–424
El-Sorogy AS, Nour H, Essa E, Tawfik M (2013) Quaternary coral reefsof the Red Sea coast, Egypt: diagenetic sequence, isotopes and tracemetals contamination. Arab J Geosci 6:4981–4991
Fernandes L, Nayak GN, Ilangovan D (2012) Geochemical assessment ofmetal concentrations in mangrove sediments along Mumbai coast,India. World Acad Sci Eng Technol 61:258–263
Garali AB, Ouakad M, Gueddari M (2010) Contamination of superficialsediments by heavy metals and iron in the Bizerte lagoon, northernTunisia. Arab J Geosci 3:295–306
Gee GW, Bauder JW (1994) Particle-size analysis. 377–382. In Methodsof Soil Analysis. Part 1, 3rd edition. Physical and MineralogicalMethods. Edited by Klute, A. SSSA and ASA, Madison, WI
Han YM, Du PX, Cao JJ, Posmentier ES (2006) Multivariate analysis ofheavy metal contamination in urban dusts of Xi’an, Central China.Sci Total Environ 355:176–186
Hernandez L, Probst A, Probst JL, Ulrich E (2003) Heavy metal distri-bution in some French forest soils: evidence for atmosphere con-tamination. Sci Total Environ 312:195–210
Hossner LH (1996) Dissolution for total elemental analysis. In: Methodsof soil analysis. Part 3, 3rd edition Chemical Methods. (eds.) Sparkset al. SSSA and ASA, Madison, WI. Pp: 46–64
Jamshidi-Zanjani A, Saeedi M (2013) Metal pollution assessment andmultivariate analysis in sediment of Anzali international wetland.Environ Earth Sci 70:1791–1808
Jara-Marini ME, Soto-Jime’nez MF, Pa’ez-Osuna F (2008) Bulk andbioavailable heavymetals (Cd, Cu, Pb, and Zn) in surface sedimentsfrom Mazatla’nHarbor (SE Gulf of California). Bull EnvironContam Toxicol 80:150–153
Kabir E, Ray S, Kim KH, Yoon HO, Jeon EC, KimYS, Cho YS, Yun ST,Brown RJC (2012) Current status of trace metal pollution in soilsaffected by industrial activities. Sci World J. doi:10.1100/2012/916705
Krami, LK, Amiri, F, Sefiyanian, A, Shariff, ARM, Tabatabaie, T,Pradhan, B (2013) Spatial patterns of heavy metals in soil underdifferent geological structures and land uses for assessing metalenrichments. Environ Monit Assess. http://dx.doi.org/10.1007/s10661-013-3298-9
Krishna AK, Govil PK (2007) Soil contamination due to heavy metalsfrom an industrial area of Surat, Gujarat, Western India. EnvironMonit Assess 124:263–275
Lindsay W (1979) Chemical equilibrai in soils. 1st edition. A Wiley-Interscience Publication. John Wiley and Sons, New York
Long ER, MacDonald DD (1998) Recommended uses of empiricallyderived, sediment quality guidelines for marine and estuarine eco-systems. Hum Ecol Risk Assess 4:1019–1039
Long ER, MacDonald DD, Smith SL, Calder FD (1995) Incidence ofadverse biological effects within ranges of chemical concentrationsin marine and estuarine sediments. Environ Manag 19:81–97
LuoW, Lu Y, Giesy JP,Wang T, Shi Y,WangG, Xing Y (2007) Effects ofland use on concentrations of metals in surface soils and ecologicalrisk around Guanting Reservoir, China. Environ Geochem Health29:459–471
MacDonald DD, Carr S, Clader FD, Long ED, Ingersoll CG (1996)Development and evaluation of sediment quality guidelines forFlorida coastal waters. Ecotoxicology 5:253–278
MacDonald DD, Ingersoll CG, Berger TA (2000) Developmentand evaluation of consensus-based sediment quality guide-lines for freshwater ecosystems. Arch Environ ContamToxicol 39:20–31
Madkour HA (2013) Impacts of human activities and natural inputs onheavy metal contents of many coral reef environments along theEgyptian Red Sea coast. Arab J Geosci 6:1739–1752
Naser HA (2013) Assessment and management of heavy metal pollutionin the marine environment of the Arabian Gulf: a review. Mar PollutBull 72:6–13
Nayek S, Gupta S, Saha RN (2013) Heavy metal distribution and chem-ical fractionation in water, suspended solids and bed sediments ofindustrial discharge channel: an implication to ecological risk. Res JChem Environ 17:26–33
Nelson DW, Sommers LE (1996) Total carbon, organic carbon, andorganic matter. In. Methods of soil analysis. Part 3. ChemicalMethods. Edited by Sparks et. al., SSSA and ASA, Madison, WI.Pp. 961–1010
PourangN,NikouyanA,Dennis J (2005) Trace element concentrations infish, surficial sediments and water from northern part of the PersianGulf. Environ Monit Assess 109:293–316
Praveena SM, Radojevic M, Abdullah MH (2007) The assessment ofmangrove sediment quality in Mengkabong Lagoon: an index ap-proach. Int J Environ Sci Educ 2:60–68
Ratha DS, Sahu BK (1993) Source and distribution of metals in urban soilof Bombay, India, using multivariate statistical techniques. EnvironGeol 22(276):285
Sadiq M, Alam I (1989) Metal concentrations in Pearl Oyster,Pinctadaradiata, collected from Saudi Arabian Coast of theArabian Gulf. Bull Environ Contam Toxicol 42:111–118
Sadiq M, Alam IA, Al-Mohana H (1992) Bioaccumulation of nickel andvanadium by clams (Meretrixmeretrix) living in different salinitiesalong the Saudi coast of the Arabian Gulf. Environ pollut 76:225–231
Sheppard C, Al-Husiani M, Al-Jamali F, Al-Yamani F, Baldwin R,Bishop J (2010) The Gulf: a young sea in decline. Mar Pollut Bull60:3–38
Singh S, KumarM (2006) Heavy metal load of soil, water and vegetablesin peri-urban Delhi. Environ Monit Assess 120:79–91
Sparks DL (1996) Methods of soil analysis, Madison,Wi: Soil Society ofAmerican
StatSoftInc (1995) Statistica for Windows (Computer Program Manual).StatSoft, Inc., Tulsa, OK
Sutherland RA (2000) Bed sediment associated trace metals in an urbanstream, Oahu, Hawaii. Environ Geol 39:611–627
Turekian KK, Wedepohl KH (1961) Distribution of the elements in somemajor units of the Earth's Crust. Geol Soc Am Bull 72:175–192
Usman ARA, Alkreda R, Al-Wabel MI (2013) Heavy metalcontaminationin sediments and mangroves from the coast ofRedSea: Avicennia marina as potential metal bioaccumulator.Ecotox Environ Safe 97:263–270
Venkatramanan S, Ramkumar T, Anithamary I, Vasudevan S (2012)Heavy metal distribution in surface sediments of theTirumalairajan river estuary and the surrounding coastal area, eastcoast of India. Arab J Geosci. doi:10.1007/s12517-012-0734-z
Wu C, Zhang L (2010) Heavy metal concentrations and their possiblesources in paddy soils of a modern agricultural zone, south easternChina. Environ Earth Sci 60:45–56
Ye C, Li S, Zhang Y, Zhang Q (2011) Assessing soil heavy metalpollution in the water-level-fluctuation zone of the Three GorgesReservoir, China. J Hazard Mater 191:366–372
Yongming H, Peixuan D, Junji C, Posmentier ES (2006) Multivariateanalysis of heavy metal contamination in urban dusts of Xi’an,Central China. Sci Total Environ 355:176–186
ZhangW, Liu X, Cheng H, Zeng EY, Hu Y (2012) Heavy metal pollutionin sediments of a typical mariculture zone in South China. MarPollut Bull 64:712–720


![MSG 366 Multivariate Analysis [Analisis Multivariat] ?· January 2012 MSG 366 – Multivariate Analysis…](https://static.documents.pub/doc/80x56/5c875e7909d3f2c77a8b9d81/msg-366-multivariate-analysis-analisis-multivariat-january-2012-msg-366-.jpg)
![MSG 366 Multivariate Analysis [Analisis Multivariat] Dr... · MSG 366 – Multivariate Analysis [Analisis…](https://static.documents.pub/doc/80x56/5b14286a7f8b9a397c8b92ab/msg-366-multivariate-analysis-analisis-multivariat-dr-msg-366-multivariate.jpg)


