Heavy mineral and grain size characterisation of bitumen seeps exposed at Ogbere, Southwestern
Nigeria
*Akintola A. I., Ikhane P. R. and Adeola O.
Department of Earth Sciences, Olabisi Onabanjo University, P.M.B. 2002, Ago-Iwoye, Ogun State, Nigeria
Accepted February 27, 2013
Heavy mineral composition and grain size analysis of the oil sands outcropping in Ogbere area located in the western part of the Dahomey basin, south western Nigeria were studied. A total of ten tar sand samples were considered with a view to elucidate and determine the provenance of the fluvial sediments, particle sizes of the sand and the heavy mineral content. Grain-size analysis result gives a mean value of (0.18-1.10) suggesting moderately to poorly sorted, platykurtic to leptokurtic coarse skewed to strongly fine skewed distribution. Heavy mineral suites of Zircon, Tourmaline and Rutile with a ZTR index of (44.7-61.29). It can therefore be said that on the average, the ZTR index indicate that the sediments were derived from igneous and metamorphic rock of nearby basement rocks but their accumulation was strongly controlled by mechanical process of sedimentation. Keywords: Heavy mineral, Platykurtic, leptokurtic, Skewed, Rutile.
INTRODUCTION Oil sands are composed of sand, heavy oil and clays that are rich in mineral and water. The heavy oil in this sand is referred to as bitumen – a sticky viscous black substance. Presence of this bitumen also results in the name bituminous sand for the oil sand. Oil or bituminous sand occurs within a belt that cut across Ogun, Ondo and Edo State; South-western Nigeria. These are all areas which fall within the eastern margin of Dahomey coastal sedimentary basin.
The origin/occurrence of this deposit in Nigeria has been subjected to several schools of thought since its discovery. One of these opinions is that crude oil might have migrated from Niger Delta Oil Field through fractures, faults or interconnected sandy formation into eastern portion of the Dahomey Basin. Due to later biodegradation of the crude oil accumulated, bitumen originated.
In spite of the inadequate information available on oil sands, significant work has been carried out by various
workers on the geology, origin, occurrence, chemistry, nature and utility of these oil sands. Adegoke et al., (1977) and (1980), Omatsola and Adegoke (1981), Coker (1982) have also indicated that residual oil occurs in the upper cretaceous sediments which outcrop on the Okitipupa structure. The origin of the oil in the sand either in situ or from an external source has been described by Ekweozor (1985), Nwachukwu and Ekweozor (1989). Studies by the Geological Consultancy Unit of Obafemi Awolowo University, Ile Ife in the 1980s have revealed a lot of information on the occurrence and the characteristic nature of bituminous sands of South-western Nigeria. As Geology is field oriented, this research was carried out by doing the detailed geological mapping of the Ogbere study area of southwestern Nigeria in which samples of these oil sands were collected. The samples were later sent for Grain size and heavy minerals analyses. Statistical parameters such as Kurtosis, Mean, Sorting and Skewness were calculated from the grain sizes analysis result to construct histogram and Cumulative curves while the ternary diagram is drawn from the result of the heavy mineral analysis. Sedimentary petrography is the description of sedimentary rocks and sediments and has been applied only to laboratory study, which includes preparation of slides and viewing them under the
Akintola et al. 83
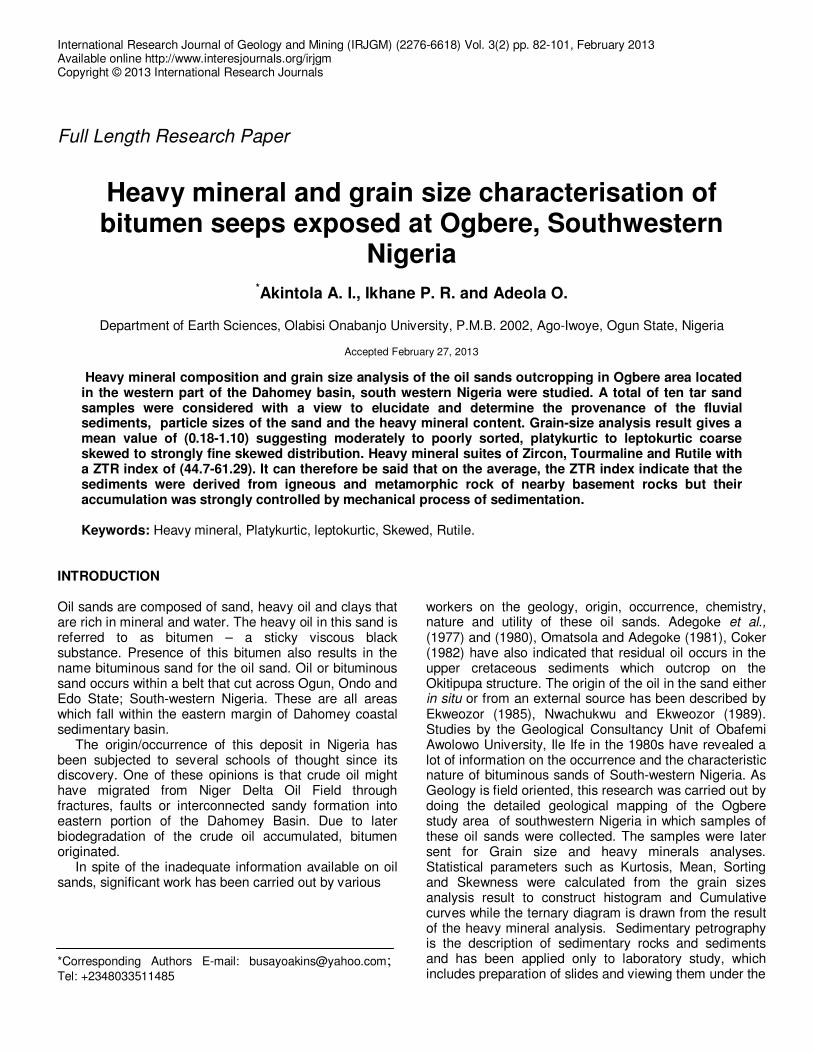
Figure 1. Location Map of the Ogbere Study Area showing Sampling Points
microscope. This research study is based on separation process, granulometric studies and heavy mineral studies of the sediments collected from the area in order to determine the provenance of the fluvial sediments and to classify the sediments based on their textural properties. Geomorphology and geology The study is located in Ogbere, Southwestern Nigeria. The study area lies within latitudes 6
0 39
1 N and 6
0 45
1 N
and longitudes 004° 101 E and 004°20
1 E of the
Greenwich meridian. (Figure 1) shows the location map with the sampling points. The area is easily assessable (Figure 1). The area is sparely populated except for Orisunmibare village which has larger population. The major occupation in the area is farming. The climatic condition of the area is tropical and is expressed as an alternation between wet and dry seasons. The two regimes of tropical climate show a fairly wide seasonal
and diurnal variation in temperature which ranges between 35
oC during dry season and 25
oC during wet
season. There are two peak of period of rainfall from June to July with a slight break in August referred to as “August break” (Onakomaya, 1992). These periods of wet and dry season have remarkable effects on the vegetation. The vegetation is characterized by trees and plant growth controlled by these systematic seasonal changes. Plants exhibit fresh looking green leaves during wet season with all types of plant showing luxurious growth and these disappear during dry season as many trees shed their leaves. The area have low to moderate relief and the drainage pattern is somewhat integrated having a network of streams that is sub-dendritic in nature the rivers in the area flow along the S-W direction. The draining pattern allows for easy setting of the bitumen seep and tar sands which are mostly found along the course of rivers.
The Dahomey basin is a marginal pull-apart basin initiated during the Early Cretaceous separation of South
84 Int. Res. J. Geo. Min.
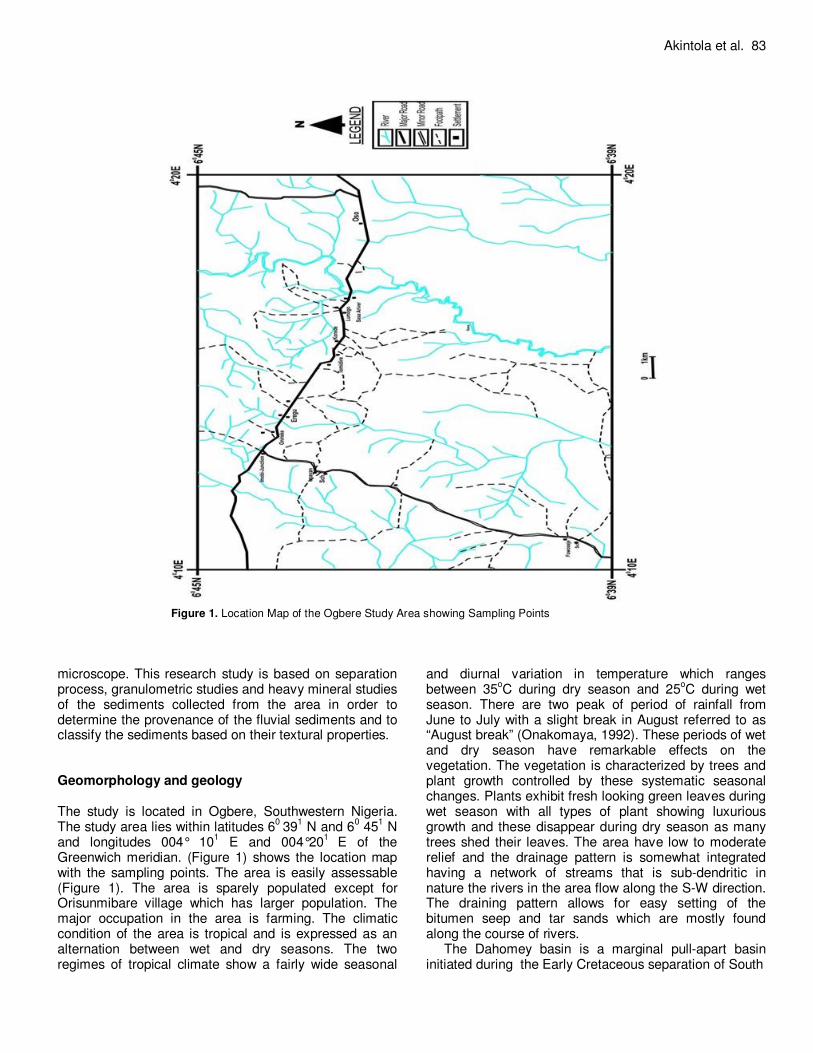
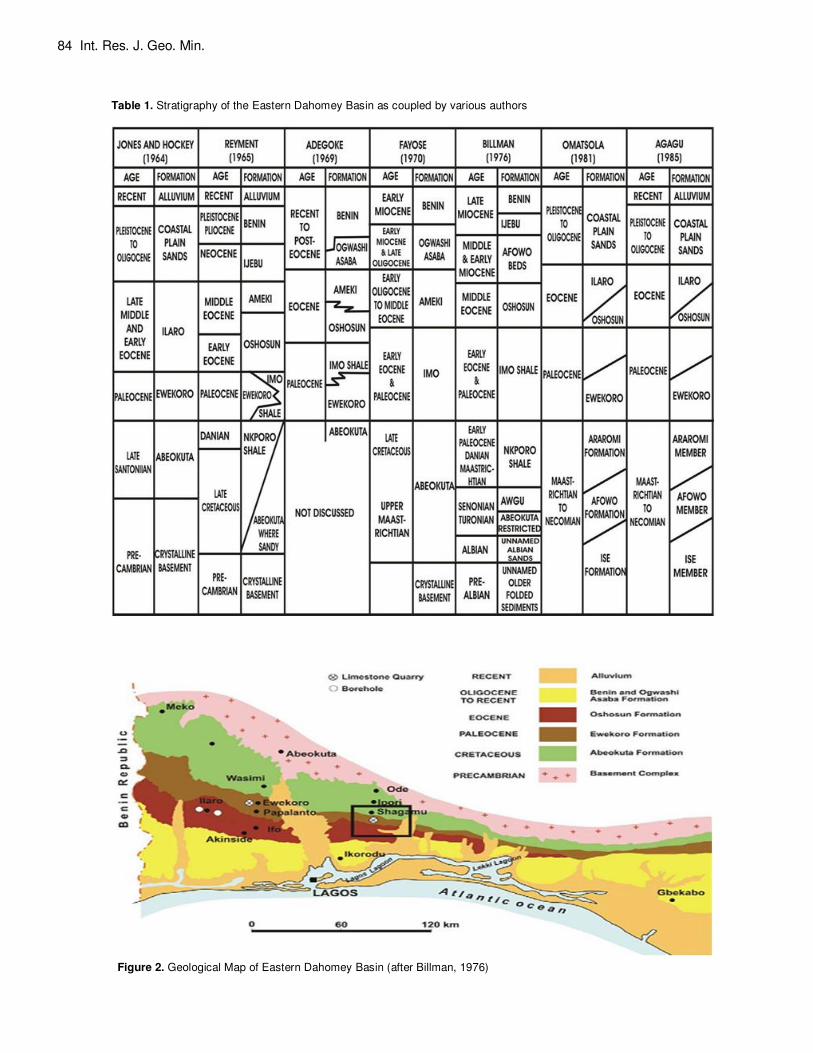
Table 1. Stratigraphy of the Eastern Dahomey Basin as coupled by various authors
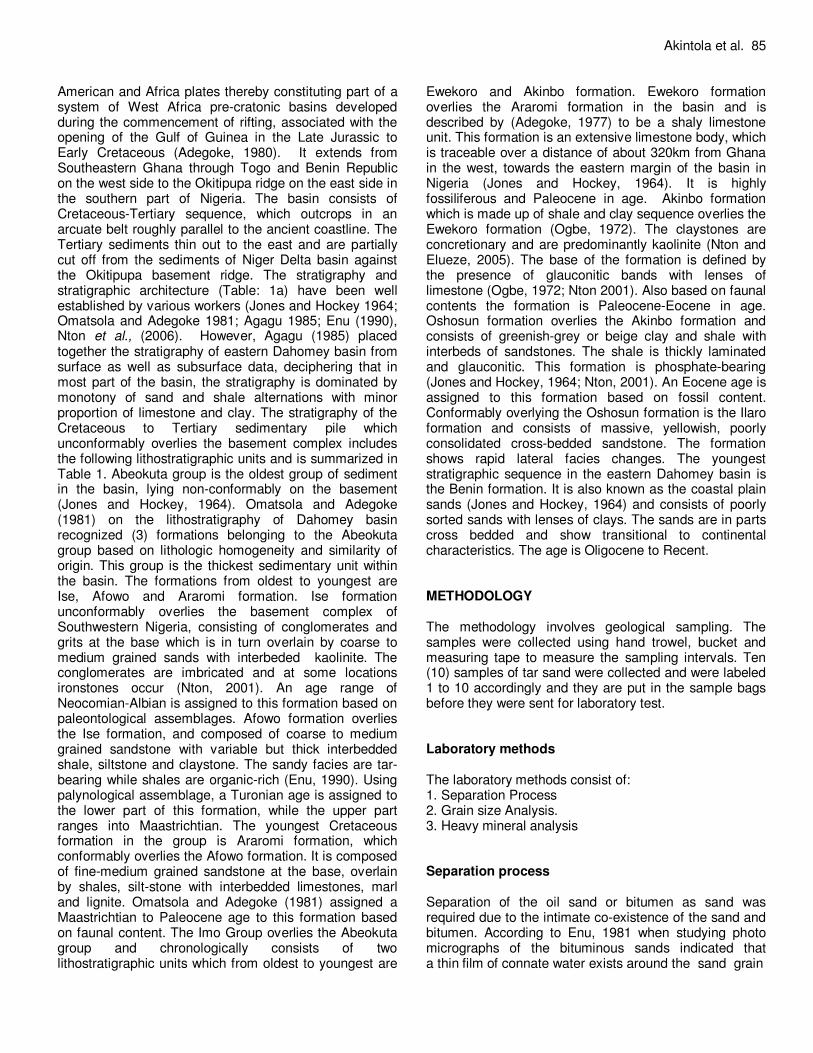
Akintola et al. 85 American and Africa plates thereby constituting part of a system of West Africa pre-cratonic basins developed during the commencement of rifting, associated with the opening of the Gulf of Guinea in the Late Jurassic to Early Cretaceous (Adegoke, 1980). It extends from Southeastern Ghana through Togo and Benin Republic on the west side to the Okitipupa ridge on the east side in the southern part of Nigeria. The basin consists of Cretaceous-Tertiary sequence, which outcrops in an arcuate belt roughly parallel to the ancient coastline. The Tertiary sediments thin out to the east and are partially cut off from the sediments of Niger Delta basin against the Okitipupa basement ridge. The stratigraphy and stratigraphic architecture (Table: 1a) have been well established by various workers (Jones and Hockey 1964; Omatsola and Adegoke 1981; Agagu 1985; Enu (1990), Nton et al., (2006). However, Agagu (1985) placed together the stratigraphy of eastern Dahomey basin from surface as well as subsurface data, deciphering that in most part of the basin, the stratigraphy is dominated by monotony of sand and shale alternations with minor proportion of limestone and clay. The stratigraphy of the Cretaceous to Tertiary sedimentary pile which unconformably overlies the basement complex includes the following lithostratigraphic units and is summarized in Table 1. Abeokuta group is the oldest group of sediment in the basin, lying non-conformably on the basement (Jones and Hockey, 1964). Omatsola and Adegoke (1981) on the lithostratigraphy of Dahomey basin recognized (3) formations belonging to the Abeokuta group based on lithologic homogeneity and similarity of origin. This group is the thickest sedimentary unit within the basin. The formations from oldest to youngest are Ise, Afowo and Araromi formation. Ise formation unconformably overlies the basement complex of Southwestern Nigeria, consisting of conglomerates and grits at the base which is in turn overlain by coarse to medium grained sands with interbeded kaolinite. The conglomerates are imbricated and at some locations ironstones occur (Nton, 2001). An age range of Neocomian-Albian is assigned to this formation based on paleontological assemblages. Afowo formation overlies the Ise formation, and composed of coarse to medium grained sandstone with variable but thick interbedded shale, siltstone and claystone. The sandy facies are tar-bearing while shales are organic-rich (Enu, 1990). Using palynological assemblage, a Turonian age is assigned to the lower part of this formation, while the upper part ranges into Maastrichtian. The youngest Cretaceous formation in the group is Araromi formation, which conformably overlies the Afowo formation. It is composed of fine-medium grained sandstone at the base, overlain by shales, silt-stone with interbedded limestones, marl and lignite. Omatsola and Adegoke (1981) assigned a Maastrichtian to Paleocene age to this formation based on faunal content. The Imo Group overlies the Abeokuta group and chronologically consists of two lithostratigraphic units which from oldest to youngest are
Ewekoro and Akinbo formation. Ewekoro formation overlies the Araromi formation in the basin and is described by (Adegoke, 1977) to be a shaly limestone unit. This formation is an extensive limestone body, which is traceable over a distance of about 320km from Ghana in the west, towards the eastern margin of the basin in Nigeria (Jones and Hockey, 1964). It is highly fossiliferous and Paleocene in age. Akinbo formation which is made up of shale and clay sequence overlies the Ewekoro formation (Ogbe, 1972). The claystones are concretionary and are predominantly kaolinite (Nton and Elueze, 2005). The base of the formation is defined by the presence of glauconitic bands with lenses of limestone (Ogbe, 1972; Nton 2001). Also based on faunal contents the formation is Paleocene-Eocene in age. Oshosun formation overlies the Akinbo formation and consists of greenish-grey or beige clay and shale with interbeds of sandstones. The shale is thickly laminated and glauconitic. This formation is phosphate-bearing (Jones and Hockey, 1964; Nton, 2001). An Eocene age is assigned to this formation based on fossil content. Conformably overlying the Oshosun formation is the Ilaro formation and consists of massive, yellowish, poorly consolidated cross-bedded sandstone. The formation shows rapid lateral facies changes. The youngest stratigraphic sequence in the eastern Dahomey basin is the Benin formation. It is also known as the coastal plain sands (Jones and Hockey, 1964) and consists of poorly sorted sands with lenses of clays. The sands are in parts cross bedded and show transitional to continental characteristics. The age is Oligocene to Recent. METHODOLOGY The methodology involves geological sampling. The samples were collected using hand trowel, bucket and measuring tape to measure the sampling intervals. Ten (10) samples of tar sand were collected and were labeled 1 to 10 accordingly and they are put in the sample bags before they were sent for laboratory test. Laboratory methods The laboratory methods consist of: 1. Separation Process 2. Grain size Analysis. 3. Heavy mineral analysis Separation process Separation of the oil sand or bitumen as sand was required due to the intimate co-existence of the sand and bitumen. According to Enu, 1981 when studying photo micrographs of the bituminous sands indicated that a thin film of connate water exists around the sand grain
86 Int. Res. J. Geo. Min.
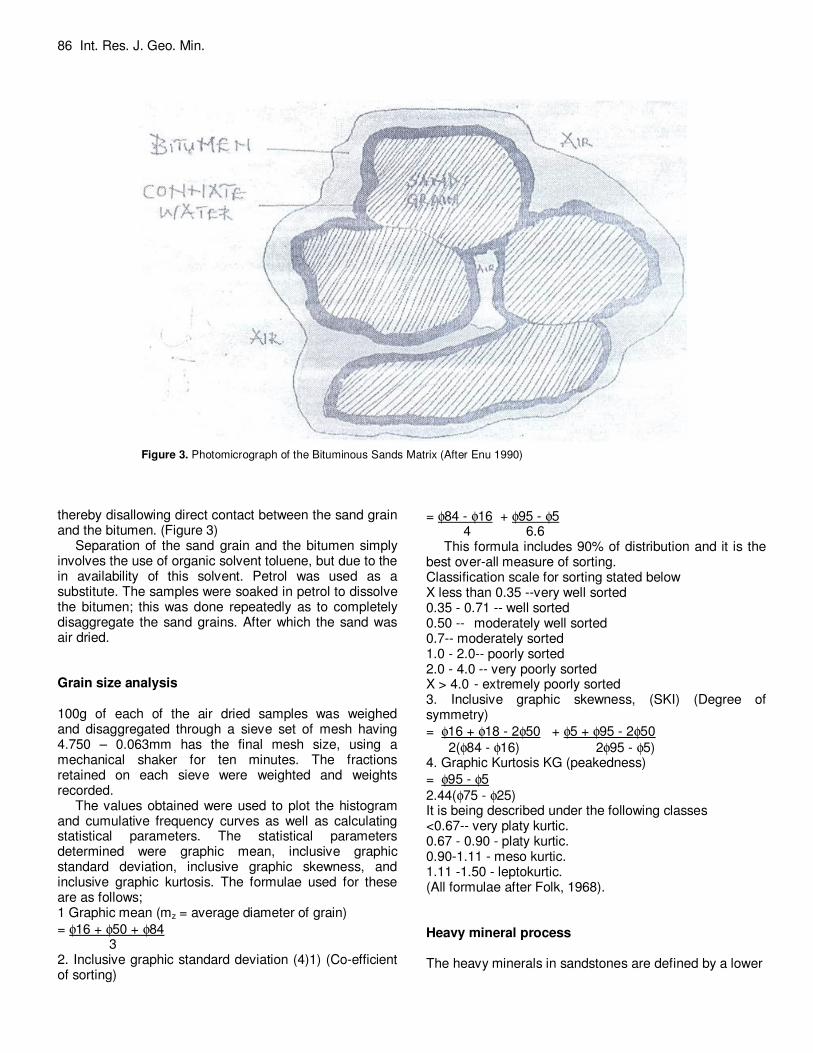
Figure 3. Photomicrograph of the Bituminous Sands Matrix (After Enu 1990)
thereby disallowing direct contact between the sand grain and the bitumen. (Figure 3)
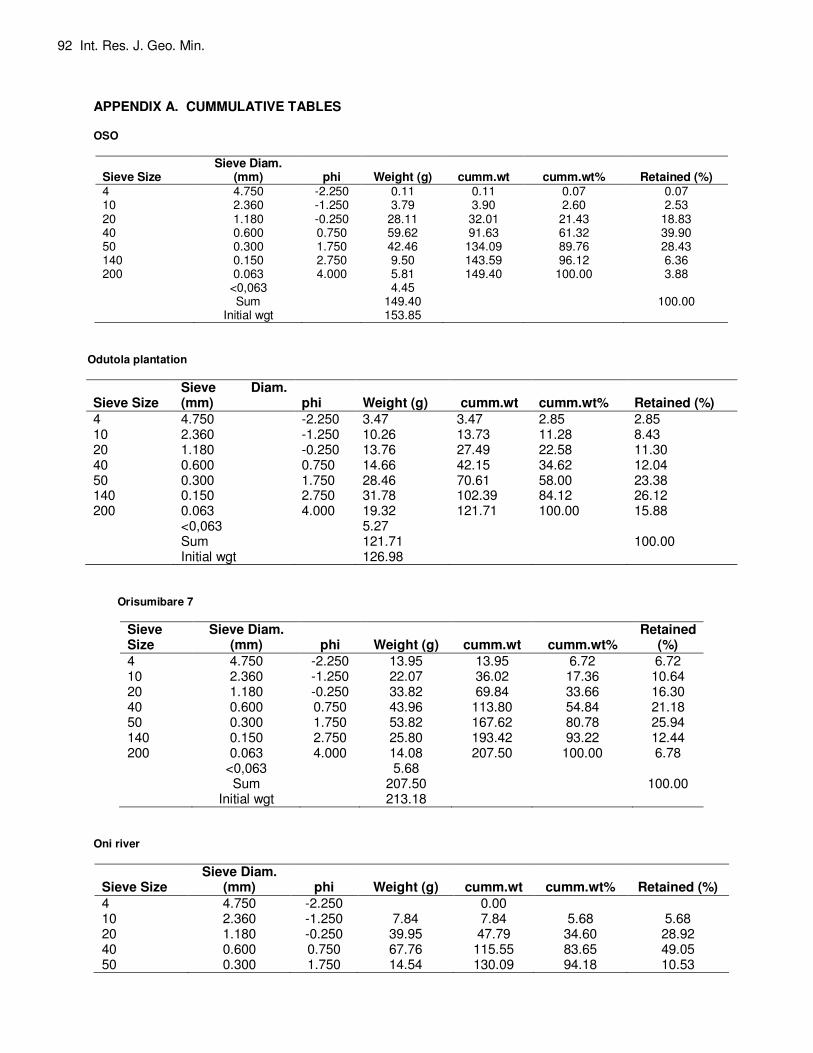
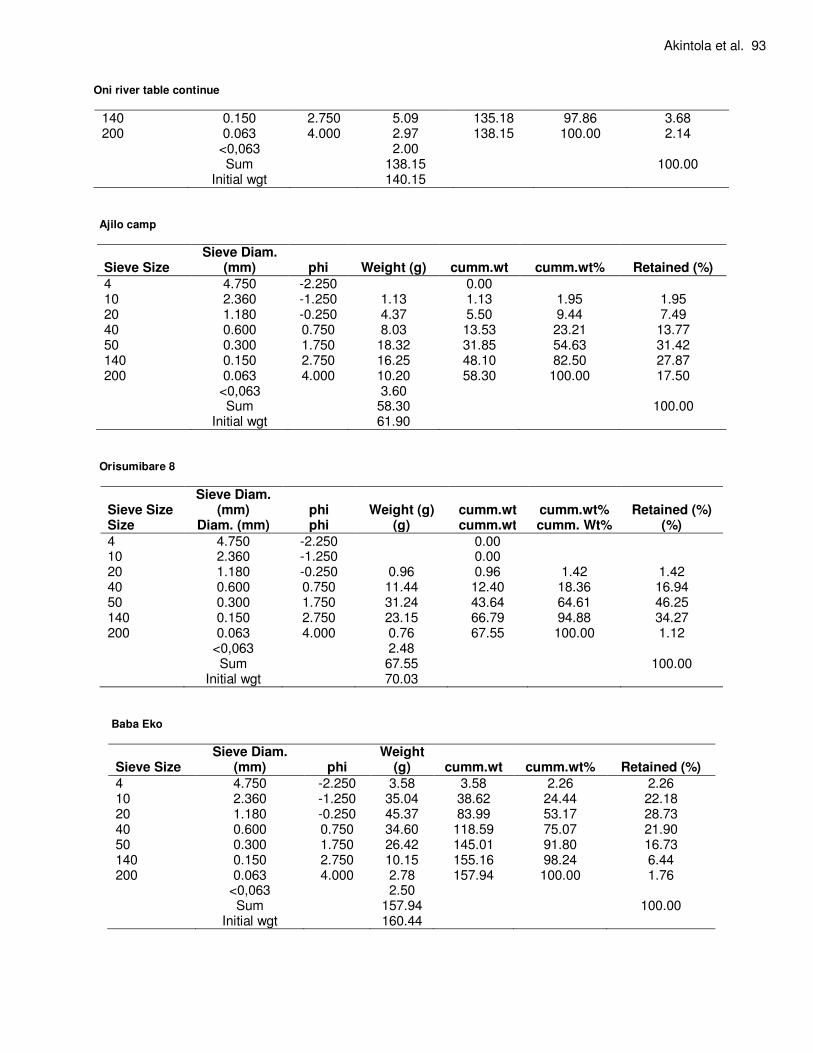
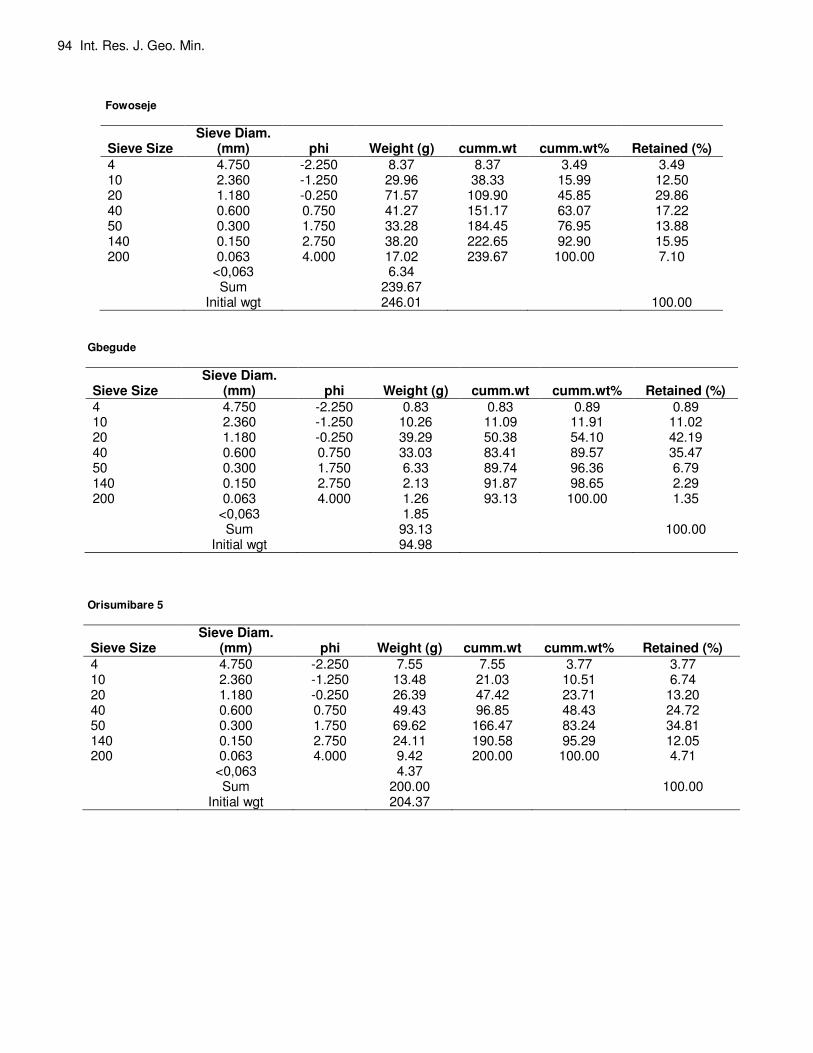
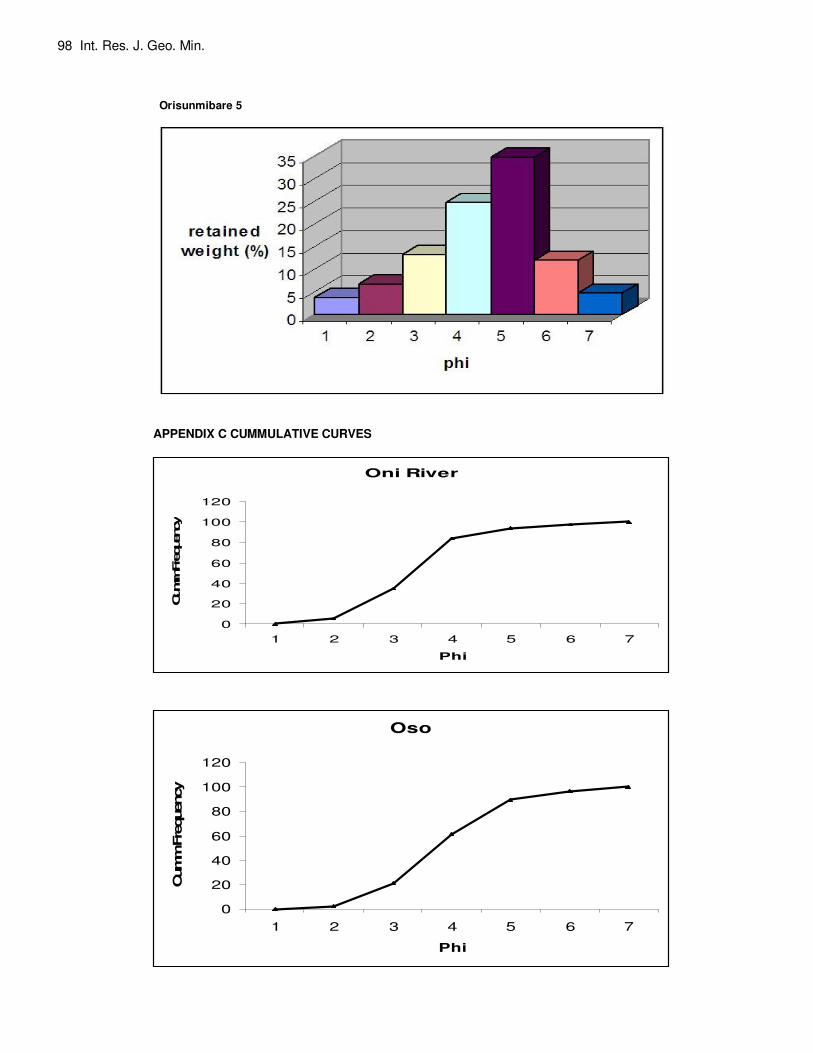
Separation of the sand grain and the bitumen simply involves the use of organic solvent toluene, but due to the in availability of this solvent. Petrol was used as a substitute. The samples were soaked in petrol to dissolve the bitumen; this was done repeatedly as to completely disaggregate the sand grains. After which the sand was air dried. Grain size analysis 100g of each of the air dried samples was weighed and disaggregated through a sieve set of mesh having 4.750 – 0.063mm has the final mesh size, using a mechanical shaker for ten minutes. The fractions retained on each sieve were weighted and weights recorded.
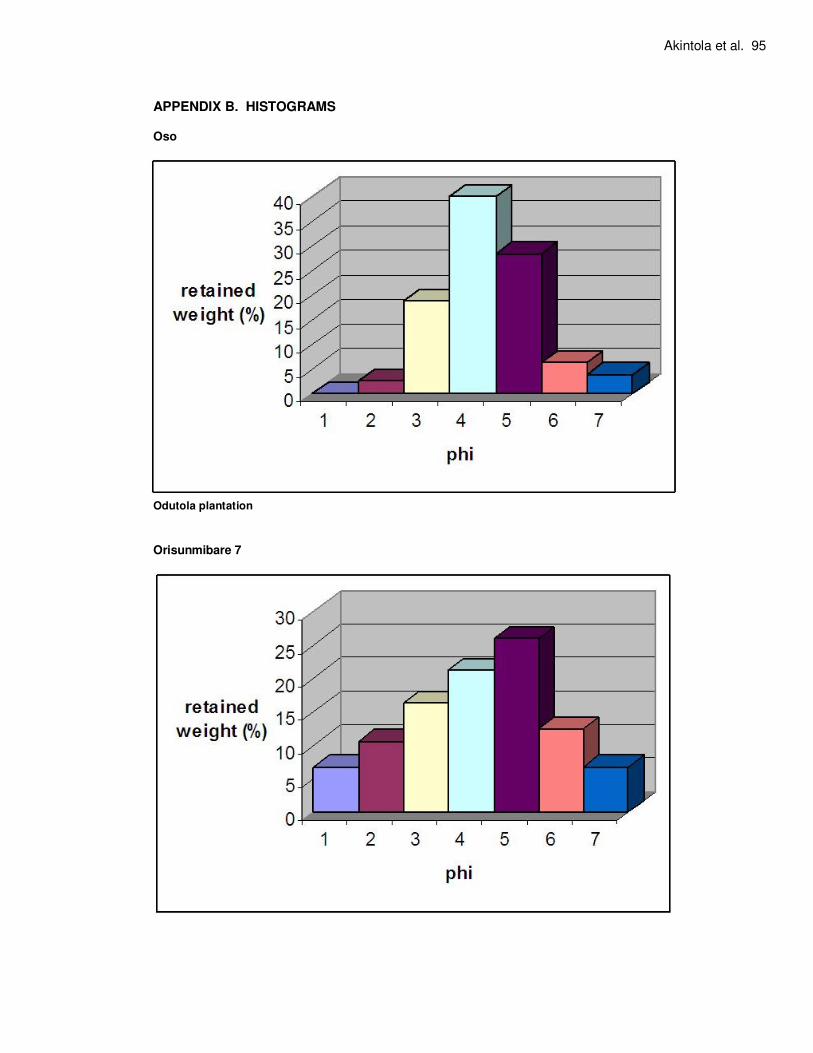
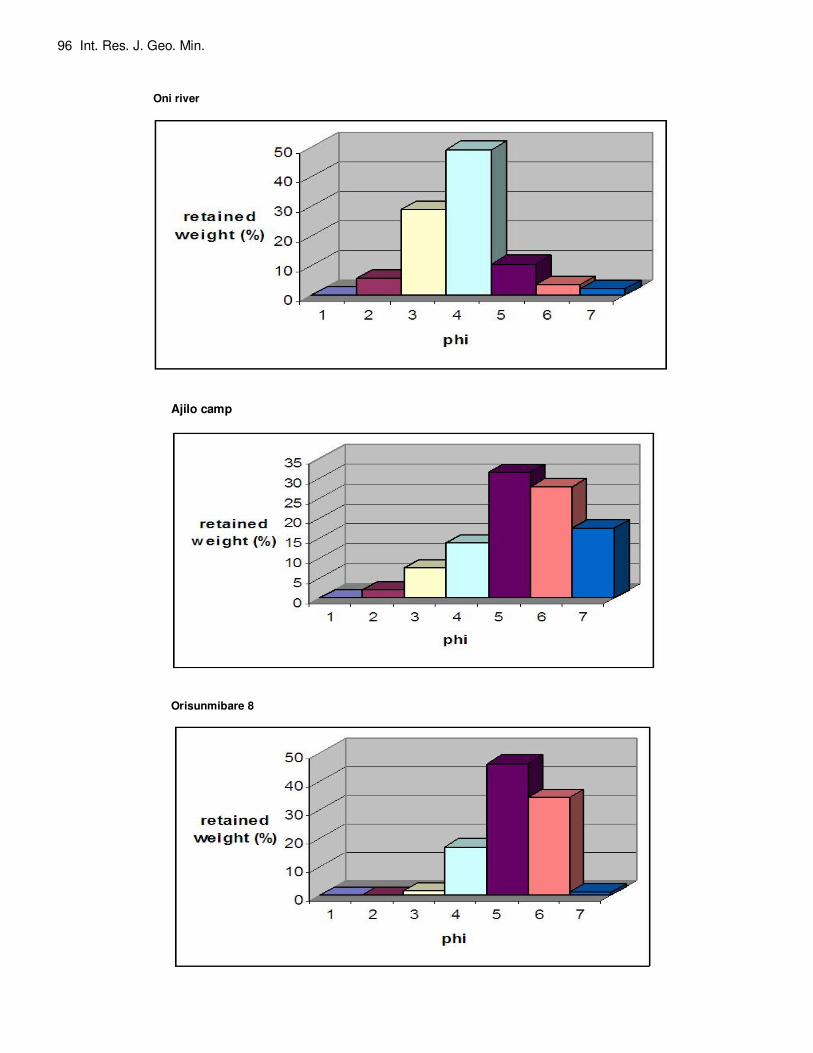
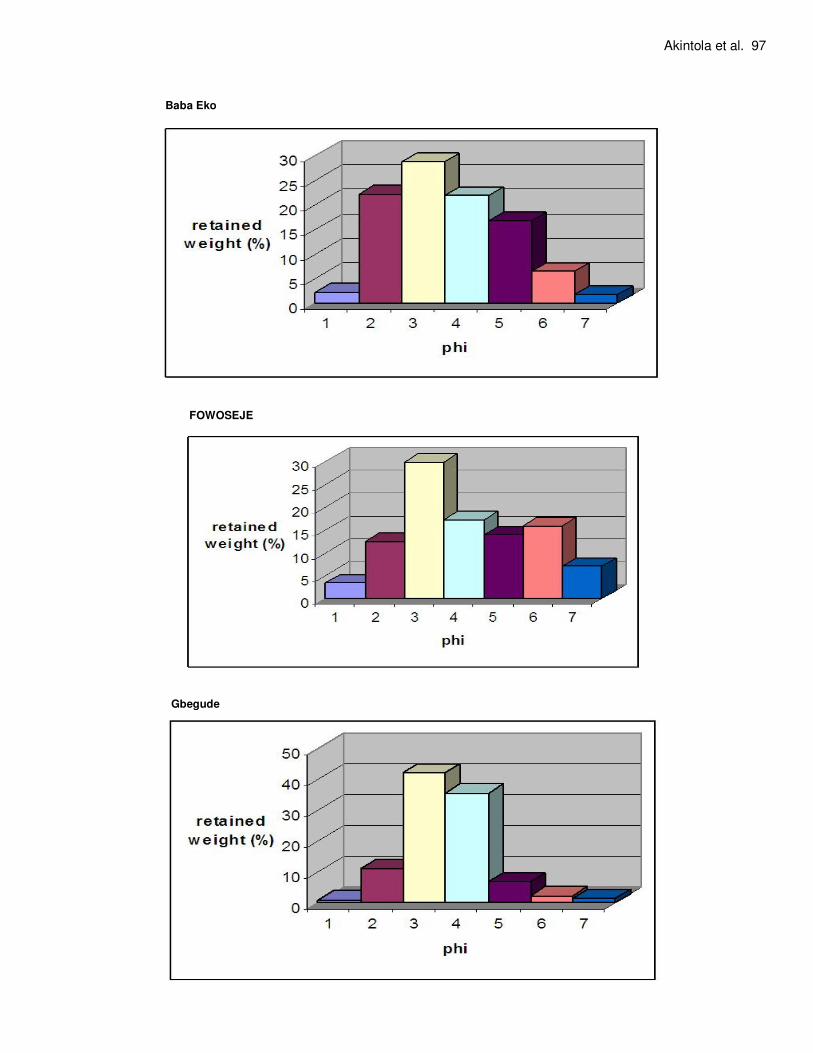
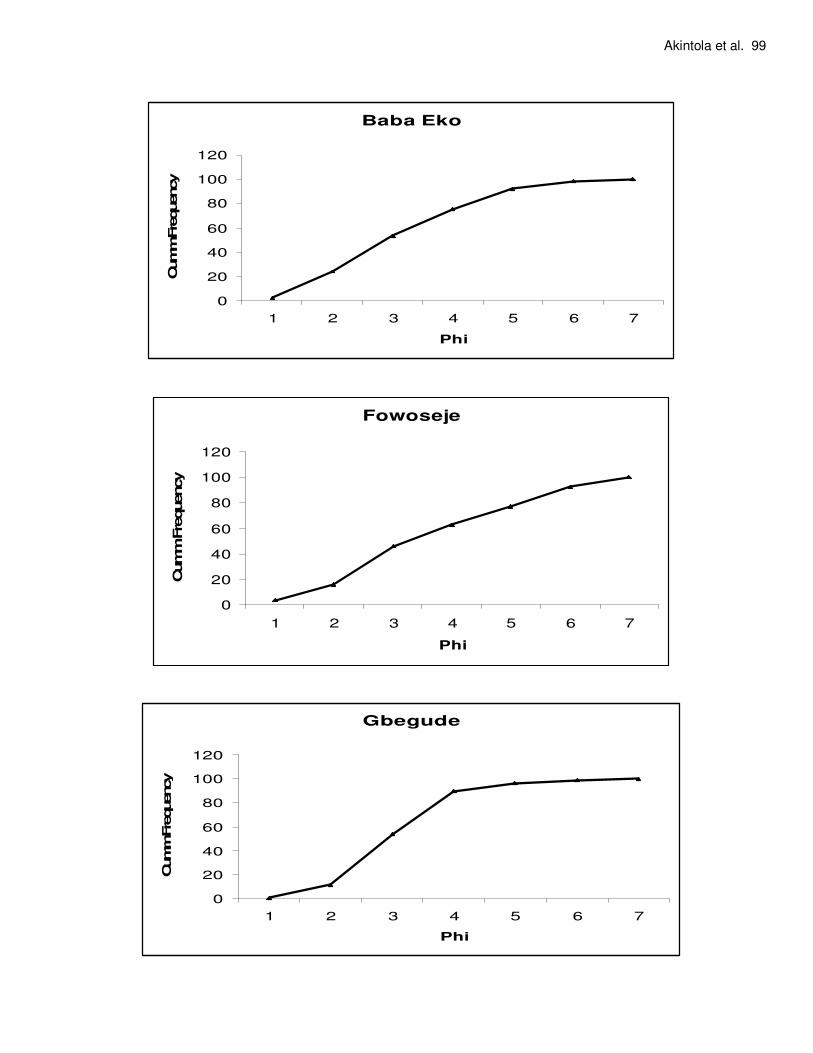
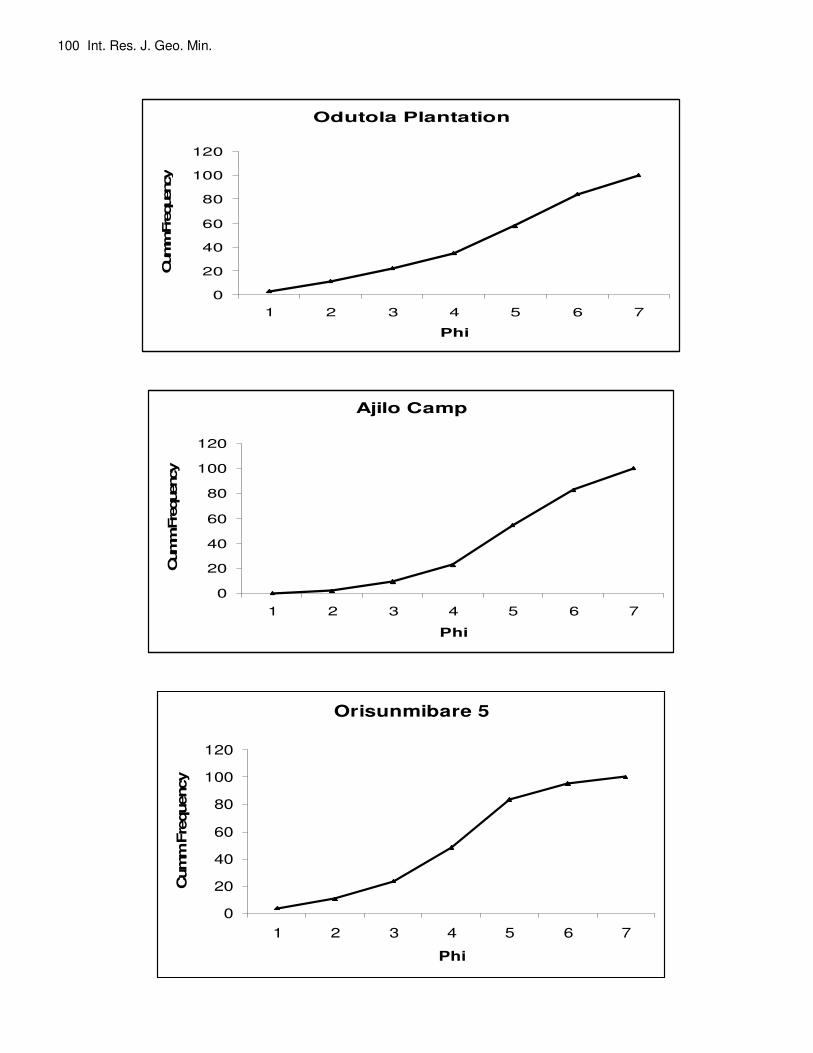
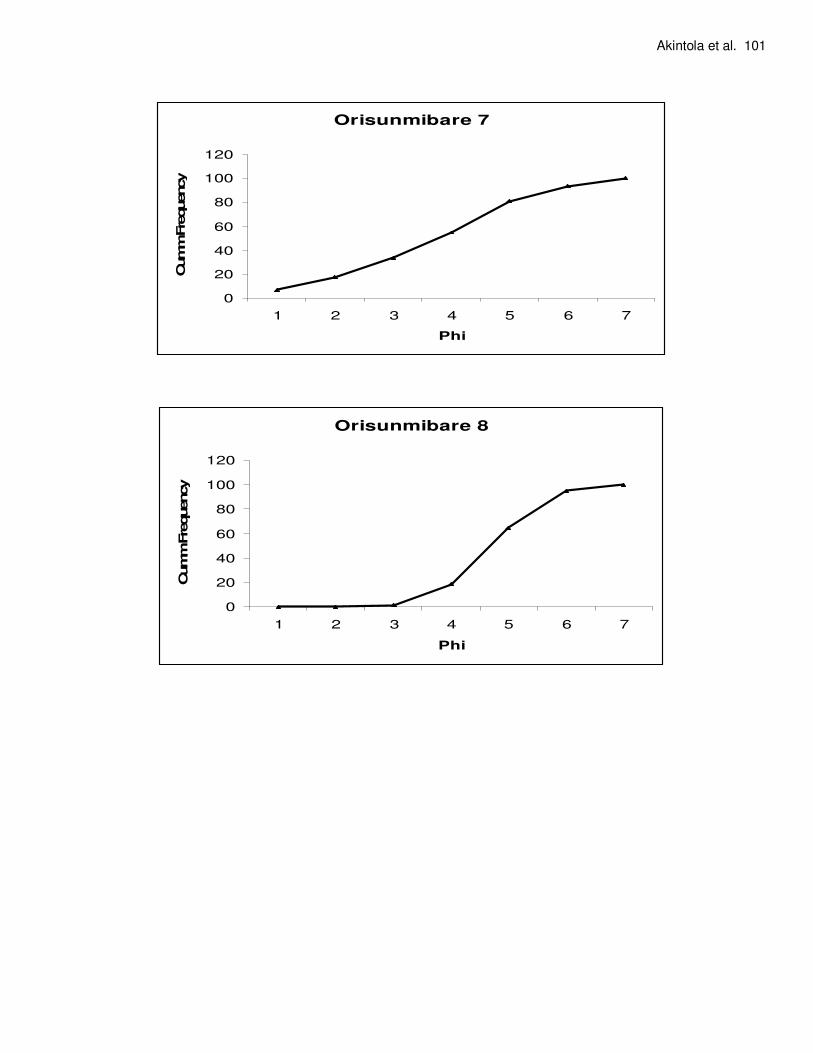
The values obtained were used to plot the histogram and cumulative frequency curves as well as calculating statistical parameters. The statistical parameters determined were graphic mean, inclusive graphic standard deviation, inclusive graphic skewness, and inclusive graphic kurtosis. The formulae used for these are as follows; 1 Graphic mean (mz = average diameter of grain)
= φ16 + φ50 + φ84 3 2. Inclusive graphic standard deviation (4)1) (Co-efficient of sorting)
= φ84 - φ16 + φ95 - φ5 4 6.6
This formula includes 90% of distribution and it is the best over-all measure of sorting. Classification scale for sorting stated below X less than 0.35 --very well sorted 0.35 - 0.71 -- well sorted 0.50 -- moderately well sorted 0.7-- moderately sorted 1.0 - 2.0-- poorly sorted 2.0 - 4.0 -- very poorly sorted X > 4.0 - extremely poorly sorted 3. Inclusive graphic skewness, (SKI) (Degree of symmetry)
2.44(φ75 - φ25) It is being described under the following classes <0.67-- very platy kurtic. 0.67 - 0.90 - platy kurtic. 0.90-1.11 - meso kurtic. 1.11 -1.50 - leptokurtic. (All formulae after Folk, 1968). Heavy mineral process The heavy minerals in sandstones are defined by a lower
Akintola et al. 87
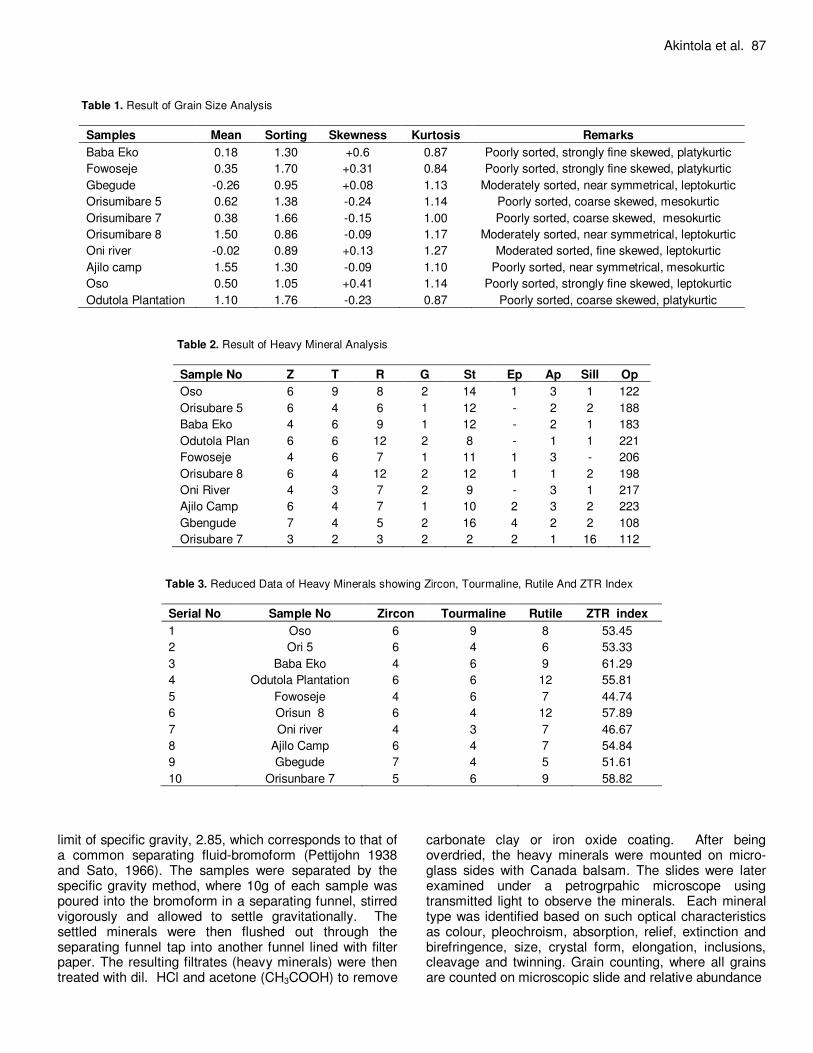
Table 1. Result of Grain Size Analysis
Samples Mean Sorting Skewness Kurtosis Remarks
Baba Eko 0.18 1.30 +0.6 0.87 Poorly sorted, strongly fine skewed, platykurtic
Table 3. Reduced Data of Heavy Minerals showing Zircon, Tourmaline, Rutile And ZTR Index
Serial No Sample No Zircon Tourmaline Rutile ZTR index
1 Oso 6 9 8 53.45
2 Ori 5 6 4 6 53.33
3 Baba Eko 4 6 9 61.29
4 Odutola Plantation 6 6 12 55.81
5 Fowoseje 4 6 7 44.74
6 Orisun 8 6 4 12 57.89
7 Oni river 4 3 7 46.67
8 Ajilo Camp 6 4 7 54.84
9 Gbegude 7 4 5 51.61
10 Orisunbare 7 5 6 9 58.82
limit of specific gravity, 2.85, which corresponds to that of a common separating fluid-bromoform (Pettijohn 1938 and Sato, 1966). The samples were separated by the specific gravity method, where 10g of each sample was poured into the bromoform in a separating funnel, stirred vigorously and allowed to settle gravitationally. The settled minerals were then flushed out through the separating funnel tap into another funnel lined with filter paper. The resulting filtrates (heavy minerals) were then treated with dil. HCl and acetone (CH3COOH) to remove
carbonate clay or iron oxide coating. After being overdried, the heavy minerals were mounted on micro-glass sides with Canada balsam. The slides were later examined under a petrogrpahic microscope using transmitted light to observe the minerals. Each mineral type was identified based on such optical characteristics as colour, pleochroism, absorption, relief, extinction and birefringence, size, crystal form, elongation, inclusions, cleavage and twinning. Grain counting, where all grains are counted on microscopic slide and relative abundance
88 Int. Res. J. Geo. Min.
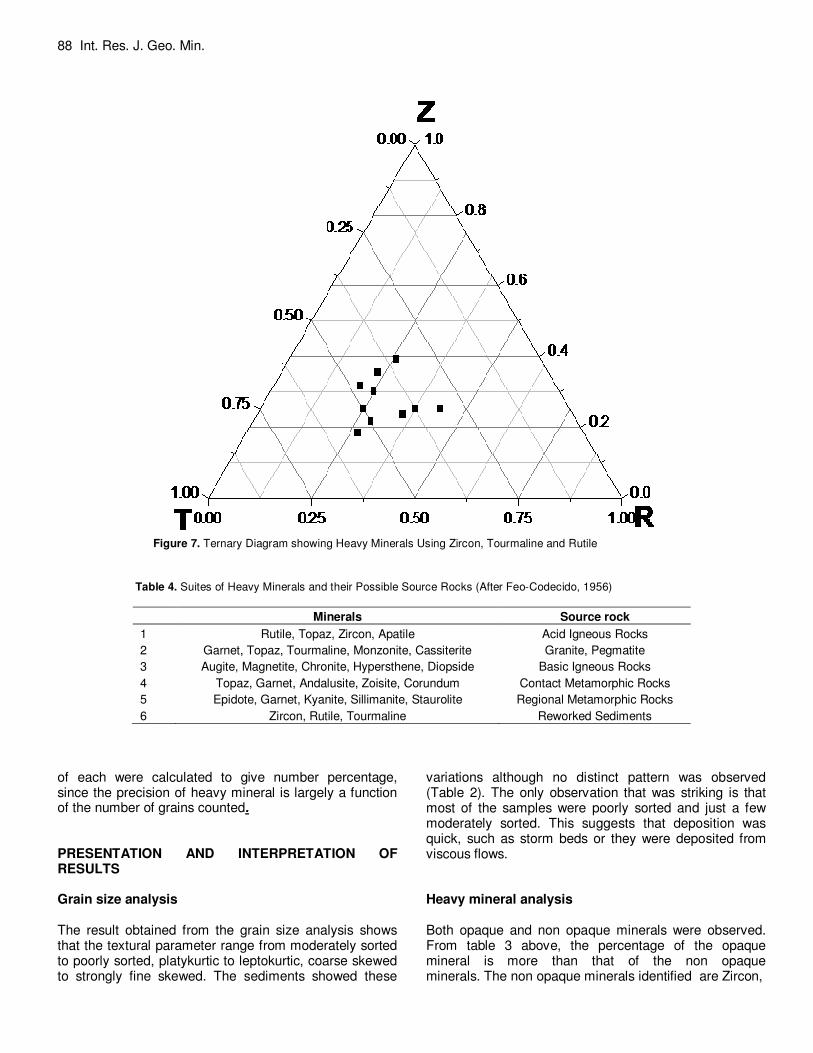
Figure 7. Ternary Diagram showing Heavy Minerals Using Zircon, Tourmaline and Rutile
Table 4. Suites of Heavy Minerals and their Possible Source Rocks (After Feo-Codecido, 1956)
of each were calculated to give number percentage, since the precision of heavy mineral is largely a function of the number of grains counted. PRESENTATION AND INTERPRETATION OF RESULTS Grain size analysis The result obtained from the grain size analysis shows that the textural parameter range from moderately sorted to poorly sorted, platykurtic to leptokurtic, coarse skewed to strongly fine skewed. The sediments showed these
variations although no distinct pattern was observed (Table 2). The only observation that was striking is that most of the samples were poorly sorted and just a few moderately sorted. This suggests that deposition was quick, such as storm beds or they were deposited from viscous flows. Heavy mineral analysis Both opaque and non opaque minerals were observed. From table 3 above, the percentage of the opaque mineral is more than that of the non opaque minerals. The non opaque minerals identified are Zircon,
Akintola et al. 89
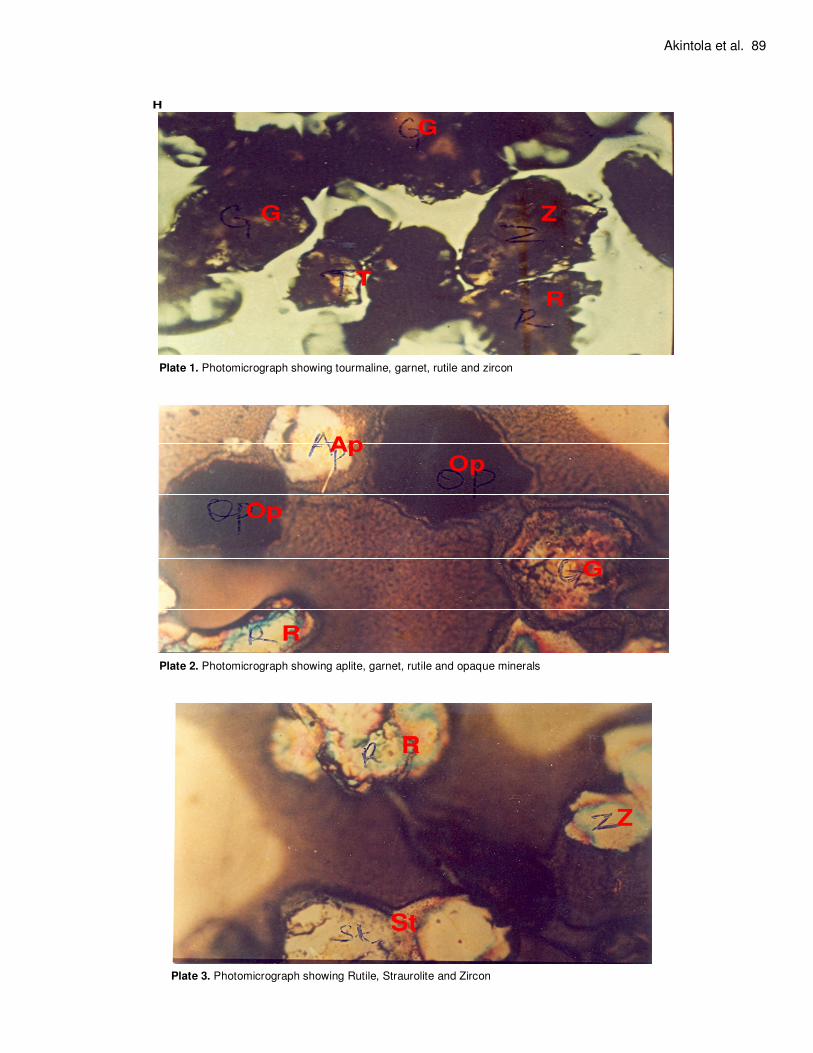
Plate 1. Photomicrograph showing tourmaline, garnet, rutile and zircon
Plate 2. Photomicrograph showing aplite, garnet, rutile and opaque minerals
Plate 3. Photomicrograph showing Rutile, Straurolite and Zircon
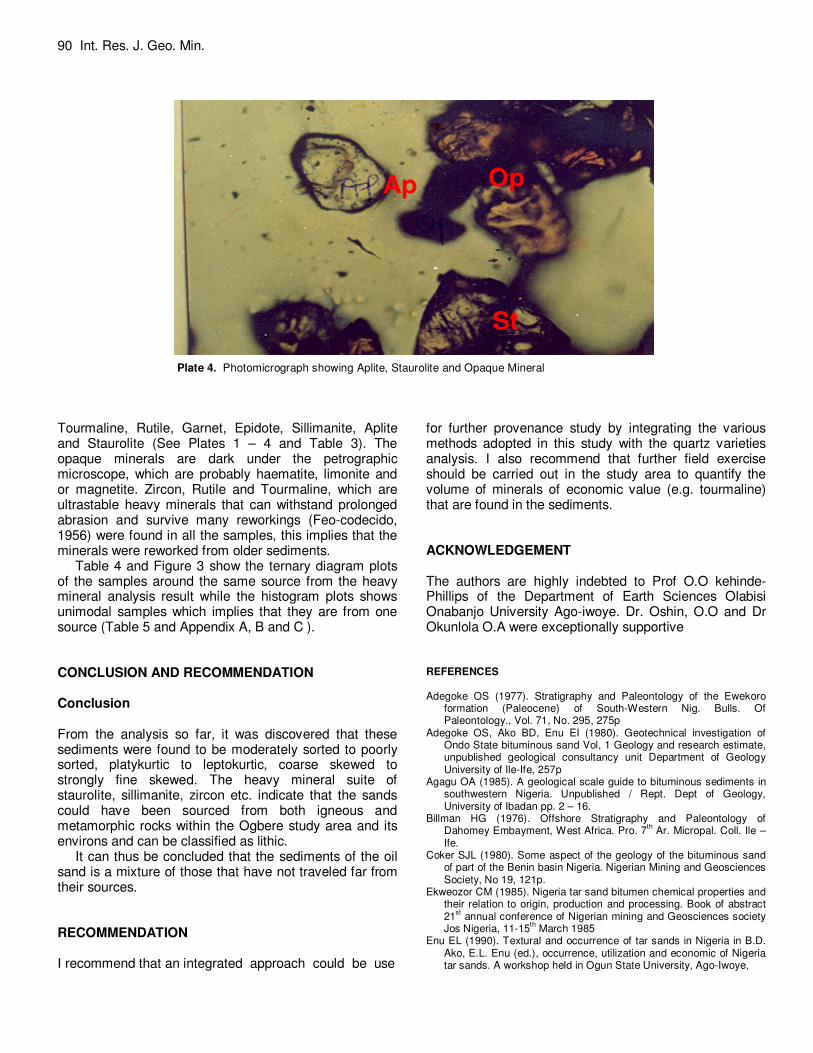
Plate 4. Photomicrograph showing Aplite, Staurolite and Opaque Mineral
Tourmaline, Rutile, Garnet, Epidote, Sillimanite, Aplite and Staurolite (See Plates 1 – 4 and Table 3). The opaque minerals are dark under the petrographic microscope, which are probably haematite, limonite and or magnetite. Zircon, Rutile and Tourmaline, which are ultrastable heavy minerals that can withstand prolonged abrasion and survive many reworkings (Feo-codecido, 1956) were found in all the samples, this implies that the minerals were reworked from older sediments.
Table 4 and Figure 3 show the ternary diagram plots of the samples around the same source from the heavy mineral analysis result while the histogram plots shows unimodal samples which implies that they are from one source (Table 5 and Appendix A, B and C ). CONCLUSION AND RECOMMENDATION Conclusion From the analysis so far, it was discovered that these sediments were found to be moderately sorted to poorly sorted, platykurtic to leptokurtic, coarse skewed to strongly fine skewed. The heavy mineral suite of staurolite, sillimanite, zircon etc. indicate that the sands could have been sourced from both igneous and metamorphic rocks within the Ogbere study area and its environs and can be classified as lithic.
It can thus be concluded that the sediments of the oil sand is a mixture of those that have not traveled far from their sources. RECOMMENDATION I recommend that an integrated approach could be use
for further provenance study by integrating the various methods adopted in this study with the quartz varieties analysis. I also recommend that further field exercise should be carried out in the study area to quantify the volume of minerals of economic value (e.g. tourmaline) that are found in the sediments. ACKNOWLEDGEMENT The authors are highly indebted to Prof O.O kehinde- Phillips of the Department of Earth Sciences Olabisi Onabanjo University Ago-iwoye. Dr. Oshin, O.O and Dr Okunlola O.A were exceptionally supportive REFERENCES Adegoke OS (1977). Stratigraphy and Paleontology of the Ewekoro
formation (Paleocene) of South-Western Nig. Bulls. Of Paleontology., Vol. 71, No. 295, 275p
Adegoke OS, Ako BD, Enu EI (1980). Geotechnical investigation of Ondo State bituminous sand Vol, 1 Geology and research estimate, unpublished geological consultancy unit Department of Geology University of Ile-Ife, 257p
Agagu OA (1985). A geological scale guide to bituminous sediments in southwestern Nigeria. Unpublished / Rept. Dept of Geology, University of Ibadan pp. 2 – 16.
Billman HG (1976). Offshore Stratigraphy and Paleontology of Dahomey Embayment, West Africa. Pro. 7
th Ar. Micropal. Coll. Ile –
Ife. Coker SJL (1980). Some aspect of the geology of the bituminous sand
of part of the Benin basin Nigeria. Nigerian Mining and Geosciences Society, No 19, 121p.
Ekweozor CM (1985). Nigeria tar sand bitumen chemical properties and their relation to origin, production and processing. Book of abstract 21
st annual conference of Nigerian mining and Geosciences society
Jos Nigeria, 11-15th March 1985
Enu EL (1990). Textural and occurrence of tar sands in Nigeria in B.D. Ako, E.L. Enu (ed.), occurrence, utilization and economic of Nigeria tar sands. A workshop held in Ogun State University, Ago-Iwoye,
Ap
St
Op
Nigeria on 29 – 31
st May, 1990, Published by the Nigerian Mining and
Geosciences Society, Ibadan, Chapter, pp. 11-16. Feo-Codecido G (1956). Heavy Mineral Techniques and their
Classification to Venezuelan Stratigraphy. Bull. Am. Ass. Petrol Geol. 40, pp. 984 -1000.
Jones HA, Hockey RD (1964). The geology of part of south western Nigeria. Geological survey of Nigeria Bulletin 31, pp 1 – 101.
Nton ME (2001). Aspect of Rock Evaluation Studies of the Maastrichtian-Eocene Sediments. J.Min and Geol., Vol.13 (2) Pp 33-39.
Nton ME, Elueze AA (2005). Composition Characteristics and Industrial Assessment of Sedimentary Clay bodies inpart of Eastern Dahomey basin, Southwestern Nigeria. J. Min. and Geol. Vol.4 (12) Pp 175-184.
Nton ME, Ikhane PR, Tijani MN (2009). Aspect of Rock Eval. Maastrichtian-Eocene Sediments of Dahomey Basin, Southwestern Nigeria. European Journal of Scientific research.
Akintola et al. 91 Nwachukwu JI, Ekweozor CM (1989). The Origin of Tar Sands of
Southwestern Nigeria, NAPE Bull, Vol. 4 No. 2. pp. 82 – 94 Ogbe FGA (1972). Stratigraphy of Strata Exposed in the Ewekoro
Quarry, Southwestern Nigeria In: T.F.J Dessauvagie and Whiteman (Eds) African Geology, University Press, Nigeria, pp 305.
Omatsola ME, Adegoke OS (1981). Tectonic Evolution of Dahomey Basin (West Africa) and its Implication in the Opening of the North and South Atlantic Proc. 26
th Intern. Geol. Congr. pp. 268
Onakomaya SO, Oyesiku OO, Jegede J (1992). Ogun State in Map Res; Chanles Publication Ibadan. ISBN 9789782137364; 187p
Pettijohn FJ (1975). Sedimentary Rocks. Happer and Raco Publishers 3
rd Edition. P. 1 – 628.
Sato V (1966). Heavy Minerals in Sandstone Fields. Monthly Bulletin. No. 141. p. 34 – 35 (in Japanese).