22
US Army Corps of Engineers Hydrologic Engineering Center HEC-5Q: System Water Quality Modeling January 1986 Approved for Public Release. Distribution Unlimited. TP-111

US Army Corps of Engineers Hydrologic Engineering Center
HEC-5Q: System Water Quality Modeling January 1986 Approved for Public Release. Distribution Unlimited. TP-111

Standard Form 298 (Rev. 8/98) Prescribed by ANSI Std. Z39-18
REPORT DOCUMENTATION PAGE Form Approved OMB No. 0704-0188
The public reporting burden for this collection of information is estimated to average 1 hour per response, including the time for reviewing instructions, searching existing data sources, gathering and maintaining the data needed, and completing and reviewing the collection of information. Send comments regarding this burden estimate or any other aspect of this collection of information, including suggestions for reducing this burden, to the Department of Defense, Executive Services and Communications Directorate (0704-0188). Respondents should be aware that notwithstanding any other provision of law, no person shall be subject to any penalty for failing to comply with a collection of information if it does not display a currently valid OMB control number. PLEASE DO NOT RETURN YOUR FORM TO THE ABOVE ORGANIZATION. 1. REPORT DATE (DD-MM-YYYY) January 1986
2. REPORT TYPE Technical Paper
3. DATES COVERED (From - To)
5a. CONTRACT NUMBER
5b. GRANT NUMBER
4. TITLE AND SUBTITLE HEC-5Q: System Water Quality Modeling
5c. PROGRAM ELEMENT NUMBER
5d. PROJECT NUMBER 5e. TASK NUMBER
6. AUTHOR(S) R.G. Willey
5F. WORK UNIT NUMBER
7. PERFORMING ORGANIZATION NAME(S) AND ADDRESS(ES) US Army Corps of Engineers Institute for Water Resources Hydrologic Engineering Center (HEC) 609 Second Street Davis, CA 95616-4687
8. PERFORMING ORGANIZATION REPORT NUMBER TP-111
10. SPONSOR/ MONITOR'S ACRONYM(S) 9. SPONSORING/MONITORING AGENCY NAME(S) AND ADDRESS(ES) 11. SPONSOR/ MONITOR'S REPORT NUMBER(S)
12. DISTRIBUTION / AVAILABILITY STATEMENT Approved for public release; distribution is unlimited. 13. SUPPLEMENTARY NOTES Presented at the U.S. Army corps of Engineers 1986 Water Quality Seminar, New Orleans, Louisiana, February 1986. 14. ABSTRACT Several state-of-the-art models are available for analyzing water quality conditions in complex reservoir systems for a given set of operational conditions. Some of these models can even make operational decisions regarding proper gate regulations to obtain a desirable water quality condition at a dam site for a given set of flow conditions. HEC-5Q, Simulation of Flood control and Conservation Systems (Including Water Quality Analysis) computer model, has the unique capabilities to accept user-specified water quantity and quality needs system-wide and to decide how to regulate the network of reservoirs. The decision criteria are programmed to consider flood control, hydropower, instream flow (municipal, industrial, irrigation, water supply, fish habitat) and water quality requirements. The HEC-5Q program was first applied to the Sacramento River system in California and a report was published in July 1985. Two other applications are in progress, the Kanawha and Monongahela River systems, and are expected to be completed by September 1986. A brief description of the HEC-5Q concepts and these three applications are discussed. 15. SUBJECT TERMS reservoir system analysis, water quality, case study, stream system analysis, computer model
16. SECURITY CLASSIFICATION OF: 19a. NAME OF RESPONSIBLE PERSON a. REPORT U
b. ABSTRACT U
c. THIS PAGE U
17. LIMITATION OF ABSTRACT UU
18. NUMBER OF PAGES 22 19b. TELEPHONE NUMBER

HEC-5Q: System Water Quality Modeling
January 1986 US Army Corps of Engineers Institute for Water Resources Hydrologic Engineering Center 609 Second Street Davis, CA 95616 (530) 756-1104 (530) 756-8250 FAX www.hec.usace.army.mil TP-111

Papers in this series have resulted from technical activities of the Hydrologic Engineering Center. Versions of some of these have been published in technical journals or in conference proceedings. The purpose of this series is to make the information available for use in the Center's training program and for distribution with the Corps of Engineers. The findings in this report are not to be construed as an official Department of the Army position unless so designated by other authorized documents. The contents of this report are not to be used for advertising, publication, or promotional purposes. Citation of trade names does not constitute an official endorsement or approval of the use of such commercial products.
HEC-5Q: System Water Quality Modeling*
R. G. Willey 1
INTRODUCTION
Several state-of-the-art models [2,3,5 I are available for analyzing water quality conditions in complex reservoir systems for a given set of operational conditions. Some of these models can even make operational decisions regarding proper gate regulations to obtain a desirable water quality condition at a dam site for a given set of flow conditions.
HEC-5Q, Simulation of Flood Control and Conservation Systems (Including Water Quality Analysis) [4] computer model, has the unique capabilities to accept user-specified water quantity and quality needs system-wide and to decide how to regulate the network of reservoirs. The decision criteria are programmed to consider flood control, hydropower, instream flow (municipal, industrial, irrigation, water supply, fish habitat) and water quality requirements.
The HEC-5Q program was first applied to t.he Sacramento River system in Ca1iforni.a and a report, was published in July 1985 [81. Two other applications are in progress, the Kanawha and Monongahela River systems, and are expected to be completed by September 1986. A brief description of the HEC--5Q concepts and these three applications will be discussed below.
MATHEMATSCAL MODEL CONCEPTS
HEC-5Q has been developed specifically for evaluating the type of problem shown in Figure 1. The model is capable of evaluating a reservoir system of up to ten reservoirs and up to thirty control points. The model will define a best system operation for water quantity and quality; evaluating operati.ona1 concerns like flood control, hydropower, water supply, and irrigation diversions. Since the computer program users manual 141, and several technical papers [1,6,71 adequately document the details of the model concepts and the input description, only a brief overview is provided below.
* Presented at the U.S. Arrny Corps of Engineers 1986 Water Quality Seminar, New Orleans, Louisiana, February 1986.
Hydrau1i.c Engineer, U. S . Army Corps of Engineers, Hydrologic Engineering Center, 609 Second Street, Davis, CA 95616

F'ow Simulation Module
The flow simulation module was developed to assist in planning studies for evaluating proposed reservoirs in a system and to assist in sizing the flood control and conservation storage requirements for each project recommended for the system, The program can be used to show the effects of existing and/or proposed reservoirs on flows and damages in a complex reservoir system. The program can also be used in selecting the proper reservoir releases throughout the system to minimize flooding as much as possible whi. le maintaining a balance of flood control storage ("balanced pool") among the reservoirs.
Water Quality Simulation Module,
The water quality simulation module is capable of analyzing water temperature and up to three conservative and three non-. conservative constituents. If at least one of the nonconservative constituents is an oxygen demanding parameter, dissolved oxygen can also be analyzed.
F igure I
TYPICAL RESERVOIR SYSTEM SCHEMATIC
The water quality simulation module accepts system flows generated by the flow simulation module and computes the distribution of all the water quality constituents in up to ten reservoirs and their associated downstream reaches. The ten reservoirs may be in any configuration.
Gate openings in reservoir multilevel withdrawal structures are selected to meet user.-specified water quality objectives at downstream control points. If the objectives cannot be satisfied with the previously computed "balanced pool" flows, the model will compute a modified flow distribution necessary to better satisfy all downstream objectives. With these capabilities, the planner may evaluate the effects on water quality of proposed reservoir-stream system modifications and determine how a reservoir intake structure should be operated to achieve desired water quality objectives within the system.

SACRAMENTO RIVER SYSTEM APPLICATION
The Sacramento Valley reservoir system consi.sts of four major reservoirs as shown in Figure 2. Shasta and Keswick Reservoirs are located on the Sacramento River in northern California about 240 miles north of Sacramento. Below Shasta and above Keswick, inter-basin water transfers enter the Sacramento River through Spring Creek. Along the Sacramento River, Cow Creek and Cottonwood Creek are major inflowing tributaries and the Anderson-Cottonwood (ACID), Tehama-Colusa (TC), Corning (C) and Glenn-Colusa (GCID) Irrigation District Canals are major irrigation diversions.
Oroville Reservoir is located on the Feather River in the Sierra foothills about 100 miles north of Sacramento. Major tributaries entering the Feather River include the Yuba and Bear Rivers. Major diversions are located immediately below Oroville Dam from the Thermalito Afterbay. The Feather River flows into the Sacramento River near Verona.
'THERMAL IT0 f- AFTERBAY
BEND BRIDGE
-..-.----- --...------
Figure 2 SACRAMENTO VALLEY RESERVOiR SYSTEM SCHEMATIC

Folsom Reservoir is located on the American River in the Sierra foothills about 30 miles east of Sacramento. The American River below Fol.som Reservoir is leveed with no major tributaries entering before its confluence with the Sacramento River at Sacramento.
The Sacramento River continues t.o flow south towards the San Francisco Bay. This study's lower boundary is located near Hood about 20 miles south of Sacramento.
The application of the HEC-5Q model to the Sacramento Valley reservoir system, includes data assembly, model execution and interpretation of results as described below and elsewhere in more detail C81.
Data Assembly
The HEC-5Q model data requirements are similar to those of most comprehensive water quality models. The data to be assembled are categorized into three types: time independent, required time dependent and optional time dependent.
The time independent data include: physical description of the reservoir (i . e . , elevation, vol.ume, surf ace area, discharge capacity, and verti.ca1 reservoir segmentation), physical description of the rive e . , cross sections, channel discharge capacity, and river reach segmentation), control point desired and required flows, model coefficients e . , flow routing; reservoir diffusion; physical, chemical and biological reaction rates) and initial conditions for the start of the si.mulation. The required time dependent data include: evaporation, meteorology, diversions, inflow quantity and quality for all reservoir and river tributaries, discharge quantity from reservoirs (only required to reproduce historical operation), and control point target flow and water quality conditions. The optional time dependent data include: reservoir storages; river flows at other than control points; and reservoir and river water quality profiles. These data are used as checks on the model output in contrast to the previously mentioned data which are required to make the model work.
Sources for the data categorized above are numerous. In general, they include all water,-related agencies at the federal, state, local and private levels. Meteorological data are readily available from the U.S. Weather Service, local airports and universities. The primary data source is the NOAA's National Weather Service (EJWS) office in Asheville, North Caroli.na.
Tributary inflows, diversions and reserv0i.r discharges may be readily available from WATSTORE and STORET data systems. WATSTORE is managed by the USGS and contains streamflow data. STORET is managed by the EPA and contains water quality data. These computer data systems can often provide the necessary tributary inflow quantity and quality dat.a.

Model Execution,
The model simulation for the Sacramento Val.1.e~ system used temperature, specific conductance (sometimes called electrical cond~ct~vity), alkalinity, carbonaceous biochemical oxygen demand (BOD), ammonia (Mi3) and dissolved oxygen (DO). These specific parameters were chosen based on the availability of at least limited data.
The model can be used for existing and/or proposed reservoirs. If an existing condition is being simulated, usually the objective is to reproduce hi.storica1 events through model calibration. Selection of the calibration option can significantly decrease computer time by not using the time-consuming linear and non-linear programming algorithms in the model.
Once the model has been calibrated, the objective may be to modify an existing reservoir operation pattern or to evaluate the impact of proposed new reservoirs or channel modifications. This analysis requires the use of the linear and non-linear programming algorithms. These algorithms compute the water quality targets at the dam which will best meet all the user-specified downstream targets and decide on the best gate operations to meet these computed targets.
The simulation mode discussed above can be used either to evaluate the best water quality that can be provided throughout the system for given reservoir discharges (obtained either external to the simulation or determined by the HEC-5 flow simulation module) or to evaluate the best water quality operation without prespecified discharge quantities. The former operation is referred to as a balanced pool operation and the latter as a flow augmentation operation.
When using the balanced pool operati.on, the HEC-5Q program simply evaluates the best vertical level for withdrawal (assuming multiple level intakes are available) at each reservoir to meet all downstream water quality targets for the given reservoir discharge determined by the flow simul,ation module.
The flow augmentation operation allows the model to relax the balanced pool concept and to decide how much flow should come from which reservoir and at which vertical level in order to meet downstream water quality targets. Sometimes downstream water quality improvements require significantly increased discharge rates to obtain only small improvements in water quality. This flow augmentation operation is the most time consuming mode of execution.
For the Sacramento River application, the input data set was executed using the calibration option. Application of this option allows the user to define t.he exact level, of the intake structure operated. This is the normal method of model application when calibrating the model to observed historical data.
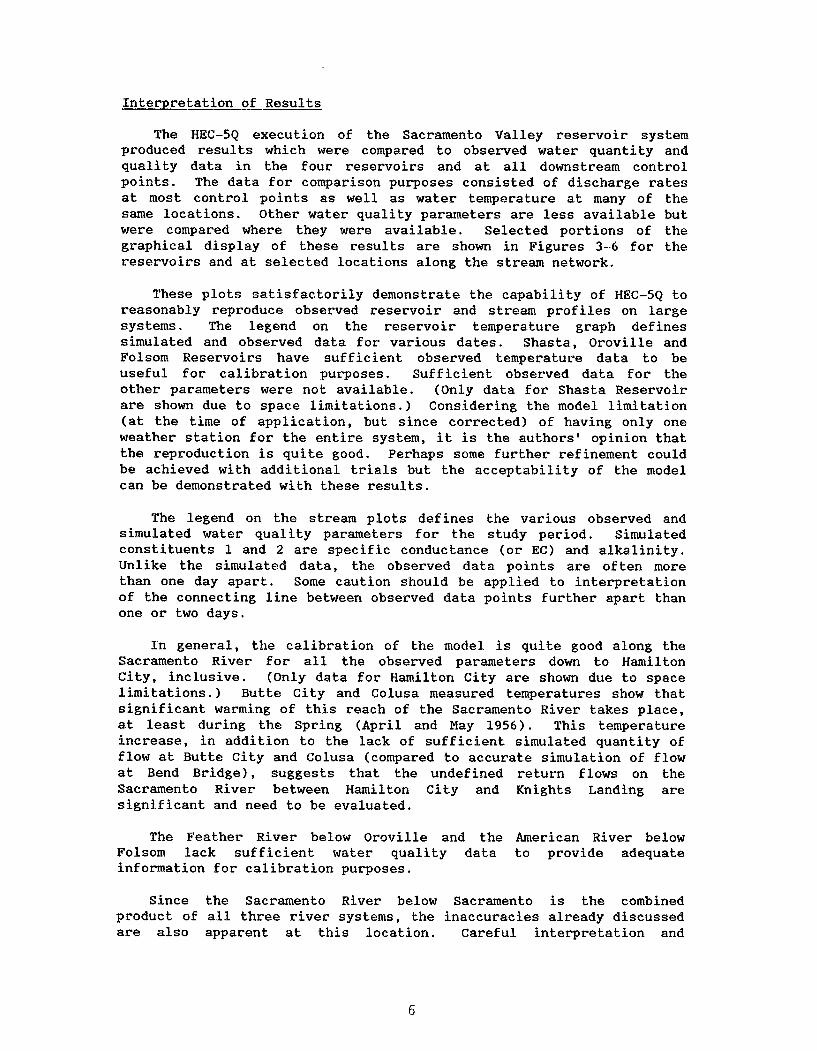
Interpretation of Results
The HEC-5Q execution of the Sacramento Valley reservoir system produced results which were compared to observed water quantity and quality data in the four reservoirs and at all downstream control points. The data for comparison purposes consisted of discharge rates at most control points as well as water temperature at many of the same locations. Other water quality parameters are less available but were compared where they were available. Selected portions of the graphical display of these results are shown in Figures 3-6 for the reservoirs and at selected locations along the stream network.
These plots satisfactorily demonstrate the capability of HEC-5Q to reasonably reproduce observed reservoir and stream profiles on large systems. The legend on the reservoir temperature graph defines simulated and observed data for various dates. Shasta, Oroville and Folsom Reservoirs have sufficient observed temperature data to be useful. for calibration purposes. Sufficient observed data for the other parameters were not available. (Only data for Shasta Reservoir are shown due to space limitations.) Considering the model limitation (at the time of application, but since corrected) of having only one weather station for the entire system, it is the authors' opinion that the reproduction is quite good. Perhaps some further refinement could be achieved with additional trials but the acceptability of the model can be demonstrated with these resu1.t~.
The legend on the stream plots defines the various observed and simulated water quality parameters for t.he study period. Simulated constituents 1 and 2 are specific conductance (or EC) and alkalinity. Unlike the simulated data, the observed dat.a points are often more than one day apart. Some caution should be applied to interpretation of the connecting line between observed data points further apart than one or two days.
In general, the calibration of the model is quite good along the Sacramento River for all the observed parameters down to Hamilton City, inclusive. (Only data for Hamilton City are shown due to space limitations.) Butte City and Colusa measured temperatures show that significant warmi,ng of this reach of the Sacramento River takes place, at least during the Spring (April and May 1956). This temperature increase, in addition to the lack of sufficient simulated quantity of flow at Butte City and Colusa (compared to accurate simulation of flow at Bend Bridge), suggests that the undefined return flows on the Sacramento River between Hamilton City and Knights Landing are significant and need to be evaluated.
The Feather River below Oroville and the American River below Folsom lack sufficient water quality data to provide adequate information for calibration purposes.
Since the Sacramento River below Sacramento is the combined product of all three river systems, the inaccuracies already discussed are also apparent at this location. Careful interpretation and

- ---- - --.---, - -- - - SiiASTA 26 JUL 79 * S l M TEMP 1
,.. ..* .... . ... 0 . . SHASTA 2 5 A U G 79 + S IM TEMP
- -,.-..- SHASTA 2 5 SEP 7 9 + Sl iP TEMP
(3---- -- -0 SHASTA 26 1UL. 79 05s TEMP
3 S tiASTA 25 A!JG 79 i 0 6 s TEMP
&-------A SHASTA 2 5 SEP 79 ~ O B S T E M P
0 5 0 100 1 5 0 2 0 0 2 5 0 3 0 0 350 400
[ IEPT H IN F E E T
Figure 3
SHASTA RESERVOIR TEMPERATURE PROFILES
-,-.--
S l M t T E M P CONSTITUENT
0 . .. . . ., , . , ,. , , , . . , 0 H A M CITY OBS TEMP
I I o----__l-_---L- L- I 1 ---.L A PR M AY JI!N JUL A U G SEP 0 CT N OV
I 1979 I
Figure 4
SACRAMENTO RIVER AT HAMILTON C l T V - WATER TEMPERATURE

Figure 5
12 0 --
SACRAMENTO RIVER AT HAMlLTON CITY-DISSOLVED OXYGEN
C - - SIM 'OXYGEN CONSTITUENT
Figure 6
0 O HAM CITY 08s DO
M G / 10 o-- L-
- I I 1 - I - I - - d
5~~~ V AY JUN JUL AUG S EP OCT NOV I
I979
SACRAMENTO RIVER A T HAMILTON ClTY - SPECIFIC
NOV
2 00 -.- SIM + CONS I CONSTITUENT
. .. . . SIM + CONS 2 CONSTITUENT
0 0- - -- a HAM ClTY 0 8 s EC
N X HAM CITY OBS A L K S
I T ,-0--- u 125:- --0-
CONDUCTANCE (EC) (L ALKALINITY
I I
1979
E N
loo-- 1 N M 75:- G / L 50--
,. : : .
%r: - - -- - - - -- - - - - -. 5 , ; : . . . .
I I I I - L J ' ~ A P R M AY JUN J u L AUG s EP o CT

evaluation of all these results lead the authors to encourage the continued applicati.on of this model to help develop understanding of the workings and operation of any stream system.
KANAWHA RIVER SYSTEM APPLICATION
The Kanawha River system consists of three major reservoirs as shown in Figure 7. Bluestone Lake Dam on the New River i.s located about 107 miles south of Charleston, West Virginia. The Greenbrier River, a significant tributary, drains into the New River immediately below Bluestone Lake Dam and above Hinton, West Virginia; the site of significant gaged flow and water quality data. The Summersville Lake Dam on the Gauley River flows into the New River at Kanawha Falls, about 40 miles above Charleston. The Sutton Lake Dam on the Elk River flows into the Kanawha River at Charleston. The New River is renamed the Kanawha River at Kanawha Fal.1~.
The Kanawha River system is being evaluated using HEC-5Q for temperature, specific conductance (or electrical conductance, EC) biochemical oxygen demand (BOD) and dissolved oxygen (DO). Since the necessary input data are available at Hinton (below Bluestone Lake) and analysis of Bluestone Lake is of no interest, only the two lakes, Summersville and Sutton, are being analyzed along with the three-.river network .
The study is still in progress. Only initial calibration efforts have been completed. This study will be the second test case of real prototype data and has already helped debug several parts of the code not previously tested. The case is similar to the Sacramento River case but involves only Corps reservoirs; therefore, it is a likely candidate for future model testing in the real-time water control and reservoir operation area.
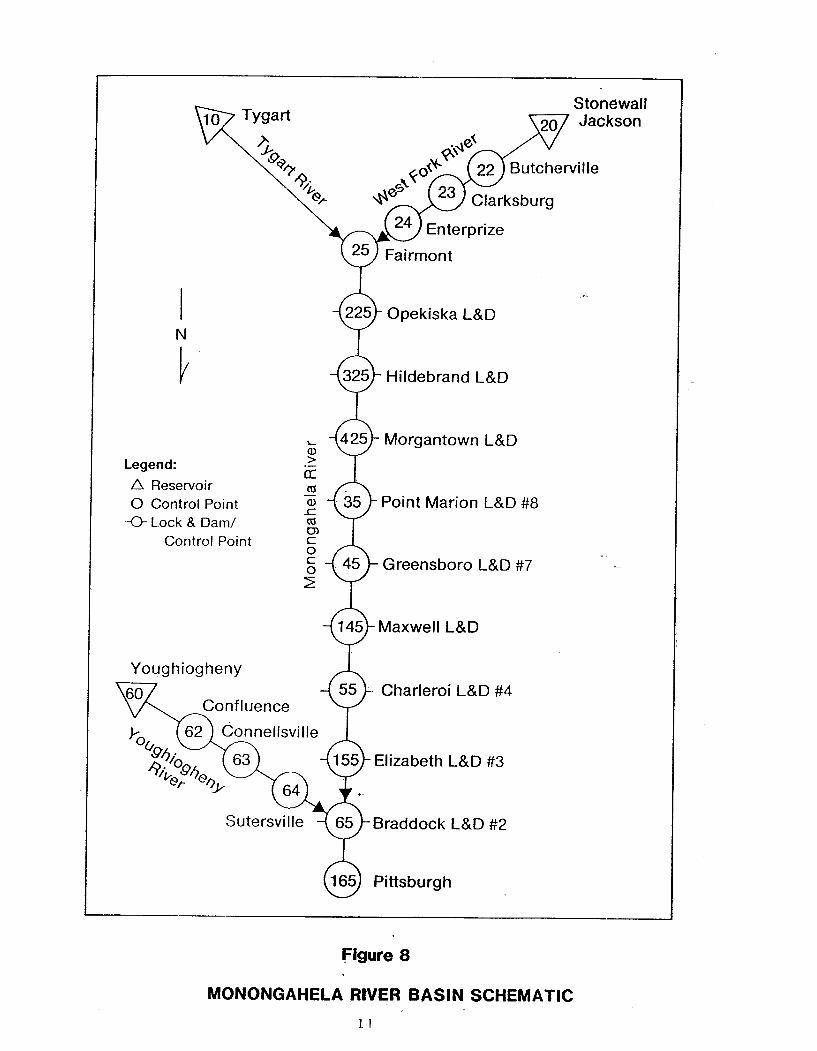
MOHONGAHELA RIVER SYSTEM APPLICATION
The Monongahela River system consists of three major reservoirs as shown in Figure 8. Stonewall Jackson Lake Dam (presently under construction) is located about 202 miles south of Pittsburgh, Pennsylvania, on the West Fork Monongahela River. Tygart Lake Dam about 152 miles north of Pittsburgh on the Tygart River drains into the Monongahela River at Fairmont, West Virginia (CP25 in Figure 8). Youghiogheny Lake Dam about 85 miles east of Pittsburgh on the Youghiogheny River drains into the Monongahela River at Braddock, West Virginia (CP65). Braddock is about 11 miles south of Pittsburgh.

Sutton Lake
Queen Clay Frametown \ Shoals
River Lake Dam
Legend: A Reservoir 0 Control Point Green brier River
U- Lock & Dam1 Control Point Bluestone Lake Dam
Figure 7
KANAWHA RIVER BASIN SCHEMATIC
Stonewall
225 Opekiska L&D 0 325 Hildebrand L&D 9
Morgantown L&D
Legend:
A Reservoir 0 Control Point Point Marion L&D #8 U Lock & Dam/
Control Point -
Greensboro L&D #7 -.
Youghiogheny harleroi L&D #4
zabeth L&D #3
ddock L&D #2
Figure 8
MONONGAHELA RtVER BASIN SCHEMATIC
11

The Monongahela River system is being evaluated using HEC-5Q for temperature, EC, BOD, and DO. The study is also still in progress with data files still being developed. This study will be the third test case and, similar to the Kanawha River system, it is a candidate for future testing of real-time operations capabi.1i.t~. This data set could easily be modified to include evaluation of hydropower retrofit on the nine locks and dams along t.he lower Monongahela River up to Fairmont .
SUMMARY
In this paper, the author has provided a brief description of the HEC-5Q computer program for analysis of water quality impacts due to reservoir system operations and a discussion of three applications, one completed and two in progress. The model results are very encouraging and future appli.cations are being considered.
The model has the capabi.lity to evaluate present operations on large integrated reserv0i.r systems such as the Columbia/Snake/Williamette Rivers or similar large systems in other parts of the United States. Once calibrated to historical conditions, alternative regulation can be easily evaluated to "best" meet all project purposes at all points in the system and provide the water managers with input to their operation decisions either in a planning or "real-time" mode.

REFERENCES
1. Duke, James H., Donald J. Smith and R.G. Willey, 1984, "Reservoir System Analysis for Water Quality," Technical Paper No. 99, Hydrologic Engineering Center.
2. Hydrocomp, 19'76, "Hydrocomp Simulation Programming Operations Manual," 4th Edition, Palo Alto, California.
3. Hydrologic Engineering Center, 1978, "Water Quality for River- Reservoir Systems," Computer Program Description.
4. Hydrologic Engineering Center, 1984, "HEC-5Q, Simulation of Flood Control and Conservation Systems (Including Water Quality Analysis)," Draft Computer Program Users Manual.
5. U.S. Army Engineer Waterways Experiment Station, 1.982, "CE-QUAL- R1: A Numerical One-Dimensional Model of Reservoir Water Quality," Instruction Report E-82-1, Computer Program User's Manual.
6. Willey, R.G., 1983, "Reservoir System Regulation for Water Quality Control," Technical Paper No. 88, Hydrologic Engineering Center.
7. Willey, R.G., D.J. Smith J.H. Duke, 1985, "Modeling Water Resources Systems for Water Quality," Technical Paper No. 104, Hydrologic Engineering Center.
8. Willey, R.G., 1985, "Water Quality Simulation of Reservoir System Operations in the Sacramento Valley Using HEC-5Q," Training Document No. 24, Hydrologic Engineering Center.


Technical Paper Series TP-1 Use of Interrelated Records to Simulate Streamflow TP-2 Optimization Techniques for Hydrologic
Engineering TP-3 Methods of Determination of Safe Yield and
Compensation Water from Storage Reservoirs TP-4 Functional Evaluation of a Water Resources System TP-5 Streamflow Synthesis for Ungaged Rivers TP-6 Simulation of Daily Streamflow TP-7 Pilot Study for Storage Requirements for Low Flow
Augmentation TP-8 Worth of Streamflow Data for Project Design - A
Pilot Study TP-9 Economic Evaluation of Reservoir System
Accomplishments TP-10 Hydrologic Simulation in Water-Yield Analysis TP-11 Survey of Programs for Water Surface Profiles TP-12 Hypothetical Flood Computation for a Stream
System TP-13 Maximum Utilization of Scarce Data in Hydrologic
Design TP-14 Techniques for Evaluating Long-Tem Reservoir
Yields TP-15 Hydrostatistics - Principles of Application TP-16 A Hydrologic Water Resource System Modeling
Techniques TP-17 Hydrologic Engineering Techniques for Regional
Water Resources Planning TP-18 Estimating Monthly Streamflows Within a Region TP-19 Suspended Sediment Discharge in Streams TP-20 Computer Determination of Flow Through Bridges TP-21 An Approach to Reservoir Temperature Analysis TP-22 A Finite Difference Methods of Analyzing Liquid
Flow in Variably Saturated Porous Media TP-23 Uses of Simulation in River Basin Planning TP-24 Hydroelectric Power Analysis in Reservoir Systems TP-25 Status of Water Resource System Analysis TP-26 System Relationships for Panama Canal Water
Supply TP-27 System Analysis of the Panama Canal Water
Supply TP-28 Digital Simulation of an Existing Water Resources
System TP-29 Computer Application in Continuing Education TP-30 Drought Severity and Water Supply Dependability TP-31 Development of System Operation Rules for an
Existing System by Simulation TP-32 Alternative Approaches to Water Resources System
Simulation TP-33 System Simulation of Integrated Use of
Hydroelectric and Thermal Power Generation TP-34 Optimizing flood Control Allocation for a
Multipurpose Reservoir TP-35 Computer Models for Rainfall-Runoff and River
Hydraulic Analysis TP-36 Evaluation of Drought Effects at Lake Atitlan TP-37 Downstream Effects of the Levee Overtopping at
Wilkes-Barre, PA, During Tropical Storm Agnes TP-38 Water Quality Evaluation of Aquatic Systems
TP-39 A Method for Analyzing Effects of Dam Failures in Design Studies
TP-40 Storm Drainage and Urban Region Flood Control Planning
TP-41 HEC-5C, A Simulation Model for System Formulation and Evaluation
TP-42 Optimal Sizing of Urban Flood Control Systems TP-43 Hydrologic and Economic Simulation of Flood
Control Aspects of Water Resources Systems TP-44 Sizing Flood Control Reservoir Systems by System
Analysis TP-45 Techniques for Real-Time Operation of Flood
Control Reservoirs in the Merrimack River Basin TP-46 Spatial Data Analysis of Nonstructural Measures TP-47 Comprehensive Flood Plain Studies Using Spatial
Data Management Techniques TP-48 Direct Runoff Hydrograph Parameters Versus
Urbanization TP-49 Experience of HEC in Disseminating Information
on Hydrological Models TP-50 Effects of Dam Removal: An Approach to
Sedimentation TP-51 Design of Flood Control Improvements by Systems
Analysis: A Case Study TP-52 Potential Use of Digital Computer Ground Water
Models TP-53 Development of Generalized Free Surface Flow
Models Using Finite Element Techniques TP-54 Adjustment of Peak Discharge Rates for
Urbanization TP-55 The Development and Servicing of Spatial Data
Management Techniques in the Corps of Engineers TP-56 Experiences of the Hydrologic Engineering Center
in Maintaining Widely Used Hydrologic and Water Resource Computer Models
TP-57 Flood Damage Assessments Using Spatial Data Management Techniques
TP-58 A Model for Evaluating Runoff-Quality in Metropolitan Master Planning
TP-59 Testing of Several Runoff Models on an Urban Watershed
TP-60 Operational Simulation of a Reservoir System with Pumped Storage
TP-61 Technical Factors in Small Hydropower Planning TP-62 Flood Hydrograph and Peak Flow Frequency
Analysis TP-63 HEC Contribution to Reservoir System Operation TP-64 Determining Peak-Discharge Frequencies in an
Urbanizing Watershed: A Case Study TP-65 Feasibility Analysis in Small Hydropower Planning TP-66 Reservoir Storage Determination by Computer
Simulation of Flood Control and Conservation Systems
TP-67 Hydrologic Land Use Classification Using LANDSAT
TP-68 Interactive Nonstructural Flood-Control Planning TP-69 Critical Water Surface by Minimum Specific
Energy Using the Parabolic Method

TP-70 Corps of Engineers Experience with Automatic Calibration of a Precipitation-Runoff Model
TP-71 Determination of Land Use from Satellite Imagery for Input to Hydrologic Models
TP-72 Application of the Finite Element Method to Vertically Stratified Hydrodynamic Flow and Water Quality
TP-73 Flood Mitigation Planning Using HEC-SAM TP-74 Hydrographs by Single Linear Reservoir Model TP-75 HEC Activities in Reservoir Analysis TP-76 Institutional Support of Water Resource Models TP-77 Investigation of Soil Conservation Service Urban
Hydrology Techniques TP-78 Potential for Increasing the Output of Existing
Hydroelectric Plants TP-79 Potential Energy and Capacity Gains from Flood
Control Storage Reallocation at Existing U.S. Hydropower Reservoirs
TP-80 Use of Non-Sequential Techniques in the Analysis of Power Potential at Storage Projects
TP-81 Data Management Systems of Water Resources Planning
TP-82 The New HEC-1 Flood Hydrograph Package TP-83 River and Reservoir Systems Water Quality
Modeling Capability TP-84 Generalized Real-Time Flood Control System
Model TP-85 Operation Policy Analysis: Sam Rayburn
Reservoir TP-86 Training the Practitioner: The Hydrologic
Engineering Center Program TP-87 Documentation Needs for Water Resources Models TP-88 Reservoir System Regulation for Water Quality
Control TP-89 A Software System to Aid in Making Real-Time
Water Control Decisions TP-90 Calibration, Verification and Application of a Two-
Dimensional Flow Model TP-91 HEC Software Development and Support TP-92 Hydrologic Engineering Center Planning Models TP-93 Flood Routing Through a Flat, Complex Flood
Plain Using a One-Dimensional Unsteady Flow Computer Program
TP-94 Dredged-Material Disposal Management Model TP-95 Infiltration and Soil Moisture Redistribution in
HEC-1 TP-96 The Hydrologic Engineering Center Experience in
Nonstructural Planning TP-97 Prediction of the Effects of a Flood Control Project
on a Meandering Stream TP-98 Evolution in Computer Programs Causes Evolution
in Training Needs: The Hydrologic Engineering Center Experience
TP-99 Reservoir System Analysis for Water Quality TP-100 Probable Maximum Flood Estimation - Eastern
United States TP-101 Use of Computer Program HEC-5 for Water Supply
Analysis TP-102 Role of Calibration in the Application of HEC-6 TP-103 Engineering and Economic Considerations in
Formulating TP-104 Modeling Water Resources Systems for Water
Quality
TP-105 Use of a Two-Dimensional Flow Model to Quantify Aquatic Habitat
TP-106 Flood-Runoff Forecasting with HEC-1F TP-107 Dredged-Material Disposal System Capacity
Expansion TP-108 Role of Small Computers in Two-Dimensional
Flow Modeling TP-109 One-Dimensional Model for Mud Flows TP-110 Subdivision Froude Number TP-111 HEC-5Q: System Water Quality Modeling TP-112 New Developments in HEC Programs for Flood
Control TP-113 Modeling and Managing Water Resource Systems
for Water Quality TP-114 Accuracy of Computer Water Surface Profiles -
Executive Summary TP-115 Application of Spatial-Data Management
Techniques in Corps Planning TP-116 The HEC's Activities in Watershed Modeling TP-117 HEC-1 and HEC-2 Applications on the
Microcomputer TP-118 Real-Time Snow Simulation Model for the
Monongahela River Basin TP-119 Multi-Purpose, Multi-Reservoir Simulation on a PC TP-120 Technology Transfer of Corps' Hydrologic Models TP-121 Development, Calibration and Application of
Runoff Forecasting Models for the Allegheny River Basin
TP-122 The Estimation of Rainfall for Flood Forecasting Using Radar and Rain Gage Data
TP-123 Developing and Managing a Comprehensive Reservoir Analysis Model
TP-124 Review of U.S. Army corps of Engineering Involvement With Alluvial Fan Flooding Problems
TP-125 An Integrated Software Package for Flood Damage Analysis
TP-126 The Value and Depreciation of Existing Facilities: The Case of Reservoirs
TP-127 Floodplain-Management Plan Enumeration TP-128 Two-Dimensional Floodplain Modeling TP-129 Status and New Capabilities of Computer Program
HEC-6: "Scour and Deposition in Rivers and Reservoirs"
TP-130 Estimating Sediment Delivery and Yield on Alluvial Fans
TP-131 Hydrologic Aspects of Flood Warning - Preparedness Programs
TP-132 Twenty-five Years of Developing, Distributing, and Supporting Hydrologic Engineering Computer Programs
TP-133 Predicting Deposition Patterns in Small Basins TP-134 Annual Extreme Lake Elevations by Total
Probability Theorem TP-135 A Muskingum-Cunge Channel Flow Routing
Method for Drainage Networks TP-136 Prescriptive Reservoir System Analysis Model -
Missouri River System Application TP-137 A Generalized Simulation Model for Reservoir
System Analysis TP-138 The HEC NexGen Software Development Project TP-139 Issues for Applications Developers TP-140 HEC-2 Water Surface Profiles Program TP-141 HEC Models for Urban Hydrologic Analysis
TP-142 Systems Analysis Applications at the Hydrologic Engineering Center
TP-143 Runoff Prediction Uncertainty for Ungauged Agricultural Watersheds
TP-144 Review of GIS Applications in Hydrologic Modeling
TP-145 Application of Rainfall-Runoff Simulation for Flood Forecasting
TP-146 Application of the HEC Prescriptive Reservoir Model in the Columbia River Systems
TP-147 HEC River Analysis System (HEC-RAS) TP-148 HEC-6: Reservoir Sediment Control Applications TP-149 The Hydrologic Modeling System (HEC-HMS):
Design and Development Issues TP-150 The HEC Hydrologic Modeling System TP-151 Bridge Hydraulic Analysis with HEC-RAS TP-152 Use of Land Surface Erosion Techniques with
Stream Channel Sediment Models
TP-153 Risk-Based Analysis for Corps Flood Project Studies - A Status Report
TP-154 Modeling Water-Resource Systems for Water Quality Management
TP-155 Runoff simulation Using Radar Rainfall Data TP-156 Status of HEC Next Generation Software
Development TP-157 Unsteady Flow Model for Forecasting Missouri and
Mississippi Rivers TP-158 Corps Water Management System (CWMS) TP-159 Some History and Hydrology of the Panama Canal TP-160 Application of Risk-Based Analysis to Planning
Reservoir and Levee Flood Damage Reduction Systems
TP-161 Corps Water Management System - Capabilities and Implementation Status


