JOURNAL OF FINANCIAL AND QUANTITATIVE ANALYSIS Vol. 44, No. 2, Apr. 2009, pp. 273–305 COPYRIGHT 2009, MICHAEL G. FOSTER SCHOOL OF BUSINESS, UNIVERSITY OF WASHINGTON, SEATTLE, WA 98195 doi:10.1017/S0022109009090188 Hedge Funds for Retail Investors? An Examination of Hedged Mutual Funds Vikas Agarwal, Nicole M. Boyson, and Narayan Y. Naik ∗ Abstract Recently, there has been rapid growth in the assets managed by “hedged mutual funds”— mutual funds mimicking hedge fund strategies. We examine the performance of these funds relative to hedge funds and traditional mutual funds. Despite using similar trading strate- gies, hedged mutual funds underperform hedge funds. We attribute this finding to hedge funds’ lighter regulation and better incentives. Conversely, hedged mutual funds outper- form traditional mutual funds. Notably, this superior performance is driven by managers with experience implementing hedge fund strategies. Our findings have implications for investors seeking hedge-fund-like payoffs at a lower cost and within the comfort of a reg- ulated environment. I. Introduction Fairly recently, a number of mutual fund companies have begun offering funds that use hedge-fund-like trading strategies designed to benefit from po- tential mispricing on the long as well as the short side. Recognizing that these funds are unique, Morningstar and Lipper have created the new style categories ∗ Agarwal, [email protected], Robinson College of Business, Georgia State University, 35 Broad St., Atlanta, GA 30303; Boyson, [email protected], College of Business Administration, North- eastern University, 360 Huntington Ave., Boston, MA 02115; and Naik, [email protected], Institute of Finance and Accounting, London Business School, Sussex Place, Regent’s Park, London NW1 4SA, United Kingdom. Agarwal also holds a Research Fellow position at the Centre for Financial Research (CFR), University of Cologne. We thank Viral Acharya, Richard Brealey, Elroy Dimson, Patrick Fauchier, Bill Fung, Francisco Gomes, Denis Gromb, Joop Huij, Robert Kosowski, Anna Pavlova, Jeffrey Pontiff, Jesper Rangvid, David Stolin, Ren´ e Stulz, Mathijs van Dijk, and seminar participants at London Business School, Ohio State University’s 2006 Alumni Summer Research Con- ference, the 2006 European Finance Association Conference, Northeastern University, Third Biennial McGill Conference on Global Asset Management, and David Chapman (the referee) for many helpful comments and constructive suggestions. We also thank Rick Goldsmith, Global Head of Deutsche Bank’s Alternative Investment Strategies; Dennis Bein at Analytic Investors; Fredrick C. “Rick” Lake at Lake Partners; and Lee Schultheis at Alternative Investment Partners, LLC, for useful insights into hedged mutual funds. Agarwal is grateful for the research support in the form of a research grant from the Robinson College of Business of Georgia State University. We are grateful for support from the BNP Paribas Hedge Fund Centre at the London Business School, and to Burak Ciceksever, Costanza Meneghetti, Tonmoy Navare, and Ashour Yacoub for excellent research assistance. Finally, we thank Ryan Tagal and Dan McNeela at Morningstar and Jeff Tjornehoj at Lipper for assistance in identifying hedged mutual funds. 273
Transcript
JOURNAL OF FINANCIAL AND QUANTITATIVE ANALYSIS Vol. 44, No. 2, Apr. 2009, pp. 273–305COPYRIGHT 2009, MICHAEL G. FOSTER SCHOOL OF BUSINESS, UNIVERSITY OF WASHINGTON, SEATTLE, WA 98195doi:10.1017/S0022109009090188
Hedge Funds for Retail Investors? AnExamination of Hedged Mutual Funds
Vikas Agarwal, Nicole M. Boyson, and Narayan Y. Naik∗
Abstract
Recently, there has been rapid growth in the assets managed by “hedged mutual funds”—mutual funds mimicking hedge fund strategies. We examine the performance of these fundsrelative to hedge funds and traditional mutual funds. Despite using similar trading strate-gies, hedged mutual funds underperform hedge funds. We attribute this finding to hedgefunds’ lighter regulation and better incentives. Conversely, hedged mutual funds outper-form traditional mutual funds. Notably, this superior performance is driven by managerswith experience implementing hedge fund strategies. Our findings have implications forinvestors seeking hedge-fund-like payoffs at a lower cost and within the comfort of a reg-ulated environment.
I. Introduction
Fairly recently, a number of mutual fund companies have begun offeringfunds that use hedge-fund-like trading strategies designed to benefit from po-tential mispricing on the long as well as the short side. Recognizing that thesefunds are unique, Morningstar and Lipper have created the new style categories
∗Agarwal, [email protected], Robinson College of Business, Georgia State University, 35 BroadSt., Atlanta, GA 30303; Boyson, [email protected], College of Business Administration, North-eastern University, 360 Huntington Ave., Boston, MA 02115; and Naik, [email protected], Instituteof Finance and Accounting, London Business School, Sussex Place, Regent’s Park, London NW14SA, United Kingdom. Agarwal also holds a Research Fellow position at the Centre for FinancialResearch (CFR), University of Cologne. We thank Viral Acharya, Richard Brealey, Elroy Dimson,Patrick Fauchier, Bill Fung, Francisco Gomes, Denis Gromb, Joop Huij, Robert Kosowski, AnnaPavlova, Jeffrey Pontiff, Jesper Rangvid, David Stolin, Rene Stulz, Mathijs van Dijk, and seminarparticipants at London Business School, Ohio State University’s 2006 Alumni Summer Research Con-ference, the 2006 European Finance Association Conference, Northeastern University, Third BiennialMcGill Conference on Global Asset Management, and David Chapman (the referee) for many helpfulcomments and constructive suggestions. We also thank Rick Goldsmith, Global Head of DeutscheBank’s Alternative Investment Strategies; Dennis Bein at Analytic Investors; Fredrick C. “Rick” Lakeat Lake Partners; and Lee Schultheis at Alternative Investment Partners, LLC, for useful insights intohedged mutual funds. Agarwal is grateful for the research support in the form of a research grant fromthe Robinson College of Business of Georgia State University. We are grateful for support from theBNP Paribas Hedge Fund Centre at the London Business School, and to Burak Ciceksever, CostanzaMeneghetti, Tonmoy Navare, and Ashour Yacoub for excellent research assistance. Finally, we thankRyan Tagal and Dan McNeela at Morningstar and Jeff Tjornehoj at Lipper for assistance in identifyinghedged mutual funds.
273
274 Journal of Financial and Quantitative Analysis
“Long/Short Equity” and “Market Neutral” to classify them. Despite their useof hedge fund strategies, “hedged” mutual funds are regulated by the Securitiesand Exchange Commission (SEC) in exactly the same way as “traditional” mutualfunds. They are available to retail investors with an average required minimum in-vestment of just $5,000, while hedge funds are only available to accredited and/orqualified investors with a minimum investment of roughly $1 million.1
We believe that hedged mutual funds will play an increasingly important rolein the field of investment management, as they provide access to hedge-fund-likestrategies with the fee structure, liquidity, and regulatory requirements of mutualfunds.2 This paper conducts an in-depth analysis of this new class of managedportfolios by comparing them with hedge funds (HFs) on one hand and tradi-tional mutual funds (TMFs) on the other. Although HFs and hedged mutual funds(HMFs) employ similar trading strategies, HFs are subject to lighter regulationand have better incentives. Regarding regulation, HMFs must comply with restric-tions that include covering short positions, limiting borrowing to only one-third oftotal assets, and restricting investment in illiquid securities to 15% of total assets.They must also provide daily liquidity and audited semiannual reports.3 In con-trast, HFs do not face such constraints, as they are largely unregulated. In additionto lighter regulation, HFs have better incentives, usually charging performance-based incentive fees, whereas HMFs usually do not.4 Differences in both reg-ulation and incentives imply that HMFs are likely to underperform HFs (ourRegulation and Incentives Hypothesis). We find evidence supporting this hypoth-esis. Controlling for differences in risks, fund characteristics, and past perfor-mance, HMFs underperform HFs by approximately 3.3% per year on a net-of-feebasis.
Furthermore, although both HMFs and TMFs are subject to the same reg-ulations, HMFs have greater flexibility in terms of trading strategies. For exam-ple, HMFs can sell short and use derivatives to exploit investment opportunitiesthat TMF managers often disallow in their prospectuses. Thus, HMFs are ableto capture alpha on both the long and the short side, which should help themto outperform TMFs (our Strategy Hypothesis). Of course, this relaxation in
1Accredited investors are those with a net worth of $1 million or more, or two consecutive yearsof income of $200,000 (or $300,000 of household income), while qualified investors are those withnet worth of $5 million. Recently, the SEC proposed changing the standard to require investable assetsof $2.5 million for accredited investors (Anderson (2006)).
2A recent study by Cerulli Associates found that over half of the Registered Investment Advis-ers who do not currently use hedge funds for their clients would add hedged mutual funds to theirportfolios (see N. O’Hara, “Funds of Funds,” http://www.onwallstreet.com, 2/1/2006). These fundsare also attractive to retirement plan administrators. For example, Lake Partners, Inc., a Greenwich,CT, investment adviser, offers a fund of hedged mutual funds, called LASSO, which is available to401(k)-style programs.
3This mandatory disclosure by mutual funds can result in leakage of funds’ private informationto outsiders, who can trade on it and move security prices against them (see, e.g., Wermers (2001),Frank, Poterba, Shackelford, and Shoven (2004)).
4If a mutual fund wishes to charge a performance-based incentive fee, the fee must be symmetrical,such that it will increase with good performance and decrease with poor performance. Not surprisingly,this type of fee (also called a “fulcrum” fee) is unpopular among mutual funds. In a study of incentivefees, Elton, Gruber, and Blake (2003) document that only 108 in their sample of over 6,000 mutualfunds use fulcrum fees. In our sample of 52 HMFs, only two use fulcrum fees.
Agarwal, Boyson, and Naik 275
constraints could also lead to an increase in agency costs. However, we find strongsupport for the Strategy Hypothesis, suggesting that the benefits of loosening con-straints exceed the costs associated with greater agency risk.5 Despite higher feesand turnover, HMFs outperform TMFs by as much as 4.8% per year on a net-of-fee basis when controlling for differences in risks, fund characteristics, and pastperformance.
Although HMFs as a group outperform TMFs, our sample of HMFs exhibitsan interesting dimension of heterogeneity. About half the HMFs have managerswith HF experience, while the rest have managers without such experience. These“experienced” HF managers concurrently manage HFs and HMFs, and, in allcases, the HF experience was gained either concurrent with or prior to the man-ager’s starting an HMF. This heterogeneity enables us to investigate whether anindividual HMF’s superior performance is related to its manager’s experience inimplementing HF-like strategies (our Skill Hypothesis). Arguably, HMF man-agers with HF experience should be more adept at implementing HF strategiesand therefore should outperform those without such experience.6 We find supportfor the Skill Hypothesis. HMF managers with HF experience outperform thosewithout. The difference in risk-adjusted performance is as much as 4.1% per yearnet of fees while controlling for fund characteristics and past performance. Thisresult implies that most of the superior performance of HMFs relative to TMFs islargely driven by these “skilled” fund managers.
Given this result, a natural question arises: Why would an HF manager startan HMF, given the tighter constraints, stricter regulation, and weaker incentivesin the mutual fund industry? One possibility is that the HFs offered by thesemanagers are underperforming other HFs. We test this possibility by comparingthe performance of these two groups and find no significant difference. Hence,it does not appear that the managers of poorly performing HFs choose to offerHMFs. Instead, we conjecture that the reason for offering both HMFs and HFsis that these managers wish to raise additional capital, given that this task can beextremely difficult for smaller HFs. This idea is corroborated by a recent studyshowing that 70% of new capital flows go to the top 100 HFs by size, leavingonly 30% for the 8,000+ remaining HFs.7 Finally, HMFs might also be attractiveto HF managers, since mutual fund investors tend to be slow to withdraw assetsfrom poorly performing funds but quick to invest in well-performing funds (seeSirri and Tufano (1998)). Thus, having both HMFs and HFs in their product rangeprovides “client diversification” benefits to managers.8
All our findings supporting the three hypotheses (Regulation and Incentives,Strategy, and Skill) hold for different risk models and on a prefee, as well asa postfee, basis. In addition, our results are robust to conducting our analysesat both the monthly and yearly levels, and to the use of alternate econometric
5We further discuss this issue in Section II.A.6It is also conceivable that HMFs with HF managers will benefit from positive externalities, such
as a reduction in transaction costs due to economies of scale in the trading process. We are implicitlygrouping such externalities together as “skill” in our hypothesis.
7See “Hedge Fund Market Trends 1Q 2007,” published by Hedge Fund Research (http://www.hedgefundresearch.com).
8We examine these issues in more detail in Section VI.
276 Journal of Financial and Quantitative Analysis
methodologies including random effects, a matched sample analysis, and theFama and MacBeth (1973) approach.
While ours is the first paper to examine the relative performance of HMFsvis-a-vis both HFs and TMFs, three other studies have examined the rationalebehind allowing mutual fund managers flexibility in implementing investmentstrategies (Koski and Pontiff (1999), Deli and Varma (2002), and Almazan, Brown,Carlson, and Chapman (2004)). This flexibility typically enables the manager touse derivative contracts, invest in restricted securities, sell securities short, and/orborrow money to create leverage. In general, these studies find evidence that pro-viding flexibility to managers does not improve fund performance but, rather,enables managers to control expenses, manage cash flows, and manage risk moreefficiently. Additionally, the existence of investment constraints (i.e., reduced in-vestment flexibility) is consistent with optimal contracting in the mutual fundindustry; empirically, these studies show that funds with a greater need for moni-toring face more investment restrictions.
We build on this literature by focusing on the performance of a specific groupof mutual funds that use HF-like trading strategies. Our research makes three im-portant contributions to the existing literature. First, we show that the superiorperformance of HMFs over TMFs is driven by managers with HF experience.This finding implies that simply allowing managers flexibility will not necessarilyresult in better performance (as confirmed by prior studies). Second, we demon-strate that these HMFs have significantly higher turnover and expenses than doTMFs, suggesting that they are not using flexibility for cost reduction but, rather,to implement HF-like strategies. Finally, by focusing on funds that use HF-liketrading strategies and comparing their performance with those of HFs, we shedlight on the role of regulation and incentives. We show that despite using simi-lar trading strategies, HMFs underperform HFs, which face lighter regulation andstronger performance-related incentives.
The paper is structured as follows. Section II discusses related literature andoutlines the three hypotheses. Section III describes the data. Section IV investi-gates the Regulation and Incentives Hypothesis. Section V examines the StrategyHypothesis. Section VI tests the Skill Hypothesis and performs a battery of ro-bustness tests, and Section VII concludes.
II. Related Literature and Testable Hypotheses
A. Related Literature
As noted in the Introduction, our paper is related to literature that examinesthe motivation for controlling a fund’s investment flexibility. One reason to restrictflexibility is to minimize agency costs by preventing the manager from strategi-cally altering the fund’s risk to increase his own compensation (Almazan et al.(2004)).9 Another reason to allow a fund flexibility is to reduce the transaction
9For example, the tournaments literature (e.g., Brown, Harlow, and Starks (1996), Chevalier andEllison (1997)) documents that mutual funds strategically change their risk in the latter half of the year
Agarwal, Boyson, and Naik 277
costs, liquidity costs, and opportunity costs of holding cash (Koski and Pontiff(1999), Deli and Varma (2002)). We contribute to this literature by showing thata special type of investment flexibility, by which managers intentionally use HFtrading strategies, can actually enhance fund performance.
In addition, two recent working papers examine potential conflicts of inter-est in side-by-side management of mutual funds and hedge funds. Cici, Gibson,and Moussawi (2006) and Nohel, Wang, and Zheng (2008) study this relationshipfrom the perspective of the management company and individual manager, re-spectively. Since the mutual fund universe predominantly consists of TMFs, theirresearch sheds light on the differences between HFs and TMFs offered by thesame agent (manager/management company). By contrast, we compare the per-formance of HMFs with both HFs and TMFs. To isolate the effect of skill, wedivide the HMFs into those that have HF managers and those that do not. Hence,we focus on the effect of skill gained in the HF industry on the performance ofHMFs, as opposed to examining conflicts of interest in side-by-side management.Thus, our paper complements this recently burgeoning literature.
Finally, we contribute to the literature on HFs that examines risk and re-turn characteristics, performance, and compensation structures (e.g., Ackermann,McEnally, and Ravenscraft (1999), Agarwal and Naik (2000), (2004), Asness,Krail, and Liew (2001), Baquero, ter Horst, and Verbeek (2005), Boyson (2008),Brown, Goetzmann, and Ibbotson (1999), Brown, Goetzmann, and Liang (2004),Brown et al. (2001), Das and Sundaram (2002), Fung and Hsieh (1997), (2000),(2001), (2004), Getmansky, Lo, and Makarov (2004), Goetzmann, Ingersoll, andRoss (2003), Jagannathan, Malakhov, and Novikov (2006), Kosowski, Naik, andTeo (2007), Liang (1999), (2000), and Mitchell and Pulvino (2001)). However,relatively scant literature compares hedge funds and mutual funds directly. Onereason is that significant differences in regulation, incentives, and trading strate-gies make it difficult to conduct a direct comparison. Our study overcomes theselimitations to some extent. Since HMFs and HFs use similar trading strategies,we may attribute the differences in performance to differences in regulation andincentives, rather than to differences in trading strategies. We also contribute tothe vast literature on mutual funds (e.g., Brown and Goetzmann (1995), Carhart(1997), Chevalier and Ellison (1999), Daniel, Grinblatt, Titman, and Wermers(1997), Elton et al. (1996a), (1996b), Jegadeesh and Titman (1993), Jensen (1968),and Wermers (2000)). Our paper is closest in spirit to studies of individual mutualfund asset classes, such as money market funds, equity mutual funds, and bondfunds (e.g., Comer (2005), Elton et al. (1995), Chen, Ferson, and Peters (2005),and Tiwari and Vijh (2004)).
B. Development of Hypotheses
This paper tests three hypotheses. First, the Regulation and Incentives Hy-pothesis posits that, due to the lighter regulation and better incentives experienced
to be “winners” and thereby attract greater capital flows, which results in higher compensation for themanager. By contrast, HF managers do not increase risk in the latter half of the year to attempt to bewinners—providing evidence that career concerns and reputational effects outweigh the agency costsfor HF managers (see Brown, Goetzmann, and Park (2001)).
278 Journal of Financial and Quantitative Analysis
by HFs, HMFs should underperform HFs. Mutual funds are regulated by the SECthrough four federal laws: the Securities Act of 1933, the Securities Exchange Actof 1934, the Investment Company Act of 1940, and the Investment Advisers Actof 1940. These acts impose several constraints on mutual funds. The InvestmentCompany Act of 1940 restricts a fund’s ability to use leverage or borrow againstthe value of securities in its portfolio. The SEC requires that funds engaging incertain investment techniques, including the use of options, futures, forwards, andshort selling, cover their positions. Mutual funds are required to provide daily netasset values (NAVs) and allow shareholders to redeem their shares at any time. Bycontrast, HFs are largely unregulated with respect to investment options, disclo-sure, and incentives. Also, HF managers are compensated through performance-based incentive fees, providing better incentives to deliver superior performance.As a result, we expect HMFs to underperform HFs.10
Second, the Strategy Hypothesis posits that, since HMFs follow trading strat-egies routinely used by HFs, HMFs should outperform TMFs that do not use thesestrategies. The ability of HMFs to outperform arises from their greater flexibility.For example, a long/short fund benefits from taking long positions in undervaluedsecurities and short positions in overvalued securities. Importantly, implementa-tion of most zero-cost investment strategies proposed in the asset pricing liter-ature, such as the size, value, and momentum strategies, requires simultaneousinvestment in long and short positions. Of course, the relaxation of constraintscan also lead to an increase in agency costs. Hence, our Strategy Hypothesis im-plicitly examines whether the benefits of loosening constraints outweigh theseagency costs.
Finally, the Skill Hypothesis predicts that HMF managers with experiencein implementing HF strategies should outperform HMF managers without theseskills and, by extension of the Strategy Hypothesis, should outperform TMFs aswell. We use a manager’s experience in the HF industry as the measure of skill.Specifically, if the HMF manager concurrently manages an HF and an HMF, themanager is “skilled.” Hence, managers must have HF experience that is eitherconcurrent with or precedes their experience in HMFs.11
III. Data and Variable Construction
A. Hedged Mutual Funds
We utilize a rigorous process to select the HMF sample. For brevity, wesummarize the process here and describe it in greater detail in Appendix A. Our
10Under the Investment Advisers Act, the SEC recently proposed that HF advisers be subject tosome of the same requirements as mutual fund advisers, including registration with the SEC, designa-tion of a chief compliance officer, implementation of policies to prevent misuse of nonpublic customerinformation and ensure that client securities are voted in the best interest of the client, and implemen-tation of a code of ethics. Since February 2006, HF advisers have been asked to comply with theserequirements, which are still much less onerous than those imposed on mutual fund managers. How-ever, a federal appeals court decision recently invalidated the SEC rule regulating HFs, so the futureof this regulation is uncertain.
11Since managers at HMFs sometimes change, an HMF may be categorized as having an HF man-ager during some years but not others.
Agarwal, Boyson, and Naik 279
primary analysis uses the CRSP Survivor-Bias-Free mutual fund database. We be-gin by including all HMFs that appear in the Morningstar and Lipper databases,which began classifying funds as HMFs in March 2006. This step results in 26unique funds. Since these lists are new, they do not include defunct funds. In addi-tion, they do not include mutual funds that follow HF investment strategies otherthan Long/Short Equity and Equity Market Neutral. To overcome these limita-tions, we search the CRSP and Morningstar mutual fund databases for fund namesand search Internet news archives for articles regarding HMFs. As detailed in Ap-pendix A, our search includes the terms “long/short,” “short,” “option,” “marketneutral,” “arbitrage,” “hybrid,” “hedged,” “merger,” “distressed,” “arbitrage,” and“alternative.” We believe that our search of news articles has a very strong chanceof identifying HMFs. Since this is a relatively new fund category that could bringadditional assets to a fund family, particularly given the media attention paid toHFs, it is logical that fund families will want to advertise the existence of thesefunds. However, recognizing that this search might not identify all possible funds,we perform an additional “completeness” test, detailed below.
The initial search yields a list of 90 funds, from which we eliminate those thatdo not use equity-based strategies or that use passive (index-based) investmentstrategies, based on their descriptions at www.Morningstar.com. We review theannual reports and prospectuses of the remaining funds from 1994 to 2004 todetermine whether they are, in fact, following “real” HF strategies. We identify22 additional funds through this process, generating a sample of 49 funds, 13 ofwhich are “dead” at the end of the sample period, 1994–2004. Our choice of thissample period is driven by two factors: first, very few HMFs (fewer than 10) werein operation prior to 1994, and, second, we want to match with reliable HF data,which begins in 1994.
We perform a final “completeness” step to ensure that we include all HMFs.Since it is possible that certain HMFs, particularly defunct funds, might remainunidentified by our original search, we use a statistical approach based on marketbeta to identify additional funds. First, we calculate the mean four-factor marketbeta of 0.36 for the already-identified 49 HMFs. We then calculate the four-factormarket betas for all other mutual funds. Using this information, we review theprospectuses and annual reports for all mutual funds with market betas of less than0.40 (rounding up the mean market beta of 0.36) for at least two years of existence.Of this list of more than 500 funds, we identify three additional funds that shouldbe classified as HMFs, one of which is defunct. None of the other funds fit theHMF criterion. Their low betas are due to a few factors: style (primarily sectorfunds, balanced funds, and “asset allocation” funds), size (very small funds on theverge of closing), or portfolio makeup (their assets are primarily invested in cash).This final step yields the final sample of 52 HMFs, of which 14 became defunctby the end of 2004.12
12To understand the flexibility available to our HMFs, we compute their constraint score, as inAlmazan et al. (2004), using SEC filings that report whether funds are permitted to use derivatives,leverage, short selling, and restricted securities. A score of 0 means the fund is completely unrestricted,while a score of 1 means the fund is completely restricted. The mean score for our sample is 0.23.More important, however, are our constraint score results for short sales, the investment technique
280 Journal of Financial and Quantitative Analysis
We also divide the sample of HMF managers into those with HF experience(“skilled”) and those without. To qualify as a “skilled” manager, the manager mustconcurrently manage both a hedge fund and a mutual fund, or have obtained HFexperience prior to becoming a mutual fund manager. Of the 52 HMF managers,27 have HF experience and 25 do not. Section VI further describes the method-ology used to identify “skilled” managers. Finally, we combine duplicate shareclasses and take asset-weighted averages of the expenses, turnover, loads, andfees, following Kacperczyk, Sialm, and Zheng (2008).
B. Traditional Mutual Funds
For the sample of TMFs, we include all equity mutual funds from the CRSPSurvivor-Bias-Free mutual fund database. As with the sample of HMFs, we com-bine duplicate share classes and take asset-weighted averages of the expenses,turnover, loads, and fees. We identify a total of 3,679 TMFs during our sampleperiod.
C. Hedge Funds
We use HF data from the TASS database, which includes monthly net-of-feereturns, management and incentive fees, size, terms (such as notice and redemp-tion periods), and investment styles of the HFs. It has been well documented thatHF databases suffer from several biases, including survivorship bias and instanthistory or backfilling bias (e.g., Ackermann et al. (1999), Fung and Hsieh (2000),Liang (2000), and Brown et al. (2001)). We control for survivorship bias by in-cluding defunct funds until they disappear from the database, and we mitigatebackfilling bias by excluding the fund’s “incubation period” from the time seriesof returns.13 Since our analysis compares HMFs with HFs, we restrict the sampleto HFs with investment styles that closely match those used by HMFs. This pro-vides us with the final sample of 2,179 HFs following Long/Short Equity, EquityMarket Neutral, and Event Driven strategies.14
D. Key Variables
Since mutual funds and hedge funds are exposed to a number of risk factors,we use risk-adjusted performance measures (alphas) for all the analyses. Alphasare defined as the intercepts from two separate regression models. The first is theCarhart (1997) four-factor model widely used in mutual fund studies. The fourfactors are the CRSP value-weighted market return, the two Fama and French(1993) factors (size (SMB) and book-to-market (HML)), and the Jegadeesh andTitman (1993) UMD (momentum) factor.
most commonly associated with the HF strategies of the funds in our sample. Within our sample, 78%of funds are permitted to use short sales, and, of these, 78% actually do. Furthermore, short sales as apercentage of assets under management for the funds in our sample average approximately 19%.
13To mitigate the incubation bias, we use data from the “Performance Start Date” instead of the“Inception Date” from the TASS database.
14See http://www.hedgeindex.com for a description of investment styles.
Agarwal, Boyson, and Naik 281
The second model is the Fung and Hsieh (2004) seven-factor model, madeup of an equity market factor, a size-spread factor, a bond market factor, a creditspread factor, and three option-based factors for bonds, currencies, and commodi-ties.15 For both models, we estimate alphas individually for each fund using theprior 24 months of gross-of-fee and net-of-fee returns for our gross and net per-formance measures.16
We also estimate two other models for robustness: Carhart’s (1997) four-factor model augmented with either i) Pastor and Stambaugh’s (2003) liquidityfactor, or ii) Agarwal and Naik’s (2004) out-of-the-money put and call optionfactors. The results (not tabulated) from these models are similar to those fromthe four- and seven-factor models.
Table 1 reports summary statistics for HMFs, TMFs, and HFs. The HMFsare subdivided into those that have HF managers and those that do not. Panels Aand B report the number of funds and their size, respectively, by year. All types offunds have increased in both number and size. In size, HMFs have grown 24-foldsince 1994, from $743 million to over $18 billion. HFs also grew rapidly duringthis period, increasing 20-fold from $19 billion to over $400 billion, while TMFsincreased three-fold from $541 billion to over $2 trillion.17
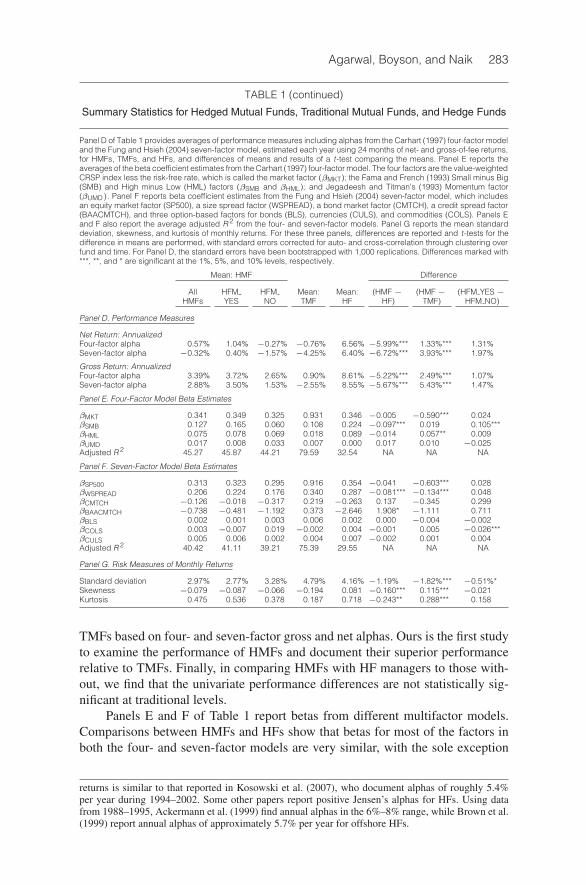
Panel C of Table 1 reports fund characteristics. HFs are younger than HMFsand have lower fixed expenses (measured as a percent of assets).18 HFs also haveincentive fees, but since HMFs and TMFs do not, we do not report these feeshere. However, in our analysis of gross performance, these fees are considered(see footnote 16 for detail). HFs and HMFs have similar flows and size. Sinceturnover and load data are not available for HFs, we do not report these statistics.In comparison to TMFs, HMFs are smaller, with lower loads but higher expenses,flows, and turnover. Finally, in comparison to HMFs without HF managers, thosewith such managers have lower expenses but turnover is higher.
Panel D of Table 1 reports univariate performance statistics using net-of-fee and gross-of-fee risk-adjusted returns. First, HFs outperform HMFs based onfour-factor and seven-factor gross and net alphas.19 Second, HMFs outperform
15We thank Kenneth French and David Hsieh for making the returns data on the four and sevenfactors, respectively, available on their Web sites (http://mba.tuck.dartmouth.edu /pages/faculty/ken.french/data library.html and http://faculty.fuqua.duke.edu/∼dah7/HFData.htm).
16Since some funds are missing return data for some months, we require that a fund have at least12 of the prior 24 months’ returns to be included in the sample. For the analysis in Section IV, wecalculate the gross performance measures for HFs accounting for the option-like incentive-fee contractas in Agarwal, Daniel, and Naik (2009). To compute gross-of-fee returns for mutual funds, we followGaspar, Massa, and Matos (2006) and others, and add to each month’s net-of-fee returns the fund’sannual expense ratio divided by 12 and the total load divided by 7, as most loads expire after 7 years.
17The growth figures reported here are only for HFs and TMFs selected for this study. In particular,the selected HF funds follow investment styles that correspond to those of HMFs, and the TMFs areonly equity-based mutual funds.
18At first, it seems a bit surprising that HFs are so much younger than HMFs. Upon closer investi-gation, this result is largely driven by a few HMFs that started many years ago. If we exclude the 10oldest HMFs, with an average age of 40 years, the remaining HMFs in the sample have an average ageof 9 years, much closer to that of HFs. Also, “fixed expense” is typically referred to as the “manage-ment fee” for HFs. To use a common term for both HFs and mutual funds, we refer to it as “expense”in this paper.
19Our finding that HFs have positive risk-adjusted performance is consistent with prior literature.Specifically, the magnitude of seven-factor alphas of approximately 6.4% per annum using net-of-fee
282 Journal of Financial and Quantitative Analysis
TABLE 1
Summary Statistics for Hedged Mutual Funds, Traditional Mutual Funds, and Hedge Funds
Panel A of Table 1 reports the number of hedged mutual funds (HMFs), traditional mutual funds (TMFs), and hedge funds(HF) each year during the sample period, 1994–2004. HMFs are further delineated into those with hedge fund managers(HFM YES) and those without (HFM NO). Panel B reports assets under management. Panel C reports the average fund age,size (the beginning-of-the-year assets under management (AUM)), expense ratio (annual expenses stated as a percentageof assets), fund flows (the difference of AUM in year t and in year t − 1, less the return between year t and t − 1, dividedby total assets in year t − 1), total load, and turnover data; Panel C also reports the mean differences and results of at-test comparing the means. Total load and turnover data are not available for HFs. The standard errors for the t-test arecorrected for auto- and cross-correlation through clustering over fund and time. Differences marked with ***, **, and * aresignificant at the 1%, 5%, and 10% levels, respectively.
Panel A. Number of Funds by Type and Year
No. of HMFs
Year All HMFs HFM YES HFM NO No. of TMFs No. of HFs
TOTAL LOAD 2.56% 2.46% 2.72% 2.89% NA NA −0.33%** −0.26%(% of assets)
TURNOVER 346.67% 418.79% 232.54% 99.35% NA NA 247.32%*** 186.25%***(% of assets)
(continued on next page)
Agarwal, Boyson, and Naik 283
TABLE 1 (continued)
Summary Statistics for Hedged Mutual Funds, Traditional Mutual Funds, and Hedge Funds
Panel D of Table 1 provides averages of performance measures including alphas from the Carhart (1997) four-factor modeland the Fung and Hsieh (2004) seven-factor model, estimated each year using 24 months of net- and gross-of-fee returns,for HMFs, TMFs, and HFs, and differences of means and results of a t-test comparing the means. Panel E reports theaverages of the beta coefficient estimates from the Carhart (1997) four-factor model. The four factors are the value-weightedCRSP index less the risk-free rate, which is called the market factor (βMKT); the Fama and French (1993) Small minus Big(SMB) and High minus Low (HML) factors (βSMB and βHML); and Jegadeesh and Titman’s (1993) Momentum factor(βUMD). Panel F reports beta coefficient estimates from the Fung and Hsieh (2004) seven-factor model, which includesan equity market factor (SP500), a size spread factor (WSPREAD), a bond market factor (CMTCH), a credit spread factor(BAACMTCH), and three option-based factors for bonds (BLS), currencies (CULS), and commodities (COLS). Panels Eand F also report the average adjusted R 2 from the four- and seven-factor models. Panel G reports the mean standarddeviation, skewness, and kurtosis of monthly returns. For these three panels, differences are reported and t-tests for thedifference in means are performed, with standard errors corrected for auto- and cross-correlation through clustering overfund and time. For Panel D, the standard errors have been bootstrapped with 1,000 replications. Differences marked with***, **, and * are significant at the 1%, 5%, and 10% levels, respectively.
Mean: HMF Difference
All HFM HFM Mean: Mean: (HMF − (HMF− (HFM YES−HMFs YES NO TMF HF HF) TMF) HFM NO)
TMFs based on four- and seven-factor gross and net alphas. Ours is the first studyto examine the performance of HMFs and document their superior performancerelative to TMFs. Finally, in comparing HMFs with HF managers to those with-out, we find that the univariate performance differences are not statistically sig-nificant at traditional levels.
Panels E and F of Table 1 report betas from different multifactor models.Comparisons between HMFs and HFs show that betas for most of the factors inboth the four- and seven-factor models are very similar, with the sole exception
returns is similar to that reported in Kosowski et al. (2007), who document alphas of roughly 5.4%per year during 1994–2002. Some other papers report positive Jensen’s alphas for HFs. Using datafrom 1988–1995, Ackermann et al. (1999) find annual alphas in the 6%–8% range, while Brown et al.(1999) report annual alphas of approximately 5.7% per year for offshore HFs.
284 Journal of Financial and Quantitative Analysis
that HFs load more heavily on the small-cap factor in both models. The similar-ities in market betas for the four- and seven-factor models, and the fact that bothare well below the market’s beta of 1, indicate that HMFs are following similar in-vestment strategies to HFs, notably, strategies that are not “long-only” in nature.Also, the market beta on both models is significantly higher for TMFs than forHMFs, again indicating that TMFs tend to be mostly “long-only” in their invest-ment styles (with market beta very close to 1), relative to HMFs. Finally, thoseHMFs with HF managers tend to load more heavily on the small-cap factors thanthose without.
Panel G of Table 1 compares risk among the three categories. HFs havehigher standard deviation, skewness, and excess kurtosis, than HMFs. TMFs havehigher standard deviation, more negative skewness, and lower kurtosis than doHMFs. Finally, between HMFs with HF managers and those without, the onlysignificant difference is that the standard deviation is lower for those HMFs withHF managers. Section IV tests our first hypothesis.
IV. Testing the Regulation and Incentives Hypothesis
We begin our analysis by comparing the performance of HFs and HMFs.We expect that differences in regulation related to trading, leverage, disclosure,liquidity, and transparency between HMFs and HFs, as well as differences inincentive compensation plans, will cause HMFs to underperform HFs. Thus, wepropose the following hypothesis:
Regulation and Incentives Hypothesis. Given the more stringent regulations andweaker incentives faced by HMFs as compared to HFs, we expect HMFs to un-derperform HFs.
While Table 1 provides initial evidence that HFs outperform HMFs on a risk-adjusted basis, these univariate statistics do not control for fund characteristics,past performance, and other factors shown to be related to hedge fund and mutualfund returns. Hence, we estimate the following regression using annual data forall three fund types (HMF, TMF, and HF):
where PERFi,t and PERFi,t−2 are the performance measures of fund i in years tand t−2, respectively; HF is an indicator variable that equals 1 if the fund is an HFand 0 otherwise; HMF is an indicator variable that equals 1 if fund is an HMF and0 otherwise (hence, the missing variable represents TMF); SIZEi,t−1 is the sizeof the fund measured as the natural logarithm of the assets under management(AUM) for fund i during year t − 1; AGEi,t−1 is the logarithm of age of fund i atthe end of year t − 1; EXPENSEi,t−1 is the expense ratio of fund i during yeart− 1; FLOWi,t−1 is the percentage money flow in fund i in year t− 1; I(YEARt)
Agarwal, Boyson, and Naik 285
is a year dummy that takes a value of 1 during year t and is 0 otherwise; and ξi,tis the error term. Since the total load and turnover variables are not available forHFs, they are not included in equation (1).
Since the regressions use annual data, but the dependent variable is measuredusing 24-month alphas, there is overlap in the dependent variable of one year. Thisoverlap causes misstatement in the standard errors, as noted by Petersen (2009). Inaddition, as noted by Brav (2000), cross-sectional correlation between fund resid-uals in the same year can also lead to improperly stated standard errors. To correctfor these potential problems, as well as any unobserved autocorrelation, we useWhite (1980) standard errors adjusted to account for autocorrelation within twoseparate “clusters”; clusters include both “fund” and “time.”20 In addition, we lagthe performance measures used as independent variables by two periods to en-sure that the independent and dependent variables also have no overlap.21 Finally,as HF returns are known to have a nonnormal distribution, we adjust for this ef-fect on finite-sample inference by using bootstrapped standard errors with 1,000replications. Hence, throughout the paper, we report the bootstrapped p-values.22
Since the omitted dummy variable in this regression is the TMF variable, apositive coefficient on the HF dummy variable (which we find) indicates that HFsoutperform TMFs. This difference is quite large, ranging from 41.4 basis points(bps) per month (approximately 5.0% per year) to 79.0 bps per month (approxi-mately 9.5% per year), and is consistent with prior HF literature; for example, seeAckermann et al. (1999) and Liang (1999). However, our focus is not on compar-ing HFs with TMFs, but rather on testing the Regulation and Incentives Hypoth-esis, which compares the performance of HFs to that of HMFs. Thus, a positiveand significant difference (HF − HMF) indicates support for the Regulation andIncentives Hypothesis.
For the four- and seven-factor models, using both gross and net alphas, wefind strong support for the hypothesis: HFs outperform HMFs in a statisticallyand economically significant way (at the 1% level). The differences in net-of-feeperformance range from 19.1 bps to 27.9 bps per month (roughly 2.3% to 3.3%per year) for the four- and seven-factor models, respectively. The corresponding
20This correction is also known as the Rogers (1993) correction, and controls for autocorrelationover the entire time series of each fund’s observations. This adjustment may be contrasted with theNewey and West (1987) correction for autocorrelation, which can be specified up to a particular laglength. As Petersen (2009) notes, the Rogers (1993) correction produces unbiased estimates, while theNewey and West (1987) correction will lead to biased estimates (although the longer the lag length,the smaller the bias). The approach also controls for cross-correlation, to address the issue noted byBrav (2000). Petersen (2009) describes the approach that we follow in this paper, where we cluster onboth fund and time to adjust standard errors for both types of potential auto- and cross-correlation. Wethank Mitchell Petersen for providing us the STATA code for this analysis.
21We acknowledge that this imposes a survival requirement of four years for funds to be includedin our sample. This type of bias is referred to as look-ahead bias (Carpenter and Lynch (1999)). Inour defense, we offer two explanations for why this should not affect our results. First, since we areinterested in relative and not absolute performance of HMFs, such bias should not materially affectour results, as it should affect both the TMFs and HMFs. Second, for robustness, we exclude laggedalpha from our regression as an independent variable, which reduces the survival requirement to twoyears. Our results remain unchanged with this alternative specification.
22One could also conduct this analysis (and all analyses in the paper) at the monthly level ratherthan at the annual level. Later, we test the robustness of our findings using monthly data and find thatall our results continue to hold.
286 Journal of Financial and Quantitative Analysis
differences for gross-of-fee alphas range from 31.4 bps to 40.7 bps per month(roughly 3.8% to 5.0% a year). The gross results are larger, since HFs chargehigher fees than do HMFs. We attribute these differences in performance to lighterregulation and better incentives in HFs. Moreover, the statistical significance ofthese results is quite impressive, given the small sample size of HMFs.
To summarize, our results in this section strongly support the Regulationand Incentives Hypothesis. HFs outperform HMFs, indicating that using strate-gies similar to HFs cannot alone overcome the regulatory and incentive-basedconstraints of mutual funds. However, while HFs outperform HMFs by a signif-icant margin (2.3% to 5.0% per year), it is not nearly as large as the margin ofoutperformance of HFs over TMFs (5.0% to 9.5% per year). This implies thatHMFs are adding value relative to TMFs. This result leads naturally to our test ofthe Strategy Hypothesis.
V. Testing the Strategy Hypothesis
The second hypothesis is as follows:
Strategy Hypothesis. HMFs should outperform TMFs due to major differences instrategy.
HMFs use strategies such as “Long/Short Equity” that are not commonlyused by TMFs. The ability to profit from both long and short trades in equitymarkets with lower systematic risk should enable HMFs to outperform TMFs. Weuse the regressions presented in Table 2 to test the Strategy Hypothesis. A positiveand statistically significant coefficient on the HMF indicator variable indicatesthat HMFs outperform TMFs (the omitted variable).
The results in Table 2 strongly support the Strategy Hypothesis. For all fourregression specifications, HMFs outperform TMFs at a statistically significantlevel. The differences in performance range from 21.5 bps (2.6% per year) for thegross four-factor model to 40.2 bps (4.9% per year) for the net seven-factor model.This finding is encouraging. Despite the heavy regulations of the mutual fundindustry, the trading strategies employed by HMFs can be successful in improvingperformance. This result is even more impressive considering the higher expenseratios of HMFs relative to TMFs.
For robustness, we also conduct a matched-sample analysis to compare theperformance of three categories of funds: HFs, HMFs, and TMFs. For this pur-pose, each year we match each of the HMFs first with HFs and then with TMFsthat follow the same strategy, have similar AUM, and have been in existence forthe same length of time (i.e., variable AGE). We follow a one-to-one matchingprocedure and report the results from the nonparametric Wilcoxon signed ranktests in Table 3.23 The results from the matched-sample procedure confirm ourearlier findings from multivariate regressions in Table 2. In particular, we con-tinue to find that HFs outperform HMFs with differences ranging from 35 bps to38 bps per month using gross-of-fee returns, and from 28 bps to 33 bps per month
23Davies and Kim (2009) show that following this practice increases the statistical power of thetests and provides better test properties.
Agarwal, Boyson, and Naik 287
TABLE 2
Performance of Hedged Mutual Funds, Traditional Mutual Funds, and Hedge Funds
Table 2 reports the results from the following OLS regression (equation (1)) using annual data for the period 1994 to 2004:
where PERFi,t is the performance measure of fund i in year t ; HF is a dummy that equals 1 if the fund is a hedge fundand 0 otherwise; HMF is a dummy that equals 1 if the fund is a hedged mutual fund and 0 otherwise; PERFi,t−2 is theperformance measure of fund i during year t − 2; SIZEi,t−1 and AGEi,t−1 are the logarithms of fund size and age,respectively, of fund i at the end of year t − 1; EXPENSEi,t−1 and FLOWi,t−1 are the expense ratio and percentagemoney flows, respectively, in fund i in year t − 1; I(YEARt ) is a year dummy that takes a value of 1 during year t and is 0otherwise; and ξi,t is the error term. Performance measures are the alphas from the Carhart (1997) four-factor model andthe Fung and Hsieh (2004) seven-factor model, estimated each year using 24 months of net- and gross-of-fee returns. SinceHF and HMF dummy variables are included, the omitted category is TMF. The p-values using bootstrapped (with 1,000replications) White (1980) standard errors adjusted for autocorrelation within two clusters (also known as the Rogers (1993)standard errors with “clustering” at the fund level and at “time” level) are shown below the coefficients in parentheses. Thedifference between the coefficients on HF and HMF is also reported, and F-tests for the significance in this difference areperformed. Coefficients marked with ***, **, and * are significant at the 1%, 5%, and 10% levels, respectively.
Includes time-trend dummies Yes Yes Yes YesNo. of fund-years 13,892 16,843 13,023 15,891
Difference between HF and HMF 0.314%*** 0.191%*** 0.407%*** 0.279%***
TABLE 3
Matched-Sample Results for Hedged Mutual Funds, Traditional Mutual Funds,and Hedge Funds
Table 3 provides the means of performance measures, including alphas from the Carhart (1997) four-factor model andthe Fung and Hsieh (2004) seven-factor model, estimated each year using 24 months of net- and gross-of-fee returns, formatched samples of HMFs, TMFs, and HFs, and differences of means and results of a Wilcoxon signed-rank test for thedifferences. The sample of HMFs is matched with that of TMFs and HFs, using size, age, and investment objective eachyear. Differences marked with ***, **, and * are significant at the 1%, 5%, and 10% levels.
288 Journal of Financial and Quantitative Analysis
using net-of-fee returns. This result confirms the support for the Regulation andIncentives Hypothesis. In addition, we continue to find that HMFs significantlyoutperform TMFs by 15 bps to 34 bps per month on a gross-of-fee basis, andby about 29 bps per month on a net-of-fee basis. This result lends support to theStrategy Hypothesis.
We also perform a number of other robustness checks for our empirical testsin Section VI.B. Our results continue to hold. In the next section, we investigatewhether strategy alone is driving these results, or if there is a further explanation—notably, manager skill.
VI. Testing the Skill Hypothesis
A. Regression Analysis
The previous section provides evidence that HMFs outperform TMFs basedon strategy. In this section, we investigate whether skill is also driving this out-performance. The data set of HMFs has a unique feature: roughly one-half of theHMFs have managers that concurrently manage HFs. We hypothesize that thisexperience should be advantageous when managing HMFs:
Skill Hypothesis. HMFs managed by HF managers will outperform those that arenot.
To test this hypothesis, we subdivide the sample of HMFs into those fundshaving HF managers and those without. We gather information regarding man-agers from a variety of sources. The first approach is to match the manager name,management company name, and/or fund name from the CRSP database with theHF database (TASS). We find nine matches in this way, all of which we verify us-ing the second approach of searching on the mutual fund company’s Web site forthe manager’s information and the additional funds he/she manages. This infor-mation is reported in the fund’s statement of additional information (SAI), whichfunds are required to file regularly with the SEC (available from funds’ Web sitesor http://www.sec.gov). We also perform a broad Internet search for interviewswith the manager in which he/she specifically discusses his/her management ofboth an HMF and an HF.
Using this search process, we identify 27 HMFs with HF managers and 25with TMF managers. Interestingly, 12 of the 14 defunct HMFs belong to the lat-ter category, providing preliminary support for the Skill Hypothesis. We createan indicator variable set to 1 for the years when the HMF has an HF manager(HFM YES) and 0 otherwise. We also create a variable set to 1 if the HMF has aHF manager (HFM NO) and 0 otherwise. Effectively, we are splitting the HMFindicator variable from Table 2 into two separate variables.
To formally test the Skill Hypothesis, we estimate the following multivariateregression:
with all remaining variables as defined in equation (1); ψi,t is the error term.Again, the missing variable is TMF.
We perform the same regression analysis as in Table 2, but with the newindicator variables. If the Skill Hypothesis holds, then the difference between theHFM YES and HFM NO variables will be positive and statistically significant.
The results in Table 4 support the Skill Hypothesis. In both gross regressionspecifications, the difference between HFM YES and HFM NO is positive andstatistically significant (see last row of Table 4), and the differences range from alow of 22.9 bps per month (2.8% annually) for the four-factor gross return modelto a high of 35.8 bps per month (4.4% annually) for the seven-factor gross re-turn model. For net-of-fee returns, although the difference is positive, it is notstatistically significant.24 In addition, the coefficient on the HFM YES variableis always positive and statistically significant, while that on the HFM NO vari-able, although always positive, is only statistically significant for net returns. Thissuggests that our earlier result of HMFs outperforming TMFs is at least partiallydriven by those HMFs that are run by HF managers.
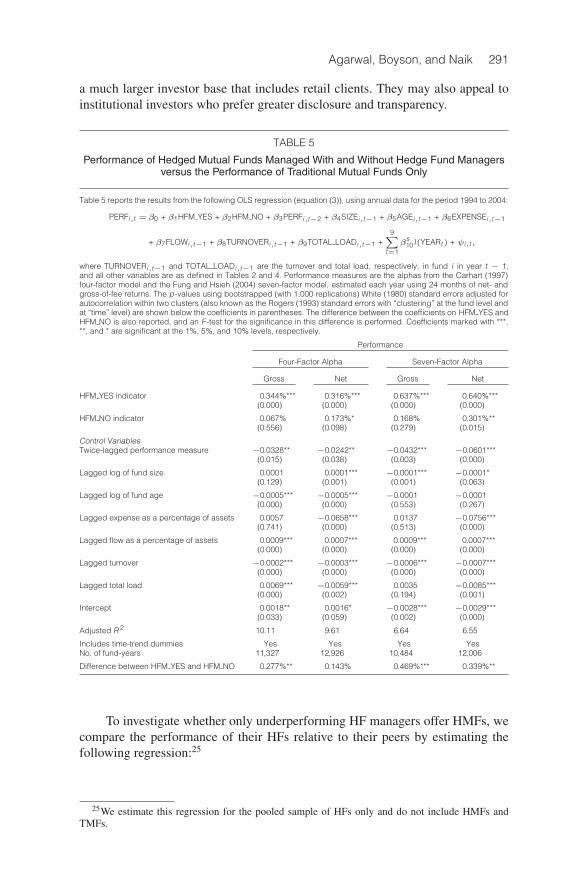
Our regression in equation (2) does not control for turnover and total load,since data on these variables does not exist for HFs. Therefore, as an additionaltest of the Skill Hypothesis, we use a pooled sample of HMFs and TMFs only (weexclude HFs) and estimate the following regression:
All variables are as in equation (2). TURNOVER is the fund’s annual turnoverprovided by CRSP, and TOTAL LOAD is the weighted average of load fees. Theresults, presented in Table 5, provide even stronger support for the Skill Hy-pothesis. It appears that including the load (TOTAL LOADi,t−1) and turnover(TURNOVERi,t−1) variables is important in this regression. Both of these vari-ables are significant in all but one of the four specifications. In three of the fourregression specifications, managers with HF experience significantly outperformthose without. This outperformance ranges from 27.7 bps to 46.9 bps per month(3.3% to 5.6% per year).
24When we repeat our analysis using the matched sample procedure (results not reported inTable 4), we do find the difference based on four-factor net alphas to be positive and significant (9 bpsper month). Furthermore, the difference based on gross alpha varies from 14 bps to 21 bps per monthusing the two models.
290 Journal of Financial and Quantitative Analysis
TABLE 4
Performance of Hedged Mutual Funds With and Without Hedge Fund Managers,Traditional Mutual Funds, and Hedge Funds
Table 4 reports the results from the following OLS regression (equation (2)) using annual data for the period 1994 to 2004:
where HFM YES (HFM NO) is a dummy variable that equals 1 for a hedged mutual fund that has (does not have) a hedgefund manager and 0 otherwise; ψi,t is the error term. Other variables are as defined in Table 2. Performance measures arethe alphas from the Carhart (1997) four-factor model and the Fung and Hsieh (2004) seven-factor model, estimated eachyear using 24 months of net- and gross-of-fee returns. The p-values using bootstrapped (with 1,000 replications) White(1980) standard errors adjusted for autocorrelation within two clusters (also known as the Rogers (1993) standard errorswith “clustering” at the fund level and at “time” level) are shown below the coefficients in parentheses. The differencesbetween the coefficients on HFM YES and HFM NO, as well as between HF and HFM YES, are also reported, and F-testsfor the significance in these differences are performed. Coefficients marked with ***, **, and * are significant at the 1%,5%, and 10% levels, respectively.
Includes time-trend dummies Yes Yes Yes YesNo. of fund-years 13,892 16,843 13,023 15,891
Difference between HF and HFM YES 0.251%*** 0.167%** 0.307%*** 0.213***Difference between HFM YES and HFM NO 0.229%* 0.074% 0.358%** 0.203%
Finding support for the Skill Hypothesis indicates that retail investors canbenefit from the skills of HF managers within the regulatory environment of mu-tual funds. A natural question related to this finding is: “Why would HF managerschoose to enter the mutual fund area, given its more stringent regulatory restric-tions, tighter investment constraints, and lack of performance-based incentives?”We explore two possible, although not mutually exclusive, explanations. The firstis that perhaps only HF managers who underperform their peers elect to offerHMFs. The second is that these HF managers may be using HMFs to raise assetsthrough alternative means. While it is likely that HF managers prefer the freedomand higher fees associated with HFs, if they are having difficulty attracting assetsin their HFs, HMFs may be attractive, as they can be advertised and marketed to
Agarwal, Boyson, and Naik 291
a much larger investor base that includes retail clients. They may also appeal toinstitutional investors who prefer greater disclosure and transparency.
TABLE 5
Performance of Hedged Mutual Funds Managed With and Without Hedge Fund Managersversus the Performance of Traditional Mutual Funds Only
Table 5 reports the results from the following OLS regression (equation (3)), using annual data for the period 1994 to 2004:
where TURNOVERi,t−1 and TOTAL LOADi,t−1 are the turnover and total load, respectively, in fund i in year t − 1,and all other variables are as defined in Tables 2 and 4. Performance measures are the alphas from the Carhart (1997)four-factor model and the Fung and Hsieh (2004) seven-factor model, estimated each year using 24 months of net- andgross-of-fee returns. The p-values using bootstrapped (with 1,000 replications) White (1980) standard errors adjusted forautocorrelation within two clusters (also known as the Rogers (1993) standard errors with “clustering” at the fund level andat “time” level) are shown below the coefficients in parentheses. The difference between the coefficients on HFM YES andHFM NO is also reported, and an F-test for the significance in this difference is performed. Coefficients marked with ***,**, and * are significant at the 1%, 5%, and 10% levels, respectively.
Includes time-trend dummies Yes Yes Yes YesNo. of fund-years 11,327 12,926 10,484 12,006
Difference between HFM YES and HFM NO 0.277%** 0.143% 0.469%*** 0.339%**
To investigate whether only underperforming HF managers offer HMFs, wecompare the performance of their HFs relative to their peers by estimating thefollowing regression:25
25We estimate this regression for the pooled sample of HFs only and do not include HMFs andTMFs.
292 Journal of Financial and Quantitative Analysis
All variables are as in equation (2) except for the variable “HF with HMF,”which is an indicator variable set to 1 if the HF manager concurrently managesan HMF and 0 otherwise. A positive coefficient on this variable indicates that theHFs of HF managers that also have HMFs outperform other HFs. We report ourfindings in Table 6. The results in Panel A show that the coefficients on the in-dicator variable are positive, although not statistically significant. This suggeststhat the performance of HFs offered by managers who also run HMFs fares noworse than that of other HFs. As a robustness check, we repeat our analysis usinga matched-sample procedure, as before. The results in Panel B of Table 6 corrob-orate the results in Panel A from the multivariate regression. Overall, these resultsindicate that poor HF performance does not drive managers into offering HMFs.
Next, we investigate the possibility that HF managers offer HMFs to gatherassets. As argued in Section I, it is difficult for smaller HFs to raise assets dueto reputational effects and restrictions on advertising. Since it is difficult to testthis idea empirically due to the small sample of HF managers who also manageHMFs, we first conduct interviews with two managers who offer both HFs andHMFs (Dennis Bein of Analytical Investors and Lee Schultheis of Alpha HedgedStrategies). Both state that gathering AUM is a key reason to concurrently man-age HFs and HMFs.26 We then review a number of recent articles supporting theidea that lesser-known HF managers have difficulty attracting assets, and that theHMF space allows them to grow their assets and establish a stable revenue base(see Appendix B for detailed quotes from these articles). Hence, we concludethat raising assets is a reasonable rationale for why some HF managers also offerHMFs. To summarize, this section’s results provide strong evidence in support ofthe Skill Hypothesis.
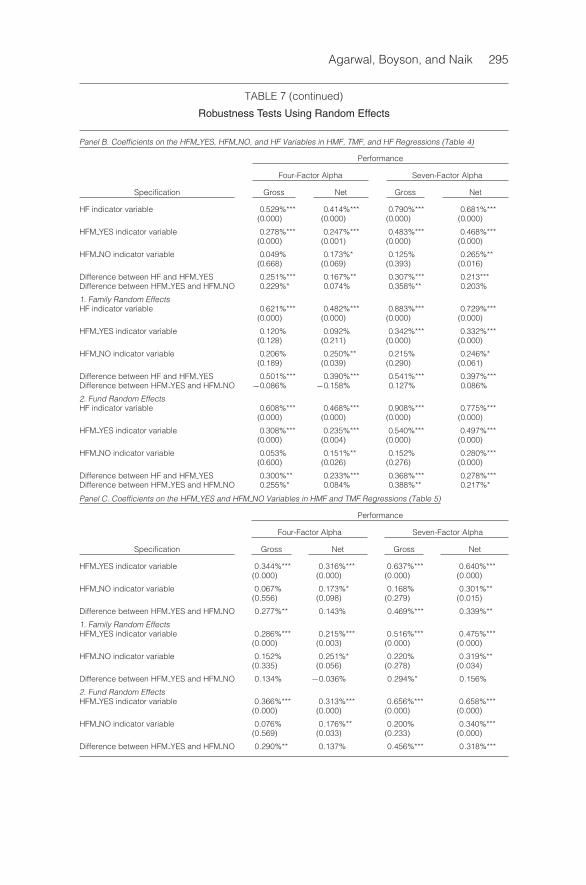
B. Robustness Tests
We perform several robustness tests to check the validity of our results. First,to control for fund-specific and management-company-specific effects, we repeatall our analyses with management-company random effects and fund random ef-fects. We report results for all the analyses in Table 7. For ease of comparison,the first row repeats the findings from the main tables. Panels A, B, and C of
26Bein believes that there are additional benefits from offering HMFs concurrently, namely open-ing up the firm’s products to the retail space and having a stable base of assets earning a fixed fee.Schultheis notes that institutions and fund-of-hedge-funds investing in HFs prefer larger funds. Healso makes the point that it is often very difficult for HF managers to gather assets beyond their initialforay into the market. As a result, many of these smaller HFs have to sell portions of their firms toventure capitalists (VCs) to achieve critical AUM or to survive in the long term. Offering HMFs con-currently provides them an alternative way to increase AUM, revenues, and long-term sustainabilitywithout giving up any equity to VC firms.
Agarwal, Boyson, and Naik 293
TABLE 6
Performance of Hedge Funds Run Along With Hedged Mutual Funds
Panel A of Table 6 reports the results from the following OLS regression (equation (4)), using annual data for the period1994 to 2004:
where HF with HMF is a dummy variable that equals 1 for a hedge fund that is offered along with a hedged mutual fund(HMF) and 0 otherwise, and all other variables are as defined in Tables 2, 4, and 5. The p-values using bootstrapped (with1,000 replications) White (1980) standard errors adjusted for autocorrelation within two clusters (also known as the Rogers(1993) standard errors with “clustering” at the fund level and at “time” level) are shown below the coefficients in parentheses.Performance measures are the alphas from the Carhart (1997) four-factor model and the Fung and Hsieh (2004) seven-factor model, estimated each year using 24 months of net- and gross-of-fee returns. Panel B of Table 6 provides the meansof performance measures for matched samples of HFs that are offered along with HMFs—HFs with HMFs—versus theothers—HFs without HMFs. It also provides the differences of means between these two groups and results of a Wilcoxonsigned-rank test for the differences. The sample of HFs is matched using size, age, and investment objective each year.Coefficients marked with ***, **, and * are significant at the 1%, 5%, and 10% levels, respectively.
Includes time-trend dummies Yes Yes Yes YesNo. of fund-years 2,639 3,979 2,639 3,979
Panel B. Comparison of Average Performance Measures for Matched Samples of Hedge Funds that are Offered Alongwith Hedged Mutual Funds and Those that are Not Offered Concurrently with Hedged Mutual Funds
Performance Measure Mean: HFs with HMFs (A) Mean: HFs without HMFs (B) Difference (A− B)
Table 7, respectively, corresponding to Tables 2, 4, and 5, indicate that the re-sults for HMFs, HFs, and TMFs are robust to the use of alternative econometricspecifications.
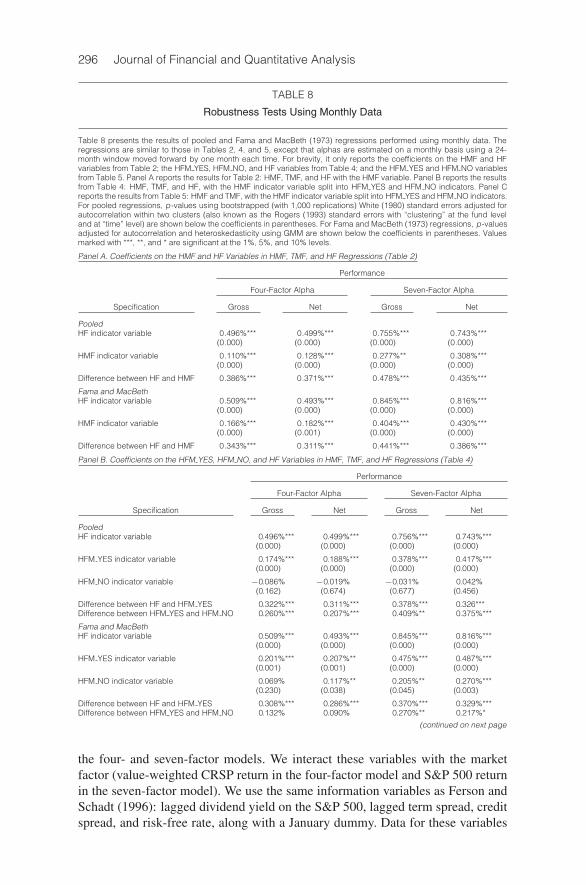
Second, we repeat all our analyses using monthly data instead of annualdata. Although monthly data provide many more observations, they also intro-duce significant serial correlation in alphas, as they are estimated each monthusing a 24-month rolling window. We conduct this analysis using both pooledand Fama and MacBeth (1973) regressions and report our findings in Table 8,
294 Journal of Financial and Quantitative Analysis
TABLE 7
Robustness Tests Using Random Effects
Table 7 presents the results of robustness tests to various econometric techniques for the regressions performed in Tables2, 4, and 5. It presents fund- and family-level random effects regressions for each of the previous tables. For the sake ofcomparison, it also reports the results from Tables 2, 4, and 5 in the first row. For brevity, it only reports the coefficients onthe HMF and HF variables from Table 2, the HFM YES, HFM NO, and HF variables from Table 4, and the HFM YES andHFM NO variables from Table 5. Panel A reports the results for Table 2: HMF, TMF, and HF with the HMF variable. PanelB reports the results from Table 4: HMF, TMF, and HF, with the HMF indicator variable split into HFM YES and HFM NOindicators. Panel C reports the results from Table 5: HMF and TMF, with the HMF indicator variable split into HFM YESand HFM NO indicators. The p-values using bootstrapped standard errors with 1,000 replications are shown below thecoefficients in parentheses. Values marked with ***, **, and * are significant at the 1%, 5%, and 10% levels, respectively.
Panel A. Coefficients on the HMF and HF Variables in HMF, TMF, and HF Regressions (Table 2)
Difference between HF and HMF 0.378%*** 0.263%*** 0.487%*** 0.358%***
(continued on next page)
carefully controlling for autocorrelation (clustering on both fund and month) andusing bootstrapped standard errors with 1,000 replications to account for the non-normality in the distribution of alphas. The double clustering in pooled regres-sions adjusts for serial as well as cross-sectional correlation in residuals. For theFama and MacBeth (1973) regressions, we adjust the standard errors for autocor-relation and heteroskedasticity using the generalized method of moments (Hansen(1982)) procedure. Our findings continue to provide strong support for our threehypotheses.27
Third, we repeat our analysis with alphas estimated from conditional models(e.g., Ferson and Schadt (1996)) instead of unconditional models. It is importantto note that our use of 24-month rolling windows to estimate “unconditional”alphas does allow for time variation in alphas and betas.28 Nevertheless, for ro-bustness, we also conduct our analysis using conditional alphas and report ourfindings in Table 9. Specifically, we introduce lagged “information variables” to
27We also repeat our entire analysis using the Fama and MacBeth (1973) approach applied to annualdata. While the annual results are qualitatively similar the monthly results, the statistical significanceis lower due to fewer observations.
28Ferson and Schadt ((1996), p. 426, footnote 1) acknowledge this by stating “Sirri and Tufano(1992) use rolling regressions for Jensen’s alpha, an approach that may approximate conditionalbetas.”
Agarwal, Boyson, and Naik 295
TABLE 7 (continued)
Robustness Tests Using Random Effects
Panel B. Coefficients on the HFM YES, HFM NO, and HF Variables in HMF, TMF, and HF Regressions (Table 4)
Difference between HFM YES and HFM NO 0.290%** 0.137% 0.456%*** 0.318%***
296 Journal of Financial and Quantitative Analysis
TABLE 8
Robustness Tests Using Monthly Data
Table 8 presents the results of pooled and Fama and MacBeth (1973) regressions performed using monthly data. Theregressions are similar to those in Tables 2, 4, and 5, except that alphas are estimated on a monthly basis using a 24-month window moved forward by one month each time. For brevity, it only reports the coefficients on the HMF and HFvariables from Table 2; the HFM YES, HFM NO, and HF variables from Table 4; and the HFM YES and HFM NO variablesfrom Table 5. Panel A reports the results for Table 2: HMF, TMF, and HF with the HMF variable. Panel B reports the resultsfrom Table 4: HMF, TMF, and HF, with the HMF indicator variable split into HFM YES and HFM NO indicators. Panel Creports the results from Table 5: HMF and TMF, with the HMF indicator variable split into HFM YES and HFM NO indicators.For pooled regressions, p-values using bootstrapped (with 1,000 replications) White (1980) standard errors adjusted forautocorrelation within two clusters (also known as the Rogers (1993) standard errors with “clustering” at the fund leveland at “time” level) are shown below the coefficients in parentheses. For Fama and MacBeth (1973) regressions, p-valuesadjusted for autocorrelation and heteroskedasticity using GMM are shown below the coefficients in parentheses. Valuesmarked with ***, **, and * are significant at the 1%, 5%, and 10% levels.
Panel A. Coefficients on the HMF and HF Variables in HMF, TMF, and HF Regressions (Table 2)
Difference between HF and HFM YES 0.308%*** 0.286%*** 0.370%*** 0.329%***Difference between HFM YES and HFM NO 0.132% 0.090% 0.270%** 0.217%*
(continued on next page
the four- and seven-factor models. We interact these variables with the marketfactor (value-weighted CRSP return in the four-factor model and S&P 500 returnin the seven-factor model). We use the same information variables as Ferson andSchadt (1996): lagged dividend yield on the S&P 500, lagged term spread, creditspread, and risk-free rate, along with a January dummy. Data for these variables
Agarwal, Boyson, and Naik 297
TABLE 8 (continued)
Robustness Tests Using Monthly Data
Panel C. Coefficients on the HFM YES and HFM NO Variables in HMF and TMF Regressions (Table 5)
Difference between HFM YES and HFM NO 0.143%* 0.098% 0.261%*** 0.211%**
are from CRSP and the U.S. Federal Reserve Web site (http://www.federalreserve.gov/).
Conditional models have not been used frequently in the HF literature,mainly due to the relatively short time frame for which HF data is available. The
TABLE 9
Robustness Tests Using Alphas from Conditional Models
Table 9 presents the results of robustness tests using conditional alphas instead of unconditional alphas for the regressionsperformed in Tables 2, 4, and 5. This table reports the results for alphas from the Carhart (1997) four-factor model andthe Fung and Hsieh (2004) seven-factor model, estimated each year (for annual regressions) and each month (for monthlyregressions) using 24 months of net- and gross-of-fee returns. For brevity, it only reports the coefficients on the HMF and HFvariables from Table 2; the HFM YES, HFM NO, and HF variables from Table 4; and the HFM YES and HFM NO variablesfrom Table 5. Panel A reports the results for Table 2: HMF, TMF, and HF with the HMF variable. Panel B reports the resultsfrom Table 4: HMF, TMF, and HF, with the HMF indicator variable split into HFM YES and HFM NO indicators. Panel Creports the results from Table 5: HMF and TMF, with the HMF indicator variable split into HFM YES and HFM NO indicators.The p-values using bootstrapped standard errors with 1,000 replications are shown below the coefficients in parentheses.Values marked with ***, **, and * are significant at the 1%, 5%, and 10% levels, respectively.
Panel A. Coefficients on the HMF and HF Variables in HMF, TMF, and HF Regressions (Table 2)
Difference between HFM YES and HFM NO 0.112% 0.109%* 0.112% 0.241%***
few academic studies that have been conducted in this area conclude that us-ing conditional models does not improve the estimation of alphas or betas.29 Inaddition, the problem of a short time frame is exacerbated in our sample of HMFs,since many of these funds did not begin until 1998. We use 24-month alphas inall our analyses because, for one thing, this time frame is long enough for esti-mation purposes but short enough that it does not induce too much survivorshipbias or lead to the exclusion of too many HMFs from our sample. We perform
29A few HF papers that have used conditional models tend to use a much longer time frame toestimate alphas. Gupta, Cerrahoglu, and Daglioglu (2003), for example, find that using conditionalmodels does not improve the estimation of alphas or betas. Kazemi and Schneeweis (2003) come to asimilar conclusion using a stochastic discount factor approach.
Agarwal, Boyson, and Naik 299
both monthly and annual analyses using the conditional alphas estimated from24-month rolling windows.
The results from conditional models in Table 9 continue to strongly supportthe Regulation and Incentives Hypothesis as well as the Strategy Hypothesis. Thesupport for the Skill Hypothesis is marginally weaker from a statistical standpoint,although the signs on the coefficients are always consistent with the results inTables 2, 4, 5, and 9.
We conduct four more robustness checks. For the sake of brevity, we sum-marize the findings without reporting them in tabular form. First, we repeat ouranalysis using only the sample period from 1998 to 2004, since there appears alarge increase in the number of HMFs between 1997 and 1998 (the sample growsfrom 15 to 27 funds). We believe that this increase is due to the repeal of the“short/short” rule, which constrained mutual funds to receiving less than 30%of their gross income from sales of securities held for less than three months.Violation of this rule resulted in tax penalties on short-term gains, restrictingfunds from investing in derivatives, as most options and futures contracts ma-ture within three months and can thereby result in short-term gains.30 With therepeal of the short/short rule, the number of HMFs grew dramatically. Regardlessof whether we use the sample period 1994–2004 or 1998–2004, our results remainsimilar.
Second, we perform a test to determine if the overlap in the independent vari-able affects the results, although we do control for this bias by adjusting standarderrors for clustering on both time and fund effects. We split the sample into twosubsamples using odd and even years, still using the double-clustering approachto control for autocorrelation and cross-sectional correlation. The results for thesplit sample are similar to results for the combined sample.
Third, we examine whether our results are sensitive to general market condi-tions. For this purpose, we divide the sample period into “up” years (1995–1999and 2003) and “down” years (1994, 2000–2002, and 2004), based on the me-dian return of the S&P 500 index during the sample period. We then reestimateall regressions from Tables 2, 4, and 5 for these two subperiods. The results donot change: HMFs outperform TMFs, and funds with HFM YES = 1 outperformthose with HFM NO = 1, regardless of market conditions.
Finally, we perform tests of performance persistence within the subsampleof HMFs, to determine whether HMFs with HF managers (HMF YES = 1) havebetter performance persistence than those without (HMF NO = 1). We followBrown and Goetzmann (1995) and Agarwal and Naik (2000) and rank each HMFrelative to all other HMFs during the year as either a “winner” (W) or a “loser”(L). Using the cross-product ratio test as well the z-statistic per Malkiel (1995),we find strong evidence of positive performance persistence among HMF YESfunds and also find some evidence of negative performance persistence amongHMF NO funds. These results on persistence provide additional support for theSkill Hypothesis.
30See Yi and Kim (2005) for a good description of the short/short rule and the implications of itsabolition for mutual funds.
300 Journal of Financial and Quantitative Analysis
The results of these tests unequivocally support our three hypotheses andindicate that they are not an artifact of the use of econometric methodologies(pooled vs. Fama and MacBeth (1973)), choice of asset pricing models (condi-tional vs. unconditional), and estimation of alphas at different horizons (monthlyvs. annual).
VII. Conclusion
This paper provides the first comprehensive examination of hedged mutualfunds. We define hedged mutual funds as mutual funds that intentionally emulatehedge fund strategies to enhance performance. We test three hypotheses using dataon hedged mutual funds (HMFs), traditional mutual funds (TMFs), and hedgefunds (HFs) following similar investment styles.
The first hypothesis, the Regulation and Incentives Hypothesis, posits thatHMFs will underperform HFs, due to differences in regulations and incentives.This hypothesis holds true. HMFs significantly underperform HFs, both on a net-of-fee basis (by as much as 4.1% per year) and on a gross-of-fee basis (by roughly5.6% per year). We infer that the tighter regulatory environment in TMFs, whichlimits funds’ borrowing to one-third of their assets and requires daily liquidityand pricing and coverage of short positions, constrains the ability of HMFs toimplement strategies as effectively as in the HF environment. Also, HMFs haveweaker incentives to deliver superior performance in the absence of performance-based compensation. Thus, it is not surprising that, as a group, HMFs stronglyunderperform HFs.
Next, the Strategy Hypothesis predicts that HMFs will outperform TMFs,since HMFs possess greater investment flexibility, use strategies that take advan-tage of good market conditions as well as bad, and profit from both long and shortpositions in the market. Arguably, greater flexibility is associated with a potentialincrease in agency costs. However, our finding that HMFs outperform TMFs byapproximately 2.6% to 4.8% per year suggests that the benefits of greater flexibil-ity outweigh the increase in agency costs.
Furthermore, the Skill Hypothesis provides an additional explanation forthe superior performance of HMFs relative to TMFs. Specifically, the hypothesispredicts that managers with experience in HF trading strategies will outperformmanagers without this experience. We find strong support for this prediction.Managers with HF experience outperform those without by approximately 3.3%to 5.6% per year.
Finally, we provide evidence that it is not the poorly performing HF man-agers who choose to offer HMFs. Anecdotal evidence seems to suggest that thisphenomenon is driven by the desire of HF managers to have a diversified clientbase as well as to raise more assets. Taken together, our findings suggest thatproviding greater flexibility to HMFs through a wider investment opportunity sethelps them to outperform TMFs. This is especially true for HMFs that are runby managers with experience in implementing hedge-fund-like strategies. Thesefindings have important implications for investors seeking hedge-fund-like expo-sure at a lower cost and within the comfort of a regulated environment.
Agarwal, Boyson, and Naik 301
Appendix A. Hedged Mutual Fund Sample SelectionProcess
To select the sample of HMFs, we begin with the Morningstar and Lipperlists. Morningstar categorizes HMFs as Long/Short Equity funds, while Lipperdivides funds into two categories: “Long/Short” and “Equity Market Neutral.” Aslong as a mutual fund is on either of the lists, we include it in the sample. Thisprocess results in 26 unique funds.31 There are two major issues with using onlythe Morningstar and Lipper data to compile the sample. First, since these cate-gorizations are quite new (they were implemented in early 2006), defunct fundsare not included on either of the lists. Second, a handful of other mutual fundsusing HF strategies such as merger arbitrage, managed futures, multi-strategy,and event driven are not picked up by Morningstar or Lipper. We address both is-sues by searching news archives (including Morningstar’s Web site, Lexis/Nexis,and http://www.google.com) for articles regarding HMFs. In addition, we searchthe Morningstar and CRSP mutual fund databases using the following searchterms: “long/short,” “short,” “option,” “market neutral,” “arbitrage,” “hybrid mu-tual fund,” “hedged mutual fund,” “merger,” “distressed,” “hedged,” and “alterna-tive.” From this search, we identify 90 additional possibilities for inclusion in thesample.
We next examine these funds to determine if they implement hedge-fund-likestrategies. Since the focus of this paper is on equity funds, our first criterion forinclusion is that the fund must have an equity-based trading strategy. Using thiscriterion, we exclude five funds from the sample that follow fixed-income or bal-anced strategies. Second, we exclude passive funds. This simple criterion allowsus to eliminate more than half of the remaining funds.32 Usually through the useof futures contracts, the eliminated funds track the performance of market indicessuch as the S&P 500. Although these funds have “flexible” trading programs anduse derivative securities, they are passively managed in terms of stock-picking.Thus, we exclude these funds. Third, we exclude funds that fall into the categoryof “short-only” or “bear market.” While this is an HF strategy, we identify onlyfour mutual funds that appear to follow an “active” short-only strategy, which weexclude from our sample.33 Fourth, of the remaining funds, we first identify thosedefunct funds that followed long/short equity strategies during their existence. Wedo not rely solely on the fund names, as these might sometimes be misleading (seeCooper, Gulen, and Rau (2005)). Instead, for each of the defunct funds, we review
31There are only a small number of funds on Lipper’s list of equity market neutral funds, all ofwhich are included on Morningstar’s Long/Short list. Hence, we simplify the nomenclature and referto the funds on these lists as “Long/Short Equity.” The key theoretical difference in Long/Short Eq-uity and Equity Market Neutral funds is that Equity Market Neutral funds have the specific goal ofreducing market risk to a very low level—for example, it is common for Equity Market Neutral fundsto have market betas of close to zero. A Long/Short equity fund, by contrast, does not always strive tobe market neutral, and typically has a positive, although not too large, market beta.
32Specifically, we exclude a number of mutual funds offered by Rydex and ProFunds, two fundfamilies that offer a variety of mutual funds in the “enhanced index” category.
33However, there are a number of passive short-only funds that attempt to replicate the inverseperformance of an index. Many of these are offered by the ProFunds and Rydex families.
302 Journal of Financial and Quantitative Analysis
prospectuses and annual reports from the SEC going back to 1994, the first yearfor which the SEC has electronic filings. After careful review of all annual reportsand prospectuses, we include additional defunct funds in the sample by imposingthe same criterion that Morningstar uses in compiling its long/short list: namely,that the fund have at least 20% short exposure each year.34 Using this approach,we identify 13 defunct long/short mutual funds that would have been included onMorningstar’s list had it categorized funds in this manner historically. This bringsour sample to a total of 39 funds.
After the exclusion of funds from the original list of 90 possibilities, we aredown to 17 funds, two of which are defunct at the end of the sample period. Wecarefully review the annual reports and prospectuses of each of these 17 funds.Of these, seven describe popular HF strategies in their prospectuses. Of the 10 re-maining funds, a review of annual reports and prospectuses reveals that all use HFstrategies that would be categorized as “other/multi-strategy.” For each of thesefunds, we also identify at least one manager interview in which the fund is de-scribed as “using a hedge fund strategy.” Hence, of these 17 funds, we excludethe funds-of-funds and tentatively include the remaining 15 funds in the sample.
We then follow a statistical approach. Since most long/short HFs minimizemarket exposure, we use a fund’s “market beta” as the final selection criterionby applying the following test: the fund’s average 24-month “market beta” (thecoefficient on the market factor in Carhart’s (1997) four-factor model) must beless than the highest market beta from the combined Morningstar/Lipper fundlist.35 Using the highest market beta for the Morningstar/Lipper list of 0.81 asthe cut-off criterion removes five funds from the list of 15. The 10 remainingfunds have market betas ranging from 0.35 to 0.76. Thus, we add these 10 funds,bringing the sample to 49.
Finally, as a last step to ensure that we are including all HMFs, we conductthe “beta test.” It is possible that we have omitted funds from our sample eitherbecause they had no news stories or their names did not include any of our originalsearch terms. For this test, we calculate the mean two-year, four-factor market betafor the 49 funds already selected for the sample as 0.36. We then calculate the two-year, four-factor market betas for each of the remaining equity funds in CRSP(excluding the 49 funds in our HMF sample). We next review the prospectusesand annual reports for more than 500 funds in the CRSP database that have betasless than 0.36. This helps us identify three additional funds that fit our criteria,bringing our final sample to 52 funds, 14 of which are defunct.36
34Per discussion with Dan McNeela of Morningstar on June 7, 2006.35We thank Dennis Bein of Analytical Investors for helping us define this general criterion.36We confirm that the low market betas of excluded funds occur for a number of reasons, the most
common being that: i) the fund does not follow a primarily equity-based strategy, ii) the fund is asector fund that has low exposure to the market factor, iii) the fund is a very small fund, iv) the fund isinvested primarily in cash, and v) the fund is on the verge of closing and is in the process of liquidatingits assets.
Agarwal, Boyson, and Naik 303
Appendix B. Rationale for Concurrent Management of HedgeFunds and Hedged Mutual Funds
In Table B1, we provide excerpts from recent press articles that suggest thatHF companies may be offering HMFs concurrently to raise assets and diversifytheir client base. We present our clarifications/comments in italics.
TABLE B1
Excerpts from Press Articles Providing Rationale for Concurrent Management of HedgeFunds and Hedged Mutual Funds
Quote Publication Date
What’s more, some HF managers, who historically catered only to themost wealthy, are now offering their services through mutual funds,which are accessible to a wider group of investors.
Denver Post April 17, 2007
Citigroup reports that HF managers are interested in running [HMFs]on behalf of long-only houses as a means of obtaining a higher qualityearnings stream that will not disappear in times of poor performance.
The Financial Times April 16, 2007
[Evan Dick] is chief of the billion-dollar mutual fund based on High-bridge Capital Management’s new statistical arbitrage model. Andchief among his aims has been to bring products that are normallyavailable only to high-net-worth players to ordinary investors. (Thisquote relates to the Highbridge Statistical Market Neutral Fund thatstarted in November 2005 and was advised by Dick. He had sevenyears’ experience at DE Shaw (an HF) and three more years’ experi-ence at Highbridge before opening the HMF. He continues to managethe HF at Highbridge.)
The Edge Financial Daily February 12, 2007
Forward Management . . . now offers the Forward Long/Short CreditAnalysis Fund, run by HF manager Cedar Ridge. The fixed incomeportfolio is designed for wealthy investors, but with a slimmer price tagand the chance to get money out fast. Forward Management PresidentAlan Reid said. “Offering these types of products is a natural reactionto demand in the marketplace.”
Reuters News January 11, 2007
Some HFs are trying to move into traditional portfolio management andbeyond their HF clientele. Kurt Borgwardt, portfolio manager of theAmerican Century Long/Short fund, said, “Hedge funds see it as anextension of what they are already doing. Rather than having mutualfunds creating an area of expertise, why not try to get as much marketshares as they can?” and “It gives hedge funds access to differentparts of the asset allocation pools of institutional investors,” Kirsten Hill,director at Merrill’s Strategic Solutions Group said. “[HMF] productsallow them not just to provide investments for the hedge fund bucketbut also for the equity bucket. It’s a powerful way for them to extendtheir reach to institutional investors.”
HedgeWorld News December 28, 2006
When the fund started in 2002, it was open only to Schwab’s cus-tomers. At the time, companies like Banc of America Securities andOppenheimer Funds were opening HFs with smaller minimum invest-ments to lure the middle class. (This quote is regarding SchwabHedged Fund, one of the HMFs in our sample.)
International Herald Tribune February 17, 2006
“I’m bringing a hedged strategy down to the masses,” said Mr. Jones,founder and president of All Season Financial Advisors Inc. in Denver.(This quote relates to a new hedged mutual fund, Integrity All SeasonFund, sub-advised by Sam Jones, manager of the All Seasons Fund,an HF.)
Investment News May 16, 2005
ReferencesAckermann, C.; R. McEnally; and D. Ravenscraft. “The Performance of Hedge Funds: Risk, Return,
and Incentives.” Journal of Finance, 54 (1999), 833–874.Agarwal, V.; N. D. Daniel; and N. Y. Naik. “Role of Managerial Incentives and Discretion in Hedge
Fund Performance.” Journal of Finance, forthcoming (2009).Agarwal, V., and N. Y. Naik. “Multi-Period Performance Persistence Analysis of Hedge Funds.” Jour-
nal of Financial and Quantitative Analysis, 35 (2000), 327–342.
304 Journal of Financial and Quantitative Analysis
Agarwal, V., and N. Y. Naik. “Risks and Portfolio Decisions Involving Hedge Funds.” Review ofFinancial Studies, 17 (2004), 63–98.
Almazan, A.; K. Brown; M. Carlson; and D. A. Chapman. “Why Constrain Your Mutual Fund Man-ager?” Journal of Financial Economics, 73 (2004), 289–321.
Anderson, J. “Barring the Hedge Fund Doors to Mere Millionaires.” New York Times (December 15,2006).
Asness, C.; R. Krail; and J. Liew. “Do Hedge Funds Hedge?” Journal of Portfolio Management,28 (2001), 6–19.
Baquero G.; J. ter Horst; and M. Verbeek,. “Survival, Look-Ahead Bias, and the Persistence in HedgeFund Performance.” Journal of Financial and Quantitative Analysis, 40 (2005), 493–517.
Boyson, N. M. “Another Look at Career Concerns: A Study of Hedge Fund Managers.” WorkingPaper, Northeastern University (2008).
Brav, A. “Inference in Long-Horizon Event Studies: A Bayesian Approach with Application to InitialPublic Offerings.” Journal of Finance, 55 (2000), 1979–2016.
Brown, K.; V. Harlow; and L. Starks. “Of Tournaments and Temptations: An Analysis of ManagerialIncentives in the Mutual Fund Industry.” Journal of Finance, 51 (1996), 85–110.
Brown, S. J., and W. N. Goetzmann. “Performance Persistence.” Journal of Finance, 50 (1995), 679–698.
Brown, S. J.; W. N. Goetzmann; and R. Ibbotson. “Offshore Hedge Funds: Survival and Performance1989–1995.” Journal of Business, 72 (1999), 91–117.
Brown, S. J.; W. N. Goetzmann; and B. Liang. “Fees on Fees in Funds of Funds.” Journal of InvestmentManagement, 2 (2004), 39–56.
Brown, S. J.; W. N. Goetzmann; and J. Park. “Careers and Survival: Competition and Risk in theHedge Fund and CTA Industry.” Journal of Finance, 56 (2001), 1869–1886.
Carhart, M. M. “On Persistence in Mutual Fund Performance.” Journal of Finance, 52 (1997), 57–82.Carpenter, J. F., and A. W. Lynch. “Survivorship Bias and Attrition Effects in Measures of Perfor-
mance Persistence.” Journal of Financial Economics, 54 (1999), 337–374.Chen, Y.; W. Ferson; and H. Peters. “The Timing Ability of Fixed Income Mutual Funds.” Working
Paper, Boston College (2005).Chevalier, J., and G. Ellison. “Risk Taking by Mutual Funds as a Response to Incentives.” Journal of
Political Economy, 105 (1997), 1167–1200.Chevalier, J., and G. Ellison. “Career Concerns of Mutual Fund Managers.” Quarterly Journal of
Economics, 114 (1999), 389–432.Cici, G.; S. Gibson; and R. Moussawi. “For Better or Worse? Mutual Funds in Side-by-Side Manage-
ment Relationships with Hedge Funds.” Working Paper, University of Pennsylvania (2006).Comer, G. “Evaluating Bond Fund Sector Timing Skill.” Working Paper, Georgetown University
(2005).Cooper, M. J.; H. Gulen; and P. R. Rau. “Changing Names with Style: Mutual Fund Name Changes
and Their Effects on Fund Flows.” Journal of Finance, 60 (2005), 2825–2858.Daniel, K.; M. Grinblatt; S. Titman; and R. Wermers. “Measuring Mutual Fund Performance with
Characteristic-Based Benchmarks.” Journal of Finance, 52 (1997), 1035–1048.Das, S., and R. Sundaram. “Fee Speech: Signaling, Risk-Sharing, and the Impact of Fee Structure on
Investor Welfare.” Review of Financial Studies, 15 (2002), 1465–1497.Davies, R. J., and S. S. Kim. “Using Matched Samples to Test for Differences in Trade Execution
Costs.” Journal of Financial Markets, forthcoming (2009).Deli, D., and R. Varma. “Contracting in the Investment Management Industry: Evidence from Mutual
Funds.” Journal of Financial Economics, 63 (2002), 79–98.Elton, E.; M. Gruber; and C. Blake. “Fundamental Economic Variables, Expected Returns, and Bond
Fund Performance.” Journal of Finance, 50 (1995), 1229–1256.Elton, E.; M. Gruber; and C. Blake. “Survivorship Bias and Mutual Fund Performance.” Review of
Financial Studies, 9 (1996a), 1097–1120.Elton, E.; M. Gruber; and C. Blake. “The Persistence of Risk-Adjusted Mutual Fund Performance.”
Journal of Business, 69 (1996b), 133–157.Elton, E.; M. Gruber; and C. Blake. “Incentive Fees and Mutual Funds.” Journal of Finance, 58
(2003), 779–804.Fama, E. F., and K. R. French. “Common Risk Factors in the Returns on Stocks and Bonds.” Journal
of Financial Economics, 33 (1993), 3–56.Fama, E. F., and J. D. MacBeth. “Risk, Return, and Equilibrium: Empirical Tests.” Journal of Political
Economy, 81 (1973), 607–636.Ferson, W., and R. Schadt. “Measuring Fund Strategy and Performance in Changing Economic Con-
ditions.” Journal of Finance, 51 (1996), 425–461.Frank, M. M.; J. M. Poterba; D. A. Shackelford; and J. B. Shoven. “Copycat Funds: Information Dis-
closure Regulation and the Returns to Active Management in the Mutual Fund Industry.” Journalof Law and Economics, 47 (2004), 515–541.
Agarwal, Boyson, and Naik 305
Fung, W., and D. A. Hsieh. “Empirical Characteristics of Dynamic Trading Strategies: The Case ofHedge Funds.” Review of Financial Studies, 10 (1997), 275–302.
Fung, W., and D. A. Hsieh. “Performance Characteristics of Hedge Funds and Commodity Funds:Natural vs. Spurious Biases.” Journal of Financial and Quantitative Analysis, 35 (2000), 291–307.
Fung, W., and D. A. Hsieh. “The Risk in Hedge Fund Strategies: Theory and Evidence from TrendFollowers.” Review of Financial Studies, 14 (2001), 313–341.
Fung, W., and D. A. Hsieh. “Hedge Fund Benchmarks: A Risk-Based Approach.” Financial AnalystsJournal, 60 (2004), 65–80.
Gaspar, J.; M. Massa; and P. Matos. “Favoritism in Mutual Fund Families? Evidence on StrategicCross-Fund Subsidization.” Journal of Finance, 61 (2006), 73–104.
Getmansky, M.; A. Lo; and I. Makarov. “An Econometric Model of Serial Correlation and Illiquidityin Hedge Fund Returns.” Journal of Financial Economics, 74 (2004), 529–609.
Goetzmann, W. N.; J. Ingersoll; and S. A. Ross. “High-Water Marks and Hedge Fund ManagementContracts.” Journal of Finance, 58 (2003), 1685–1717.
Gupta, B.; C. Cerrahoglu; and A. Daglioglu. “Evaluating Hedge Fund Performance: Traditional versusConditional Approaches.” Journal of Alternative Investments, 6 (2003), 7–24.
Hansen, L. “Large Sample Properties of Generalized Method of Moments Estimators.” Econometrica,50 (1982), 1029–1054.
Jagannathan, R.; A. Malakhov; and D. Novikov. “Do Hot Hands Exist among Hedge Fund Managers?An Empirical Evaluation.” NBER Working Paper No. 2015 (2006).
Jegadeesh, N., and S. Titman. “Returns to Buying Winners and Selling Losers: Implications for StockMarket Efficiency.” Journal of Finance, 48 (1993), 65–91.
Jensen, M. “The Performance of Mutual Funds in the Period 1945–1964.” Journal of Finance, 23(1968), 389–416.
Kacperczyk, M.; C. Sialm; and L. Zheng. “Unobserved Actions of Mutual Funds.” Review of FinancialStudies, 21 (2008), 2379–2416.
Kazemi, H., and T. Schneeweis. “Conditional Performance of Hedge Funds.” Working Paper, Univer-sity of Massachusetts Amherst (2003).
Koski, J., and J. Pontiff. “How are Derivatives Used? Evidence from the Mutual Fund Industry.”Journal of Finance, 54 (1999), 791–816.
Kosowski, R.; N. Y. Naik; and M. Teo. “Do Hedge Funds Deliver Alpha? A Bayesian and BootstrapAnalysis.” Journal of Financial Economics, 84 (2007), 229–264.
Liang, B. “On the Performance of Hedge Funds.” Financial Analysts Journal, 55 (1999), 72–85.Liang, B. “Hedge Funds: The Living and the Dead.” Journal of Financial and Quantitative Analysis,
35 (2000), 309–326.Malkiel, B. “Returns from Investing in Equity Mutual Funds 1971 to 1991.” Journal of Finance, 50
(1995), 549–572.Mitchell, M., and T. Pulvino. “Characteristics of Risk and Return in Risk Arbitrage.” Journal of
Finance, 56 (2001), 2135–2175.Newey, W., and K. West. “A Simple, Positive Semi-Definite, Heteroskedastic and Autocorrelation
Consistent Covariance Matrix.” Econometrica, 55 (1987), 703–708.Nohel, T.; Z. Wang; and L. Zheng. “Side-by-Side Management of Hedge Funds and Mutual Funds.”
Working Paper, University of Michigan (2008).Pastor, L., and R. Stambaugh. “Liquidity Risk and Expected Stock Returns.” Journal of Political
Economy, 111 (2003), 642–685.Petersen, M. “Estimating Standard Errors in Finance Panel Data Sets: Comparing Approaches.”
Review of Financial Studies, 22 (2009), 435–480.Rogers, W. “Regression Standard Errors in Clustered Samples.” Stata Technical Bulletin, 13 (1993),
19–23.Sirri, E., and P. Tufano. “Costly Search and Mutual Fund Flows.” Journal of Finance, 53 (1998),
1589–1622.Tiwari, A., and A. Vijh. “Sector Fund Performance: Analysis of Cash Flow Volatility and Returns.”
Working Paper, University of Iowa (2004).Wermers, R. “Mutual Fund Performance: An Empirical Decomposition into Stock-Picking Talent,
Style, Transaction Costs, and Expenses.” Journal of Finance, 55 (2000), 1655–1695.Wermers, R. “The Potential Effects of More Frequent Portfolio Disclosure on Mutual Fund Perfor-
mance.” Investment Company Institute Perspective, 7 (2001), 1–12.White, H. “A Heteroskedasticity-Consistent Covariance Matrix Estimator and a Direct Test for Het-
eroskedasticity.” Econometrica, 48 (1980), 817–838.Yi, J., and M. K. Kim. “Tax-Motivated Trading Strategies of Mutual Funds.” Working Paper, Syracuse