34
Height and Competitiveness Dan Fessler, Uri Gneezy, John List, and Moshe Hoffman 8/21/2010

Height and Competitiveness Dan Fessler, Uri Gneezy, John List, and Moshe Hoffman
8/21/2010
1. Introduction
Taller people are, on average, more successful in labor markets. For example, the tallest
quartile earns 13 percent more than the shortest quartile (Nicola Persico and Andrew Postlewaite
2004), and 30 percent of Fortune 500’s CEOs are above 6’2”, while only 3.9 percent of the U.S.
population is above that height (Malcolm Gladwell 2005). This difference in labor market
success is comparable in magnitude to race and gender differences.
Possible explanations for what drives the effects of height in the labor market include
discrimination (e.g., Eng S. Loh 1993), self-esteem (e.g., Timothy A. Judge and Daniel M. Cable
2004), social skills learned during extracurricular activities in high school (Persico and
Postlewaite 2004), and intelligence due to better nutrition (Anne Case and Christina Paxson
2008). In this paper, we propose an additional explanation: taller individuals are more
competitive.
To test this explanation empirically, we conducted an experiment in which we measured
height and competitiveness in a sample of over 1300 participants. Participants performed a task
and chose how to receive their pay—either according to a piece rate or a winner-take-all scheme.
Allowing them to choose their incentive scheme allowed us to observe the participants’ level of
competitiveness (Uri Gneezy, Muriel Niederle, and Aldo Rustichini 2003; Niederle and Lise
Vesterlund 2007; Gneezy, Kenneth L. Leonard, and John A. List, 2009). We find that, even
while controlling for gender, the tallest quartile are one and a half times more likely to choose
the competitive payment scheme than the shortest quartile, an effect of the same magnitude as
the gender difference. This finding is true in spite of the fact that taller individuals actually
perform more poorly in our task than shorter individuals.

Why might taller people be more competitive?
In physical confrontations, bigger individuals stand a larger chance of winning and a
smaller chance of getting hurt. A plethora of non-human findings support this prediction. Even
animals as primitive as sea anemones, lacking brains, show an increased likelihood of attacking
their fellow sea anemone neighbors, if bigger (Brace and Pavey 1978). Studies looking at
mollusks (Zack 1975), hermit crabs (Mitchell 1976; Dowds and Elwood 1983; Neil 1985), field
crickets (Dixon and Cade 1986), bluegill sunfish (Henderson and Chiszar 1977), brown anoles
(Tokarz 1985), rats (Robitaille and Bovet 1976), and a variety of non-human primates (Smuts,
Cheney, Seyfarth, Wrangham and Struhsaker 1987) document similar results.
In humans, the correlation between size and aggressiveness is also well documented. For
example, height correlates with the frequency of engaging in aggressive acts, such as the number
of fights since age 14 (Aaron Sell, John Tooby, and Leda Cosmides 2009; John Archer and
Vanlal Thanzami 2007). In the classroom setting, teachers report that taller children are more
likely to stand up for themselves, to dominate their classmates, and to tell others what to do.
Taller children were also more likely to end up at the front of the line when the teacher
announced a prize to those who lined up first (Pellegrini et al. 2007). Among adults, heavier
participants, but not lighter participants, showed increased tendencies to electrically shock a
confederate when experimentally intoxicated, presumably because alcohol removes one’s
inhibitions, revealing the natural difference in willingness to shock (Nathan C. Dewall, Brad J.
Bushman, Peter R. Giancola, and Gregory D. Webster 2010). The correlation between size and
aggression appears to generalize beyond situations where physical size influences the chance of
winning or getting hurt, such as responding more favorably to a survey question about the use of
military force in international conflicts (Sell et al. 2009).

Empirically, size seems to matter more for aggression among males than females. For
example, the results of Sell et al. (2009), described above, held only for males. For females, the
correlations between Sell et al.’s measures of size and aggressiveness were one-third the size and
statistically insignificant (whereas correlations with measures of attractiveness showed the
reverse pattern). Likewise, the DeWall et al. (2010) intoxication results reported above hold only
for males. To our knowledge, these are the only two papers on human aggression and size that
report results separately by gender. Our results parallel these findings, being twice the magnitude
for males than for females, and not statistically significant when restricted to females.
2. Experimental Design
Experiments were conducted in eight villages in the Meghalaya region of India. In each
session, we recruited participants in advance, and asked each potential participant to arrive at a
central place in the village (either a school or town hall) at a given time. This procedure
attenuated selection problems, as everyone was interested in participating in the experiment after
they learned pecuniary incentives were involved. Upon arrival at each experimental site,
participants were directed to stand in two separate lines, one for each gender, outside of the
experimental room. An experimenter took the first six participants from each line and explained
the task to the group of 12, with exceptions being made on occasions when less than 12
participants remained or when the lines for males were slightly longer than the lines for females.
Instructions, presented in Appendix A, were translated from English to the local language
(Khasi), then back-translated by a different party into English to check for accuracy. An
experimenter read the instructions aloud to the individual participant. We allocated participants

in such a way as to have an equal ratio of male and female participants in each session. Similarly,
we ensured that the ratio of male and female experimenters was balanced in each session.
The experimental task involved tossing a tennis ball into a bucket three meters away
(Gneezy, Leonard and List, 2009). An experimenter informed participants they would have 10
chances to toss the ball. A successful shot meant the tennis ball entered the bucket and stayed
there. We chose this task because it was simple to explain and implement. Furthermore, we are
aware of no other popular task in this society that is similar to the ball games we employed.
Indeed, the villagers are known archers and play cricket and soccer for sport, but since our task
can only be completed with an underhand toss, the skills practiced for these activites do not give
an advantage to individuals with experience at any of these games. Also, since the bucket was
placed on the floor, in contrast to basketball, taller individuals do not have an advantage. In this
spirit, our data represent signals of initial competitive inclinations, as the task was unfamiliar.
An experimenter explained to our participants, who numbered 1309 in total, that they
were matched with a participant from another group. They received no other information about
the individual with whom they were matched. The only decision participants were asked to make
concerned the manner in which they would be paid for their performance. They made this choice
before performing the task, but only after they fully understood the instructions and the payment
schemes. Participants chose between two options, namely (a) 20 Rupees per successful shot
regardless of the performance of the participant from the other group with whom they were
randomly matched, or (b) 60 Rupees per successful shot if they outperformed the other
participant. The experimenter explained that if they chose the second option and scored the same
as the other participant, they would receive 20 Rupees per successful shot. We also asked most
participants to predict their own performance and the performance of the other participant with

whom they were matched. After choosing the incentive scheme and stating their predictions,
participants completed the task and learned how the other participant performed. A subsample of
participants went on to choose incentive schemes again and complete the task once more.
Following the ball-throwing task, participants were asked to solve a puzzle. Participants
formed a line outside a private room or an external location fenced off with tarp and waited until
the experimenter called themparticipant, one by one, to the private area, where the experimenter
explained the task (see Appendix A). An experimenter, who was always the same female
assistant, read the instructions aloud to the individual participant.
The experimental task involved solving a four-piece puzzle. Participants learned that if
they solved the puzzle within 30 seconds, they would receive an additional 20 Rupees. When we
interviewed the participants, none expressed familiarity with puzzles, and we are aware of no
other popular task in this area that is similar to puzzle solving. Finally, participants received their
pay in cash.
We also ran two smaller studies at the University of Chicago and Harvard. The first of
these was designed to investigate whether participants believed that gender and height would
influence performance on the ball-throwing task, as such beliefs could plausibly influence
participants’ decisions. At the University of Chicago, we showed 38 undergraduate participants
photographs of villagers in India performing the ball throwing task and asked them whether they
believed men would be better than women, whether women would be better than men, or
whether we would see no difference at this task. Additionally, we asked whether taller men
would be better than shorter men, whether shorter men would be better than taller men, or

whether we would see no difference. We randomly selected one participant to receive $10 for
each question that he or she answered correctly.
The purpose of the second smaller study was to investigate whether the effect of height
would generalize to other populations and other tasks. At Harvard, we asked participants to
choose between payoff schemes similar to those employed in India, except the task involved
solving mazes instead of throwing balls into buckets. We recruited participants through fliers
distributed on the Harvard University campus and through email solicitation to undergraduate
residential houses in the spring of 2007. A total of 98 male participants between the age of 18
and 23 years participated in the study, out of which 97 completed the competition task.
Each participant first received a practice maze and learned he would solve mazes similar
to the practice one for five minutes. Before solving the mazes, participants chose between two
payment options: (a) 25 cents per maze regardless of the performance of the last participant who
had completed the study, or (b) 75 cents per maze if the participant solved at least as many
mazes as the person who had last completed the study. If the participant chose the competitive
scheme and solved fewer mazes than the person who had last completed the study, he received
$0.
3. Results
Of the 1318 Indian villagers recruited to participate in the ball-throwing task, 22 were
dropped because of missing data (either their height or their gender was not coded). As detailed
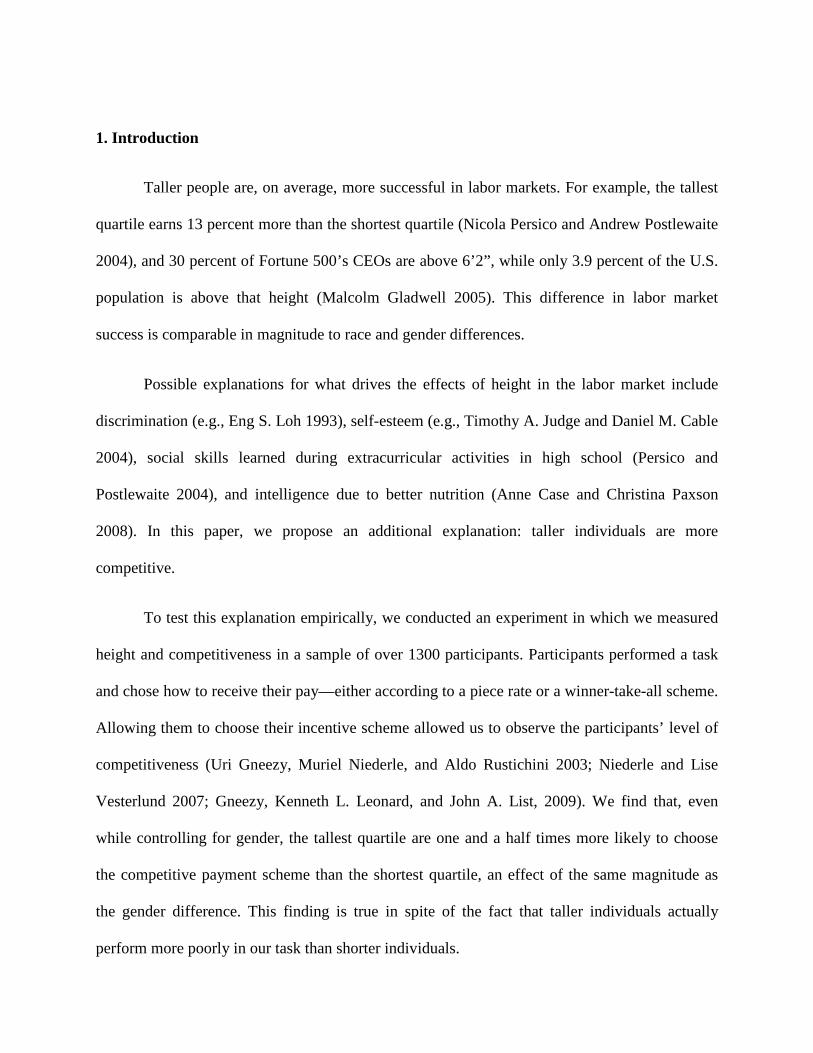
in Table 1, in the remaining sample of 1296 (52.6% female), height appears normally distributed,
with a difference in mean height of 11.3 cm between men and women.

Table 2 presents the main results. In total, 38.1 percent of the men and 23.8 percent of
women in our sample chose to compete. Without controlling for gender, each centimeter
increases the chance of competing by .9 percent (t-test, 2 sided t=5.84 p-value <.001) (see Figure
1). Controlling for gender, each centimeter still increases the chance of competing by .6 percent
(OLS, t=2.80, 2 sided p-value =.004). To see the magnitude of this effect, after demeaning by
gender, the tallest quartile is 1.5 times as likely to compete as the shortest quartile, an effect that
is nearly as large as the effect of gender alone (men being1.6 times as likely to compete as
women).
Gender
When regressing competitive choice on gender, the gender coefficient greatly reduces
when we add height as a control. Without height as a control, the gender coefficient is .143; with
height as a control, the gender coefficient drops to .074, half of its original magnitude.
Researchers have suggested differences in competitiveness as an explanation for the
gender gap in labor markets (Gneezy, Niederle and Rustichini, 2003). Since men are taller than
women, and our hypothesis predicts a relation between height and competitiveness within
gender, we expect height to explain some of the between-gender difference in competitiveness.
In fact, we find the relationship between height and competitiveness reduces the gender gap in
competitiveness by 50 percent, indicating that part of the gender gap in labor market outcomes
may be due to height.
However, how we interpret the drop in the gender coefficient rests heavily on whether we
believe the within-gender effect of height works the same as the between-gender effect of height.
One possibility is that both males and females adjust their aggressiveness in light of how tall they

are relative to the entire population, and since males are on average taller than females, males
become more aggressive. An alternative possibility is that males and females form their
aggressiveness based on how tall they are relative to other members of their own gender, and, for
unrelated reasons, males compete more than females, and males are taller than females. Our data
cannot parse these two possibilities; however, if we think of aggression as being mostly acts
against members of one’s own gender, the latter interpretation would be more consistent with our
overarching logic.
The above findings raises the possibility that the fact that men are taller contributes to the
gender gap in wages. Indeed, using PSID 2007 data, we find that the gender gap in wages
reduces by half when height is added as a control variable. Restricting our sample to those who
are heads of households or wives of heads of households (N=6485), and controlling for age, each
inch adds 2.3 percent to wages, which is consistent with estimates of height on wages studied
elsewhere (e.g. Nicola Persico and Andrew Postlewaite 2004). In the same sample, women earn
26.7 percent less than men per hour when we do not control for height. However, when we
control for height, the gender coefficient drops to 13.5 percent. However, once again, how this
result should be interpreted is debatable. The interpretation rests on the counterfactual: would the
gender gap in wages be reduced if the distribution of height for women was shifted upward to be
identical to that of men? If one believes that the effect of height on wages operates in the same
manner within as between genders, one would predict the gender gap in wages to go down by 50
percent in this counterfactual. However, if one believes that height leads to higher wages within
each gender but not across genders, then the gender gap in wages would not drop in this
counterfactual.

Gender and Height
The aggression explanation presented in the Introduction entails the important prediction
that the effect of height on competitiveness will interact with gender. Specifically, we predict
that a man’s relative height will have a stronger effect on his decision to compete than a
woman’s relative height will have on her decision. Our data support this prediction.
Consistent with our aggression explanation, the effect is stronger for males than females
(see figures 2 and 3). When looking only at males, we find that each centimeter adds .8 percent
to the probability of competing (OLS, t=2.43 sided p-value=.015). When looking only at
females, we find that each centimeter adds .4 percent to the probability of competing (OLS,
t=1.44 2 sided p-value=.150). Thus, the effect for females is only half the magnitude of the effect
for males and is not statistically significant (nor is the effect significant for females when we add
a quadratic or cubic term). Note that the standard deviation in height for females is comparable
to that of males (5.71 cm vs. 6.17 cm), and the sample size is in fact larger (682 vs. 614).
Recall from the introduction that the effect of height on aggression is specifically a male
phenomenon. Accordingly, if aggression is what is driving the relationship between height and
competition, than the effect of height on aggression should also be a male phenomenon, as our
results indicate. Alternative explanations for the relationship between height and competitiveness
do not easily explain this result. For instance, if nutrition drives the relationship between height
and competitiveness (better nourished individuals being smarter and taller), then there is no
reason to expect the relationship between height and competitiveness to differ by gender given
that the effect of nutrition on IQ and the effect of nutrition on height are the same for males and
females (Anne Case and Christina Paxson 2008).

Relative Height
Another prediction of our aggression explanation is that competitiveness is influenced not
only by absolute height, by also by relative height. As an instrument to test this explanation, we
use the different distribution of heights in the eight villages in our sample. We find that, for
males, while controlling for one’s own height, the chance of choosing the competitive option
decreases by .3 percent for every centimeter added to the average height of one’s fellow male
villagers (OLS, t=-1.717, 1 sided p-value=.043; a one-sided p-value is appropriate here since our
aggression hypothesis is only consistent with competitiveness decreasing and not increasing with
the average height of one’s fellow villagers). As predicted, we find no similar effect for females.
Differences in ability?
A possible explanation of the result is that taller participants are better at the task and
hence are more likely to choose to compete. In fact, taller participants were not better at the task.
Comparing ability by height, we find that taller people actually perform more poorly on this task.
After controlling for gender, a one-centimeter increase in height decreases the number of
successful tosses by .024 (OLS, t=-2.88, 2 sided p-value=.004). When we add the number of
successful tosses as a control variable, the coefficient on height does not change, nor does its p-
value (coefficient .006, p-value=.004).
Even if taller participants are no better at the task, our participants may still expect taller
participants to be better at the task. To test for beliefs regarding the correlation of height and

performance in this task, we asked 38 students at the University of Chicago to view photographs
of our Indian villagers who performed the task and then indicate “Who do you think performed
the best (circle one)? The tallest participants, the shortest participants, or no difference?” 11
(29%) participants thought taller villagers would outperform shorter individuals. The same
question was asked regarding men or women and 24 (63%) thought men would outperform
women, indicating that participants did not simply think that everyone would perform the same.
Granted, participants at the University of Chicago might hold different beliefs about the
influences of height and gender on performance in the ball-throwing task compared to
participants in rural India. Moreover, our results were replicated in the Harvard sample, using a
completely different competitive task, one which does not have a stereotypical relationship to
height. Recall, we repeated essentially the same study on 98 male undergraduates at Harvard,
except in this latter sample, we measures competitiveness using a different task; instead of
having participants throw balls into buckets, participants solved mazes. In this sample, each
centimeter increased the probability of the competitive choice by 1.6 percent (p-value=.0087).
However, recall that for most of our Indian participants we collected each
individualparticipant’s predictions regarding the number of successful tosses to be
participantmade by the participant and the number already made by the opponentparticipant.
Consonant with the pattern of beliefs evident in the Chicago data, taller villagers did, in fact,
expect to make more successful tosses. Importantly, however, participants’ beliefs do not
explain much of our result; when we add as control variables the participant’s predictions of own
number of successful tossesparticipant and opponent's number of successful tosses, the height
coefficient remains nearly as large (dropping from .006 to .005) and remains significant (p-
value=.039).

Differences in cognitive abilities
Given that the competitive option in our experiment yielded a higher expected profit, a
potential alternative explanation for our results is that taller individuals chose to compete more
often because they are more intelligent (Case and Paxson, 2008), and hence more likely to select
the option which maximizes expected value; given that the stakes are so small this seems like the
“smarter” choice. . However, three pieces of evidence indicate that differences in cognitive
abilities do not drive our findings.
First, note that we collected a proxy for intelligence: time to solve a puzzle. This measure
does not correlate with competitiveness. Since time to solve the puzzle is log normally
distributed, we first log transform the time to solve the puzzle and find no partial correlation
between this measure and the decision of whether to compete (2-sided p-value =.321) once we
control for gender. Additionally, when we add this variable as a control variable to the regression
of competitiveness on height, the point estimate of height remains identical and the p-value is
still highly significant (OLS, t= 2.71 sided p-value=.007).
Second, recall that, for male participants, relative height as well as absolute height
matters. It is difficult to imagine a situation in which relative height but not absolute height
affects cognitive abilities.
Third, we have shown that the effect of competitiveness on height differs by gender.
However, we have no reason to assume the correlation between height and cognitive abilities is
smaller for females. In fact, in 12 of the 14 measures of cognitive abilities reported by Case and

Paxson (2008), the correlation with height is either exactly the same for males and females or
larger for females.
4. Discussion
Why are taller people more competitive? In physical confrontations, bigger individuals
stand a better chance of winning and a smaller chance of getting hurt. Consider, for example, two
individuals facing one piece of food. If the bigger (presumably stronger) individual were to reach
for the food, the smaller one would be better off giving up, because his chance of winning a fight
is small. One can model the above argument using a hawk-dove game where size is commonly
known. In the Nash equilibrium of this game, the bigger individual plays the hawk and the
smaller individual plays the dove (Maynard Smith, 1982). A plethora of findings discussed in the
Introduction support this prediction.
The aggression explanation predicts a gender difference in the effect of size on
competitiveness. A stronger effect of height on aggression for males makes sense because males
are more likely to resort to physical confrontation.1
1 Males are more likely to directly confront those who have angered them (Ann M. Kring 2000), more likely to employ violence (Mary B. Harris and KellyKnight-Bohnoff 1996; Joycelin M. Pollock and Sareta M. Davis 2005; Paz M. Toldos 2005), and more likely to escalate the altercation to the point of homicide, making them vastly overrepresented as both killers and victims (Martin Daly and Margo Wilson 2001; Rosemary Gartner 1990; Patricia M. Lambert 1994; Joycelin M. Pollock and Sareta M. Davis 2005).
In fact, evolutionary anthropologists explain
the difference in average size and degree of muscularity between men and women precisely in
terms of a prolonged history of greater involvement by men than women in high-stakes physical
confrontations (reviewed in Daniel Fessler, 2010 and David Puts, 2010). Also of interest, this
aggression explanation predicts an effect not merely of absolute size, but of relative size. That is,

if individual A is deciding whether to aggress individual B, not only does the size of individual A
matter but also the size of individual B.
These results are in line with labor market outcomes. The height premium in wages and
occupations is stronger for men than women. In the BHPS data Case et al. (2009) report, each
inch increases the probability a man will be in a high- versus a low-skilled occupation by 16
percent, whereas the increase for women is 5.2 percent. Turning to wages, Case and Paxson
(2008) report the height premium by gender using data from the National Child Development
Study (NCDS), British Cohort Study (BCS), and Panel Study of Income Dynamics (PSID). For
PSID and NCDS, respectively, the height premium is 1.6 and 1.2 times larger for males than for
females. In BCS, on the other hand, the height premium is larger for females. To our knowledge,
Case and Paxson’s BCS finding is the only published report of a larger effect of height on wages
for females than for males, and it is worth noting in this regard that the NCDS and PSID sample
sizes are 10 times and 2.5 times that of BCS, respectively, .
Note that, because education, parental variables, and intelligence all contribute to the
height premium, yet arguably do via pathways that are distinct from our aggression explanation,
our account predicts a larger gender difference in the effects of height on wages after controlling
for these features. Case et al. (2009) report that, once they control for education in the BHPS
sample, each additional inch in height increases wages by .9 percent for men and .5 percent for
women. Case and Paxson (2008) report that, once they control for test scores, personal
characteristics, and parental characteristics, the height premium in NCDS is 1.7 times larger for
males than females. When the authors include height at various ages, the gender difference
becomes even more pronounced. With such controls, F height at no age is significant for
women. Note that since all the above results are for percentage changes in earnings, the numbers

described above understate the gender differences, as women are earning smaller amounts to
begin with. Other papers investigating height premiums report similar gender differences (e.g.,
Eng S. Loh 1993; Timothy A. Judge and Daniel M. Cable 2004). Persico et al. (2004), the other
important economics paper on the height premium, only report analysis for males, so we cannot
address whether they also would have found differences by gender.
The difference in competitiveness as an explanation is consistent with other aspects of the
literature on height differences in labor markets. For example, taller individuals select into
arguably more competitive occupations, and this finding explains about half the height premium
(Case, Paxson and Islam 2009). Participation in extracurricular activities during high school,
arguably a proxy for competitive preferences, explains 38 percent of the height premium
(Persico, Postlewaite, and Silverman 2004).
Our explanation for the height premium also predicts a premium for other correlates of
male formidability. Using an exhaustive sample of an age cohort of males in Sweden, Lundborg,
Nystedt, and Rooth (2009) found that physical strength predicted earnings after controlling for
height. Sparticipants rode on a stationary bicycle for five minutes and the maximal wattage they
attained was recorded. Participants also squeezed a device that measured their handgrip strength.
Those whose maximal wattage was one standard deviation higher than the mean earned 7.8
percent higher wages, and those whose handgrip strength was one standard deviation above the
mean earned 2 percent higher wages.
Our results might have relevance for the gender differences in the labor market. Women
make considerably lower wages than men, work in very different occupations (e.g., Joseph G.
Altonji and Rebecca M. Blank 1999), and do not rise as high in the hierarchy (Marianne Bertrand

and Kevin F. Hallock 2001). As discussed above, previous investigators have suggested
differences in competitiveness as an explanation for this gender gap in labor markets. Since men
are taller than women, height could explain some of the between-gender difference in
competitiveness. Indeed, we find that the relationship between height and competitiveness
reduces the gender gap in competitiveness by 50 percent. However, how we interpret the drop in
the gender coefficient rests heavily on whether we believe the between-gender effect of height
operates in the same manner as the within-gender effect of height. One possibility is that both
males and females adjust their aggressiveness in light of how tall they are relative to the entire
population, and since males are on average taller than females, males become more aggressive.
An alternative possibility is that males and females calibrate their aggressiveness in light of how
tall they are relative to other members of their own gender, and also for unrelated reasons, males
compete more than females, and males are taller than females. For instance, imagine that each
individual calibrates his or her aggressiveness based on fighting experience in highschool.
Imagine that individuals only get in fights with members of their own sex. Imagine that taller
individuals tend to win fights. Imagine that men compete more than females because they have
more testosterone, but imagine testosterone has no affect on height. Imagine that men are taller
than women because they have delayed growth spurts. Our data cannot parse these two
possibilities; however, if we think of aggression as being mostly acts against members of one’s
own gender, the latter interpretation would be more consistent with our overarching logic.
Tables and Figures:
Table 1: Summary Statistics
Male Female Combined
N 614 682 1296
Mean Height 158.3 cm 147.0 cm 152.4 cm
Standard Deviation Height 6.17 cm 5.71 cm 8.18 cm
Mean Time to Solve Puzzle
36.27 sec
43.32 sec 39.95 sec
Standard Deviation Time to Solve puzzle 28.75 sec
38.70 sec
34.47 sec
Percentage Choose to Compete 38.10% 23.80% 30.40%
Table 2 Main Regressions. *
Model 1 Model 2 Model 3 Model 4 Model 5 Model 6 Model 7 Model 8 Model 9.009*** 0.006*** 0.006*** .008** 0.004 0.007*** 0.009*** 0.002[.002] [.002] [.002] [.003] [.003] [.002] [.003] [.003]
0.143*** 0.074** 0.061* 0.09**[.025] [.035] [.036] [.037]
0.021[.022]
y Yes Yes Only Yes Yes eight *-0.002 **-0.003 0.009
[.002] [.002] [.007]1296 1309 1295 1139 614 682 1296 614 682

*OLS. Dependent variable is the probability that a subject in chose to get paid 60 rupees for each successful throw, provided they threw more baskets than an anonymous competitor, as opposed to getting paid 20 rupees for each successful throw, regardless of their competitor’s performance. * indicates significant at .1 level. ** at .05 level. *** at .01 level. Height is in cm. Puzzle is ln of seconds till completed puzzle. Others’ height is average height of other members of own gender within own village in cm.
Figure 1 Effect of Height on Competitiveness, Without Controlling for Gender
Y axis indicates the probability that a subject in the given quartile chose to get paid 60 rupees for each successful toss, provided they had more succesful tosses than an anonymous competitor, as opposed to
getting paid 20 rupees for each successful toss, regardless of their competitor’s performance. N=129

Figure 5.2 Effect of Height on Competitiveness, for Males Only
Y axis indicates the probability that a subject in the given quartile chose to get paid 60 rupees for each successful toss, provided they had more succesful tosses than an anonymous competitor, as opposed to getting paid 20 rupees for each successful toss, regardless of their competitor’s performance. N=613

Figure 5.3 Effect of Height on Competitiveness, for Females Only
Y axis indicates the probability that a subject in the given quartile chose to get paid 60 rupees for each successful toss, provided they had more succesful tosses than an anonymous competitor, as opposed to getting paid 20 rupees for each successful toss, regardless of their competitor’s performance. N=680
Babcock, Linda, and Sara Laschever. 2003. Women Don’t Ask: Negotiation and the Gender Divide. Princeton, NJ: Princeton University Press.
Bertrand, Marianne, and Kevin Hallock. 2001. "The Gender Gap in Top Corporate Jobs.” Industrial and Labor Relations Review, 55(1), 3-21.
Bertrand, Marianne, Claudia Goldin and Lawrence F. Katz.Forthcoming."Dynamics of the Gender Gap for Young Professionals in the Financial and Corporate Sectors.” American Economic Journal: Applied Economics.

Case, Anna, and Christina Paxson.2008. “Stature and Status: Height, Ability, and Labor Market Outcomes.” Journal of Political Economy, 116(3): 499-532.
Case, Anna, Christina Paxson, and Manez Islam.2009. “Making sense of the labor market height premium: Evidence from the British Household Panel Survey.” Economics Letters, 102: 174-176.
Daly, Martin and Margo Wilson. 2001. “Risk-taking, intrasexual competition, and homicide.”Nebraska Symposium on Motivation, 47: 1-36.
Dewall, Nathan C., Brad J. Bushman, Peter R. Giancola, and Gregory D. Webster. “The Big, the Bad, and the Boozed-Up: Weight Moderates the effect of Alcohol on Aggression.” Unpublished.
Fessler, Daniel M.T. 2010. “Madmen: An evolutionary perspective on anger and men’s violent responses to transgression.” In Handbook of anger: Constituent and concomitant biological, psychological, and social processes, ed. Michael Potegal, GerhardStemmler, and Charles D. Spielberger, 361-381. New York: Springer.
Fischer, Agneta H. and Catharine Evers. 2010. “Anger in the context of gender.” In Handbook of anger: Constituent and concomitant biological, psychological, and social processes, ed. Michael Potegal, GerhardStemmler, and Charles D. Spielberger, 349-360. New York: Springer.
Gartner, Rosemary. 1990. “The victims of homicide: A temporal and cross-national comparison.”American Sociological Review, 55(1): 92-106. Gladwell, Malcolm. 2005. Blink: The Power of Thinking Without Thinking. New York: Little, Brown & Company,
Gneezy, Uri, and Aldo Rustichini. 2004. “Gender and competition at a young age,” American Economic Review, 94(2): 377-381.
Gneezy, Uri, and Aldo Rustichini. 2005. “Executives verses Teachers: Gender, Competition and Self Selection.” Unpublished.
Gneezy, Uri, Kenneth L. Leonard, and John A. List. 2008. “Gender Differences in Competition: Evidence from a Matrilineal and a Patriarchal Society,” Econometrica, 77(5): 1637-1664.
Gneezy, Uri, Muriel Niederle, and Aldo Rustichini. 2003. “Performance in competitive environments: Gender differences.” Quarterly Journal of Economics, 118(3): 1049-1074.
Harris, Mary B. and Kelly Knight-Bohnhoff. 1996. “Gender and aggression: II. Personal aggressiveness.” Sex Roles, 35: 27–42.
Hedges, Larry V., and Amy Nowell.1995. “Sex differences in mental test scores, variability, and numbers of high-scoring individuals”, Science, 269: 41–45.
Judge, Timothy A. 2004. “The effect of Physical Height on Workplace Success and Income: Preliminary Test of a Theoretical Model.” Journal of Applied Psychology, 89(3): 428-441.

Lambert, Patricia M. 1994.War and peace on the western front: a study of violent conflict and its correlates in prehistoric hunter-gatherer societies of coastal southern California. University of California, Santa Barbara. Kring, Ann M. 2000.“Gender and anger.” In Gender and emotions: Social psychological perspectives, ed. Agneta H. Fischer,211-231. New York: Cambridge University Press.
Loh, Eng S. 1993. “The Economic Effects of Physical Appearance.” Social Science Quarterly, 74(2): 420-438.
Lundborg, Peter, Paul Nystedt, Dan-OlofRooth. 2009. “The Height Premium in Earnings: The Role of Physical Capacity and Cognitive and Non-Cognitive Skills.” IZA Discussion Paper No. 4266.
Maynard Smith, John. 1982. Evolution and the Theory of Games. New York: Cambridge University Press.
Niederle, Muriel, andLiseVesterlund. 2007. “Do Women Shy away from Competition? Do Men Compete too Much?” Quarterly Journal of Economics, 122(3): 1067-1101.
Pellegrini, Anthony D., Cary J. Roseth, Shanna Mliner, Catherine M. Bohn, Mark Van Ryzin, Natalie Vance, Carol L. Cheatham, and Amanda Tarullo. 2001.“Social Dominance in Preschool Classrooms.” Journal of Comparative Psychology, 121(1): 54-64.
Persico Nicola, and Dan Silverman. 2004. “The Effect of Adolescent Experience on Labor Market Outcomes: The Case of Height.” Journal of Political Economy, 112(5): 1019-1053.
Pinker, Steven. 2002. The Blank Slate: The Modern Denial of Human Nature. New York: Viking Penguin. Pollock, Joycelin M., and Sareta M. Davis. 2005. “The continuing myth of the violent female offender.” Criminal Justice Review, 30(1), 5–29.
Puts, David A. 2010. “Beauty and the beast: mechanisms of sexual selection in humans.” Evolution and Human Behavior 31(3), 157–175.
Sell, Aaron, John Tooby, and Leda Cosmides. 2009. “Formidability and the logic of human anger.” Proceedings of the National Academy of Science, 106(35): 15083-15078.
Toldos, Paz M. 2005. “Sex And age differences in self-estimated physical, verbal and indirect aggression in Spanish adolescents”. Aggressive Behavior, 31(1): 13-23.
Yee, Nick, and Jeremy Bailenson. Forthcoming. “The Proteus Effect: The Effect of Transformed Self-Representation on Behavior” Human Communication Research.


APPENDIX A
INSTRUCTIONS FOR COMPETITION MEASURE
Welcome to this study of decision-making. The experiment will take about 20 minutes. The instructions are simple, and if you follow them carefully, you can earn a considerable amount of money. All the money you earn is yours to keep, and will be paid to you, in cash, in private, at the end of today. Your confidentiality is assured.
Pay attention to these instructions. Please do not talk with each other from this point on. If you have a question, you can raise your hand and ask. Otherwise, please be quiet and listen carefully. After the instructions are finished, we will take you inside and you will play the game.
The task that we ask you to perform is throwing this ball into a bucket from a line. (Show them the ball, bucket and line). You will have 10 chances and you will be paid for your performance. Before you do the task, you will have a choice between 2 ways of earning money.
Option 1 (Individual Payment): If you choose this option, you receive 20 rupees for each ball you throw in successfully.
Option 2 (Tournament): If you choose this option, your performance will be compared with a random person from another group. You will receive a reward only if you succeed more times than this person. If you succeed more times than your opponent and win the competition, you will be paid 60 rupees for every ball you throw in successfully. So if you succeed once, then you will get 60 rupees. If you succeed 2 times, then you will get 120 rupees. If you succeed 3 times you will get 180 rupees and so on. But you will only receive a reward if you are better than your opponent. Otherwise you will get zero. If you both succeed the same number of times, you get 20 rupees for each success.
Do you have any questions?

In a few minutes, we will take you inside to play the game. Inside, we will ask you individually/privately which option you would like to choose.
Khasi:
Ngi pdiang snewbha iaphi sha kane ka jingpule jongka jingshim ia ka rai. Kan shim por tang kumba 20 minit. Ki jingbatai ki long kiba suk ban sngewthuh,bad lada phi bud bniah ia ki, phin kham kamai kham bun. Baroh ka pisa ba phi ioh ka dei ka jong phi ba phin buh, yn siew ia phi, da ka pisa, tang para marwei, ynda la sep ka sngi. Ka jingsngew skhem bad jingshaniah jong phi ia lade ka long ka ba donkam bha.
Mynta ngin batai ia phi shaphang ka rukom lehkai. Sngap bha ia kine ki jingbatai namar ba katba phi nang kham sngewthuh kham bha katta phin nang kham ioh ban kamai kham bun ka pisa. Lada phi don kano kano ka jingkylli, phi lah ban rah ka kti bad kylli. Hyrei te, sngewbha long ki ba sngapjar bad shah shkor bha. Ynda ladep kine ki jingbatai, ngin sa ialam iaphi shapoh ba phin sdang ia ka jingialehkai.
Shwa ba phin sdang, phin jied na kine 2 tylli ki lad bad kamai pisa.
Ka jingjied kaba 1 (Kaba ialeh marwei): La da phi jied ia kane, phin ioh 20 tyngka manla kawei pa kawei ka bol kaba phi lah ban thep ne pynrung.
Ka jingjied daka ba 2 (kompetition/ ka jingiakob): Lada phi jied da kane pat, ia ka jinglah ban lehbha jongphi yn pyniatynjuh bor bad ka ____(green/yellow) krup. Phin ioh ia ka bainong jongphi tang lada phi lah ban leh khambha ban ia u nongialeh pyrshah jongphi. Lada phi lah ban leh khambha ban ia u nongialeh pyrshah jongphi, bad jop ia ka competition, yn siew 60 tyngka manla kawei pa kawei ka bol kaba phi lah ban pynrung. Kumta lada phi lah bah pynrung tang shisien, phin ioh 60 tyngka. Lada phi lah ban pynrung 2 sien, phin ioh 120 tyngka. Lada phi lah ban pynrung 3 sien phin ioh 180 tyngka bad kumta ter ter. Hynrei phin ioh ia kane tang lada phi lah ban leh kham bha ban ia u nongialeh pyrshah jong phi. Lym kumta phin ioh not (zero). Lada baroh ar ngut phi ia long mar kum juh, baroh ar ngut na phi phin ia ioh tang mar 20 tyngka manla kawei pa kawei ka bol kaba phi lah ban pynrung.

Dong kano kano ka jingkylli?
Tang hapoh khyndiat minit, ngin sa ialam ia phi shapoh ba phin ioh ban leh kai. Ynda phi la don hapoh, ngin sa kylli iaphi para marwei kano napdeng kane ka jait jingialehkai phi kwah ban ialehkai. Ngi ruh ngin sa iathuh iaphi, shwa ba phin jied, ia u nongialeh pyrshah jongphi lada dei u ne ka.
Shwa ban gin leit shapoh, ngin ia peit katto katne ki nuksa:
Before you go inside, let us give the following examples:
(Ask control questions to the whole group)
(Pyrshang kylli jingkylli ia ka krup baroh kawei)
• “If I choose the individual payment (that is, if I do not choose competition), and I throw in 5 balls successfully how much money do I get?”
Khasi:
• “Lada nga jied da kaba ialehkai marwei (katta kamut, lada ngam treh ban ialeh da ka kopetition ), bad lada nga rung 5 tylli ki bol katno ka pisa nga dei ban ioh?”
• “If I choose to compete and I throw in 3 balls successfully and my opponent makes 2 balls, how much money do I get?
Khasi
• “Lada nga jied ban ialehkai daka kompetition bad nga lah ban pynrung 3 tylli ki bol bad u nongialeh pyrshah jong nga u pynrung 2 tylli, katno ka pisa nga dei ioh?”
• “If I choose to compete and I throw in 4 balls successfully and my opponent throws in 5 balls, how much money do I get?
Khasi

• “Lada nga jied ban ialehkai daka kompetition bad nga pynrung 4 tylli ki bol bad u nongialeh pyrshah jongnga u pynrung 5 tylli ki bol, katno ka pisa nga dei ban ioh?”
• “If I choose to compete and I throw in 2 balls successfully and my opponent throws in 2 balls also, how much money do I get?”
Khasi:
• “Lada nga jied ban ialehkai daka competition bad nga pynrung 2 tylli ki bol bad u nongialeh pyrshah jongnga ruh u pynrung 2 tylli ki bol, katno ka pisa nga dei ban ioh?”
Do you have any questions?
Don kano kano ka jingkylli?
(Take them into the room)
Khasi:
(Ialam ia ki sha ka kamra)
INSTRUCTIONS TO BE READ INSIDE
Remember that with Option 1 (individual pay), you get 20 rupees per successful throw. With Option 2 (tournament), you get 60 rupees per successful throw if you are better than your opponent, zero if you are worse, and 20 rupees per successful throw if your performance is the same.
Khasi:
Kynmaw ba lada phi jied da kaba nyngkong (kaba kamai marwei shimet), phin ioh 20 tyngka manla kawei pa kawei ka bol ba phi lah ban pynrung. Lada phi jied da kaba 2 pat (da kaba ialeh da ka competition pat ) phin ioh 60 tyngka manla kawei pa kawei ka bol lada phi leh khambha ban ia u nongialeh pyrshah jong phi, phin ym ioh eiei lada phi rem, bad 20 tyngka lada jia ba phi ialong mar katjuh.

We have matched you with someone from the next room, who is doing the same task as you. NO SEX INFORMATION GIVEN! If you choose competition, we will compare your performance with this person. Now, please tell us which option you would like to choose—individual pay (Option 1) or competition (Option 2).
Khasi: Ngi la pyniabuh mangi ia u nognialehpyrshah jongphi naka _____(YELLOW/GREEN) krup. ______U/ka briew (**iathuh lada dei kynthei/shynrang katkum ka jingthoh ha ka sex column, ia u/ka nongialeh pyrshah**). Lada phi jied da ka competition, phi hap ban iakhun pyrshah ban _____u/ka. Mynta, Sngewbha iathuh ia ngi kano napdeng kine ki lad phin jied ban iakeh kai − Kaba kamai marwei shimet (lada phi jied da kaba nyngkong) lane da ka kompetition (lada phi jied da kaba ar)
(Record this under 1st stage choice)
Khasi:
(Thoh ia kane ha ka “choice” column haka bynta ba nyngkong u lain ba nyngkong jong ka rekod sheet)
Now, we will ask you to tell us how many successful shots out of 10 you think you are going to make. You will be paid an additional 10 rupees if your guess is correct.
Khasi:
Mynta, ngin kylli ia phi katno sien phi lah ban pynrung na ka 10 tylli ki bol. Phin ioh tam 10 tyngka lada phi lah thik ban pynrung kumba phi ong.
(Record this under Guess(own)!)
Khasi:
(Thoh ia kane kaka “Guess”column (jong u)!)

(RA Says): Remember that there is a person in the next room you were matched with. How many successful shots out of 10 do you think that person will make (he or she, don’t say specific sex!!!)? You will be paid an additional10 rupees if your guess is correct.
Re-translate:
Khasi:
(RA Ong): kynmaw ba don ____(u briew/ka briew) uba phi hap ban ialeh pyrshah ha ka wei pat ka kamra. Katno tylli tharai (U/KA) kin lah ban pynrung ia ka bol? Phin ioh tam 10 tyngka lada phi ong thik katba u ne ka ki lah ban pynrung.
(Record this under Guess(other)!)
(Thoh ia kane!)
Khasi:
(Thoh ia kane kaka “Guess”column (jong u nongialeh pyrshah)!)
[The guesses are recorded on the record sheet]
Khasi:
[ ki jingtharai lah buh jingthoh ha ka kot thoh]
Now you can start throwing the balls.
Khasi:

Mynta phi lah ban sdang ban kawang ia ka bol.
[Subject throws 10 balls, helper puts a check on the sheet for each ball made, adds]
Khasi:
[ki nongiashimbynta kin kawang ia ki shiphew tylli ki bol, ki nongiarap kin buh jingthoh ia ki bol kawei pa kawei ka bol kaba rung bad sa khein lang.]
NOTE TO RA’s: AT THIS POINT YOU GO AND MEET WITH THE RA’s FROM OTHER ROOM. COMPARE A1 with B1, A2 with B2 etc. Then, give feedback to your subject, depending on if she did better/worse than opponent. If your subject got more balls in than opponent, say:
“you did better than the person you were matched with, he or she did worse than you”. MAKE SURE TO SAY THIS RIGHT!!!!!THIS IS VERY IMPORTANT.
Re-translate according to the above!!! Naka bynta ki RA’s: Pule na ki sheets ki jong phi.
Khasi:
Phi la lah ban pynrung ____sien. U/ka nongiashim bynta ha kawei pat ka karma kala dep hi. Ka kham lah ban pynrung kham _____ (bun/duna) ban ia phi
Stage 2: Now we will repeat the same game with another 10 balls. Like before, you will again have the chance to choose between the two payment schemes. Your opponent will be the same person you were matched with in the first stage.
Khasi:
Bynta ba 2: Ngin pynialeh biang ia kajuh sa 10 tylli ki bol. Kumba leh mynne, phin ioh ban jied na ar jiad ki rukom ialehkai. U/ka nongiashim bynta kin dei hi kijuh kiba phi ialeh mynne

Remember, with Option 1 (individual pay), you receive 20 rupees for each ball you throw in successfully.
Khasi:
Kynmaw, da kaba jied da kaba nyngkong (kaba kamai marwei shimet) phin ioh 20 tyngka manla kawei pa kawei ka bol kaba phi thep
With Option 2 (tournament), you receive 60 rupees per ball but only if you succeed more times than the woman/man you were matched with. Otherwise you will get zero. If you both succeed the same number of times you will both get 20 rupees for each success.
Khasi:
Lada phi jied da kaba ar pat (competition), phin ioh 60tyngka tang lada phi jop ban ia u/ka nongialeh pyrshah jongphi, lym kumta phin ym ioh eiei. Lada jia ba phi ia ryngkat bor phi ia ioh tang mar 20 tyngka naka bynta kawei pa kawei ka ball ba phi pynrung ha ka borti.
Now, please tell us which option you would like to choose for this stage.
Khasi:
Mynta, iathuh iangi kano ka bynta phinjied
(Record This Under Choice in the Stage 2 Row of Record Sheet)
Khasi:
(Thoh ia kane hapoh ka choice column haka bynta kaba ar jong u lain ba ar!)
Now, we will ask you to tell us how many successful shots out of 10 you think you are going to make. You will be paid an additional 10 rupees if your guess is correct.

Khasi:
Mynta, ngin kylli iaphi katno na ka 10 tylli ki bol phi lah ban pynrung. Phin ioh tam 10 tyngka lada phi dei thik kumba phi ong/iathuh.
How many successful shots out of 10 do you think the person in the next room is going to make? You will be paid an additional 10 rupees if your guess is correct.
Khasi:
Katno tylli ki bol phi tharai ba ka nongialeh pyrshah jong phi ha kawei pat ka karma ka lah ban pynrung? Ngin siew ia phi tam 10 tyngka lada ka dei thik kumba phi ong maphi
[The guesses are recorded on the record sheet]
Khasi:
[ki jingtharai lah buh jingthoh ha ka kot thoh]
Now you can start throwing the balls.
Khasi:
Mynta phi lah ban sdang ban kawang noh ia ka bol.
[Subject throws 10 balls, helper puts a check on the sheet for each ball made, adds]
Khasi:
[ki nongiashimbynta kin kawang ia ki shiphew tylli ki bol, ki nongiarap kin buh jingthoh ia ki bol kawei pa kawei ka bol kaba rung bad sa khein lang.]

APPENDIX b
INSTRUCTIONS GIVEN TO EXPERIMENTER FOR PUZZLE MEASURE
-Scramble puzzle pieces. Lead subject into experimental room. -Then say in Khasi, “in this experiment you will be asked to copy this horse.” Show subject the image of the horse, as well as the four scrambled puzzle pieces. Then solve it once for them, and rescramble. -Then say, “you will be timed while you try to make the horse. If you manage to make the horse within 30 second, you will get paid an additional 20 rupees, in addition to whatever else you have earned so far today. Otherwise, you will not be paid anything for this part of the study, but everything else you have earned beforehand is still yours to keep. Do you have any questions?” -If the subject claims to have finished when in fact the puzzle is not complete, tell the subject there is an error, and point to at least one discrepancy between the image of the horse and the four pieces the subject claims are solved. Do not stop the timer until the subject has actually completed the puzzle.


