82
ADAOG91 5A8 NAVALYTRAINING EQUIPMENT CENTER ORLANDO FL F/G 5/8 SURVEY OF CIG DATA BASE GENERATION FROM IMAGERT(U) SEP AG0 V RAREGLIA UNCLASSIFIED NAVTRAEOUIPCIH-318AN !hELhhEE
ADAOG91 5A8 NAVALYTRAINING EQUIPMENT CENTER ORLANDO FL F/G 5/8SURVEY OF CIG DATA BASE GENERATION FROM IMAGERT(U)
SEP AG0 V RAREGLIA
UNCLASSIFIED NAVTRAEOUIPCIH-318AN
!hELhhEE

UNCLASS1FIEDSECURITY CLASSIFICATION Of THIS PAGE (he Data ntere4D READ_____________________
REPORT DOCUMENTATION PAGE BFRED CONSTC IN1. REPORT NUMBER M~ OVT ACCESSION NO: 3. RECIPIENT'S CATALOG NUMBERINAVTRAEQUIPCEN IH-318 PJA4. TITLE (and Subtitle) 9 YEO EOT6PRO OEE
- - - -Interim Report for PeriodSurvey of CIG Data Base Generation From Imagery, October 1978-December 1979
-S. PERFORMING ORO. REPORT NUMBER
7Ak Skaw I. CONTRACT 0R GRANT NUMNE~rr
~J)Denis R. B 1/ a
9. PERFORMING ORGANIZATION NAME AND ADDRESS 10. PRiOGnAMELEMEN.POET TASKCAdvanced Simulation Concepts Laboratory Code N-73 AREA 8& WORK U'NITUBRS
Naval Training Equipment Center NAVTRAEQUIPCEN Task No. 8734Orlando, FL 32813 _____________
1I. CONTROLLING OFFICENAMEIfAQU- 12. REPORT DATE
*~September 1980TF/~ IS. NUMBER OFPAGES
- 9 7a14. MONITORING A," ALWRESS(U difteremm ftr CmfOVI&Sng1 Office,) IS. SECURITY CILASS. (of thisrpet
IP Ift~,'n t UNCLASSIFIEDIs&. OECL ASSIFICATIOWI DOWNGRADINGF
SCHEDULE
stDisTRi3uTioIO TNT maN1 (Fa this Raiprty
Approved for public release; distribution unlimited.
17. DISTRIBUTION STATEMENT (ofta. abstract antorodi mo ack" . 7ditea dIIust, er Repefoa V1)P
18. SUPPLEMENTARY NOTES
I$. KEY WORDS (Continue on reves side it noesaety mod idandO~ by block mbw"
Computer Image Generation (CIG)
Digital Image ProcessingGeometric Modeling
ABSTRACT (Continue -n roema. aide if nevoeeay ond idonti bp black anna)
* The generation of an environment model for a Computer Image Generation (CIG)system is currently a labor intensive, expensive effort. This report reviewsan extensive amount of literature covering the topics of scene complexityrequirements in a visual simulation system, the structure of the data required4 by existing three-dimensional graphic algorithms, the application of photo-granunetric and digital image processing techniques to assist the modeler, andrecommnendations for a modeling facility.
9/p 0102-01T4-64:011 UNCLASSIFIED8ECURITY CLASBIFICATION OF THIS PASS9 j=rn Data&- Q
NAVTRAEQUIPCEN IH-318
TABLE OF CONTENTS
Section Paqe
I INTRODUCTION....... ..... . . .... .. .. .. .. .. .. ... J
Visual Simulation .. .. .... ..... ..... ..... 3Computer Image Generation Systems. .. .. ..... ..... 4Data Base Content .. .. .... ..... ..... ..... 5Data Base Construction .. .. .. ..... ..... ..... 5Report Summary .. .. .. ..... ..... ..... ... 6
11 SCENE DETAIL REQUIREMENTS .. .. .. ..... ..... ...... 7
Introduction .. ... ..... ..... ..... ..... 7Seeing vs. Perceiving. .. .. ..... ..... ...... 7Visual Capabilities .. .. .... ..... ..... ... 9Visual Task Performance .. .. .... ..... ....... 12Recommendations. .. ... ..... ..... ..... .. 17
III DATA BASE STRUCTURE .. .. .. ..... ..... ..... ... 19
Introduction. .. .. ... ..... ...... .... .. 19Algebraic Surfaces .. .. .. ..... ..... ....... 21Point Set Surfaces .. .. .. ..... ..... ....... 22Parametric Surfaces .. .. .... ..... ..... ... 25Volume Representations. .. .. .... .... ..... .. 27Semantic Representations .. .. .. ..... ..... ... 27Conclusion. .. .. ... ..... ...... ..... .. 28
IV DATA ACQUISITION AND REDUCTION. .. .. ..... ..... ... 29
Introduction. .. .. ... ..... ..... ..... .. 29Stereophotogranunetry. .. .. ... ..... ..... ... 33Digital Image Processing. .. .. ... ..... ...... 42Software Transformation .. .. .... ..... ....... 54
V SYSTEM RECOMMENDATIONS. .. .. ..... ..... ..... .. 56
VI SUMMARY AND CONCLUSIONS .. .. .. ..... ..... ....... 64
Scene Detail Requirements. .. .. ..... ..... ... 64Data Acquisition and Reduction. .. .. ... ..... ... 64
REFE RENCES . ...... 65
-4

NAVTRAEQUIPCEN IH-318
ILLUSTRATIONS
Figure Page
I Image of a Planar Object Perpendicular to the Camera Axis . . . 33
2 Effect of Tilt on Image Point Locations .............. 34
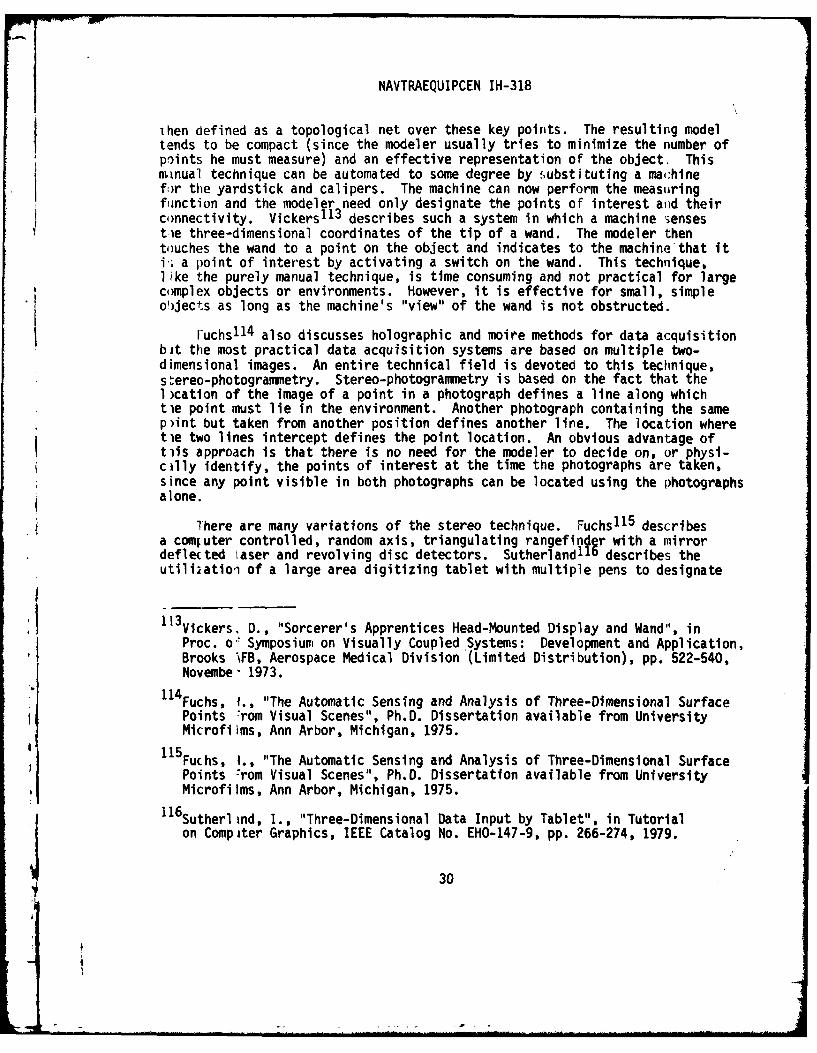
3 Effect of Surface Relief .... ................... .... 35
4 Stereo Geometry ...... ....................... ... 35
5 Projection Plotter ..... .. ...................... 37
6 Wire Frame Model from Stereophotos ..... .............. 13
2

NAVTRAEQUIPCEN IH-318
SECTION I
INTRODUCTION
VISUAL SIMULATION
The function of a visual simulation system in a training device is topresent a view of a simulated real world environment to a weapon systemoperator trainee. Visual simulation technology can be categorized into twobroad technology areas; image generators and displays. An image generatoraccepts information regarding the viewpoint and viewing direction of theobserver and creates the simulated real world imagery in the format suitablefor the display system. The display system then presents the view to theobserver. Image generators contain a physical or mathematical model of areal world environment from which the required view or scene information isobtained. An example of an image generator which uses a physical model is asystem which employs a television camera and a three-dimensional scaledterrain model board for simulating a pilot's view as he flies over the terrain.A computer image generator (CIG), on the other hand, processes a mathematicalmodel of the visual environment to produce the required scene information.Prior to the advent of CIG technology, the camera-modelboard type of systemdominated image generator technology. The reasons for the current trendtoward CIG technology have been summarized by Wekwerth1. The areas of com-
parison included; depth of focus (limited with camera at low altitudes),stability (degradation of electro/mechanical components with camera system),gaming area (modelboard size and scale restricted), flexibility (changingenvironments in a CIG system is easier than changing a modelboard),and power consumption (150KW for modelboard v5. 15KW for CIG) aiong a dozenother reasons. Other investigators (O'Connor4, Monroe3 , Thorpe ) havepointec( out the advantages of CIG systems in terms of training effectiveness.
1Wekwerth, M., "The Lufthansa Day/Night Computer Generated Visual System",in AGARD Conference Proc. No. 249 (ADA063850), pp. 12-1, 12-6. April 1978.
20 'Connor, F; Shinn, J.; and Bunker, W., "Prospects, Problems, andPerformance: A Case Study of the First Pilot Trainer Using C(I Visuals",in Proc. of Sixth NTEC/Industry Conference, pp. 55-83, November 1973.
3Monroe, E., "Air to Surface Full Mission Simulation by tie ASUPT System",in Proc. of 9th NTEC/Industry Conference, pp. 41-48, Nov..mber 1976.4,,
Thorpe, J.; Varney, N.; McFadden, R.; LeMaster, W.; and :;hort, L., "TrainingEffectiveness of Three Types of Visual Systems For KC-135i Flight Simulators",Air Force Human Resources Laboratory, Flying Training Division Report AFHRL-TR-78 16, June 1978.
3
NAVTRAEQUIPCEN IH-318
COMP ITER IMAGE GENERATION SYSTEMS
The real-time CIG systems currently employed in visual simulation systemsresu ted as an outgrowth of the field of computer graphics. Newman 5 providesan e.cellent source for review of the mathematics and algorithms utilized incompiter graphics. Non-real-time computer graphics research is primaridire,-ed toward creating more realistic computer generated scenes (Crow°,Csur ) with little regard to the amount of computation time and hardwarerequ red. Real-time CIG research is primarily directed toward the same endwith'n the hardware and time constraints of a real-time system. (A real-timeCIG :reates a complete new scene every 1/30 second with a pipeline computa-tion time of less than 1/10 second). Morland8 describes the design andcapabilities of the CIG system developed for the NAVTRAEQUIPCEN Vi ualTechnology Research System, developed by General Electric. Woomerdescribes an implementation of a calligraphic CIG system developed byMcDonnell Douglas. SchumackerI0 compares calligraphic C-G to Raster CIG.Potential improvemepts to the $late of the art of real time CIG systems aredescribed by Bunker", Marconii z , and Swallow13 .
5Newman, W. and Sproull, R., "Principles of Interactive Computer Graphics",2nd Edition, McGraw-Hill Book Company, 1979.
6Crow, F., "Shaded Computer Graphics in the Entertainment Industry", inTutorial on Computer Graphics, IEEE Catalog No. EHO-147-9, 1979.
Csi, C., "Computer Graphics and Art", in Tutorial on Computer Graphics,IE.E Catalog No. EHO-147-9, pp. 421-433, 1979.
8Mo-land, D., "System Description - Aviation Wide-Angle Visual System(AWAVS) Computer Image Generator (CIG) Visual System", Technical ReportNA'ITRAEQUIPCEN 76-C-0048-1, Naval Training Equipment Center, Orlando,Florida, February 1979.
9Woomer, C. and Williams, R., "Environmental Requirements for SimulatedHe icopter/VTOL Operations From Small Ships and Carriers", in AGARD Conf.Proc. No. 249, Piloted Aircraft Environment Simulation Technologies,ADA063850, October 1978.
10Schumacker, R. and Rougelot, R., "Image Quality: A Comparison of Night/Du, k and Day/Night CGI Systems", in Proceedings of the 1977 Image Conferencehe'd at Williams AFB, Arizona, 17-18 May 1977, pp. 243-255.
1Bunker, W., "Computer Image Generation Imagery Improvement: Circles,Coiitours, and Texture", Technical Report AFHRL-TR-77-66, Advanced SystemsDivision, Air Force Human Resources Laboratory, Wright-Patterson Air ForceBa';e, Ohio, September 1977.
12Marconi Radar Systems Limited, Product Brochure, "A Picture Generatorfor Flight Simulators".
13Swallow. R., "Computrol Computer Generated Day/Dusk/Night Image Display",in Proceedings of 11th NTEC/Industry Conference, pp. 321-331, November 1978.
4
V

NAVTRAEQUIPCEN IH-318
CIG technology is rapidly growing and the capability to process a complexenvironment in real-time is a reality. However, the process to create thecomplex environment model is currently labor intensive and expensive. Thepurpose of this report is to propose techniques to make the environmental database creation process more efficient.
DATA BASE CONTENT
The basic information stored in the environmental model or data base is
geometry and appearance. The specific requirements as to the size of thegaming area, the minimum size of details in the gaming area, the number ofdetails in a given scene, and the required fidelity to the real world isstrongly influenced by the tasks required for the specific mission beingtrained. In many cases the requirements are unknown. Often there is a needfor the data base to represent actual real world areas rather than genericareas. For example, if the task is to navigate a ship in Norfolk Harbor thedata base should represent Norfolk Harbor. Many training tasks require thatthe weapon system operator use a variety of sensor systems. In these caesthe data bases must correlate. For example, the radar data base should havefeatures located in the same geographic position as the visual data base.Hoog14,15 and Basinger16 discuss the general requirements for a data base andmake a good case for the use of information which represents the real world(DMA17 ) as a framework from which CIG data bases can be built.
DATA BASE CONSTRUCTION
The structure or form in which the data is organized is a function ofthe CIG processing technique. Sutherland 18 classifies the various processirg
14Hoog, T.; Dahlberg, R.; and Robinson, R., "Project 1183: An Evaluationof Digital Radar Landmass Simulation", in Proceedings of NTEC/IndustryConference NAVTRAEQUIPCEN, IH-240, pp. 54-79, November 1974.
15Hoog, T. and Stengel, J., "Computer Image Generation Using the DefenseMapping Agency Digital Data Base", in Proc. of the 1977 Image Conferenceat Williams Air Force Base, pp. 203-218, May 1977.
16Basinger, J. and Ingle, S., "Data Base Requirements for Full MissionSimulation" in Proceedings of the 1977 Image Conference, Air Force, HumanResources Laboratory, Flying Training Division, Williams AFB, Arizona,pp. 25-33, May 1977.
17Defense Mapping Agency, "Product Specifications for Digital LandmassSystem (DLMS) Data Base, PS/ICD-E-F-G/100, July 1977.
18Sutherland, I.; Sproull, R.; and Schumacker, R., "Characterization ofTen Hidden-Surface Algorithms", Computing Surveys, Vol. 6, No. 1, pp.1-55, March 1974.
5

NAVTRAEQUIPCEN IH-318
algorithms which utilize data bases in which the inf)rmation is stored as planarpolygons. In currint, real-time CIG systems polygon models are the basic datastructure. MonroeL 9 descr hs the techniques utiliz.d in the construction ofa polygon data base. Kotas describes the polygon lata base constructionfacility at NAVTRAEQUIPCEN.
REPORT SUMMARY
This report is primarily the result of a literature search and is nctmeant to be an in-depth discussion of the subjects covered. The prime purposewas to provide an overview of the problems involved in CIG data base construc-tion and discuss the technologies which are pertinent to the automation ofdata base development. In Section II of this report a description of modelingcriteria in terms of scene detail is proposed. Section III describes thevarious data base structures used in computer graphics with the understardingthat real time CIG systems currently use polygon representations but futLreCIG systems might require different data base structures if only to Rake themodeling task more efficient. Section IV discusses stereophotogramietric anddigital image processing techniques for extracting CIG data base informationfrom photographs. Section V describes the components of a modeling systEm interms of the hardware necessary to implement stereophotogrammetric and digitalimage processing of imagery for CIG data base development.
19Monroe. E., "Environmental Data Base Development Process for the ASUPTCIG System", Air Force Human Resources Laboratory, Technical ReportAFHRL-TR-75-24, August 1975.
20Kotas, J. and Booker J., "The AWAVS Data Base Facility - A ComprehensivePreparetion Package", in Proc. of llth NTEC/Industry Conference, pp.49-62, November 1978.
6

NAVTRAEQUIPCEN IH-318
SECTION II
SCENE DETAIL REQUIREMENTS
INTRODICTION
1 i this Section an attempt is made to identify and quantify the infortiationwhich s operated on by the CIG system to produce a simulated visual environment.This information includes geometric information such as size, shape, ind loca-tion a, well as the less easily defined modes of appearance such as b-ightriess,hue, s turation (these three can also be called spectral luminance), trans-parency, and glossiness. The scene illumination also affects the appearance.Illumination has spectral properties and objects in the scene have reflectanceproperties which are a function of color and direction (OSA21).
This Section discusses; the difference between seeing and perceiling,the capabilities of the eye, scene parameters affecting the performance ofcertain visual tasks, and recommendations for scene detail requirements.
SEEING VERSUS PERCEIVING
The purpose of a weapon system trainer is to provide an environmentwh ch will teach and exercise an operator in those skills required in theperformance of his mission tasks in the actual weapon system. Since anoperator's performance is based on his perception of his environment, thesitiulated environment should be perceptually similar to the real world en-vir'onment. The visual simulation system in a weapon system trainer providesa visual environment to the operator which should be perceptually similar toth,! real world visual environment. In a CIG visual simulation system theopirator's perception of his environment can be considered; to originate inthe data base, to proceed through the image generation and the displaysystem, to be seen by the observer's eyes, and finally to be operated on bythe observer's perception process (involving his memory, emotional state,and corcentration) to yield his perception. The information rate of the eye-brain rerception process has been estimated at 5 X 103 bits/second (Sagan2Z).If thi5 process could be accurately determined any visual environment could
* be per(eptually replicated at this relatively low information data rate.Unfortunately, the perception process is difficult to analyze and quantify.Consequently, a visual simulation system attempts to replicate what the eyecan see in the real world with sufficient similarity such that the perceptionis functionally identical to the observer's perception in the real world asmeasured by training transfer. There is no conclusive research as to therequired degree of realism or fidelity necessary to train. In order to be
21Optical Society of America, "The Science of Color", Optical Society ofAmerica, Washington, D.C., 1963.
22Sagan, C., "The Dragons of Eden", Ballantine Books, New York, 1977.
7
AL I
NAVTRAEQUIPCEN IH-318
confident that positive transfer of training is occurring two general rulesare usually followed (Hamilton23); maximize the similarity between thesimulated and operational environments, and provide adequate experience withthe task.
Another driving force behind emphasizing perceptual fidelity as opposedto realisn is the high cost of realism. Replication of all sensible attri-butes of the real world is potentially possible but also very expensive.
Alth)ugh the concept of perceptual fidelity has been voiced before(Wood24), the design and specification of visual simulation systems will con-tinue to je based on physical fidelity to the real world until those trade-offson realism required for specific training transfer have been quantitativelyidentifiel. For example, WelcheS states that good texture and parallax cuesare suffizient for piloting training in the nap-of-the-earth (NOE) mission butthe navigation training requires a much more complex set of topographic,hydrographic, and botanical cues. The visual cues reuired for the simulationof the full NOE mission almost defy analysis. Gibson 6 points out that thevisual stimulus need only be a correlate of the real world property, not acopy of it, in order for the perception to be the same. Bunker 7 describesan example in which parallel converging lines serve the same function as atexture gradient to produce a perception of depth in a visual simulation.
In this Section the performance parameters of the eye will be reviewedas well as some perceptual parameters which have been measured for specificvisual tasks. It is recommended that data base content be based on perceptualFidelity as a goal. However, it must be kept in mind that many tasks have notbeen studied sufficiently to determine just what scene qualities are necessaryto produce perceptual fidelity. In cases such as NOE navigation it may benecessary to have all of the visual fidelity of the real world simply be-cause the trade-offs are unknown.
23Hamilton, H., "Feasibility Study for Simulation of an Airport TowerControl Environment", ADA051174, February 1978.
24Wood, M., "The Fidelity Issue in Visual Simulation", in Proc. of the 1977Image Conference, Williams AFB, pp. 291-295, May 1977.
25Welch, B., "Recent Advances in Television Visual Systems", in AGARD Conference
1Proceedings #249, ADA063850, pp. 13-1, 13-7, April 1978.25Gibson, J., "The Perception of the Visual World", Houghton-Mifflin Company,
Boston, 1950.21Bunker, W., "Training Effectiveness Versus Simulation Realism", SPIE, Vol.
162, Visual Simulation and Image Realism, pp. 76-82, August 1978.
8

NAVTRAEQUIPCEN IH-318
VISUAL CAPABILITIES
The performance capability of the eye has ben extensivey studied ancreviewed many times and reported elsewhere (Boothz8, Carel29 , Farrell 30).In order to demonstrate the magnitude of the problem in trying to replicatethe visual environment a brief description of some of the capabilities of theeye are summarized in the following paragraphs.
Acuity. Acuity is defined as the reciprocal of the angle, measured ir,arc minutes, of the smallest detail which can be resolved. Acuity varieswith luminance, color, contrast, and position in the field of view (LeGranl31).For high contrast targets, viewed on-axis, the minimum separable acuity at10 FTL (Foot Lamberts) is 2.0. This corresponds to a bar target with anangular frequency of one line pair per arc minute. Vernier acuity, which isthe ability to see a misalignment in a line, and stereo acuity, which is theability to see the angular disparity due to the eye separation distance, areboth approximately 0.04 arc minutes. The minimum perceptible angular subtenseof a non luminous detail is approximately 0.007 arc minutes.
The above acuity thresholds can be combined with the closest approachdistance to be simulated to give an idea of the size of details which theeye is capable of seeing in the real world. The minimum perceptible acuitycriteria allows power lines to be seen against a uniform sky. Under idealconditions a power line only a half inch thick can be seen at a range ofthree miles. At a range of 5 meters a spider web strand only 10 micronsthi:k can be seen. Vernier acuity thresholds indicate that breaks in edges,due to misalignment of two juxtaposed displays can be seen with misalignmeritsas ;mall as 34 microns on a screen located 3 meters from the observer.Ste,eo acuity becomes important in a stereo display system in which separatedislays are computed for the viewpoint of each eye. This has implicationson the precision with which a viewpoint is located for scene computation.For example, to replicate the stereo capability of an observer viewing anobject located 5 meters away, the viewpoint positions must be precise to alinear dimension of 34 microns in real world coordinates.
j 28B)oth, J. and Farrell, R., "Overview of Human Engineering Considerations
f-r Electro-Optical Displays", SPIE, Vol. 199, pp. 78-108, August 1979.29Cirel. W.; Herman, J.; and Olzak, L., "Design Criteria for Imaging Sensor
Displays", ADA055411, May 1978.30 Firrell, R. and Booth, J., "Design Handbook for Imagery Interpretation
Eluipmnent", Boeing Aerospace Company, Seattle, Washincton, December 1975.31LGraid, Y., "Form and Space Vision", Indiana University Press, Bloomington,
1 i67.
9
NAVTRAEQUIPCEN IH-318
The minimum separable acuity threshold is the one most often used asthe ultimate goal in a visual display system. As evidenced by the abovediscussions a data base minimum detail dimension criteria based on a minimumseparable acuity threshold would not replicate the potentially visibleenvironment. The minimum separable threshold applies to a large percentageof, but not all, visual tasks. Minimum separable acuity is that visualperformance parameter which is used to read the letters in an eye chart.For example, 20/20 vision as measured on a Snellen chart corresponds to aseparable acuity of 1.0 or a resolution of 2 arc minutes/line pair. A personwith 20/20 vision is capable of reading letters whose lines or gaps subtend1 arc minute or approximately 1/16 inch at 20 feet.
Luminance. The range of light levels to which the eye can respond ex-tends from 10-6 FTL to 104 FTL or approximately 10 orders of magnitude. However,at any one time the eye is limited to approximately two orders of magnitudeof luminance dj'crimination due to the brightness - adaption mechanism of theele (Cornsweetn). Consider a sunlit environmLnt. The adaptation level adjuststo its maximum range. All luminances above 104 FTL are seen as white; allluminances below 104 FTL are seen as black. Now consider a dark interior oran overcast night. The eye adapts to jts minimum range. All luminances below10-6 FTL are black while all above 10-4 FTL ar white (assuming the eye is notallowed to adapt to luminances higher than 10" FTL). Since display systemstypically are restricted to a dynamic range of 100:1, or less, CIG systems havegenerally computed display information over this same range. If, however,visual environment simulations are to include the effects of adaptation todifferent luminance levels, while maintaining the dynamic range, then thecomputation of pixel luminance in the display should be carried out over theentire range of luminances consistent with the dynamic scenario. For example,consider a battlefield scenario on a cloudy, moonless night. The displaysystem has a highlight brightness of 10 FTL and a dark level of 0.1 FTL.T-ie simulated scene has absolute luminance levels extending from 10-6 to1)-4 FTL which are effectively simulatgd by the display which calls 10-4 FTLwhite and displays at 10 FTL while 10- FTL is called black and displayed as0.1 FTL. (For illustration, contrast effects have been ignored). A "white"'I object is seen against a "black" treeline. Now a parachute flare ignitesbehind the treeline with the "white" object in shadow. In the real world the
eye would adapt to the new luminance level (call it 104 FTL) and the previously"white" object would appear black while the tops of the trees which were blackare now illuminated by the flare and appear white. If the dynamic range of
*luminance computation is restricted to two orders of magnitude this situation(ould not be effectively simulated. The same reasoning applies to less extreme(xamples such as a pop-up maneuver from a small clearing in a dense forest or'he effect of headlights or search lights. Note that the display dynamiciange is not at issue, just the computational luminance range.
2Cornsweet, T., "Visual Perception", Academic Press, New York, 1970.
10
NAVTRAEQUIPCEN IH-318
Contrast. The perception of luminance differences is a function of colorand luminance level. The problem of modeling observable color differencesis complex and beyond the scope of this report. The interested reader isreferred to MacAdam33 and Hunt . Contrast sensitivities to luminance leveldifferences can be measured by observing a uniformly lit screen of luminance
4 ,B. A sharp edged area within the screen has additional luminance of AB.The luminance AB is increased from zero until it is just noticeable. Thejust noticeable difference AB is measureqas a function of B. The quantityAB/B is called the Weber Ratio (Gonzalez"). This quantity for typicaldisplay luminance ranges is approximately 10% at 0.1 FTL decreasing to2% at 1 FTL and remaining fairly constant at 2% to 10 FTL.
In terms of absolute luminance levels the Weber fraction increases to 10at luminance levels of 10"J FTL or less allowing the discrimination of onlytwo or three gray levels. To more accurately simulate the situation describedabove, the "white" object might be assigned a display luminance value of 5.1FTL while the black trees are displayed at 5 FTL.
Note that luminance difference thresholds are a function of luminancelevel. Since CIG systems treat luminances in a linear, digitized fashion forcomputational purposes the computations are carried out with fixed luminancedifferences. If the appearance of the resultant display is to replicate theeye's capability then the fixed luminance difference should be equal to thesmallest luminance difference observable. This would lead to luminance stepsof 0.01 FTL or 1000 steps to span the display range of 0.1 to 10.0 FTL. Inpractice luminance computations carried to 8 bit accuracy (256 steps) areusually acceptable. If the entire dynamic range of eye perceivable luminancelevels is to be simulated (as discussed above) then thg smallest perceptibleluminance level is approximately 10-4 FTL requiring 100 steps and 20 bitaccuracy.
In a color display formed by the combination of three separately modulatedcolors the above analysis is applicable with some modification. A predominantlyred color can be distinguished from another predominantly red color at thesame luminance level with a change in the red component of the order of 2%.However, a predominantly blue color needs a larger relative change in the redcomponent to be distinguished.
33MacAdam, D., "Visual Sensitivities to Color Differences in Daylight",Journal of the Optical Society of America, Vol. 32, No. 5, pp. 247-274,May 1942.
34Hunt, R., "The Reproduction of Colour", Fountain Press, England, 1975.35Gonzalez, R. and Wintz, P., "Digital Image Processing", Addison-Wesley
Publishing Co., Reading, Massachusetts, 1977.
11

NAVTRAEQUIPCEN IH-318
VISUAL TASK PERFORMANCE
The problem of developing a visual simulation system which providesimagery indistinguishable from the real world is not a valid goal for training.The goal, as stated previously, is to provide an environment in which visualskills can be learned. In the following paragraphs some data on the visuJalinformation required to perform certain visual tasks will be described.
Shape Recognition. LeGrand36 gives criteria for recognizing geometricforms as 3 arc minutes for the length of the sides of a triangle; 4 arc minutesfor the sides of a square; 4 arc minutes for the diameter of a circle; and a1% difference in axis length for distinguishing a circle from an ellipse.
Color. The requirement for color versus monochrome displays in a visualsimul-t3iZn system has not been experimentally verified. Target detectionexperiments (Wagner37) indicate that color is betti but not significantly.For visual search and identification tasks, Christao has found thatthere is no particular advantage or disadvantage as tieasured by task performancefor many tasks. However, he found that for some tasks color could be veryeffective under certain conditions. All 39 describes a color-based computeranalysis of aerial photographs in which color not only provides an identifyingfeature with which a particular object can be recognized by the machine, butalso provides a basis for the initial separation of the individual objectsin theperception of the scene.
Although color has not yet been demonstrated to be necessary in visualsimulation for training it is usually one of the items specified as desirable
36LeGrand, Y., "Form and Space Vision", Indiana University Press, Bloomington,1967.
37Wagner, D., "Target Detection With Color Versus Black and White Television",Report TP5731, Naval Weapons Center, China Lake, CA, April 1975.
38 Christ, R., "Four Years of Color Research for Visual Displays", in Proc.of Human Factors Society - 21st Annual Meeting, pp. 319-321, October 1977.
39Ali, M. et al., "Color-Based Computer Analysis of Aerial Photographs",Computer Graphics and Image Processing, Vol. 9, pp. 282-293, 1979.
12
NAVTRAEQUIPCEN IH-318
by the trainees (Rivers40 , Chase4l). McGrath42 provides a rationale for colorsimulation based on pilot training objectives and various mission tasks interrain flight.
Gray Levels. Mezrich43 has developed a vision model to compute the numberof just noticeable differences in display perception. He states that 6 bitssuffice for a 10 FTL display. Another interesting parameter described inhis report is that the contrast sensitivity peaks at 3 cycles/degree as seenby the observer. He also found that the power spectrum of natural scenescould generally be described by 5 bits of luminance and that the perceivedinformation capacity of a color display is more than a monochrome for the samebandwidth.
Texture. Richards44 has proposed that texture perception is analogousto color perception. The eye's response to colors can be explained by assumingthe presence of three detectors in the retina, each one having different spec-tral response. Richards proposes and finds experimental evidence that textureperception can be explained by the presence of texture sensors in the retina.He has found that the texture "primaries" are approximately 1, 3, 6, and 11cycles/degree. Therefore, any texture can be simulated by forming itstexture metamer from a composition of these spatial frequencies. Since thetexture primaries are defined in terms of subtended visual angle, the synthesisof a given texture is a function of range and aspect angle of the texturedsurface.
Flight Training. Stark45 describes a methodology for selecting the visualinformation for CIG representation. For example, air to air training tasksrequire only a checkerboard simulation of the ground to enable the traineeto obtain cues to his altitude, altitude rate, and ground speed and highly
40Rivers, H. and VanArsdall, R., "Simulator Comparative Evaluation", inProc. of 10th NTEC/Industry Conference, pp. 37-42, November 1977.
41Chase, W., "Effect of Color on Pilot Performance and Transfer FunctionsUsing a Full-Spectrum, Calligraphic, Color Display System" in Proceedingsof AIAA Vision Simulation and Motion Conference, April 1976.
42McGrath, J., "The Use of Wide-Angle Cinematic Simulators in Pilot Training",Technical Report NAVTRAEQUIPCEN 70-C-0306-1, March 1973.
43Mezrich, J.; Carlson, C.; and Cohen, R., "Image Descriptors for Display",Office of Naval Research Report ONR-CR213-120-3, February 1977.
44Richards, W., "Experiments in Texture Perception", ADA059630, January 1978.
45Stark, E.; Bennett, W.; and Borst, G., "Designing DIG Images forSystematic Instruction", in Proc. of 10th NTEC/Industry Conference, pp.147-155, November 1977.
13
NAVTRAEQUIPCEN IH-318
detailed imagery of the target aircraft to make effective judgments ofrange and attitude. Basinger46 describes the qualitative attributes of afull mission simulation. Ritchie47 emphasizes that perception is stronglysubjective and highly task dependent in developing design criteria for CIGsystems. These reports point out the need for research to develop perceptualcriteria based on training effectiveness.
Rivers48 describes an experiment in which Tactical Air Command (TAC) pilotsperformed subjective evaluations of existing flight simulators. Their subjec-tive opinion was that current systems are inadequate for air-to-surfacetasks. They voiced a need for: multiple moving targets; a runway; controlledceiling and visibility; adequate gaming area; realistic color; sufficientscene content and detail to determine airspeed, altitude, and area orientation;visual grayout/blackout; sun image; field of view eiquivalent to the aircraft1 FOV; and weapons effects.
Kraft49 and Chase50 evaluated pilot acceptance, pilot performance, andtraining transfer using CIG imagery. Kraft found that CIG provides acceptablecrew training for the approach and landing task in commercial aircraft.Chase found different levels of pilot performance and acceptability withdifferent colors in a calligraphic display.
Kraft51 describes the results of a study to develop criteria for visualsystem for flight crew training in air transports. He concludes that thevisual simulation criteria are primarily driven by equipment limitations. Hisrecommendations ari a minimum of 6 FTL display luminance (performance dropsoff below 6 FTL) aid display resolution of 3 arc minutes/pixel for daylightscenes.
4(Basinger, J. and Ingle, S., "Data Base Requirements for Full MissionSimulation" in Proceedings of the 1977 Image Conference, Air Force, HumanResources Laboratory, Flying Training Division, Williams AFB, Arizona,pp. 25-33, May 1977.
47Richie, M., "Object, Illusion, and Frame of Reference as Design Criteriafor Computer-Generated Displays", SPIE, Vol. 162, Visual Simulation and ImageRealism, pp. 8-10, August 1978.
48Rivers, H. and VanArsdall, R., "Simulator Comparative Evaluation", inProc. of 10th NTEC/Industry Conference, pp. 37-42, November 1977.
49Kraft, C.; Elworth, C.; Anderson, C.; and Allsopp, W., "Pilot Acceptanceand Performance Evaluation of Visual Simulation", in Proc. of 9th NTEC/Industry Conference, pp. 235-249, November 1976.
50Chase, W., "EffEct of Color on Pilot Performance and Transfer FunctionsUsing a Full-Spectrum, Casligraphic, Color Display System" in Proceedingsof AIAA Vision Simulation and Motion Conference, April 1976.
51Kraft, C. and Shaffer, L., "Visual Criteria for Out of the CockpitVisual Scenes", in AGARD Conference Proceedings No. 249, ADA063830, pp.3-1, 3-18, April 1978.
14
NAVTRAEQUIPCEN IH-318
Terrain Flight. Ozkaptan52 describes the visual requirements for nap-
of-the-earth flight simulation as: resolution of 3 arc minutes/pixel;luminance of 50-100 FTL field of view of 400 X 1200; full color; simulatedrange to 20 miles. Key3 describes the visual requirements for an ArmyRotorcraft Research Simulator. He states that for an obstacle avoidance taskin NOE flight a field of view of at least 600 X 1800 is required. Resolutionfor this proposed research simulator is specified as 3 arc minutes/pixel orbetter. Key states that objects such as targets can be made artificially largein this imulator since combat simulation for training is not the goal.Sanders5 has experimentally determined that the task of navigation duringterrain flight consumes 92% of the navigator's time. He has described thistask as primarily a correlation task in which the navigator first searchesand then pattern matches. The navigator correlates his view of the terrainwith his map or photographs, taking into account seasonal changes, visibility,illumination, day/night differences, and changes in fields and roads since hisreference information was obtained.
Tar et Acquisition. This visual task has apparently generated the greatestamount of perception data available. Vony experimental results under a varietyof conditions are described by Farrell O. The subject views a displayed scenecontaining a target and background. His task it to acquire the target. Hisperformance is usually measured as a function of display parameters such asresolution, contrast, field of view and display time. The performance criteriais usually defined in terms of detection (something is present in field);orientation (where it is in field); recognition (recognizing that the objectbelongs a class); and identification (identification of type within class).BibermanU0 gives the general quantitative resolution requirements in terms ofthe number of line pairs subtended by the minimum critical object dimension
520zkaptan, H., "Critical Visual Requirements for Nap of the Earth (NOE)Flight Research", in Proc. 8th NTEC/Industry Conference, pp. 53-65,November 1975.
53Key, D.; Odneal, B.; and Sinacori, J., "Mission Environment Simulation'1 for Army Rotorcraft Development - Requirements and Capabilities", in AGARDConference, Proc. #249, (ADA063850), pp. 4-1, 4-17, April 1978.
54Sanders, M.; Simmons, R.; Hofmann, M.; and DeBonis, J., "Visual Workloadof the Co-Pilot/Navigator During Terrain Flight", Proc. of the Human FactorsSociety 21st Annual Meeting, pp. 262-266, October 1977.
55 Farell, R. and Booth, J., "Design Handbook for Imagery InterpretationEqupment", Boeing Aerospace Company, Seattle, Washington, December 1975.
56Bibcrman, L. (Editor), "Perception of Displayed Information", Plenum Press,New York, 1973.
15
" L .. .. . .. .. I . . . II . .. ... . .
NAVTRAEQUIPCEN IH-318
as: Detection = 1.0; Orientation = 1.4; Recognition = 4; and Identification= 6.4. Booth 7 gives similar values with the caveats that the subtendedvisual angle must exceed 12 arc minutes and that Jhe results are highlydependent on the task and the background. Scott ° measured identificationonly and scored correct percentage of responses. His subjects scored 20%correct at 1.5 line pairs and 90% at 7 line pairs per minimum vehicledimension. Scanlan 5' measured time to detect as a function of backgroundcomplexity. He found that detection time for a h~gh-complexity backgroundwas 24 times that of a uniform background. Gavenou measured identificationas a function of line pairs per vehicle and the number of gray levels. Hefound that the number of quantized gray levels is inversely proportionaljothe number of lines per vehicle for a given level of performance. Craig Olfound that, for a given number of lines per vehicle, performance improved asthe field of view increased to approximately 100 then leveled off. The targetsize was a minimum of 30 arc minutes.
The quantification of background complexity in terms of perception andcognition has been attempted by Ciavarelli 6o and Hall 63 . Until such atarget-background complexity metric has been defined and tested relative toperformance of specific visual tasks the specification and evaluation ofbackground complexity will continue to be subjective.
57Booth, J. and Farrell, R., "Overview of Human Engineering Considerationsfor Electro-Optical Displays", SPIE, Vol. 199, pp. 78-108, August 1979.
58Scott, F.; Hollanda, P.; and Harabedian, A., "The Informative Value of
Sampled Images as a Function of the Number of Scans Per Scene Object",Photographic Science and Engineering, Vol. 14, No. 1, pp. 21-27, January 1970.
5 Scanlan, L., "Target Acquisition in Realistic Terrain", in Proc. of theHuman Factors Society - 21st Annual Meeting, pp. 249-253, October 1977.
6CGaven, J.; Tavitian, J.; and Harabedian, A., "The Informative Value of
Sampled Images as a Function of the Number of Gray Levels Used In Encodingthe Images", Photographic Science and Engineering, Vol. 14, pp. 168, 1970.
6 Craig, G., "Vehicle Detection on Television; A Laboratory Experiment",62AD919898, April 1974. 1
62Ciavarelli, A.; Wachter, L.; and Lee, W., "Terrain Classification Study",AD B005535, May 1975.
Hall, E.; Hwang, J.; Lee, C.; and Hwang, M., "Measuring Scene Content FromAerial Images", SPIE, Vol. 186, pp. 215-223, May 1979.
16
NAVTRAEQUIPCEN IH-318
Photographic Interpretation. Wolf 64 describes the basic charactevisticsof photographic images which are utilized for interpretation as:
a. Shape. This relates to the form configuration or outline of anindividual object. Shape is probably the most important singlefactor in recognizing objects from their photographic images.
b. Size.
c. Pattern. The repetition of certain general forms or relationshipsis characteristic of many objects.
d. Shadows. Shadows in photographs have two general effects. Theyafford a profile view of the object casting the shadow and theyhide objects within them.
e. Tone. Without tonal differences, shapes, patterns, and texturecould not be discerned.
f. Texture. This is the frequency of tone change in the image. Textureis produced by an aggregate of unit features which may be too smallto be clearly discerned.
g. Site. The location of an object in relation to other features maybe very helpful in identification.
Photographic interpretation is not a skill to impart to a trainee in areal-time CIG system but the general characteristics listed above probablycorrelate well with the cues utilized by such a trainee as he observes hisvisual environment.
RECOMMENDATIONS
DETAIL SIZE
The amount of information necessary to model a visual environment extendsfrom a maximum in which the display is indistinguishable from the real worldto a minimum in which the display contains just enough visual cues to beperceptually similar for the specific task to be learned. The former casecan be calculated from eye performance measurements and allowed closestapproach. The size of the data base becomes enormous if the visual environ-ment is to appear "realistic" for close approaches anywhere within the gamingarea. The latter case is ideal in terms of economy but there is insufficientdata available to define just what minimum amount of information is requiredfor all tasks. A hypothesis is proposed as a strawman for scene detail re-quirements based on object acquisition studies described above.
64Wolf, P., "Elements of Photogrammetry", McGraw-Hill, New York, 1974.
17
()0
U.& .

NAVTRAEQUIPCEN IH-318
Scene Detail Hypothesis. A visual environment need only be modeled tolevel of detail sufficient to identify the object with the smallest critic,,l
i'inimum dimension for the particular visual tasks expected to be trained inihe simulation system.
For example, if the scenario involves search and acquisition of targetsr) smaller than a tank and the minimum critical dimension of a tank is 2ITters then the visual environment should be modeled such that it appearsiidistinguishable from the real world when seen with 2 meters of object sub-tanding 7 line pairs of resolution regardless of closest approach distance.Ii a 1IG data base which incorporates different models of the same object,tie above modeling criteria is pertinent to the highest level of detailm)deled. In practice the modeler would work from tank photographs whoseresoltition is such that 7 line pairs could be resolved over a two meter distanceat the same range as the tank. The modeler then adds detail to his model untiltie rendering of the CIG image resembles the tank image when they are bothoaserled at the same size and resolution. It is proposed that the entire database be constructed in this fashion although artificial detail at the 7 lineptirs/2 meter criterion may be used as the highest texture spatial frequencyii data base areas where specific scene content is not required.
This modeling technique would not appear realistic. For example, at a5 meter closest approach 1 arc minute per line pair eye resolution implies1400 line pairs/2 meters. The tank modeled by the 7 line pair/2 meterscriterion would be devoid of expected details, however, it should still becapable of being identified as a tank which was the purpose for which it wasintended. The justification for modeling the entire gaming area to thisapparent detail is to make the background scene as complex as the smallesttarget at the identification level. This makes the entire acquisition sequence(from detection through identification) just as difficult in the simulationas in the real world.
Other mission scenarios might have different minimum critical dimensions.For example, consider a periscope view simulation. For identification of shipclass a minimum critical dimension might be 50 meters but for determinationof angle-on-the-bow the minimum critical dimension would be smaller.
DETAIL REFLECTANCE
Although the requirement for color has not been firmly established, itis proposed that detail spectral reflectance be recorded to eight bitprecision in red, green, and blue primaries.
ENVIRONMENT CONTENT
The choice of which objects should be included in the simulated environ-ment is somewhat subjective and task dependent. For example, a navigatorwould expect an environment to contain objects or features which are desig-nated on the map he is using to navigate.
18
r

7-1
NAVTRAEQUIPCEN IH-318
SECTION III
DATA BASE STRUCTURES
INTRODUCTION
This Section investigates the form of the representation of the environ-ment which is operated on by the image generator to produce the visual display.Each representation class has its own advantages and disadvantages, which arestrongly dependent on the class of objects or surfaces to be modeled. Beforeproceeding further, a distinction should be made between modeling and design-ing in the context of this report. Modeling is defined as generating amathematical description of a real world environment. This is essentially acopying process. Designing, on the other hand, involves the subjective crea-tion of a mathematical description. Modeling involves analyzing real worldobjects in terms of the chosen environment representation whereas designinginvolves synthesizing simulated real world objects using the chosen environmentrepresentation. Modeling does not require any intelligence or decision makingand is highly amenable to automation.
Brown65 describes the three basic problems of making a mathematicalrepresentation of physical solids, these are: (a) obtaining the raw data orphysical measurements of the object; (b) representing the object descriptionin a concise form; and (c) using the representation to render a display. Thechoice of representation is driven by both the means for obtaining the rawdata and the means for rendering. There is no best representation which willbe capable of efficiently accepting Cpy form of raw data and efficientlyrendering any type of object. BlinnOgycategorizes the most commonly used
* three-dimensional surface representation as; algebraic, point set, and para-metric. Algebraic functions can be used to describe a limited number of objectclasses. The data stored in this case is the type of function, the coefficientswhich control it, and the region of the environment for which it is valid.Point set representations are the class to which current CIG data bases belong.The data stored in a current CIG data base are the three-dimensional locationsof points (vertices) together with information concerning which points make upedges or lines, which edges make up polygons, and which polygons make uppolyhedrons. This type of representation is best suited or most efficient forthe representation of objects which have planar faces. The point set surfacedescription class also includes those data base forms in which the surface tobe modeled is sampled on a regular grid. In such a data base, two of the
65Brown, C. M., "Some Issues and Answers in Geometric Modelling" in Proceedings
of Workshop on the Representation of Three-Dimensional Objects, Bajcsy, R.
(ED.), The Department of Computer and Information Scierce, University ofPennsylvania, May 1979.
66Blinn, J., "Geometric Representations in Computer Graphics" in Proceedingsof Workshop on the Representation of Three Dimensional Objects, Bajcsy, R.(ED.), The Department of Computer and Information Science, University ofPennsylvania, May 1979.
19
NAVTRAEQUIPCEN IH-318
tiree dimensions of the vertex point locations are specified by memory loca-tion. The third class of surface description is the parametric representation.in this representation the surface is divided into a regular or irregular mesh(if patches. The surface shape within a patch is then specified by an algebraic:unction of parameters which are chosen for their convenient behavior within.he patch boundaries. In the case of the parametric representation, the data)ase would contain the location of the patch (in world coordinates) and the:oefficients of the parametric equation describing the patch shape. The'idelity of the model to the surface being modeled is a function of the degreeif the parametric function used (e.g. cubic, quadratic, quintic, etc.), theize of the patch, and the desired patch to patch continuity. An alternative
,;ata base format for parametric patch representation is the storage of threet'imensional locations of control points which have the property of containinglie information necessary to generate the parametric surfaces as the model istendered.
Volume representations form another class of three-dimensional models.bject; are stored in the data base as conglomerations of primitive volumelements. The data base would include an object location and a listing of the
type and relative location of the various volume elements required to renderthe object.
Higher order environment models include semantic models in which a dataase entry might consist of an object name and its location.
Each of the above data base structures requires increasing complexityf the CIG processing system to render a display, as the structure class1roceeds from algebraic, point set, and parametric surfaces to volume ands emantic representations.
Some effort has been devoted to standardization of graphics systems.Eergern 67 states that lack of standardization is the most serious obstacleto the widespread application of computer graphics. The Association forComputing Machinery is currently putting together a proposed standard forcraphics (GSPC 8 ). The only representation which was recommended to bea standard by the ACM Committee was the polygon made up of the three-dimen-sional coordinates of each of its vertices. There was no support given tothe standardization of other than polygon representations . . "at thistime, since current systems are too diverse."
6 Bergeron, R., "Standards for Interactive Computer (Graphics Software" inProc. of Workshop on Picture Data Description and Management, IEEE ComputerSociety, pp. 126-129, April 1977.
6 3"Graphic Standards Planning Committee Status Repor.", Computer Graphics,Vol. 13, No. 3, August 1979.
20
NAVTRAEQUIPCEN IH-318
Clark69 discusses desired attribute of a data base other than its structure,namely, a hierarchy of models having various levels of detail. Such hierarchaldata bases have been implemented in CIG systems where it would be inefficientto operate on a data base which uses models at a high level of detail regard-less of the simulated range. Thomason70 applies this concept to a relationaldata base.
This section is only concerned with the types of representation used incomputer graphics. Section IV will describe techniques for generating thedata to make the model.
ALGEBRAIC SURFACES
A surface described solely by algebraic functions may potentiallystretch to infinity. The degree of complexity of the surface is dependent onthe complexity of the functions used to describe it. The higher the complexityof the functions the more difficult it is to render the model into a display.Planes are modeled by linear functions. In a rectangular coordinate systemthe general form for the equation of a plane is given by equation 3-1.
3-1 Ax +By+ Ca + D = 0
The specification of the coefficients A, B, C, and D is sufficient to describea model of a plane surface. Since plane surfaces in the real world do notstretch to infinity more information is required to model real world planesurfaces. This information can be in the data base or can be computed in therendering process. For example, if the real world surface consists of twoplanes, the data base can specify the boundary line beyond which one of theplanes is valid or the processing can determine the boundary by computing theline describing the intersection of the two planes.
The next degree of surface complexity which can be represented by algebraicfunctions are second degree polynomials of the form given by equation 3-2.
3-2 Ax2 +By 2 + Cz2 + Dxy + Exz + Fyz + Gx + Hy + Ja + K = 0
The types of surfaces capable of being modeled by this general equation arecylindrical surfaces (functions of just two of the three variables), conicalsurfaces (homogenous equations in the variables x, y, and i), spheres,ellipsoids, hyperboloids, elliptic paraboloids, and hyperbolic paraboloids.These surfaces and their various permutations make up the family of seventeen
6gClark, J., "Designing Surfaces in 3-D", Comm. of ACM, Vol. 19, No. 8,pp. 454-460, August 1976.
70Thoma-on, M., "Applications of Probalistic Information Theory to RelationalData Bases", SPIE, Vol. 186, pp. 224-229.
21

NAVTRAEQUIPCEN IH-318
quadric surfaces. The modeling of surfaces in quadric and linear polynomialshas been accomplished in non real time image generati n systems for simulationof real world scenes (Gardner71, 72, Yan73, and Levin?4).
The advantage of utilizing quadric models is the efficiency with whichsurfa(.es such as spheres, ellipsoids, etc. can be stored in the data base.The disadvantages of such representations are: (a) the complexity of thesurface intersections which must be stored or computed (the intersection oftwo qvadric surfaces is a fourth degree polynomial in the general case); and(b) the surfaces modeled are restricted to the seventeen quadric surfaces.
ihe representation of surfaces by equations of higher degree is potentiallypossitle but difficult to implement due to the complexity involved.
P)INT SET SURFACES
Polygons. In a point set surface representatior the basic informationstored in the data base is the three-dimensional location of points. All currentreal-time CIG systems employ point set surfaces as the preferred data baserepresentation for modeling arbitrarily shaped real world objects. The specifictype of point set representation used in these systems is one in which pointsare grouped to define edges, polygons and polyhedrons. The data base con-structed for such CIG systems must conform to specific modeling ruJs imposedby the processing capabilities of the real-time hardware. Morlandl' describesthe real-time CIG system at NAVTRAEQUIPCEN and the modeling rules which themodeler must follow if the environment is to be properly rendered. For example;polygon faces must be convex, the vertices making up the polygon face must beco-planar, the vertices must be numbered in a clockwise fashion when viewed
71Gardner, G., "Conputer Image Generation System With Efficient Image Storage",in Optical Information Storage, SPIE, Vol. 177, pp. 10-12, 1979.
72Gardner, G., "Conputer-Generated Texturing to Model Real-World Features",in Proc. of 1st Interservice/Industry Training Equipment Conference, pp.239-246, November 1979.,73Yan, J ., "Real-Time Generation and Smooth Shading of Quadric Surfaces",in Proc. of 1st Interservice Industry Training Equipment Conference, pp.247-260, November 1979.
74Levin, J., "A Parametric Algorithm for Drawing Pictures of Solid ObjectsComposed of Quadric Surfaces", Communications of the ACM, Vol. 19, No. 10,pp. 555-563, October 1976.
75 Morla'id, D., "Sy';tem Description - Aviation Wide-Angle Visual System(AWAVS) Computer Image Generator (CIG) Visual System", Technical ReportNAVTRAEQUIPCEN 76-C-0048-1, Naval Training Equipment Center, Orlando,Florida, Februar, 1979.
22

..
NAVTRAEQUIPCEN IH-313
from the visible side of the face, objects made ul of convex polygons mustbe convex polyhedrons, objects are limited to a miximum of sixteen faces, andthe number of edges in the environment as well as the number of edges in anypotential field of view must not exceed the on-lire storage capability oredce processing capability, respectively, of the real-time hardware. Thepolygon class of surface representation is most efficient for modeling realworld objects composed of planar surfaces. The mceling of smoothly curvedsurfaces is less efficient with this technique since many polygons are required.This difficulty is somewhat overcome by the use of shading techniques in therendering process which eliminate the appearance o edges on a polygon modelof a smoothly curved surface. However, the silhou.!ttes of such models willstill have straight lines.
Many Polygon oriented visible surface algoritims have been developed(Watkins , Sutherland7 7) and implemented in both eal-time and non-real timeimage generators. The basic reason for such wides)read use of this particularsurface representation is the relative simplicity )f the geometric transforma-tions required for rendering a display on a flat screen such as a CRT monitor.This is summarized as; straight lines in the model transform to straight linesin the display. Carlboml8 describes the variety of ways in which three-dimen-sional objects can be projected to a planar display. Polygon based imagegenerators are continuously being refined to produce higher quality renderings.The latg)t developments involve the addition of texture to polygon face(Bunker's) and the utilization of translucent faces (Bunker ).
Fixed Grid Arrays. The construction of a math model describing the reliefof the earth's surface existed as a requirement long before there were CIGsystems. Such math models of the earth's surface are called digital terrainmodels (DTM). The users of DTM have different requirements for the form ofthe terrain information. Geomorphologists prefer the DTM to be a set of
I76Witkins, G., "A Real-Time Visible Surface Algorithm", AD-762004, June 1970.
77Sutherland, I.; Sproull, R.; and Schumacker, R., "Characterization of4Ten Hidden-Surface Algorithms", Computing Surveys, Vol. 6, No. 1, pp. 1-55,
March 1974.
* 78Carlbom, I and Paciorek, J., "Planar Geometric Projections and ViewingTransformations", Computing Surveys, Vol. 10, No. 4, pp. 465-502, December1978.
79Bunker, W., "Computer Image Generation Imagery Improvement: Circles,Contours, and Texture", Technical Report AFHRL-TR-77-66, Advanced SystemsDivision, Air Force Human Resources Laboratory, Wright-Patterson Air ForceBase, Ohio, September 1977.
80Bunker, W., "CIG Translucent Face Simulation Provides Multiple Benefits",
Proc. of 1st Interservice/Industry Training Equipment Conference, pp.229-238, November 1979.
23

NAVTRAEQUIPCEN IH-318
contiguous non-overlapping polygons restricted to the horizontal plane whose)ounearies are indicative of landforms. Surveyors prefer the representationof the terrain to be a polyhedral solid which approximates the terrain surfacein three dimensions and adapts in density and complexity to the local topo-,jraphy. The cartographer prefers the terrain information to be in the form(of lines such as profiles or contours. Despite the fact that none of the usersof DTM desire the terrain model to be in the form of a regular grid ofQlevations, this is the form of terrain model which is most widely used (Mark8l).6ridded data in which elevation is sampled at regular incrc;nents in latitudeand longitude is inefficient. In order to have sufficient information toreproduce complex terrain the increments must be small but this implies aiarge number of samples even in areas where the terrain is flat. Dutton82
points out the reasons for using gridded data even though it is inefficient.(ridded data is the easiest to generate since an automatic elevation measuring!ystem does not have to make decisions on where to bound polygons. Gridded(ata is easiest to transport between different analysis systems; to compareone set of data with another; to display; and to conceptualize. Other advan--ages for graphics applications include: data access need not be global; andoverlays can be accomplished with limited computational memory and inexpensivedlgorithms. For reasons such as these the Defense Mapping Agency, which is,issigned overall responsibility of mapping, charting and geodetic resourcesin the Department of Defense chose to use a regular grid representation forterrain elevation data (DMA8H). A description of the DMA data base and an(evaIl:ation of its application to radar display simulation is g ven by Hoog84
and [efense Mapping Agency Aerospace Center (DMAAC85 ). Salmen86 surveys,atssesses, and compares 54 existing computer software systems and geographicdata bases. This report is indicative of the non-standardization of applica-tion programs which indicates the reason for desiring a data base form whichis easily transportable.
' IMarK, D., "Concepts of Data Structure for Digital Terrain Models", inPro,:. of Digital Terrain Models (DTM) Symposium, American Society ofPhotogrammetry. May 1978.
S2Dutton, G., "An Extensible Approach to Imagery of Gridded Data", ComputerGraphics, Vol. II, No. 2, pp. 159-169, Summer 1977.
.33
Defense Mapping Agency, "Product Specifications for Digital LandmassSystem (DLMS) Data Base, PS/ICD-E-F-G/100, July 1977.
;4 Hoog, T.; Dahlberg, R.; and Robinson, R., "Project 1183: An Evaluationof Digital Radar Landmass Simulation", in Proceedings of NTEC/IndustryConference NAVTRAEQUIPCEN, IH-240, pp. 54-79, November 1974.
35Defense Mapping Agency Aerospace Center, "Test and Evaluation of USAF
Project 1183 Digital Data Bases", DMAAC TR 79-1, February 1979.
Salnen, L.; Gropper, J.; Hamill, J.; and Reed, C., "Comparison of
Selected Operational Capabilities of Fifty-Four Geographic InformationSystems", U.S. Department of Commerce, PB-286977, September 1977.
24
NAVTRAEQUIPCEN IH-318
Many processing algorithms have een developed which utilize gridded datadirectly in creating imagery. Strat8 utilizes an algorithm which takes agrid of elevation data and displays perspective or orthographic views in whichpixel intensity is a function of surface normal and a simulated terrain illumin-ation direction. Unruh88 and Schachter89 describe algorithms in which bothelevation and spectral reflectance values in the grid data base are utilizedto produce displays. Faintich9u describes capabilities for generating displaysin which elevation is a function of gray level contoured displays, shadedrelief displays, and stereo displays. Dungan9 describes an algorithm imple-mentation which can have several surfaces in gridded data format. Thus, visualeffects such as clouds or haze can be generated from a grid data base.
Algorithms which transform gridded data into more efficient forms are
described in Section 4.
PARAMETRIC SURFACES
This class of surface modeling divides the surface into patches whoselocation is specified in world coordinates. Within each patch the surfacevariation is described in terms of parametric functions chosen for their abilityto efficiently model the surface within the patch. Planar patches are identicalto the polygon point set representation. Quadric patches utilize quadricalgebraic functions within a patch. The next level of surface complexitywithin a patch is that described by bicubic functions and so on. Forrest92
gives a good summary of the various patch modeling and designing techniques.Depending on the specific patch technique used, the data base will contain
87Strat, T., "Shaded Perspective Images of Terrain", ADA055070, March 1978.
88Unruh, J.; Alspaugh, D.; and Mikhail, E., "Image Simulation From DigitalData", in Proceedings of American Congree on Surveying and Mapping, 1977.
89Schachter, B., "Computer Generation of Full Colored Textured TerrainImages", in Proc of 1st Interservice/Industry Training Equipment Conference,pp. 367-374, November 1979.
90Faintich, M.; Sigler, G.; and Fahy, D., "Digital Image Display andSimulation From Digital Terrain Data Bases", in Proc. of Digital TerrainModels (DTM) Symposium, American Society of Photogrammetry, pp. 610-616,May 1978.
9 1Dungan, W., "A Terrain and Clnud Computer Image Generation Model", ComputerGraphics, Vol. 13, No. 2, pp. 143-150, August 1979.
92Forrest, A., "Recent Trends in Computer Aided Geometric Design", in Proc.of International Conference on Interactive Techniques in Computer Aided Design,IEEE Catalog No. 78CH1289-8C, pp. 141-146, 1978.
25
NAVTRAEQUIPCEN IH-318
coefficients of the function within a patch or the location of control pointswhich cmn be used to generate the proper surface shape. Some techniquesutilize control points which are on the surface wbile others use controlpoints which are remote from the surface. Brewer9J describes patches whichcan be constructed from points on the surface. Quadric patches do not have
enough degrees of freedom to satisfy slope continuity between patches forarbitrary surfaces but can be used where such continuity is not required.Mahl 4describes algorithms for displaying surfaces made up of quadric patches.Algorithms f~r bicubic patches (Catmull95, 96, Hosaka 97 ) and biquintic patches(Munchmeyer g) have also been developed for displaying such surfaces. Wu99
describes a technique for storing surface data as sectional curves (two-dimensional profiles of the surface sliced into parallel sections). Hisalgorithm for displaying such a surface made up of B-spline functions inter-polates between sections using cardinal spline functions, Blinnl 0 , 101 hasdeveloped a technique for applying texture to parametric patches which yieldsvery impressive imagery. All of the patch display algorithms have one majordrawback at this time: they are too computationally expensive to operate ona complex scene in real-time.
93Brewer, J. and Anderson, D., "Visual Interaction With Overhauser Curvesand Surfaces", Computer Graphics, Vol. 11, No. 2, pp. 132-137, Summer 1977.
94Mahl, R., "Visible Surface Algorithms for Quadric Patches", AD-762017,December 1970.
95Catmull, E., "A Subdivision Algorithm for Computer Display of CurvedSurfaces", ADA 004968, December 1974.
96Catwull, E., "Computer Display of Curved Surfaces", in Proc. of Conf. onComputer Graphics, Pattern Recognition, and Data Structure, IEEE CatalogNo. 75CH0981-1C, pp. 11-17, May 1975.
97Hosaka, M. and Kimura, F., "Synthesis Methods and Curves and Surfacesin Interactive CAD", in Proc. of International Conference on InteractiveTechniques in Computer Aided Design, IEEE Catalog No. 78 CH1289-8C, pp.
9 151-155, 1978.
Munchmeyer, F. and Lau, G., "On the Iterative Design of Smooth PatchedSurfaces", in Proc. of International Conference on Interactive Techniquesin Computer Aided Design, IEEE Catalog No. 78CH1289-8C, pp. 147-150, 1978.
Wu, S.; Abel, J.; and Greenberg, D., "An Interactive Computer GraphicsApproach to Surface Representation", Communications of ACM, Vol. 20, No. 10,pp. 703-712, October 1977.
100Blinn, J., "Computer Display of Curved Surfaces", Ph.D. Thesis, Universityof Utah, December 1978.
101Blinn, J., "Geometric Representations in Computer Graphics" in Proceedingsof Workshop on the Representation of Three Dimensional Objects, Bajcsy, R.(ED.), The Department of Computer and Information Science, University ofPennsylvana, May 1979.
26
NAVTRAEQUIPCEN IH-318
VOLUME REPRESENTATIONS
Modeling solid objects can also be accomplished by representations inwhich the data base describes the objects as compositio:is of primitive solidbuilding blocks. The simplest form of such a data base is a three-dimensionalrectangular fixed grid of volume elements (Herinanl0 Z). Braidl03 models objectsas additions and subtractions of primitive solids such as cubes, wedges, andcylinders. Sorokal04 uses generalized cylinders as primitives. A generalizedcylinder is stored in the data base as a location, an axis and a functionwhich describes the cross section at each point along the axis. The Universityof Rochester Production Automation Project has generated a significant bodyof literature on solid modeling systems (Requichal85 , VoelckerlO 6 , Brownlo).
Volume representation can be very efficient in terms of data base storagerequirements. The rendering of such data bases into displays is, in general,more complex and computationally expensive than surface representation.
SEMANTIC REPRESENTATIONS
The data base which stores information in the form of a high-level lan-guage is probably the most efficient model form. The words "blue '59 Chevyparked in front of a hospital" can certainly be rendered into a display by thehuman brain. The processing required by a computer to produce such a renderingfrom such information is difficult to conceive. Semantic models are useful,
102Herman, G. T., "Representation of 3-D Surfaces by a Large Number of SimpleSurface Elements", in Proceedings of Workshop and Representation of Three-Dimensional Objects, Department of Computer and Information Sciences,University of Pennsylvania, May 1979.
103Braid, I., "The Synthesis of Solids Bounded by Many Faces", Communicationsof ACM, Vol. 18, No. 4, pp. 209-216, April 1975.
104Soroka, B. et al., "A Program for Describing Complex Three-DimensionalObjects Using Generalized Cylinders as Primitives", in Proceedings of IEEEComputer Society Conference on Pattern Recognition and Image Processing,pp. 331-339, June 1978.
105Requicha, A. and Voelcker, H., "Constructive Solid Geometry", U.S. Dept.of Commerce, PB281613, November 1977.
106Voelcker, H. and Requicha, A., "Geometric Modeling of Mechanical Partsand Processes", Computer, pp. 48-57, December 1977.
107Brown, C.; Requicha, A.; and Voelcker, H., "Geometric Modelling Systemsfor Mechanical Designs and Manufacturing", prepared for presentation atACM 78, December 4-6 1978.
27
J,71

NAVTRAEQUIPCEN IH-318
however, when the requirement is not to display in real-time but to organizea math model data base to allow to be intelligently addressed by themodeler or processor. (McKeown, AginlO9).
CONCLUSION
Brown110 summarizes the characteristics of a god modeling system as(a) geometric coverage and tolerance (includes the capability to representall shapes to the desired accuracy), (b) completeness (sufficient informationabout each object for current and future applications), (c) reliability (thesystem should be able to verify or guarantee the correctness of the data itcontains), and (d) efficiency (the representation should be capable of support-ing a variety of applications efficiently). Brown states that he knows of nogeometric modeling system with these characteristics although a half-dozenor more are currently under development.
As far as current practical systems are concerned, point set data baseswill continue to dominate CIG model representation. Regular grid models areeasiest to generate automatically and polygon models are easiest to displaywith :urrently available technology.
JI
08McKeown, D. et al., "A Hierarchical Symbolic Representation for anImage Data Base", in Proceedings of IEEE Computer Society Workshop on
jPicture Data Description and Management, pp. 40-44, April 1977.09Agin, G. J., "Hierarchical Representation of Three-Dimensional Objects
Using Semantic Models" in Proceedings of Workshop on the Representationof Three-Dimensional Objects, Bajcsy, R. (ED.) The Department of Computerand Information Science, University of Pennsylvania, May 1979.
10.
lOBrcwn, C. M., "Some Issues and Answers in Geometric Modelling" in Pro(eedingsof Workshop on the Representation of Three-Dimensional Objects, Bajcsy, R.(EC.), The Department of Computer and Information Science, University ofPennsylvania, May 1979.
28

NAVTRAEQUIPCEN IH-318
SECTION IV
DATA ACQUISITION AND REDUCTION
INTRODUCTION
The basic problem in modeling a real world environment is to transformreal world data into a form or structure which can be recognized by the CIGsystem which uses the model. The ultimate source of the real world data isthe real world but the data used by the modeler can already have been trans-formed into a non-CIG model and the problem can be one of transforming onerepresentation into another.
Currently, the environment models utilized by real-time CIG systems aregenerdted by tedious, manpower intensive techniques. The modeler utilizesdata sources such as maps, photographs, scale drawings, and blueprints. Thebasic information obtained from these sources is the three-dimensional locationof points in the real world and the spectral reflectance properties of surfacesin the real world. Based on the intended use and capacity of the CIG systemthe modeler makes subjective decisions on which points and surfaces should beincluded in the model. He then extracts the information from his data sources,puts the information in the form and structure required by the CIG system, andsubjectively evaluates hq imagery rendered by the CIG system using the modelas a data base. Monroe explains this process in great detail as implementedin the environmental model generation of what is the largest CIG data baseexisting. In actual practice many iterations of the above process are requiredbefore the modeler, the CIG system, and, possibly, the users are satisfied withthe model. As the capacity of real time CIG systems continually grows, the sizeand complexity of the environmental model needed to support the CIG must grow.Dependence on the manpower intensive techniques is inadequate to support suchgrowth in terms of efficiency and cost. Any techniques which can automateparts of the modeling process or reduce the amount of time required for themodeler to complete parts of the process should improve the overall efficiencyof the process. Of course, the cost of the automation must be balanced againstthe cost of the modeler's time. The acquisition of position measurements fromthe real world environment can be accomplished by a variety of techniques(Fuchs112). The most elementary method is by direct, manual measurement. Withthe aid of yardsticks, plumb lines, and calipers a great many objects can besucessfully measured. The modeler first determines what he considers to bepoints of interest on the object and then measures the coordinates of each ofthese points from a common reference position. The surface of the object is
111Monroe, E., "Environmental Data Base Development Process for the ASUPTCIG System", Air Force Human Resources Laboratory, Technical ReportAFHRL-TR-75-24, August 1975.
112Fuchs, H., "The Automatic Sensing and Analysis of Three-Dimensional'SurfacePoints From Visual Scenes", Ph.D. Dissertation available from UniversityMicrofilms, Ann Arbor, Michigan, 1975.
29I.
NAVTRAEQUIPCEN IH-318
then defined as a topological net over these key points. The resulting modeltends to be compact (since the modeler usually tries to minimize the number ofpoints he must measure) and an effective representation of the object. Thisminual technique can be automated to some degree by substituting a machinefor the yardstick and calipers. The machine can now perform the measuringfinction and the modeler need only designate the points of interest and theirconnectivity. Vickers113 describes such a system in which a machine sensestie three-dimensional coordinates of the tip of a wand. The modeler thentouches the wand to a point on the object and indicates to the machinethat iti; a point of interest by activating a switch on the wand. This technique,like the purely manual technique, is time consuming and not practical for largecomplex objects or environments. However, it is effective for small, simpleo)jects as long as the machine's "view" of the wand is not obstructed.
Fuchs 114 also discusses holographic and moire methods for data acquisitionbit the most practical data acquisition systems are based on multiple two-dimensional images. An entire technical field is devoted to this technique,slereo-photogrametry. Stereo-photogrammetry is based on the fact that the1,cation of the image of a point in a photograph defines a line along whichtie point must lie in the environment. Another photograph containing the samep)int but taken from another position defines another lire. The location wheretie two lines intercept defines the point location. An obvious advantage oftils approach is that there is no need for the modeler to decide on, or physi-cilly identify, the points of interest at the time the photographs are taken,since any point visible in both photographs can be located using the photographsalone.
There are many variations of the stereo technique. Fuchs115 describesa computer controlled, random axis, triangulating rangefin r with a mirrordeflected laser and revolving disc detectors. Sutherland1 describes theutili2atioi of a large area digitizing tablet with multiple pens to designate
1l3Vickers, D., "Sorcerer's Apprentices Head-Mounted Display and Wand", inProc. o' Symposium on Visually Coupled Systems: Development and Application,Brooks \FB, Aerospace Medical Division (Limited Distribution), pp. 522-540,Novembe" 1973.
114Fuchs, ., "The Automatic Sensing and Analysis of Three-Dimensional Surface
Points 'rom Visual Scenes", Ph.D. Dissertation available from UniversityMicrofilms, Ann Arbor, Michigan, 1975.
115Fuchs, I., "The Automatic Sensing and Analysis of Three-Dimensional SurfacePoints :rom Visual Scenes", Ph.D. Dissertation available from UniversityMicrofilms, Ann Arbor, Michigan, 1975.
116Sutherland, I., "Three-Dimensional Data Input by Tablet", in Tutorialon Compiter Graphics, IEEE Catalog No. EHO-147-9, pp. 266-274, 1979.
30
I-

NAVTRAEQUIPCEN IH-318
the poirt of interest in multiple views of the same object. (The multipleviews can extend in cpplexity from orthographic drawings to perspectivephotographs). Appell prefers orthographic projections since there is adirect correspondence between the two-dimensional view and two of thecoordinate axes in the data base.
The automation of stereo techniques requires that the machine be capableof deternining which image points correspond to the same object points inmultiple views containing the object. Such machines are currently used toproduce digital terrain models. They are effective when the surface to bemodeled is sufficiently textured in reflectance and yet sufficiently similarin two views that the machine can find the same point by correlation techniques.These sytems fail when the surface has large expanses of the same reflectance(such as deserts or lakes) or sufficiently rugged terrain that the views aretoo dissimilar to correlate, as the vertical side of a building which isvisible in one of the images but invisible in the other.
Ever if correlation techniques can generate the location of all pointsin a scene the modeler is still required to choose the points he wishes toinclude in his model (unless the form of his model is fixed grid). Buttechniques are available to assist him in this task. Digital and opticalimage processing technologies are capable (to a limifg degree) of analyzinga scene in terms of its natural boundaries. RobertsLo describes all of theelements of this process but the hardware sophistication at that time limitedimplementation to very simple scenes. Most of the application of thesetechnologies has been in the area of machine recognition. Recognition impliesthat the machine contains a reference model of the object or objects it isrequired to recognize. The output of such a machine is the decision as towhether a reference object is in the scene as well as its location andorientation rather than the geometric description of an arbitrary object.Image processing techniques offer methods for analyzing 2-D images in termsof their natural boundaries. Optical image processing has inherent speedadvantages over digital image processing. This has led to extensive researchinto applications where speed is required such as terminal guidance andthreat identification (Neff119). The Navy has attempted to use this*111117Appel, A., "Modeling in Three Dimensions", IBM Systems Journal, Nos. 3 and4, pp. 310-321, 1968.
118Roberts, L., "Machine Perception of Three-Dimensional Solids", inOptical and Electro-Optical Information Processing, J. T. Tippett et al.,EDS., MIT Press, Cambridge, Massachusetts, pp. 159-197, 1965.
19 Neff, J. and Flannery, D., "Air Force Research in Optical Processing',
in Optical Signal and Image Processing, SPIE, Vol. 118, pp. 2-5, 1971.
31

NAVTRAEQUIPCEN IH-318
powerful too] several times with little success. (Tr-mble120). Vatz 121
states that the optical processing field better get moving if it is tocompete in terms'of size, cost, capability and utility, with digital technology.
Since speed is not of prime importance in modeling an environment for CIGsystems, the digital processing technologies have the advantage and will bediscussed in further detail in this report. The reader is referred toCasasert 122 and Nesterikhin 123 for further informatioti on optical processing.
Software technologies also offer considerable assistance to the modeler.Digital data describing the geometry of an object or environment is alreadyavailable in many cases. Programs which transform this available data intothe CIG environmental model with little or no action requiyN of the modelercan be implemented. The trend in both the civilian (Edson' ) and military(DMA125) mapping communities is to record cartographic information in a machinereadable form. The computer aided design community, as part of the designprocess, records object and shape descriptions in macline readable form.Besides techniques for recording real world data the nodeler can use softwaretechniques to assist in designing (rather than modeliig). For example, themodeler can insert generically similar objects into tie environmentafter modeling an object just one time. This is called object instancing.
In the remainder of this section, photogrammetry, digital image processing,artificial intelligence, and software modeling aids are discussed in greaterdetail. In Section V the applications of these techniques in terms of specificmodeling tasks are discussed.
120Trimble, J., "Navy Optical Processing Programs for Systems Applications -
An Historical Overview", in Optical Signal and Image Processing, SPIE, Vol.118, pp. 96-99, 1977.
121Vatz, B., "The Moving Technology", SPIE, Vol. 118, Optical Signal and ImageProcessing, pp. 142-143, 1977.
122Casasent, D. ED., "Optical Data Processing Applications", Springer-Verlag,New York, 1978.
123Nesterikhin, Y.; Stroke, G.; and Kock, W., (Eds.), "Optical InformationProcessing", Plenum Press, New York, 1976.
124Edson, D. and Lee, G., "Ways of Structuring Data Within a Digital Carto-graphic Data Base", Computer Graphics, Vol. II, No. 2, Summer 1977.
125Defense Mapping Agency, "Product Specifications for Digital LandmassSystem (DLMS) Data Base, PS/ICD-E-F-G/100, July 1977.
32

NAVTRAEQUIPCEN IH-318
STER O PHOTOGRA1 ETRY
Basics. Phctogrametry is the science of taking measurements from photo-graphs. The two-dimensional location of an object'; image in a photograph isdirectly related to its two-dimensional direction from the camera's locationwhen the photogriph was exposed. Measurements on the photograph are usuallyin rectangular coordinates called photograph coordinates. The units of photo-graph coordinate! are usually microns. The real world direction of the objectis usually compu! ed as two angles, specifying a two-dimensional direction. Thethree-dimensiona location of an object can be determined from the ohotographiccoordinates of its image in two photographs which are taken from two differentlocations (stereo-photogrametry). The procedures and geometry of photogrammetryduplicate the real world measurements and computations of a surveyor. Just asin surveying, there is a variety of instruments available to assist in the dataacquisition and data reduction process leading to the production of a represen-tation of the real world to the desired degree of precision.
The best known application of photogrammetry is the generation of mapsand other cartographic products. In this application the photographs areusually aerial photographs. Aerial photos may be classed as vertical, inwhich the optical axis of camera is vertical and pointing down; low oblique,in which the optical axis is deviated from vertical but the recorded imagedoes not contain the horizon; and high oblique, in which the horizon is containedin the recorded image. Most aerial photogrammetry utilizes vertical photography.Terrestrial photogrammetry connotes photography in which the camera is fixedto the ground. If the optical axis is perpendicular to the vertical directionthe photographs are called horizontal photographs.
Single Photo. If the object being photographed lies in a plane perpendi-cular to the optical axis of the camera and the camera lens is free fromdistortion, the positions of image points in the photograph are directly re-lated to positions on the object by a simple scale factor. Figure 1 shows sucha situation.
OBJECT, JFILM
A LENSAPRINCIPAL
OBJECTbPOINTS OPTICAL a IMAGE
AXISi POINTS
Figure 1. Image of a Planar Object Perpendicularto the Camera Axis
33

NAVTRAEQUIPCEN IH-318
The scale of the photograph is the focal length (F) of the lens dividedby the object distance (D), assuming object distance is much greater than thefocal length. For example, a vertical aerial photograph taken from an altitudeof 10,000 feet with a lens of focal length of 6 inches has i scale of 1:20,000.The physical distance measured on the photograph oetween image points a andb is equal to the physical distance between A and B in the object plaie multi-plied by the scale factor. Using the same example, if a and b are meisured tobe Imm apart in photograph coordinates; A and B would be separated by 20 metersat the object plane.
Photogrammetry usually employs metric cameras for obtaining photographs.A metric camera has reference points, called fiducial marks, built into the focalplane which allow accurate recovery of the principal point of the photograrh.The principal point is where the optical axis intercepts the image plane(marked "o" in Figure 1). A metric camera is manufactured specifically fordimensional stability. It is calibrated for focal length, coordinates of t.heprincipal point, and residual lens distortion.
Tilt. When the optical axis is deviated from the direction perpendicularto the'ject plane, the image points are displaced relative to their positionsin the truly perpendicular case. Figure 2 shows this situation. A nominallyvertical aerial photograph is usually tilted from vertical due to uncontrollableangular positions of the aircraft. The effect of tilt on image points can becompensated by utilizing control points to determine the pointing directionof the camera. Tilt can occur about two axes (for example, aircraft pitchand roll axes). The process in which the effects of camera tilt are eliminatudis called rectification. Rectification only eliminates image point displace-ments for object points in the assumed object plane.
A4-
I B4b
Figure 2. Effect of Tilt on Image Point Locations
Relief. Although a plane object surface can be assumed in many casessuch as aerial photography of a flat terrain from a high altitude, the effectof surface relief or departure of the surface from a flat plane also causesimage displacement.
34
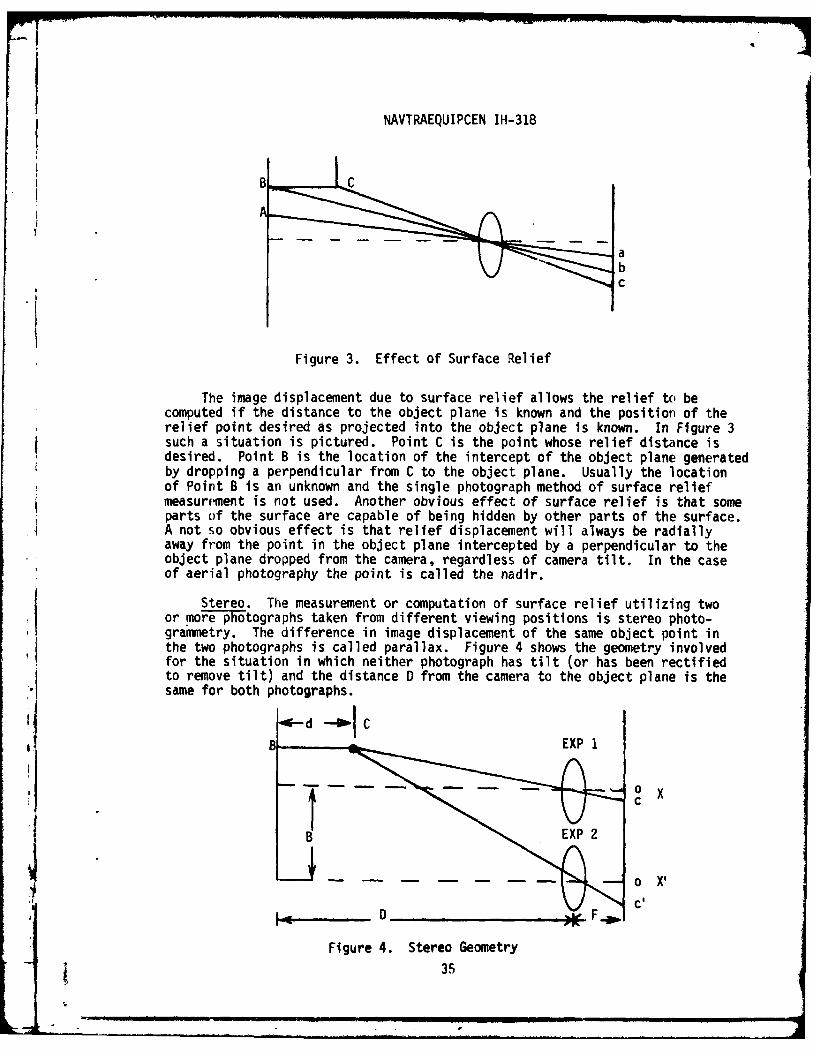
NAVTRAEQUIPCEN IH-318
BC
A
abC
Figure 3. Effect of Surface Relief
The image displacement due to surface relief allows the relief to becomputed if the distance to the object plane is known and the position of therelief point desired as projected into the object plane is known. In Figure 3such a situation is pictured. Point C is the point whose relief distance isdesired. Point B is the location of the intercept of the object plane generatedby dropping a perpendicular from C to the object plane. Usually the locationof Point B is an unknown and the single photograph method of surface reliefmeasuroment is not used. Another obvious effect of surface relief is that someparts of the surface are capable of being hidden by other parts of the surface.A not so obvious effect is that relief displacement will always be radiallyaway from the point in the object plane intercepted by a perpendicular to theobject plane dropped from the camera, regardless of camera tilt. In the caseof aerial photography the point is called the nadir.
Stereo. The measurement or computation of surface relief utilizing twoor more photographs taken from different viewing positions is stereo photo-grammetry. The difference in image displacement of the same object point inthe two photographs is called parallax. Figure 4 shows the geometry involvedfor the situation in which neither photograph has tilt (or has been rectifiedto remove tilt) and the distance D from the camera to the object plane is thesame for both photographs.
d -- C
B EXP 1
c
o X,
Figure 4. Stereo Geometry
35
NAVTRAEQUIPCEN IH-318
In Figure 4, B is the length of the baseline or the distance between the
camera exposure positions, C is the image of object point C on the two photo-graphs, o is the principal point on each photograph, X and X' are the distancesmeasured on the photographs between the principal points in a direction parallelto the baseline. The difference X-X' is called the parallax (p). From similartriangle relationships it can be shown that the relief distance d = BC isgiven by equation 4-1.
4-1. d = D B FP
In aerial photography the greatest single obstacle in utilizing the rela-tively simple relationships between parallax and relief is the presence of tiltin the photographs. Terrestrial photographs are easier to analyze since thelocation of the camera and its pointing direction can be precisely measured atthe time of exposure using standard surveying techniques.
Other Factors. There are several other factors which can cause imagedisplacement besides tilt and relief. These are: motion of the camera relativeto the object during an exposure, inherent distortion in the camera lens,stability of the principal point with respect to the fiducial marks or otherreferences, departure from flatness of the film at the time of exposure, thick-ness and resolution of the film, stability of the film against dimensionalchanges during processing and handling, and atmospheric conditions at thetime of exposure.
Photogrammetric Terms. There are several other terms used in photogrammetrywhich are of interest. The ratio of the length of the baseline (distance betweenexposure stations) to the object distance is called the base-height ratio. Thelarger the base height ratio, the greater the parallax and the smaller stereooverlap. In typical aerial photography, base height ratios of 0.6 are common.In close range photogrametry, base height ratios of 0.2 are common. The instru-ment or method used to make photogrammetric measurements are usually classifiedby a quality factor called the "C" factor. The "C" factor is the ratio ofobject distance to the accuracy with which relief can be measured. "C"factors range from approximately 500 to 5000 depending on the quality of theinstrument and the photographs. For example, an instrument being used togenerate terrain elevations from aerial photographs might have a "C" factorof 1,200. This indicates that height of the terrain could be measured towithin 10 feet if the aerial photographs were shot from an altitude of 12,000feet. Convergent photogrammetry describes photogrammetric measurements madefrom photographs taken with the optical axes purposely tilted. Convergentphotogrammetry is used when the base height ratio is desired to be large sothat parallax is large and easy to measure but the coverage or overlap of thephotographs is also desired to be large. The overlap area of two photographsdefines the area of the stereo model within which parallax can be determined.The area within the stereo model which is actually used for measurements iscalled the neat model. Photogrammetric measurements are usually made frompositive transparencies of the negatives exposed in the camera. These arecalled diapositives.
36

NAVTRAEQUIPCEN IH-318
Photogrametric Instruments. The determination of the geometry of a three-dimensional object from photographs utilizes instruments which fall into twogen(ral classes; instrumental and analytic. Although both classes utilizeins'.ruments, the differences in the techniques used to recover the three-dimensional description from the photographs are different. Both methods re-quire that a sufficiently dense network of control points or reference pointsbe i cquired from the object. Large-scale (objects are large in photographs)photography generally requires more control points than small-scale photo-graphy.
Instrumental Vs. Analytical Photograinetry. Instrumental photogrammetryis defined as the instrumental process of establishing three-dimensional loca-tions of object points from visual, spatial models. The models are formed ininstruments called stereoplotters which physically reverse the photograjhicprocess to create a small-scale, three-dimension1 model of .he surface whichwas photographed. Measurements can be made directly from the model withoutextensive mathematical computation. Figure 5 shows the basic arrangement ofa projection plotter. The two diapositives are mounted in a dual projector.The projected images are viewed in stereo by an operator.
A
a ba
~STEREO
~MODEL
i Xb_. X Xa
Figure 5. Projection Plotter
In order to allow only one projected image to be seen by each eye of theobserver the light is usually coded in some way, e.g., by color or polarization.The images are projected such that the stereo model apparently floats inspace above the surface of a table. In Figure 5 an object A is recorded at
37
-. -f s-nn ~ t.
NAVTRAEQUIPCEN IH-318
different positions in the two diapositives. Rays from each of the diapositivesof the image of object A will intersect or be coincident at point A in thestereomodel. By using a table which is capable of measuring X position(in this simplified two-dimensional example) and an elevation stage capableof measuring height above the table the coordinates of the point of coincidencecan be directly measured. The true coordinates can then be found by simplymultiplying by the scale of the stereomodel relative to the actual object size.Such instruments are commercially available which generate digitized x, y, acoordinates of any point in the stereo model within the limits of the instru-ment. The limitations imposed by the use of such instruments are dictated bytheir physical construction; e.g., mechanical limits of stage movements, limitson variation of scale, limits on format size, etc. Analytical instrumentsdetermine the object point location by computation involving the measuredlocation of the image points of the same object in the two photographs and thevarious parameters associated with the original photography.
The advent of relatively inexpensive computers has made analytic photo-grammetry the preferred method in recent years. The fundamental advantage ofanalytic photogrammetry is that there are no limitations or restrictions onthe geometry of the original photography due to the geometry of the measurementprncess.
Automatic Stereocompilation. The basic parameter desired to be measuredis parallax. This requires that the same object can be recognized by theinstrument in both photographs. In non-automatic methods the human operatorperforms this recognition function. Automatic instruments, on the other hand,must perform the recognition function without the aid of an operator. Thetechnique used in automatic instruments is to correlate an area of one photo-graph with areas of the other photograph until a correlation peak is obtained.For objects which lie in a plane or deviate from a plane only by a smallamount, this technique works well and has been implemented in the generationof terrain relief information from small-scale aerial photographs. In suchphotographs the earth's surface is essentially flat and the appearance of anobject in the two photographs is nearly identical allowing a high correlationpeak to be found. Problems arise with this technique when high correlationcannot be found or cannot be located to the desired accuracy in the photograph.Some examples of problem areas are: featureless areas in the photographs,such as featureless plains or bodies of water in the case of aerial photography,and areas of high relief where the differences between the two photographs aretoo great to correlate. An automatic instrument can be taught to overcomethese problems to some degree. For example, a body of water is recognized assuch and assigned the elevation of its shoreline. The use of epipolar
, geometry also aids in automatic correlation. Epipolar lines are lines on thephotographs defined by the intersection of the photograph planes with planeswhich contain both photograph perspective centers (epipolar planes). Theperspective center corresponds to the location of the camera lens when thephotograph is made. More specifically, the perspective center for the photo-graph image is the rear nodal point of the lens. For any particular epipolar
38
I. .. ..n

NAVTRAEQUIPCEN IH-311;
plane, conjugate imagery in the two photographs appears along conjugateepipolae' lines. By scanning the photographs along epipolar lines the imagecorrelation task is reduced from two-dimensional to one-dimensional. Auto-macic stereo compilation equipment is used extensively in the cartographiccoinmunity. In general, the use is restricted to small-scale aerial photography.The "C" factor of such equipments is in the range of 5,000. Areas wherecorrelation is difficult, due to lack of features or ground slopes in excessof 600, are generally beyond the instrument capabilities and require theassistance of a human operator to do the recognition task. Additionaldetai1 on the subject of photogrammetry may be obtained from Thompson126 andWolf 1 . A descr Dtion of automatic stereo compilation techniques are de-scribed by Helava!28 who invented the analytic plotter. Descriptions Tf^commercially available automatic equipmen is are also available (Bendix ,Abshier130, Kraus131, VanWijk132 , Allam j, Kelly134). Typical performanceof an automatic system is the production of a 700,000 point digital terrainmodel and an orthophoto in 90 minutes (Kelly135).
126Thompson, M. (Editor), "Manual of Photogrammetry", American Society ofPhotogrammetry, Falls Church, VA, 1966.
127Wolf, P., "Elements of Photogrammetry", McGraw-Hill, New York, 1974.
128Helava, U., "Instruments and Methods for Digital Terrain Model DataCollection", in Proc. of the Digital Terrain Models (DTM) Symposium, AmericanSociety of Photogrammetry, pp. 61-71, May 1978.
129Bendix Research Laboratories, "Photogrammetry at Bendix", Bendix Center,Southfield, Michigan, 48076.
S 130Abshier, J., "TA3/PA and AS-11B-1 Improvement Study", AD904906L, September1972.
131Kraus, K.; Otepka, G.; Loitsch, J.; and Haitzmann, H., "DigitallyControlled Production of Orthophotos and Stereo-Orthophotos", PhotogrammetricEngineering and Remote Sensing, Vol. 45, No. 10, pp. 1353-1362, October 1979.
132VanWijk, M., "Geometrical Quality of Stereo-Orthophotos Produced FromAutomatic Image Correlation Data", Photogrammetric Engineering and RemoteSensing, Vol. 45, No. 10, pp. 1363-1369, October 1979.
133Allam, M., "DTM's Application in Topographic Mapping", in Proc. of DigitalTerrain Models (DTM) Symposium, American Society of Photogrammetry, May1978.
134Kelly, R.; McConnell, P.; and Mildenberger, S., "The Gestalt PhotomappingSystem", Photogrammetric Engineering and Remote Sensing, Vol. 43, No. 11,pp. 1407-1417, November 1977.
Kelly, R.; McConnell, P.; and Mildenberger, S., "The Gestalt PhotomappingSystem", Photogrammetric Engineering and Remote Sensing, Vol. 43, No. 11,pp. 1407-1417, November 1977.
39
NAVTRAEQUIPCEN IH-318
Orthophotography. The production of an orthographic perspective view froma pair of stereo photographs is called orthophotography. The orthophotographis essentially a photograph in which the image displacement due to relief hasbeen removed. All object image points in the orthophotograph have photographcoordinates which directly correspond to coordinates of the object in theobject plane. In the case of aerial photography the object plane coordinates
*might be latitude and longitude. In this case relief is elevation and apoint on the orthophotograph is associated with a single latitude-longitudevalue regardless of the terrain elevation at that point. Orthophotographscan be produced opto-mechanically or analytically.
Digital Photogrammetry. Many digital computational techniques are beinginvestigated and implemented in the field of photogrammetry. Most of theseinvolve the conversion of a photograph into a form recognizable by a computer.This is generally accomplished by quantizing the density or transmission ofthe photograph at discreet, digitized locations in photograph coordinates.The digitizing and quantizing operations will be discussed in the section ondigital image processing. The resultant digital image is a mathematical entitywhich can be manipulated by a computer (Rosenfeld135). Panton136 ,137 describesa technique for producing digital terrain models from digital images utilizingepipolar geometry for correlation search strategies. He also recommends theutilization of bi-cubic patch models based on a rectangular grid for surfacedescription. Hunt 138 presents a simplified theory of the relation betweenerrors in calculation of terrain elevation and the observable parameters ina digitized stereo pair. Keating 139 gives the computer memory storage require-ments for a digitized stereo pair of 9" aerial photographs as 5 X 100 bitstogether with the resultant model storage requirement of 108 bits. Keating 140
also describes the procedure to produce an orthophoto from an unrectified aerialphoto and a digital terrain model.
135Rosenfeld, A., "Extraction of Topological Information From DigitalImages", ADA042125, June 1977.
136Panton, D., "Digital Orthophoto Study", ADA020066, December 1975.
. 137Panton, D., "A Flexible Approach to Digital Stereo Mapping", in Proc.of Digital Terrain Models (DTM) Symposium, American Society of Photogrammetry,pp. 32-60, May 1978.
138Hunt, B. and Ryan, T., "Prediction of Correlation Errors in ParallaxComputation From Digital Stereo Images", in Applications of Digital ImageProcessing, SPIE, Vol. 149, pp. 222-231, August 1978.
139 Keating, T., "Analytical Photogrammetry From Digitized Image Densities",1 9Ph.D. Dissertation, University of Wisconsin, 1975, (Avail. NTIS).
140Keating, T. and Boston, D., "Digital Orthophoto Production Using ScanningMicrodensitometers", Photogrammetric Engineering and Remote Sensing, Vol.45, No. 6, pp. 735-740, June 1979.
40

NAVTRAEQUIPCEN IH-318
Close Range Photogrammetry (CRP). CRP is not amendable to automaticoperation since the relief is large and corresponding images are usuallytoo different to be correlated. Large relief also makes analytic pho -
grammetry more advantageous than instrumental photogrammetry. Karara~i1and Jaksic 142 describe the hardware and software available for close I gephotogrammetry. An interesting application of CRP is found in Liebes
Color Orthophotography. Once the relief of a surface has been determined,any type gf photographic imagery can be transformed into an orthophoto.Konecn 14~ descibes a procedure for producing true color orthophotos.Martin 45 describes the production of false color orthophotos from visuial aridnear IR photos.
Non-Metric Cameras. If a sufficient number of control points are known,the dT~tortions and lack of registration information associated with ordinarycamera; can be compensated in making photogrammetric measurements. Abdel-Aziz 146
has im)lemented such an approach with the conclusion that photographs takenwith a $20 hand-held camera were capable of generating position informationaccura.e to 2m for an average object distance of 5 meters ("C" factor of2,500). His analysis indicates that a minimum of 6 object control points arerequired and near co-planar control points should be avoided. This indicatesthat with proper analysis techniques and some knowledge of the dimnsions andlocation of the object one can take any camera and simply take seviral photo-graphs of it to obtain three-dimensional coordinate information.
141Karara, H., "Industrial Photogrammetry", in Pro(.. of Symposium on Close-Range Photogrammetric Systems, American Society of Photogranmnetry, pp.97-141, July 1975.
142Jaksic, Z., "Analytical Instruments in Close-Range Photogrammetry", inProc. of Symposium on Close-Range Photogrammetric Systems, American Societyof Photogrammetry, pp. 538-555, July 1975.
143Liebes, S. and Schwartz, A., "Viking 1975 Mars Lander InteractiveComputerized Video Stereophotogrammetry", Journal of Geophysical Research.Vol. 82, No. 28, pp. 4421-4429, September 1977.
144Konecny, G., "Methods and Possibilities for Digital DifferentialRectification", Photogrammetric Engineering and Remote Sensing, Vol. 45,No. 6, pp. 727-734, June 1979.
145Martin, S., "Color Image Maps From Black and White Photographs",Photogrammetric Engineering and Remote Sensing, Vol. 46, No. 2, pp. 193-200,February 1980.
146Abdel-Aziz, Y. and Karara, H., "Photogrammetric Potentials of Non-metriccameras" University of Illinois at Urbana, PB-231-254, March 1974.
41

NAVTRAEQUIPCEN IH-318
FEASIBILITY
An evaluation of stereophotogrammetry applied to generating a polygonmodel was made using a scale model of a ship. The scale model was photographedfrom two positions using a metric camera. A projection stereoplotter wasthen used to digitally determine the three-dimensional coordinates of operatorchosen vertices of polygons. This data was then manually keyed into a computeraided design work station in the format required by the NAVTRAEQUIPCEN CIGsystem. (This step would not be necessary if the stereo analysis equipmentwere interfaced directly to the modeler's display). Since the ship model wassynmetrical about a vertical plane, only one side had to be digitized. Theresultant wire frame model is shown in oblique perspective in Figure 6.
A comparison of this technique to manual digitizing methods cannot bemade since the cost of manually generating three-dimensional vertices hasnot been analyzed. The cost of the stereo method can be estimated as followsfor a typical airport environment containing approximately 10,000 vertices:Non-recurring - stereo-plotter and computer graphics display $100,000;recurring costs - aerial photography and ground control $5,000; plotterset-up (36 stereo pairs) $1,000 and digitizing time $5,000.
DIGITAL IMAGE PROCESSING
Basics. A digital image is an image which has been discretized bothin spatial coordinates and luminance. A digital image may be considered asa matrix whose row and column indices identify a point in the image and thecorresponding matrix element value identifies a gray level at that point.The elements of such a digital array are called picture elements or pixels(Gonzalez147 ). Digital image processing consists of mathematically manipulatingdigital images to extract information. The two principal applications ofdigital image processing are the improvement of pictorial information forhuman interpretation and the processing of picture data for autonomous machineperception. The basic elements of a digital image processing system, utilizedas an aid to picture interpretation, are a digitizer, a digital computer, anda display. The digitizer converts the image into a machine recognizableform, the computer performs the desired mathematical manipulations and the dis-play converts the results into an operator readable form.
Digitizers. The conversion of a continuous tone image such as a photo-graph into a digital image is accomplished by a digitizer. Digitizers aremost commonly either scanning microdensitometers or television cameras.Microdensitometers are used when high precision is required and the inputimage is in the form of a transparency. TV cameras are more flexible in termsof the form of the input data, less precise, and faster than microdensitometers.
147Gonzalez, R. and Wintz, P., "Digital Image Processing", Addison-WesleyPublishing Co., Reading, Massachusetts, 1977.
42
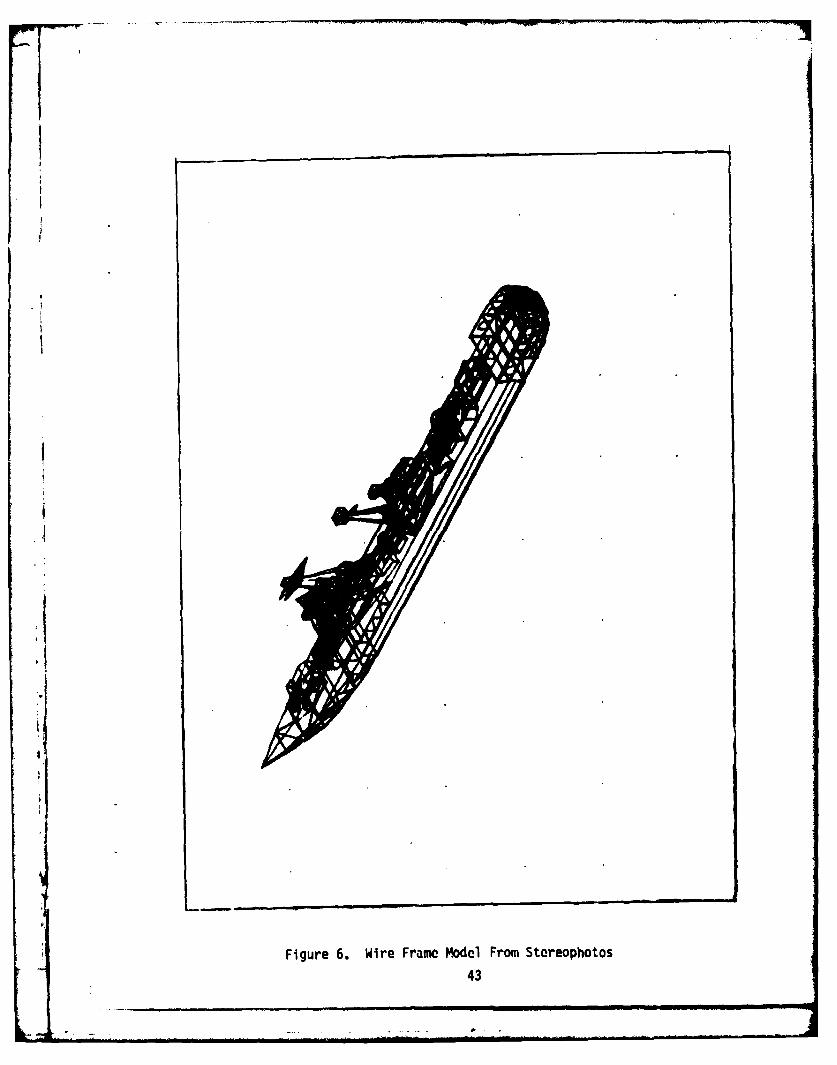
Figure 6. Wire Frame Model From Stereophotos43
NAVTRAEQUIPCEN IH-318
Both types of systems use a photosensor to sense the light level from each
point in the image. The light level is then assigned a quantized gray levelrepresenting the pixel. The gray level assigned can be linearly or non-linearly related to the output of the photosensor. Therefore, some "analog"processing can occur before the picture is digitized. The effect of analogprocessing on the image is similar to the effect of changing brightness orcontrast on a broadcast television picture. Color digitizing is accomplishedby the use of color filters, monochrome color separations, or color sensitivephotodetectors. The sample or pixel size to which the original imagery isdiscretized is not independent of the original imagery. The discrete samplingof imagery leads to aliasing effects or the generation of spurious spatialfrequencies unless the spatial sampling is at least twice the resolution ofthe original imagery (Nyquist criterion). Therefore, the original imagerydigitizing process must consider aliasing and its effect on the desiredresult. Typical microdensitometers can digitize a photograph containing aquarter of a billion pixels quantized to 256 gray levels (8 bits) in a fewhours. A TV digitizer can digitize a TV frame of approximately one quartermillion pixels in a TV frame time of 1/30 second.
Digital Computer. The function of the digital computer in a digitalimage processing system is to perform some operation or operations on themathematical entity which is the digitized image. The operations range fromthe relatively simple operations used for image enhancement to extremely com-plex operations used for pattern recognition and machine understanding orartificial intelligence. Pratt 148 is an excellent reference for the varioustypes of operations which are performed on digital images.
Displays. The display of the results of the processing operations aredependent on the desired end product. For example, a processor might be animage enhancer whose function it is to provide a "better" version of the in-
* put image to the operator. A more complex processor might have the functionof determining whether a particular object's image is contained in the inputimage in which case the output is a yes, no, or maybe. For the modelingapplication of interest, the display would most likely be a raster scannedCathode Ray Tube (CRT), preferably a color shadow mask type, with some opera-tor interaction capability.
Image Enhancement Operations. The most basic operations of digital imageprocessing are those which operate on single pixels without regard to theremainder of the pixels in the image.
Histogram. The production of a histogram is perhaps the most basicoperation. A histogram is simply a count of how many pixels in the image havea particular gray level. The resultant plot which may be displayed to the
148Pratt, W., "Digital Image Processing", John Wiley and Sons, New York, 1978.
44

NAVTRAEQUIPCEN IH-318
operator on a CRT display or output in hard copy from a plotter wouldresemble Figure 7.
60
5.0# 40
PIXELS 30
20
1 2 3 A 4 5 6 7 8 9
GRAY LEVEL
Figure 7. Histogram
Histogram analyses do convey some information about a digitized image.Foi example, the histogram envelope might indicate that the image belongs toa (ertain class of images or that the image should undergo additional processing.In the case of multispectral images, e.g., color separations, each image has itsow histogram.
Cntrast Stretching. The digital image process which assigns differentgray TIvels to each pixel so as to make optimum use of the gray level range ofthe dislay is called contrast stretching. For example, the histogram of animage (is originally digitized) might be concentrated in only a few adjacentgray leiels. The contrast stretching operation would reassign the few adjacentlevels to displayed gray levels which are separated to the gray level limit ofthe display. Figure 8 shows the result of such an operation by comparing thehistogram of input image to the histogram of the displayed image.
PIXEL;
0 1so 1o ;'56 0 256
GRAY LEVELa b
Figure 8. Contrast Stretching (a) Input Image
Histogram (b) Displayed Image Histogram
45
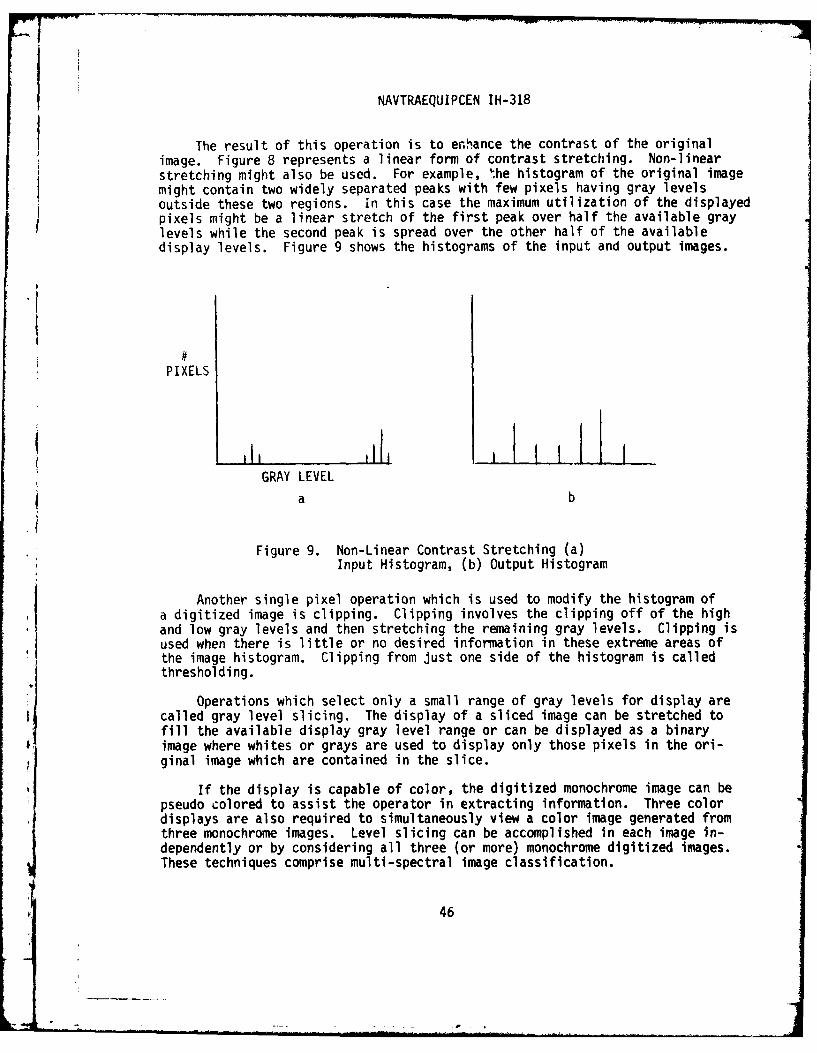
NAVTRAEQUIPCEN IH-318
The result of this operation is to enhance the contrast of the originalimage. Figure 8 represents a linear form of contrast stretching. Non-linearstretching might also be used. For example, the histogram of the original imagemight contain two widely separated peaks with few pixels having gray levelsoutside these two regions. In this case the maximum utilization of the displayedpixels might be a linear stretch of the first peak over half the available graylevels while the second peak is spread over the other half of the availabledisplay levels. Figure 9 shows the histograms of the input and output images.
PIXELS
GRAY LEVEL
a b
Figure 9. Non-Linear Contrast Stretching (a)Input Histogram, (b) Output Histogram
Another single pixel operation which is used to modify the histogram ofa digitized image is clipping. Clipping involves the clipping off of the highand low gray levels and then stretching the remaining gray levels. Clipping isused when there is little or no desired information in these extreme areas ofthe image histogram. Clipping from just one side of the histogram is calledthresholding.
Operations which select only a small range of gray levels for display arecalled gray level slicing. The display of a sliced image can be stretched tofill the available display gray level range or can be displayed as a binaryimage where whites or grays are used to display only those pixels in the ori-ginal image which are contained in the slice.
If the display is capable of color, the digitized monochrome image can bepseudo colored to assist the operator in extracting information. Three colordisplays are also required to simultaneously view a color image generated fromthree monochrome images. Level slicing can be accomplished in each image in-dependently or by considering all three (or more) monochrome digitized images.These techniques comprise multi-spectral image classification.
46
NAVTRAEQUIPCEN IH-318
The most widespread utilization of the above techniques is to classifyterrain areas in aerial or satellite images according to surface material. ALandsat image, for example, contains approximately 8 million pixels, each ofwhich has 4 gray levels associated with apparent brightness in 4 different
j spectrel bands. Each pixel in each band is quantized to a precision of 6 or 7bits. The total number of different valuy 9 (or 4-vectors) which a pixel canhave is in excess of 100 million. Jayroe in analyzing a typical Landsatimage found that one third of the pixels were unique (there were no other pixelsin the image which had the same 4-vector). Another eighth of the pixels wereduplicated once. The most common vector was associated with 3,000 pixels.Jayroe stated that some landsat images such as those taken of a vegetatedterrain during a growing season had as many as 99% of the pixels with uniquevectors. Despite such classification statistics an operator can perform use-ful classifications to a high degree of accuracy with sufficient iterations onthe type of contrast stretching and level slicing employed. Ground truthmeasurements or the obtaining of information regarding the specific materialcontciined within a ground area covered by a specific pixel is important if theclassification is to accurately reproduce the location of real world surfacematerials. Problems encountered in classification by histogram analysis areprimarily due to the gray level or multispectral signature (combination of graylevels from several spectral bands) not being the same for the same materialin different images (such as photographs made at different times or fromdifferent locations, or with different cameras etc.). Even in a single photo-graph the same type of malgial may have different signatures in differentparts of the image (NagaoU).
Noise Cleaning. Digital images can also be processed by considering the* local neighborhood around a pixel and modifying the gray level of the displayed* pixel, based on the gray levels of the pixels around it. By appropriate choice
of algorithms the effect of such operations could be to low pass spatial filterthe image which minimizes high spatial frequency noise or to high pass filter:1 the image and emphasize edges or high spatial frequency information. Anotheralternative is to transform the image into a sum of spatial frequency components
*and display the pixels which have the particular spatial frequency relations ofinterest.
Noise in an image is usually of high spatial frequency. Low pass filtering
is accomplished by performing an average or weighted average of the pixel in thedigital image with its 8 nearest neighbors (or 15 or 24 nearest neighbors) andassigning the corresponding display pixel the average value. For example, anaverage of a white noise spot pixel gray level = 256, in a black background,neighboring pixel gray levels = 1, using an equally weighted filter over the
4|
149jayroe, R. and Underwood, D., "Vector Statistics of LANDSAT Imagery",NASA Tech Memo, TM 78149, December 1977.
150Nagao, M. et al, "Agricultural Land Use Classification of Aerial
Photographs by Histogram Similarity Method", Proceedings of IEEE ComputerSociety Conference on Pattern Recognition, pp. 669-672, November 1976.
47
NAVTRAEQUIPCEN IH-318
white pixel and its 8 nearest neighbors produces a display pixel of gray level= 29. Other noise cleaning masks might assign a weight of 2 to the pixel ofinterest and a weight of 1 to the neighboring pixels or a weight of 4 to thepixel of interest and weights of 2 and 1 to its immediate neighbors respectively.The result of noise cleaning tends to lose resolution since the operation reducescontrast of high spatial frequency information as well as reducing noise contrast.
Edge Enhancement. Edges or high spatial frequency information in a digitalimage can e extracted or utilized to enhance the original image. This isaccomplished by taking the difference between a pixel and its neighbors andassigning the gray level of the displayed pixel based on the difference. Byanalogy to the noise cleaning operation a weighted average is computed for eachpixel with negative weights assigned to the neighbors while a positive weightis assigned to the pixel of interest. An operation like this can be utilizedalong a row or column of the digital image matrix and so extract vertical orhorizontal edges independently. Similarly, by appropriate weighting of neigh-bors edges, running in any or all directions can be extracted. The operationwhich is concerned with any difference is called a gradient operation (sincethe form of the displayed image is approximately the gradient of the originalimage). Applying the gradient operation to a gradient image is called aLaplacian operation. Original images tend to be subjectively better when theirown Laplacian is added to them. The resultant image appears crisper to thehuman observer.
Besides improving the asthetic qualities of an image, the above operationsalso tend to simplify more complex image processing operations which requiresome machine understanding of the image structure. The more complex operationsare almost always preceded by the relatively simple operations of histogrammodification, noise reduction, and edge enhancement.
Image Restoration. When the original image has been aegradea due to someknown mechanism, the image can be restored to some degr by processipg it toremove the degradation due to the known cause. Andrews?9l and Pratt containdetailed information on the types of image degradation and image restorationoperations. Some sources of image degradation which are amenable to restorationtechniques are diffraction in the optical system, sensor non-linearities,optical system aberrations, film non-linearities, atmospheric turbulence, imagemotion blur, geometric distortion, sensor or film noise, and temporal effects.Digitizing the original imagery can also be a source for image degradation whichcan be counted in the processing.
151Andrews, H. and Hunt, B., "Digital Image Restoration", Prentice-Hall Inc.,New Jersey, 1977.
152Pratt, W., "Digital Image Processing", John Wiley and Sons, New York,1978.
48
NAVTRAEQUIPCEN IH-318
In practice a math model of the degradation process is developed ind aprocess derived from the model which will invert the degradation. It isapparent that such processing can become extremely complex if many degradationsare present. The specific restoration processes are not independent and theorder in which they are applied is important.
The conclusion to be drawn is that original imagery should contain littleor no degradation and the original image digitizing system should be designedto minimize degradation in the digitizing process. The assumption that adegraded image can be restored is optimistic and the better procedure wouldbe to eat the degraded image and obtain another original when possible andpractical.
Image Understandin . The tcnlg operations require no understanding onthe part of the machine. The machine just operates on one image to produceanother. The technology which is invoved with the design o machines W ccan extract information from the data available, make inferences as to thehigh-level structure of the information, test tho e inferences, and learn rommistakes is called artificial intelligence (Huntl9 , Winston 5 , Jackson155).The design of such machines tends to be analogoo to mental perception processes.The digitized image or scene is analyzed into segments or regions based onsome parameter such as gray level (or color) or gray level variation withinthe region. Such scene analysis is natural to biological visual perceptionprocesses. Each region is then classified as the image of a known object(recognition) or as the image of a new object (cognition) or as irrelevantinformation. Machines which are capable of such pyggesses have been implementedwith some success in limited applications (Kasvand ). The applicationsusually involve scenes of limited complexity or classification to a limitednumber of object types.
Segmentation. The data in a digital image is gray level or color for
each pixel. The information which is to be extracted from this data can takei many forms and so there are many varied paths used to arrive at the desired
information. One of the most basic operations in scene analysis is to segmentthe scene into regions within which the gray level or some function of graylevel describes the pixels to the desired degree of fidelity. Once a scenehas been segmented, the boundaries of each region can be mathematically described.The boundaries of a region can be used to describe che shape of a region to themachine. Shape is a higher order description which may be the desired informa-tion or may be the input into a recognition process which matches or correlatesshapes.
153Hunt, E., "Artificial Intelligence", Academic Press, New York, 1975.154Winst)n, P. (Editor), "The Psychology of Computer Vision", McGraw-Hill
Book :ompany, New York, 1975.155jacks)n, P., "Introduction to Artificial Intelligence", Petrocelli/
Chart-2r, New York, 1974.
156 Kasvaid, T., "Some Observations on Linguistics for Scene Analysis", inProceadings of IEEE Computer Society Conference and Computer Graphics,Pattern Recognition, and Data Structure, pp. 118-124, May 1975.
49

NAVTRAEQUIPCEN IH-318
The most elementary segmentation algorithms analyze a scene by dividingit into regions having the same gray level. In the case of multispectralimages, the regions have the same color. The analysis of landsat imagery isamenable to this type of classification (Towles1 57 ). Problems arise whendifferences in gray level or color do not arise from surface material differencesbut from lighting, sensor, or atmospheric effects. A digital image segmentedby gray level into a binary image can be transformed into a line drawing typeof image by a gradient operation. In all but the most simple images, this willresult in the display of many unconnected lines of various lengths and orien-tations in which the boundaries of the various scene regions are imbedded.Techniques for eliminating or minimizing the extraneous lines include regionfilling. Region filling of the binary gray level slice is accomplished bychanging the value of a pixel if all of its surrounding neighbors have adifferent value. This is done prTor to the gradient operation to remove singlepixel anomalies. Many similar techniques are utilized in scene analysisalgorithms (Duda 158 ).
Segmentation can be accomplished by doing a gradient operation thengrowing a region by connecting line segments or edges extracted by the gradientoperation to surround regions.
Discrimination of regions by texture classification is a more sophisticatedprocess. Classification of terrain from aerial photographs has been studiedby Weszka 159 . He found that the best measure of texture was based on secondorder statistical differences. Tamura160 analyzed scenes according to thosetexture properties which resemble human perception pro esses. Segmentation andtexture classification has also been described by Tou Ii and Haralick162 amongmany others.
157Towles, R., "An Experimental Approach to Generation of Digital LandmassData Base Culture/Planimetric Files Using LANDSAT Imagery and MultispectralImage Analysis Techniques", Proc. American Society of Photogrammetry, FallTechnical Meeting, October 1977.
158 Duda, R. and Hart, P., "Pattern Classification and Scene Analysis", JohnWiley and Sons, New York, 1973.
159Weszka, J.; Dyer, C.; and Rosenfeld, A., "A Comparative Study of TextureMeasures for Terrain Classification", IEEE Trans on Systems, Man, andCybernetics, Vol. SMC-6, No. 4, pp. 269-285, April 1976.
160Tamura, H., "Textural Features Corresponding to Visual Perception", IEEETransactions on Systems, Man, and Cybernetics, Vol. SMC-8, No. 6, pp. 460-473,June 1978.
16 1Tou, J. etal., "Picture Understanding by Machine Via Textural FeatureExtraction", in Proceedings of IEEE Computer Society Conference on PatternRecognition and Image Processing, pp. 392-399, June 1977.
162Haralick, R.; Shanmugam, K.; and Dinstein, I., "Textural Features ForImage Classification", IEEE , Trans. on Syst., Man, and Cybernetics, Vol.SMC-3, pp. 610-621, November 1973.
50
... . . l llL 7i . . . .
NAVTRAEQUIPCEN IH-318
Once an image has been segmented into meaningful regions, the shape of theregion or the content of the region can be further analyzed.
Pattern Recognition. The technology of automatically recognizing a graylevel ditribution within a region or the shape of a region as belongifig toone of a number of classes is called pattern recognition. Once a scene hasbeer segmented, a variety of algorithms are available to assist in the recognitionprocess (Agrawala163). Davis164 provides a survey of techniques used'to findedges. Hueckel165 and Dudalbb describe algorithms for locating lines and edgesbased on gray level. Nevatia 167 used color for edge detection and scene seg-mentation.
The edges bounding a region may be obvious to a human operator but themachine must also be capable of knowing edges if it is to know the shape ofthe region. Nevatia1 68 describes an algorithm which finds groups of edges thatconitect in a straight line and then links them to form a boundary. Agin 169
des(.ribes an algorithm which finds roads in an aerial photograph. Hwang 170
uses both global and local edge information to locate region boundariesenabling the machine to interpolate through image areas where the edge may behidden. Once the machine has what is essentially a line drawing of the scene,it can proceed with the recognition of description process. This may involvetemplet matching in which case the machine has a stored library of specific
163Agrawala, A., "Machine Recognition of Patterns", IEEE Press, John Wileyand Sons, Inc., New York, 1976.
164Davis, L., "A Survey of Edge Detection Techniques", Computer Graphicsand Image Processing, Vol. 4, pp. 248-270, 1975
165Hueckel, M., "An Operator Which Locates Edges it; Digitized Pictures",Journal of the Association of Computing Machines, Vol. 18, pp. 113-125,
*January 1971.166Duda, R. 0. et al, "Use of the Hough Transformation to Detect Lines and
Curves in Pictures", Communications of the Association for Computing Machines,V l. 15, pp. 11-15, January 1972.
167Nevatia, R., "A Color Edge Detector and its Use in Scene Segmentation",
IEEE Trans. on Systems, Man, and Cybernetics, Vol. SMC-7, No. 11, pp. 518-524,November 1977.
168Nevatia, R., "Locating Object Boundaries in Textured Environments", IEEETrans on Computers, Vol. C-25, No. 11, pp. 1170-1175, November 1976.
169Agin, G. et al., "Interactive Aids for Cartography and Photo-Interpretation",
ADA056355, June 1978.
170Hwang, J.; Lee, C.; and Hall, E., "Segmentation of Solid Objects Using
'Global and Local Edge Coincidence", in Proceedings of IEEE Computer Society'sConference on Pattern Recognition and Image Processin , pp. 114-121, August1979.
51
I -B
t s c o NAVTRAEQUIPCEN IH-318
templets which can be compared to the regions found. Another alternative is toutilize t-mplets of generic features to interrogate the image. Each regionshape will have a particular signature when operated on by all of the featureextractors. If the reference object has been characterized by a particularfeature signature, then regions could be classified by comparing c.eir signatureswith the reference signatures. By application of pcttern recognition techniques,many two-dimensional region shapes can be classified. However, unless allpotential object images are known prior to processing, there will be an"unknown" class, even if their is no "noise" or mistakes in the edge extractionprocess. Despite the fact that scene analysis has not been perfected for anarbitrary two-dimensional image, investigators have proceeded to three-dimensional scene analysis.
Three-Dimensional Scene Analysis. This can be divided into single-viewand multiple-view scene analysis. The single-view class can be based on match-ing a stored object description as seen from various viewing directionsagainst the projected boundary in the available view. Brooks 171 describes asystem which is supplied with generic descriptions of objects in a high-levelmodeling language (objects are segmented into generalized cones). Views of thestored objects are then matched to the information obtained from scene processing.McKee 172 describes algorithms which operate on an edge image to define surfacesbounded by edges. In subsequent views, each edge is compared to previouslystored edges or assigned as a new edge. This system can then recognize orlearn. Hemami 173 works from objects whose silhouettes can be found and comparedto the shape of regions. Guzman 174 first finds and classifies vertices (edgeintersections) in an image of a group of polyhedrons. By applying his algorithm,the machine can perform a three-dimensional scene segmentation. Some investigatorshave utilized distance information acquired by some other means such as a laserrangefinder (Duda175 , Nevatia1 76 ) to allow the task of object recognition orthree-dimensional scene analysis to be simplified.
17 1Brooks, R. A. et al., "Progress Report on a Model Based Vision System"in Proceedings of Workshop on the Representation of Three DimensionalObjects, Bajcsy, R. (ED.), The Department of Computer and InformationScience, University of Pennsylvania, May 1979.
~~172Me, McKee J. and Aggarwal, J., "Computer Recognition of Partial Views ofThree Dimensional Curved Objects", in Proc. of Conference on Pattern Recog-nition, IEEE Catalog No. 76 CH1140-3C, pp. 499-503, November 1976.
173Hemami, H.; Weimer, F.; and Advani, J., "Identification of Three-Dimensional
Objects by Sequential Image Matching", IEEE, Proc. of Conference on ComputerGraphics, Pattern Recognition, and Data Structure, Catalog No. 75CH0 981-1C,pp. 273-278.
174Guzman, A., "Computer Recognition of Three-Dimensional Objects in a VisualScene", Ph.D. Thesis, Massachusetts Institute of Technology, December 1968.
175Duda, R. et al., "Use of Range and Reflectance Data to Find Planar SurfaceRegions", IEEE Transactions on Pattern Analysis and Machine Intelligence,Vol. PAMI-1, No. 3, July 1979.
176Nevatia, R. and Binford, T., "Description and Recognition of Curved
Objects", Artificial Intelligence, Vol. 8, pp. 77-98.
52
NAVTRAEQUIPCEN IH-318
The three-dimensional scene analysis class which utilizes more than oneview of the scene includes stereo photogrammetry. This class also includesthe description of scenes or recognition of objects all of whose surfacesare not visible in any of the multiple views. Zucker177 divides the s(enespace into volume elements hecalls voxels. His algorithm then determines theorientation of a plane that separates volumes of different voxels when differ-ent views are used. Della Vigna178 and Henderson179 describe algorithmswhich describe three-dimensional scenes composed of planar objects. DellaVigna states that the most crucial problem is identifying the same vertex intwo different views. Nevatia 180 and Lacina181 describe algorithms which trackthe same object point in multiple images. Nevatia's technique utilizes manydifferent views to track the same point with measurement only needing thoseviews at the extremes of visibility. Potmesil182 illuminates the object witha projected grid. His algorithm then finds the same grid intersections inthe different views. This works well as long as all grid intersections arevisible in at least two views. Shapira18 3 describes an algorithm which con-structs a description of a three-dimensional scene from multiple views byassuming that objects are composed of planar or quadric surfaces and allvertices are formed by exactly three faces.
177Zucker, S. and Hummel, R., "An Optimal Three-Dimensional Edge Extractor",in Proceedings of IEEE Computer Society's Conference on Pattern Recognitionand Image Processing, pp. 162-168, August 1979.
178 Della Vigna, P. and Luccio, F., "Some Aspects of the Recognition ofConvex Polyhedra From Two Plane Projections", Information Sciences, Vol.2, pp. 159-178, 1970.
179Henderson, R.; Miller, W.; and Grosch, C., "Automatic Stereo Reconstructionof Man-Made Targets", SPIE, Vol. 186, pp. 240-248.
180Nevatia, R., "Depth Measurement by Motion Stereo,", Computer Graphics and,* Image Processing, pp. 203-214, May 1976.
*1 181Lacina, W. and Nicholson, W., "Passive Determinetion of Three DimensionalForm From Dynamic Imagery", SPIE, Vol. 186, pp. 178-189, May 1979.
182Potmesil, M., "Generation of 3-D Surface Descriptions From Images ofPattern-Illuminated Objects", in Proceedings of IEEE Computer SocietyConference on Pattern Recognition and Image Processing, pp. 553-559,August 1979.
183Shapira, R. and Freeman, H., "Computer Descript*on of Bodies Boundedby Quadric Surfaces From a Set of Imperfect Projections", IEEE Trans. onCompute!rs, Vol. C-27, No. 9, pp. 841-854, Septe iber 1978.
53
--I uI I-
NAVTRAEQUIPCEN IH-318
Summary. The application of digital image processing techniques to environ-ment modeling must be restricted to automated rather than automatic operationat the present time. Automatic technique development has been and will continueto be driven by applications where a human operator cannot be utilized and sothe technology will eventually be available to the CIG modeler with or withouthis support. Currently digital image analysis and processing techniques cangreatly aid the modeler with relatively simple algorithms and operations whichdo not require a high degree of machine sophistication. For example, weightedaveraging can allow the operator to observe an object at various resolutionlevels; digitizers can determine appropriate colors of scene elements; three-dimensional geometry of objects or vertices can be determined from multipleviews with the operator indicating the same point in each view.
FEASIBILITY
The digital image processing facility at Kennedy Space Center was visitedand a small experiment was conducted. A color aerial photograph of an urbanarea was digitized into three-digital images using a television digitizerwith three color filters. The three images were then processed together andseparately to determine whether the machine could readily extract regions whichwere very apparent to the human observer. The features chosen were lakes andmajor roads. The techniques used were histogram analysis for the lakes andboth histogram analysis and gradient operations for the roads. In neithercase did the processing reduce the time it would have taken for an operatorto manually digitize those particular features using the same image on adigitizing table. Admittedly, the image was complex and the processing algorithmsutilized were relatively simple. But the fact remains that an experiencedoperator of the equipment required at least an hour to create a major roadmap on the display. The same map could be created from the original imageand a digitizing tablet in less than 10 minutes. The relative ease withwhich colors of regions could be determined does allow digital image process-ing to be a viable assistance to the modeler.
SOFTWARE TRANSFORMATION
In many cases the information required to construct an environment modelalready exists in some machine recognizable form. The prime example of thisis digital terrain models which have been assembled for cartographic purposes.
.4 Such digital terrain models are usually derived from automated stereo photo-grammetric instruments in the form of fixed grid point sets. Although the fixed
1. grid format is used in some digital terrain models most transform the fixed gridinto an irregular grid. Fowler 184 describes a procedure for transforming afixed grid to an irregular triangular network. The difficulty encountered with
184Fowler, R. and Little, J., "Automatic Extraction of Irregular NetworkDigital Terrain Models", Computer Graphics, Vol. 13, No. 2, pp. 199-207,August 1979.
I 5
NAVTRAEQUIPCEN IH-318
this procedure is insuring the capture of important topojraphical features suchas ridge ];jes and stream beds. In practice these must be added manually.Jancaitis' converts a fixed grid digital terrain model into polynomialpatches-using a least squares criteria. Patch size is determined by how wellthe polynomial fits the points within the patch. Other transformation techniqueshave been or are being developed for the creation of radar and visual databases from fixed grid digital terrain models.
Since object contours or cross sections can be generated in many ways ,sof-ware transformation from contour information is also desirable. Fuchs18ohas developed a technique which will tile the surface of a three-dimensionalobject whose cross sections are simple closed curves with triangular polygons.The tiled surface generated is valid at all of the given contours to a givenprezision.
Although this report is primarily concerned with the modeling of a realworld environment, there is some advantage to having a system with which theoperator can sculpt objects rather than copy existing objects. Parent 187
describes the sculptor's studio environment of the Computer Graphics ResearchGroup at Ohio State University.
Besides transformation programs another important software function is thebookkeeping required to insure that the modeled environment confQrms to therequirements of the real time CIG system. For example, Monroe 188 describesthe limitations imposed on a polygon data base in terms of the maximum numberof potentially visible edges from any one viewpoint as well as the maximumnumber of edges per object. The number of closed convex polyhedral objectswhich can be grouped to form a model is limited. The number of objects andthe numter of models within the field of view and range of view is also re-stricted. With proper software parameters, edge, object, and model countscar be monitored by the machine so that the real time CIG capacity is notexceeded by the environment complexity.
The development of transformation and bookkeeping software is highlysystem specific and not in the scope of this report.
18 5Jancaitis, J. and Moore, W., "Near Real-Time Application of DigitalTerrain Data in a Mincomputer Environment", AD-A054008, April 1978.
186Fuchs, H.; Kedem, Z.; and Uselton, S., "Optimal Surface ReconstructionFrom Planar Contours", Communications of the ACM, Vol. 20, No. 10, pp.693-702, October 1977.
187Parent, R., "A System for Sculpting 3-D Data", Computer Graphic;, Vol. II,No. 2, pp. 138-147.
188Monroe, E., "Environmental Data Base Development Process for thr ASUPT
CIG System", Air Force Human Resources Laboratory, Technical ReportAFHRL-TR-75-24, August 1975.
55

NAVTRAEQUIPCEN IH-318
SECTION V
SYSTEM RECOMMENDATIONS
INTRODUCTION
This section discusses the recommended design of an environmental database generation facility which utilizes the tools and techniques discussed inthe previous sections. The basic information to be recorded in the data baseis assumed to be geometric and appearance parameters. Current systems whichare utilized to generate environments will be described, followed by a discus-sion of the application of stereo photogrammetric and digital image analysistechniques to automating the tedious operator tasks. Finally, a recommendedapproach to improving the efficiency of the environment data base generationfacility at the NAVTRAEQUIPCEN will be proposed.
CURRENT SYSTEMS
Morland 189 describes the environment data base generation system developedby General Electric for the NAVTRAEQUIPCEN. It was designed to provide thecapability of generating environments specifically for the real time CIG systemat NAVTRAEQUIPCEN. It consists of three major subsystems; a digitizer station,a non-real-time CIG emulator, and a camera station. The digitizer station con-sists of a digitizing table, which provides the two-dimensional coordinates ofa point on the table indicated by an operator with an electronic pen, and aninteractive graphics display system which is capable of displaying perspectiveviews of wire frame models whose three-dimensional vertex locations and connec-tivity have been supplied by the operator either through the digitizing ofseveral two-dimensional views of a scene (usually orthographic views in theform of blueprints) or by operator insertion of coordinates through a keyboardor by modifying a previously digitized vertex by use of the digitizing tablet,an electronic pen, and a cursor on the display. Once the modeler has generatedand viewed the displayed wire frame model and is satisfied with its appearance,edge count, and object count, he is ready to record an object or model for theCIG data base. The type of information needed for an object description is; aunique object name, a designator as to whether it's two-dimensional or threedimensional, the number of vertices, the number of polygon faces, and the facedata (coordinates of vertices and color). Model descriptions include the typeof model, the names of the objects conposing it, the way in which the objectsjoin, the level of detail as a function of range, the size of the model, itsorientation, and priority information. An environment description includes the
,• name, the names of the models within the environment, the location and orienta-tion of the models within the environment, special codes for sun angle illumin-ation, and surface color blending. The real-time CIG emulator is a minicomputerprogran med to duplicate the perspective transformations and hidden surface algo-rithms implemented in the real-time CIG hardware at NAVTRAEQUIPCEN. The rendered
189Morland, D., "System Description - Aviation Wide-Angle Visual System (AWAVS)Computer Image Generator (CIG) Visual System", Technical Report NAVTRAEQUIP-CEN 76-C-0048-1, Naval Training Equipment Center, Orlando, Florida, February,1979.
56
NAVTRAEQUIPCEN IH-318
imagery is then fed to a film recording station which utilizes a monochrome,high-resolution CRT imaged onto recording film. Three exposures throuihcolor filters serve to produce a color image~for evaluation.
Schnitzer190 describes the data base development facility utilized bySinger-Link to provide environments for the Singer real-time CIG system. Hedescribes the construction of a CIG environment using the DMAAC DLMS database, culture files (DMA191). The culture files consist of a plan view ofthe ea -th's surface in which polygons define cultural feature boundaries ina high-level language description. The process utilized by Schnitzer semi-automa-ically generates three-dimensional environments from these two-dimen-sional polygons. The example cited utilized a culture file of much higherdensity than the standard DLMS product; 4300 vertices in one square mile.The concept to simply "extrude" each polygon into a three-dimensional objectis pow~rful and can be done fairly automatically for objects with verticalsides. However, there are many cases where the feature information must besupplemented by the modeler using other sources.
B ack 192 describes the environment generation techniques employed byEvans (nd Sutherland for their CIG systems. A digitizing tablet is the primesource of vertex coordinate determination from which wire frame models aremade. The wire frame model is interactively modified by the modeler. Soft-ware routines are used to transform line drawings to polygons and to definesolid objects.
A software routine allows the modeler to create a polygon tiled surfaceof revolution by just specifying a two-dimensional curve and the number ofpoiygons desired.
The development of three-dimensional graphics environments primarilyfor non-real-time graphics systems has been accomplished at several univer-sities. Clark 193 discusses the sculpting methods employed at The Universityof Utah. The novel system described employs a head mounted display and athree-dimensional wand. The sculptor simply moves the wand about to createthe environment which he then observes in three dimensions as his inputs are
190Schnitzer, A., "A Data Base Generation System for Digital Image Generation",in Poc. of 9th NTEC/Industry Conference, pp. 103-113, November 1976.
191Defeise Mapping Agency, "Product Specifications for Digital LandmassSystem (DLMS) Data Base, PS/ICD-E-F-G/00, July 1977.
192Black, S., "Digital Processing of Three-Dimensional Data to Generate Inter-active Real-Time Dynamic Pictures" in Three-Dimensional Imaging, SPIE, Vol.120, 1977.
19'Clark, J., "Designing Surfaces in Three-Dimensional", Comm. of ACM, Vol.19, 4o. 8, pp. 454-460, August 1976.
57
/J
NAVTRAEQUIPCEN IH-318
rendered. Clark concludes that three-dimensional interaction is far superior
to standard design techniques for three-dimensional environments. Greenberg194discusses the facilities at Cornell University. He describes four methods ofinteractively building an environment; assembling conglomerations of primitivevolumes, utilizing multiple two-dimensional views, utilizing serial cross-sections,and extruding two-dimensional shapes. He recommends that all of these tools beavailable to the modeler. Hackathorn195 describes the facilities of the ComputerGraphics Research Group at the Ohio State University. Based on the descriptionsof existing systems and available data acquisition technologies, the characteris-tics of an optimum environment data base generation facility can be defined to-
* gether with implementation recommendations.
INTERACTIVE SYSTEMS
Schneiderman1 96 describes the general policies to be considered in designinginteractive systems. These are summarized in fairly general statements basedon human factors experiments. Interactive systems should be simple to operatebut perform powerful operations. The operational procedures should be easyto learn and yet appeal to experienced users. Errors should be handled easilybut freedom of expression should not be restricted. The system developmenttime should be as short as possible with low cost and capability for futuremodifications. Although these statements are general, Schneiderman does givesome specific recommendations. The maximum response time should not exceedone or two seconds for simple user commands. In no cases should the responsetime exceed 15 seconds. In the case of environmental modeling, a simple commandmight be a vertex entry. A complex command might involve changing the viewpointand look direction for a rendered environment.
Recommendation. The interactive facility should be capable of rendering adisplay of a modified environment in less than 15 seconds. This requirementprecludes the utilization of a film writer as the display means. The preferredmethod of display is a CRT monitor having visual characteristics emulating thedisplay utilized in the real-time system and sufficient computation power torender an image in less than 15 seconds.
194Greenberg, D., "An Interdisciplinary Laboratory for Graphics Research andApplications", Computer Graphics, Vol. 11, No. 2, pp. 90-97, Summer 1977.
195Hackathron, R., "ANIMA I: A Three-Dimensional Color Animation System",Computer Graphics, Vol. II, No. 2, pp. 54-64, Summer 1977.
196Shneiderman, B., "Human Factors Experiments in Designing Interactive Systems",Computer, pp. 9-19, December 1979.
5
..... . 58

NAVTRAEQUIPCEN IH-318
DISPLAY SYSTEMS
Latta 197 analyzes display design both from the standpoint of displayoperator and from the limitations imposed by the state-of-the-art displayhardware. He concludes that a 14-inch square display having 1,024 x 1,024pixels viewed from a distance of 4 feet meets the acuity and comfortableviewing distancE requirements of the observer. The implementations of thisrecommendation requires some tradeoffs based on available displays. A 19"high-resolution color shadow mask CRT having 980 raster lines is probablythe best alternative. A more standard monitor (normal 525 line TV) wouldbe less expensive but require a viewing distance beyond the comfortablerange if acuity is to be maintained. A 2,048 x 2,048 display requires anuncomforlbly close viewing distance if the display acuity is to be utilized.Carlson1 lists 30 requirements for graphics terminals and evaluates availablegraphics terminals as inadequate for all but 12 of his requirements. Hubblel99
provides a survey and feature comparison of ten commercially available real-time color digital image displays. The utilization of more than one displaymonitor in a system allows stereo viewing or multiple operators. For stereoviewing on a single monitor Roese200 describes a field sequential stereo displaywhich is utilized with PLZT ceramic stereo glasses. The glasses are commer-cially available. Ohlson201 surveys various devices for allowing an operatorto interface with the interactive system. These include digitizing tablets,touch panels, joysticks, and trackballs. The use of horizontal tablets orother devices which allow the operator to rest his arm are preferable to theuse of light pens which must be positioned on the vertical surface of the CRTfrom the standpoint of reducing operator fatigue.
Recommendation. Operator station should consist of at least two displaymonitors; a color monitor having the capability of rendering imagery equivalentin color and acuity to the display driven by the real-time CIG, and a monochromecomputer terminal type display for alphanumeric interaction with the system.Operator controls should include a digitizing tablet or joystick as well asa standard terminal keyboard. The capability to view renderings in stereo canbe achieved through the field sequential stereo method noted above.
197Latta, J., "New Developments in Digital Image Processing Displays", SPIE,Vol. 164, pp. 164-171, 1977.
198Carlson, E., "Graphics Terminal Requirements for the 1970's" in Tutorial
on Computer Graphics, IEEE Catalog No. EHO-147-9, pp. 126-134, 1979.
I9 Hubble, L. and Reader, C., "State of the Art in Image Display Systems",SPIE, Vol. 199, pp. 2-8, August 1979.
200Roese, J., "Stereoscope Computer Graphics for Simulation and Modelling",Computer Graphics, Vol. 13, No. 2, pp. 41-47.
201Ohlson, M., "System Design Considerations for Graphics Input Devices",in Tutorial on Computer Graphics, IEEE Catalog No. EHO 147-9, pp. 282-290,1979.
59
NAVTRAEQUIPCEN IH-318
STEREOPHOTOGRAMI4ETRIC EQUIPMENT
Although digital terrain models are available from sources such as theDefense Mapping Agency and the U.S. Geological Survey, as well as high-levellanguage descriptions of type and class of cultural features as a function ofgeographic location, there are still a large number of shapes in the real worldwhose geometric descriptions do not exist in a digitized form. For thisreason, stereophotogrammetric techniques, specifically that class of photogram-metry known as close range or terrestrial photogrammetry, offer a means forassisting the modeler. The function of the stereophotogrammetric equipmentwould be to produce a geometric description of a specific cultural object fromstereo photographs. In many cases such a specific model could be used as ageneric model which can reside in a feature library to be called up, modifiedappropriately, and inserted into the environment. The type of equipment requiredincludes a camera for initial image acquisition and an analytical stereo plotterinterfaced to the system computer. In operation, the camera system would be usedto take stereo photographs of the desired object from a sufficient number ofviewpoints to insure complete stereo coverage. A number of object control pointswould be recorded at the same time. The analytic stereo plotter would then be
*used to create the stereo model. The operator would input the various controlparameters to properly orient the stereo model. The three-dimensional coordinatesof any operator selected point on the three-dimensional image of the object couldthen be automatically recorded. By using the keyboard, the operator can groupvertices as belonging to specific polygons and polygons as belonging to specificobjects etc.
Although stereophotogrammetric analysis systems based on the utilizationof two television images have been implemented (Yakimovsky202 , Liebes203 ), thegreater resolution of film based systems and the lack of need for rapid rawdata acquisition precludes their use for this application.
The speed with which an operator can digitize stereo models is a strongfunction of the relief and relief variation in the model. Speakman204 describesa task in which 21,035 points were encoded in 56 operator hours. If the stereomodel is amenable to automatic stereo correlation, it would be possible to haveit digitized as a service. Production costs for digital terrain models and
202Yakimovsky, Y., "Extracting Depth Information From a Stereo Pair", MilwaukeeSymposium on Automatic Control, pp. 311-316, 1974.
203Liebes, S. and Schwartz, A., "Viking 1975 Mars Lander Interactive Computer-ized Video Stereophotogrammetry", Journal of Geophysical Research, Vol. 82,No. 28, pp. 4421-4429, September 1977.
~204204Speakman, E. and Stanton, J., "Is the Stereoplanigraph Obsolete", American
Institute of Aeronautics and Astronautics, 1974.
60

NAVTRAEQUIPCEN IH-318
orthoplotos (Hagan205 , Gockowski206 , and Foster207 ) should not exceed $25 - $50 persquare nile when elevations are required on a fixed 30 meter grid.
R(. ommendation. Stereo analysis equipment consisting of a metric camera,survey ig instruments (to obtain ground control) an analytical stereo plotter andsoftwaie to interface to modeling system is recommended. The products of sucha systun would be specific object geometric models which can be used as genericmodels to form an environment.
DIGITAL IMAGE PROCESSING EQUIPMENT
The application of digital image processing equipment to interactiveenvironmental data base development is relatively limited in that the tasks whichare done best by current equipment have, for the most part, been done. Thesegmenting of a geographic area into areas labeled with predominant featureclassifications is included in the digital land mass system (DLMS) (DMA208 ).The more sophisticated artificial intelligence type of applications are extremelylimited in scope and are best applied to specific pattern or shape recognitiontasks. However, there are some relatively simple application of digital imageprocessing which can be utilized by a data base modeler. These include; theuse of a digitizer to measure color of an object surface in a color photograph,the use of enhancement techniques to make imagery more comfortable to view orto emphasize classes of features, measurement of gray level variation or texturewithin an image region corresponding to an object surface.
Avdrews209 describes the digital image processing facility at the Universityof Soulhern California Image Processing Institute. Schrock210 and Gaibino2 l1describe the facility at the U.S. Army Engineering Topographic Laboratory.
205Hagan, W., "Observations on USGS - State Cooperative Mapping", PhotogrammetricEngineering and Remote Sensing, Vol. 45, No. 12, pp. 1617-1620, December 1979.
206Gockowski, J., "Mapping Cooperation Among Civilian Agencies", PhotogrammetricEngineering and Remote Sensing, Vol. 45, No. 12, pp. 1629-1631. December 1979.
207Foster, H.; Bos, J.; and Richie, C., "A Remote Sensing System for aNationwide Data Bank", in Proc. Machine Processing of Remotely Sensed DataSymposium, IEEE Catalog No. 77CH1218-7, MPRSD, pp. 160-171, June 1977.
208 Defense Mapping Agency, "Product Specifications for Digital LandmassSystem (DLMS) Data Base, PS/ICD-E-F-G/100, July 1977.
209Andrews, H., "An Educational Digital Image Processing Facility", C:oater,Vol. 10, No. 8, pp. 48-53, August 1977.
210Schrock, B., "Interactive Interpretation of Dig'tal Imagery", SPIF,Prcc. on Airborne Reconnaisance III, Vol. 137, pp. 188-194, March 1978.
211Ganbino, L. and Schrock, B., "An Experimental Digital Interactive Facility",
Computer, Vol. 10, No. 8, pp. 22-28, August 1977.
61

NAVTRAEQUIPCEN IH-318
Faust 212 describes the pattern recognition facility at Rome Air DevelopmentCenter. Wilson 213 describes the system at the Marshall Space Flight Centerused for image enhancement and image restoration. Cunningham 214 describesthe five major components of a system as; digitizer (microdensitometer ortelevision), digital computer, computer to hard copy output, color CRT moni-tor, and custom interfaces. Rohrbacher215 describes high-speed image pro-cessing with the STARAN parallel computer. Fanshier 216 describes the impactof currently available hardware on digital image processing systems. Wittig 217describes techniques utilized for the production of 100 land use maps. Heconcludes that automatic segmentation is superior to,manual digitizing onlyif the original photography is very clean to start with. He found that themajor problems associated with manual digitizing were; inaccuracies, missinginformation, and digitization of the same point twice. Booth218 describesall the system components in a digital image analysis system and their effectson end results. He states that an understanding of the long chain of trans-ducers, signal conditioners, and processors which produced the image to analyzeis essential to the analysis task. Reynolds219 describes a technique forapplying generic texture tiles to simulate real world texture.
212Faust, J.; Webb, H.; and Gerhardt, L., "The RADC Interactive Laboratory forDesign of Pattern Recognition Systems and its Application", in Proc. ofConf. on Computer Graphics, Pattern Recognition, and Data Structure, IEEECatalog No. 75CH0981-1C, pp. 258-272, May 1975.
213Wilson, R; Teuber, D.; Thomas, D.; and Watkins, J., "The MSFC Image Data
Processing System", Computer, Vol. 10, No. 8, pp. 37-44, August 1977.214Cunningham, R., "Update on Digital Image Processing", Electro-Optics
System Design, pp. 34-41, July 1979.215Rohrbacher, D. and Potter, J., "Image Processing With the Staran Parallel
Computer", Computer, Vol. 10, No. 8, pp. 54-59, August 1977.
216Fanshier, D. and Andrews, H., "Impact of RAM Multiported Memories onInteractive Digital Image Processing Systems", SPIE, Vol. 199, pp. 35-41,August 1979.
217Wittig, G., "Interactive Manipulation of Land Use Data", in Proc. of Inter-national Conference on Interactive Techniques in Computer Aided Design",IEEE Catalog No. 78CH1289-8C, pp. 216-222, 1978.
218Booth, J. and Schroeder, J., "Design Consdierations for Digital Image
Processing Systems", Computer, Vol. 10, No. 8, pp. 15-20, August 1977.219Reynolds, R.; Dungan W.; and Sutty, G., "Depth Perception and Motion Cues
via Textured Scenes", in Proc. AIAA Flight Simulation Technologies Confer-ence, pp. 46-48.
62

NAVTRAEQUIPCEN IH-318
Recommendation. Digital image processing equipment should be restrictedto a television digitizer (3-color), a frame memory (3-color), and minimalhardware processing capability at the current time. As Irocessing capabilityis driven to more generally applicable systems by other than CIG mcdeliigrequirements, continue to reevaluate system performance for future systemimprovements.
63
NAVTRAEQUIPCEN IH-318
SECTION VI
SUMMARY AND CONCLUSIONS
SCENE DETAIL REQUIREMENTS
This report reviewed an extensive body of literature describing visualcapabilities and visual task performance in an effort to quantify the fidelityof a visual simulation to the real world. The required fidelity is highlytask dependent and there is no general rule which will apply to all trainingsituations. A recommendation is made to construct models which are faithfulto the real world only to the degree necessary to identify the objects whichare relevant to the visual tasks to be trained. In practice this could beaccomplished using photographs in which images of objects are resolved onlyto an identification level as guides to the modeler.
DATA ACQUISITION AND REDUCTION
The generation of environment models from imagery is a difficult taskeven when automated techniques are used. The conversion of existing modelsto the desired form through the use of transformation software is thepreferred approach if an existing model is available. The Computer SystemsLaboratory at NAVTRAEQUIPCEN has been and will continue to be developingthis approach to automatic data base generation.
In t~e case of real world environments which have not been reduced tomodels thE techniques of stereophotogrammetry and digital image processingoffer potential improvements to the data base generation process. Thequantification of the improvement in efficiency can be determined by com-paring the actual costs of manual modeling to a modeling procedure incor-porating these techniques when modeling the same environment from the realworld to the same degree of fidelity.
The use of artificial intelligence techniques for converting imageinformation into a semantic model which then may be converted into a CIGenvironment model is a potential future solution to automating the database generation pre 'ess. However, the current state-of-the-art is notsufficiently developed to apply these techniques to complex visualenvironments.
64
-PonNAVTRAEQUIPCEN IH-318
REFERENCES
Abdel-Aziz, Y. and Karara, H., "Photogrammetric Potentials of N )n-metriccameras" University of Illinois at Urbana, PB-231-254, March 1914.
Abshier, J., "TA3/PA and AS-11B-1 Improvement Study", AD904906L, September1972.
Agin, G. et al., "Interactive Aids for Cartography and Photo-Interpretation",A01056355, June 1978.
Agin, G. J., "Hierarchical Representation of Three-Dimensional ObjectsUsing Semantic Models" in Proceedings of Workshop on the Representationof Three-Dimensional Objects, Bajcsy, R. (ED.) The Department of Computerand Information Science, University of Pennsylvania, May 1979.
Agrawala, A., "Machine Recognition of Patterns", IEEE Press, John Wileyand Sons, Inc., New York, 1976.
Ali, M. et al., "Color-Based Computer Analysis of Aerial Photographs",Computer Graphics and Image Processing, Vol. 9, pp. 282-293, 1979.
Allam, M., "DTM's Application in Topographic Mapping", in Proc. of DigitalTerrain Models (DTM) Symposium, American Society of Photogrammetry, May1978.
Andrews, H. and Hunt, B., "Digital Image Restoration", PrenticE-Hall Inc.,New Jersey, 1977.
Andrews. H., "An Educational Digital Image Processing Facility', Computer,Vol. 10. No. 8, pp. 48-53, August 1977.
Appel, A., "Modeling in Three Dimensions", IBM Systems Journal, Nos. 3 and4, pp. 310-321, 1968.
Ayeni, )., "Considerations for Automated Digital Terrain Models WithApplications in Differential Photo Mapping", Ph.D. Dissertation, TheOhio Stite University, 1976, (Avail. NTIS).
Bajcsy, R. et al., "What Can One See on the Earth From DifferentAltitudes" in Proceedings IEEE Computer Society Conference on PatternRecognition and Image Processing, pp. 108-111, June 1977.
Basinge-, J. and Ingle, S., "Data Base Requirements for Full MissionSimulation" in Proceedings of the 1977 Image Conference, Air Force, HumanResourc~s Laboratory, Flying Training Division, Williams AFB, Arizona,pp. 25-33, May 1977.
Bendix lesearch Laboratories, "Photogrammetry at Bendix", Bendix Center,*Southfi3ld, Michigan, 48076.
Bergerol, R., "Standards for Interactive Computer Graphics Software" inProc. of Workshop on Picture Data Description and Management, IEEE Computer
4Society, pp. 126-129, April 1977.
Bibermin, L. (Editor), "Perception of Displayed Information", Plenum Press,
New Yovk, 1973.
65

NAVTRAEQUIPCEN IH-318
Black, S., "Digital Processing of 3-D Data to Generate Interactive Real-Time Dynamic Pictures" in Three Dimensional Imaging, SPIE, Vol. 120, 1977.
Blinn, J. and Newell, M., "Texture and Reflection in Computer GeneratedImages", Communications of the ACM, Vol. 19, No. 10, pp. 542-547, October]976.
Blinn, J., "Computer Display of Curved Surfaces", Ph.D. Thesis, Universityof Utah, December 1978.
Blinn, J., "Geometric Representations in Computer Graphics" in Proceedingsof Workshop on the Representation of Three Dimensional Objects, Bajcsy, R.(ED.), The Department of Computer and Information Science, University ofPennsylvania, May 1979.
Booth, J. and Schroeder, J., "Design Considerations for Digital ImageProcessing Systems", Computer, Vol. 10, No. 8, pp. 15-20, August 1977.
Booth, J. and Farrell, R., "Overview of Human Engineering Considerationsfor Electro-Optical Displays", SPIE, Vol. 199, pp. 78-108, August 1979.
Braid, I., "The Synthesis of Solids Bounded by Many laces", Communicationsof ACM, Vol. 18, No. 4, pp. 209-216, April 1975.
Brewer, J. and Anderson, D., "Visual Interaction With Overhauser Curvesand Surfaces", Computer Graphics, Vol. 11, No. 2, pp. 132-137, Summer 1977.
Brooks, R. A. et al., "Progress Report on a Model Based Vision System"in Proceedings of Workshop on the Representation of Three DimensionalObjects, Bajcsy, R. (ED.), The Department of Computer and InformationScience, University of Pennsylvania, May 1979.
Brown, C.; Requicha, A.; and Voelcker, H., "Geometric Modelling Systemsfor Mechanical Designs and Manufacturing", prepared for presentation atACM 78, December 4-6 1978.
Byown, C. M., "Some Issues and Answers in Geometric M'odelling" in Proceedingsof Workshop on the Representation of Three-Dimensional Objects, Bajcsy, R.(ED.), The Department of Computer and Information Science, University ofPennsylvania, May 1979.
Bunker, W., "Computer Image Generation Imagery Improvement: Circles,Contours, and Texture", Technical Report AFHRL-TR-77-66, Advanced Systems
H iDivision, Air Force Human Resources Laboratory, Wright-Patterson Air ForceBase, Ohio, September 1977.
IB,ink(r, W , "Training Effectiveness Versus Simulation Realism", SPIE, Vol.1h2, Visu, 1 Simulation and Image Realism, pp. 76-82, August 1978.
Bunkcr, M and Ingalls, M., "Circles, Texture, Etc.; Alternate Approachest,) CIG Scine Detail", in r,'oc. AIAA Flight Simulation TechnologiesConfcrence, pp. 49-58, September 1978.
66
NAVTRAEQUIPCEN IH-318
Bunker, W., "CIG Translucent Face Simulation Provides Multiple Benefits",Proc. of 1st Interservice/Industry Training Equipment Conference, pp.229-238, November 1979.
Care!, W.; Herman, J.; and Olzak, L., "Design Criteria for Imaging SensorDisp ays", ADA055411, May 1978.
Carlbom, I and Paciorek, J., "Planar Geometric Projections and ViewingTransformations", Computing Surveys, Vol. 10, No. 4, pp. 465-502, [ecember1978.
Carlson, E., "Graphics Terminal Requirements for the 1970's" in Tutorialon Computer Graphics, IEEE Catalog No. EHO-147-9, pp. 126-134, 1979.
Casasent, D. ED., "Optical Data Processing Applications", Springer-Verlag,New York, 1978.
Catmull, E., "A Subdivision Algorithm for Computer Display of CurvedSurfaces", ADA 004968, December 1974.
Catmull, E., "Computer Display of Curved Surfaces", in Proc. of Conf. onComputer Graphics, Pattern Recognition, and Data Structure, IEEE CatalogNo. 75CH0981-1C, pp. 11-17, May 1975.
Chase, W., "Effect of Color on Pilot Performance and Transfer FunctionsUsing a Full-Spectrum, Calligraphic, Color Display System" in Proceedingsof AIAA Vision Simulation and Motion Conference, April 1976.
Christ, R., "Four Years of Color Research for Visual Displays", in Proc.of Human Factors Society - 21st Annual Meeting, pp. 319-321, October 1977.
Ciavarelli, A.; Wachter, L.; and Lee, W., "Terrain Classification Study",AD B005535, May 1975.
Clark, J., "Designing Surfaces in 3-D", Comm. of ACM, Vol. 19, No. 8,pp. 454-460, August 1976.
Clark, J., "Hierarchical Geometric Models for Visible Surface Algorithms",in Tutorial on Computer Graphics, IEEE Catalog No. EHO-147-9, pp. 222-229,1979.
Cornsweet, T., "Visual Perception", Academic Press, New York, 1970.
Craig, G., "Vehicle Detection on Television; A Laboratory Experiment",AD919898, April 1974.
Crow, F., "Shaded Computer Graphics in the Entertai nment Industry", inTutorial on Computer Graphics, IEEE Catalog No. EHO-147-9, 1979.
Csuri, C., "Computer Graphics and Art", in Tutorial on Computer Graphics,IEEE Catalog No. EHO-147-9, pp. 421-433, 1979.
Cunningham, R., "Update on Digital Image Processing", Electro-OpticsSystem Design, pP. 34-41, July 1979.
67 //
I
NAVTRAEQUIPCEN IH-318
Davis, L., "A Survey of Edge Detection Techniques", Computer Graphicsand Image Processing, Vol. 4, pp. 248-270, 1975.
Della Vigna, P. and Luccio, F., "Some Aspects of the Recognition ofConvex Polyhedra From Two Plane Projections", Information Sciences, Vol.2, pp. 159-178, 1970.
Defense Mapping Agency, "Product Specifications for Digital LandmassSystem (DLMS) Data Base, PS/ICD-E-F-G/100, July 1977.
Defense Mapping Agency Aerospace Center, "Test and Evaluation of USAFProject 1183 Digital Data Bases", DMAAC TR 79-1, February 1979.
Duda, R. 0. et al, "Use of the Hough Transformation to Detect Lines andCurves in Pictures", Communications of the Association for Computing Machines,Vol. 15, pp. 11-15, January 1972.
Duda, R. and Hart, P., "Pattern Classification and Scene Analysis", JohnWiley and Sons, New York, 1973.
Duda, R. et al., "Use of Range and Reflectance Data to Find Planar SurfaceRegions", IEEE Transactions on Pattern Analysis and Machine Intelligence,Vol. PAMI-1, No. 3, July 1979.
Dungan, W., "A Terrain and Cloud Computer Image Generation Model", ComputerGraphics, Vol. 13, No. 2, pp. 143-150, August 1979.
Dutton, G., "An Extensible Approach to Imagery of Gridded Data", ComputerGraphics, Vol. II, No. 2, pp. 159-169, Summer 1977.
Edson, D. and Lee, G., "Ways of Structuring Data Within a Digital Carto-graphic Data Base", Computer Graphics, Vol. II, No. 2, Summer 1977.
Erickson, R. and Hemingway, J., "Image Identification on Television",Report NWC-TP-5025 Naval Weapons Center, China Lake, California, AD876332.
Faintich, M.; Sigler, G.; and Fahy, D., "Digital Image Display andSimulation From Digital Terrain Data Bases", in Proc. of Digital TerrainModels (DTM) Symposium, American Society of Photogrammetry, pp. 610-616,May 1978.
Fanshier, D. and Andrews, H., "Impact of RAM Multiported Memories onInteractive Digital Image Processing Systems", SPIE, Vol. 199, pp. 35-41,August 1979.
Farrell, Z. and Booth, J., "Design Handbook for Imagery InterpretationEquipment", Boeing Aerospace Company, Seattle, Washington, December 1975.
Faust, J.; Webb, H.; and Gerhardt, L., "The RADC Interactive Laboratoryfor Design of Pattern Recognition Systems and its Application", in Proc. ofConf. on Computer Graphics, Pattern Recognition, and Data Structure, IEEECatalog No. 75CH0981-1C, pp. 258-272, May 1975.
68
L

NAVTRAEQUIPCEN IH-318
Forrest, A., "Recent Trends in Computer Aided Geometric Design", in Proc.of literiational Conference on Interactive Techniques in Computer Aided Design,IEEE Catilog No. 78CH1289-8C, pp. 141-146, 1978.
Foster, H.; Bos, J.; and Richie, C., "A Remote Sensing System for aNationwide Data Bank", in Proc. Machine Processing of Remotely Sensed DataSymposium;, IEEE Catalog No. 77CH1218-7, MPRSD, pp. 160-171, June 1977.
Fowler, P'. and Little, J., "Automatic Extraction of Irregular NetworkDigital Terrain Models", Computer Graphics, Vol. 13, No. 2, pp. 199-207,August 1979.
Fuchs, H., "The Automatic Sensing and Analysis of Three-Dimensional SurfacePoints From Visual Scenes", Ph.D. Dissertation available from UniversityMicrofilws, Ann Arbor, Michigan, 1975.
Fuchs, H.; Kedem, Z.; and Uselton, S., "Optimal Surface ReconstructionFrom Planar Contours", Communications of the ACM, Vol. 20, No. 10, pp.693-702, October 1977.
Gambino, L. and Schrock, B., "An Experimental Digital Interactive Facility",Computer, Vol. 10, No. 8, pp. 22-28, August 1977.
Gardner, G., "Computer Image Generation System With Efficient Image Storage",in Optical Information Storage, SPIE, Vol. 177, pp. 10-12, 1979.
Gardner, G., "Computer-Generated Texturing to Model Real-World Features",in Proc. of 1st Interservice/Industry Training Equipment Conference, pp.239-246, November 1979.
Gaven, J.; Tavitian, J.; and Harabedian, A., "The Informative Value ofSampled Images as a Function of the Number of Gray Levels Used in Encodingthe Images", Photographic Science and Engineering, Vol. 14, pp. 168, 1970.
Gibson, J., "The Perception of the Visual World", Houghton-Mifflin Company,Boston, 1950.
Gockowski, J., "Mapping Cooperation Among Civilian Agencies", PhotogrammetricEngineering and Remote Sensing, Vol. 45, No. 12, pp. 1629-1631.
2onzalez, R. and Wintz, P., "Digital Image Processing", Addison-WesleyPublishing Co., Reading, Massachusetts, 1977.
Granda, T., "A Comparison Between a Standard Map and a Reduced Detail MapWithin a Simulated Tactical Operations System (SIMTOS)", Army ResearchInstitute, ADA028752.
Greenberg, D., "An Interdisciplinary Laborary for Graphics Research andApplications", Computer Graphics, Vol. 11, No. 2, pp. 90-97, Summer 1977.
"Graphic Standards Planning Committee Status Report", Computer Graphics,Vol. 13, No. 3, August 1979.
Guzman, A., "Computer Recognition of Three-Dimensional Objects in a VisualScene", Ph.D. Thesis, Massachusetts Institute of Technology, De:ember 1968.
69
S- a

NAVTRAEQUIPCEN IH-318
Hdckathron, R., "ANIMA II: A 3-D Color Animation System", ComputerGraphics, Vol. II, No. 2, pp. 54-64, Sumer 1977.
Hagan, W., "Observations on USGS - State Cooperative Mapping", PhotogrammetricEngineering and Remote Sensing, Vol. 45, No. 12, pp. 1617-1620, December 1979.
Hall, E.; Hwang, J.; Lee, C.; and Hwang, M., "Measuring Scene Content FromAerial Images", SPIE, Vol. 186, pp. 215-223, May 1979.
Hamilton, H., "Feasibility Study for Simulation of an Airport TowerControl Environment", ADA051174, February 1978.
Haralick, R.; Shanmugam, K.; and Dinstein, I., "Textural Features ForImage Classification", IEEE , Trans. on Syst., Man, and Cybernetics, Vol.SMC-3, pp. 610-621, November 1973.
Helava, U., "Instruments and Methods for Digital Terrain Model DataCollection", in Proc. of the Digital Terrain Models (DTM) Symposium, AmericanSociety of Photogrammetry, pp. 61-71, May 1978.
Hemami, H.; Weimer, F.; and Advani, J., "Identification of Three-DimensionalObjects by Sequential Image Matching", IEEE, Proc. of Conference on ComputerGraphics, Pattern Recognition, and Data Structure, Catalog No. 75CH0 981-IC,pp. 273-278.
Henderson, R.; Miller, W.; and Grosch, C., "Automatic Stereo Reconstructionof Man-Made Targets", SPIE, Vol. 186, pp. 240-248.
Herman, G. T., "Representation of 3-D Surfaces by a Large Number of SimpleSurface Elements", in Proceedings of Workshop and Representation of Three-Dimensional Objects, Department of Computer and Information Sciences,University of Pennsylvania, May 1979.
Hoffmann, H. and Buell, R., "Results of Field Experiments ConcerningVisibility of Objects", ADB017717 (Limited Distribution), May 1977.
Hoog, T.; Dahlberg, R.; and Robinson, R., "Project 1183: An Evaluationof Digital Radar Landmass Simulation", in Proceedings of NTEC/IndustryConference NAVTRAEQUIPCEN, IH-240, pp. 54-79, November 1974.
Hoog, T. and Stengel, J., "Computer Image Generation Using the DefenseMapping Agency Digital Data Base", in Proc. of the 1977 Image Conferenceat Williams Air Force Base, pp. 203-218, May 1977.
Hoog, T., "Correlated Data Bases for the Present and Future", in Proc.AIAA Flight Simulation Technologies Conference, pp. 73-78, September 1978.
Hosaka, M. and Kimura, F., "Synthesis Methods and Curves and Surfacesin Interactive CAD", in Proc. of International Conference on InteractiveTechniques in Computer Aided Design, IEEE Catalog No. 78 CH1289-8C, pp.151-155, 1978.
Hubble, L. and Reader, C., "State of the Art in Image Display Systems",SPIE, Vol 199, pp. 2-8, August 1979.
70

NAVTRAEQUIPCEN IH-318
HuecKel, M., "An Operator Which Locates Edges in Digitized Pictures",Journal of the Association of Computing Machines, Vol. 18, pp. 113-125,
. Jant~ary L971.
Hunt, E., "Artificial Intelligence", Academic Press, New York, 1975.
Hunt, R., "The Reproduction of Colour", Fountain Press, England, 1975.
Hunt, B. and Ryan, T., "Prediction of Correlation Errors in ParallaxComputation From Digital Stereo Images", in Applications of Digital ImageProcessing, SPIE, Vol. 149, pp. 222-231, August 1978.
Hwang, J.; Lee, C.; and Hall, E., "Segmentation of Solid Objects UsingGlobal and Local Edge Coincidence", in Proceedings of IEEE Computer Society'sConference on Pattern Recognition and Image Processing, pp. 114-121, August1979.
Jackson, P., "Introduction to Artificial Intelligence", Petrocelli/Charter, New York, 1974.
Jaksic, Z., "Analytical Instruments in Close-Range Photogrammetry", inProc. of Symposium on Close-Range Photogrammetric Systems, American Societyof Photogrammetry, pp. 538-555, July 1975.
Jancaitis, J. and Moore, W., "Near Real-Time Application of DigitalTerrain Data in a Mincomputer Environment", AD-A054008, April 1978.
Jayroe, R. and Underwood, D., "Vector Statistics of LANDSAT Imagery",NASA Tech Memo, FM 78149, December 1977.
Karara, H., "Industrial Photogrammetry", in Proc. of Symposium on Close-Range Photogrammetric Systems, American Society of Photogrammetry, pp.97-141, July 1975.
Kasvand, T., "Some Observations on Linguistics for Scene Analysis", inProceedings of IEEE Computer Society Conference and Computer Graphics,Pattern Recognition, and Data Structure, pp. 118-124, May 1975.
Keating, T., "Analytical Photogrammetry From Digitized Image Densities","I Ph.D. Dissertation, University of Wisconsin, 1975, (Avail. NTIS).
Keating, T. and Boston, D., "Digital Orthophoto Production Using ScanningMicrodensitometers", Photogrammetric Engineering and Remote Sensing, Vol.45, No. 6, pp. 735-740, June 1979.
Kelly, R.; McConnell, P.; and Mildenberger, S., "The Gestalt PhotomappingSystem", Photogrammetric Engineering and Remote Sensing, Vol. 43, No. 11,pp. 1407-1417, November 1977.
Key, D.; Odneal, B.; and Sinacori, J., "Mission Environment Simulationfor Army Rotorcraft Development - Requirements and Capabilities", in AGARD
Conference, Proc. #249, (ADA063850), pp. 4-1, 4-17, April 1978.
71

NAVTRAEQUIPCEN IH-318
K)necny, G., "Methods and Possibilities for Digital DifferentialR-ctification", Photogrammetric Engineering and Remote Sensing, Vol. 45,No. 6, pp. 727-734, June 1979.
Kotas, J. and Booker J., "The AWAVS Data Base Facility - A ComprehensivePreparation Package", in Proc. of 11th NTEC/Industry Conference, pp.49-62, November 1978.
Kraft, C.; Elworth, C.; Anderson, C.; and Allsopp, W., "Pilot Acceptanceand Performance Evaluation of Visual Simulation", in Proc. of 9th NTEC/Industry Conference, pp. 235-249, November 1976.
Kraft, C. and Shaffer, L., "Visual Criteria for Out of the CockpitVisual Scenes", in AGARD Conference Proceedings No. 249, ADA063830, pp.3-1, 3-18, April 1978.
Kraus, K.; Otepka, G.; Loitsch, J.; and Haitzmann, H., "DigitallyControlled Production of Orthophotos and Stereo-Orthophotos", PhotogrammetricEngineering and Remote Sensing, Vol. 45, No. 10, pp. 1353-1362, October 1979.
Lacina, W. and Nicholson, W., "Passive Determination of Three DimensionalForm From Dynamic Imagery", SPIE, Vol. 186, pp. 178-189, May 1979.
Latta, J., "New Developments in Digital Image Processing Displays", SPIE,Vol. 164, pp. 164-171, 1977.
LeGrand, Y., "Form and Space Vision", Indiana University Press, Bloomington,1967.
Leighty, R., "Concepts for Automated Pattern Recognition Research WithHybrid Optical/Digital Systems", in Data Extraction and Classification FromFilm, SPIE, Vol. 117, pp. 132-139.
Levin, J., "A Parametric Algorithm for Drawing Pictures of Solid ObjectsComposed of Quadric Surfaces", Communications of the ACM, Vol. 19, No. 10,pp. 555-563, October 1976.
Liebes, S. and Schwartz, A., "Viking 1975 Mars Lander InteractiveComputerized Video Stereophotogranmnetry", Journal of Geophysical Research,Vol. 82, No. 28, pp. 4421-4429, September 1977.
Lintz, J. and Simonett, D. (Editors), "Remote Sensing of Environment",Addison-Wesley, Reading, Massachusetts, 1976.
MacAdam, D., "Visual Sensitivities to Color Differences in Daylight",Journal of the Optical Society of America, Vol. 32, No,. 5, pp. 247-274,May 1942.
Mahl, R., "Visible Surface Algorithms for Quadric Patches", AD-762017,December 1970.
Marconi Radar Systems Limited, Product Brochure, "A Picture Generatorfor Flight Simulators".
72

NAVTRAEQUIPCEN IH-318
Mark, D., "Concepts of Data Structure for Digital Terrain Models", inProc. of Digital Terrain Models (DTM) Symposium, Americar Society ofPhotogrammetry, May 1978.
Martin, S., "Color Image Maps From Black and White Photographs",Photogranimetric Engineering and Remote Sensing, Vol. 46, No. 2, pp. 193-200,February 1980.
McGrath, J., "The Use of Wide-Angle Cinematic Simulators in Pilot Training",Technical Report NAVTRAEQUIPCEN 70-C-0306-1, March 1973.
McKee, J. and Aggarwal, J., "Computer Recognition of Partial Views ofThree Dimensional Curved Objects", in Proc. of Conference on Pattern Recog-nition, IEEE Catalog No. 76 CH1140-3C, pp. 499-503, November 1976.
McKeown, D. et al., "A Hierarchical Symbolic Representation for anImage Data Base", in Proceedings of IEEE Computer Society Workshop onPicture Data Description and Management, pp. 40-44, April 1977.
Mezrich, J.; Carlson, C.; and Cohen, R., "Image Descriptors for Display",Office of Naval Research Report ONR-CR213-120-3, February 1977.
Monroe, E., "Environmental Data Base Development Process for the ASUPTCIG System", Air Force Human Resources Laboratory, Technical ReportAFHRL-TR-75-24, August 1975.
Monroe, E., "Air to Surface Full Mission Simulation by the ASUPT System",in Proc. of 9th NTEC/Industry Conference, pp. 41-48, November 1976.
Morland, D., "System Description - Aviation Wide-Angle Visual System(AWAVS) Computer Image Generator (CIG) Visual System", Technical ReportNAVTRAEQUIPCEN 76-C-0048-1, Naval Training Equipment Center, Orlando,Florida, February 1979.
Munchmeyer, F. and Lau, G., "On the Iterative Design of Smooth PatchedSurfaces", in Proc. of International Conference on Interactive Techniquesin Computer Aided Design, IEEE Catalog No. 78CH1289-8C, pp. 147-150, 1978.
Nagao, M. et al, "Agricultural Land Use Classification of AerialPhotographs by Histogram Similarity Method", Proceedings of IEEE ComputerSociety Conference on Pattern Recognition, pp. 669-672, November 1976.
Neff, J. and Flannery, D., "Air Force Research in Optical Processing",in Optical Signal and Image Processing, SPIE, Vol. 118, pp. 2-5, 1977.
Nesterikhin, Y.; Stroke, G.; and Kock, W., (Eds.), "Optical InformationProcessing", Plenum Press, New York, 1976.
Nevatia, R., "Depth Measurement by Motion Stereo", Computer Graphics andImage Processing, pp. 203-214, May 1976.
Nevatia, R., "Locating Object Boundaries in Textured Environments", IEEETrans on Computers, Vol. C-25, No. 11, pp. 1170-1175, November 1976.
73
NAVTRAEQUIPCEN IH-318
Nevatia, R. and Binford, T., "Description and Recognition of CurvedObjects", Artificial Intelligence, Vol. 8, pp. 77-98.
Nevatia, R., "A Color Edge Detector and its Use in Scene Segmentation",IEEE Trans. on Systems, Man, and Cybernetics, Vol. SMC-7, No. 11, pp. 518-524,Nivember 1977.
Newmnan, W. and Sproull, R., "Principles of Interactive Computer Graphics",2nd Edition, McGraw-Hill Book Company, 1979.
O'Connor, F; Shinn, J.; and Bunker, W., "Prospects, Problems, andPerformance: A Case Study of the First Pilot Trainer Using CGI Visuals",in Proc. of Sixth NTEC/Industry Conference, pp. 55-83, November 1973.
Ohlson, M., "System Design Considerations for Graphics Input Devices",in Tutorial on Computer Graphics, IEEE Catalog No. EHO 147-9, pp. 282-290,
1979.
O)tical Society of America, "The Science of Color", Optical Society of
Aj)erica, Washington, D.C., 1963.
Ozkaptan, H., "Critical Visual Requirements for Nap of the Earth (NOE)Flight Research", in Proc. 8th NTEC/Industry Conference, pp. 53-65,November 1975.
Panton, D., "Digital Orthophoto Study", ADA020066, December 1975.
Panton, D., "A Flexible Approach to Digital Stereo Mapping", in Proc.oF Digital Terrain Models (DTM) Symposium, American Society of Photogrammetry,p,). 32-60, May 1978.
Parent, R., "A System for Sculpting 3-D Data", Computer Graphics, Vol. II,No. 2, pp. 138-147.
Pnillips, R., "Computer Graphics in Urban and Environmental Systems", inTutorial on Computer Graphics, IEEE Catalog No. EHO-147-9, pp. 405-420, 1979.
P.tmesil, M., "Generation of 3-D Surface Descriptions From Images ofP Jttern-Illuminated Objects", in Proceedings of IEEE Computer SocietyConference on Pattern Recognition and Image Processing, pp. 553-559,August 1979.Pratt, W., "Digital Image Processing", John Wiley and Sons, New York, 1978.
Requicha, A. and Voelcker, H., "Constructive Solid Geometry", U.S. Dept.of Commerce, P8281613, November 1977.
Reynolds, R.; Dungan W.; and Sutty, G., "Depth Perception and Motion Cuesvia Textured Scenes", in Proc. AIAA Flight Simulation Technologies Conference,p). 46-48.
Richards, W., "Experiments in Texture Perception", ADA059630, January 1978.
74
NAVTRAEQUIPCEN IH-318
Richi., M., "Object, Illusion, and Frame of Reference as Design Criteriafor C mputer-Generated Displays", SPIE, Vol. 162, Visual Simulation and ImageReali;m, pp. 8-10, August 1978.
River;, H. and VanArsdall, R., "Simulator Comparative Evaluation", inProc. of 10th NTEC/Industry Conference, pp. 37-42, November 1977.
Rivers, H. A., "Simulator Comparative Evaluation", ADB023450 (LimitedUJistribution).
Roberts, L., "Machine Perception of Three-Dimensional Solids", inOptical and Electro-Optical Information Processing, J. T. Tippett et al.,EDS., MIT Press, Cambridge, Massachusetts, pp. 159-197, 1965.
Roese, J., "Stereoscope Computer Graphics for Simulation and Modelling",Computer Graphics, Vol. 13, No. 2, pp. 41-47.
Rohrbacher, D. and Ptter, J., "Image Processing With the Staran ParallelComputer", Computer, Vol. 10, No. 8, pp. 54-59, August 1977.
Rosenfeld, A., "Extraction of Topological Information From DigitalImages", ADA042125, June 1977.
Sagan, C., "The Dragons of Eden", Ballantine Books, New York, 1977.
Salmen, L.; Gropper, J.; Hamill, J.; and Reed, C., "Comparison ofSelected Operational Capabilities of Fifty-Four Geographic InformationSystems", U.S. Department of Commerce, PB-286977, September 1977.
Sanders, M.; Simons, R.; Hofmann, M.; and DeBonis, J., "Visual Workloadof .he Co-Pilot/Navigator During Terrain Flight", Proc. of the Human FactorsSoc ety 21st Annual Meeting, pp. 262-266, October 1977.
Scawtlan. L., "Target Acquisition in Realistic Terrain", in Proc. of theHumin Factors Society - 21st Annual Meeting, pp. 249-253, October 1977.
Schachter, B., "Computer Generation of Full Colored Textured Terrain
Images", in Proc of 1st Interservice/Industry Training Equipment Conference,pp. 367-374, November 1979.
Scbnitzcr, A., "A Data Base Generation System for Digital Image Generation",in Proc. of 9th NTEC/Industry Conference, pp. 103-113, November 1976.
Schrock. B., "Interactive Interpretation of Digital Imagery", SPIE,Proc. o, Airborne Reconnaisance III, Vol. 137, pp. 188-194, March 1978.
Schumacder, R. and Rougelot, R., "Image Quality: A Comqparison of Night/Dusk and Day/Night CGI Systems", in Proceedings of the 1977 Image Conferenceheld at Williams AFB, Arizona, 17-18 May 1977, pp. 243-255.
Scott, F.; Hollanda, P.; and Harabedian, A., "The Informative Value ofSampled. Images as a Function of the Number of Scans Per Scene Object",Photographic Science and Engineering, Vol. 14, No. 1, pp. 21-27, January 1970.
.. . . .. .. . ... ... . . .. .. .... - " - - .... , 2 " -2 . .. --4" ._- ,-.. .. . .. . .--
NAVTRAEQUIPCEN IH-318
Shapira, R. and Freeman, H., "Computer Description of Bodies Boundedby Quadric Surfaces From a Set of Imperfect Projections", IEEE Trans. onComputers, Vol. C-27, No. 9, pp. 841-854, September 1978.
Shneiderman, B., "Human Factors Experiments in Designing InteractiveSystems", Computer, pp. 9-19, December 1979.
Soroka, B. et al., "A Program for Describing Complex Three-DimensionalObjects Using Generalized Cylinders as Primitives", in Proceedings of IEEEComputer Society Conference on Pattern Recognition and Image Processing,pp. 331-339, June 1978.
Speakman, E. and Stanton, J., "Is the Stereoplanigraph Obsolete",American Institute of Aeronautics and Astronautics, 1974.
Stark, E.; Bennett, W.; and Borst, G., "Designing DIG Images forSystematic Instruction", in Proc. of 10th NTEC/Industry Conference, pp.147-155, November 1977.
Sties, M. et al., "Organization of Object Data for an Image InformationSystem", in Proceedings of IEEE Computer Society Conference on PatternRecognition, pp. 863-869, November 1976.
Strat, T.. "Shaded Perspective Images of Terrain", ADA055070, March 1978.
Sutherland, I., "Three-Dimensional Data Input by Tablet", in Tutorialon Computer Graphics, IEEE Catalog No. EHO-147-9, pp. 266-274, 1979.
Sutherland, I.; Sproull, R.; and Schumacker, R., "Characterization ofTen Hidden-Surface Algorithms", Computing Surveys, Vol. 6, No. 1, pp.1-55, March 1974.
Swallow, R., "Computrol Computer Generated Day/Dusk/Night Image Display",in Proceedings of 11th NTEC/Industry Conference, pp. 321-331, November 1978.
famura, H., "Textural Features Corresponding to Visual Perception", IEEETransactions on Systems, Man, and Cybernetics, Vol. SMC-8, No. 6, pp. 460-473,June 1978.
Thomason, M., "Applications of Probalistic Information Theory to RelationalDita Bases", SPIE, Vol. 186, pp. 224-229.
Thompson, M. (Editor), "Manual of Photogrammetry", American Society ofPhotogrammetry, Falls Church, VA, 1966.
Thorpe, J.; Varney, N.; McFadden, R.; LeMaster, W.; and Short, L., "TrainingEffectiveness of Three Types of Visual Systems For KC-135 Flight Simulators",Air Force Human Resources Laboratory, Flying Training Division Report AFHRL-TR-78-16, June 1978.
Tou, J. etal., "Picture Understanding by Machine Via Textural FeatureExtraction", in Proceedings of IEEE Computer Society Conference on PatternRecognition and Image Processing, pp. 392-399, June 1977.
76
NAVTRAEQUIPCEN IH-318
Towles, R., "An Experimental Approach to Generation of Digital LandmassData Base Culture/Planimetric Files Using LANDSAT Imagery and MultispectralImag, Analysis Techniques", Proc. American Society of Photogrammetry, FallTechnical Meeting, October 1977.
Trim.le, J., "Navy Optical Processing Programs for Systems Applications -An H:storical Overview", in Optical Signal and Image Processing, SPIE, Vol.118, pp. 96-99, 1977.
Unruh, J.; Alspaugh, D.; and Mikhail, E., "Image Simulation From DigitalData", in Proceedings of American Congree on Surveying and Mapping, 1977.
VanWijk, M., "Geometrical Quality of Stereo-Orthophtos Produced FromAutomatic Image Correlation Data", Photogrammetric Engineering and RemoteSensing, Vol. 45, No. 10, pp. 1363-1369, October 1979.
Vatz, B., "The Moving Technology", SPIE, Vol. 118, Optical Signal and ImageProcessing, pp. 142-143, 1977.
Vickers, D., "Sorcerer's Apprentices Head-Mounted Display and Wand", inProc. of Symposium on Visually Coupled Systems: Development and Application,Brooks AFB, Aerospace Medical Division (Limited Distribution), pp. 522-540,November 1973.
Voelcker, H. and Requicha, A., "Geometric Modeling of Mechanical Partsand Processes", Computer, pp. 48-57, December 1977.
Wagner, D., "Target Detection With Color Versus Black and White Television",Report TP5731, Naval Weapons Center, China Lake, CA, April 1975.
Watkins, G., "A Real-Time Visible Surface Algorithm", AD-762004, June 1970.
Wekwerth, M., "The Lufthansa Day/Night Computer Generated Visual System",4 in AGARD Conference Proc. No. 249 (ADA063850), pp. 12-1, 12-6, April 1978.
Welch, B., "Recent Advances in Television Visual Systems", in AGARD ConferenceProceediigs #249, ADA063850, pp. 13-1, 13-7, April 1978.
Weszka, J.; Dyer, C.; and Rosenfeld, A., "A Comparative Study of TextureMeasures for Terrain Classification", IEEE Trans on Systems, Man, andCybernetics, Vol. SMC-6, No. 4, pp. 269-285, April 1976.
Wilson, R.; Teuber, D.; Thomas, D.; and Watkins, J., "The MSFC Image DataProcessing System", Computer, Vol. 10, No. 8, pp. 37-44, August 1977.Winston, P. (Editor), "The Psychology of Computer Vision", McGraw-Hill
* Book Company, New York, 1975.
Wittig, G., "Interactive Manipulation of Land Use Data", in Prcc. of Inter-national Conference on Interactive Techniques in Computer Aidec Design",IEEE Catalog No. 78CH1289-8C, pp. 216-222, 1973.
Wolf, P., "Elements of Photogrammetry", McGraw-Hill, New York, 1974.
77

NAVTRAEQUIPCEN IH-318
Wood, M., "The Fidelity Issue in Visual Simulation", in Proc. of the 1977Image Conference, Williams AFB, pp. 291-295, May 1977.
Woomer, C. and Williams, R., "Environmental Requirements for SimulatedHelicopter/VTOL Operations From Small Ships and Carriers", in AGARD Conf.
* Proc. No. 249, Piloted Aircraft Environment Simulation Technologies,I ADA063850, October 1978.
Wu, S.; Abel, J.; and Greenberg, D., "An Interactive Computer GraphicsApproach to Surface Representation", Communications of ACM, Vol. 20, No. 10,pp. 703-712, October 1977.
Yakimovsky, Y., "Extracting Depth Information From a Stereo Pair",Milwaukee Symposium on Automatic Control, pp. 311-316, 1974.
Ydn, J., "Real-Time Generation and Smooth Shading of Quadric Surfaces",in Proc. of 1st Interservice Industry Training Equipment Conference, pp.247-260. November 1979.
Zucker, S. and Hummel, R., "An Optimal Three-Dimensional Edge Extractor",in Proceedings of IEEE Computer Society's Conference on Pattern Recognitionand Image Processing, pp. 162-168, August 1979.
78

""'r .......
''NA
1;JR;
......
A6

DATE
FILMEIF
w vm Ow


