64
HELIX RESOURCES LIMITED ANNUAL REPORT 2012 Drilling at the Joshua Project 2012 For personal use only

HELIX RESOURCES LIMITED
ANNUAL REPORT 2012
Drilling at the Joshua Project 2012
For
per
sona
l use
onl
y

Helix Resources Limited Annual Report 2012
1
Contents
Chairman’s Review ........................................................ 2
Review Of Operations ..................................................... 4
Corporate Governance ................................................... 16
Directors’ Report ......................................................... 20
Auditor’s Independence Declaration ................................... 27
Independent Audit Report ............................................... 28
Directors’ Declaration .................................................... 31
Statement Of Financial Position ........................................ 32
Statement Of Comprehensive Income ................................. 33
Statement Of Cash Flows ................................................ 34
Statement Of Changes In Equity ........................................ 35
Notes To The Financial Statements .................................... 36
Number Of Shares Held .................................................. 60
Tenement Schedule ...................................................... 62
Corporate Directory ...................................................... 63
Chile Exploration Manager Alamiro San Francisco
Quad bike towed Auger Team sampling, NSW
For
per
sona
l use
onl
y

Helix Resources Limited Annual Report 2012
2
CHAIRMAN’S REVIEW Dear Shareholder I am pleased to present the 2012 Annual Report for the Company. As you would be aware, the uncertainty and volatility in Global debt and equity markets over the past 12 months has resulted in very challenging operating conditions for your Company and explorers in general. Our market capitalisation based on limited trading volume is not considered reflective of the underlying value of our Mineral assets, a theme which is consistent across the mineral sector at present. It is my view the Market fundamentals for the commodities to which we have exposure will remain solid for the medium term, with supply-side constraints and demand-side support from emerging economies supporting prices. We continue to carefully manage our liquid assets whilst directing over 80 cents in every $ spent into our Mineral assets to add value to our asset portfolio. I expect Merger & Acquisition deals to accelerate going forward and see your Company well placed to participate given we have interests in JORC resources and advancing exploration in infrastructure rich regions. Our business model is outlined below:-
Our decision to gain exposure to Chile in late 2009 is showing tremendous potential. Our most advanced prospect, Joshua Target 1, has been confirmed as a significant copper porphyry system and has attracted interest from Major miners and investment funds based in Chile. Our other surrounding projects are advancing and additional positive exploration results will provide value uplift from these 100% owned assets. Our exposure to the Cobar region in NSW is also proving very worthwhile, with Resources being discovered and further exploration and drilling indicating the potential for multiple gold and copper deposits, in a region with excellent infrastructure including operating mines. We expect to see broader market interest in our Chile and NSW Assets as the up-coming exploration campaigns move these assets into the “Discovery & Development Phase”. Development Studies Underway The Tunkillia Gold Project JV is undergoing Pre-Feasibility studies for a targeted decision to mine
in 2014 The Yalleen Iron Ore Project JV undergoes development studies as the region awaits the WPIOP
infrastructure solution
For
per
sona
l use
onl
y

Helix Resources Limited Annual Report 2012
3
I would like to thank the Board and Staff for their contributions during 2011/12 and ongoing commitment. I draw your attention to the Operational Report which discusses our Mineral assets in detail and encourage you to visit our website at www.helix.net.au for the latest information regarding our activities. I look forward to your attendance at the forthcoming Annual General Meeting. Yours faithfully
Greg J Wheeler Executive Chairman
Examining historic workings on Hado, Chile 2012 For
per
sona
l use
onl
y

Helix Resources Limited Annual Report 2012
4
REVIEW OF OPERATIONS CHILE - COPPER AND GOLD PROJECTS Background Chile hosts world class copper and gold mines and mineralized systems, with the mining sector being one of the major pillars of the Chilean economy given copper exports account for +30% of GDP. Chile is a politically stable democracy with strong financial institutions and sound economic policy providing it the strongest sovereign debt rating in South America. Chile is very supportive of foreign investment and Helix considers it an appropriate location to achieve geographic diversification. Chile Strategy Confirm Joshua Target 1 copper porphyry size potential; attract JV partner to fund Target 1
Resource and technical/economic studies; advance up ‘value curve’ and realise value to invest in advancing our other Chile Projects.
Confirm Joshua Target 2, 3 and 4 copper porphyry potential; track construction and DDH drilling of targets identified from IP survey/ground magnetics; repeat Joshua Target 1 strategy.
Huallillinga Project – drill +600m IP chargeable feature below Blanco y Negro mine to confirm Cu/Au mineralisation and target size; drill targets identified from IP survey and geological mapping associated with +25km long Los Mantos Fault.
Hado Project – drill 500m x 500m IP chargeable feature to confirm Cu porphyry; geochemistry program over Au target 1,500m long and 500m wide at surface prior to RC drill program.
Figure 1 : Helix Region IV Projects (incl. Joshua Project) with neighboring mines/deposits and infrastructure
For
per
sona
l use
onl
y

Helix Resources Limited Annual Report 2012
5
Joshua Copper Project [100%]
The Joshua Project is Helix’s most advanced project in Chile, is 100% owned with no concession payments or royalties, and located 40km SE of Teck’s Carmen de Andacollo porphyry deposit (400Mt @ 0.38% Cu Reserve) in Region IV Chile. The Project is located 40km East of the township of Ovalle [Population 100,000], at low altitude (less than 1400m), with excellent nearby infrastructure. Since 1st drilling program mid-2011, and subsequent 200m spaced pole-dipole IP and ground magnetics leading to a DD program 1H12, the Company has outlined a potential large scale, bulk tonnage copper-gold project likely to be amenable to open pit mining.
1st Program 1,200m RC Results 3Q11 – all from surface
256m @ 0.32% Cu Eq* to EOH, incl. 27m @ 0.58% Cu Eq* 156m @ 0.26% Cu Eq* 143m @ 0.27% Cu Eq*
2nd Program 1,000m DD Results 1H12
DDH2 - 0 to 400m @ 0.33% Cu Eq to EOH*, with 70m @0.41% Cu Eq* from 82m. DDH3 – 0 to 242m @ 0.14% Cu Eq*to EOH
To date drilling has been confined the only access track developed to the SE flank of the system testing approximately 0.2km² of a 1.5km² target. Access tracks onto the larger N flank of the system are the next stage and results to date suggest that the system should improve both in grade and widths through this zone and is considered a priority target for future drilling.
Figure 2: Joshua Target 1
For
per
sona
l use
onl
y
Helix Resources Limited Annual Report 2012
6
Huallillinga Copper Project
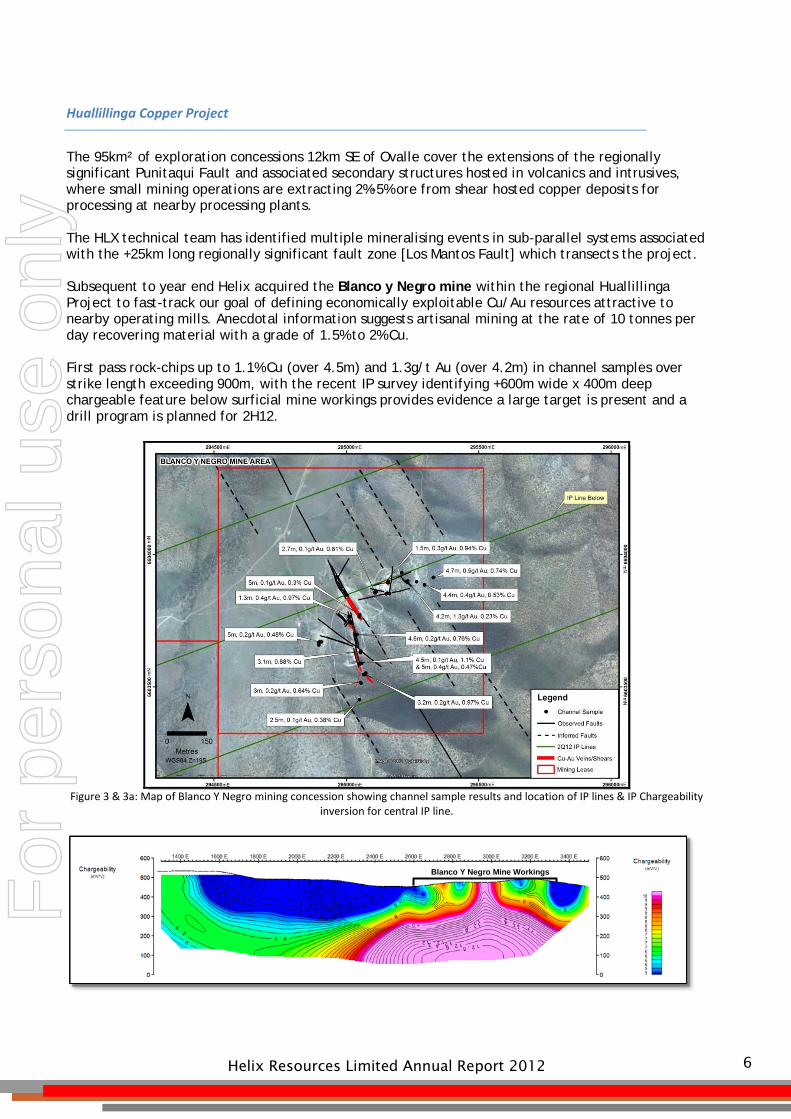
The 95km² of exploration concessions 12km SE of Ovalle cover the extensions of the regionally significant Punitaqui Fault and associated secondary structures hosted in volcanics and intrusives, where small mining operations are extracting 2%-5% ore from shear hosted copper deposits for processing at nearby processing plants. The HLX technical team has identified multiple mineralising events in sub-parallel systems associated with the +25km long regionally significant fault zone [Los Mantos Fault] which transects the project. Subsequent to year end Helix acquired the Blanco y Negro mine within the regional Huallillinga Project to fast-track our goal of defining economically exploitable Cu/Au resources attractive to nearby operating mills. Anecdotal information suggests artisanal mining at the rate of 10 tonnes per day recovering material with a grade of 1.5% to 2% Cu. First pass rock-chips up to 1.1% Cu (over 4.5m) and 1.3g/t Au (over 4.2m) in channel samples over strike length exceeding 900m, with the recent IP survey identifying +600m wide x 400m deep chargeable feature below surficial mine workings provides evidence a large target is present and a drill program is planned for 2H12.
Figure 3 & 3a: Map of Blanco Y Negro mining concession showing channel sample results and location of IP lines & IP Chargeability
inversion for central IP line.
Blanco Y Negro Mine Workings
For
per
sona
l use
onl
y

Helix Resources Limited Annual Report 2012
7
Hado Gold/Copper Project
The Hado Project targets the same geological domain as the Joshua Area (Cretaceous volcanics intruded by Paleocene intrusives) and is situated 25km S of Joshua and 18km by road from the township of Monte Patria. Hydrothermal breccias, brecciated andesite, diorite porphyry and intrusive granodiorite lithologies have been identified in first-pass geological mapping. The hydrothermal breccia is overprinted with alteration including argillic assemblages with abundant limonite and hematite weathering after sulphides. The system covers an area exceeding 5km² and is semi-circular in shape, with historic artisanal workings identified in Qtz (+Cu & Au) veins striking N-S and NNW throughout the system.
The recent IP survey has identified both a Cu and Au target for follow up.
The gold target is +1,500m x 500m with historical gold workings present. A small number (5) of sub-crop rock-chips have returned up to 0.6g/t Au. A detailed sampling program has commenced in preparation for drilling in 2H12. The copper target is less well defined due to its size and additional mapping and sampling is required.
Figure 4 & 4a. Hado gold target with first-pass sampling and mapping; IP Chargeability inversion over gold target
Hydrothermal Breccia Target
For
per
sona
l use
onl
y

Helix Resources Limited Annual Report 2012
8
Other Chile Projects
Talca Gold Project
• 100% owned 97km2 exploration concession adjacent and along strike to local gold mining of high-grade quartz tension veins [average >5-10g/t Au] within mining district of Punta De Talca (Region IV). The district has been only ever been artisanally mined, producing +800,000 oz gold since colonial times, with opportunity to use modern exploration methods to assess scope for larger scale developments based on known gold exploited from bounded by parallel NW trending shears, traceable for 5-10km along strike.
• Initial geochemistry and mapping has confirmed regional prospectivity with rock chips up to 15.2g/t Au.
• TSX listed Orosur actively exploring along strike and HLX assessing the results emerging from their $10M investment in the region to determine plan for Talca.
Pelusa, Loa and Lalo Projects
• Helix has reviewed these projects prospectivity and will consider introducing JV partners or selling to concentrate on our main Projects in Region IV.
Technical Director Mick Wilson reviewing RC chips, Joshua Project
For
per
sona
l use
onl
y

Helix Resources Limited Annual Report 2012
9
COPPER & GOLD PROJECTS - NSW Background Helix has a significant ground holding in Central NSW covering 2,000km² of tenements through joint ventures it controls and 100% tenement acquisitions. The area has been targeted for its Cu and Au mineral prospectivity, excellent infrastructure [including nearby copper and gold processing plants, some with excess capacity]; and the presence of mining-focused companies in the district (Straits; Mincor; Glencore; YTC; NewGold, Oz Minerals and Polymetals).
Strategy Grow Resource from current 100,000 oz Au and 18,000t Cu within our 2,000 km2 tenement
holding in mineral prospective and infrastructure rich region.
Figure 5: Helix's NSW project location map
RESTDOWN JV & MURIEL TANK JV PROJECTS
EL 6140, EL6501 & EL6739:- Helix Resources 70%; Glencore International AG 30%
The Projects are located 40km to 70 km SE of Cobar in Central Western NSW with the tenement package covering an area of ~278km² (Restdown JV Project 188km², Muriel Tank JV Project 90km²).
Restdown Gold Project
The Restdown Project is ±25km SW of the historic Mt Boppy Gold Mine (produced ~500,000 oz at +10g/t Au) now owned by PolyMetals and ±35km N of YTC’s Nymagee and Hera development projects. During 2011 Helix concentrated on defining a maiden resource at the Sunrise and Good Friday prospects, where zones of gold mineralisation associated with sandy sediments intersected by localized shears is present. An inferred resource of 2.6Mt @ 1.2g/t Au for 100,000oz (see resource table) was defined and remains open in all directions. Regional geochemical sampling has continued during the year with +2800 auger soil samples collected which confirm the continuance of the gold mineralised corridor over +7km and has highlighted six Priority 1 target zones which are to be tested by a an RC drill program scheduled to commence 3Q12.
For
per
sona
l use
onl
y

Helix Resources Limited Annual Report 2012
10
These new zones provide encouragement that multiple repeats of Sunrise-style mineralisation are present in the district, and should assist in the company’s strategy of proving up an economic resource within trucking distance to several nearby processing operations. Regional Prospectivity The excellent results from drilling to date, the existence of historic workings scattered throughout the area; the aeromagnetic survey data and geochemical sampling program results provides confidence the project has the potential to host economic gold mineralisation elsewhere in the identified zone of interest which is +20km long by up to 9km wide (Figure 6). A series of assessment criteria including lithological controls, interaction of structural directions, and multi-element geochemistry appears to provide the key to higher tenor of gold in the region and these criteria have prioritised targets defined from this regional geochemical sampling. Drilling is expected to commence in 3Q12.
Figure 6: Gold in auger soil results from 1H12 regional sampling highlighting previously unknown areas of significant gold
anomalism where 3Q12 drilling will be concentrated.
For
per
sona
l use
onl
y

Helix Resources Limited Annual Report 2012
11
CANBELEGO PROJECT JV – NSW
EL 6105:- Helix Resources Ltd 51%, moving to 70%, Straits Resources 49% (Diluting) Project Summary The Canbelego Project is located 45km SE of Cobar. Helix to date has defined an Initial inferred resource for the Canbelego Project at a 0.3% Cut off grade of 1.5 million tonnes at 1.2% Cu for 18,000t Contained Copper (refer ASX announcement 1st October 2010). Following the success of Straits at their Avoca Tank Prospect and YTC at their Nymagee Prospect, the evidence for high grade plunging shoots within the broader mineralised footprints of these discrete copper systems is considered a compelling target at Canbelego and a recent review of the resource area (1.5Mt @ 1.2% Cu for 18,000t inferred) at the Canbelego Mine Prospect has highlighted several zones below and along strike of the limited drilling that indicate untested plunges may exist. EM surveys are underway, to be modeled and we plan to test targets in an upcoming drill program in 1H13.
OTHER NSW PROJECTS – (LITTLE BOPPY– QUANDA – FIVEWAYS- TOTTENHAM) [Helix 100%]
Helix considers the region, dominated by VMS style copper and gold systems, has significant exploration and development potential. The company has isolated a series of key structural, geochemical and lithological controls that are being used to prioritise targets within our large tenement holding and with subsequent positive drill results, rapidly build on our resource base in the district.
During 2Q12 Helix took possession of a vehicle mounted Auger rig, purpose built and fitted onto one of our Landcruiser utilities. This Auger rig has the ability to sample to a depth of approximately 15-20m and is considered ideal for targeting consistent sample material in areas of extensive (albeit shallow) soil and gravel cover on the eastern VMS projects. The rig has commenced work on the Northern half of the Quanda tenement, which is considered highly prospective for Tritton/Avoca Tank-style copper(+gold) systems. A gold in soil result of 0.5g/t Au has already been returned in regional wide-spaced sampling from a depth of 2.5m.
Figure 7: Helix Auger Rig will allow our field team to sample a consistent soil horizon across areas of variable cover (up to max 20m). This will be used to identify drill targets on the southern extensions of the Tritton and Kurrajong VMS trends to work up
targets for drill testing.
For
per
sona
l use
onl
y

Helix Resources Limited Annual Report 2012
12
OLARY MAGNETITE PROJECT – SA
100% - EL4022; EL3956 Strategy Attract JV partner to fund Resource and technical/economic studies in this new iron ore region,
whilst concurrently seeking approvals for a regional RC drill program to delineate a Resource.
Share Subscription Agreement Helix has executed a Share Subscription Agreement with Lodestone Equities Ltd [Lodestone] over the Olary Magnetite Project in South Australia. Lodestone has acquired a 33% shareholding in the Helix wholly owned subsidiary, Olary Magnetite Pty Ltd [Olary], with an up-front cash payment of $0.5M to Helix and $1M towards the proposed work program. Olary’s sole assets are tenements EL3956 and EL4022 prospective for Braemar Fe Formation in South Australia. Upon all approvals being received to enable drilling to commence, Lodestone will provide a further $1M to earn 50% in Olary. Helix will oversee the work program, receiving a management fee, with drilling and assays used to establish an independently estimated maiden Inferred JORC compliant resource. Lodestone has one month after receipt of the independent JORC Report to elect whether to acquire the remaining 50% shareholding in Olary by an additional cash payment calculated in accordance with the following formula:
Cash Payment = JORC Resource tonnes x DTR% x $0.035 x150%
with a floor price of $5M and a cap of $9M. If the Option to acquire the remaining 50% is not exercised by Lodestone, the parties will operate Olary as a corporate joint venture.
Figure 8: Helix Olary Project showing surrounding project ownership and results/resources
For
per
sona
l use
onl
y

Helix Resources Limited Annual Report 2012
13
NON MANAGED JOINT VENTURES
TUNKILLIA GOLD PROJECT JV – SA
Helix Resources Ltd 40% JV interest and tenement owner; Mungana Goldmines Ltd 60% JV interest and Operator Strategy
HLX strategy remains to dilute our interest under our favourable dilution formulae to ±20% at Decision to Mine 3Q13 [assumes MUX spends $6M in 2012 for PFS and $8M in 2013 for BFS], and sell de-risked percentage of project. HLX holds tenements 100% and JV agreement requires 100% participant approval to move to mine development.
Project Summary Resource inventory of 803,000oz Au and 1,658,000oz Ag (*
Refer appended resource table); Mungana Gold Mines [ASX:MUX] as JV operator (55% JV interest purchased from Minotaur Nov
2011 for $6M) and increased calendar 2012 work program from $3M to $6.2M to complete PFS, with HLX electing to not contribute and therefore diluting to ±30% at 31 December 2012.
MUX announced 19 July 2012 the acquisition of the Tarcoola Gold Project located 60km NW of Tunkillia which provides strong potential to contribute an additional 20,000 oz Au per annum in high grade feed to the Tunkillia process plant and improve Tunkillia project economics.
Background Helix discovered the Tunkillia deposit in the mid 1990’s while exploring for gold under cover in the Gawler Craton of South Australia. The Tunkillia discovery, which was announced in late 1996, was one of the first gold discoveries in the Gawler Craton and the subsequent 800koz Au resource remains the largest undeveloped gold resource in South Australia. Since the Project became the subject of an Earn-In & Joint Venture in 2005, +$6M was spent by the Operator carrying out additional drilling at Area 223 and several exploration campaigns using geophysics, geochemistry and drilling. In August 2009, an updated combined measured, indicated and inferred estimate inventory of 803,000oz Au and 1,658,000oz Ag within the Area 223 deposit. Geology The Gawler Craton is broadly divided into three main geological units, Archaean crystalline basement, highly deformed Palaeoproterozoic metasediments and granites, and less deformed Mesoproterozoic volcanics, clastic sediments and granite. Almost all gold and copper mineralisation found in the Gawler Craton is directly associated with Mesoproterozoic magmatism. The host rocks to the Tunkillia prospect are medium- to coarse-grained granitoids of the Tunkillia Suite that have been intensely sheared and brecciated within the Yarlbrinda Shear Zone. At the prospect scale, gold mineralisation at Tunkillia is associated with zones of intense sericite alteration, and quartz and sulphide veining.
Figure 9 Tunkilla Tenement Locations
For
per
sona
l use
onl
y

Helix Resources Limited Annual Report 2012
14
YALLEEN IRON ORE PROJECT – WA
Helix Resources Ltd 30% JV interest and tenement owner; API (AMCI/Aquila) 70% iron ore rights E 47/1169-1171 Strategy
Helix strategy to negotiate acceptable JV agreement with API; await WPIOP infrastructure solution and access terms; re-assess Project viability; sell Project tenements and interest.
Project Summary
• JORC Resource based on drilling during 2007/8 currently stands at 84.3Mt @ 57.2% Fe Channel Iron(refer to appended resources table)
• API since 2009 have completed conceptual level analyses of potential mine development options from which the following comments can be made:-
A conceptual level mine plan at 8Mtpa ore production rate indicates a potential recoverable resource of +60Mt at an ore strip ratio of 2.65:1
A potential product specification comparable to the API’s West Pilbara Fines target grades is achievable
Operating margins are sufficient to cover expected mainline rail and port access charges
The Project requires a rail and port infrastructure solution which API has been progressing at Anketell Point. As stated in the 2011 Annual Report, Helix continues to await the release of the WPIOP Stage 1 DFS together with Project Development Approval and Funding updates to determine the impact on the Yalleen JV.
Helix Project Locations
For
per
sona
l use
onl
y

Helix Resources Limited Annual Report 2012
15
Resources
Commodity Category Project Interest Resource
Iron Ore Indicated
Inferred Yalleen JV, WA
30%
(Contributing) 47.9Mt @ 57.3% Fe (Channel Iron) 36.4Mt @ 57.1% Fe (Channel Iron)
Joint ventured with API Management Pty Ltd (50% Aquila Resources, 50% AMCI) and forms part of their West Pilbara Iron Ore Project [WPIOP] which comprises multiple JV’s.
Copper Inferred Canbelego JV, NSW
51% (Moving to 70%)
(Managing)
1.5Mt @ 1.2% Cu for 18,000t Contained Cu (at 0.3% Cu Cut-off)
Joint venture with Straits Resources
Gold
Oxide
Measured Indicated Inferred
Primary
Indicated
Inferred Inferred
Total
Tunkillia JV, SA
46%
(Diluting)
1.2Mt @ 1.8 g/t – 66,000 oz 2Mt @ 1.3 g/t – 86,000 oz 2.5 Mt @ 1g/t – 77,000 oz
4.2Mt @ 2 g/t – 270,000 oz
4.4Mt @ 2.1 g/t – 300,000 oz 8.6Mt @ 5.7 g/t – 1.6M oz Silver
0.8M oz Au and 1.6M oz Ag
Mungana Goldmines Ltd JV Manager and 55% JV participant. $6.2M exploration budget for calendar 2012 to complete PFS. Mungana has stated it wants the project to be production ready in 2014 with initial scope for a conventional open-pit operation and 1.5/2Mtpa CIP plant. Helix has elected to dilute, with our equity position expected to be around 30% at the end of the calendar 2012 program spend.
Gold Inferred Restdown JV, NSW 70% (Managing) 2.6Mt @ 1.2g/t Au for 100,000oz
gold (at 0.3g/t Au Cut-off)
Joint Venture with Glencore AG
Details of the assumptions underlying the above estimations are contained in previous ASX releases or at www.helix.net.au
Competent Persons Statements The information in this announcement that relates to Exploration Results, Mineral Resources or Ore Reserves is based on information compiled by Mr M Wilson who is a full time employee of Helix Resources Limited and a Member of The Australasian Institute of Mining and Metallurgy. Mr M Wilson has sufficient experience which is relevant to the style of mineralisation and type of deposit under consideration and to the activity which he is undertaking to qualify as a Competent Person as defined in the 2004 Edition of the ‘Australasian Code for Reporting of Exploration Results, Mineral Resources and Ore Reserves’. Mr M Wilson consents to the inclusion in the report of the matters based on his information in the form and context in which it appears.
Exploration Target References to exploration target size and target mineralisation in this announcement are conceptual in nature and should not be construed as indicating the existence of a JORC Code compliant mineral resource. Target mineralisation is based on projections of established grade ranges over appropriate widths and strike lengths having regard for geological considerations including mineralisation style, specific gravity and expected mineralisation continuity as determined by qualified geological assessment. There is insufficient information to establish whether further exploration will result in the determination of a mineral resource within the meaning of the JORC Code Copper Equivalent Calculation Copper Equivalent (also Cu Eq*) Calculation represents the total metal value for each metal, multiplied by the conversion factor, added and expressed in equivalent copper percentage. These results are exploration results only and a 10% allowance has been made for recovery losses that may occur should mining eventually result. It is the Company’s opinion that elements considered here have a reasonable potential to be recovered as evidenced in similar multi-commodity natured porphyry mines elsewhere in Chile. Copper Eq values calculated using = (Cu_ppm) + (Au_ppm x 0.7).
For
per
sona
l use
onl
y

Helix Resources Limited Annual Report 2012
16
CORPORATE GOVERNANCE The directors of Helix Resources Limited believe that effective corporate governance improves company performance, enhances corporate social responsibility and benefits all stakeholders. Governance practices are not a static set of principles and the company assesses its governance practices on an ongoing basis. Changes and improvements are made in a substance over form manner, which appropriately reflect the changing circumstances of the company as it grows and evolves. Accordingly, the Board has established a number of practices and policies to ensure that these intentions are met and that all shareholders are fully informed about the affairs of the Company. The Company has a corporate governance section on the website at www.helix.net.au. The section includes details on the company’s governance arrangements and copies of relevant policies and charters. ASX Corporate Governance Council Best Practice Principles and Recommendations (2nd Edition) For ease of comparison to the recommendations, the Corporate Governance statement addresses each of the 8 principles in turn. Where the company has not followed a recommendation this is identified with the reasons for not following the recommendation. This disclosure is in accordance with ASX listing rule 4.10.3. The following table outlines which of the ASX recommendations the Company has not complied with. Reasons for non-compliance are explained in this report.
ASX Recommendation Description 2.1 A majority of the board should be independent directors 2.2 The chair should be an independent director 2.3 The roles of chair and chief executive officer should not be exercised by the same individual 2.4 The board should establish a separate nomination committee
3.2 The diversity policy should include requirements for the board to establish measurable objectives for achieving gender diversity
3.3 Companies should disclose in each annual report the measurable objectives for achieving gender diversity set by the board in accordance with the diversity policy and progress towards achieving them
4.1 The board should establish a separate audit committee
4.2
The audit committee should be structured so that it: • consists only of non-executive directors • consists of a majority of independent directors • is chaired by an independent director, who is not chair of the board • has at least 3 members
8.1 The board should establish a separate remuneration committee PRINCIPLE 1 - LAY SOLID FOUNDATIONS FOR MANAGEMENT AND OVERSIGHT BY THE BOARD The board operates in accordance with broad principles set out in its charter which is available from the corporate governance section of the company’s website. The directors formally adopted the board charter in August 2006. Broadly the key responsibilities of the board are: 1. Setting the strategic direction of the company with management and monitoring management implementation of that strategy; 2. Evaluating, approving and monitoring major capital expenditure, capital management and all major corporate transactions; 3. Approving the annual operating budget, annual shareholders report and annual financial accounts; 4. Appointing, monitoring, managing the performance of, and if necessary terminating the employment of the Chief Executive Officer; 5. Approving and monitoring the company’s risk management framework; 6. Ensuring compliance with the Corporations Act 2001, ASX listing rules and other relevant regulations. All directors and key executives reporting to the CEO of the company have been given formal letters of appointment outlining key terms and conditions of their appointment. Performance evaluations for senior executives are carried out annually by either the Chief Executive Officer or the Technical Director. Performance during the previous 12 months is assessed against relevant performance indicators, and role expectations and goals are set for the following year. Performance evaluations have been completed for all executives during the reporting period in accordance with approved processes.
For
per
sona
l use
onl
y

Helix Resources Limited Annual Report 2012
17
PRINCIPLE 2 – STRUCTURE THE BOARD TO ADD VALUE Board Members Details of board members, their experience, expertise, qualifications, term in office and independence status are set-out in the Directors’ Report. The structure of the board does not comply with ASX recommendation 2.1 in that a majority of the directors are not independent. Currently the board consists of four directors of which Mr Gordon Dunbar and Mr John den Dryver are considered independent within the ASX’s definition. The board charter is available from the company’s website.
The Company does not comply with ASX recommendations 2.2 and 2.3 in that the Chairman is not an independent director, and the roles of Chairman and Chief Executive Officer are performed by the same person. The board believes the current structure is appropriate at this stage of the company’s activities.
The board has formalised various policies on securities trading, disclosure and codes of conduct, which assist in providing a stronger governance framework for the Company. These of course are in addition to the Company’s requirements under the Corporations Act 2001 and ASX Listing Rules.
Board structure and composition will be reviewed as and when the company’s strategic directions and activities change. The Company will only recommend the appointment of additional Directors to your board where it believes the expertise and value added outweighs the additional cost. During the year no new directors were appointed to the Helix board.
A copy of the Director Nomination and Induction Policy is available from the corporate governance section of the company’s website.
Nomination Committee The company does not comply with ASX recommendation 2.4 in that there is no separate nomination committee. Given the board comprises four directors it has been decided that there are no efficiencies to be gained from forming a separate nomination committee. The current board members carry out the roles that would otherwise be undertaken by a nomination committee and each director excludes himself from matters in which he has a personal interest.
Each Director completes an annual formal evaluation of the Board’s performance including the Chief Executive Officer and Technical Director. The Chairman conducts an informal evaluation of the board members at least once per annum.
Further information on the performance assessment process for the board and senior executives can be found in the Directors’ Report. Details of director’s attendance at board, audit committee and remuneration committee meetings are detailed in the Directors’ Report.
A copy of the Nomination Committee Charter is available from the corporate governance section of the company’s website.
Independent Advice A director of the Company is entitled to seek independent professional advice (including but not limited to legal, accounting and financial advice) at the Company’s expense on any matter connected with the discharge of his or her responsibilities, in accordance with the procedures and subject to the conditions set out in the board’s charter. PRINCIPLE 3 – PROMOTE ETHICAL AND RESPONSIBLE DECISION MAKING Code of Conduct The board adopted a code of business conduct in August 2006. The code has formalised policies and practices that were in place prior to formal adoption of the code by the company. A copy of the code is made available to all employees of the company.
This code expresses certain basic principles that the Company and employees should follow in all dealings related to the Company. They should show the highest business integrity in their dealings with others, including preserving the confidentiality of other peoples’ information and should conduct the Company’s business in accordance with law and principles of good business practice.
A copy of the code of conduct is available from the corporate governance section of the company’s website.
Securities Trading Policy A formal Securities Trading Policy has been in place since August 2006. Prior to this date there was an understanding among executives of when it was appropriate to trade in the Company’s securities. The policy which has now been adopted has been strengthened, as certain key executives (“Restricted Persons”) are prevented from trading in the company’s shares 2 weeks prior to the announcement of quarterly, half-year and the full-year reports. This is a restriction over and above the requirement to not trade in the Company’s securities when in possession of inside information.
A copy of the Securities Trading Policy is available from the corporate governance section of the company’s website.
Diversity Policy The Company has established a Diversity Policy. The Diversity Policy does not include measurable objectives as the Board believes that the Company will not be able to successfully meet these given the current size of the Company. Given the size of the Company the Directors do not consider it appropriate to set measurable objectives in relation to diversity. Notwithstanding this the Company strives to provide the best possible opportunities for current and prospective employees of all
For
per
sona
l use
onl
y

Helix Resources Limited Annual Report 2012
18
backgrounds in such a manner that best adds to overall shareholder value and which reflects the values, principles and spirit of the Company’s Diversity Policy. For the 2012 financial year the Company had a total of 3 women employees out of a total of 8 employees, with 1 woman in senior management and no women on the board. A copy of the Diversity Policy is available in the Corporate Governance section of the Company’s website.
PRINCIPLE 4 – SAFEGUARD INTEGRITY IN FINANCIAL REPORTING The Chief Executive Officer and Chief Financial Officer have made the following certifications to the board; • That the company’s financial reports are complete and present a true and fair view, in all material respects, of the financial condition and
operational results of the group and are in accordance with relevant accounting standards; • That the reports were founded on a sound system of financial risk management and internal compliance and control. Audit Committee The company does not comply with ASX recommendations 4.1 and 4.2 in that there is no separate audit committee, and it is not comprised only of non-executive Directors. Given the board comprises four directors it has been decided that there are no efficiencies to be gained from forming a separate audit committee. The current board members carry out the roles that would otherwise be undertaken by an audit committee.
The board adopted a formal audit charter in August 2006. Prior to this date the audit committee carried out many of the roles and responsibilities outlined in the charter. The charter sets out the roles and responsibilities of the audit committee and contains information on the procedures for the selection and rotation of the external auditor. A full copy of the Audit Committee Charter is available from the corporate governance section of the Company’s website.
The board believes the audit committee structure is appropriate given the company’s size. The composition of the audit committee will be assessed on an ongoing basis in light of the company’s overall board structure and strategic direction.
PRINCIPLE 5 – MAKE TIMELY AND BALANCED DISCLOSURE Continuous Disclosure The board adopted a formal disclosure policy outlining procedures for compliance with ASX continuous disclosure requirements in August 2006. Informal procedures were in place prior to this time and these have been formulated and strengthened into the written policy. The policy is based upon the Company’s desire to promote fair markets, honest management and full and fair disclosure. The disclosure requirements must be complied with in accordance with their spirit, intention and purpose. The purpose of the policy is to:
• summarise the Company’s disclosure obligations;
• explain what type of information needs to be disclosed;
• identify who is responsible for disclosure; and
• explain how individuals at the Company can contribute. The Company Secretary is responsible for ensuring disclosure of information to the ASX. A copy of the Disclosure Policy is available from the corporate governance section of the company’s website. PRINCIPLE 6 – RESPECT THE RIGHTS OF SHAREHOLDERS Shareholder Communication Strategy The board adopted a formal shareholder communication guidelines policy in August 2006. The policy formalises many of the practices that were in place already but has also resulted in some additional information being made available on the website.
All information disclosed to the ASX is posted on the company’s website as soon as it is disclosed to the ASX. When analysts are briefed on aspects of the group’s operations, the material used in the presentation is released to the ASX and posted on the company’s website. Procedures are in place to determine where price sensitive information has been inadvertently disclosed, and if so, this information is released to the ASX.
The company’s website aims to be user friendly and informative for shareholders and other visitors to the site. The website continues to be updated and refined as appropriate.
The external auditor attends the annual general meeting and is available to respond to questions about the conduct of the audit and content of the independent audit report.
A full copy of the shareholder communication policy is available from the corporate governance section of the company’s website.
For
per
sona
l use
onl
y

Helix Resources Limited Annual Report 2012
19
PRINCIPLE 7 – RECOGNISE AND MANAGE RISK
Risk assessment and management The company does not have a separate Risk Management committee. Given the current size of the company and board, the directors believe there are no efficiencies in forming a separate committee and the board as a whole performs this role.
The company does not have a single specific risk management policy, but rather, financial and operating risks are addressed through individual approved policies and procedures covering financial, contract management, safety and environmental activities of the company. In addition to financial audits, the company’s operations in Australia are subjected to annual Risk Management reviews in accordance with Risk Management Standard AS/NZS ISO 31000:2009. The company engages an insurance broking firm as part of the company’s annual assessment of the coverage for insured assets and risks. The results of all the various reviews and insurances are reported to the board at least annually.
The integrity of Helix’s financial reporting relies upon a sound system of risk management and control. Accordingly, the Chief Executive Officer and Chief Financial Officer, to ensure management accountability, are required to provide a statement in writing to the board that the financial reports of Helix are based upon a sound risk management policy.
The board believes that it has a thorough understanding of the Company’s key risks and is managing them appropriately. A copy of the company’s risk management committee charter is available from the corporate governance section of the company’s website.
PRINCIPLE 8 – REMUNERATE FAIRLY AND RESPONSIBLY
Remuneration committee The Company does not comply with ASX recommendation 8.1 in that it has not established a separate remuneration committee. Given the current size of the company and board, the directors believe there are no efficiencies in forming a separate committee and the board as a whole performs this role. The board of directors reviews and approves recommendations in terms of compensation and incentive plan arrangements for directors and senior executives, having regard to market conditions and the performance of individuals and the consolidated entity.
Remuneration Policies The Company’s remuneration policies are detailed in the Remuneration report in the Directors’ Report.
Non-Executive Director Remuneration Non-executive directors are remunerated by way of director’s fees. Apart from compulsory superannuation entitlements, non-executive directors are not eligible to receive retirement benefits.
A copy of the Remuneration Policy is available from the corporate governance section of the company’s website.
Quad bike based field reconnaissance NSW September 2011
For
per
sona
l use
onl
y

Helix Resources Limited Annual Report 2012
20
DIRECTORS’ REPORT In respect of the financial year ended 30 June 2012, the Directors of Helix Resources Limited, (the parent entity), submit the financial report. In order to comply with the provisions of the Corporations Act 2001, the Director’s report as follows:
DIRECTORS The following persons held office as Directors of Helix Resources Limited during or since the end of the financial year and up to the date of this report:
Greg J Wheeler BCom; FCA; SF Fin; GAICD Executive Chairman; Managing Director and Chief Financial Officer – 14th July 2006 to present Non-Executive Director – 25 October 2004 to 14th July 2006
Mr Wheeler is a Fellow of the Institute of Chartered Accountants in Australia and the Financial Services Institute of Australasia, and has operated in many of the major accounting practices for the past 25 years in Australia and overseas. Greg was a Partner at the Chartered Accounting practices of Grant Thornton [1990 to 1999] and Deloitte [1999 to 2002], before establishing his own consulting firm in 2002. His skills include:- company and business valuations, advice to directors/shareholders; shareholder wealth strategies, capital raisings and broker presentations, acquisitions and divestitures, corporate governance; commercial negotiations and risk assessment and mitigation.
Michael Wilson B Ec; B Sc (Hons); MAusIMM Executive Technical Director - 1st June 2007 to present
Mr Wilson has been with the company since 1997 and has played major roles at Tunkillia on the Gawler Craton, South Australia and in the exploration for gold, platinum group metals and base metals in the Proterozoic Terranes of New South Wales and South Australia, and the Proterozoic and Archaean Terranes in Western Australia. Michael’s experience includes project management; mineral exploration using geology, geochemistry, geophysics and drilling; ore resource drilling, ore resource estimation and evaluation programs; and monitoring joint venture projects. Michael leads our team of experienced geologists and technical staff and is also completing his Masters of Business Administration and Masters of Mineral Economics part-time at Curtin University.
John den Dryver BE (Mining) MSc FAusIMM (CP) Non-Executive Director - Appointed 25 October 2004
Mr den Dryver is a mining engineer with some 30 years mining experience in operational and corporate management. John joined Mount Isa Mines in 1973. In 1982, John joined North Flinders Mines as the Company Mining Engineer. He became the Operations Manager for North Flinders after the mine was commissioned in 1986 and over the next 10 years managed the operations as well as developing the further discoveries in this region including the Callie Mine. In 1987 he was invited to join the Board of North Flinders to become Executive Director- Operations. In 1997 after Normandy Mining took over North Flinders, John was appointed Executive General Manager-Technical leading a team of specialist geologists, mining engineers and metallurgists in operational support, technical review and due-diligence activities. In 2003, after the takeover of Normandy by Newmont Corporation, John set up his own mining consultancy business.
Gordon Dunbar BSc (Hons), MSc, FAusIMM, FAIG Non-Executive Director - Appointed 18 July 2006
Mr Dunbar is a consulting geologist with 40 years experience in the Australian minerals industry managing project development, mineral exploration and evaluation programmes, mine geology, financial studies, production assessment and monitoring joint venture projects. Gordon’s experience includes exploration and mining geology roles at Kambalda with WMC, the evaluation of the Golden Grove base metal deposit in WA, the Chief Geologist at Rosebery Mine in Tasmania and management roles with BP Australia undertaking financial studies, monitoring the evaluation of the Olympic Dam deposit and as Exploration manager for BP Minerals.
Gordon formed his own consulting group in 1990 to provide advice on exploration, evaluation, mining geology, project assessment and pre-feasibility studies, particularly those involving gold, base metals and nickel. He has worked on projects within Australia and Internationally.
DIRECTORSHIPS OF OTHER LISTED COMPANIES Directorships of other listed companies held by directors in the 3 years immediately before the end of the financial year are as follows:
Name Company Period of directorship John den Dryver Adelaide Resources Limited 18 April 2005 – current Gascoyne Resources Limited 5 October 2009 – current Centrex Metals Limited 1 March 2011 – current Gordon Dunbar Gascoyne Resources Limited 5 October 2009 – current Rubianna Resources Limited 13 September 2011 - current JOINT COMPANY SECRETARIES Greg J Wheeler Mr Wheeler is a Chartered Accountant with over 25 years experience in accounting, company secretarial and
corporate management.
For
per
sona
l use
onl
y

Helix Resources Limited Annual Report 2012
21
Joneen McNamara Mrs McNamara is an Accountant and has completed Chartered Secretaries Australia’s Graduate Diploma in Applied Corporate Governance. She is a member of the Institute of Chartered Secretaries and Administrators.
PRINCIPAL ACTIVITIES The principal activity of the Group constituted by Helix Resources Limited and the entities it controlled during the year consisted of gold, iron ore and base metal mineral exploration in Australia and Chile. There has been no significant change in the nature of these activities during the year.
FINANCIAL RESULTS The net consolidated loss of the Group for the financial period, after provision for income tax was $441,374 (2011: $708,373).
DIVIDENDS No dividend has been paid since the end of the previous financial year and no dividend is recommended for the current period.
REVIEW OF OPERATIONS The Consolidated entity’s activities are contained in releases to the ASX on a quarterly basis, discussed in a separate section of this Annual Report as well as on our website at www.helix.net.au. The Company’s strategy continues to focus on prospective gold and copper regions and utilising our corporate and geological expertise to create and extract value for the benefit of our shareholders. Mineral Asset Project Highlights include:- AUSTRALIA Gold Restdown Gold Project - NSW - [Helix 70%; Isokind Pty Ltd 30%] Helix continues its strategy to grow the existing Inferred resource of 2.6Mt @ 1.2g/t Au for 100,000 oz in this mineral prospective and infrastructure rich region. Detailed regional geochemical sampling has confirmed the continuation of the gold mineralised corridor to +7kms and highlighted numerous Priority 1 target zones which are to be drill tested. These new zones provide encouragement that multiple repeats of Sunrise-style mineralisation are present in the district, and should assist in the company’s strategy of proving up an economic resource within trucking distance to several nearby processing operations. NSW Cobar Regional [Helix 100%] Helix considers the +2,000 km2 tenement holding in the region, dominated by VMS style copper and gold systems, has significant exploration and development potential. The company has isolated a series of key structural, geochemical and lithological controls that are being used to prioritise targets within our large tenement holding and with subsequent positive drill results, rapidly build on our resource base in the district. Non-Managed JV - Tunkillia Gold Project - SA [Helix 45% & tenement owner; Mungana Gold Mines 55% & Operator] Helix strategy remains to dilute our interest to ±20% at Decision to Mine 3Q13 [assumes MUX spends $6M in 2012 for PFS and $8M in 2013 for BFS], and sell de-risked project. HLX holds tenements 100% and JV agreement requires 100% participant approval to move to mine development. Mungana Gold Mines [ASX:MUX] as JV operator (55% JV interest purchased from Minotaur Nov 2011 for $6M) increased calendar 2012 work program from $3M to $6.2M to complete PFS, with HLX electing to not contribute and therefore diluting to ±30% at 31 Dec 2012. Iron Ore Non Managed JV - Yalleen Project - WA [API (Aquila/AMCI) 70% iron ore rights / Helix 30% & tenement owner] Helix strategy continues to be to negotiate an acceptable JV agreement with API; await WPIOP infrastructure solution and access terms; re-assess Project viability; sell Project tenements and interest. Olary Magnetite Project – SA [100%] Helix has executed a Share Subscription Agreement with Lodestone Equities Ltd regarding the Olary Magnetite Project as follows:- - Lodestone shall acquire a 50% shareholding in the Helix wholly owned subsidiary, Olary Magnetite Pty Ltd, whose sole assets are EL3956 and 4022 in South Australia, by the cash payment of $0.5M and shall fund a $2M work programme to establish a JORC compliant resource - Lodestone shall have one month after receipt of the JORC Report to elect whether to acquire the remaining 50% shareholding in Olary by a cash payment calculated in accordance with the following formula: Cash Payment = JORC Resource tonnes x DTR% x $0.035 x 150% with a minimum floor of $5M and a capped maximum of $9M. [Example: 1 billion tonnes times 16% DTR times $0.035 times 150% equals $8.4M] - If the Option to acquire the remaining 50% is not exercised by Lodestone, the parties will operate Olary as a corporate joint venture Copper Canbelego Copper Project- NSW - [Helix 51% and earning 70%; Straits Resources 49% diluting] Following the recent success of Straits at their Avoca Tank Prospect and YTC at their Nymagee Prospect, the evidence for high grade plunging shoots within the broader mineralised footprints of these discrete copper systems is considered a compelling target at Canbelego and a recent review of the resource area (1.5Mt @ 1.2% Cu for 18,000t inferred) at the Canbelego Mine Prospect has highlighted several zones below and along strike of the drilling that indicate untested plunges may exist. A small ground-based EM survey over Canbelego, Canbelego West and regional targets Caballero and Mullen is being undertaken, with any significant conductors planned to be drill tested.
For
per
sona
l use
onl
y

Helix Resources Limited Annual Report 2012
22
CHILE Chile hosts world class copper & gold mines and mineralized systems, with the mining sector being one of the major pillars of the Chilean economy given copper exports account for +30% of GDP. Chile is a politically stable democracy with strong financial institutions and sound economic policy providing it the strongest sovereign debt rating in South America. Chile is very supportive of foreign investment and Helix considers it an appropriate location to achieve geographic diversification. Copper Joshua Copper Project [100%] The Joshua Project is Helix’s most advanced project in Chile, is 100% owned with no option payments or royalties, and located 40km SE of Teck’s Carmen de Andacollo porphyry deposit (400Mt @ 0.38% Cu Reserve) in Region IV Chile. The Project is located 40km East of the township of Ovalle [Population 100,000], at low altitude (less than 1700m), with excellent nearby infrastructure. Since drilling 1st commenced mid-2011, with subsequent 200m spaced pole-dipole IP and ground magnetics leading to a DD program 1H12, the Company has outlined potential for a large scale, bulk tonnage copper(+gold) project likely to be amenable to open pit mining. 1st Program 1,200m RC Results 3Q11 - all from surface • 256m @ 0.32% Cu Eq* to EOH, incl. 27m @ 0.58% Cu Eq* • 156m @ 0.26% Cu Eq* • 143m @ 0.27% Cu Eq* 2nd Program 1,000m DD Results 1H12 • DDH2 - 0 to 400m @ 0.33% Cu Eq* to EOH, with 70m @0.41% Cu Eq* from 82m. • DDH3 - 0 to 242m @ 0.14% Cu Eq* to EOH Drilling to date has been confined to the only access track developed to the SE flank of the system testing approximately 0.2km2 of a 1.5km2 target area. Access tracks onto the larger N flank of the system are the next stage and results to date suggest that the system could improve both in grade and widths through this zone and is considered a priority target for future drilling. Huallillinga Copper/Gold Project [100%] Huallillinga Project is a large 95km² area with significant potential for shear hosted copper and gold, with little evidence of modern exploration in the district. From the field activities undertaken to date, Helix has recognised at least two mineralising events associated with large structures (5 to 30 metres wide) controlled by a regional shear zone. Subsequent to year end Helix acquired the Blanco y Negro mine located within the Huallillinga Project to fast-track our goal of defining economically exploitable Cu/Au resources attractive to nearby operating mills. Anecdotal information suggests artisanal mining at the rate of 10 tonnes per day recovering material with a grade of 1.5% to 2% Cu. First-pass rock-chips have returned up to 1.1% Cu (over 4.5m) and up to 1.3g/t Au (over 4.2m) in channel samples taken from outcrop. Of 43 channel samples collected from workings and sub-crop, the results averaged 0.4% Cu, 0.2g/t Au and 47ppm Mo, over a strike exceeding 900m, providing evidence that a large Cu/Au target is present. An IP survey conducted over the mining concession and surrounding area has identified a +600m wide chargeable feature below surficial mine workings, providing further evidence for a large mineral system being present. Hado Gold/Copper Project [100%] The Hado Project targets the same geological domain as the Joshua Area (Cretaceous volcanics intruded by Paleocene intrusives) and is situated 25km S of Joshua and 18km by road from the township of Monte Patria. Hydrothermal breccias, brecciated andesite, diorite porphyry and intrusive granodiorite lithologies have been identified in first-pass geological mapping. An IP survey has identified both a Cu and Au target for follow up, with the gold target being +1,500m x 500m with historical gold workings present.
For
per
sona
l use
onl
y

Helix Resources Limited Annual Report 2012
23
Corporate The Group reported a loss of $441,374 during the year after impairment of $186,569 of carried forward exploration costs. SIGNIFICANT CHANGES IN STATE OF AFFAIRS In the opinion of the Directors, other than disclosed elsewhere in this Report, there were no significant changes in the state of affairs of the Group that occurred during the period under review.
SUBSEQUENT EVENTS OLARY MAGNETITE PROJECT – SOUTH AUSTRALIA Helix has executed a Share Subscription Agreement with Lodestone Equities Ltd [Lodestone] over the Olary Magnetite Project in South Australia reflecting the terms of the MoU announced 23 July 2012. Lodestone has acquired a 33% shareholding in the Helix wholly owned subsidiary, Olary Magnetite Pty Ltd [Olary], with an up-front cash payment of $0.5M to Helix and $1M towards the proposed work program. Olary’s sole assets are tenements EL3956 and EL4022 prospective for Braemar Fe Formation in South Australia. Upon all approvals being received to enable drilling to commence, Lodestone will provide a further $1M to earn 50% in Olary. Helix will oversee the work program, receiving a management fee, with drilling and assays used to establish an independently estimated maiden Inferred JORC compliant resource. Lodestone has one month after receipt of the independent JORC Report to elect whether to acquire the remaining 50% shareholding in Olary by an additional cash payment calculated in accordance with the following formula: Cash Payment = JORC Resource tonnes x DTR% x $0.035 x150% with a floor price of $5M and a cap of $9M. If the Option to acquire the remaining 50% is not exercised by Lodestone, the parties will operate Olary as a corporate joint venture.
FUTURE DEVELOPMENTS Disclosure of information regarding likely developments in the operations of the Group in future financial years and the expected results of those operations is likely to result in unreasonable prejudice to the Group. Accordingly, this information has not been disclosed in this report.
REMUNERATION REPORT [AUDITED] The Company’s Executive Officers’ remuneration policy is set to ensure that remuneration packages properly reflect the duties and responsibilities of the senior executives and are sufficient to attract, retain and motivate personnel of the requisite quality. The policy is administered by the Remuneration Committee, which is comprised of all board members. The Executive Officers of the Company are employed under Service Agreements which are identical in their contents and only differ in remuneration levels. They have durations of twenty four months currently expiring June 2013 and renew automatically unless terminated by either the Company by giving a minimum of twelve months notice to the individual; or by the individual by giving six months notice to the Company. Whilst the level of remuneration is not dependent on the satisfaction of any performance condition, the performance of Executives is reviewed on an annual basis against a number of qualitative and quantitative factors.
Non-executive Directors are remunerated by fees determined by the Board within the aggregate Directors’ fee pool limit of $150,000 approved by shareholders in April 1996. The pool limit is not at present fully utilised. In setting the fees, account is taken of the responsibilities inherent in the stewardship of the Company and the demands made of Directors in the discharge of their responsibilities. Advice is taken from independent sources where appropriate to ensure remuneration accords with market practice.
The company has largely adopted the ASX Corporate Governance Council’s Principles of Good Corporate Governance and Best Practice Recommendations and decided to remunerate its non-executive directors on an ongoing basis with no accrual or entitlement to a retirement benefit.
Remuneration packages contain the following key elements: a) Primary benefits – salary / fees and performance based bonuses; b) Equity – share options granted under the executive share option plan as disclosed in note 17 to the financial statements. The following table discloses the remuneration of the directors and executives of the company:
For
per
sona
l use
onl
y

Helix Resources Limited Annual Report 2012
24
Primary Post Employment Equity
2012
Salary & Fees
$
Perfor- mance Based
Payment* $
Non Monetary
$
Super-annuation
$
Pre-scribed Benefits
$
Other Retire- ment
Benefits $
Options $
% of Remu-
neration
%
Other Benefits
$
Total $
Key Management Personnel
G J Wheeler 311,927 - - 28,073 - - - - - 340,000
M H Wilson 222,385 - - 20,015 - - - - - 242,400
J den Dryver 36,698 - - 3,302 - - - - - 40,000
G Dunbar 40,000 - - - - - - - - 40,000
J McNamara 80,140 - - 7,212 - - - - - 87,352 Total Key Management Personnel
691,150 - - 58,602 - - - - - 749,752
Primary Post Employment Equity
2011
Salary & Fees
$
Perfor- mance Based
Payment $
Non Monetary
$
Super-annuation
$
Pre-scribed Benefits
$
Other Retire- ment
Benefits $
Options $
% of Remu-
neration
%
Other Benefits
$
Total $
Key Management Personnel
G J Wheeler 297,592 73,395 - 33,388 - - - - - 404,375
M H Wilson 247,300** 50,459 - 22,921 - - - - - 320,680
J den Dryver 36,698 - - 3,302 - - - - - 40,000
G Dunbar 40,000 - - - - - - - - 40,000
J McNamara 79,117 11,010 - 8,111 - - - - - 98,238 Total Key Management Personnel
700,707 134,864* - 67,722 - - - - - 903,293
*The bonus paid in April 2011 was to recognise the voluntary reduction by staff in salaries by ±25% during 2009/10 and ±15% during 2010/11 to recognise the GFC and to conserve cash. **During 2011 the Long Service Leave entitlement of MH Wilson was paid out [$48,000].
DIRECTORS’ SHARE AND OPTION HOLDINGS
Director *Fully Paid Ordinary Shares
G J Wheeler 16,873,259
M H Wilson 2,349,700
J den Dryver 600,000
G Dunbar 1,050,000 * Directors’ interests in ordinary shares and options of the parent entity are shown at the date of this Directors’ Report.
For
per
sona
l use
onl
y

Helix Resources Limited Annual Report 2012
25
OFFICERS’ INDEMNITY AND INSURANCE During the year the Company paid an insurance premium to insure the Directors and Officers of the Company and related bodies corporate. The Officers of the Company covered by the insurance policy include the Directors named in this report.
The Directors’ and Officers’ Liability insurance provides cover against all costs and expenses that may be incurred in defending civil or criminal proceedings that fall within the scope of the indemnity and that may be brought against the officers in their capacity as officers of the Company or a related body corporate. The insurance policy does not contain details of the premium paid in respect of individual officers of the Company. Disclosure of the nature of the liability cover and the amount of the premium is subject to a confidentiality clause under the insurance policy.
The Company has entered into an agreement with the Directors and Officers to indemnify them against any claim and related expenses, which arise as a result of work completed in their respective capacities.
The Company has not otherwise, during or since the financial year indemnified or agreed to indemnify an officer or auditor of the Company or of any related body corporate against a liability incurred as such an officer or auditor.
ENVIRONMENTAL REGULATIONS The Group is subject to environmental regulations under laws of the Commonwealth and State. The Group has a policy of complying with its environmental performance obligations and at the date of this report, is not aware of any breach of such regulations. MEETINGS OF DIRECTORS The number of meetings held during the year by Company Directors (including meetings of committees of Directors) and the number of those meetings attended by each Director was:
Board of Directors’ Meetings Remuneration Committee Meetings
Audit Committee Meetings
Held Attended Held Attended Held Attended
G J Wheeler 3 3 1 1 2 2
M H Wilson 3 3 1 1 2 2
J den Dryver 3 3 1 1 2 2
G Dunbar 3 3 1 1 2 2
NON-AUDIT SERVICES The auditors did not provide any non-audit services during the financial year.
AUDITOR’S INDEPENDENCE DECLARATION The auditor’s independence declaration is included on page 27 of the financial report.
Dated at Perth this 22nd day of August 2012.
This report is made and signed in accordance with a resolution of Directors made pursuant to s.298(2) of the Corporations Act 2001. On behalf of the Directors.
Greg J Wheeler Executive Chairman
For
per
sona
l use
onl
y

Helix Resources Limited Annual Report 2012
26
Competent Persons Statement The information in this announcement that relates to Exploration Results, Mineral Resources or Ore Reserves is based on information compiled by Mr M Wilson who is a full time employee of Helix Resources Limited and a Member of The Australasian Institute of Mining and Metallurgy. Mr M Wilson has sufficient experience which is relevant to the style of mineralisation and type of deposit under consideration and to the activity which he is undertaking to qualify as a Competent Person as defined in the 2004 Edition of the ‘Australasian Code for Reporting of Exploration Results, Mineral Resources and Ore Reserves’. Mr M Wilson consents to the inclusion in the report of the matters based on his information in the form and context in which it appears. Details of the assumptions underlying any Resource estimations are contained in previous ASX releases or at www.helix.net.au Exploration Target References to exploration target size and target mineralisation in this announcement are conceptual in nature and should not be construed as indicating the existence of a JORC Code compliant mineral resource. Target mineralisation is based on projections of established grade ranges over appropriate widths and strike lengths having regard for geological considerations including mineralisation style, specific gravity and expected mineralisation continuity as determined by qualified geological assessment. There is insufficient information to establish whether further exploration will result in the determination of a mineral resource within the meaning of the JORC Code. Copper Equivalent Calculation Copper Equivalent (also Cu Eq*) Calculation represents the total metal value for each metal, multiplied by the conversion factor, added and expressed in equivalent copper percentage. These results are exploration results only and a 10% allowance has been made for recovery losses that may occur should mining eventually result. It is the Company’s opinion that elements considered here have a reasonable potential to be recovered as evidenced in similar multi-commodity natured porphyry mines elsewhere in Chile. Copper Eq values calculated using = (Cu_ppm) + (Au_ppm x 0.7).
For
per
sona
l use
onl
y

Helix Resources Limited Annual Report 2012
27
AUDITOR’S INDEPENDENCE DECLARATION
Grant Thornton Audit Pty Ltd
ABN 94 269 609 023
10 Kings Park Road West Perth WA 6005
PO Box 570 West Perth WA 6872
T +61 8 9480 2000 F +61 8 9322 7787
E [email protected] W www.grantthornton.com.au
Auditor’s Independence Declaration To the Directors of Helix Resources Limited
In accordance with the requirements of section 307C of the Corporations Act 2001, as lead auditor for the audit of Helix Resources Limited for the year ended 30 June 2012, I declare that, to the best of my knowledge and belief, there have been: a no contraventions of the auditor independence requirements of the Corporations Act 2001 in relation to the audit; and
b no contraventions of any applicable code of professional conduct in relation to the audit.
GRANT THORNTON AUDIT PTY LTD Chartered Accountants
C A Becker Partner - Audit & Assurance Perth, 22 August 2012 Grant Thornton Australia Limited is a member firm within Grant Thornton International Ltd. Grant Thornton International Ltd and the member firms are not a worldwide partnership. Grant Thornton Australia Limited, together with its subsidiaries and related entities, delivers its services independently in Australia. Liability limited by a scheme approved under Professional Standards Legislation
For
per
sona
l use
onl
y

Helix Resources Limited Annual Report 2012
28
INDEPENDENT AUDIT REPORT
Grant Thornton Audit Pty Ltd ABN 94 269 609 023
10 Kings Park Road West Perth WA 6005 PO Box 570 West Perth WA 6872
T +61 8 9480 2000 F +61 8 9322 7787 E [email protected] W www.grantthornton.com.au
Independent Auditor’s Report To the Members of Helix Resources Limited Report on the financial report We have audited the accompanying financial report of Helix Resources Limited (the “Company”), which comprises the Statement of financial position as at 30 June 2012, the Statement of comprehensive income, Statement of changes in equity and Statement of cash flows for the year then ended, notes comprising a summary of significant accounting policies and other explanatory information and the directors’ declaration of the consolidated entity comprising the Company and the entities it controlled at the year’s end or from time to time during the financial year. Directors’ responsibility for the financial report The Directors of the Company are responsible for the preparation of the financial report that gives a true and fair view of the financial report in accordance with Australian Accounting Standards and the Corporations Act 2001. This responsibility includes such internal controls as the Directors determine are necessary to enable the preparation of the financial report to be free from material misstatement, whether due to fraud or error. The Directors also state, in the notes to the financial report, in accordance with Accounting Standard AASB 101 Presentation of Financial Statements, that compliance with the Australian equivalents to International Financial Reporting Standards ensures that the financial report, comprising the financial statements and notes, complies with International Financial Reporting Standards. Auditor’s responsibility Our responsibility is to express an opinion on the financial report based on our audit. We conducted our audit in accordance with Australian Auditing Standards which require us to comply with relevant ethical requirements relating to audit engagements and plan and perform the audit to obtain reasonable assurance whether the financial report is free from material misstatement.
Grant Thornton Australia Limited is a member firm within Grant Thornton International Ltd. Grant Thornton International Ltd and the member firms are not a worldwide partnership. Grant Thornton Australia Limited, together with its subsidiaries and related entities, delivers its services independently in Australia.
Liability limited by a scheme approved under Professional Standards Legislation
For
per
sona
l use
onl
y

Helix Resources Limited Annual Report 2012
29
An audit involves performing procedures to obtain audit evidence about the amounts and disclosures in the financial report. The procedures selected depend on the auditor’s judgement, including the assessment of the risks of material misstatement of the financial report, whether due to fraud or error.
In making those risk assessments, the auditor considers internal control relevant to the Company’s preparation and fair presentation of the financial report in order to design audit procedures that are appropriate in the circumstances, but not for the purpose of expressing an opinion on the effectiveness of the Company’s internal control. An audit also includes evaluating the appropriateness of accounting policies used and the reasonableness of accounting estimates made by the Directors, as well as evaluating the overall presentation of the financial report.
We believe that the audit evidence we have obtained is sufficient and appropriate to provide a basis for our audit opinion.
Independence In conducting our audit, we have complied with the independence requirements of the Corporations Act 2001.
Auditor’s opinion In our opinion:
a the financial report of Helix Resources Limited is in accordance with the
Corporations Act 2001, including:
i giving a true and fair view of the Company’s and consolidated entity’s financial position
as at 30 June 2012 and of its performance for the year ended on that date; and
ii complying with Australian Accounting Standards and the Corporations Regulations 2001; and
b the financial report also complies with International Financial Reporting Standards as
disclosed in the notes to the financial statements.
Report on the remuneration report We have audited the remuneration report included in pages 23 to 25 of the directors’ report for the year ended 30 June 2012. The Directors of the Company are responsible for the preparation and presentation of the remuneration report in accordance with section 300A of the Corporations Act 2001. Our responsibility is to express an opinion on the remuneration report, based on our audit conducted in accordance with Australian Auditing Standards.
For
per
sona
l use
onl
y

Helix Resources Limited Annual Report 2012
30
Auditor’s opinion on the remuneration report In our opinion, the remuneration report of Helix Resources Limited for the year ended 30 June 2012, complies with section 300A of the Corporations Act 2001.
GRANT THORNTON AUDIT PTY LTD Chartered Accountants
C A Becker Partner – Audit & Assurance
Perth, 22 August 2012
For
per
sona
l use
onl
y

Helix Resources Limited Annual Report 2012
31
DIRECTORS’ DECLARATION The Directors of the company declare that:
1. The consolidated financial statements and notes, as set out on pages 32 to 61 are in accordance with the Corporations Act 2001 and:-
a. comply with Australian Accounting Standards (including the Australian Accounting Interpretations) and the Corporations Regulations 2001; and
b. give a true and fair view of the financial position as at 30 June 2012 and of the performance for the year ended on that date of the group; and
c. complies with International Financial Reporting Standards as disclosed in Note 1.
2. the Chief Executive Officer and Chief Finance Officer have each declared that:-
a. the financial records of the Company for the financial year have been properly maintained in accordance with s 286 of the Corporations Act 2001;
b. the financial statements and notes for the financial year comply with the Accounting Standards; and
c. the financial statements and notes for the financial year give a true and fair view; 3. In the directors’ opinion, there are reasonable grounds to believe that the Company will be able to pay its debts as and when they become
due and payable;
This declaration is made in accordance with a resolution of the Board of Directors.
On behalf of the Directors
Greg J Wheeler Executive Chairman Signed at Perth this 22nd day of August 2012.
For
per
sona
l use
onl
y

Helix Resources Limited Annual Report 2012
32
STATEMENT OF FINANCIAL POSITION AS AT 30 JUNE 2012
CONSOLIDATED
Note 2012 2011
$ $
Current Assets Cash and Cash Equivalents 2 1,075,879 4,284,040
Trade and Other Receivables 3 61,969 160,969
Other Financial Assets 4 780,576 3,600
Total Current Assets 1,918,424 4,448,609
Non-Current Assets Property, Plant & Equipment 6 122,318 94,225
Exploration and Evaluation 7 12,558,617 9,747,315
Other Financial Assets 5 202,712 1,064,000
Total Non-Current Assets 12,883,647 10,905,540
Total Assets 14,802,071 15,354,149
Current Liabilities Trade and Other Payables 8 266,634 343,842
Short Term Provisions 9 128,014 107,119
Total Current Liabilities 394,648 450,961
Non- Current Liabilities Long Term Provisions 9 69,554 65,845
Total Non-Current Liabilities 69,554 65,845
Total Liabilities 464,202 516,806
Net Assets 14,337,869 14,837,343
Equity Share Capital 10 59,186,339 59,145,439
Reserves 11 665,000 825,600
Accumulated Losses 12 (45,513,470) (45,133,696)
Total Equity 14,337,869 14,837,343
This statement should be read in conjunction with the Notes to the Financial Statements
For
per
sona
l use
onl
y
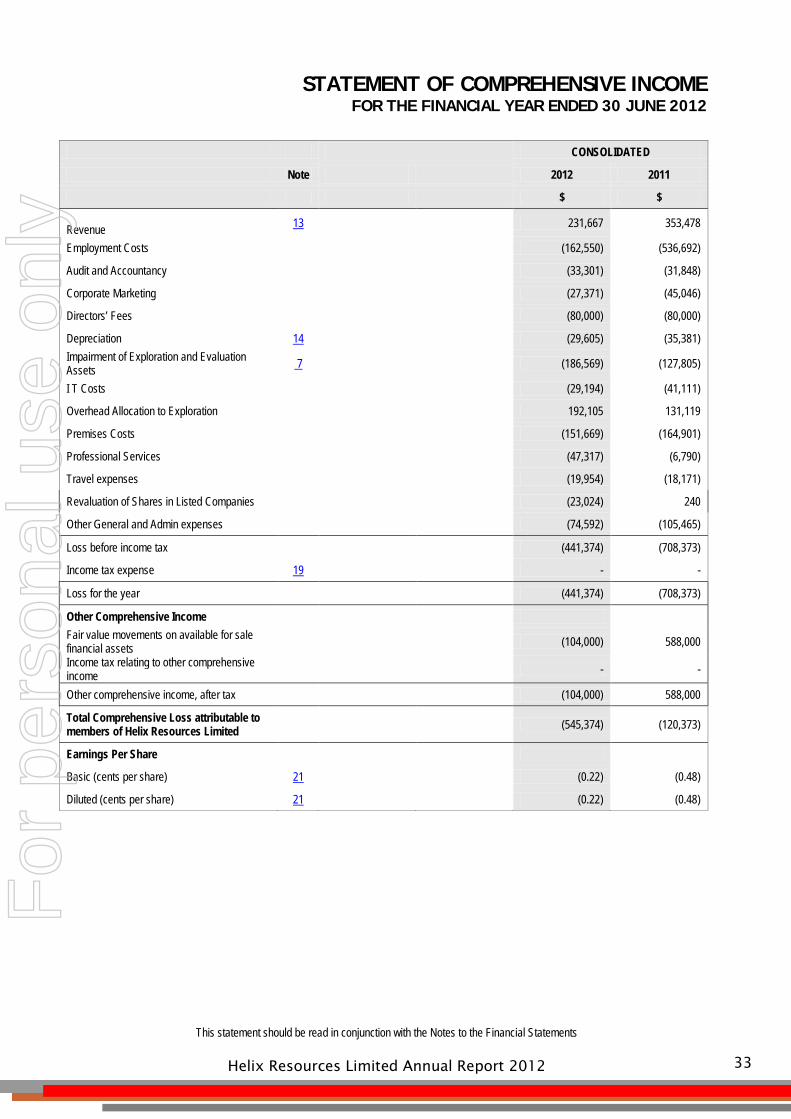
Helix Resources Limited Annual Report 2012
33
STATEMENT OF COMPREHENSIVE INCOME FOR THE FINANCIAL YEAR ENDED 30 JUNE 2012
CONSOLIDATED Note 2012 2011 $ $ Revenue 13 231,667 353,478
Employment Costs (162,550) (536,692)
Audit and Accountancy (33,301) (31,848)
Corporate Marketing (27,371) (45,046)
Directors’ Fees (80,000) (80,000)
Depreciation 14 (29,605) (35,381) Impairment of Exploration and Evaluation Assets 7 (186,569) (127,805)
I T Costs (29,194) (41,111)
Overhead Allocation to Exploration 192,105 131,119
Premises Costs (151,669) (164,901)
Professional Services (47,317) (6,790)
Travel expenses (19,954) (18,171)
Revaluation of Shares in Listed Companies (23,024) 240
Other General and Admin expenses (74,592) (105,465)
Loss before income tax (441,374) (708,373)
Income tax expense 19 - -
Loss for the year (441,374) (708,373)
Other Comprehensive Income Fair value movements on available for sale financial assets (104,000) 588,000 Income tax relating to other comprehensive income - -
Other comprehensive income, after tax (104,000) 588,000
Total Comprehensive Loss attributable to members of Helix Resources Limited (545,374) (120,373)
Earnings Per Share
Basic (cents per share) 21 (0.22) (0.48)
Diluted (cents per share) 21 (0.22) (0.48)
This statement should be read in conjunction with the Notes to the Financial Statements
For
per
sona
l use
onl
y

Helix Resources Limited Annual Report 2012
34
STATEMENT OF CASH FLOWS FOR THE FINANCIAL YEAR ENDED 30 JUNE 2012
CONSOLIDATED Note 2012 2011 $ $
Cash Flow From Operating Activities Payments to suppliers and employees (394,973) (687,691)
Interest received 158,176 203,924
Other receipts 41,017 165,017
Net cash used in operating activities 2(b) (195,780) (318,750)
Cash Flow From Investing Activities Payments for capitalised exploration & evaluation expenditure (2,997,871) (3,746,492)
Payments for property, plant & equipment (57,698) (29,751)
Proceeds for investments - 60,081
Payments for security deposits (2,712) (50,000)
Net cash used in investing activities (3,058,281) (3,766,162)
Cash Flow From Financing Activities
Proceeds from issue of shares and options 45,900 4,927,737
Share issue costs paid - (136,620)
Net cash provided by financing activities 45,900 4,791,117
Net increase / (decrease) in cash and cash equivalents held (3,208,161) 706,205 Cash and cash equivalents at beginning of financial year 4,284,040 3,577,835
Cash and cash equivalents at End of Financial Year 2(a) 1,075,879 4,284,040
This statement should be read in conjunction with the Notes to the Financial Statements
For
per
sona
l use
onl
y

Helix Resources Limited Annual Report 2012
35
STATEMENT OF CHANGES IN EQUITY FOR THE FINANCIAL YEAR ENDED 30 JUNE 2012
CONSOLIDATED Share Capital
2012 Ordinary Other Reserves Accumulated Losses Total
$ $ $ $ Total equity at the beginning of the financial year 59,145,439 825,600 (45,133,696) 14,837,343
Shares issued during the financial year 40,900 - - 40,900
Share Issue Costs - - - -
Options issued during the financial year - 5,000 - 5,000
Exercise of options during the financial year - - - -
Expiry of options during the financial year - (61,600) 61,600 -
Loss for the year - - (441,374) (441,374)
Other Comprehensive Income for the year - (104,000) - (104,000)
Total equity at the end of the financial year 59,186,339 665,000 (45,513,470) 14,337,869
CONSOLIDATED Share Capital
2011 Ordinary Other Reserves Accumulated Losses Total
$ $ $ $ Total equity at the beginning of the financial year 53,571,624 1,037,930 (44,442,955) 10,166,599
Shares issued during the financial year 2,277,000 - - 2,277,000
Share Issue Costs (136,620) - - (136,620)
Exercise of options during the financial year 3,433,435 (782,698) - 2,650,737
Expiry of options during the financial year - (17,632) 17,632 -
Loss for the year - - (708,373) (708,373)
Other Comprehensive Income for the year - 588,000 - 588,000
Total equity at the end of the financial year 59,145,439 825,600 (45,133,696) 14,837,343
This statement should be read in conjunction with the Notes to the Financial Statements
For
per
sona
l use
onl
y

Helix Resources Limited Annual Report 2012
36
NOTES TO THE FINANCIAL STATEMENTS
FOR THE FINANCIAL YEAR ENDED 30 JUNE 2012 1. SUMMARY OF ACCOUNTING POLICIES
Financial Reporting Framework The financial report is a general-purpose financial report that has been prepared in accordance with the Corporations Act 2001, Australian Accounting Standards and Australian Accounting Interpretations, other authoritative pronouncements of the Australian Accounting Standards Board and complies with other requirements of the law. The financial report includes financial statements for Helix Resources Limited as the Consolidated Entity (Group) consisting of Helix Resources Limited and its controlled entities.
Australian Accounting Standards set out accounting policies that the AASB has concluded would result in a financial report containing relevant and reliable information about transactions, events and conditions. Compliance with Australian Accounting Standards ensures that the financial statements and notes also comply with International Financial Reporting Standards.
Accounting policies Material accounting policies adopted in the preparation of the financial report are set out below. These policies have been consistently applied to all the periods presented, unless otherwise stated.
Historical cost convention These financial statements have been prepared under the historical cost convention, as modified where applicable by the revaluation of available-for-sale financial assets, financial assets and liabilities (including derivative instruments) at fair value through profit or loss, certain classes of property, plant and equipment and investment property. A summary of the Group’s significant accounting policies is set out below.
a) Principles of Consolidation The consolidated financial statements incorporate the assets, liabilities and results of entities controlled by Helix Resources Limited at the end of the reporting period. A controlled entity is any entity over which Helix Resources Limited has the power to govern the financial and operating policies so as to obtain benefits from the entity’s activities. Control will generally exist when the parent owns, directly or indirectly through subsidiaries, more than half of the voting power of an entity. In assessing the power to govern, the existence and effect of holdings of actual and potential voting rights are also considered.
Where controlled entities have entered or left the Group during the year, the financial performance of those entities are included only for the period of the year that they were controlled. A list of controlled entities is contained in Note 4 to the financial statements.
In preparing the consolidated financial statements, all inter-group balances and transactions between entities in the consolidated group have been eliminated on consolidation. Accounting policies of subsidiaries have been changed where necessary to ensure consistency with those adopted by the parent entity.
b) Cash and Cash Equivalents Cash on hand and in banks and short term deposits are stated at nominal value. For the purposes of the Statement of Cash Flows, cash includes cash on hand and in banks, and money market investments readily convertible to cash within 90 days, net of outstanding bank overdrafts.
c) Income Tax The income tax expense or revenue for the period is the tax payable on the current period's taxable income based on the national income tax rate for each jurisdiction adjusted by changes in deferred tax assets and liabilities attributable to temporary differences between the tax bases of assets and liabilities and their carrying amounts in the financial statements, and to unused tax losses.
Deferred tax assets and liabilities are recognised for temporary differences at the tax rates expected to apply when the assets are recovered or liabilities are settled, based on those tax rates which are enacted or substantively enacted for each jurisdiction. The relevant tax rates are applied to the cumulative amounts of deductible and taxable temporary differences to measure the deferred tax asset or liability. An exception is made for certain temporary differences arising from the initial recognition of an asset or a liability. No deferred tax asset or liability is recognised in relation to these temporary differences if they arose in a transaction, other than a business combination, that at the time of the transaction did not affect either accounting profit or taxable profit or loss.
Deferred tax assets are recognised for deductible temporary differences and unused tax losses only if it is probable that future taxable amounts will be available to utilise those temporary differences and losses. Deferred tax liabilities and assets are not recognised for temporary differences between the carrying amount and tax bases of investments in subsidiaries where the parent entity is able to control the timing of the reversal of the temporary differences and it is probable that the differences will not reverse in the foreseeable future. Current and deferred tax balances attributable to amounts recognised directly in equity are also recognised directly in equity. F
or p
erso
nal u
se o
nly

Helix Resources Limited Annual Report 2012
37
d) Plant and Equipment Plant and equipment are measured on the cost basis. The carrying amount of plant and equipment is reviewed annually by directors to ensure it is not in excess of the recoverable amount from these assets. The recoverable amount is assessed on the basis of the expected net cash flows that will be received from the asset’s employment and subsequent disposal. The expected net cash flows have been discounted to their present values in determining recoverable amounts.
The depreciation rates used for each class of depreciable assets are: Plant and equipment Straight line 10% - 33%
Diminishing Value 20% - 40% Motor Vehicles Diminishing Value 22.5%
e) Exploration and evaluation Exploration and evaluation expenditure incurred is accumulated in respect of each identifiable area of interest. These costs are only carried forward to the extent that they are expected to be recouped through the successful development of the area or where activities in the area have not yet reached a stage that permits reasonable assessment of the existence of economically recoverable reserves. Accumulated costs in relation to an abandoned area are written off in full against profit in the year in which the decision to abandon the area is made. When production commences, the accumulated costs for the relevant area of interest are amortised over the life of the area according to the rate of depletion of the economically recoverable reserves. A regular review is undertaken of each area of interest to determine the appropriateness of continuing to carry forward costs in relation to that area of interest.
f) Leases Lease payments for operating leases where substantially all the risks and benefits remain with the lessor are charged as expenses in the periods in which they are incurred.
g) Non-derivative financial instruments Financial instruments are initially measured at cost on trade date, which includes transaction costs. Subsequent to initial recognition, these instruments are measured as set out below.
(i) Financial assets at fair value through profit or loss This category has two sub-categories: financial assets held for trading, and those designated at fair value through profit or loss on initial recognition. A financial asset is classified in this category if acquired principally for the purpose of selling in the short term or if so designated by management. The policy of management is to designate a financial asset if there exists the possibility it will be sold in the short term and the asset is subject to frequent changes in fair value. Derivatives are also categorised as held for trading unless they are designated as hedges. Assets in this category are classified as current assets if they are either held for trading or are expected to be realised within 12 months of the reporting date.
(ii) Loans and receivables Loans and receivables are non derivative financial assets with fixed or determinable payments that are not quoted in an active market. They arise when the Group provides money, goods or services directly to a debtor with no intention of selling the receivable. They are included in current assets, except for those with maturities greater than 12 months after the reporting date which are classified as non-current assets. Loans and receivables are included in receivables in the Statement of Financial Position.
(iii) Held-to-maturity investments Held-to-maturity investments are non-derivative financial assets with fixed or determinable payments and fixed maturities that the Group's management has the positive intention and ability to hold to maturity.
(iv) Available-for-sale financial assets Available-for-sale financial assets, comprising principally marketable equity securities, are non-derivatives that are either designated in this category or not classified in any of the other categories. They are included in non-current assets unless management intends to dispose of the investment within 12 months of the reporting date.
Purchases and sales of investments are recognised on trade-date - the date on which the Group commits to purchase or sell the asset. Investments are initially recognised at fair value plus transaction costs for all financial assets not carried at fair value through profit or loss. Financial assets are derecognised when the rights to receive cash flows from the financial assets have expired or have been transferred and the Group has transferred substantially all the risks and rewards of ownership.
Available-for-sale financial assets and financial assets at fair value through profit and loss are subsequently carried at fair value. Loans and receivables and held-to-maturity investments are carried at amortised cost using the effective interest method. Realised and unrealised gains and losses arising from changes in the fair value of the 'financial assets at fair value through profit or loss' category are included in the statement of comprehensive income in the period in which they arise. Unrealised gains and losses arising from changes in the fair value of non monetary securities classified as available-for-sale are recognised in equity in the available-for-sale investments revaluation reserve.
When securities classified as available-for-sale are sold or impaired, the accumulated fair value adjustments are included in the statement of comprehensive income as gains and losses from investment securities.
The fair values of quoted investments are based on current bid prices. If the market for a financial asset is not active (and for unlisted securi-
For
per
sona
l use
onl
y

Helix Resources Limited Annual Report 2012
38
ties), the Group establishes fair value by using valuation techniques. These include reference to the fair values of recent arm's length transactions, involving the same instruments or other instruments that are substantially the same, discounted cash flow analysis, and option pricing models refined to reflect the issuer's specific circumstances.
The Group assesses at reporting date whether there is objective evidence that a financial asset or group of financial assets is impaired. In the case of equity securities classified as available for sale, a significant or prolonged decline in the fair value of a security below its cost is considered in determining whether the security is impaired. If any such evidence exists for available-for-sale financial assets, the cumulative loss - measured as the difference between the acquisition cost and the current fair value, less any impairment loss on that financial asset previously recognised in profit and loss - is removed from equity and recognised in the statement of comprehensive income. Impairment losses recognised in the statement of comprehensive income on equity instruments are not reversed through the statement of comprehensive income.
h) Employee Benefits Provision is made for benefits accruing to employees in respect of wages and salaries, annual leave and long service leave when it is probable that settlement will be required and they are capable of being measured reliably. Provision is made in respect of wages and salaries, annual leave and other employee benefits expected to be settled within 12 months, are measured at their nominal values using the remuneration rate expected to apply at the time of settlement. Provision made in respect of long service leave which is not expected to be settled within 12 months is measured as the present value of the estimated future cash outflows to be made by the Group in respect of services provided by the employees up to reporting date.
Share-based payments Share-based compensation benefits are provided to employees via various Share Option Plans.
The fair value of options granted is recognised as an employee benefit expense with a corresponding increase in equity. The fair value is measured at grant date and recognised over the period during which the employees become unconditionally entitled to the options.
The fair value at grant date is independently determined using a Black-Scholes option pricing model that takes into account the exercise price, the term of the option, the vesting and performance criteria, the impact of dilution, the non-tradable nature of the option, the share price at grant date and expected price volatility of the underlying share, the expected dividend yield and the risk-free interest rate for the term of the option.
The fair value of the options granted excludes the impact of any non-market vesting conditions (for example, profitability and sales growth targets). Non-market vesting conditions are included in assumptions about the number of options that are expected to become exercisable. At each reporting date, the entity revises its estimate of the number of options that are expected to become exercisable. The employee benefit expense recognised each period takes into account the most recent estimate.
Upon the exercise of options, the balance of the share-based payments reserve relating to those options is transferred to share capital. The market value of shares issued to employees for no cash consideration under the Share Plans is recognised as an employee benefits expense with a corresponding increase in equity when the employees become entitled to the shares.
i) Interest in Joint Venture Operations Interest in joint venture operations, where material, are brought to account by including in the respective classifications, the Group's share of the individual assets employed and liabilities and expenses incurred.
Details of interests in joint ventures are shown at Note 22.
j) Revenue Recognition Revenue from the disposal of assets is recognised when the Group has passed control of the goods or other assets to the buyer. Interest on bank deposits is recognised as income as it accrues.
Interest revenue is recognised using the effective interest rate method, which, for floating rate financial assets, is the rate inherent in the instrument and is net of GST.
k) Accounts Payable Trade payables and other accounts payable are recognised when the Group becomes obliged to make future payments resulting from the purchase of goods and services.
l) Receivables Other receivables are recorded at amounts due less any specific provision for doubtful debts.
m) Goods and Services Tax Revenues, expenses and assets are recognised net of the amount of goods and services tax GST), except:
• where the amount of GST incurred is not recoverable from the taxation authority, it is recognised as part of the cost of acquisition of an asset or as part of an item of expense; or
• for receivables and payables which are recognised inclusive of GST. The net amount of GST recoverable from, or payable to, the taxation authority is included as part of receivables or payables. Cash flows are included in the statement of cash flows on a gross basis. The GST component of cash flows arising from investing and financing activities which is recoverable from, or payable to, the taxation authority is classified as operating cash flows.
For
per
sona
l use
onl
y

Helix Resources Limited Annual Report 2012
39
n) Impairment of Non-financial Assets Non-financial assets that have an indefinite useful life are not subject to amortisation and are tested annually for impairment. Assets that are subject to amortisation are reviewed for impairment whenever events or changes in circumstances indicate that the carrying amount may not be recoverable. An impairment loss is recognised for the amount by which the asset's carrying amount exceeds its recoverable amount. The recoverable amount is the higher of an asset's fair value less costs to sell and value in use. For the purposes of assessing impairment, assets are grouped at the lowest levels for which there are separately identifiable cash flows (cash generating units).
o) Fair Value Estimation The fair value of financial assets and financial liabilities must be estimated for recognition and measurement or for disclosure purposes. The fair value of financial instruments traded in active markets (such as publicly traded derivatives, and trading and available-for-sale securities) is based on quoted market prices at the reporting date. The quoted market price used for financial assets held by the Group is the current bid price; the appropriate quoted market price for financial liabilities is the current ask price.
The fair value of financial instruments that are not traded in an active market (for example, over-the-counter derivatives) is determined using valuation techniques. The Group uses a variety of methods and makes assumptions that are based on market conditions existing at each reporting date. Quoted market prices or dealer quotes for similar instruments are used for long-term debt instruments held. Other techniques, such as estimated discounted cash flows, are used to determine fair value for the remaining financial instruments.
The nominal value less estimated credit adjustments of trade receivables and payables are assumed to approximate their fair values. The fair value of financial liabilities for disclosure purposes is estimated by discounting the future contractual cash flows at the current market interest rate that is available to the Group for similar financial instruments.
p) Critical Accounting Estimates and Other Accounting Judgements Estimates and judgements are continually evaluated and are based on historical experience and other factors, including expectations of future events that are believed to be reasonable under the circumstances. The Group is of the view that there are no critical accounting estimates and judgements in this financial report, other than accounting estimates and judgements in relation to the following: Exploration and Evaluation Expenditure The Group capitalises expenditure relating to exploration and evaluation where it is considered likely to be recoverable or where the activities have not reached a stage which permits a reasonable assessment of the existence of resources or reserves. While there are certain areas of interest from which no reserves have been extracted, the directors are of the continued belief that such expenditure should not be written off since feasibility studies in such areas have not yet concluded. Such capitalised expenditure is carried at the end of the reporting period at $12.6M. Fair value of options issued Management apply valuation techniques to determine the fair value of financial instruments where active market quotes are not available. This requires management to develop estimates and assumptions based on market inputs, using observable data that market participants would use in pricing the instrument. Where such data is not observable, management uses its best estimate. Estimated fair values of financial instruments may vary from the actual prices that would be achieved in an arm’s length transaction at the reporting date. q) Provisions Mine restoration and rehabilitation costs are provided for at the present value of future expected expenditures required to settle the Group’s obligations on commencement of commercial production, discounted using a rate specified to the liability. When this provision is recognised a corresponding asset is also recognised as part of the development costs of the mine to the extent that it is considered that the provision gives access to future economic benefits. On an ongoing basis, the rehabilitation liability is re-measured at each reporting period in line with the changes in the time value of money (recognised as an expense in the statement of comprehensive income and an increase in the provision), and additional disturbances or changes in rehabilitation costs will be recognised as additions or changes to the corresponding asset and rehabilitation liability. r) Adoption of New and Revised Accounting Standards Certain new accounting standards and interpretations have been published that are not mandatory for 30 June 2012 reporting periods. The Company has decided against early adoption of these standards. The Company's assessment of the impact of these new standards and interpretations is set out below:
AASB 9 Financial Instruments, 2009-11 Amendments to Australian Accounting Standards arising from AASB 9 and 2010-7 Amendments to Australian Accounting Standards arising from AASB 9
This standard and its consequential amendments are applicable to annual reporting periods beginning on or after 1 January 2013 and completes phase I of the IASB's project to replace IAS 39 (being the international equivalent to AASB 139 'Financial Instruments: Recognition and Measurement'). This standard introduces new classification and measurement models for financial assets, using a single approach to determine whether a financial asset is measured at amortised cost or fair value. To be classified and measured at amortised cost, assets must satisfy the business model test for managing the financial assets and have certain contractual cash flow characteristics. All other financial instrument assets are to be classified and measured at fair value. This standard allows an irrevocable election on initial recognition to present gains and losses on equity instruments (that are not held-for-trading) in other comprehensive income, with dividends as a return on these investments being recognised in profit or loss. In addition, those equity instruments measured at fair value through other comprehensive income would no longer have to apply any impairment requirements nor would there be any 'recycling' of gains or losses through profit or loss on disposal. The accounting for financial liabilities continues to be classified and measured in accordance with AASB 139, with one exception, being that the portion of a change of fair value relating to the entity's own credit risk is to be presented in
For
per
sona
l use
onl
y

Helix Resources Limited Annual Report 2012
40
other comprehensive income unless it would create an accounting mismatch. The Companyy will adopt this standard from 1 July 2013 but the impact of its adoption is yet to be assessed by the Company.
AASB 10: 'Consolidated Financial Statements'
This standard replaces the part of IAS 27: 'Consolidated and Separated Financial Statements' and is applicable for the annual period beginning 1 January 2013. This new standard introduces a new definition of control that determines which entities are consolidated. This new definition of control may potentially lead to the consolidation of entities that were not previously included in the Consolidated Entity resulting in more assets and liabilities on the books. The Company is currently assessing the impact of this standard.
AASB 11: 'Joints Arrangements'
This standard replaces IAS 31: 'Interest in Joint Ventures' and is applicable for annual periods beginning on or after 1 January 2013. This new standard introduces new rules which classify joint arrangements as either a joint operation or joint venture. Under the new standard, proportionate consolidation is not allowed and all joint ventures must be equity accounted. All joint arrangements held by the Company will need to be reassessed to determine whether the joint operation or joint venture classification is appropriate, and therefore the potential impacts of a change on the presentation of the Financial Statements. The Company is currently assessing the impact of this standard.
AASB 12: ' Disclosure of interest in other Entities'
This standard is applicable for annual reporting periods beginning on or after 1 January 2013. This standard clarifies the disclosure requirements for all forms of interests in other entities including joint arrangements, associates, special purpose vehicles and other off balance sheet vehicles. The Company is assessing the impact of this standard.
AASB 13: 'Fair Value Measurement'
This standard establishes a single course of guidance for determining the fair value of assets and liabilities. The Company is currently assessing the impact of this standard.
AASB 2011-7 Amendments to Australian Accounting Standards arising from the Consolidation and Joint Arrangements Standards
The amendments are applicable to annual reporting periods beginning on or after 1 January 2013. The amendments make numerous consequential changes to a range of Australian Accounting Standards and Interpretations, following the issuance of AASB 10, AASB 11, AASB 12 and revised AASB 127 and AASB 128. The Company has yet to determine to potential effect of this standard.
AASB 2011-9 Amendments to Australian Accounting Standards – Presentation of Other Comprehensive Income
The amendments are applicable to annual reporting periods beginning on or after 30 June 2013. The main change will be the separation and classification of components within other comprehensive income between reclassification adjustments to profit or loss and those that will not be reclassified.
s) New standards and interpretations which may impact the Company not yet adopted Whilst amendments to the Accounting Standards and Australian Accounting Interpretations have been considered, the Company does not anticipate early adoption of any of the reporting requirements and does not expect these requirements to have any material effect on the Company’s financial statements. t) Going Concern The Directors have prepared the financial statements on a going concern basis, which contemplates continuity of normal business activities and the realisation of assets and extinguishment of liabilities in the ordinary course of business.
The Group’s operations require it to raise capital on an on-going basis to fund its planned exploration program and to monetise its tenement assets. If the Group does not raise capital in the short term, it can continue as a going concern by reducing planned but not committed exploration expenditure until funding is available and/or entering into arrangements where exploration is funded by a third party. We refer to Note 28 – Subsequent Events, as an example. u) Foreign Currency Translation Functional and presentation currency The consolidated financial statements are presented in Australian dollars (AUD), which is also the functional currency of all entities in the group. Foreign currency transactions and balances Foreign currency transactions are translated into the functional currency of the respective Group entity, using the exchange rates prevailing at the dates of the transactions (spot exchange rate). Foreign exchange gains and losses resulting from the settlement of such transactions and from the re-measurement of monetary items at year end exchange rates are recognised in profit or loss. Non-monetary items are not retranslated at year-end and are measured at historical cost (translated using the exchange rates at the date of the transaction), except for non-monetary items measured at fair value which are translated using the exchange rates at the date when fair value was determined.
For
per
sona
l use
onl
y

Helix Resources Limited Annual Report 2012
41
2. NOTES TO THE CASH FLOW STATEMENT a) Reconciliation of Cash
For the purposes of the statement of cash flows and statement of financial position, cash and cash equivalents include cash on hand and in banks, and investments in money market instruments, net of outstanding bank overdrafts. Cash at the end of the financial year as shown in the statement of cash flows is reconciled to the related items in the statement of financial position as follows:
CONSOLIDATED
2012 2011
$ $
Cash at Bank 129,830 10,399
Cash at Bank – Chile 14,240 139,581
Cash on deposit 931,809 4,134,060
Total Cash 1,075,879 4,284,040
b) Reconciliation of loss after income tax to cash flows used in operations
CONSOLIDATED 2012
$ 2011
$ Loss after income tax (441,374) (708,373)
Non-cash flows in Loss
Depreciation 29,605 35,381
Impairment of Exploration and evaluation 186,569 127,805
Loss on sale of investments - 14,940
(Gain) / Loss on revaluation of investments 23,024 (240)
Gain on sale of mineral area (40,000) -
Changes in Net Assets and Liabilities
(Increase)/Decrease in Assets
(Increase)/decrease in trade and other receivables 99,000 (23,023)
Increase/(Decrease) in Liabilities
Increase / (decrease) in trade and other payables (77,209) 208,807
Increase in provisions 24,605 25,953
Net Cash used in Operations (195,780) (318,750)
c) Non-cash Transactions Nil 3. TRADE AND OTHER RECEIVABLES
CONSOLIDATED 2012
$ 2011
$ Prepayments 3,504 26,406
Other 58,465 134,563
Total Current Receivables 61,969 160,969 All amounts are short term. The net carrying value of trade receivables is considered a reasonable approximation of fair value.
For
per
sona
l use
onl
y

Helix Resources Limited Annual Report 2012
42
4. OTHER FINANCIAL ASSETS
CONSOLIDATED 2012 2011 $ $
Current: Held for trading financial assets: Shares in listed corporations – available for sale 760,000 - Shares in listed corporations – at fair value through profit or loss 20,576 3,600
Total Current Financial Assets 780,576 3,600 Shares in Gascoyne Resources Limited [GCY] were re-classified from non-current to current on expiry of the escrow period on 11 December 2011. 4(a) Shares in subsidiaries
Name Country of Incorporation Percentage Held Percentage Held 2012 2011 Olary Magnetite Pty Ltd Australia 100% 100%
Oxley Exploration Pty Ltd Australia 100% 100% Leichhardt Resources (QLD) Pty Ltd Australia 100% 100%
Helix Resources (Overseas) Pty Ltd Australia 100% 100% Helix Resources Chile Limitada Chile 100% 100%
5. OTHER FINANCIAL ASSETS
CONSOLIDATED 2012 2011 $ $
Non-Current Security Deposits 202,712 200,000
Available for Sale Financial Assets:
Shares in Listed Companies - 864,000
Total Other Assets – Non-Current 202,712 1,064,000
For
per
sona
l use
onl
y

Helix Resources Limited Annual Report 2012
43
6. PROPERTY, PLANT AND EQUIPMENT
CONSOLIDATED 2012 Plant & Equipment Motor Vehicles Total $ $ $ Gross Carrying Amount Balance at 30 June 2011 123,953 174,084 298,037
Additions 57,698 - 57,698
Balance at 30 June 2012 181,651 174,084 355,735
Accumulated Depreciation
Balance at 30 June 2011 97,973 105,839 203,812
Depreciation 14,292 15,313 29,605
Balance at 30 June 2012 112,265 121,152 233,417
Net Book Value
30 June 2011 25,980 68,245 94,225
30 June 2012 69,386 52,932 122,318
CONSOLIDATED 2011 Plant & Equipment Motor Vehicles Total $ $ $ Gross Carrying Amount Balance at 30 June 2010 168,798 164,721 333,519
Additions 20,387 9,363 29,750
Disposals (65,232) - (65,232)
Balance at 30 June 2011 123,953 174,084 298,037
Accumulated Depreciation
Balance at 30 June 2010 149,629 84,034 233,663
Disposals (65,232) - (65,232)
Depreciation 13,576 21,805 35,381
Balance at 30 June 2011 97,973 105,839 203,812
Net Book Value
30 June 2010 19,169 80,687 99,856
30 June 2011 25,980 68,245 94,225 F
or p
erso
nal u
se o
nly

Helix Resources Limited Annual Report 2012
44
7. EXPLORATION AND EVALUATION EXPENDITURE (NON-CURRENT)
CONSOLIDATED 2012 2011 $ $
Balance at beginning of the financial year 9,747,315 6,149,147 Expenditure incurred during the year 2,997,871 3,725,973 Impairment losses (186,569) (127,805) Balance at the end of the financial year 12,558,617 9,747,315
The Directors' assessment of carrying amount was after consideration of prevailing market conditions; previous expenditure carried out on the tene-ments; and the potential for mineralisation based on both the entity's and independent geological reports. The ultimate value of these assets is de-pendent upon recoupment by commercial development or the sale of the whole, or part, of the Group's interests in those areas for an amount at least equal to the carrying value. There may exist, on the Group’s exploration properties, areas subject to claim under native title or containing sacred sites or sites of significance to Aboriginal people. As a result, exploration properties or areas within the tenements may be subject to exploration and mining restrictions.
CONSOLIDATED 2012
$ 2011
$ 8. TRADE AND OTHER PAYABLES (CURRENT) Trade payables 266,634 343,842 All amounts are short term. The carrying value of trade payables is considered to be a reasonable approximation of fair value.
9. PROVISIONS
Current
Employee Benefits 128,014 107,119
Balance at end of financial year 128,014 107,119
Non -Current
Employee Benefits 69,554 65,845
Balance at end of financial year 69,554 65,845
10. SHARE CAPITAL 204,649,072 Fully Paid Ordinary Shares (2011: 203,923,618) 59,186,339 59,145,439
Balance at end of financial year 59,186,339 59,145,439
2012 2011 No. $ No. $
Fully Paid Ordinary Shares Balance at beginning of financial year 203,923,618 59,145,439 131,943,746 53,571,624
Share Issue Costs - - - (136,620)
Exercise of Options to Fully Paid Shares @ $0.05* - - 52,179,872 3,433,435
Share Placement - - 19,800,000 2,277,000
Share Issue: 525,454 Fully Paid Shares @ $0.055 525,454 28,900 - -
Share Issue: 200,000 Fully Paid Shares @ $0.06 200,000 12,000 - -
Balance at end of financial year 204,649,072 59,186,339 203,923,618 59,145,439
For
per
sona
l use
onl
y

Helix Resources Limited Annual Report 2012
45
Fully paid ordinary shares have no par value, carry one vote per share and carry the right to dividends. Options carry no voting rights until converted to fully paid ordinary shares. * Non-renounceable rights issue at $0.015 per option, exercisable at $0.05 before 31 May 2011. Capital Management Management controls the capital of the group in order to maximise the return to shareholders and ensure that the group can fund its operations and continue as a going concern. Management effectively manages the group’s capital by assessing the group’s financial risks and adjusting its capital structure in response to changes in these risks and in the market. These responses include the management of expenditure and debt levels, distributions to shareholders and share and option issues. There have been no changes in the strategy adopted by management to control the capital of the group since the prior year.
Employee Options 17,600,000 employee options were issued in October 2008 following approval at the 2008 AGM. The options were valued under Black and Scholes at 0.35 cents each ($61,600) and were in substitute of a cash bonus. Value at Grant Date [also Issuance Date] of 10th October 2008 A Black & Scholes calculation [www.blobek.com] of the notional value of the Incentive Options is outlined below based on the following assumptions:
a. the Incentive Options expire on 31 October 2011 and are exercisable at $0.55 each; b. a current price per Share of $0.08; c. a volatility factor of 70%; d. an interest rate of 5.38%; e. a discount factor of 50% has been applied due to the lack of marketability of the Incentive Options; f. the valuations ascribed to the Incentive Options may not necessarily represent the market price of the Incentive Options at the date of
the valuation; and g. the valuation date for the Incentive Options was 10th October 2008.
Applying the 50% discount factor as described in (e) above, the value for each Incentive Option is therefore $0.0035 at 10th October 2008, the date of issuance. There were 17,600,000 employee options outstanding at 30 June 2011. There were no employee options outstanding at 30 June 2012. Viaticus Options 7,500,000 options were issued in March 2012. The options were issued in three tranches of 2,500,000 options exercisable at $0.08, $0.125 and $0.175, expiring on 31 March 2014. The options were valued under Black and Scholes. The options were issued for the provision of corporate advisory services. Valuation date 2 March 2012 A Black & Scholes calculation [www.blobek.com] of the notional value of the Options is outlined below based on the following assumptions:
a. the Incentive Options expire on 31 March 2014 and are exercisable at $0.08 [Tranche 1], $0.125 [Tranche 2]and $0.175 [Tranche 3], providing certain vesting conditions are met;
b. a current price per Share of $0.06; c. a volatility factor of 90%; d. an interest rate of 4% [being the risk free interest rate on five year government bonds]; e. an estimate based on past share trading as to the probability of the share price achieving the level for the options to vest; f. probability of exercise being 10% [Tranche 1], 0% [Tranche 2], 0% [Tranche 3] g. the valuations ascribed to the Options do not necessarily represent the market price of the Options at the date of the valuation; and h. the valuation date for the Options was 2 March 2012.
Based on the above assumptions, the valuation of the options is $5,000 [Tranche 1], $0 [Tranche 2], $0 [Tranche 3] There were no options outstanding at 30 June 2011. There were 7,500,000 options outstanding at 30 June 2012.
For
per
sona
l use
onl
y

Helix Resources Limited Annual Report 2012
46
11. OTHER RESERVES
2012 2011
No. $ No. $
Listed Options
Balance at beginning of financial year - - 53,355,308 800,330
Options expired during financial year - - (1,175,436) (17,632)
Exercise of Options to Fully Paid Shares - - (52,179,872) (782,698)
Balance at end of financial year - - - -
2012 2011
No. $ No. $
Share Options
Balance at beginning of financial year 17,600,000 61,600 17,600,000 61,600
Expiry of Terminated Employee Incentive Options (17,600,000) (61,600) - -
Issue of Options to corporate consultant 7,500,000 5,000 - -
Balance at end of financial year 7,500,000 5,000 17,600,000 61,600 The Options Reserve records items recognised as expenses on valuation of options.
CONSOLIDATED 2012
$ 2011
$ Financial Assets Reserve Balance at beginning of financial year 764,000 176,000
Fair Value of Gascoyne Resources shares (104,000) 588,000
Balance at end of financial year 660,000 764,000
The financial asset reserve records revaluation of available for sale financial assets. 12. ACCUMULATED LOSSES
Balance at beginning of financial year (45,133,696) (44,442,955)
Net Loss attributable to members of the parent entity (441,374) (708,373)
Expiry of Listed Options - 17,632
Expiry of Incentive Options 61,600 -
Balance at end of financial year (45,513,470) (45,133,696)
For
per
sona
l use
onl
y

Helix Resources Limited Annual Report 2012
47
13. REVENUE Loss before Income Tax includes the following items of revenue and expense:
CONSOLIDATED 2012
$ 2011
$ Operating Activities
Interest Revenue 150,650 203,401
Tenement Rental Reimbursements - 72,775
Other 81,017 92,242
Total Operating Revenue 231,667 368,418
Non-Operating Activities Profit / (Loss) on sale of investments - (14,940) Total Non – Operating Revenue - (14,940)
Total Revenues 231,667 353,478 14. LOSS FOR THE YEAR Expenses
CONSOLIDATED 2012 2011 $ $
Depreciation of non-current assets: Property, plant and equipment 29,605 35,381
Impairment of exploration and evaluation assets 186,569 127,805 Operating lease rental expenses: Minimum lease payments 137,414 151,811
Share based payments 45,900 -
Loss for the year 441,374 708,373
15. COMMITMENTS a) Operating Lease Commitments
Not later than 1 year 107,863 123,444
Later than 1 year but not later than 2 years 98,654 36,307
Later than 2 years but not later than 5 years - -
206,517 159,751
The lease is for a 3 year term with a 2 year option to extend. As at reporting date there was a balance of 2 years remaining on the office lease.
b) Exploration Expenditure Commitments In order to maintain current rights of tenure to exploration tenements, the Group is required to perform minimum exploration work to meet the requirements specified by various State governments. These obligations can be reduced by selective relinquishment of exploration tenure or application for expenditure exemptions. Due to the nature of the Group’s operations in exploring and evaluating areas of interest, it is very difficult to forecast the nature and amount of future expenditure. It is anticipated that expenditure commitments for the next twelve months will be tenement rentals of $177,000 (2011: $66,280) and, subject to cash reserves and economic conditions, exploration expenditure of $2,800,000 (2011: $2,274,000). JV parties are expected to fund at least $1,600,000 of these commitment costs.
For
per
sona
l use
onl
y

Helix Resources Limited Annual Report 2012
48
16. KEY MANAGEMENT PERSONNELS’ REMUNERATION Please refer to disclosures contained in the Remuneration Report section of the Directors’ Report.
The totals of remuneration paid to key management personnel of the Group during the year are as follows:
2012 $
2011 $
Short term employee benefits 691,150 835,571 Post-employment benefits 58,602 67,722 Other long-term benefits - - Termination benefits - - Share Based payments - - Total 749,752 903,293 17. EXECUTIVE SHARE OPTION PLAN As at 30 June 2012 the Company had issued no share options (30 June 2011: 15,500,000). Share options carry no rights to dividends and no voting rights. The difference between the total market value of options issued during the financial year, at the date of issue, and the total amount received from executives and employees is not recognised in the financial statements except for the purposes of determining key management personnels’ remuneration in respect of that financial year. The amounts are disclosed in remuneration in respect of the financial year in which the entitlement was earned.
Further details are disclosed below: Executive Share Option Plan 2012
No. Weighted average exercise price 2011
No. Weighted average exercise price
Balance at beginning of financial year (i) 15,500,000 $0.525 15,500,000 $0.525
Cancelled during the financial year (ii) - - - -
Expired during the financial year (iii) (15,500,000) $0.525 - -
Granted during the financial year (iv) - - - -
Exercised during the financial year (v) - - - -
Balance at end of financial year (vi) - - 15,500,000 $0.525 (i) Balance at beginning of financial year
Options - Series No. Vested Unvested Grant Date Expiry Date Exercise Price
$ Fair value at grant date
Issued 9 Oct 2008 15,500,000 15,500,000 - 9 Oct 2008 31 Oct 2011 $0.525 0.35c per option
15,500,000 15,500,000 - (ii) Cancelled during the financial year There were no options cancelled during the financial years ended 30 June 2012 and 2011. (iii) Expired during the financial year 15,500,000 options expired during the financial year ended 30 June 2012. No options expired during the financial year ended 30 June 2011. (iv) Granted during the financial year There were no options granted during the financial year ended 30 June 2012 and 2011. (v) Exercised during the financial year There were no executive options exercised during the financial years ended 30 June 2012 and 2011. (vi) Balance at end of the financial year There were no employee options at the end of the financial year ended 30 June 2012.
For
per
sona
l use
onl
y

Helix Resources Limited Annual Report 2012
49
Fair value of consideration received is measured as the nominal value of cash receipts on conversion. The fair value of shares at the date of their issue is measured as the market value at close of trade on the date of their issue. Employee share options carry no rights to dividends and no voting rights. In accordance with the terms of the executive share option plan, options may be exercised at any time from the date the vesting period ends to the date of their expiry.
The difference between the total market value of options issued during a financial year, at the date of issue, and the total amount received from executives and employees is not recognised in the financial statements except for the purposes of determining key management personnels’ remunerations in respect of that financial year as disclosed in notes to the financial statements. The amounts are disclosed in remuneration in respect of the financial years over which the entitlement was earned.
Consideration received on the exercise of executive options is recognised in contributed equity. During the financial year no options were exercised, hence no amount was recognised in contributed equity arising from the exercise of executive options (2011: $nil).
18. RELATED PARTY AND DIRECTORS’ DISCLOSURES
a) Other Transactions with key management personnel
There were no items of expenses that resulted from transactions other than remuneration with key management personnel or their personally-related entities. Transactions between related parties are on normal commercial terms and conditions unless otherwise stated.
b) Transactions with Gascoyne Resources Limited Helix Resources provided equipment rental, accommodation and employee services to Gascoyne Resources on normal commercial terms and conditions to the value of $11,998 (2011: $90,389). There was no outstanding balance at 30 June 2012. (2011: nil).
c) Key Management Personnels’ Equity Holdings Fully paid ordinary shares issued by Helix Resources Limited 2012 Balance @
1/7/11
No.
Granted as remuneration
No.
Received on exercise of
options No.
Net other change
No.
Balance @ 30/6/12
No.
Balance held nominally
No.
Key Management Personnel G J Wheeler 16,873,259 - - - 16,873,259 -
M H Wilson 2,349,700 - - - 2,349,700 -
J den Dryver 600,000 - - - 600,000 - G Dunbar 1,050,000 - - - 1,050,000 - J McNamara 142,250 - - - 142,250 - Total 21,015,209 - - - 21,015,209 -
2011 Balance @
1/7/10
No.
Granted as remuneration
No.
Received on exercise of
options No.
Net other change
No.
Balance @ 30/6/11
No.
Balance held nominally
No.
Key Management Personnel
G J Wheeler 7,248,839 - 9,624,420 - 16,873,259 - M H Wilson 233,133 - 2,116,567 - 2,349,700 - J den Dryver - - 600,000 - 600,000 - G Dunbar 300,000 - 750,000 - 1,050,000 - J McNamara 94,833 - 47,417 - 142,250 - Total 7,876,805 - 13,138,404 - 21,015,209 - F
or p
erso
nal u
se o
nly

Helix Resources Limited Annual Report 2012
50
Executive Share Options issued by Helix Resources Limited 2012 Bal @
1/7/11
Granted as remuneration
Exercised
Other
change
Bal @ 30/6/12
Bal
vested @ 30/6/12
Vested but not
exerciseable Vested and exercisable
Options vested during year
No. No. No. No. No. No. No. No. No. Key Management Personnel
G J Wheeler 8,000,000 - - (8,000,000) - - - - -
M H Wilson 5,000,000 - - (5,000,000) - - - - -
J denDryver 1,000,000 - - (1,000,000) - - - - -
G Dunbar 1,000,000 - - (1,000,000) - - - - -
J McNamara 500,000 - - (500,000) - - - - -
Total 15,500,000 - - (15,500,000) - - - - - 2011 Bal @
1/7/10
Granted as remuneration
Exercised
Other
change
Bal @ 30/6/11
Bal vested @ 30/6/11
Vested but
not exerciseable
Vested and exercisable
Options vested during year
No. No. No. No. No. No. No. No. No. Key Management Personnel
G J Wheeler 8,000,000 - - - 8,000,000 8,000,000 - 8,000,000 -
M H Wilson 5,000,000 - - - 5,000,000 5,000,000 - 5,000,000 -
J denDryver 1,000,000 - - - 1,000,000 1,000,000 - 1,000,000 -
G Dunbar 1,000,000 - - - 1,000,000 1,000,000 - 1,000,000 -
J McNamara 500,000 - - - 500,000 500,000 - 500,000 -
Total 15,500,000 - - - 15,500,000 15,500,000 - 15,500,000 - Each executive share option converts into 1 ordinary share of Helix Resources Limited on exercise. No amounts are paid or payable by the recipient on receipt of the option. During the financial year, no executive share options were exercised by key management personnel. Further details of the options granted during the year are contained in note 17 to the financial statements. Listed Share Options issued by Helix Resources Limited 2012 Bal @
1/7/11
Granted as remuneration
Exercised
Other
change
Bal @ 30/6/12
Bal
vested @ 30/6/12
Vested but not
exerciseable Vested and exercisable
Options vested during year
No. No. No. No. No. No. No. No. No. Key Management Personnel
G J Wheeler - - - - - - - - -
M H Wilson - - - - - - - - -
J denDryver - - - - - - - - -
G Dunbar - - - - - - - - -
J McNamara - - - - - - - - -
Total - - - - - - - - -
For
per
sona
l use
onl
y

Helix Resources Limited Annual Report 2012
51
2011 Bal @ 1/7/10
Granted as
remuneration
Exercised
Other change
Bal @ 30/6/11
Bal
vested @ 30/6/11
Vested but not
exerciseable Vested and exercisable
Options vested during year
No. No. No. No. No. No. No. No. No. Key Management Personnel
G J Wheeler 9,624,420 - 9,624,420 - - - - - -
M H Wilson 2,116,567 - 2,116,567 - - - - - -
J denDryver 600,000 - 600,000 - - - - - -
G Dunbar 750,000 - 750,000 - - - - - -
J McNamara 47,417 - 47,417 - - - - - -
Total 13,138,404 - 13,138,404 - - - - - -
For
per
sona
l use
onl
y

Helix Resources Limited Annual Report 2012
52
19. INCOME TAX CONSOLIDATED
2012 2011
$ $ Accounting profit / (loss) before tax from continuing operations (441,374) (708,373)
Accounting profit / (loss) loss before tax from discontinuing operations - -
Accounting profit / (loss) before tax (441,374) (708,373)
Reconciliation of Income Tax Expense / (Benefit) to Accounting Profit / (Loss)
Prima facie tax payable / (benefit) at Australian rate of 30% (2010 – 30%) (81,412) (201,065)
Prima facie tax payable / (benefit) at Chilean rate of 20% (31,450) (7,631)
Adjusted for tax effect of the following:
- taxable / non-deductible items 2,443 17,277
- non-taxable / deductible items (28,066) (28,138)
- over-provision in prior year (849) -
- adjustment for change of tax rate 572 -
Current year tax losses not recognised in current period 138,762 219,557
Income tax expense / (benefit) - -
Statement of Comprehensive Income
Current income tax charge - -
Deferred income tax
Relating to origination and reversal of temporary differences (657,927) (966,643)
Adjustment for change of tax rate 16,500 -
Current year tax losses not recognised / (recognised) in the current period 641,427 966,643
Prior year tax losses recognised in current period -
Income tax expense / (benefit) reported in statement of comprehensive income - -
Unrecognised Deferred Tax Balances:
Australian deferred tax asset losses 14,703,365 14,212,583
Chilean deferred tax asset losses 517,038 227,631
Australian deferred tax assets other 70,977 58,734
Australian deferred tax liabilities (2,991,917) (2,596,777)
Chilean deferred tax liabilities (478,529) (220,000)
Net Unrecognised deferred tax assets 11,820,934 11,682,171
For
per
sona
l use
onl
y

Helix Resources Limited Annual Report 2012
53
20. SEGMENT INFORMATION The Group has identified its operating segments based on the internal reports that are reviewed and used by the Board of Directors (Chief Operating decision makers) in assessing performance and determining the allocation of resources. The Group is managed on the basis it is a mineral exploration company operating predominately in the geographical region of Australia, mainly in Western Australia, New South Wales and South Australia, with a developing operation in Chile which currently represents ±20% of mineral asset expenditure. The mineral assets held via outright ownership or joint venture are considered one business segment and the minerals currently being targeted include gold, copper, iron ore and other base metals. Decisions are made on a prospectivity basis, not a geographical or commodity basis.
Australia Chile Total 2012 2011 2012 2011 2012 2011
Current Assets Cash 1,061,639 4,144,460 14,240 139,580 1,075,879 4,284,040 Non-Current Assets Mineral Assets 9,988,543 8,736,964 2,756,643 1,138,156 12,745,186 9,875,120 Impairment (16,569) (89,649) (170,000) (38,156) (186,569) (127,805)
Carrying Amount 9,971,974 8,647,315 2,586,643 1,100,000 12,558,617 9,747,315
Current Liabilities Trade payables 217,349 343,842 49,285 - 266,634 343,842
21. EARNINGS PER SHARE COMPANY 2012 2011 Cents Per share Cents Per share Basic loss per share (0.22) (0.48)
Diluted loss per share (0.22) (0.48)
Basic Loss per Share The earnings and weighted average number of ordinary shares used in the calculation of basic earnings per share are as follows: 2012 2011 $ $ Earnings / (loss) (a) (441,374) (708,373) 2012 2011 No. No. Weighted average number of ordinary shares (b) 204,346,477 147,916,287
(a) Earnings used in the calculation of basic earnings per share is net loss after tax of $441,374 (2011: $708,373). (b) The executive share options are not considered to be potential ordinary shares and are therefore excluded from the weighted average number of shares used in the calculation of basic earnings per share. Where dilutive, potential ordinary shares are included in the calculation of diluted earnings per share (refer below).
For
per
sona
l use
onl
y

Helix Resources Limited Annual Report 2012
54
Diluted Loss per Share The earnings and weighted average number of ordinary and potential ordinary shares used in the calculation of diluted earnings per share are as follows:
2012 2011 $ $
Earnings (a) (441,374) (708,373) 12 months to 30 June 2012 12 months to 30 June 2011 No. No. Weighted average number of ordinary shares and potential ordinary shares (b) 204,346,477 147,916,287
(a) Earnings used in the calculation of diluted loss per share is net loss after tax of $441,374 (2011: $708,373). (b) The following potential ordinary shares are not dilutive and are therefore excluded from the weighted average number of ordinary shares and potential ordinary shares used in the calculation of diluted earnings per share: 2012 2011 No. No. Executive options - 15,000,000
Viaticus options 7,500,000 - 22. INTEREST IN JOINT VENTURES The parent entity has entered into the following unincorporated joint ventures: Joint Venture Project Percentage Interest Principal Exploration Activities Tunkillia 45% (2011: 46.2%) (Mungana Gold Mines Limited) Gold Yalleen 30% (2011: 30%) (API Management Pty Ltd 70% Iron Ore rights) Iron Ore Restdown JV 70% (2011: 70%) (Isokind Pty Ltd) Gold Canbelego 51% (2011: 51%) (Straits Resources) Copper / Gold
The joint ventures are not separate legal entities but are contractual arrangements between the participants for sharing costs and output and do not in themselves generate revenue and profit. Exploration expenditure is the only asset of the joint ventures. The Group’s interest in exploration expenditure in the above mentioned joint ventures is as follows:
Yalleen JV 30%
Tunkillia JV 45%
Restdown JV 70%
Canbelego JV 51%
Non-Current Assets Mineral Assets 2,659,097 3,039,173 2,440,330 577,672 Impairment - - - -
Carrying Amount 2,659,097 3,039,173 2,440,330 577,672
The recoverability of the carrying amount of the mineral assets is dependent on successful development and commercial exploitation, or alternatively, sale of the respective areas of interest.
For
per
sona
l use
onl
y

Helix Resources Limited Annual Report 2012
55
23. FINANCIAL INSTRUMENTS Details of the significant accounting policies and methods adopted, including the criteria for recognition, the basis of measurement and the basis on which revenues and expenses are recognised, in respect of each class of financial asset, financial liability and equity instrument are disclosed in Note 1 to the financial statements. The Group's exposure to interest rate risk and effective weighted average interest rate for classes of financial assets is set out below:
Floating Interest Rate Maturity
Average Interest
Rate Fixed
Interest Rate Less than 1
year More than 1
Year Non Interest
Bearing Total
% $ $ $ $ $ 2012 Financial Assets
Other Receivables - - - 61,969 61,969
Held for trading assets - - - 20,576 20,576
Cash and cash equivalent assets 3.85 1,075,879 - - 1,075,879 Security deposits and deposits at financial institutions 5.79 - 202,712 - - 202,712
Available for sale assets - - - 760,000 760,000
1,075,879 202,712 - 842,545 2,121,136
Financial Liabilities Trade Payables (all payable within 30 days) - - - - 266,634 266,634
- - - 266,634 266,634
Floating Interest Rate Maturity
Average Interest
Rate Fixed
Interest Rate Less than 1
year More than 1
Year Non Interest
Bearing Total
% $ $ $ $ $ 2011 Financial Assets
Other Receivables (incl tenement appl.) - - - 160,969 160,969
Held for trading assets - - - 3,600 3,600
Cash and cash equivalent assets 5.25 2,284,040 2,000,000 - - 4,284,040 Security deposits and deposits at financial institutions 6.03 - 200,000 - - 200,000
Available for sale assets - - - 864,000 864,000
2,284,040 2,200,000 - 1,028,569 5,512,609
Financial Liabilities Trade Payables (all payable within 30 days) - - - - 343,842 343,842
- - - 343,842 343,842
Other than those classes of assets and liabilities denoted as "listed" in note 4, none of the classes of financial assets and liabilities are readily traded on organised markets in standardised form. Financial Instruments Measured at Fair Value The financial instruments recognised at fair value in the statement of financial position have been analysed and classified using a fair value hierarchy reflecting the significance of the inputs used in making the measurements. The fair value hierarchy consists of the following levels: — quoted prices in active markets for identical assets or liabilities (Level 1);
For
per
sona
l use
onl
y

Helix Resources Limited Annual Report 2012
56
— inputs other than quoted prices included within Level 1 that are observable for the asset or liability, either directly (as prices) or indirectly (derived from prices) (Level 2); and
— inputs for the asset or liability that are not based on observable market data (unobservable inputs) (Level 3).
2012 Level 1 Total
$ Financial Assets
Held for trading assets 20,576 20,576
Available for sale assets 760,000 760,000
780,576 780,576
2011 Level 1 Total
$ Financial Assets
Held for trading assets 3,600 3,600
Available for sale assets 864,000 864,000
867,600 867,600
Included within Level 1 of the hierarchy are listed investments. The fair values of these financial assets have been based on the closing quoted bid prices at reporting date, excluding transaction costs. Financial Risk Exposures and Management The main risks the group is exposed to through its financial instruments are interest rate risk, liquidity risk and credit risk. The Board is responsible for the financial risk management. Interest Rate Risk Interest rate risk is managed by investing cash with major financial institutions in both cash on deposit and term deposit accounts. Interest Rate Risk Sensitivity Analysis At 30 June 2012, the effect on loss and equity as a result of a 50% increase in the interest rate, with all other variables remaining constant would be a decrease in loss by $75,325 (2011: $101,700) and an increase in equity by $75,325 (2011: $101,700). The effect on loss and equity as a result of a 50% decrease in the interest rate, with all other variables remaining constant would be an increase in loss by $75,325 (2011: $101,700) and a decrease in equity by $75,325(2011: $101,700). Liquidity Risk The group manages liquidity risk by monitoring forecast cash flows and ensuring that adequate unutilised borrowing facilities are maintained. The Group’s operations require it to raise capital on an on-going basis to fund its planned exploration program and to commercialise its tenement assets. If the Group does not raise capital in the short term, it can continue as a going concern by reducing planned but not committed exploration expenditure until funding is available and/or entering into joint venture arrangements where exploration is funded by the joint venture partner. Credit Risk Credit Risk refers to the risk that counterparty will default on its contractual obligations resulting in financial loss to the Group. The Group has adopted the policy of only dealing with credit worthy counterparties and obtaining sufficient collateral or other security where appropriate, as a means of mitigating the risk of financial loss from defaults. The Group measures risk on a fair value basis. The maximum credit risk on financial assets of the Group which have been recognised on the statement of financial position, other than investments in shares, is generally the carrying amount, net of any provisions for doubtful debts. F
or p
erso
nal u
se o
nly
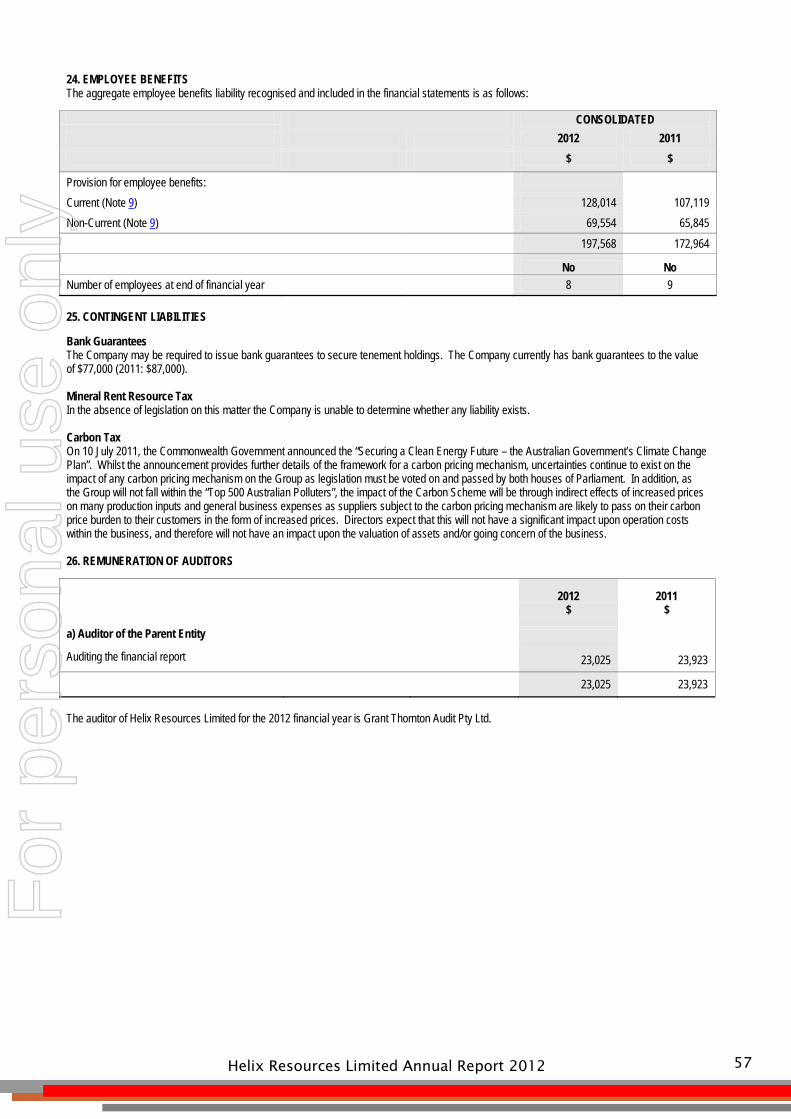
Helix Resources Limited Annual Report 2012
57
24. EMPLOYEE BENEFITS The aggregate employee benefits liability recognised and included in the financial statements is as follows: CONSOLIDATED 2012 2011 $ $ Provision for employee benefits: Current (Note 9) 128,014 107,119 Non-Current (Note 9) 69,554 65,845 197,568 172,964
No No Number of employees at end of financial year 8 9 25. CONTINGENT LIABILITIES
Bank Guarantees The Company may be required to issue bank guarantees to secure tenement holdings. The Company currently has bank guarantees to the value of $77,000 (2011: $87,000). Mineral Rent Resource Tax In the absence of legislation on this matter the Company is unable to determine whether any liability exists. Carbon Tax On 10 July 2011, the Commonwealth Government announced the “Securing a Clean Energy Future – the Australian Government’s Climate Change Plan”. Whilst the announcement provides further details of the framework for a carbon pricing mechanism, uncertainties continue to exist on the impact of any carbon pricing mechanism on the Group as legislation must be voted on and passed by both houses of Parliament. In addition, as the Group will not fall within the “Top 500 Australian Polluters”, the impact of the Carbon Scheme will be through indirect effects of increased prices on many production inputs and general business expenses as suppliers subject to the carbon pricing mechanism are likely to pass on their carbon price burden to their customers in the form of increased prices. Directors expect that this will not have a significant impact upon operation costs within the business, and therefore will not have an impact upon the valuation of assets and/or going concern of the business. 26. REMUNERATION OF AUDITORS
2012 2011 $ $ a) Auditor of the Parent Entity Auditing the financial report 23,025 23,923 23,025 23,923 The auditor of Helix Resources Limited for the 2012 financial year is Grant Thornton Audit Pty Ltd.
For
per
sona
l use
onl
y

Helix Resources Limited Annual Report 2012
58
27. HELIX RESOURCES LIMITED PARENT COMPANY INFORMATION
Note 2012 2011
$ $
Assets Current Assets 1,918,424 4,309,028
Non-current Assets 12,883,647 11,045,121
Total Assets 14,802,071 15,354,149
Liabilities Current Liabilities 8, 9 394,648 450,961
Non-current Liabilities 9 69,554 65,845
Total Liabilities 464,202 516,806
Equity Issued Capital 59,186,339 59,145,439
Accumulated Losses (45,513,470) (45,133,696)
Reserves Options Reserve 5,000 61,600
Financial Assets 660,000 764,000
Total Equity 14,337,869 14,837,343
Financial Performance
Loss for the year 14 (441,374) (708,373)
Other comprehensive income (104,000) 588,000
Total Comprehensive Income (545,374) (120,373)
28. SUBSEQUENT EVENTS OLARY MAGNETITE PROJECT – SOUTH AUSTRALIA Helix has executed a Share Subscription Agreement with Lodestone Equities Ltd [Lodestone] over the Olary Magnetite Project in South Australia reflecting the terms of the MoU announced 23 July 2012. Lodestone has acquired a 33% shareholding in the Helix wholly owned subsidiary, Olary Magnetite Pty Ltd [Olary], with an up-front cash payment of $0.5M to Helix and $1M towards the proposed work program. Olary’s sole assets are tenements EL3956 and EL4022 prospective for Braemar Fe Formation in South Australia. Upon all approvals being received to enable drilling to commence, Lodestone will provide a further $1M to earn 50% in Olary. Helix will oversee the work program, receiving a management fee, with drilling and assays used to establish an independently estimated maiden Inferred JORC compliant resource. Lodestone has one month after receipt of the independent JORC Report to elect whether to acquire the remaining 50% shareholding in Olary by an additional cash payment calculated in accordance with the following formula: Cash Payment = JORC Resource tonnes x DTR% x $0.035 x150% with a floor price of $5M and a cap of $9M. If the Option to acquire the remaining 50% is not exercised by Lodestone, the parties will operate Olary as a corporate joint venture.
For
per
sona
l use
onl
y

Helix Resources Limited Annual Report 2012
59
29. ADDITIONAL COMPANY INFORMATION Helix Resources Limited is a listed public company, incorporated and operating in Australia. Registered Office Principal Place of Business Suite 7, 29 Ord Street Suite 7, 29 Ord Street WEST PERTH WA 6005 WEST PERTH WA 6005 Tel (08) 9321 2644 Tel (08) 9321 2644 The financial report for Helix Resources Limited for the year ended 30 June 2012 was authorised for issue in accordance with a resolution of the directors on the 22 August 2012.
For
per
sona
l use
onl
y
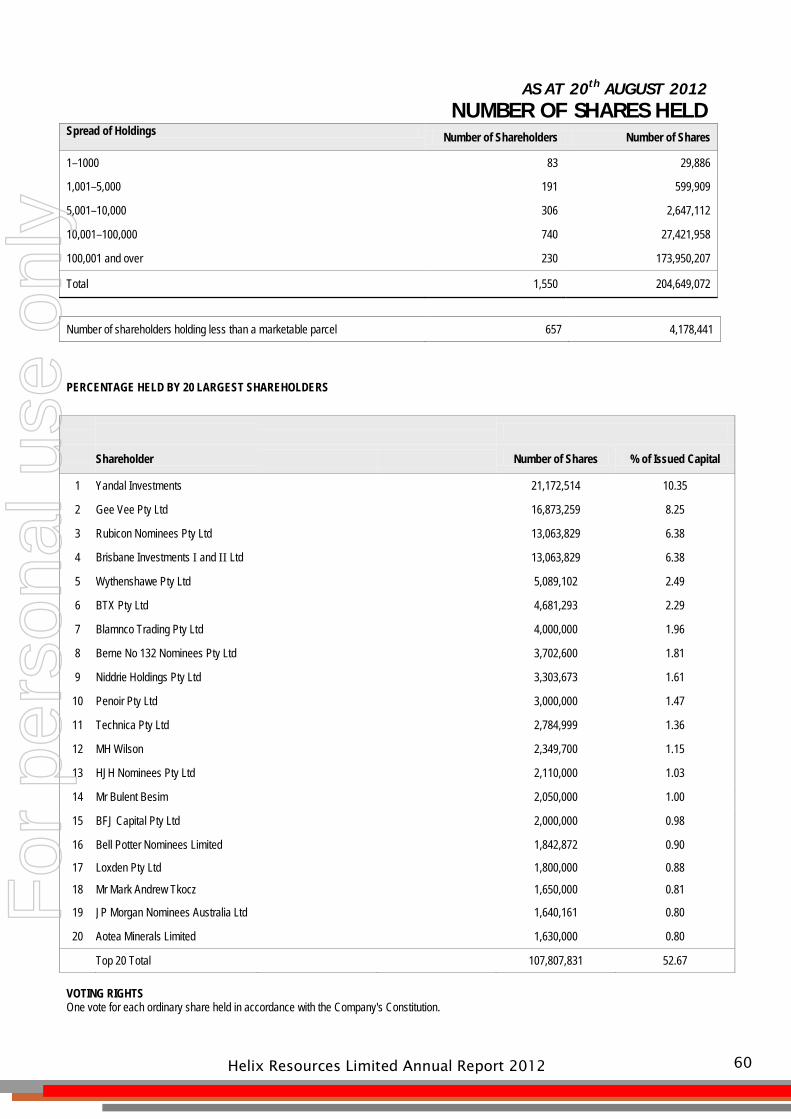
Helix Resources Limited Annual Report 2012
60
AS AT 20th AUGUST 2012 NUMBER OF SHARES HELD
Spread of Holdings Number of Shareholders Number of Shares 1–1000 83 29,886
1,001–5,000 191 599,909
5,001–10,000 306 2,647,112
10,001–100,000 740 27,421,958
100,001 and over 230 173,950,207
Total 1,550 204,649,072
Number of shareholders holding less than a marketable parcel 657 4,178,441
PERCENTAGE HELD BY 20 LARGEST SHAREHOLDERS
Shareholder Number of Shares % of Issued Capital 1 Yandal Investments 21,172,514 10.35
2 Gee Vee Pty Ltd 16,873,259 8.25
3 Rubicon Nominees Pty Ltd 13,063,829 6.38
4 Brisbane Investments I and II Ltd 13,063,829 6.38
5 Wythenshawe Pty Ltd 5,089,102 2.49
6 BTX Pty Ltd 4,681,293 2.29
7 Blamnco Trading Pty Ltd 4,000,000 1.96
8 Berne No 132 Nominees Pty Ltd 3,702,600 1.81
9 Niddrie Holdings Pty Ltd 3,303,673 1.61
10 Penoir Pty Ltd 3,000,000 1.47
11 Technica Pty Ltd 2,784,999 1.36
12 MH Wilson 2,349,700 1.15
13 HJH Nominees Pty Ltd 2,110,000 1.03
14 Mr Bulent Besim 2,050,000 1.00
15 BFJ Capital Pty Ltd 2,000,000 0.98
16 Bell Potter Nominees Limited 1,842,872 0.90
17 Loxden Pty Ltd 1,800,000 0.88
18 Mr Mark Andrew Tkocz 1,650,000 0.81
19 JP Morgan Nominees Australia Ltd 1,640,161 0.80
20 Aotea Minerals Limited 1,630,000 0.80
Top 20 Total 107,807,831 52.67 VOTING RIGHTS One vote for each ordinary share held in accordance with the Company's Constitution.
For
per
sona
l use
onl
y

Helix Resources Limited Annual Report 2012
61
SUBSTANTIAL SHAREHOLDERS
Shareholder Number of Shares % of Issued Capital
Yandal Investments Pty Ltd 21,172,514 10.35
Gee Vee Pty Ltd 16,873,259 8.25
Rubicon Nominees Pty Ltd 13,063,829 6.38
Brisbane Investments I and II Ltd 13,063,829 6.38
DIRECTORS' INTEREST IN SHARE CAPITAL
Director Fully Paid Ordinary Shares
G J Wheeler 16,873,259
M H Wilson 2,349,700
J den Dryver 600,000
G Dunbar 1,050,000
Total 20,872,959
For
per
sona
l use
onl
y

Helix Resources Limited Annual Report 2012
62
TENEMENT SCHEDULE Tenement Name Mineral Ownership
NSW COPPER & GOLD PROJECTS (INCL. CANBELEGO AND RESTDOWN JV's)
EL6105 Canbelego Copper/Gold HLX 51% (earning 70%), Straits 49%
EL6140 Restdown Gold/Copper Helix 70%, Glencore 30%
EL6501 South Restdown Copper/Gold Helix 70%, Glencore 30%
EL6739 Muriel Tank Gold/Copper Helix 70%, Glencore 30%
EL7438 Quanda Copper/Gold HLX 100%
EL7439 Fiveways Copper/Gold HLX 100%
EL7482 Little Boppy Copper/Gold HLX 100%
EL7565 Arsenal Copper/Gold HLX 100%
EL7566 Tottenham Copper/Gold HLX 100%
EL7567 Restdown Copper/Gold HLX 100%
EL7619 Inverness Copper/Gold HLX 100%
EL7745 Koree Copper/Gold HXL 100%
ELA4375 Meryula Copper/Gold HXL 100%
ELA4376 Little Boppy North Copper/Gold HXL 100%
QUEENSLAND COPPER & GOLD PROJECTS
EPM18363 Landsborough Copper/Gold HLX 100%
EPM18373 Saxby 2 Copper/Gold HLX 100%
EPM18374 Saxby 1 Copper/Gold HLX 100%
LAKE EVERARD (INCL. TUNKILLIA)
EL4596 Yellabinna Gold/Uranium/Basemetals HLX 100%, Mungana 55% all minerals other than uranium
EL4812 Lake Everard Gold/Uranium/Basemetals HLX 100%, Mungana 55% all minerals other than uranium
EL4495 Lake Everard West Gold/Uranium/Basemetals HLX 100%, Mungana 55% all minerals other than uranium
OLARY MAGNETITE
EL3956 Devonborough Downs Gold/Copper/Iron Ore HLX 100%
EL4022 Olary Gold/Copper/Iron Ore HLX 100%
YALLEEN IRON ORE PROJECT
E47/1169-I Yalleen Iron ore/Basemetals HLX 100%, API Management Pty Ltd 70% iron ore rights
E47/1170-I Yalleen Iron ore/Basemetals HLX 100%, API Management Pty Ltd 70% iron ore rights
E47/1171-I Yalleen Iron ore/Basemetals HLX 100%, API Management Pty Ltd 70% iron ore rights
Abbreviations and Definitions used in Schedule:
EL, EPM or E Exploration Licence ELA Exploration Licence Application
For
per
sona
l use
onl
y
Helix Resources Limited Annual Report 2012
63
CORPORATE DIRECTORY Directors
Greg J Wheeler Executive Chairman John den Dryver Non-executive Director Gordon Dunbar Non-executive Director Michael Wilson Technical Director
Australian Business Number
27 009 138 738
Head and Registered Office
Suite 7, 29 Ord Street
West Perth Western Australia 6005
PO Box 825 West Perth Western Australia 6872
Telephone: +61 8 9321 2644
Facsimile: +61 8 9321 3909
Email: [email protected] Website: www.helix.net.au
Share Registry
Advanced Share Registry
150 Stirling Highway Level 6, 225 Clarence Street
Nedlands Western Australia 6009 Sydney NSW 2000
PO Box 1156 Nedlands Western Australia 6909 PO Box Q1736 Queen Victoria Building NSW 1230
Telephone: +61 8 9389 8033 +61 2 8096 3502
Facsimile: +61 8 9389 7871
Auditor
Grant Thornton Audit Pty Ltd
Level 1, 10 Kings Park Road
West Perth Western Australia 6005
Telephone: +61 8 9480 2000
Facsimile: +61 8 9322 7787
Stock Exchange
The Company Securities are quoted on the Australian Stock Exchange Limited
CODE: HLX
For
per
sona
l use
onl
y


