43
Company update March 2016

Company update
March 2016

1
Contents
• Introduction – Group Overview
• Strategy update
• Industry & market developments
• Strategic business units (SBUs)
• Appendix

Leading independent refiner in SEE with upgraded complex refining asset base;
sales evenly spread between domestic and international
• High complexity and net cash margin refineries
• Balanced sales channel mix with exports at
50% of total sales
• Regional footprint with international
subsidiaries
• > 60% of cashflows driven from international
sales and regional benchmark margins
• Leading domestic market position with c.60-
65% of wholesale and c.30% of retail
• Marketing and Petchems vertically integrated
with Refining; diversification in G&P
• Improved competitiveness position; €50m of
further upside in next 2 years
Nelson/Solomon complexity and benchmark margins
Group operational footprint
4*
(*) Average benchmark margins 2012-2015 ($/bbl)
Aspropyrgos
13.9
Thessaloniki
5.0 6.9
Elefsina
11.3
8.8 9.7
Solomon NCI
5* 1*
MONTENEGRO
BULGARIA
SERBIA
FYROM
GREECE
CYPRUS Power & Gas
2

Assets overview Core business around downstream assets with activities across the energy value chain
DESCRIPTION METRICS
• Exploration assets in Greece
• Complex (recently upgraded) refining system:
– Aspropyrgos (FCC, 148kbpd)
– Elefsina (HDC, 100kbpd)
– Thessaloniki (HS, 93kbpd)
• Pipeline fed refinery/terminal in FYROM
• Capacity: 16MT
• NCI: 9.6
• Market share: 65%
• Tankage: 7m M3
• Basel technology PP production (integrated with
refining) and trading
• > 60% exports in the Med basin
• Capacity (PP): 220 kt
• Leading position in all market channels (Retail,
Commercial, Aviation, Bunkering) through EKO and
HF (BP branded network)
• c.1,700 petrol stations
• 30% market share
• Sales volumes: 3.5MT
• Strong position in Cyprus, Montenegro, Serbia,
Bulgaria, FYROM
• Advantage on supply chain/vertical integration
• c.290 petrol stations
• Sales volumes: 1.2MT
• ELPEDISON: Second largest IPP in Greece (JV with
Edison/EdF)
• Capacity: 810 MW
(CCGT)
• DEPA/DESFA GROUP: 35% in Greece’s incumbent
NatGas supply company (DESFA in sale process) • Volumes (2015): 3.0bcm
Refining, Supply
& Trading
Exploration &
Production
Domestic
Marketing
International
Marketing
Petrochemicals
Power & Gas
3

Our Group in numbers – key financials
€ million, IFRS 2010 2011 2012 2013 2014 2015
Income Statement
Sales Volume (MT’000) - Refining 14,502 12,528 12,796 12,696 13,538 14,258
Net Sales 8,477 9,308 10,469 9,674 9,478 7,303
Segmental EBITDA
- Refining, Supply & Trading 338 259 345 57 253 561
- Petrochemicals 50 44 47 57 81 93
- Marketing 114 66 53 68 90 107
- Other (incl. E&P) -28 -6 0 -5 -7 -2
Adjusted EBITDA * 474 363 444 178 417 758
Adjusted associates’ share of profit 30 67 69 57 28 22
Adjusted Net Income * 213 140 229 -120 2 268
Balance Sheet / Cash Flow
Capital Employed 4,191 4,217 4,350 3,905 2,870 2,913
Net Debt 1,659 1,687 1,855 1,689 1,140 1,122
Capital Expenditure (incl. refinery upgrades) 709 675 521 112 136 165
(*) Calculated as Reported less the Inventory effects and other non-operating items 4

Our Group in numbers – key metrics
5
0
1
2
3
4
5
6
7
2010 2011 2012 2013 2014 2015
1.0
1.1
1.2
1.3
1.4
1.5
2010 2011 2012 2013 2014 2015
40%
50%
60%
70%
80%
90%
100%
2010 2011 2012 2013 2014 2015
0%
10%
20%
30%
40%
50%
60%
2010 2011 2012 2013 2014 2015
Mogas Middle distillates Fuel oil
Benchmark system margin ($/bbl)
EUR/USD - €/$
Utilisation rate* (%)
Production yields (%)
758
417
178
363
444474
2010 2013 2014 2015 2011 2012
Adjusted EBITDA (€m)
(*) Total feed over crude capacity; 2011-1H12 Elefsina Refinery was not operating due to its upgrade project

Contents
• Introduction – Group Overview
• Strategy update
• Industry & market developments
• Strategic business units (SBUs)
• Appendix
6

2014-2018 Strategy Update Benefit of investments and competitiveness improvement initiatives to achieve deleverage and
increased cashflow; Emphasis on risk management, which remains a key priority
1
2
5
Rebalance market position and
de-risk business model
Improve financial position
3 Continue competitiveness
improvement
4 Manage business portfolio for
value
Integrate and realise benefit of
investments
- Vertical integration
- Increased exports (50%)
- Operating KPIs
- Solomon benchmarks
- Gas & Power
- Capture positive refining
cycles
- EBITDA €500-700m
STRATEGY TARGETS
- Deleverage balance-sheet
- De-risking
- Cost of funding
7
•85%
•60%
•60%
•50%
•65%

0
5
10
15
2011 2012 2013 2014 2015
IG int sales
293
6,414
2,914
5,031
2014
13,693
7,612
1,825
4,256
2013
12,961
7,771
1,269
3,920
2012
12,107
8,080
2,572
1,455
2011
8,635
7,061
1,282
Aspropyrgos
Thessaloniki
Elefsina
2015
14,359
(*) Total feed over crude capacity; 2011-1H12 Elefsina Refinery was not operating due to its upgrade project
New business model - Operations Business model transformed, post Elefsina upgrade, with increased production driving higher
exports with significant benefits (risk profile, economics, working capital)
Refining Sales by market (m MT)
21% 50%
Nameplate
capacity
8
50%
21%
Gross Production by refinery (MT’000)
54% Utilisation
Rate* (%) 76% 81% 85% 91%
Domestic Sales
Exports

New business model – Profitability drivers Reduced exposure to domestic economic environment; refining margins and operational
performance key drivers of profitability
9
30%
8%
12%
30%
19%
8%
Int’l* PetChems
5%
51%
Total Exports Aviation &
Bunkering*
Domestic
market*
Refining
38%
High Low None
Group Gross margin breakdown (%)
Greek market: contribution
(*) Includes both trading & marketing

Capex Significant step-down following completion of upgrade capex; no major growth project in 2016
10
136112
521
675
709
614
Stay in business capex
2015 2014 2013 2012 2011 2010 2009
165
2016
Capex evolution (€m) 2015 Overview
• Aspropyrgos full T/A included small
growth projects (PP splitter capacity,
energy efficiency projects)
• Elefsina decoking and Thessaloniki
debottlenecking works
• Retail network optimisation; growth of
COMO network
2016 Plan: Main projects
• Maintenance works at Elefsina in 1Q16
(Hydrocracker catalysts and VDU) and
Thessaloniki full T/A
• Selective expansion in Domestic and
International Marketing

Leverage* (x)
Credit facilities - liquidity Full repayment of $400m Eurobond during 1H16; plan to address other maturities, once market
conditions allow
Gross Debt overview (%)
9%
Banks (uncommitted)
30%
25%
Banks (committed)
EIB
36% Debt Capital Markets
Total:
€3.3bn
4Q15 Credit Lines Maturity Profile
11
Interest cover *(x) Gearing* (%)
0
100
200
300
400
500
600
700
2020+ 2019 2018 2017 2016
Debt Capital Markets Banks EIB
3.8 3.9
0 x
1 x
2 x
3 x
4 x
5 x
2013 1H14 2014 1H15 2015
Interest Coverage (x)
Interest Coverage (incl. Assoc.)
1.4 1.2
0 x
2 x
4 x
6 x
8 x
10 x
2013 1H14 2014 1H15 2015
Leverage (incl. Assoc.) Leverage (pro forma)
Leverage ratio is calculated as 12m trailing
Net Debt/Adjusted EBITDA;
Interest cover calculated as Adj. EBITDA over finance costs
(*) pro forma adjustment for DEPA group BV at reported capital structure
Gearing calculated as Net Debt/
Capital Employed
39%
31%
20%
30%
40%
50%
2013 1H14 2014 1H15 2015
Gearing (%) Gearing Pro forma

Framework Agreement with NIOC Iran payables agreement, positive for balance sheet and future crude supply options
12
• Following the removal of US/EU sanctions on 16 January 2016 (“Implementation day” according to the
P5+1 agreement reached on 7 July 2015), Hellenic Petroleum and the National Iranian Oil Company
(NIOC), reached a framework agreement on 22 January
• Recommencement of commercial relationship offering an additional source of crude, in line with existing
contract provisions; deliveries expected to start soon
• Agreement for the settlement of payables from 2011-2012 crude purchases which were frozen, (following
imposition of UN/US sanctions), de-risks balance sheet and is in line with the Group medium-term cash
flow plans
• Agreement implementation is subject to full compliance with current EU and International framework,
including surviving sanctions
Contents
• Introduction – Group Overview
• Strategy update
• Industry & market developments
• Strategic business units (SBUs)
• Appendix
13

Recent Industry developments Recent improvement in European refining environment; beginning of a new cycle?
• European refining margins benefited from improved Atlantic basin crude supply conditions (production
growth in US, as well as Iraq); lifting of Iran sanctions expected to impact crude supply in the region
• Strong demand in both OECD (Europe, US) and emerging markets (China) for products, notably gasoline
throughout 2015
• Developments in global refining capacity (Middle East, Russia) and inter-regional competitive position
(USGC) key drivers
• Weak crude prices and stronger USD positive for refiners, despite one-off inventory impact
Med complex margins - $/bbl (2012-2015)
Med FCC margins:
2.6
$/bbl
3.3 6.5
14 (*) Data updated as of 14/03/2016
4.3
FCC
Hydrocracking
0
1
2
3
4
5
6
7
8
1Q12 2Q12 3Q12 4Q12 1Q13 2Q13 3Q13 4Q13 1Q14 2Q14 3Q14 4Q14 1Q15 2Q15 3Q15 4Q15 QTD*
$/bbl

Regional market – Diesel shortage in the Med ELPE yields match increasing shortage in the region
Key DIESEL/GASOIL balances in the Med region, kb/d (2020)
-178
-103
-65 -28
-40
-40
-10 -11
-20
-6
-5
-18
-195
-34
-55
-16
-13
-87
+4
+8
+9
PORTUGAL
GIBRALTAR
MOROCCO
SPAIN
MED FRANCE
ALGERIA
TUNISIA MALTA
ITALY
CROATIA
SLOVENIA
SERBIA
BOSNIA
FYROM
ALBANIA
GREECE
MONTENEGRO
TURKEY
LIBYA
EGYPT ISRAEL
LEBANON
SYRIA
CYPRUS
Diesel/Gasoil surplus (2020)
Diesel/Gasoil deficit (2020)
-59
Source: Wood Mackenzie
15

953
805
765
751
930
10,125
3,722
2,518
2,932
2009
11,413
4,064
2,837
3,353
1,159
MOGAS
ADO
HGO
LPG & Others
2013
6,599
2,670
2,248
2012
7,727
2,913
2,066
1,983
2011
9,267
3,355
2,224
2,883
2010
813829
971
2015
7,103
2,458
2,427
1,389
2014
6,669
2,527
2,358
Domestic market environment Positive 1H15 trend reversed in 2H, following bank holiday and capital controls; auto-fuels flat y-o-
y, with heating gasoil driving overall market demand growth
16
(*) Does not include PPC and armed forces
Source: Ministry of Environment & Energy
Domestic Market demand* (MT ‘000)
+6%
-7% +6%
+22%
4Q
2,097 1,980
3Q
1,501 1,611
2Q
1,583 1,497
1Q
1,923
1,581
2015 2014
-3%
+43%
+3%
+3%
-11%
-8%
-17%
-15% +1% +7%

Contents
• Introduction - Group overview
• Strategy update
• Industry & market developments
• Strategic Business Units (SBUs)
• Appendix
17

Refining, Supply & Trading economics Combination of Refining economics, in-market trading and International export business;
export sales at 50% of total
Markets
(sales premia varying
across channels)
Refining
(Med benchmark returns
& operations performance)
Imported Products
(0.5-1.5m MT)
Aviation & Bunkering
(Med competitive pricing)
Exports, Intra-Group
(Platts Med FOB based + premia)
Domestic market
5.5 MT
2.5 MT
Exports, 3rd parties
(Platts Med FOB based)
2.0 MT
5.0 MT
Aspropyrgos
NCI 9.7
148kbpd
FCC
Thessaloniki
NCI 6.9
95kbpd
Hydroskimming
Elefsina
NCI 11.3
100kbpd
HDC
16 MT
0.5-1.5 MT
$ / €
Total ELPE capacity
12%
55%
25%
8%
Fuel oil Middle Distillates
Gasoline Other
Refined Products
(14.0 MT) $ $ $
11%
89%
High sulphur
Low sulphur
25%
8%
55%
12%
Other
Gasoline Fuel Oil
Middle Distillates
18
Other
8%
Egypt
9%
Libya
2%
CPC 20%
Iraq
28%
Urals 33%
FY15 crude slate (%)

19
ELPE realised vs benchmark* margin ($/bbl)
(*) System benchmark calculated using actual crude feed weights
(**) Includes PP contribution which is reported under Petchems
Refining, Supply & Trading economics – Performance vs benchmarks Operational excellence and trading premia account for consistent over-performance vs
benchmark of $5-5.5/bbl at normal operations
25 9 84 132 172 77 Adj.
EBITDA 163
8.0 7.5
10.2 10.2
12.3
8.3
11.8
9.5
1Q14 2Q14 3Q14 4Q14 1Q15 2Q15 3Q15 4Q15
ELPE system benchmark (on feed) ELPE realised margin**
143
Aspropyrgos
T/A

300
500
700
900
1100
1300
1500
1700
4Q14 1Q15 2Q15 3Q15 4Q15
Propane, FOB Propylene NWE, CIF Polypropylene NWE
Petrochemicals Operations centred on vertical integration for higher value product; trading geared to
exports markets
Polypropylene value chain
Propylene (refinery grade)
Propylene splitter
90%
Thessaloniki PP plant
(220 kt)
PP
Imports
10%
Propylene (polymer grade)
10%
90%
Domestic and international
market
BOPP film plant (26kt)
• Competitive advantage in polypropylene - vertical
integration at 85-90% of total production
• Exports account for >60% of total sales; strong export
markets in Turkey, Italy and East Med
• Domestic market share in petchems exceeds 50% in
all products, produced or traded
PP value chain contribution ($/T)
20
Integrated
PP
Margin Aspropyrgos splitter
contribution
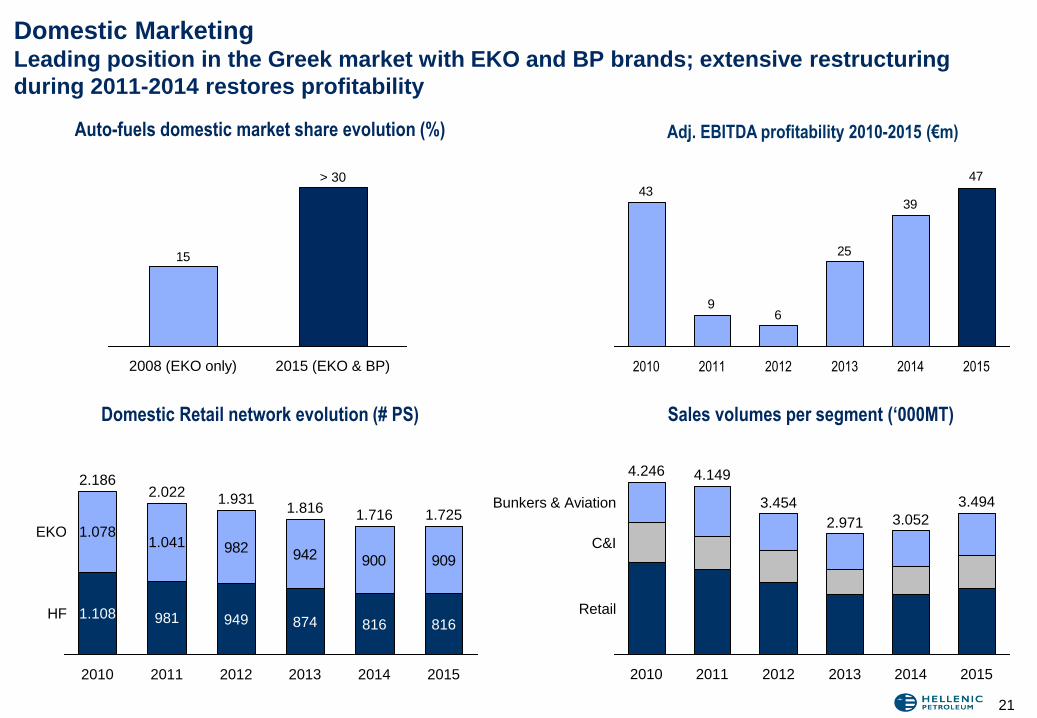
Domestic Marketing Leading position in the Greek market with EKO and BP brands; extensive restructuring
during 2011-2014 restores profitability
Auto-fuels domestic market share evolution (%)
15
2015 (EKO & BP)
> 30
2008 (EKO only)
Adj. EBITDA profitability 2010-2015 (€m)
47
39
25
69
43
2015 2014 2013 2012 2011 2010
21
2011
4.149
2010
4.246
Retail
C&I
Bunkers & Aviation
2015
3.494
2014
3.052
2013
2.971
2012
3.454
Sales volumes per segment (‘000MT)
982 942 900 909
1.078
2012
1.931
949
2011
2.022
981
1.041
2010
2.186
1.108 HF
EKO
2015
1.725
816
2014
1.716
816
2013
1.816
874
Domestic Retail network evolution (# PS)

International Marketing
Subsidiaries in neighboring markets increase downstream integration; selective expansion
to improve network control and increase presence in markets of focus
International Marketing: Regional footprint
Adj. EBITDA profitability 2010-2015 (€m) 59
51
4441
4548
2015 2014 2013 2012 2011 2010
22
CY
BU
SER
JPK
2015
1,178
2014
1,079
2013
1,072
2012
1,072
2011
1,041
2010
1,051
Sales volumes (MT‘000)
+5%
-1%
+19%
+5%
Group refineries
83%
3rd party
17%
2015
GREECE
BULGARIA SERBIA
MONTENEGRO
TURKEY
CYPRUS
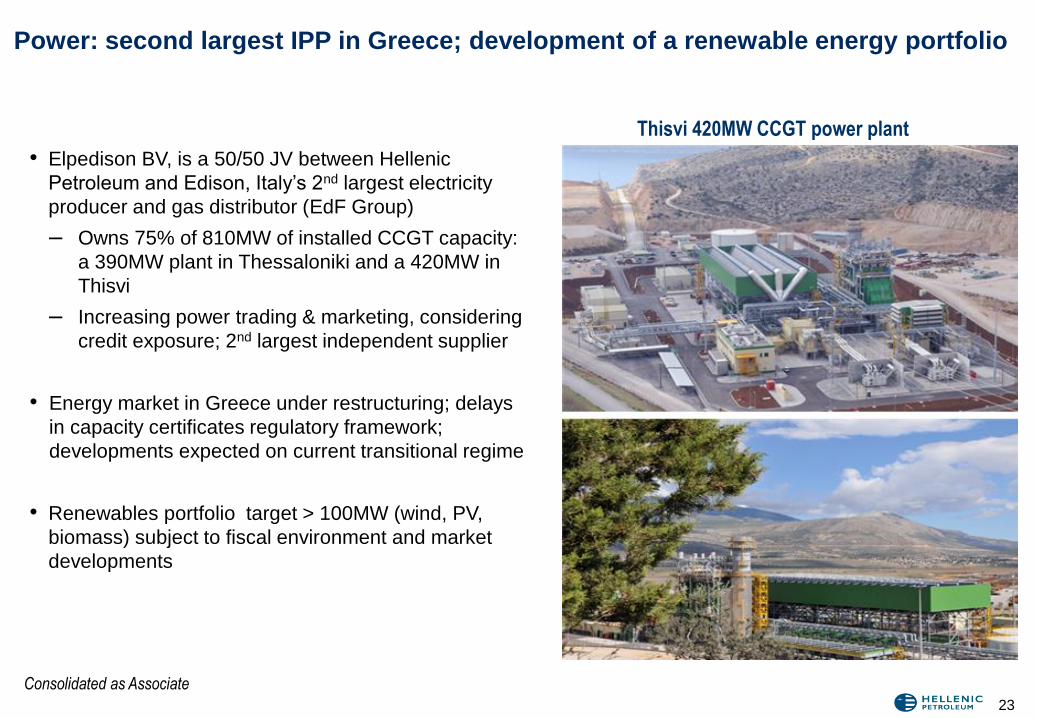
Power: second largest IPP in Greece; development of a renewable energy portfolio
Thisvi 420MW CCGT power plant
Consolidated as Associate
• Elpedison BV, is a 50/50 JV between Hellenic
Petroleum and Edison, Italy’s 2nd largest electricity
producer and gas distributor (EdF Group)
– Owns 75% of 810MW of installed CCGT capacity:
a 390MW plant in Thessaloniki and a 420MW in
Thisvi
– Increasing power trading & marketing, considering
credit exposure; 2nd largest independent supplier
• Energy market in Greece under restructuring; delays
in capacity certificates regulatory framework;
developments expected on current transitional regime
• Renewables portfolio target > 100MW (wind, PV,
biomass) subject to fiscal environment and market
developments
23

Gas: 35% participation in DEPA, Greece’s incumbent gas company
DEPA
– Long-term contracts on pipe gas (Russian & Azeri) and
capacity rights on two in-bound interconnecting pipelines
– Long-term contracts with power generators, eligible industrial
customers and existing EPAs
– Owns 51% of the local supply companies (EPAs), with rights
until 2036
– International pipelines: Participation in Greece-Bulgaria
Interconnector
DESFA (RAB) – in sale process
– Greece’s gas grid and LNG import terminal owner and
operator
• SPA for sale of 66% of DESFA to SOCAR for €400m signed
on 21 Dec 2013; regulatory approvals in process for
completion of transaction
DEPA snapshot financials (€m) 2009 2010 2011 2012* 2013 2014 2015
EBITDA 166 211 288 287 196 126 141
Net Income 61 91 191 197 147 83 66
* Adjusted for settlement with PPC
Natural gas transmission network
DEPA Volumes 2009-2015 (bcm)
Consolidated as Associate
2011 2009
3.3
2015
3.6
4.3
3.0
2013 2014
4.2
2012
3.8
3.0
2010
24

Contents
• Introduction - Group overview
• Strategy update
• Industry & market developments
• Strategic business units (SBUs)
• Appendix
25

Group Key financials: 2005 – 2015 Strong track record of consistent delivery and balance sheet resilience
(*) Calculated as Reported less the Inventory effects and other one-off non-operating items and special income taxes
26
€ million, IFRS (Published) 2005 2006 2007 2008 2009 2010 2011 2012 2013 2014 2015
Income Statement Figures
Sales Volume (MT'000) - Refining 16,525 16,952 17,130 16,997 15,885 14,557 12,528 12,796 12,696 13,538 14,258
Sales Volume (MT'000) - Marketing 4,727 4,790 5,236 4,910 4,787 5,735 5,126 4,434 4,043 4,131 4,672
Net Sales 6,653 8,122 8,538 10,131 6,757 8,477 9,308 10,469 9,674 9,478 7,303
EBITDA 671 502 617 249 390 501 335 298 29 -84 444
Adjusted EBITDA* 466 526 458 513 362 474 363 444 178 417 758
Net Income 341 271 365 29 176 187 118 81 -272 -369 45
Adjusted Net Income* 198 288 246 221 152 213 140 229 -120 2 268
Balance Sheet / Cash Flow Items
Capital Employed 2,956 3,442 3,557 3,153 3,927 4,191 4,217 4,350 3,905 2,870 2,913
Net Debt 699 1,044 977 679 1,419 1,629 1,687 1,855 1,689 1,140 1,122
Capital Expenditure 185 145 195 338 614 709 675 521 112 136 165
Free Cash flow -182 -177 204 512 -561 17 165 25 404 770 307
Dividend/Distributions (€/share) 0.43 0.43 0.50 0.45 0.45 0.45 0.45 0.15 n/a 0.21 n/a
Key drivers
Brent crude ($/bbl) 55.2 68.1 72.9 98.3 62.6 80.3 111.0 111.7 108.7 99.0 52.0
FCC cracking Med margins ($/bbl) 7.3 7.3 7.1 6.8 3.7 4.4 2.9 4.7 2.4 3.4 6.5
€/$ 1.24 1.26 1.37 1.47 1.39 1.33 1.39 1.29 1.33 1.33 1.11

Shareholding & Governance Controlling shareholders supported successful implementation of long-term strategy
Shareholding structure
6%
8%
36%
Greek State
Retail
7% Int’l institutionals
GR institutionals
POIH 43%
Corporate Governance
Board of Directors:
• Consists of 13 members appointed as per
Articles of Association
• Board Committees (Finance / Audit / HR)
Executive Committee:
• Key management executives with responsibility
for strategy and operations
27

Aviation &
Bunkering
C&I (Construction,
wholesale)
Retail
Greek petroleum market overview and route to market Leading domestic market position through vertical integration and competitive logistics
assets
3rd party
Imports
60-65% 30-35%
0-10%
Greek Refining capacity: 25MT
Domestic market: 11.5MT
ELPE Group
subsidiaries: 3.5MT
(30%)
MOH Group
subsidiaries: 2MT
(20%)
Independent
marketing
companies: 4.5MT
(35%)
ELPE exports: 6-8MT
3rd party exports:
5MT
16MT
ELPE Group
subsidiaries: 1-2MT
8%
9% 6%
20%
12%
24%
21%
Fuel Oil
Greek market product breakdown
Specialty markets
(PPC, public sector):
1.5MT (15%)
Gasoline
Diesel
Gasoil Jet
Bunkers
Other
28

€ million, IFRS 4Q FY
2014 2015 Δ% 2014 2015 Δ%
Income Statement
Sales Volume (MT'000) - Refining 3,981 4,070 2% 13,538 14,258 5%
Sales Volume (MT'000) - Marketing 1,075 1,211 13% 4,131 4,672 13%
Net Sales 2,383 1,803 -24% 9,478 7,303 -23%
Segmental EBITDA
- Refining, Supply & Trading 133 144 8% 253 561 -
- Petrochemicals 25 25 0% 81 93 14%
- Marketing 15 17 14% 90 107 19%
- Other -2 -2 -3% -7 -2 70%
Adjusted EBITDA * 171 184 8% 417 758 82%
Share of operating profit of associates ** 6 2 -66% 28 22 -24%
Adjusted EBIT * (including Associates) 121 131 8% 240 581 -
Finance costs - net -49 -48 3% -215 -201 7%
Adjusted Net Income * 52 65 24% 2 268 -
IFRS Reported EBITDA -206 31 - -84 444 -
IFRS Reported Net Income -228 -60 74% -369 45 -
Balance Sheet / Cash Flow
Capital Employed 2,870 2,913 1%
Net Debt 1,140 1,122 -2%
Capital Expenditure 51 34 -32% 136 165 22%
-60
-228
4Q15 4Q14
184171
+8%
4Q15 4Q14
131121
+8%
4Q15 4Q14
Adj. EBIT (€m)
4Q15 GROUP KEY FINANCIALS
(*) Calculated as Reported less the Inventory effects and other non-operating items
(**) Includes 35% share of operating profit of DEPA Group 29
IFRS Net Income (€m)
Adj. EBITDA (€m)

4Q15 KEY HIGHLIGHTS
30
• 4Q15 Adj. EBITDA at €184m (€171m LY) and Adj. Net Income at €65m (€52m LY):
– Robust refining margins and stable EUR/USD exchange rate
– Higher utilisation of all group refineries both q-o-q and y-o-y, improved performance post maintenance
– Record quarterly sales at 4m MT with exports at 53%
– Increased domestic fuels demand (+6%), driven by Heating GO, despite recession (GDP at -2%) in
4Q15
• Record high FY15 Adj. EBITDA at €758m and Adj. NI at €268m
• Oil price decline extended Inventory losses (€148m in 4Q15 and €301m in FY15), negatively affecting IFRS
Net results, at €-60m in 4Q15 and €45m in FY15
• Operating cashflow (Adj. EBITDA – Capex) of €593m supported uninterrupted operations during a most
challenging year, with Net Debt (€1.1bn), flat y-o-y
• Framework agreement with Iran for the settlement of payables from 2011-12 crude purchases and re-
commencement of commercial relationship reduces balance sheet risk
• May 2016 maturing Eurobond ($400m) to be repaid from Group’s existing reserves; Refinancing plans to be
implemented depending on market conditions later in the year
• Awarded exploration rights for Arta Preveza and NW Peloponisos areas (onshore) in Western Greece;
Geophysical studies (seismic 3D) in W. Patraikos have been completed

109 108 110 102
76
54 63
51 44
1.36 1.37 1.37 1.33
1.25
1.13 1.11 1.11 1.09
1.00
1.10
1.20
1.30
1.40
1.50
1.60
10
30
50
70
90
110
130
4Q13 1Q14 2Q14 3Q14 4Q14 1Q15 2Q15 3Q15 4Q15
Brent ($/bbl) EURUSD
INDUSTRY ENVIRONMENT Crude oil prices recorded new lows in 4Q15, leading to inventory losses; EUR/USD remained flat
at $1.1 level
31
• Global growth concerns and sustained
crude oversupply drive prices lower to
$44/bbl area
• Stable EUR/USD at $1.1 for 4th
consecutive quarter
• Further narrowing of Brent – WTI
spread, as US production declined
• Sour spreads at $1.5/bbl on increased
sour crude supply
ICE Brent and EUR/USD
Crude differentials ($/bbl) 11.8
9.4
6.7 6.2
4.0
6.6 5.6 5.6
2.6
0.3 0.8 1.4 1.0 0.8 1.0
0.5 0.7 1.5
4Q13 1Q14 2Q14 3Q14 4Q14 1Q15 2Q15 3Q15 4Q15
Brent-WTI Brent - Urals
2014 2015
31-Dec 55 36
4Q 76 44

Product Cracks* ($/bbl)
Hydrocracking & FXC
INDUSTRY ENVIRONMENT Robust refining benchmarks on sustained gasoline strength and wider crude spreads; middle
distillates performance was weaker y-o-y
32
Med benchmark margins** ($/bbl)
(*) Brent based.
(**) Revised benchmark margins set post-upgrades and secondary feedstock pricing adjustment
FCC
Diesel MOGAS
Naptha
HSFO
-30
-25
-20
-15
-10
-5
0
5
10
15
20
4Q14 1Q15 2Q15 3Q15 4Q15
$/bbl
1Q 2Q
3.4
7.2
3.1
5.8
4.7
6.2
3Q 4Q FY
4.5
6.7
3.9
6.5
2014 2015
1Q 2Q
2.2
6.8
2.6
7.3
4.2
7.3
3Q 4Q FY
4.3 4.8
3.3
6.5

-7 -2
253
561 81
93
200
145 65
30 1
90
107
20
80
FY14 BenchmarkRefiningMargins
FX Greek crisis(capital
controls)
Shut-down Assetutilisation
Supply Others FY15
CAUSAL TRACK & SEGMENTAL RESULTS OVERVIEW 2015 Record operating profitability reflects strong refining economics throughout 2015, despite
turnaround opportunity cost
33
Adjusted EBITDA causal track 2015 vs 2014 (€m)
758 417
Refining,
S&T
MK
Chems Refining,
S&T
MK
Chems
Other
(incl. E&P)
Environment Performance
Other
(incl. E&P)

CASH FLOW PROFILE Strong operating cashflow and prudent liquidity management allowed uninterrupted operations
during a most challenging year
Free Cashflow from Operations (Adj. EBITDA less capex- €m)
34
593
150188
68
188
281
120121
122766
FY14 4Q14 3Q14 2Q14 1Q14 FY13 FY15 4Q15 3Q15 2Q15 1Q15
Net Debt evolution FY14-FY15 (€m)
758
440
278
FY15 Net debt
1.122
Others
22
Working capital
(inventory
volumes, contago)
Interest, Tax,
Capex, Dividends
EBITDA FY14 Net Debt
1.140

4Q 2015 FINANCIAL RESULTS GROUP PROFIT & LOSS ACCOUNT
35 (*) Includes 35% share of operating profit of DEPA Group
IFRS FINANCIAL STATEMENTS 4Q FY
€ MILLION 2014 2015 Δ % 2014 2015 Δ %
Sales 2,383 1,803 (24%) 9,478 7,303 (23%)
Cost of sales (2,529) (1,702) 33% (9,334) (6,608) 29%
Gross profit (146) 101 - 145 695 -
Selling, distribution and administrative expenses (122) (123) (1%) (440) (458) (4%)
Exploration expenses (2) 1 - (4) (1) 87%
Other operating (expenses) / income - net* 8 (3) - 11 10 (9%)
Operating profit (loss) (262) (23) 91% (289) 245 -
Finance costs - net (49) (48) 3% (215) (201) 7%
Currency exchange gains /(losses) 1 (9) - (9) (27) -
Share of operating profit of associates** 6 2 (66%) 28 22 (24%)
Profit before income tax (305) (79) 74% (485) 39 -
Income tax expense / (credit) 77 19 (75%) 116 6 (95%)
Profit for the period (228) (60) 74% (369) 45 -
Minority Interest 1 2 28% 3 2 (50%)
Net Income (Loss) (227) (58) 74% (365) 47 -
Basic and diluted EPS (in €) (0.74) (0.19) 74% (1.20) 0.15 -
Reported EBITDA (206) 31 - (84) 444 -

4Q 2015 FINANCIAL RESULTS REPORTED VS ADJUSTED EBITDA
36
(€ million) 4Q FY
2014 2015 2014 2015
Reported EBITDA -206 31 -84 444
Inventory effect - Loss/(Gain) 375 148 484 301
One-offs 2 5 17 13
Adjusted EBITDA 171 184 417 758

37
4Q 2015 FINANCIAL RESULTS GROUP BALANCE SHEET
(*) 35% share of DEPA Group book value (consolidated as an associate)
IFRS FINANCIAL STATEMENTS FY FY
€ MILLION 2014 2015
Non-current assets
Tangible and Intangible assets 3,530 3,502
Investments in affiliated companies* 682 679
Other non-current assets 313 325
4,526 4,506
Current assets
Inventories 638 662
Trade and other receivables 708 744
Cash and cash equivalents 1,848 2,108
3,194 3,514
Total assets 7,719 8,020
Shareholders equity 1,618 1,684
Minority interest 110 106
Total equity 1,729 1,790
Non- current liabilities
Borrowings 1,812 1,598
Other non-current liabilities 162 170
1,974 1,768
Current liabilities
Trade and other payables 2,739 2,822
Borrowings 1,178 1,633
Other current liabilities 100 7
4,017 4,462
Total liabilities 5,991 6,230
Total equity and liabilities 7,719 8,020

4Q 2015 FINANCIAL RESULTS GROUP CASH FLOW
38
IFRS FINANCIAL STATEMENTS 12M
€ MILLION 2014 2015
Cash flows from operating activities
Cash generated from operations 876 478
Income and other taxes paid (23) (35)
Net cash (used in) / generated from operating activities 853 443
Cash flows from investing activities
Purchase of property, plant and equipment & intangible assets (136) (165)
Sale of property, plant and equipment & intangible assets 5 1
Expenses paid relating to share capital increase of subsidiary - (1)
Grants received - 1
Interest received 9 9
Dividends received 39 18
Proceeds from disposal of available for sale financial assets - 1
Net cash used in investing activities (83) (136)
Cash flows from financing activities
Interest paid (197) (201)
Dividends paid (2) (67)
Proceeds from borrowings 1,112 421
Repayment of borrowings (828) (227)
Net cash generated from / (used in ) financing activities 85 (74)
Net increase/(decrease) in cash & cash equivalents 854 233
Cash & cash equivalents at the beginning of the period 960 1,848
Exchange gains/(losses) on cash & cash equivalents 34 10
Net increase/(decrease) in cash & cash equivalents 854 233
Cash & cash equivalents at end of the period 1,848 2,091
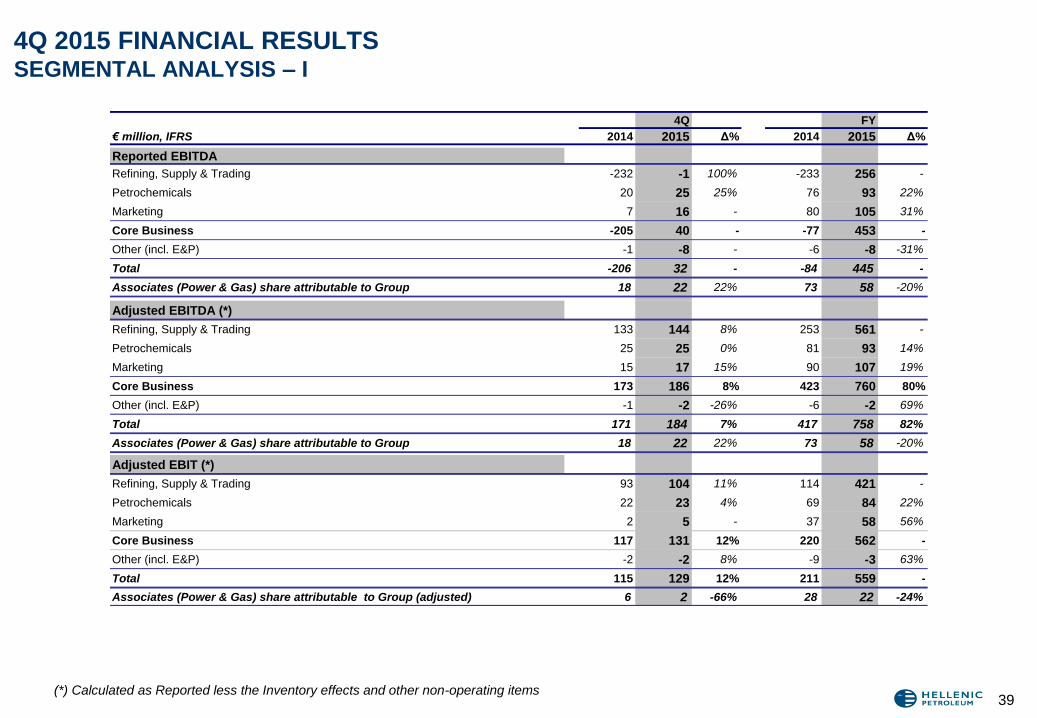
(*) Calculated as Reported less the Inventory effects and other non-operating items
4Q 2015 FINANCIAL RESULTS SEGMENTAL ANALYSIS – I
39
4Q FY
€ million, IFRS 2014 2015 Δ% 2014 2015 Δ%
Reported EBITDA
Refining, Supply & Trading -232 -1 100% -233 256 -
Petrochemicals 20 25 25% 76 93 22%
Marketing 7 16 - 80 105 31%
Core Business -205 40 - -77 453 -
Other (incl. E&P) -1 -8 - -6 -8 -31%
Total -206 32 - -84 445 -
Associates (Power & Gas) share attributable to Group 18 22 22% 73 58 -20%
Adjusted EBITDA (*)
Refining, Supply & Trading 133 144 8% 253 561 -
Petrochemicals 25 25 0% 81 93 14%
Marketing 15 17 15% 90 107 19%
Core Business 173 186 8% 423 760 80%
Other (incl. E&P) -1 -2 -26% -6 -2 69%
Total 171 184 7% 417 758 82%
Associates (Power & Gas) share attributable to Group 18 22 22% 73 58 -20%
Adjusted EBIT (*)
Refining, Supply & Trading 93 104 11% 114 421 -
Petrochemicals 22 23 4% 69 84 22%
Marketing 2 5 - 37 58 56%
Core Business 117 131 12% 220 562 -
Other (incl. E&P) -2 -2 8% -9 -3 63%
Total 115 129 12% 211 559 -
Associates (Power & Gas) share attributable to Group (adjusted) 6 2 -66% 28 22 -24%

4Q 2015 FINANCIAL RESULTS SEGMENTAL ANALYSIS – II
40
4Q FY
€ million, IFRS 2014 2015 Δ% 2014 2015 Δ%
Volumes (M/T'000)
Refining, Supply & Trading 3,981 4,070 2% 13,538 14,258 5%
Petrochemicals 64 59 -8% 236 221 -7%
Marketing 1,075 1,211 13% 4,131 4,672 13%
Total - Core Business 5,119 5,340 4% 17,905 19,151 7%
Sales
Refining, Supply & Trading 2,217 1,613 -27% 8,818 6,644 -25%
Petrochemicals 84 64 -24% 322 263 -18%
Marketing 741 641 -14% 3,220 2,712 -16%
Core Business 3,042 2,318 -24% 12,361 9,620 -22%
Intersegment & other -659 -514 22% -2,882 -2,317 20%
Total 2,383 1,803 -24% 9,478 7,303 -23%
Capital Employed
Refining, Supply & Trading 1,344 1,164 -13%
Marketing 657 838 27%
Petrochemicals 164 144 -12%
Core Business 2,165 2,146 -1%
Associates (Power & Gas) 682 679 -1%
Other (incl. E&P) 23 88 -
Total 2,870 2,913 1%

Glossary of Key Terms
Adjusted EBITDA Reported EBITDA adjusted by inventory effect (impact of the fluctuation of crude prices on BS inventories and on the
value of products sold during the related period) and other one-off non recurring items
ADO Auto Diesel Oil
CCGT Combined Cycle Gas Turbine
COMO Company Owned Manager Operated
DCM Debt Capital Markets
FCC Fluid Catalytic Cracking
HDC Hydrocracking
HGO Heating Gasoil
HS Hydroskimming
HSFO High Sulfur Fuel Oil
IPP Independent Power Producer
MOGAS Motor Gasoline
LNG Liquefied Natural Gas
NatGas Natural Gas
Nelson Complexity Index (NCI) Index assessing the refinery conversion capacity by relating each processing unit capacity against the crude distillation
capacity and applying a weighting factor.
POIH Paneuropean Oil and Industrial Holdings
PP Polypropylene
Solomon Complexity Index Compares the relative refining configuration apart from throughput capacity. It is the total of EDC (Equivalent Distillation
Capacity) divided by the sum of the crude unit stream-day capacities.
ULSD Ultra-low-sulphur Diesel
41

Disclaimer
Forward looking statements
Hellenic Petroleum do not in general publish forecasts regarding their future financial
results. The financial forecasts contained in this document are based on a series of
assumptions, which are subject to the occurrence of events that can neither be reasonably
foreseen by Hellenic Petroleum, nor are within Hellenic Petroleum's control. The said
forecasts represent management's estimates, and should be treated as mere estimates.
There is no certainty that the actual financial results of Hellenic Petroleum will be in line
with the forecasted ones.
In particular, the actual results may differ (even materially) from the forecasted ones due
to, among other reasons, changes in the financial conditions within Greece, fluctuations in
the prices of crude oil and oil products in general, as well as fluctuations in foreign
currencies rates, international petrochemicals prices, changes in supply and demand and
changes of weather conditions. Consequently, it should be stressed that Hellenic
Petroleum do not, and could not reasonably be expected to, provide any representation or
guarantee, with respect to the creditworthiness of the forecasts.
This presentation also contains certain financial information and key performance
indicators which are primarily focused at providing a “business” perspective and as a
consequence may not be presented in accordance with International Financial Reporting
Standards (IFRS).
42


