37
1

1

Hello and welcome. This is BP’s fourth-quarter and full-year 2015 results webcast and
conference call.
I’m Jess Mitchell, BP’s Head of Investor Relations and I’m here with our Group Chief
Executive Bob Dudley, and our Chief Financial Officer, Brian Gilvary. Also with us for the
Q&A is the Chief Executive of our Upstream, Lamar McKay, and Tufan Erginbilgic, Chief
Executive of our Downstream.
Before we start, I need to draw your attention to our cautionary statement.
2

During today’s presentation, we will make forward-looking statements that refer to our
estimates, plans and expectations. Actual results and outcomes could differ materially due
to factors we note on this slide and in our UK and SEC filings. Please refer to our Annual
Report, Stock Exchange Announcement and SEC filings for more details. These documents
are available on our website.
Thank you, and now over to Bob.
3

4
Thanks Jess.

Welcome everybody and thank you for joining us. It already looks like another very
turbulent year for our industry and so I’ll start today by looking at that business
environment. Then I’ll look at how we are responding and building resilience in these tough
conditions. I’ll then give you the headlines from the full-year results.
As usual Brian will take you through the detail of our fourth-quarter numbers and provide an
update of the medium-term guidance we laid out in October. And I’ll come back to briefly
update you on the ongoing work in our Upstream and Downstream businesses. At the end
there will, as always, be time for your questions.
5

So let’s start with the oil price environment.
Between September 2014 and the end of 2015 we saw the price of oil fall by over $60 per
barrel. And as we enter 2016, the fundamentals that caused this are still in play, which
means prices are likely to remain very volatile in the near term.
However, the market is responding to these low oil prices. Globally, supply is levelling out -
especially in the United States, where output is declining. Last year, low prices led to a
steep increase in demand of approximately 1.8 million barrels per day, which is double the
average annual demand growth of the past ten years.
These trends suggest that supply may converge with levels of demand sometime in the
second half of this year. And as we move further out we expect demand may well start to
exceed supply – which is an increasingly consistent view across a number of industry
commentators and data sources, including our own outlook. Of course, inventories that
have built up in the meantime would also need to work their way into the market. As this all
starts working together to improve the fundamentals, I might characterise the outlook as
being “lower for longer, but not lower forever”.
There will be more detail on our view of the longer term, in our updated Energy Outlook
publication which our Chief Economist, Spencer Dale, will launch next week.
The recent sharp fall in oil prices has had a big impact on our 2015 results – as it has for the
whole industry. The key in such times is to adapt and compete in the new environment. At
BP, I believe we have a distinctive track record of understanding, responding and adapting
to change quickly and effectively. I believe our swift response, the fundamental principles of
our strategy, and the solid day-to-day delivery in our businesses are all serving us well in
this environment.
6

This time last year we predicted that the deteriorating environment would bring about a
period of intense change for our industry. We talked about a reset phase of two years or so,
with outcomes defined by the level of oil and gas prices, the pace of deflation, the ability to
achieve efficiencies and possible M&A activity.
And we are seeing all of that playing out across the sector.
In BP we recognised early on, the need to focus on a set of clear priorities for the near
term. You may recall we called these priorities the 4 D’s – ongoing delivery in the business;
a disciplined reset of our capital and cash costs; completing our planned divestments; and
most importantly, maintaining our dividend as the first priority in our financial framework.
In 2015, we did make good progress against these priorities.
As operators we maintained a strong hold on safe and reliable delivery while undertaking
major business transformation. In the Upstream, our focus on managing production in our
base assets and driving down operating costs is showing up increasingly with competitive
operating performance. A strong year in the Downstream is a reminder of both the
importance of our integrated model and also the quality and performance of our
Downstream portfolio. And Rosneft, in which we have a 19.75% interest, is showing good
operational and financial resilience in the current environment.
As last year began we moved quickly to reset our capital expenditure plans. Also, the
reduction we have seen in our cash costs is substantial and also, we believe, largely
sustainable for the long term. And agreed divestments are within the range planned for the
2014 to 2015 period. We will come back to all these points in more detail as we go through
today’s presentation.
7

We also reached a milestone - a significant one - in July with the
announcement of the agreements in principle with the United States
government and five Gulf States to settle all federal and state claims arising
from the Deepwater Horizon oil spill. This leaves us able to focus more
clearly on the future.
So we have achieved a lot despite the challenges. As we look forward in
2016 we continue to adapt to the changing circumstances. I am convinced
we are responding smartly; doing the right things and that, as we adapt,
we are also learning and enhancing our ability to adapt even further for
what we expect to be a very tough year ahead. We know how to do this in
BP. Our balance sheet was strengthened by divestments after 2010 to
provide flexibility for Deepwater Horizon uncertainties as well as this sort of
price volatility. And the rapid pace at which we are resetting the business is
putting us well down a path of rebalancing our financial framework. Brian
will cover this more fully in a moment. All of this is supporting our ongoing
commitment to sustaining the dividend.
7

Of course as we work through this reset phase we have to think about more than just the
near term. Ours is a long-term business and we need to respond to today’s challenges in a
very thoughtful way so as not to compromise safety or the growth plans that are essential
for the future. As we highlighted to you in October we have not lost sight of the enduring
principles that guide our business in any environment. These principles embody what is
needed to succeed in our business through the cycle. And they keep us focused on our
primary objective of growing value for shareholders over the long term.
We talked a lot about this in October so I will only touch on the main points again today.
Our approach starts with a relentless focus on safe and reliable operations. It also
recognises the importance of a strong, balanced portfolio with resilience to a wide range
of operating conditions and opportunities for growth. We have worked hard since 2010 to
reshape our portfolio through $75 billion of divestments, when you include our interest in
TNK-BP. It leaves us with a high-quality set of opportunities well aligned to what we do
best. With our interest in Rosneft, our portfolio retains the scale of a 3.3 million barrel per
day company. We manage this portfolio for value over volume, whether through inorganic
activity such as our ongoing divestments or asset deepening; or through alternative ways
to optimise our businesses such as you have seen in the US Lower 48.
Capital and cost discipline are not only critical right now, but fundamental to our business
model long-term. We must be efficient with our scarce capital. We will continue to
sanction projects, but only those we see as competitive, once they have been optimised
for deflation. And we continue to transform our cash cost base as we make the structural
changes for a sustained business model for the future.
All of this works towards the most important shareholder focused principle - that of
growing sustainable free cash flow and shareholder distributions over the long term.
8

Now let me now turn specifically to the full-year 2015 results for the Group.
Our underlying replacement cost profit was $5.9 billion for the year – a result significantly
affected by the much weaker Upstream environment. This was 51% lower than the full-year
2014. At the same time, that result was supported by a strong environment and strong
performance in the Downstream, and our efforts to reduce costs broadly across the Group.
These same factors impacted our underlying operating cash flow which, excluding oil spill
related payments, was $20.3 billion for the year. This was 38% lower than last year.
Organic capital expenditure in 2015 was $18.7 billion while proceeds during the year from
divestments totalled $2.8 billion.
Gearing at the end of the year was 21.6%.
We distributed $6.7 billion in cash to shareholders through dividends.
And finally, our reserves replacement ratio for 2015 is estimated at 61%, excluding the
impact of acquisitions and divestments.
9

I’d like to take a moment now to look more closely at the outcome of our efforts to reset
costs.
We continue to move quickly in lowering the costs we control across BP. That means
optimising the scope of what we do every day, and changing how we manage our internal
costs, including extensive simplification of our organisational structures in every part of the
business. This is what makes a large part of these cost savings sustainable for the future.
And you can see the results to date. The Group’s controllable cash costs for the full-year
2015 are some $3.4 billion lower compared with 2014. This is well down the track towards
delivering the cash cost savings we outlined in October, which we now expect to be close
to $7 billion by 2017, compared to 2014.
Non-operating restructuring charges are expected to approach $2.5 billion in total by the
end of 2016, relative to around $1.5 billion incurred in total since the fourth quarter of 2014.
As I just mentioned, organic capital expenditure for 2015 was $18.7 billion. This compares
to the guidance at the start of the year of around $20 billion and 2014 actual spend of $22.9
billion. As well as paring back some exploration and access spend and prioritising activity in
our base operations, it reflects a very careful focus on balancing the timing of investments
to capture the accelerating deflation in the supply chain, while ensuring we continue to
invest sufficiently in our growth plans. Based on past cycles and the interventions we have
in train, we expect continued deflation in 2016, in both capital spending and our operating
cost base.
So, you can see we are transforming the business to a sustainably lower cost base. We
must take full advantage of the changed environment while making the tough choices that
ensure we establish a resilient cost structure for both the current environment and as a
platform for future growth.
10
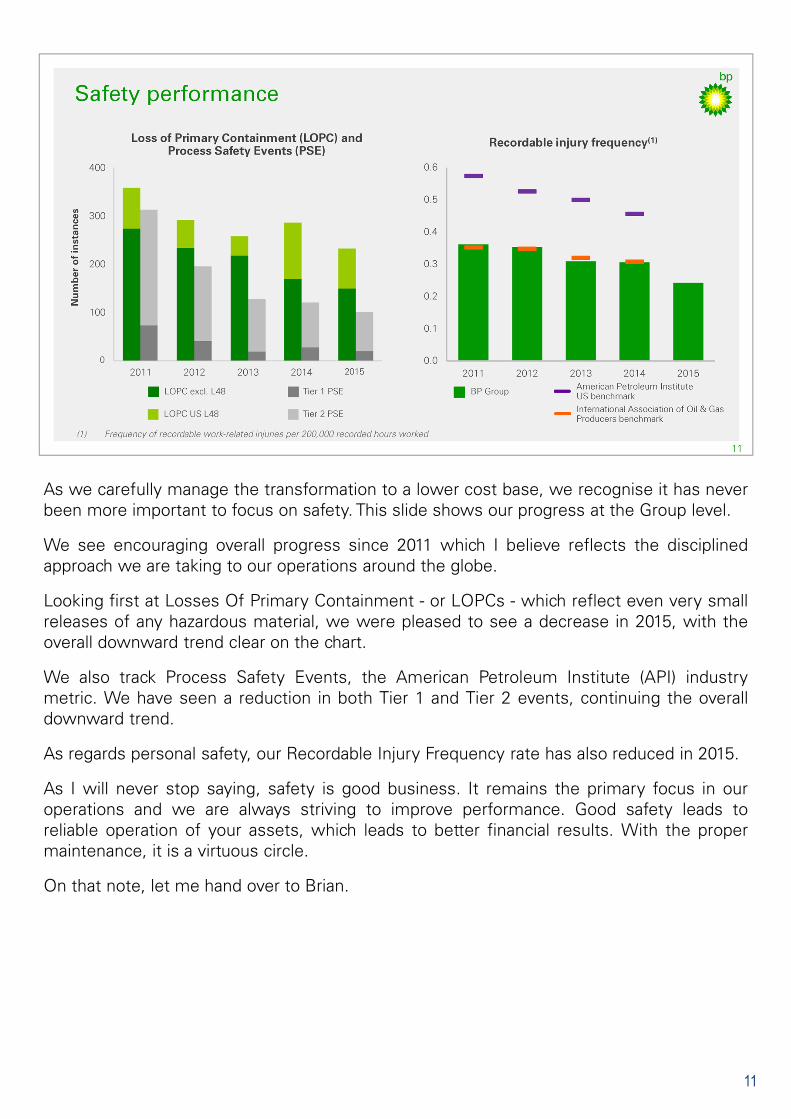
As we carefully manage the transformation to a lower cost base, we recognise it has never
been more important to focus on safety. This slide shows our progress at the Group level.
We see encouraging overall progress since 2011 which I believe reflects the disciplined
approach we are taking to our operations around the globe.
Looking first at Losses Of Primary Containment - or LOPCs - which reflect even very small
releases of any hazardous material, we were pleased to see a decrease in 2015, with the
overall downward trend clear on the chart.
We also track Process Safety Events, the American Petroleum Institute (API) industry
metric. We have seen a reduction in both Tier 1 and Tier 2 events, continuing the overall
downward trend.
As regards personal safety, our Recordable Injury Frequency rate has also reduced in 2015.
As I will never stop saying, safety is good business. It remains the primary focus in our
operations and we are always striving to improve performance. Good safety leads to
reliable operation of your assets, which leads to better financial results. With the proper
maintenance, it is a virtuous circle.
On that note, let me hand over to Brian.
11

12
Thanks Bob.

13
Starting with the price environment for the fourth quarter.
Brent crude oil fell to an average of just under $44 per barrel, the lowest quarterly
average since the second quarter of 2004. This was mainly driven by sustained OPEC
output pushing inventories higher, despite falling production in the United States.
Henry Hub gas prices averaged around $2.30 per million British Thermal Units in the
fourth quarter, lower than the previous quarter due to unseasonably warm weather
impacting demand. Gas prices increased sharply towards the end of the year as
temperatures returned to more seasonal norms.
As expected, the overall refining environment deteriorated through the fourth quarter, as
capacity returned after autumn maintenance and gasoline demand fell.
These lower trends had a significant impact on our fourth-quarter results in a quarter of
otherwise strong operational delivery.
14
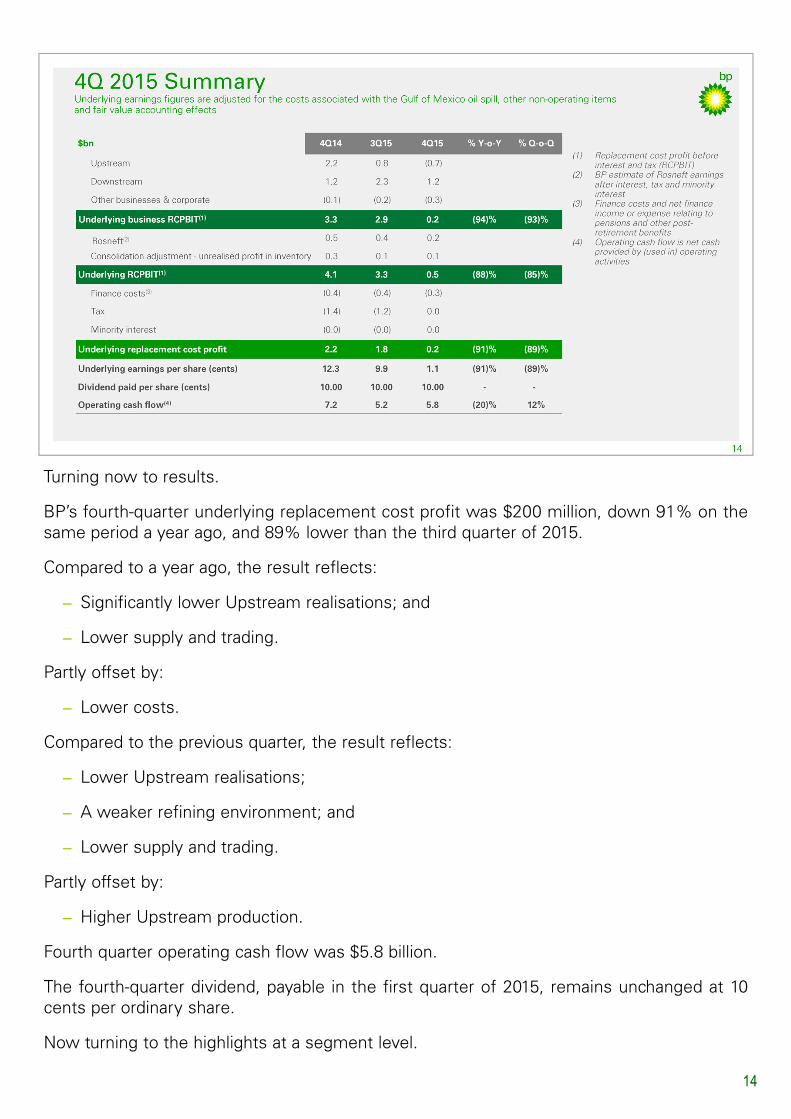
Turning now to results.
BP’s fourth-quarter underlying replacement cost profit was $200 million, down 91% on the
same period a year ago, and 89% lower than the third quarter of 2015.
Compared to a year ago, the result reflects:
− Significantly lower Upstream realisations; and
− Lower supply and trading.
Partly offset by:
− Lower costs.
Compared to the previous quarter, the result reflects:
− Lower Upstream realisations;
− A weaker refining environment; and
− Lower supply and trading.
Partly offset by:
− Higher Upstream production.
Fourth quarter operating cash flow was $5.8 billion.
The fourth-quarter dividend, payable in the first quarter of 2015, remains unchanged at 10
cents per ordinary share.
Now turning to the highlights at a segment level.
15
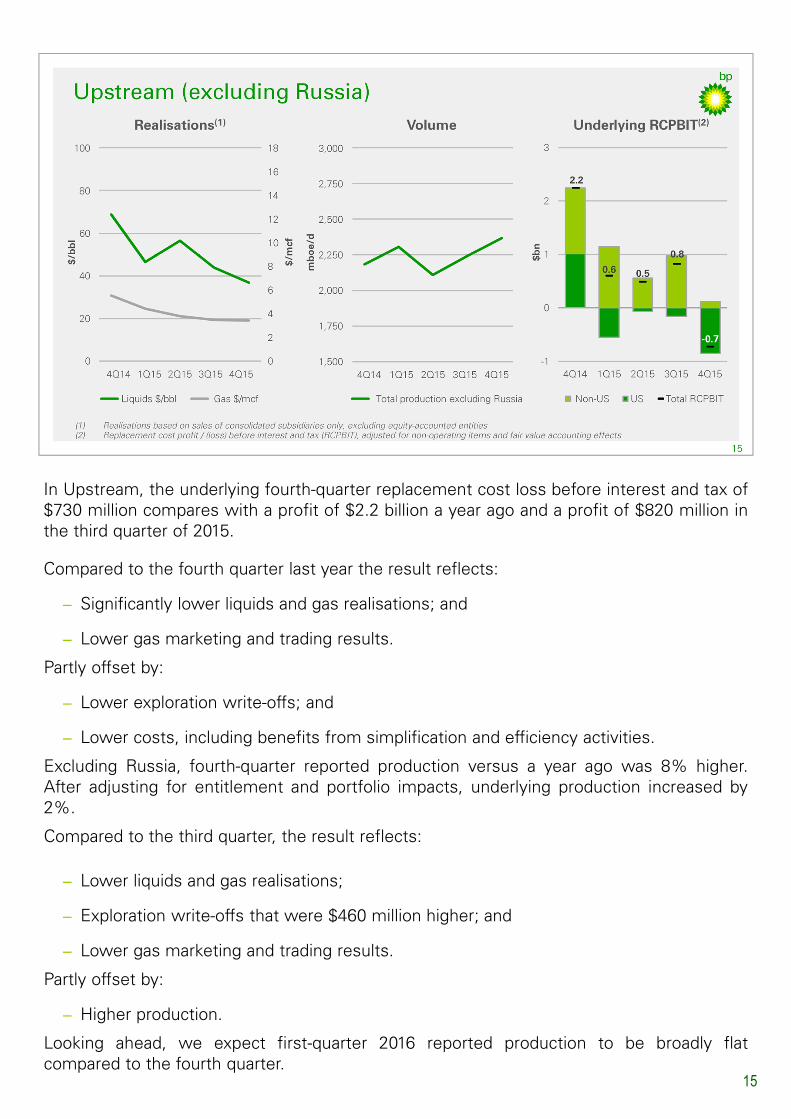
In Upstream, the underlying fourth-quarter replacement cost loss before interest and tax of
$730 million compares with a profit of $2.2 billion a year ago and a profit of $820 million in
the third quarter of 2015.
Compared to the fourth quarter last year the result reflects:
− Significantly lower liquids and gas realisations; and
− Lower gas marketing and trading results.
Partly offset by:
− Lower exploration write-offs; and
− Lower costs, including benefits from simplification and efficiency activities.
Excluding Russia, fourth-quarter reported production versus a year ago was 8% higher.
After adjusting for entitlement and portfolio impacts, underlying production increased by
2%.
Compared to the third quarter, the result reflects:
− Lower liquids and gas realisations;
− Exploration write-offs that were $460 million higher; and
− Lower gas marketing and trading results.
Partly offset by:
− Higher production.
Looking ahead, we expect first-quarter 2016 reported production to be broadly flat
compared to the fourth quarter.

16
In the Downstream, the fourth-quarter underlying replacement cost profit before interest
and tax was $1.2 billion compared with $1.2 billion a year ago and $2.3 billion in the third
quarter. This brings the Downstream full-year underlying replacement cost profit to a record
$7.5 billion.
The fuels business reported an underlying replacement cost profit before interest and tax
of $890 million in the fourth quarter, compared with $930 million in the same quarter last
year and $1.9 billion in the third quarter. Compared to a year ago this reflects:
− Cost benefits from simplification and efficiency programmes.
Offset by:
− Weak supply and trading.
Compared to the third quarter this reflects:
− Lower seasonal refining margins; and
− Weak supply and trading.
Refining operations in the fourth quarter were strong, with Solomon availability at 95.5%.
The lubricants business delivered an underlying replacement cost profit of $290 million in
the fourth quarter, compared with $310 million in the same quarter last year and $350
million in the third quarter of 2015. Compared to a year ago this reflects continued strong
margins, offset by adverse foreign exchange impacts.
The petrochemicals business reported an underlying replacement cost profit of $40 million
in the fourth quarter.
Looking ahead we expect refining margins in the first quarter to be lower than the fourth
quarter.

17
Turning to Rosneft. Based on preliminary information, we have recognised $235 million as
our estimate of BP’s share of Rosneft’s underlying net income for the fourth quarter,
compared to around $470 million a year ago and $380 million in the third quarter.
Our estimate of BP’s share of Rosneft’s production for the fourth quarter is just over 1
million barrels of oil equivalent per day, broadly flat compared with a year ago and 2.5%
higher than the previous quarter.
Further details will be made available by Rosneft with their results, which we expect to be
issued later this quarter.

18
In Other Businesses and Corporate, the pre-tax underlying replacement cost charge was
$300 million for the fourth quarter, an increase of $180 million on the same period a year
ago, mainly due to a number of one-off credits in the fourth quarter of 2014. The average
quarterly charge during 2015 was lower than our guidance of $400 million per quarter and
reflects benefits from our simplification programmes and profitability in our other corporate
businesses.
The underlying effective tax rate for the fourth quarter was minus 20%, with tax credits in
respect of the reported Upstream loss more than offsetting tax charges elsewhere in the
business. Excluding the one-off North Sea tax reduction in the first quarter of 2015, the
underlying effective tax rate for 2015 was 31%. This compares to 36% in 2014 and reflects
a change in the mix of the Group’s profits.

19
Turning to the Gulf of Mexico oil spill costs and provisions.
As previously announced, BP Exploration & Production reached agreements in principle
with the United States government and five Gulf Coast states to settle all federal and state
claims arising from the Deepwater Horizon oil spill, pending court approval of the proposed
consent decree, scheduled for the 23rd of March 2016.
The settlements do not include claims relating to the 2012 class action settlement with the
Plaintiff’s Steering Committee, including business economic loss claims not provided for;
private claims not included within the class action settlement; or private securities litigation
in MDL 2185.
The charge taken for the accident for the fourth quarter was $440 million which takes the
total cumulative pre-tax charge to $55.5 billion. This reflects:
− Around $580 million related to business economic loss claims not provided for;
− Credits to other provisions; and
− The ongoing costs of the Gulf Coast Restoration Organisation.
It is still not possible to reliably estimate the remaining liability for business economic loss
claims and we continue to review this each quarter.
The pre-tax cash outflow on costs related to the oil spill for the full-year 2015 was $1.1
billion, including $595 million relating to fines and penalties.
Of the $20 billion paid into the Trust fund, $18.6 billion has now been paid out with the
remainder allocated to amounts already provided for.
As a reminder, we expect cash outflows in 2016 of $530 million in respect of the 2012

criminal settlement with the United States Department of Justice; and $1.1
billion in respect of the 2015 settlement agreements. In addition, we also
expect further payments relating to business economic loss claims and
other costs not yet provided for. We will continue to update you on these
charges on a quarterly basis.
19

20
Now looking at cash flow, this slide compares our sources and uses of cash in 2014 and
2015.
Operating cash flow for 2015 was $19.1 billion, of which $5.8 billion was generated in the
fourth quarter. This compares with $32.8 billion in 2014 and $7.2 billion in the fourth quarter
of 2014. Excluding oil spill related outgoings, underlying operating cash flow for the year
was $20.3 billion as noted by Bob. This includes a working capital build of $300 million in
the year.
Organic capital expenditure for the full year of $18.7 billion, includes $5.5 billion for the
fourth quarter.
Divestment proceeds totalled $2.8 billion in 2015, with $230 million in the fourth quarter.

21
Now turning to our guidance for 2016.
We expect full-year underlying production in 2016 to be broadly flat compared with 2015.
The actual reported outcome will depend on divestments, OPEC quotas and entitlement
impacts.
Relative to our October guidance of $17-19 billion per annum of capital expenditure through
to 2017, we now expect 2016 capital expenditure to be towards the lower end of this range.
This fine tuning of our guidance reflects the ongoing rebalancing of uses of cash in the
lower price environment. The reduction is largely driven by a better understanding of what
to expect from deflation in the supply chain rather than any material changes to planned
activity. Depending on where oil prices settle and how this continues to impact deflation
we will keep the capital frame under review as we move through 2016 and beyond.
In 2016 we expect DD&A to remain broadly flat relative to the 2015 charge of $15.2 billion.
In Other Businesses and Corporate, the average underlying quarterly charge is expected to
be around $300 million, although this may fluctuate between individual quarters.
In the current environment, and with our existing portfolio of assets, we expect the
effective tax rate to be lower during 2016 due to changes in the mix of Group profits.
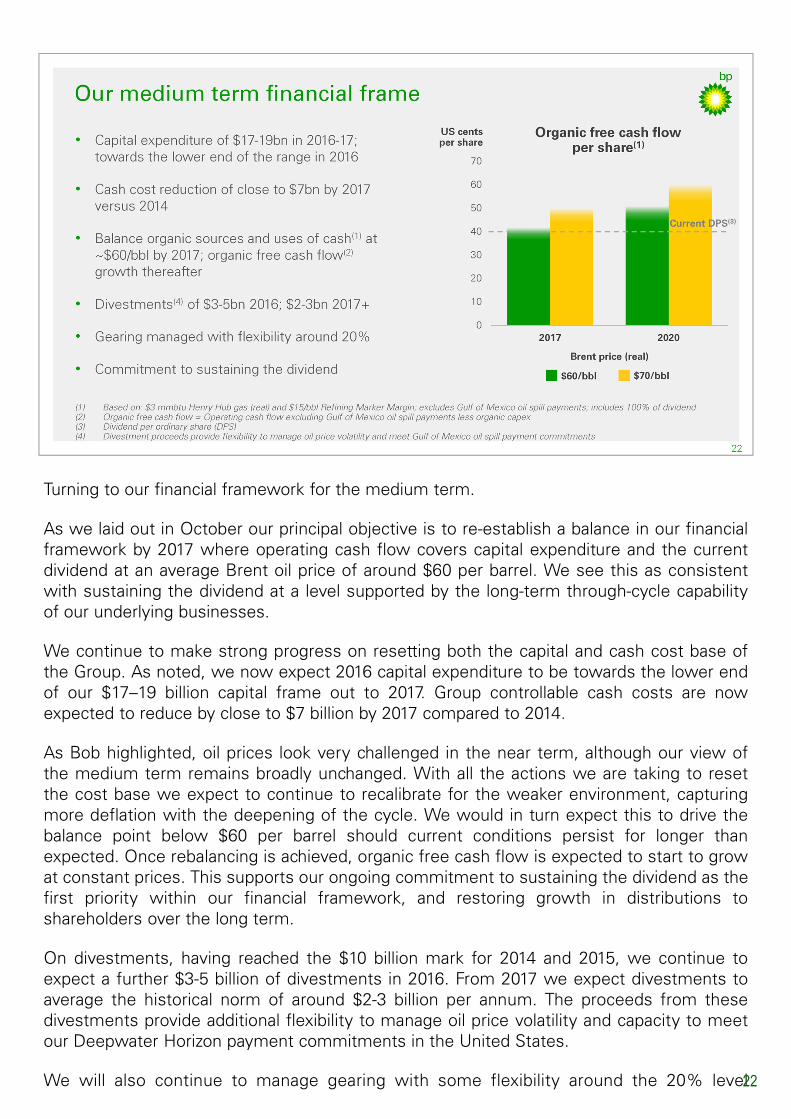
Turning to our financial framework for the medium term.
As we laid out in October our principal objective is to re-establish a balance in our financial
framework by 2017 where operating cash flow covers capital expenditure and the current
dividend at an average Brent oil price of around $60 per barrel. We see this as consistent
with sustaining the dividend at a level supported by the long-term through-cycle capability
of our underlying businesses.
We continue to make strong progress on resetting both the capital and cash cost base of
the Group. As noted, we now expect 2016 capital expenditure to be towards the lower end
of our $17–19 billion capital frame out to 2017. Group controllable cash costs are now
expected to reduce by close to $7 billion by 2017 compared to 2014.
As Bob highlighted, oil prices look very challenged in the near term, although our view of
the medium term remains broadly unchanged. With all the actions we are taking to reset
the cost base we expect to continue to recalibrate for the weaker environment, capturing
more deflation with the deepening of the cycle. We would in turn expect this to drive the
balance point below $60 per barrel should current conditions persist for longer than
expected. Once rebalancing is achieved, organic free cash flow is expected to start to grow
at constant prices. This supports our ongoing commitment to sustaining the dividend as the
first priority within our financial framework, and restoring growth in distributions to
shareholders over the long term.
On divestments, having reached the $10 billion mark for 2014 and 2015, we continue to
expect a further $3-5 billion of divestments in 2016. From 2017 we expect divestments to
average the historical norm of around $2-3 billion per annum. The proceeds from these
divestments provide additional flexibility to manage oil price volatility and capacity to meet
our Deepwater Horizon payment commitments in the United States.
We will also continue to manage gearing with some flexibility around the 20% level22

although we expect gearing to run above 20% while oil prices remain
weak.
I’ll now hand you back to Bob.
22

23
Thanks Brian.

Turning to our businesses and looking first at the Upstream.
In a challenging external environment, we achieved a number of significant milestones in
2015.
In Exploration, we made a high-value discovery at the Atoll well, offshore Egypt.
We were awarded new blocks in the Gulf of Mexico and Egypt, as well as achieving access
in Mexico through our Joint Venture partner, Pan-American Energy.
We saw three major project start-ups in 2015: the Kizomba Satellites Phase 2 and Greater
Plutonio Phase 3 projects in Angola; and the Western Flank A project on the Australian
North West Shelf. The In Salah Southern Fields project in Algeria is expected to start-up
during the first quarter.
And we made Final Investment Decisions - or FID’s - on four major projects, including our
twoWest Nile Delta projects in Egypt.
In operations, 15 turnarounds were successfully completed, and the performance of our
base assets continues to improve.
In its first year operating as a separate entity, our US Lower 48 onshore business delivered
material improvements in competitiveness and performance. Unit production costs in 2015
were around 7% lower year-on-year. And by the fourth quarter, capital efficiency on BP-
operated wells had improved by 15% compared to 2014, benefitting from some real
innovation in well designs and improved execution by the team.
24

We continue to deliver on our Upstream cost agenda where we are right-sizing our
organisation, reducing our third party spend and influencing our partners where we are not
the operator.
Our total Upstream workforce is now 20% smaller than it was in 2013, with 11% fewer
employees and 48% fewer agency contractors. We are aiming for a total Upstream
employee and agency headcount below 20,000 compared to around 30,000 in 2013. This
will mean a further workforce reduction of around 4,000 people.
We have a significant focus on capturing deflation and have achieved average cost
reductions of around 15% in our third party spend.
We have also accelerated competitive bidding programmes across the Upstream. We
expect to have rebid 40% of our third party spend in our operations by the end of 2016; and
around 60% of our well services spend by the end of the first quarter of 2016.
We continue to challenge our teams and our partners to deliver as efficiently as possible.
And our focus on costs in 2015 has resulted in unit production costs over 20% lower than
2013.
25

26
The next few slides come back to the most important points from our October
presentation, starting with our base assets.
Here, performance remains resilient, with that focus on safety and reliability, maximising
production and resetting our cost base. Our functional organisational model is executing
this improving performance.
We have seen a significant reduction in process safety incidents, and our personal safety
statistics continue to improve, with recordable injuries in the Upstream at their lowest
level ever. At the same time, BP-operated plant reliability in the Upstream has increased
from 86% in 2011 to 95% in 2015, driven by big improvements in key regions including
Angola, the North Sea and the Gulf of Mexico.
Drilling efficiency is getting better, with non-productive downtime down more than 20%
versus three years ago. Thanks to these improvements, production from new wells and
wellwork reached around 160,000 barrels of oil equivalent per day in 2015, with the vast
majority of well programmes delivering rates of return of over 20% at a $60 Brent oil price.
We expect all these efforts to keep our managed base decline at around 2% through 2016,
compared with a 2014 baseline. Our long-range view remains at 3-5% as we have said
before. Moreover these performance improvements have now positioned us in the top tier
of our peer group on a cash flow per barrel equivalent basis.

27
Looking ahead, we expect over 800 thousand barrels of oil equivalent per day of new
production from projects starting up between 2015 and 2020. Over half of that is
anticipated to come from seven key projects, all of which are progressing well. These
projects are accretive to the existing portfolio, with operating cash margins around 35%
better than the existing base business.
We have some significant new projects that will increase the share of gas production in our
portfolio. These include LNG projects, pipeline gas projects such as Shah Deniz 2, and
domestic gas projects such as those in Egypt and Oman. Our domestic and pipeline gas
investments offer the longevity of a typical LNG project – but cost less to develop. We
focus on cost of supply as much as the sale price. We work to leverage our commercial,
financial and technical capability through the value chain to drive competitive returns on
these projects.
Break-even prices for our major projects have fallen by around 15% in the past 12 months –
meaning that the vast majority of our pre-FID projects now break-even below $60 per
barrel. We continue to optimise project economics and drive to lower the cost of supply in
this deflationary environment. We are also rescoping and rephasing the spending
appropriately.
In addition to the projects under construction, we have a deep hopper of around 50 pre-
execute and appraisal opportunities around the world. These include some very good new
discoveries made in the last 18 months, such as Atoll in Egypt and Vorlich in the UK North
Sea. In October we showed you a slide detailing the depth of our project portfolio and this
is available on our website. You may want to have a look at this.
We expect to take final investment decision on a number of these projects and - while
some of this may change as we optimise our portfolio - we believe this inventory of
projects remains balanced across our asset themes, fiscal regimes and geographies, and
this will allow us to continue on our growth trajectory.

28
Lastly, looking beyond 2020 in the Upstream, we have the options, discovered resources
and acreages to sustain long-term growth.
To emphasise another chart you have seen before, we have a hopper of 44 billion barrels
of oil equivalent, including 11 billion barrels of proved reserves from the existing base
assets and sanctioned projects, and a further 33 billion barrels underpinning our growth
beyond the end of the decade.
In addition, we have an exploration pipeline across a range of resource types.
This includes incumbent positions in world class hydrocarbon provinces such as the Gulf of
Mexico, the Caspian Sea, the North Sea and the Nile Delta in Egypt.
Recent access to new regions and plays does create the potential for future production
centres. Also we are building a material position through our relationship with Rosneft.
All of this gives us considerable flexibility to adapt to changes in the energy mix of world
demand over the long term. We remain very excited about the future of our Upstream
business.
28

29
Turning to the Downstream, we also delivered strong safety and underlying financial
performance in 2015 which puts us in a good position to meet our medium-term strategic
targets.
Process safety metrics have improved again with 2015 seeing the lowest level on record for
total Tier 1 and 2 events. This has been done along with strong refining availability. With the
refineries running well, we have benefitted from the favourable refining environment.
Record pre-tax earnings of $7.5 billion from the Downstream included $1.9 billion of
underlying performance improvement relative to the environment in 2014, while pre-tax
returns have doubled to 18%.
Our simplification and efficiency programmes in the Downstream contributed to a year-on-
year cash cost reduction of more than 15%.
We continue to focus on building an advantaged portfolio. You may have seen this reflected
in our recent announcement to divest our Alabama petrochemicals complex in the United
States and the agreement with our partner Rosneft to dissolve our refining joint operation
in Germany.

Our Downstream strategy as laid out last year is delivering results.
In manufacturing, we continue to build a top quartile refining business and are taking steps
to significantly improve the cash breakeven performance of the petrochemicals business. In
2015 this delivered significant improvements versus 2014. Our refining earnings more than
doubled at a constant refining environment to 2014, and in petrochemicals, we grew
earnings by over $200 million in a similar environment to 2014.
In fuels marketing and lubricants, we invest in high returning businesses that generate
operating cash flow growth. In 2015, fuels marketing earnings grew by 11% at constant
currencies, and lubricants earnings by 20% on the same basis, bringing the combined
earnings of these two businesses to over $3 billion.
Across Downstream, we continue to divest non-core assets but are also selectively
investing in growth opportunities.
The simplification and efficiency programmes across the company remain central to our
strategy.
As the metrics in the charts show, we are moving towards our medium-term targets in the
Downstream. In addition to doubling returns, we delivered strong cash flow, driven by
EBITDA growth. We have reset the cost base and taken a number of decisive portfolio
actions. Our competitiveness has also improved as you can see in the bottom right chart.
Continued execution of this strategy is expected to lead to further growth in underlying
performance and make the business even more resilient to environmental volatility.
30

31
Turning to simplification and efficiency in the Downstream. Today, I can tell you that we
have increased our cost efficiencies target to $2.5 billion per year compared to the $1.6
billion target we set this time last year. We plan to achieve this annual target by the end of
next year, 12 months earlier than originally planned.
We‘ve made material progress in 2015 with cash costs more than 15% lower than the
same period in 2014. This is from three broad activity streams.
Firstly, we continue to right-size the organisation. For example, during 2015, we have:
− Simplified our fuels organisation, reducing the number of businesses from nine to
three;
− Streamlined our lubricants business and have started restructuring petrochemicals;
and
− Taken actions in our head office which have led to around a 40% reduction in costs
through the streamlining and elimination of activities.
Secondly, through site-by-site improvement programmes, we are driving manufacturing
efficiency in refining and petrochemicals.
And thirdly, our focus on third party spend has resulted in significant cost reductions
compared to last year, despite the ongoing inflationary pressures, that are evident in
Downstream markets.
Together, these programmes are expected to result in more than 5,000 employee and
agency contractor roles being removed in the Downstream by the end of next year,
compared to the end of 2014; with more than 2,000 of these already occuring during 2015.
So, 2015 has been a year of significant strategic progress and some very material
performance delivery for the Downstream segment. This has reset our competitive position

and established a strong underlying business.
The focus for Downstream going forward will be to continue delivering
underlying performance improvement and growth and, in doing so, further
improve the resilience of the business to environmental volatility.
31

32
In summary (and thank you for your patience) we are moving rapidly down the path of
resetting the company for a sustained period of lower oil prices. I am confident we are
doing the right things. We have made solid progress in 2015 and there is considerable
momentum behind our work to transform BP for the current environment. I know this
company has the focus and the grit to emerge from these current times smarter, more
evolved and better adapted than ever to successfully navigate the future, whatever it may
bring.
We expect 2016 to be tough. But we do not expect oil prices to remain lower forever. We
have set a very clear course for the medium term. It is based around a financial framework
that rebalances organic sources and uses of cash by 2017 in a $60-world. This is
underpinned by disciplined management of our capital spending and continued rebasing of
cash costs. We will work to lower this balance point as we capture the impacts of deflation
at the prevailing oil price. But we are also clear that we will not compromise safety or the
enduring principles that drive our business. Nor will we compromise our platform for future
growth.
Our aim is always to grow free cash flow and distributions over the long term and this will
continue to guide our decisions. We believe we have the right portfolio, the right projects
and the right investment framework to do this.
And our resolve is strong. While they are undoubtedly painful, tough times improve us; they
make us harder and leaner, sharper and more focused.
And on that note, thank you for listening, and we’ll now turn it over to your questions.

33


