78
…helping communities protect themselves from polluting energy and waste technologies

…helping communities protect
themselves from polluting energy and waste technologies

Biomass / Waste Incineration
www.EnergyJustice.net/incineration/
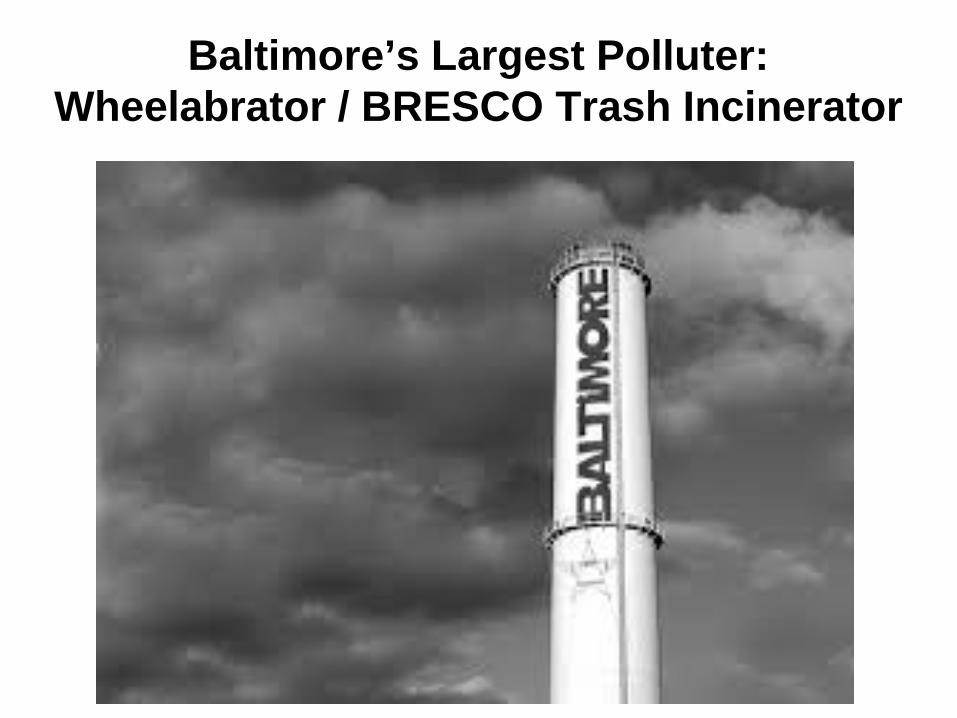
Baltimore’s Largest Polluter: Wheelabrator / BRESCO Trash Incinerator

Baltimore’s Largest Polluter: Wheelabrator / BRESCO Trash Incinerator
• Burns 2,250 tons of trash per day – Largest of two remaining trash incinerators in MD – 10th largest in the nation
• Responsible for 36% of all stationary sources of air pollution in Baltimore in 2014
• Fined for mercury violations in 2009 • Contract expires in 12/31/2021

Baltimore’s Largest Polluter: Wheelabrator / BRESCO Trash Incinerator
Among trash incinerators in the U.S., it’s 10th largest, but worse than average for some pollutants:
• #2 in formaldehyde • #3 in sulfur dioxide (SO2) • #3 in lead • #6 in hydrochloric acid (HCl) • #6 in hydrofluoric acid (HF) • #6 in chromium (III) • #8 in chromium (VI) • #8 in benzo(a)pyrene
Source: 2014 EPA National Emissions Inventory

Baltimore’s Largest Polluter: Wheelabrator / BRESCO Trash Incinerator
In 2014, Wheelabrator Baltimore was… • #1 in mercury (89% of total: 60 pounds!) [2011 data] • #1 in benzo[a]pyrene (84% of total) • #1 in hydrochloric acid (83% of total) • #1 in sulfur dioxide (SO2) (80% of total) • #1 in chromium VI (80% of total) • #1 in lead (78% of total) • #1 in nitrogen oxides (NOx) (57% of total)
– Equal to half the cars or half the trucks in the city!
• #1 in formaldehyde (33% of total) • #3 in carbon monoxide (CO) • #3 in particulate matter (PM10 and PM 2.5)
Source: 2014 EPA National Emissions Inventory

Baltimore’s Largest Polluter: Wheelabrator / BRESCO Trash Incinerator
In all of Maryland (520 facilities), Wheelabrator is the 12th largest air polluter, including… • #4 in benzo[a]pyrene • #4 in hydrochloric acid • #4 in mercury • #6 in lead • #9 in sulfur dioxide (SO2) • #10 in chromium (VI) • #11 in nitrogen oxides (NOx) • #11 in hydrofluoric acid • #12 in nickel • #16 in formaldehyde • #19 in fine particulate matter (PM2.5)
Source: 2014 EPA National Emissions Inventory

Baltimore’s Largest Polluter: Wheelabrator / BRESCO Trash Incinerator
Where BRESCO’s waste came from in 2015:
SOURCE TONS % Baltimore City 429,314 59% Baltimore 263,098 36% Anne Arundel 19,128 3% Howard 11,889 2% St. Mary's 5,800 1% Prince George's 1,167 0% Frederick 216 0% Montgomery 48 0% PENNSYLVANIA 42 0%
TOTAL 730,702 tons/year 2,002 tons/day average = 89% of their 2,250 ton/day capacity

Baltimore City’s Trash
In 2015, Baltimore City Municipal Solid Waste went to:
% TONS FACILITY 64% 429,314 Wheelabrator Baltimore (BRESCO) incinerator (Baltimore City) 14% 94,325 Quarantine Road Landfill (in Hawkins Point, Baltimore City) 10% 65,720 Western Acceptance Facility (Baltimore County) 8% 54,574 Northwest Transfer Station (Baltimore County) 2% 10,929 Central Acceptance Facility (Baltimore County) 1% 5,792 Eastern Sanitary Landfill (Baltimore County) 1% 5,001 Ameriwaste Transfer Station (Baltimore County) [Small amounts (under 0.5%) went to two other places.] TOTAL WASTE FROM BALTIMORE CITY: 673,272 tons (1,845 tons/day)

Baltimore County’s Trash
In 2015, Baltimore County Municipal Solid Waste went to:
% TONS FACILITY 28% 263,098 Wheelabrator Baltimore (BRESCO) incinerator (Baltimore City) 25% 239,232 Central Acceptance Facility (Baltimore County) 21% 196,055 Eastern Sanitary Landfill (Baltimore County) 14% 130,205 Western Acceptance Facility (Baltimore County) 4% 37,862 Harford County Incinerator [Now closed / decommissioned] 4% 36,073 Roll-off Express 3% 32,771 Annapolis Junction Transfer Station 1% 6,749 Ameriwaste Transfer Station (Baltimore County) [Small amounts (under 0.5%) went to two other places.] TOTAL WASTE FROM BALTIMORE COUNTY: 943,866 tons (2,586 tons/day)

Curtis Bay Energy:
The Nation’s Largest Medical Waste Incinerator
(burning about 70 tons/day
in Hawkins Point)

Curtis Bay Energy: 2013 Waste Sources (25,368 tons [69.5 tons/day]):
STATE TONS % Maryland 8,644 34% Pennsylvania 7,498 30% New Jersey 1,998 8% California 1,954 8% New York 1,162 5% Massachusetts 1,066 4% North Carolina 731 3% Canada 656 3% Delaware 515 2% Virginia 338 1% Washington, DC 265 1% Georgia 232 1% Wisconsin 122 0% Arizona 50 0% South Carolina 40 0% Illinois 37 0% Rhode Island 30 0% Kentucky 30 0%
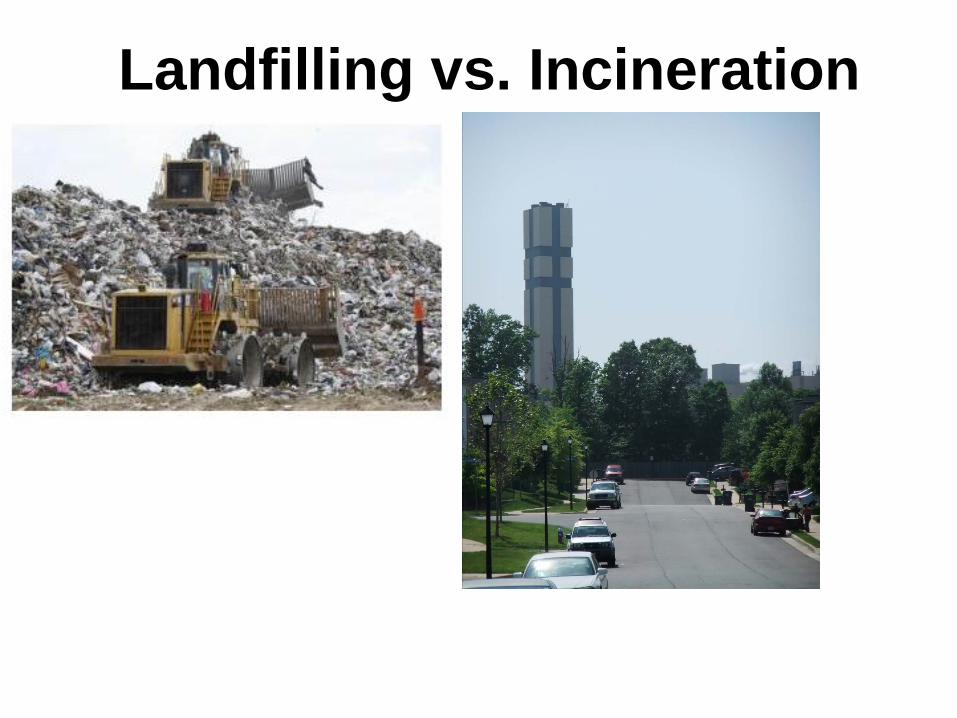
Landfilling vs. Incineration

Landfilling vs. Incineration
…and Ash Landfilling

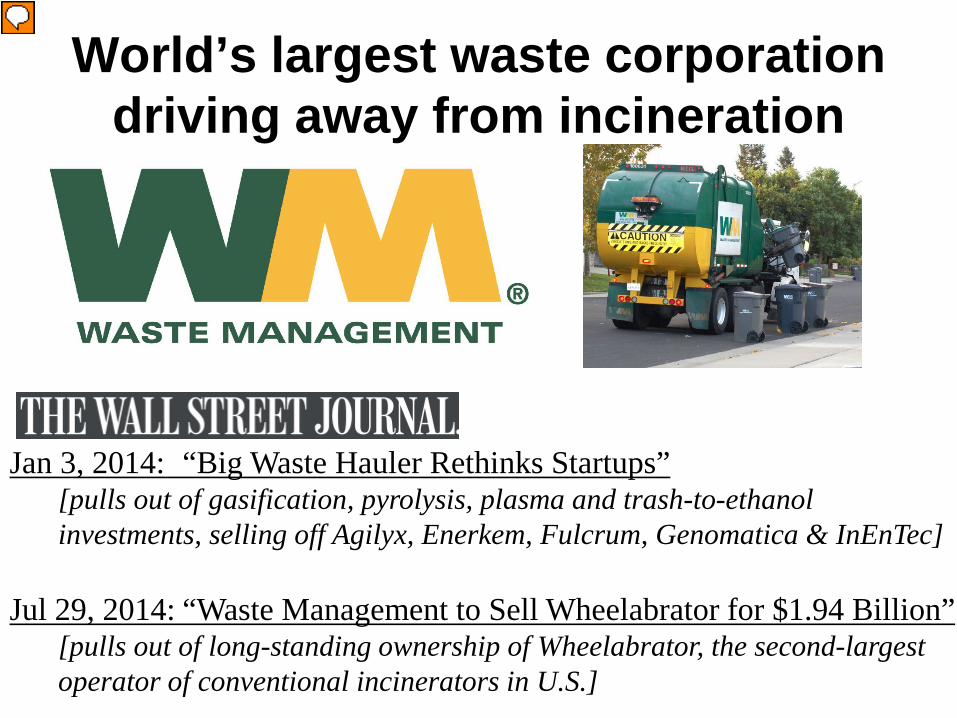
World’s largest waste corporation driving away from incineration
Jan 3, 2014: “Big Waste Hauler Rethinks Startups” [pulls out of gasification, pyrolysis, plasma and trash-to-ethanol investments, selling off Agilyx, Enerkem, Fulcrum, Genomatica & InEnTec]
Jul 29, 2014: “Waste Management to Sell Wheelabrator for $1.94 Billion” [pulls out of long-standing ownership of Wheelabrator, the second-largest operator of conventional incinerators in U.S.]

• Garbage-in, Garbage-out.
• Nothing is 100%.
• Small amounts matter, especially if they're a small % of a BIG number.
• Over 99% of incinerator proposals are defeated by grassroots opposition or fail on their own.
• If incineration is the answer, someone asked the wrong question
• Incinerators are habitual law-breakers and Covanta is notorious
Basic Lessons
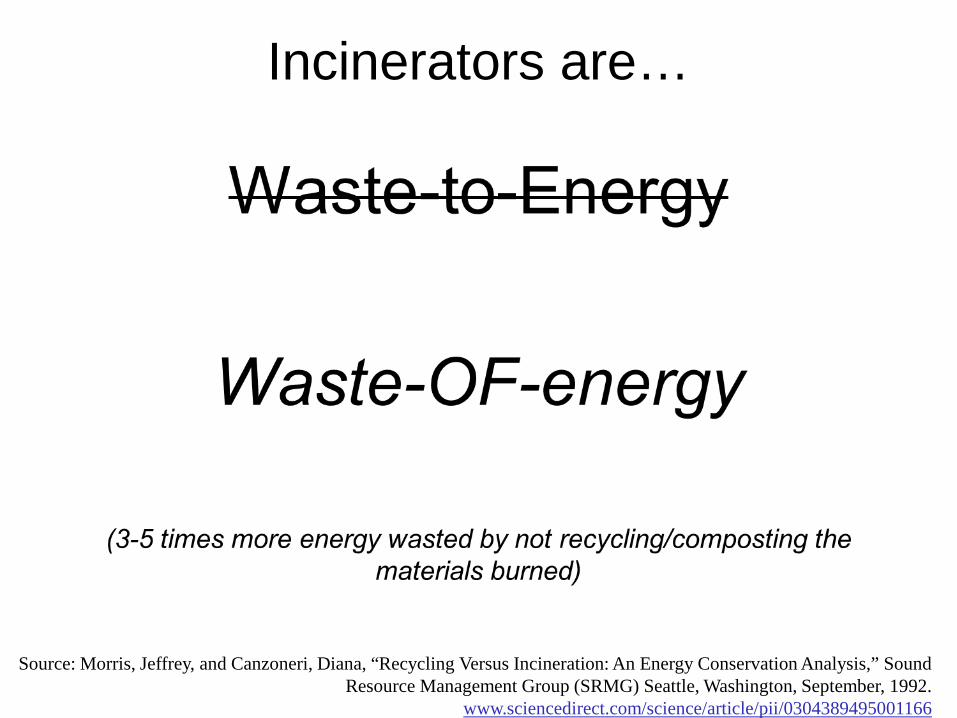
• Destroys materials / net energy issues – “waste-OF-energy” – 3-5 times more energy
saved by recycling/composting • Environmental racism • Global warming contribution worse than
zero waste solutions • Makes the problem "invisible" rather than
making it very visible so that unsustainably-produced products can be properly dealt with
Bigger Problems with Incinerators

Incinerators are…
Incinerators are…
Source: Morris, Jeffrey, and Canzoneri, Diana, “Recycling Versus Incineration: An Energy Conservation Analysis,” Sound Resource Management Group (SRMG) Seattle, Washington, September, 1992.
www.sciencedirect.com/science/article/pii/0304389495001166

“Waste-to-energy is an additional capital cost. That is not in dispute, compared to a landfill... compared to a landfill, which is a less capital-intense structure – it is more expensive. If you had a landfill next to a
waste-to-energy facility, then almost in every case, you would think the landfill is going to
be cheaper.”
Most Expensive Way to Manage Waste
Ted Michaels, President, Energy Recovery Council, March 18, 2013 testimony before Washington, DC City Council

Most Expensive Way to Manage Waste
Source: National Solid Waste Management Association 2005 Tip Fee Survey, p4. www.environmentalistseveryday.org/docs/Tipping-Fee-Bulletin-2005.pdf

Most Expensive Way to Make Energy
Source: "Updated Capital Cost Estimates for Utility Scale Electricity Generating Plants," Energy Information Administration, April 2013, p.6, Table 1. Full report here: www.eia.gov/forecasts/capitalcost/pdf/updated_capcost.pdf

Worst Way to Create Jobs


Toxic Air Emissions are… • Dioxins / furans (28 times as much) • Mercury (6-14 times as much) • Lead (6 times as much) • Nitrogen Oxides (NOx) (3.2 times as much) • Carbon Monoxide (CO) (1.9 times as much) • Sulfur Dioxide (SO2) (20% worse) • Carbon Dioxide (CO2) (2.5 times as much)
Incineration Worse than Coal
www.energyjustice.net/incineration/worsethancoal

Incineration Worse than Coal
Ratios of pollution levels emitted per unit of energy produced by U.S.
coal power plants and trash incinerators

Global Warming Pollution Smokestack CO2 Emissions from U.S. Power Plants
Data is in pounds of CO2 per unit of energy produced
(lbs/MWh)
Source: U.S. EPA Emissions &
Generation Resource Integrated
Database (eGRID) v.9, released
2/24/2014 (2010 data)

“a waste-to-energy plant is designed to manage solid
waste... the electricity output is a secondary function”
Incinerator, Not a Power Plant
Ted Michaels, President, Energy Recovery Council, March 18, 2013 testimony before Washington, DC City Council

Dioxin Facts • Dioxins and furans are the most toxic
chemicals known to science. They are highly toxic even in miniscule amounts.
• Dioxins cause infertility, learning disabilities, endometriosis, birth defects, sexual reproductive disorders, damage to the immune system, cancer and more.
• 93% of dioxin exposure is from eating meat and dairy products.
www.ejnet.org/dioxin/
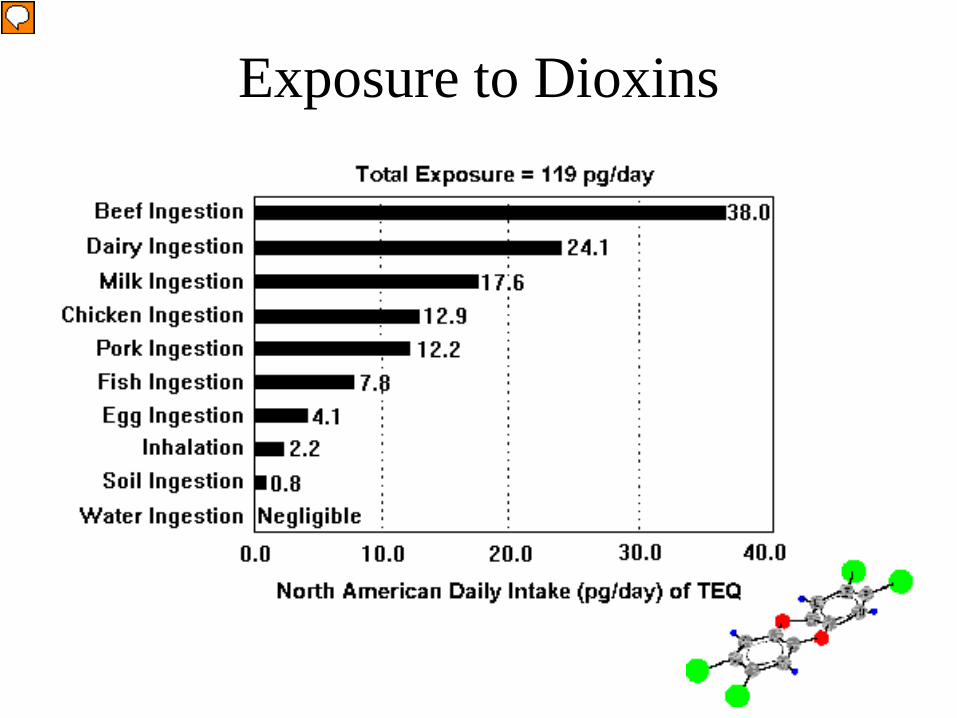
Exposure to Dioxins

How to make dioxin • Dioxins are created by burning
hydrocarbons with chlorine in the presence of oxygen.
• Dioxin emissions increase when: – More chlorine is in the fuel/waste stream – Certain metal catalysts are present (Copper,
Iron, Zinc…) – The gases stay in a low temperature range
(200-450o C)

Continuous Emissions Monitors
www.ejnet.org/toxics/cems

• Only generally used for 3 pollutants: sulfur oxides (SOx), nitrogen oxides (NOx) and carbon monoxide (CO) plus opacity, oxygen and temperature
• Technology now exists to continuously monitor:
Ammonia (NH4)
Carbon Dioxide (CO2)
Hydrogen Sulfide (H2S)
Acid Gases: Sulfuric Acid (H2SO4) Hydrofluoric Acid (HF) Hydrochloric Acid (HCl)
Products of Incomplete Combustion (PICs): Dioxins & Furans Polycyclic Aromatic Hydrocarbons (PAHs) Volatile Organic Compounds (VOCs)
Particulate Matter (PM)
Metals: Antimony (Sb) Arsenic (As) Barium (Ba) Cadmium (Cd) Chromium (Cr) Lead (Pb) Manganese (Mn) Mercury (Hg) Silver (Ag) Nickel (Ni) Zinc (Zn) …and more
Continuous Emissions Monitors
www.ejnet.org/toxics/cems

• Incinerators still require landfills for their toxic ash • Choice is NOT landfill vs. incinerator, but:
Incineration Worse than Landfills
landfill
vs.
incinerator AND a smaller, more toxic landfill

• Incinerators still require landfills for their toxic ash • Choice is NOT landfill vs. incinerator, but:
Incineration Worse than Landfills
landfill
vs.
incinerator AND a smaller, more toxic landfill
OR…
Zero Waste and minimal landfilling
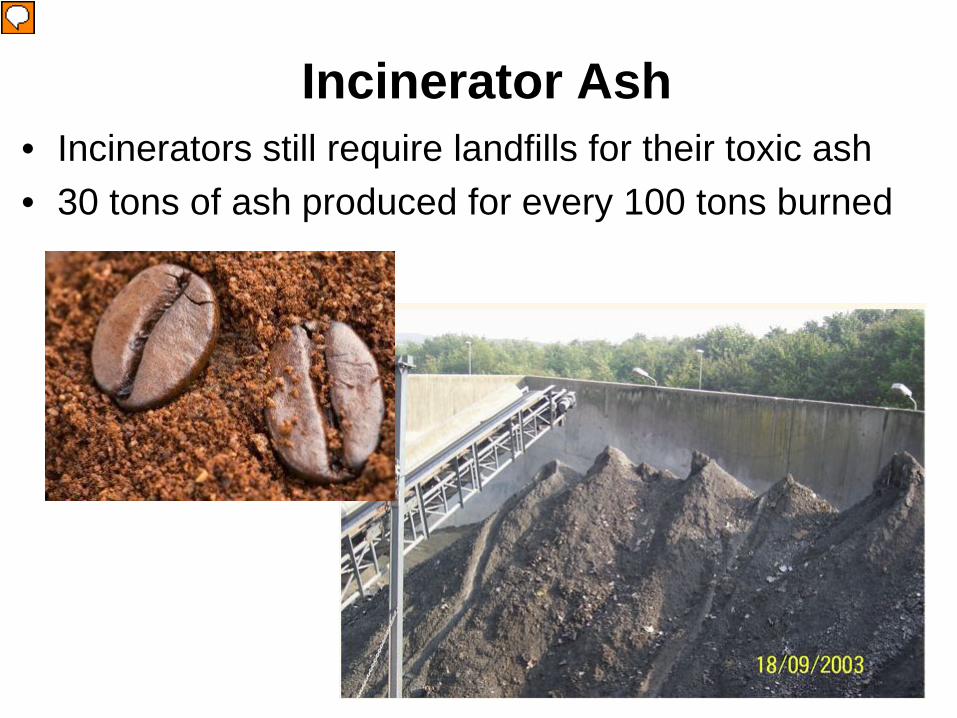
• Incinerators still require landfills for their toxic ash • 30 tons of ash produced for every 100 tons burned
Incinerator Ash
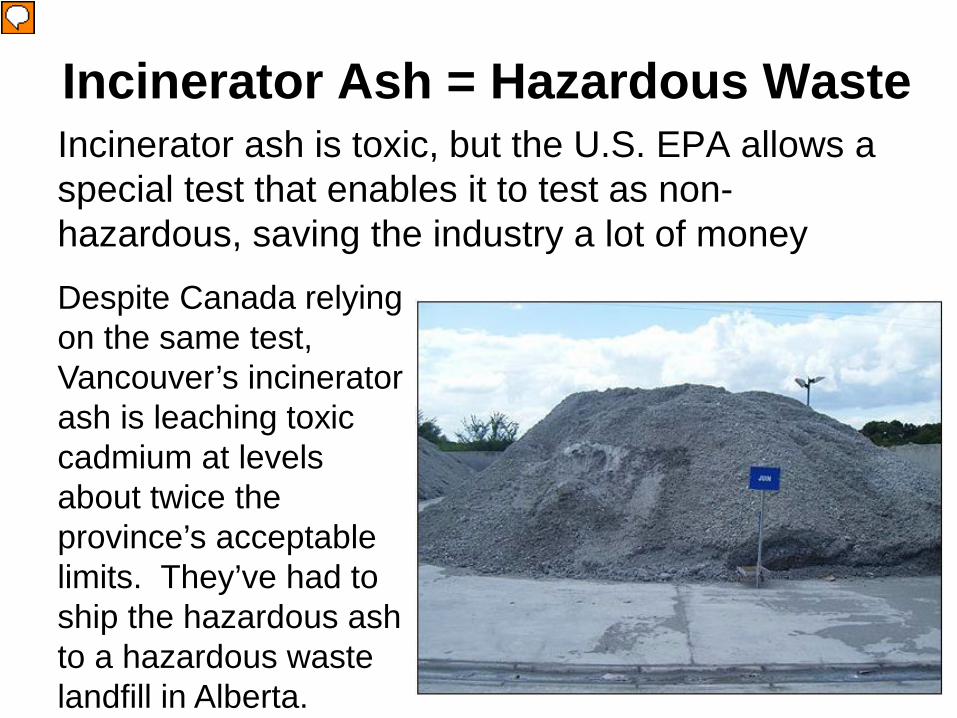
Incinerator ash is toxic, but the U.S. EPA allows a special test that enables it to test as non-hazardous, saving the industry a lot of money
Incinerator Ash = Hazardous Waste
Despite Canada relying on the same test, Vancouver’s incinerator ash is leaching toxic cadmium at levels about twice the province’s acceptable limits. They’ve had to ship the hazardous ash to a hazardous waste landfill in Alberta.

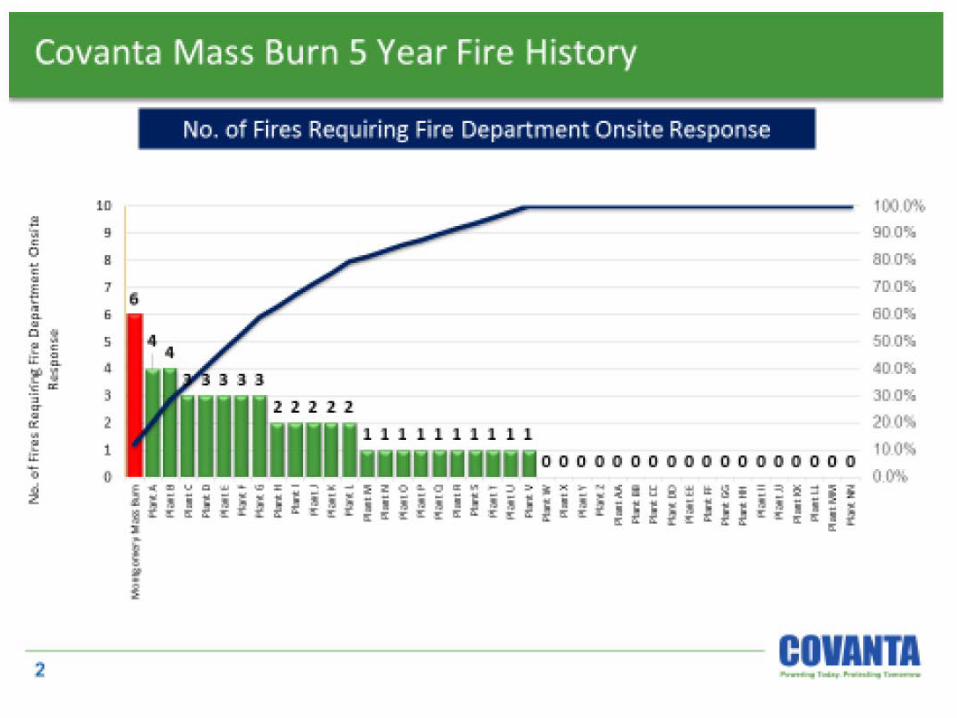
“In our industry, and in the waste industry as a whole, fires are becoming more prevalent.” -Mark Harlacker – Covanta’s Commercial Business Director for Mid-Atlantic Region, 4/26/2017 testimony before DC City Council
Trash Incinerator Health Impacts
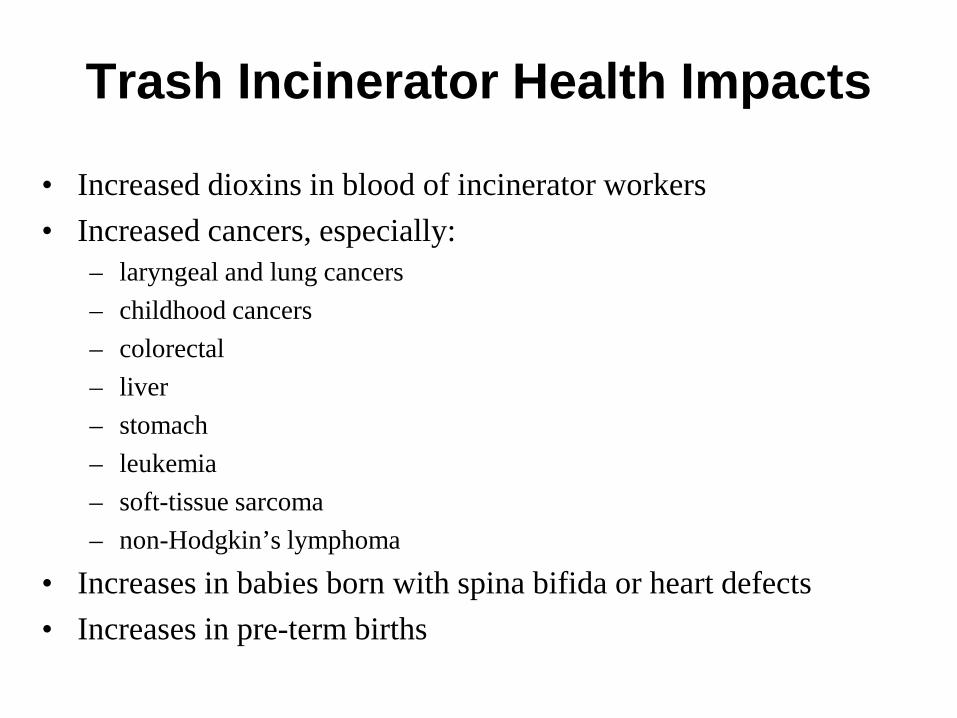
Trash Incinerator Health Impacts
• Increased dioxins in blood of incinerator workers • Increased cancers, especially:
– laryngeal and lung cancers – childhood cancers – colorectal – liver – stomach – leukemia – soft-tissue sarcoma – non-Hodgkin’s lymphoma
• Increases in babies born with spina bifida or heart defects • Increases in pre-term births

Medical Professionals Oppose Incineration National: • American Academy of Family Physicians • American Lung Association • British Society for Ecological Medicine
State / regional: • American Lung Association in Florida • American Lung Association in Georgia • American Lung Association in Massachusetts • American Lung Association of New England • Florida Medical Association • Massachusetts Breast Cancer Coalition • Massachusetts Medical Society • North Carolina Academy of Family Physicians • Washington State Medical Association
Local • Erie County Medical Society
(Pennsylvania) • Capital Medical Society (Tallahassee,
Florida) • Lane County Health Advisory
Committee (Oregon) • Physicians for Social Responsibility /
Pioneer Valley (Massachusetts)
Copies of all of these groups’ statements are available online at www.energyjustice.net/biomass/health/
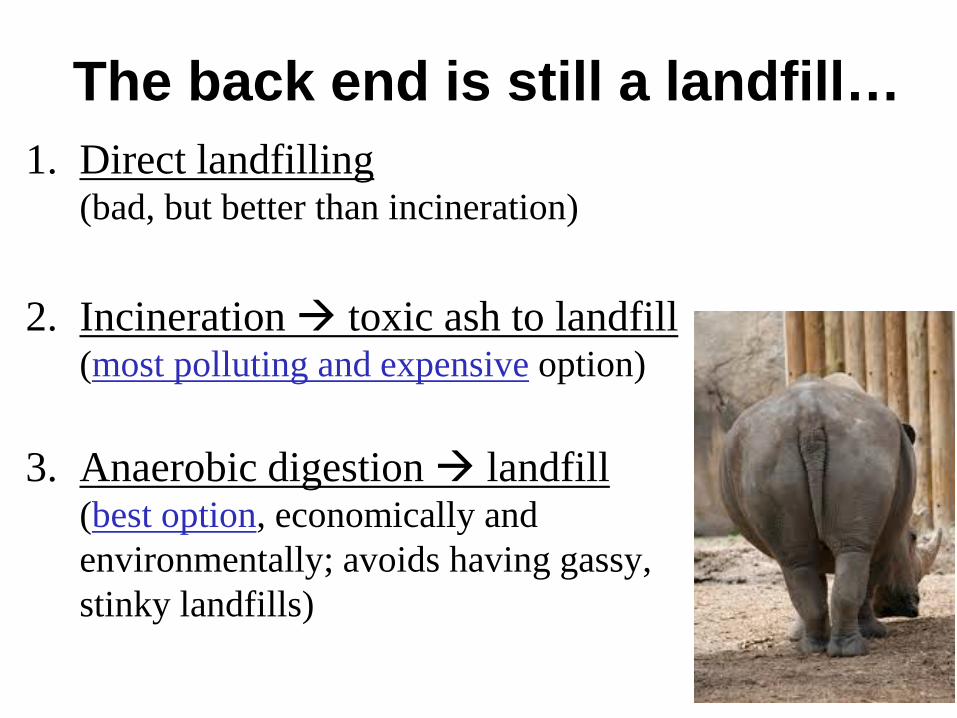
1. Direct landfilling (bad, but better than incineration)
2. Incineration toxic ash to landfill (most polluting and expensive option)
3. Anaerobic digestion landfill (best option, economically and environmentally; avoids having gassy, stinky landfills)
The back end is still a landfill…

1. Direct landfilling leachate (toxins) air emissions (toxins, methane, odors)
2. Incineration toxic ash to landfill leachate (even more toxins) air emissions from ash blowing off site (toxins)
3. Anaerobic digestion landfill odor, leachate and air emissions highly minimized
Impacts of Each Major Option

Zero Waste Jobs
Deconstruction Crew, Second Chance, Baltimore, MD. Photo Credit: C. Seldman

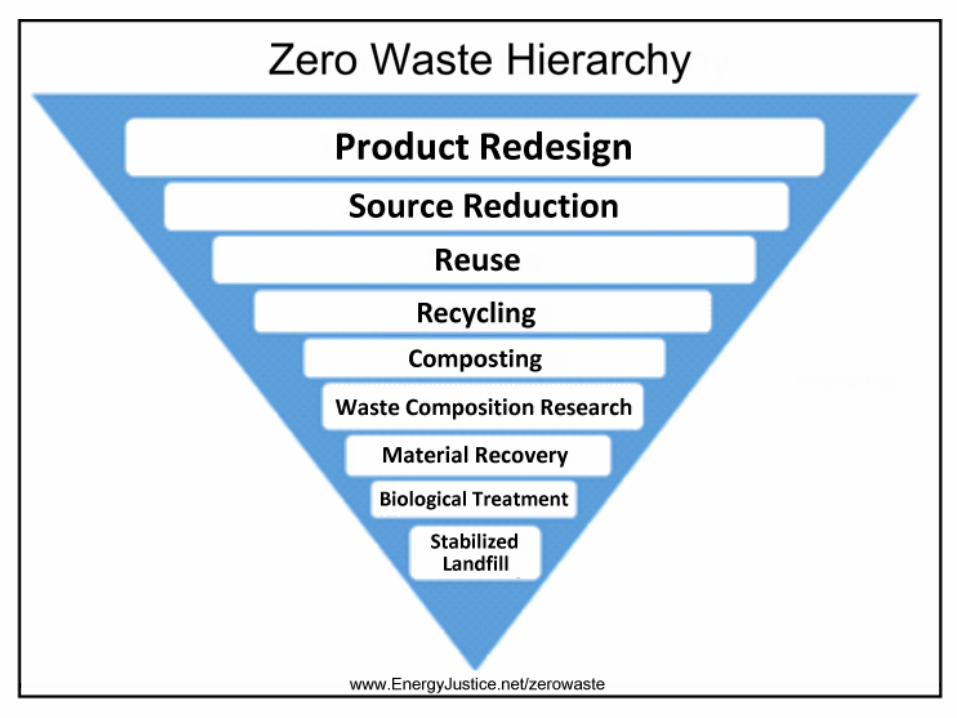

Zero Waste Hierarchy • Rethink / Redesign • Reduce • Reuse • Source Separate:
– Recycle (multi-stream) – Compost – Waste
• Research to see what is left, and encourage redesign • Recovery: mechanically remove additional recyclables • Anaerobically digest, then aerobically compost residuals • Stabilized (digested) residuals to landfill
www.energyjustice.net/zerowaste


“Zero Waste is a goal that is ethical, economical, efficient and visionary, to guide people in changing their lifestyles and practices to emulate sustainable natural cycles, where all discarded materials are designed to become resources for others to use.
Zero Waste means designing and managing products and processes to systematically avoid and eliminate the volume and toxicity of waste and materials, conserve and recover all resources, and not burn or bury them.
Implementing Zero Waste will eliminate all discharges to land, water or air that are a threat to planetary, human, animal or plant health.”
What is Zero Waste?
Source: Zero Waste International Alliance, www.zwia.org
Zero waste is recognized as achieving 90% or greater diversion from landfills and incinerators. The goal is to get as close to zero as possible, without getting caught up on the impossibility of actually hitting zero. “Zero waste” is like “zero drug tolerance” or “zero accidents in the workplace” standards. Zero is the goal, and the right policies will get you as close as you can get.
If you’re not for Zero Waste, how much waste are you for?

Textiles7% Glass
6%
Metals9%
Other materials8%
Plastics17%Food scraps
21%
Yard trimmings8%
Wood8%
Paper and paperboard
16%
Money Thrown Away $11.4 billion worth of recyclable packaging wasted (sent to landfills and incinerators) in 2010
Source: “Unfinished Business: The Case for Extended Producer Responsibility,” 2012 Report, www.asyousow.org/sustainability/eprreport.shtml


Ohio State Reported Achieving Zero Waste Last Fall
On November 3, 2012, Ohio State University achieved zero waste at its Ohio Stadium – diverting a record 98.2% of its total generated waste. Total attendance was 105,311.
At its October 20th home game, OSU diverted 94.4%. That's everything from food scraps to compostable
packaging to recyclables. Source: http://sustainability.osu.edu

Otter Lake Landfill • Halifax Regional Municipality, Nova Scotia, Canada • 140,000 tpy (50,000 residential) • Front-end Processing (FEP) facility • Magnets and protected workers remove recyclables • Protected city workers pull out any recyclables and toxics • Dirty organics sent to end of belts with nonrecyclables
and sent to a Waste Stabilization Facility (WSF) where it is shredded and placed into concrete troughs to be mechanically turned and aerated for 15 days
• Stabilized material is then sent to landfill • 56% diversion from incineration and landfilling • 7 times as many jobs as incineration or direct landfilling

Why Local Ordinances? • smaller level more easily influenced
– best in municipalities; many states don’t have them • keeps the fight where the community people
power is – keeps it political
• play by own rules • inexpensive • legal bills socialized
– legal liability insurance

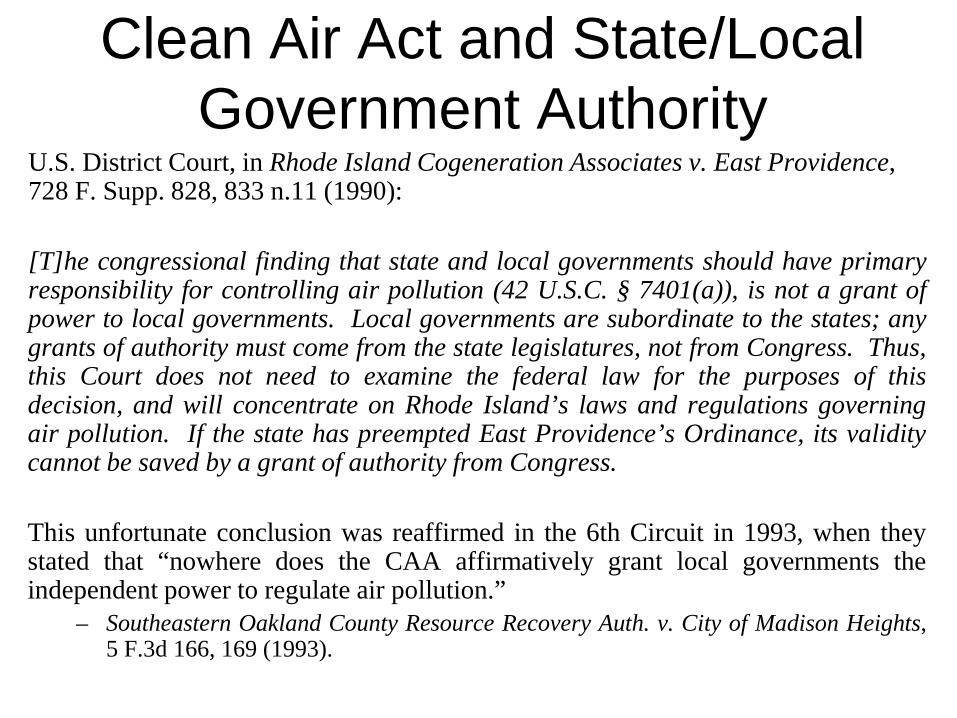
Clean Air Act and State/Local Government Authority
§ 7416. Retention of State authority
Except as otherwise provided in sections 119(c), (e), and (f) (as in effect before the date of the enactment of the Clean Air Act Amendments of 1977), 209, 211(c)(4), and 233 (preempting certain State regulation of moving sources) nothing in this Act shall preclude or deny the right of any State or political subdivision thereof to adopt or enforce (1) any standard or limitation respecting emissions of air pollutants or (2) any requirement respecting control or abatement of air pollution; except that if an emission standard or limitation is in effect under an applicable implementation plan or under section 111 or 112, such State or political subdivision may not adopt or enforce any emission standard or limitation which is less stringent than the standard or limitation under such plan or section.
Clean Air Act and State/Local Government Authority
U.S. District Court, in Rhode Island Cogeneration Associates v. East Providence, 728 F. Supp. 828, 833 n.11 (1990): [T]he congressional finding that state and local governments should have primary responsibility for controlling air pollution (42 U.S.C. § 7401(a)), is not a grant of power to local governments. Local governments are subordinate to the states; any grants of authority must come from the state legislatures, not from Congress. Thus, this Court does not need to examine the federal law for the purposes of this decision, and will concentrate on Rhode Island’s laws and regulations governing air pollution. If the state has preempted East Providence’s Ordinance, its validity cannot be saved by a grant of authority from Congress. This unfortunate conclusion was reaffirmed in the 6th Circuit in 1993, when they stated that “nowhere does the CAA affirmatively grant local governments the independent power to regulate air pollution.”
– Southeastern Oakland County Resource Recovery Auth. v. City of Madison Heights, 5 F.3d 166, 169 (1993).

Maryland Authority Md. ENVIRONMENT Code Ann. § 2-104
ENVIRONMENT TITLE 2. AMBIENT AIR QUALITY CONTROL SUBTITLE 1. DEFINITIONS; GENERAL PROVISIONS § 2-104. Powers of political subdivisions (a) Adopting ordinances, rules, or regulations. -- (1) Except as provided in this section, this title does not limit the power of a political subdivision to adopt ordinances, rules, or regulations that set emission standards or ambient air quality standards. (2) A political subdivision may not adopt any ordinance, rule, or regulation that sets an emission standard or ambient air quality standard less stringent than the standards set by the Department under this title. (b) Requesting rules or regulations. -- The governing body of any political subdivision may ask the Department to adopt rules and regulations that set more restrictive emission standards or ambient air quality standards in that political subdivision.

State-to-Local Air Pollution Savings Clauses
Green = Local laws allowed Yellow = In-between (allowed only in certain areas or subject to state approval)
Red = Local laws preempted Blue = Local air regulation programs allowed
Kulpmont Borough, Pennsylvania
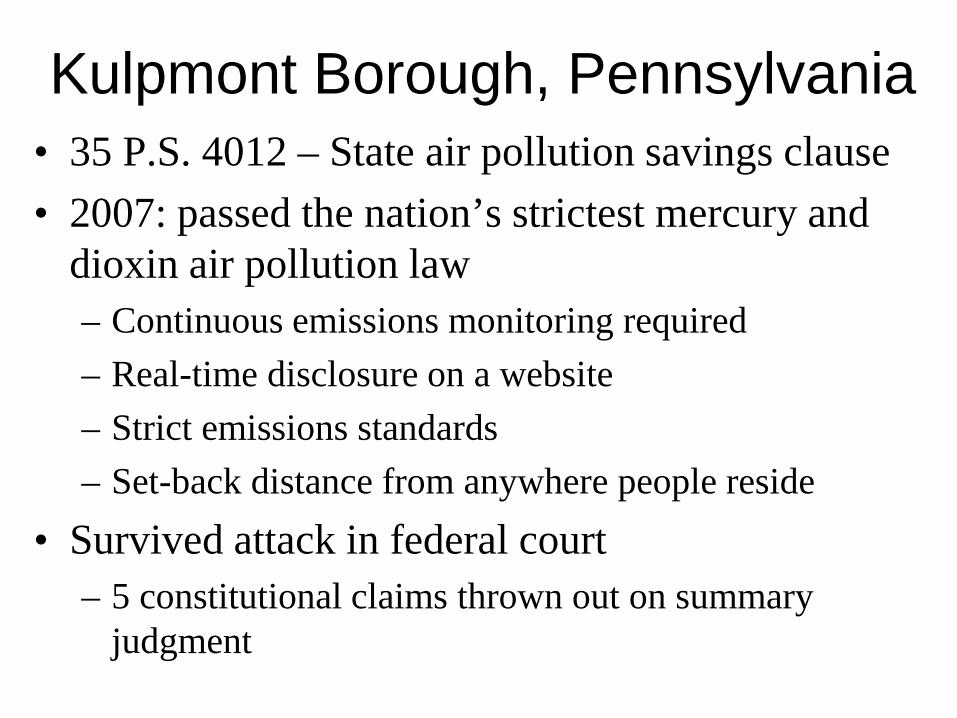
Kulpmont Borough, Pennsylvania • 35 P.S. 4012 – State air pollution savings clause • 2007: passed the nation’s strictest mercury and
dioxin air pollution law – Continuous emissions monitoring required – Real-time disclosure on a website – Strict emissions standards – Set-back distance from anywhere people reside
• Survived attack in federal court – 5 constitutional claims thrown out on summary
judgment

For more information…
www.EnergyJustice.net/ordinances/
Further info on continuous emissions monitoring (one of our favored tactics with local air ordinances):
www.ejnet.org/toxics/cems/

• Incineration: – www.EnergyJustice.net/incineration – www.EnergyJustice.net/biomass – www.EnergyJustice.net/tires – www.no-burn.org – www.GreenAction.org
• Landfills and Landfill Gas Burning: – www.EnergyJustice.net/lfg – www.ejnet.org/landfills – www.beyondlandfilling.org
• Zero Waste: – www.EnergyJustice.net/zerowaste – www.ilsr.org/initiatives/waste-to-wealth – www.grrn.org/zerowaste – www.zwia.org
For more Info…

MD Renewable Portfolio Standard • One of the dirtiest in the nation • 2006-2015: Maryland ratepayers paid $125
million to subsidize paper mills, trash incinerators, tree burners, and landfills
• 2015: $47 million to dirty energy & rising • 77% of the “Tier I” dirty energy from out of state • 59% of the “Tier I” renewable energy serving
Maryland that is actually produced IN the state of Maryland comes from the state’s two trash incinerators – sources dirtier than coal burning.

(1) solar energy, including energy from photovoltaic technologies and solar water heating systems;
(2) wind; (3) qualifying biomass; (4) methane from the anaerobic decomposition of organic materials in a landfill
or wastewater treatment plant; (5) geothermal, including energy generated through geothermal exchange
from or thermal energy avoided by, groundwater or a shallow ground source;
(6) ocean, including energy from waves, tides, currents, and thermal differences; (7) a fuel cell that produces electricity from a Tier 1 renewable source under item
(3) or (4) of this subsection; (8) a small hydroelectric power plant of less than 30 megawatts in capacity that is
licensed or exempt from licensing by the Federal Energy Regulatory Commission;
(9) poultry litter-to-energy; (10) waste-to-energy; (11) refuse-derived fuel; and (12) thermal energy from a thermal biomass system.
MD Tier I Renewable Energy Defined:
Bold = Has to be MD-based Red = Combustion technology

Maryland’s “Renewable” Energy Mix (by percentage)
Dirty energy was a majority in every year except 2013 and 2016, when it fell to 44% and 45%, respectively.
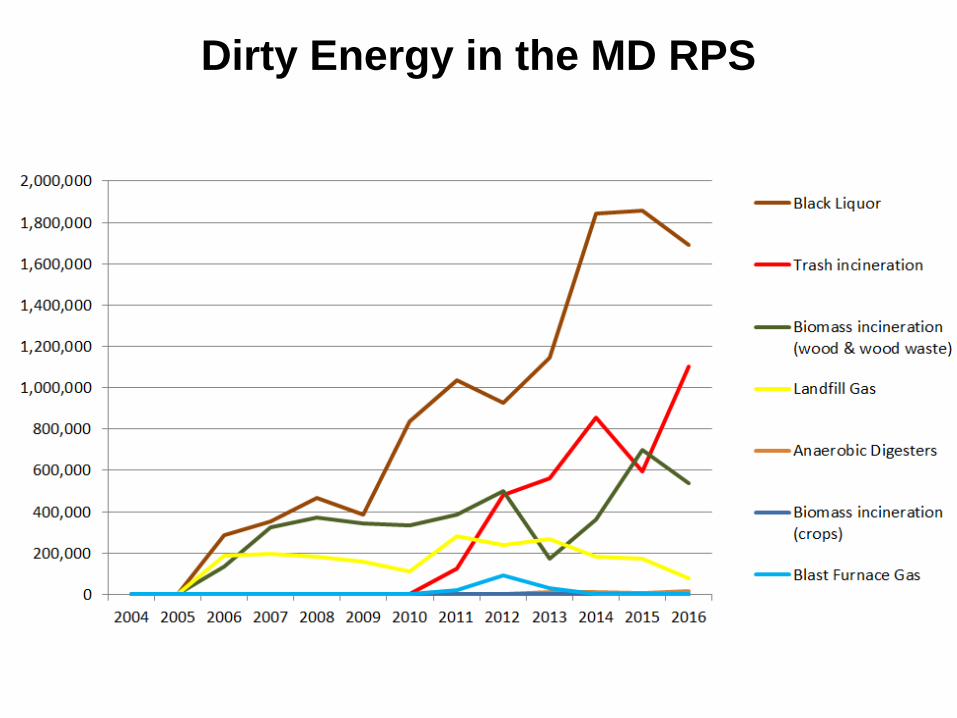
Dirty Energy in the MD RPS

Where Maryland’s “Renewable” Energy Comes From:

Where Maryland’s “Renewable” Energy Came From in 2016
Source In-State Out-of-State Wind: 1% 99% Solar: 100% 0% Geothermal: 100% 0% Hydroelectric dams: 2% 98% Biomass incineration (wood): 0% 100% Biomass incineration (crops): 0% 100% Black Liquor burning (paper mills): 4% 96% Landfill Gas Burning: 34% 66% Trash incineration: 73% 27% Anaerobic digester gas: 0% 100% TOTAL: 18% 82%

MD Renewable Portfolio Standard • A better way to grow wind & solar… Since
dirty energy is nearly half of the mandated renewable energy mix in recent years, removing these sources doubles the space for wind, solar and hydro.
• Those who propose doubling the RPS goal risk a continued growth of subsidies to dirty energy sources. Maintaining annual dirty energy subsidies helps keep these facilities open, such as Maryland’s remaining trash incinerators that we’re organizing to close.

RPS Cleanup Bill
Cuts out 97% of the combustion sources from the RPS:
1) Immediately limit eligibility of combustion sources to those facilities currently in the RPS.
2) Make trash incineration and refuse-derived fuel credits ineligible by 2019.
3) Make out-of-state combustion sources ineligible by 2020.

Mike Ewall, Esq. Founder & Director
215-436-9511


