Part number: NEMM026_Rev_L Last updated: June 2018 Copyright 2007 - 2018 All rights reserved HE/LX Analysis Software Operator’s Manual Basic Level added feature Sleep-Apnea Software version: 6.0b
Transcript
Part number: NEMM026_Rev_LLast updated: June 2018Copyright 2007 - 2018All rights reserved
HE/LX Analysis Software Operator’s Manual
Basic Level
added feature Sleep-Apnea Software version: 6.0b
Copyright 2007 - 2018 NorthEast Monitoring, Inc. All rights reserved.
The HE/LX Analysis software has been developed by NorthEast Monitoring, Inc.
NorthEast Monitoring is an FDA Registered Facility, number 1224919, that follows all FDA CGMP Manufacturing Practices.
The HE/LX Analysis software has FDA 510(k) Market Approval Number K930564 and K081861.
Microsoft Windows 7 and Windows 10 are registered trademarks of Microsoft Corp.
Java software is developed by Oracle Corporation.
Adobe Acrobat Reader is a registered trademark of Adobe Systems Incorporated.
Special acknowledgement to Bruno Lowagie and Paulo Soares, the authors of iText library. This open source library provided the ability to generate Adobe
Acrobat files. For more information, see www.itextpdf.com
N
1.INTRODUCTION Welcome to NorthEast Monitoring’s HE/LX Analysis Software. Used in conjunction with a North-East Monitoring Digital Holter Recorder - either the DR180 Series, the DR180 Series with the optional OxyHolter cable, the DR200/HE or the DR300 - HE/LX Analysis - Basic allows you to print full disclosure of your patient Holter recordings, to review all of the 3-channel recording on-screen, to confirm or correct all beat labels, to save particular ECG strips of interest, and to review the report information before it’s printed. HE/LX Analysis automatically reads patient data from the recorder’s flashcard - including entries made using the Event button - and saves sample strips of event markers, diary entries, and high and low heart rates. Archiving is also included.
Optional oximetry from the DR180 Series with OxyHolter and 12-lead data from the DR180 Series can also be analyzed, edited, and presented.
Intended Use and Indications for Use
Intended Use:
The HE/LX Analysis software is intended to provide a means for trained operators to analyze long-term ambulatory Electrocardiogram (ECG) recordings [Holter recordings]. The results of this analy-sis are intended to assist the physician in the interpretation of the recorded data. The HE/LX Analysis software is intended to be used by a trained operator under the supervision of a licensed healthcare professional.
Indications for Use:
1. The HE/LX Analysis software is to be used to analyze the data recorded by Holter recorders such as the NorthEast Monitoring DR180+, DR181, DR200/HE and the DR300.
2. Detection of Arrhythmias: The HE/LX Analysis software assists in the evaluation of ECG recordings of cardiac rhythm when intermittent arrhythmias are suspected due to patient symptoms such as palpitations, transient ischemic attacks (TIAs), syncope (fainting), or other such symptoms as determined by the physician.
3. Efficacy of Treatment: The HE/LX Analysis software assists in documenting the effect of pharmacological treatment of known arrhythmias is effective by measuring the frequency and duration of the arrhythmia compared to the frequency and duration prior to treatment.
4. Pacemaker Evaluation: The HE/LX Analysis software assists in the evaluation of the function of implanted pacemakers to insure that the pacemaker is functioning within prescribed limits.
5. Detection of Sleep Apnea: The HE/LX Analysis software assists physicians in determining the need for clinical diagnosis and evaluation by polysomnography based on the patient's score.
The HE/LX Analysis software is to be used only on the order of a physician.
orthEast Monitoring, Inc NEMM026-Rev-L Page 3 of 51
Recorder DefinitionsThe following definitions are applied throughout this manual:
• "DR180 Series" is a DR180+ or DR181 recorder
• "OxyHolter" is a DR180 Series recorder with an optional OxyHolter or OxyHolter/A cable
• "NEMon Holter" is any DR180 Series, DR200/HE or DR300 Holter recorder
System requirementsThe HE/LX Analysis software is to be used to analyze the data recorded by a NEMon Holter recorder. To run the HE/LX Analysis soft-ware, your personal computer must include:
• Microsoft Windows 7 or 10 Operating System
• a processor with a speed of 1 GHz or faster
• at least 2 GB of memory
• at least 10 GB of free space on hard drive
• a monitor with a resolution of at least 1280 by 1024
• a USB flashcard reader (included) or a lap-top PC card slot
• a laser printer is recommended.
Operator knowledgeTo use NorthEast Monitoring HE/LX Analy-sis Software, you must have extensive Holter knowledge that allows you to properly iden-tify sinus and paced rhythms, abnormal rhythms, supraventricular and ventricular arrhythmias, artifact, ST segment changes, and pacemaker failures. In addition, all instructions assume a working knowledge of computers and, specifically a Windows oper-ating system.
Specifications for HE/LX Analysis software
User Specifications:
The software is designed to be used by a trained operator under the supervision of a licensed clinician for the purpose of evaluat-ing the severity of arrhythmia as part of the patient's medical evaluation for treatment.
Software Performance and Specifications:
Arrhythmia Detection:
• Ventricular Premature Beats (VPBs)
• Supraventricular Premature Beats (SVPBs)
Maximum time analyzed:
• 14 days
Presentation of data:
• Standard 25 mm/s for 3-lead and 12-lead recordings
• 50 mm/s available for 12-lead recordings
• All 12-lead data displayed for 12-lead recordings
• For oximetry recordings, SpO2 replaces 3rd channel
• Calibration indication can be provided in reports
ST Segment slope:
• Positive or negative slope indicated based on manual setting of cursors by trained operator
LAN Capability:
Allows multiple users to access a common database of patient data without conflict.
rthEast Monitoring, Inc NEMM026-Rev-L Page 4 of 51
• When at least 4 hours of noise free data is provided will calculate AHI (Apnea-hypopnea index) value.
Reports:
• Capability of labeling all arrhythmias with the operators input
• Modular with ability for operator to select modules to be included
• All reportable values and labels are edit-able by the operator
• Ability to remove and/or add sample ECG strips
Algorithm Performance:
• Based on quality of recorded data*
• The following values were calculated from the "MIT-BIH Arrhythmia Data-base":
•QRS Sensitivity: up to 98%
•QRS Positive Predictivity: up to 99%
•SVPB Sensitivity: up to 65%
•SVPB Positive Predictivity: up to 80%
•VPB Sensitivity: up to 95%
•VPB Positive Predictivity: up to 99%*Noise in a recording can significantly affect the performance of the algorithm, however, all data is presented to the opera-tor and can be presented in the report for review by the physician. Results are no lower than 2% of expected results. The accuracy calculation uses the methodology of 60601-2-47.
The HE/LX Analysis Software Package includes:• HE/LX Analysis Software disk
• License File disk
• Software HASP key
• USB flashcard reader
The HE/LX Analysis software must be installed on your hard drive in order to run. A license file must also be installed. A demo patient has been provided with your soft-ware. Otherwise, you will need a flash.dat file from a Holter recorder to begin analysis.
st Monitoring, Inc NEMM026-Rev-L Page 5 of 51
North
HE/LX Analysis Operator’s Manual - Basic Introduction: The Flashcard
The FlashcardECG data recorded during the Holter period is saved on a removable flashcard. The DR181, DR200/HE and DR300 Holter recorders use an SD flashcard while the DR180+ Holter Recorder uses a compact flashcard. To input the data from the card to the computer system, first remove the flash-card from the recorder, and then insert it into your computer system’s card reader.
Depending on your computer and your card reader, a window may appear acknowledging that a card has been newly inserted and list-ing what files are present on the card. A recording saved by a NorthEast Monitoring recorder is named “flash.dat.” If the window appears, close it.
Into a USB SD card reader
To insert an SD flashcard into the drive, hold the card right-side up, with the missing cor-ner away from you and to the right. Insert the opposite edge into the opening of the card reader. Push the card in gently until it is fully plugged in. Some card readers have a light indicating when a flashcard is properly inserted; if yours does, make sure the light comes on.
Into a USB compact card reader
To insert the compact flashcard into the reader, hold onto the card by the edge with the ridge and insert the opposite edge into the opening of the flashcard slot. Push the card in gently until it is fully plugged in. Some card readers have a light indicating when a flashcard is properly inserted; if yours does, make sure the light comes on.
Into a laptop PC card slot
First insert the flashcard into a flashcard adaptor; to do so, hold onto the card by the edge with the ridge and insert the opposite
edge into the adapter. Then insert the adaptor, right side up into the laptop’s card slot. If a window appears listing what files are on the flashcard, close it.
Initializing a flashcard Before using a new card for the first time, or between recordings, you may want to initial-ize your flashcard with a clean flash.data file.
Using the HE/LX software, select File > Flashcard > Initialize. If a drive is found, the Initialize Flashcard window opens.
First determine that the correct drive has been selected for your card. The drive that will be updated should be highlighted in blue, and if there is already a flash.dat file on it, the check box will be populated.
If a drive has not been found, check to be sure that a card is in the slot and the reader is attached to the computer. You will need to Exit and return to this screen to refresh the Drive list.
Next, check to make sure that the correct card format option is selected for your recorder and then press Erase and your card will be initialized for its next use.
Initialize Flashcard Window
East Monitoring, Inc NEMM026-Rev-L Page 6 of 51
NorthEa
HE/LX Analysis Operator’s Manual - Basic Introduction: The Holter Procedure
Note: If you insert a card into the recorder and get a message that the “Flashcard is missing,” the card is not formatted or erased properly.
The Holter Procedure NorthEast Monitoring HE/LX Analysis software is used in conjunction with data from a NEMon Holter Recorder. After a patient has worn the recorder, you should remove the card from the recorder and insert the card in your computer system’s card reader and the Holter signal will be loaded onto your system. While the signal is being transferred, the software processes it, then you review the results, edit as needed, and print the report.
An overview of the process is covered in this chapter, and details are covered in sub-sequent chapters.
The Holter procedure typically includes the following steps:
• Holter the patient using a NorthEast Holter recorder.
• Remove the recorder from the patient and remove the flashcard from the recorder.
• Insert the flashcard into the computer’s card reader.
• Start the NorthEast HE/LX Analysis software.
• Enter/review information about the patient and the recording.
• Let the software analyze the Holter data.
• Review the Saved Strips, making sure
that all significant events are documented and labeled properly.
• Type your comments about the Holter test in the Report Summary.
• Create and print the final report to be reviewed by a physician.
Detailed information about the steps out-lined above appears in subsequent chapters in this manual.
Online helpIn addition to the information in this man-ual and the on-screen help messages that appear within the HE/LX Analysis soft-ware, more information and help is avail-able at our web site www.nemon.com or
Our “Technical Support” page on the web-site includes Frequently Asked Questions. The most current version of this manual and our software can always be found on our web-site on the “Downloads & Docu-ments” page.
st Monitoring, Inc NEMM026-Rev-L Page 7 of 51
2. PATIENT INFORMATION
The HE/LX Analysis software automatically retrieves the Holter recorder signal file and the patient iden-tification number, the recorder number, the date and time the recording started, and any diary entries that the patient saved using the Event/Record button on the recorder from the flashcard. All of this informa-tion is carried forward onto the Patient Information screen when the flashcard is read. You are now responsible for entering any additional data that you want to save on the Patient Information screen.
NorthEast Monit
While running the HE/LX Analysis software, you have the choice of opening the Patient Information window for (1) the last patient whose Holter test was accessed (that is, the “current” patient), (2) a previous patient whose Holter test has already been analyzed, or (3) a new patient whose Holter test has not yet been analyzed. In the first two cases, a patient record has already been created for the patient and the Holter data for the patient has already been down-loaded from the flashcard onto the hard disk of your computer.
The HE/LX Analysis has two tool bars that allow you to switch between views for the patient that is currently opened. In this exam-ple, “Smith Mary” is the patient who is currently open and whose data you are able to view.
In the case of a new patient, a new Patient Information record must be created and the Holter information downloaded from the flash-card. This chapter covers creating a new patient record first.
To enter information about a new patient’s Holter recording, the HE/LX Analysis software must be running. When the program appears, it displays a blank screen with the standard tool bars.
Standard Basic tool bars
oring, Inc NEMM026-Rev-L Page 8 of 51
NorthEa
HE/LX Analysis Operator’s Manual - Basic Patient Information: Enter a new patient
F
Enter a new patientTo create a new patient, do the following:
1. Insert the patient’s flashcard into the card reader and then click on File > Open/New from the toolbar. The Patient List will now appear.
2. From the Patient List, select an empty directory (row) and double-click on it or click the New button at the bottom of the window.
3. A Patient Information window will open, and click on the Copy Flashcard or Start button to read the flashcard.
4. Now press the Start button for analysis to begin.
Some things to be aware of:
• If you press the Copy Flashcard or the Start button before inserting a card, you will see a window that explains that
there is no flashcard in the drive. If this happens, insert the flashcard into the drive and click Retry.
• If you see a window that shows that more than one flash.dat file has been found, you will need to determine which file to use before creating your new patient. Once you determine which is correct, click on and highlight the file that you want to use at this time.
If you are not sure which file to use, you can use File > Preview Flashcard to see recording information about the file that was saved on each card. More information on Preview Flashcard can be found at the end of this chapter.
Multiple Flash found
ile drop-down options
st Monitoring, Inc NEMM026-Rev-L Page 9 of 51
NorthEa
HE/LX Analysis Operator’s Manual - Basic Patient Information: Enter a new patient
New Pa
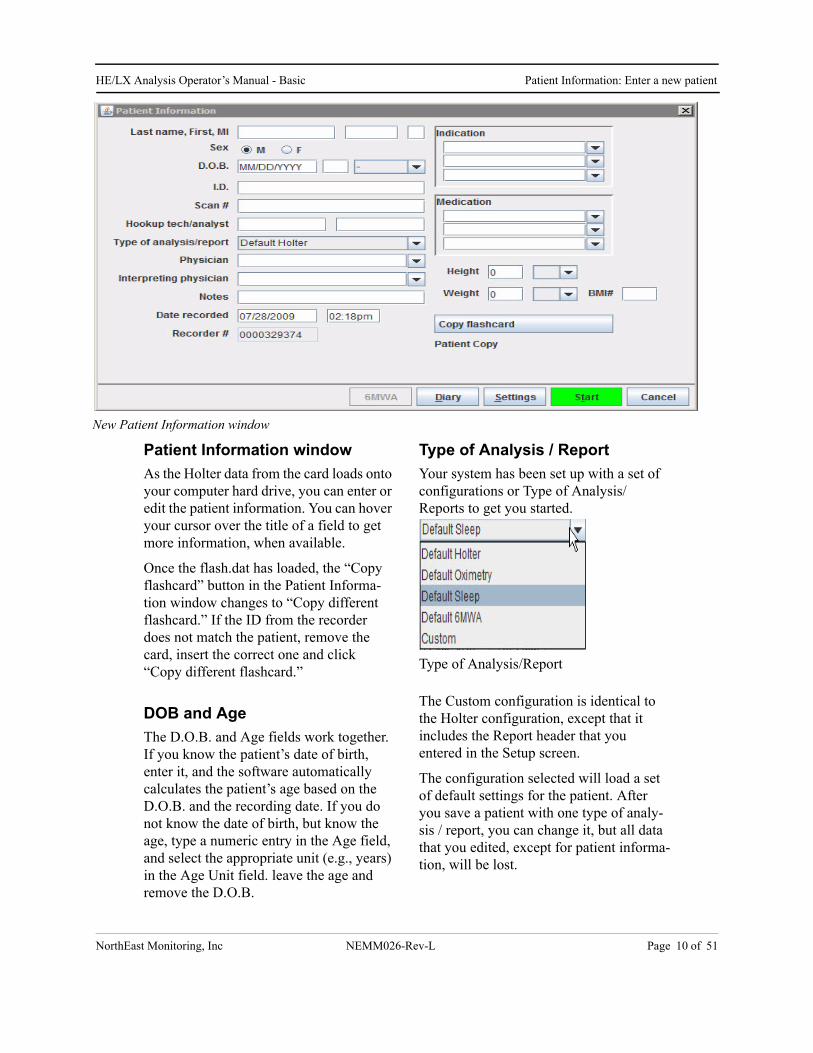
Patient Information window
As the Holter data from the card loads onto your computer hard drive, you can enter or edit the patient information. You can hover your cursor over the title of a field to get more information, when available.
Once the flash.dat has loaded, the “Copy flashcard” button in the Patient Informa-tion window changes to “Copy different flashcard.” If the ID from the recorder does not match the patient, remove the card, insert the correct one and click “Copy different flashcard.”
DOB and Age
The D.O.B. and Age fields work together. If you know the patient’s date of birth, enter it, and the software automatically calculates the patient’s age based on the D.O.B. and the recording date. If you do not know the date of birth, but know the age, type a numeric entry in the Age field, and select the appropriate unit (e.g., years) in the Age Unit field. leave the age and remove the D.O.B.
Type of Analysis / Report
Your system has been set up with a set of configurations or Type of Analysis/Reports to get you started.
The Custom configuration is identical to the Holter configuration, except that it includes the Report header that you entered in the Setup screen.
The configuration selected will load a set of default settings for the patient. After you save a patient with one type of analy-sis / report, you can change it, but all data that you edited, except for patient informa-tion, will be lost.
Type of Analysis/Report
tient Information window
st Monitoring, Inc NEMM026-Rev-L Page 10 of 51
NorthEa
HE/LX Analysis Operator’s Manual - Basic Patient Information: Diary Information
Notes
The Notes field allows an alphanumeric entry that can be used to record informa-tion that might be helpful about the Holter test or the patient. It is not printed in the final report. To enter notes to be printed in the final report, use the Comments section of the Report summary.
BMI
HE/LX Analysis will calculate your patient’s Body Mass Index (BMI) if you enter the patient’s height and weight and the appropriate units. A patient’s weight status can be determined from the BMI as follows:
• Below 18.5 - Underweight
• 18.5 -24.9 - Normal
• 25 - 29.9 - Overweight
• 30 & Above - Obese
Diary InformationWhile wearing a NEMon Holter recorder, the patient can identify symptoms and activities in two ways:
(1) by pressing the Event/Diary button on the recorder and, possibly, entering a pre-coded symptom or activity, or
(2) by keeping a written record of times and symptoms or activities.
When analysis takes place, the software reads the Event/Diary button information directly from the flashcard and enters it
automatically. You must type any signifi-cant information from the written record manually into the Diary window from the Patient Information Screen.
To open the Diary Symptoms window, click the Diary button in the Patient Infor-mation window. If any entries are present initially, those are the diary entries that were automatically read from the flash-card. You can now add any additional diary entries at this time.
Note: Whether the software uses a 12- or 24-hour clock is determined by your computer’s setting in the Control Panel.
Date - The date and time will initially be populated by the previous entry or the date recorded. If you need to edit the date, you can either do it manually by clicking on it or double-click on it to open the calendar edit screen
Time - You should edit the time by double-clicking on the box. Since no two diary entries can contain the same date/time, be sure that you edit the time so that is not the same as what is entered above or below it. If two entries appear at the same date/time, you can edit the symptom to include both.
Symptom - To enter a symptom, first click on the Symptom field next to the Date. Then enter the text either by typing a free-form entry or by clicking on the arrow to display a scrolling list of pre-typed entries. To enter a selection from the list, click on it; you can now edit the entry or move to the next field by clicking on it. Once a symptom is entered, the diary entry now exists. If there is no symptom, the diary entry does not exist.
When you have finished entering all writ-ten diary events, click the OK button to save your entries and return to the Patient Information window.
Delete - To delete a diary entry, click on the trash can icon to the left of entry.
Editing - If you add or modify diaries after analysis, the system will force an update and some of your editing of the ECG may be lost. For this reason, it is best to enter diaries before the analysis is started.
6-Minute Walk Assessment WindowIf you have a 6-Minute Walk Assessment patient, you are able to enter 6MWA data using the window that is accessible at the bottom of the Patient Information Screen. The 6MWA window allows you to enter data that wa recorded during the assess-ment. This data can be output by using the 6MWA front page that is available on the Reports screen.
To Change SettingsDuring Holter analysis, the HE/LX Analy-sis software makes decisions about the Holter signal based on a variety of pre-defined settings from the Type of Analysis/
Report or Configuration you have chosen for your patient
You can change some of these settings by clicking the Settings button in the Patient Information window. You can now change the following:
• Analysis duration determines how many hours of data are analyzed. All the ECG loads in from the compact flashcard, but analysis stops after the amount of time indicated here or at the end of the Holter recording, whichever comes first. It uses the HHH:MM format, with the digits prior to the colon showing hours and the numbers after showing minutes. A maximum of 336 hours (14 days) may be entered.
What Strips to Auto Save
• Minimum HR indicates whether to automatically save a sample strip of the lowest heart rate (typically based on a four-beat running average) observed during the recording.
• Maximum HR indicates whether to automatically save a sample strip of the
fastest heart rate (typically based on a four-beat running average and excluding ectopy) observed during the recording.
• Diary or event indicates whether to automatically save a sample strip at the time-of-day when either (1) the event button on the recorder was pushed or (2) an entry was manually typed into the Diary Symptoms window.
• Save 1 strip/hour indicates whether to automatically save a sample strip at the beginning of each hour of the recording.
Processing criteria
• Primary channel determines which channel is used first to locate R-waves and do template matching.
• Alternate channel determines which channel is used to do template matching and also to locate R-waves if one is not found in the primary channel.
• Pacemaker type contains four settings that allow the software to expect certain behavior:
5. Not paced means that the software will not look for any pacemaker spikes, beats or failures.
6. VVI means that each paced beat will be preceded by a single spike.
7. AV sequential means that paced beats will be preceded by two spikes, one atrial and one ventricular.
8. DDD means that paced beats can be preceded by either one or two spikes.
Note: When Oximetry is being recorded, no pacemaker spikes will appear on the Holter recording and no pacemaker analysis will be done. This setting should be set to Not Paced.
• Disable SVPB Counts - If a patient is in intermittent atrial fibrillation or flutter, you can choose to disable the SVPB counts.
• Label Events as Artifact - allows you to choose whether to label events as artifact or not.
Within the Settings window, there are three types of fields. For a numeric entry, click on the field and type over the existing entry. For a check box associated with a setting, click to turn it on or off; a check mark indicates that the setting is turned on. For fields with an arrow to the right, click on the arrow to list the other possible set-tings, then click on the new choice.
When you have finished making changes, click OK to save those changes and close the window, and click Cancel to close the window without saving changes.
Note: Be sure to make any changes in the Settings window before you work on the final report. Manually saved sample strips and typed comments will be lost after some changes in the Settings window.
Oximetry Settings
For any patients with oximetry data, the Settings window also contains an Oxime-try button, which opens the Oximetry win-
dow that allows settings to be reviewed and adjusted.
The settings include:
• Desaturation threshold (percent) defines the oxygen level (SpO2 value) that every reading during a desaturation event must be below. The duration of an event is defined as a time period during which no reading was above this level.
• Max. desaturation nadir defines the SpO2 level that must be met for an event to be identified as a desaturation event. During the event, at least one reading must drop to this level.
• Min. overall desaturation length (in seconds) determines how long the readings must remain at or below the Desaturation threshold to be considered a desaturation event.
• Max. length of artifact in a desatu-ration (in seconds) defines the maximum amount of sequential artifact that can occur during a desaturation event and still have it reported as an event.
• Min. separation of artifact segments in desaturation (in seconds) defines how close periods of artifact can be within a desaturation event and still have it reported as an event.
Starting Holter AnalysisTo start analysis after entering patient data, click the Start button at the bottom of the
Patient Information window. The Analysis window may appear or you may see Anal-ysis in the lower left-side of the screen. You cannot stop or cancel the initial analy-sis, and once analysis is complete, the Patient Information will be changed.
To interrupt analysis, click the Stop button. The analysis ends immediately, with data only for the portion that was complete. The unanalyzed ECG can be reviewed in Page and printed in full disclosure.
After analysis is complete, proceed with your review of the Holter recording. See Chapter 3: Review Methods for details.
Edit patient information for the “current” patient After analysis is completed for a patient’s Holter data, you can re-open the Patient Information window and edit the informa-tion in it. To open the Patient Information window for the current patient, select Patient > Patient Information.
While most of the Patient Information win-dow is the same as when new, there are significant differences:
• The Re-analyze button replaces the Start button because the Holter signal has already been analyzed.
Note: If you choose to change the Type of Analysis/Report at this time, you will be forced to redo analysis and all edited ECG data will be lost.
Oximetry settings
st Monitoring, Inc NEMM026-Rev-L Page 14 of 51
NorthEa
HE/LX Analysis Operator’s Manual - Basic Patient Information: Edit patient information for the “current” patient
• The absence of the Copy different flashcard button.
• The addition of the Status button.
Status window
After a patient’s Holter signal has been ana-lyzed, the Patient Infor-mation win-dow also includes a Status button that opens the Status win-
dow. The Status window helps you keep track of the status of each patient’s Holter test. As you complete each step, you can click on the check box next to each field in the Status window to indicate that the step has been completed.
The Status fields include:
• Edited indicates the Holter signal was reviewed and edited as needed;
• Printed means the report was printed;
• Verified means the report was reviewed/approved by a physician;
• Locked removes all editing capabilities from the Patient Information and Review windows. No changes are allowed.
The Archive field at the bottom of the sta-tus window fills in automatically when you use the Archive to save a patient’s Holter information. It will read either “Full” to indicate that all Holter data is archived with the patient report or “Report” to indi-cate that just the compiled report is archived for this patient.For more informa-tion about archiving patient records, see Chapter 8: Archive Patient Reports.
To save your data and close the Patient Information window without starting anal-ysis, click OK. To close it without saving any changes, click Cancel.
To save your data and close the Patient Information window without starting anal-ysis, click OK. To close it without saving any changes, click Cancel.
Patient Information window for analyzed (not new) patient
Status window
st Monitoring, Inc NEMM026-Rev-L Page 15 of 51
NorthEa
HE/LX Analysis Operator’s Manual - Basic Patient Information: The Current Patient
An
The Current PatientAt any one time, only one patient is the current patient - the patient whose infor-mation appears at the top of the screen,
the patient you see when you select File > Patient Information, the patient whose ECG appears in the screen displays, the patient whose report prints when you make the request. To change the current patient to a different one, either click on the appro-priate name on the Patient List and click Open, or double-click on the appropriate line.
Also, you can change the current patient using the << and >> buttons in the bottom of the Holter LX window. << changes the current patient to the previous one on the Patient List and >> changes the current patient to the next one on the Patient List. Click each button repeatedly to move backward or forward through the list. To display a combo box listing all patients on the system, click the arrow to the left of the << and >> buttons.
The Patient ListYou can keep multiple patient Holter recordings and reports saved on your com-puter system. All of the patients currently saved in the software appear in the Patient List when you select File > Open/New from the toolbar.
From the Patient List you can choose to open a patient’s record by clicking and highlighting it and pressing “OK” or by double-clicking anywhere on the patient line.
On the Patient List, if you don’t know the meaning of a specific column, you can hover your cursor over the heading for that column and help will be displayed if it exists.
Hover for Help on Patient List window
example of the Patient List window
st Monitoring, Inc NEMM026-Rev-L Page 16 of 51
NorthEa
HE/LX Analysis Operator’s Manual - Basic Patient Information: Preview data on flashcard
Customize the Patient List View
You are able to customize the Patient List for your specific needs in the following ways:
• To change what columns appear on the list, right-click on the top row of the column headings. You will now see a list where you can check or uncheck items to include or exclude from the list.
•Once you have decided what columns you want to see, you can change the position of the column by clicking on it and dragging it to a new
location.
• Grab the column divider to increase or decrease the size of any column.
•Sort on any column by double-clicking on the header for that column. An arrow will appear to show you which column is sorted.
Archive button
The Archive button at the bottom of the screen will take you to the Archive screen where you can select one or more patients to save in the Archive directory. You can also copy previously deleted records using the Restore tab. More information is pro-vided later in this manual.
Delete button
This will allow you to delete one or more patients. This data will be lost forever unless saved or Archived in another direc-tory.
New Button
When you select an empty patient direc-tory, this button is enabled.
Open Button
Enables you to open a different patient than is currently opened.
Preview data on flashcardIf you would like to review the clerical information on a flashcard before creating a new patient record, you can insert the card into the drive and then select File > Preview Flashcard from the main toolbar. This opens the Preview window, which displays the identification and recorder numbers, along with the date recorded and the start time, directly off the card without loading the information onto your com-puter’s hard drive. Use this feature to ver-ify which flashcard contains a particular patient’s Holter data.
After verifying that the card is the correct one, click OK to close the window, select File > Open/New and follow the normal
st Monitoring, Inc NEMM026-Rev-L Page 17 of 51
NorthEa
HE/LX Analysis Operator’s Manual - Basic Patient Information: Preview data on flashcard
procedure described at the beginning of this chapter.
If the information in the Preview window does not match the information you have, do not proceed without clearing up the dis-crepancy.
Permanently Delete Patient Directories
If for some reason you would like to reduce the number of patient directories, you must first delete the patient records in the directories you will delete. You can do this by going to the Patient List, selecting the patients, and then clicking the Delete button. You will then need to go to the Settings Utility window to reduce the num-ber of patient directories, and then use Windows Explorer to delete unwanted directories permanently. Use the Archive function to save patient directory prior to deleting directories.
st Monitoring, Inc NEMM026-Rev-L Page 18 of 51
3. REVIEW METHODSAfter loading the Holter signal from the flashcard to the hard drive of your computer, the HE/LX Analysis software analyzes the signal and then displays it for your review. You can review an on-screen, color-coded full disclosure of all the ECG, an interval table summarizing the heart rates and ectopy counts, graphs showing the heart rate and RR interval data, selected strips saved for the final report, and a report summary that describes the heart rates measured during the recorded period, along with any typed com-ments you enter.
NorthE
Reviewing the Holter data
Note: NorthEast Monitoring recommends that the entire Holter recording for each patient be carefully reviewed by a physician or other qualified person who knows how to interpret Holter waveforms. This review can be done page-by-page using either the Page window or the printed full disclosure.
Details of using the Page window are included in this chapter, while printing full disclosure is covered in Chapter 4: Printing.
Color codingThroughout the HE/LX Analysis software, the ECG is color-coded based on what the sys-tem has labeled each beat:
• Green: Beats the software has identified as normal.
• Yellow: Beats identified as supraventricular premature beats (SVPBs). They have a normal morphology, but fall at least 20% early compared to the normal.
• Red: Beats identified as ventricular premature beats (VPBs). They differ significantly from the normal; they are not necessarily premature.
• White: Beats identified as pauses, defined as RR intervals at least 2.5 seconds or longer. White overrides any other color that the beat also qualifies for (e.g., red because it’s a VPB).
• Light blue (cyan): Signal that appears to be contaminated by artifact.
• Cobalt blue: Beats identified as paced.
ast Monitoring, Inc NEMM026-Rev-L Page 19 of 51
NorthEa
HE/LX Analysis Operator’s Manua - Basicl Review Methods: Reviewing data in the Page window
All data must be reviewed carefully to ensure that you agree with the beat labels the software has selected; if you do not agree, you can change a beat label and its color will change appropriately.
In addition to the labels the software can provide for each beat, there are some labels only you can use to relabel beats. These are:
• Questionable (Unknown): Use this label to separate out beats you cannot identify and keep them from being included in another category. They are colored green, like normals.
• T-wave: Use this label if the software has identified a portion of the signal as a QRS, but it is not. This will merge its RR interval with the preceding RR interval. The signal will take the color of whatever beat precedes it.
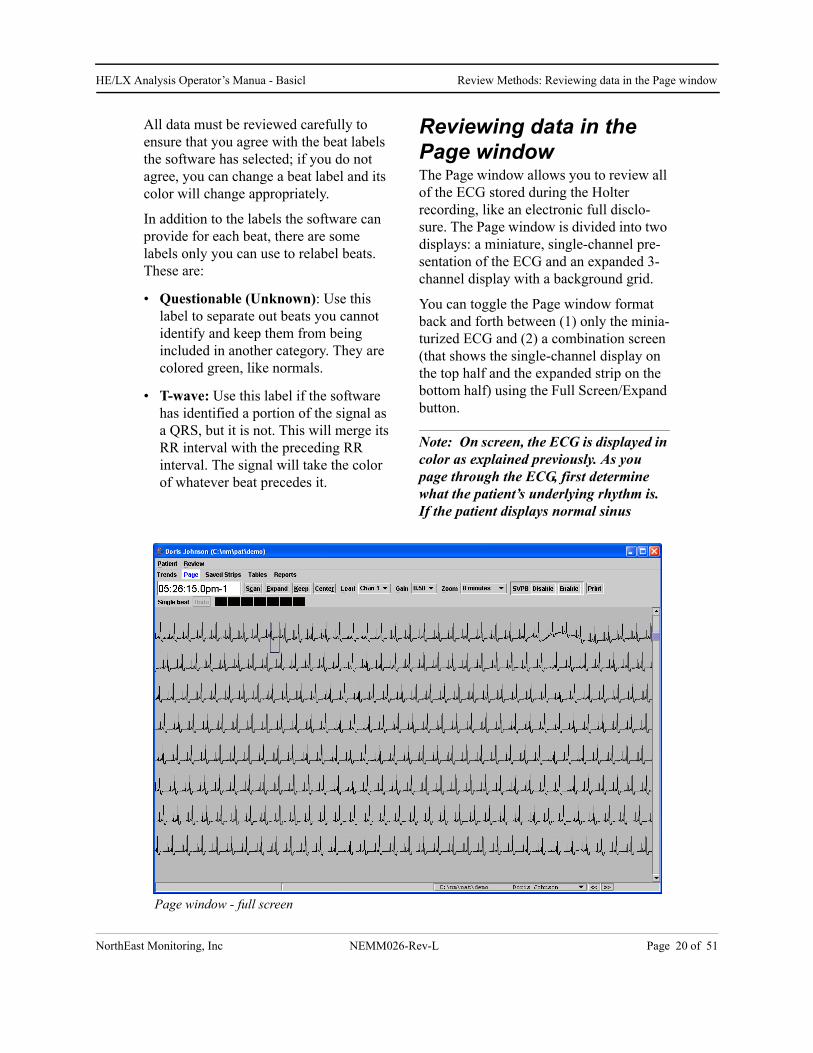
Reviewing data in the Page windowThe Page window allows you to review all of the ECG stored during the Holter recording, like an electronic full disclo-sure. The Page window is divided into two displays: a miniature, single-channel pre-sentation of the ECG and an expanded 3-channel display with a background grid.
You can toggle the Page window format back and forth between (1) only the minia-turized ECG and (2) a combination screen (that shows the single-channel display on the top half and the expanded strip on the bottom half) using the Full Screen/Expand button.
Note: On screen, the ECG is displayed in color as explained previously. As you page through the ECG, first determine what the patient’s underlying rhythm is. If the patient displays normal sinus
Page window - full screen
st Monitoring, Inc NEMM026-Rev-L Page 20 of 51
NorthEa
HE/LX Analysis Operator’s Manua - Basicl Review Methods: Reviewing data in the Page window
rhythm, then pay particular attention to any signal, regardless of color, that appears different from the patient’s normal rhythm.
Single-channel page display
The single-channel page display contains a blue highlight box surrounding one of the QRS complexes. The time-of-day at that beat is displayed in the time field in the upper left corner of the window. The dis-played ECG can be adjusted in these ways:
• To adjust the ECG so that the highlighted beat appears in the center of the page, click Center.
• To move the highlight box to a different beat, click on the beat.
• To change the channel displayed, click on the Lead field and select a different channel from the list.
• To change the amplitude of the displayed signal, click on the Gain field and select a different size from the list.
• To change the amount of time displayed on each page, click on the Zoom field and select a different amount of time.
• To invert the signal in a channel or to completely eliminate a channel from any display and the report, go to Review > Invert/Hide to open the Invert/Hide window. Click on the check box for each channel to be inverted or hidden; click on the check box again to return the signal to normal. Click OK to save any changes and exit. To close the
window without saving changes, click Cancel.
In the single-channel display, you can visu-ally review pages of ECG by using the PageUp and PageDown keys, by clicking on the down arrow of the scroll bar, or by clicking the Scan button. Turn the Scan button off by clicking it again. While scan-ning, use the + key to increase the speed of the display, and use the - key to decrease it.
Relabeling a beat
If you determine that a particular beat is not labeled appropriately, you can use the relabel buttons to change the beat label. To relabel, click on the beat to highlight it, then click the appropriate relabel button.
The relabel buttons correspond to the beat labels explained in the “Color coding” sec-tion on the first page of this chapter, with:
• A for artifact
• V for ventricular (VPB)
• N for normal
• P for paced (only if pacemaker type is on)
• S for supraventricular (SVPB)
• Q for questionable/unknown
• T for T-wave
A highlighted beat
Relabel buttons
Invert/Hide window
st Monitoring, Inc NEMM026-Rev-L Page 21 of 51
NorthEa
HE/LX Analysis Operator’s Manua - Basicl Review Methods: Reviewing data in the Page window
Note: If you relabel one or more beats, when you exit from the Page window, the software automatically updates all results to reflect your changes.
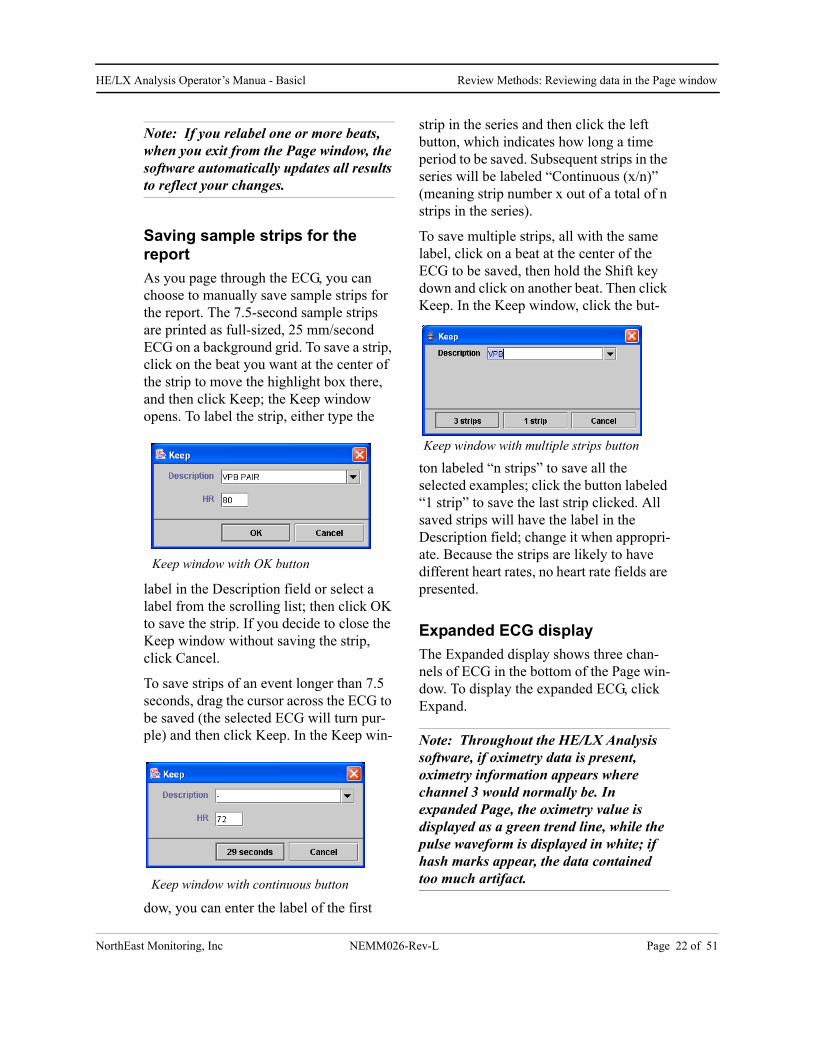
Saving sample strips for the report
As you page through the ECG, you can choose to manually save sample strips for the report. The 7.5-second sample strips are printed as full-sized, 25 mm/second ECG on a background grid. To save a strip, click on the beat you want at the center of the strip to move the highlight box there, and then click Keep; the Keep window opens. To label the strip, either type the
label in the Description field or select a label from the scrolling list; then click OK to save the strip. If you decide to close the Keep window without saving the strip, click Cancel.
To save strips of an event longer than 7.5 seconds, drag the cursor across the ECG to be saved (the selected ECG will turn pur-ple) and then click Keep. In the Keep win-
dow, you can enter the label of the first
strip in the series and then click the left button, which indicates how long a time period to be saved. Subsequent strips in the series will be labeled “Continuous (x/n)” (meaning strip number x out of a total of n strips in the series).
To save multiple strips, all with the same label, click on a beat at the center of the ECG to be saved, then hold the Shift key down and click on another beat. Then click Keep. In the Keep window, click the but-
ton labeled “n strips” to save all the selected examples; click the button labeled “1 strip” to save the last strip clicked. All saved strips will have the label in the Description field; change it when appropri-ate. Because the strips are likely to have different heart rates, no heart rate fields are presented.
Expanded ECG display
The Expanded display shows three chan-nels of ECG in the bottom of the Page win-dow. To display the expanded ECG, click Expand.
Note: Throughout the HE/LX Analysis software, if oximetry data is present, oximetry information appears where channel 3 would normally be. In expanded Page, the oximetry value is displayed as a green trend line, while the pulse waveform is displayed in white; if hash marks appear, the data contained too much artifact.
Keep window with OK button
Keep window with continuous button
Keep window with multiple strips button
st Monitoring, Inc NEMM026-Rev-L Page 22 of 51
NorthEa
HE/LX Analysis Operator’s Manua - Basicl Review Methods: Reviewing data in the Page window
Exp
The expanded display includes a beat label in the upper left corner and beat-by-beat annotation of either heart rate or RR inter-val.
The expanded ECG in the bottom half of the window and the single-channel display in the top half of the window are linked. The Expanded strip is centered on the highlight box in the top half. If you move the highlight box, the ECG displayed in the bottom half changes appropriately.
To change the amount of time that appears in the expanded mode, click in the Display field in the toolbar at the center of the win-dow and select the amount of time to be displayed.
To print a strip of ECG centered on a dis-played beat, along with a page of full dis-closure of the surrounding rhythm, use the Print button. When the Print window opens, click the left button to print the cur-rent beat centered on the page of full dis-closure, or click the middle button to print with the beat on the first line. Click Cancel to close the window without printing.
Measuring in Expanded Page
The two blue vertical calipers can be used to make a variety of measurements. The calipers can be dragged to specific loca-tions on the ECG; clicking on the ECG will also move the closer caliper to the location of the cursor. To move both cali-pers while keeping them the same distance apart, click on the Both check box in the center toolbar, and then drag them where you want them; click Both again to move each caliper separately.
To keep the calipers in the same locations as you move through different screens of ECG, click the check box next to Lock; the calipers will stay in the indicated locations unless you move them again. Click again to turn off.
To measure the heart rate on the strip, place the calipers two RR intervals apart; the heart rate appears in the HR (2 RR) field. To measure an RR or a PR interval, place the left caliper at the start of the interval and the right caliper at the end of the interval; the time between them appears in the Time field.
To make ST measurements, place the left caliper in the isoelectric portion of the PR interval, and place the right caliper where you want the ST segment measurement to be made; the vertical distance between where the left caliper intersects the ECG and where the right caliper intersects the ECG will appear in the ST field for each channel (labeled ST 1, 2, 3).
If oximetry data is present, it appears in SpO2 data fields to the right of the Display field.
Reviewing the Trends windowOpen the Trends window by clicking Trends in the Review toolbar or by select-ing Review > Trends in the primary Holter toolbar. The display includes two trend graphs of information from the recording.
RR Trend
The RR trend shows the range of RR inter-val measurements throughout the Holter period in one-minute increments. Time-of-day appears on the horizontal axis, and RR interval length (in seconds) is on the verti-cal axis. RR intervals are plotted so that the range within each minute appears as a vertical line; the top end of the line indi-cates the longest RR interval within that minute, and the bottom of the line indi-cates the shortest RR interval within it.
HR Trend
The HR trend shows heart rate data throughout the Holter period in one-minute increments. Like in the RR trend, time-of-day appears on the horizontal axis. On the vertical axis is heart rate in beats per min-ute. The information plotted is the average heart rate for each minute.
The blue marker
The blue vertical marker is located at the time-of-day of a particular 30-second seg-ment. Click on either trend to move the marker to a different time-of-day. The time-of-day that appears in the large data box indicates the time-of-day at the marker. The data boxes at the top of the display indicate the heart rate (HR), the shortest RR interval (RR Min), and the longest RR interval (Max) in the minute where the marker is located.
You can expand the trends by decreasing the amount of time displayed across a sin-gle page. To change the amount of time displayed, click on the arrow in the Hours field and select the number of hours you want displayed per page.
When Hours is set to less than 24 for a 24-hour recording, there are multiple pages of data. To move from one page of data to the next, use either the PageUp and PageDown keys on your keyboard, or the scroll bar at the right edge of the window.
Shorten analysis time
If the Holter period ends prematurely, you can either throw out the information as artifact, as described in the section above or you can shorten the analysis time.
To shorten the analysis time, in the Trends window, click to move the marker to the time-of-day at which you would like to end analysis, then select Review > Shorten analysis time. When the window opens to confirm the command, click Yes to re-ana-lyze the data, stopping at the time indi-cated. To close without re-analyzing, click No.
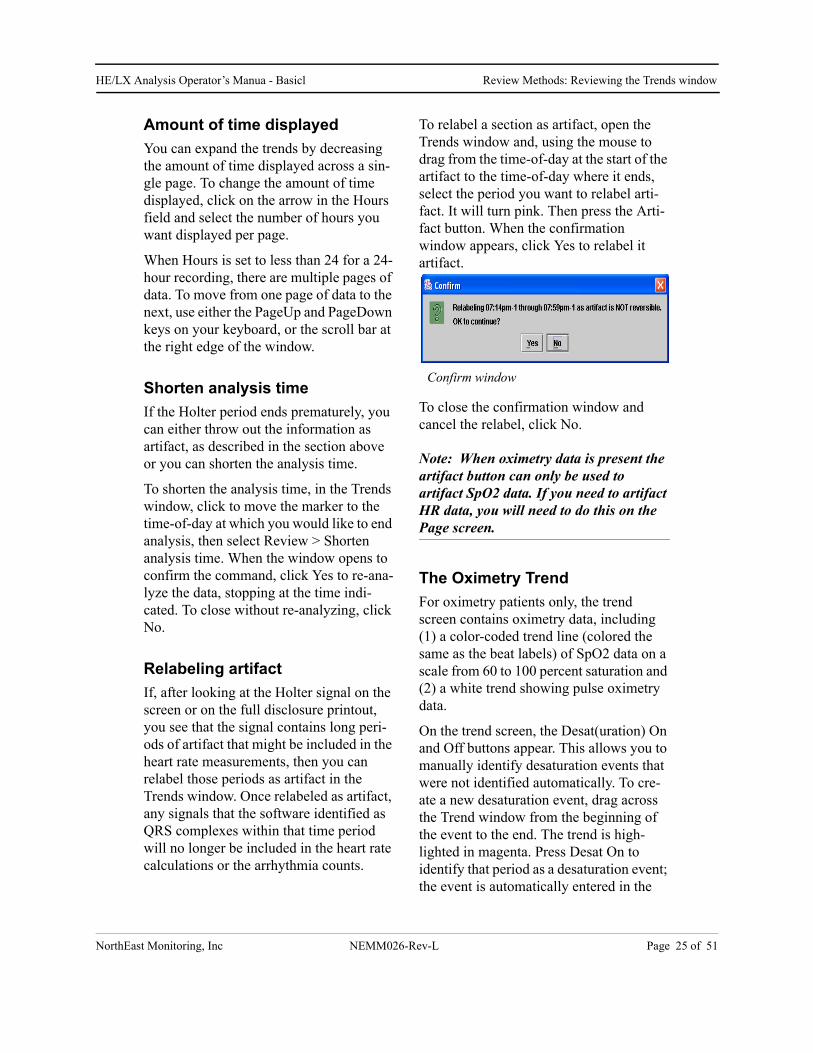
Relabeling artifact
If, after looking at the Holter signal on the screen or on the full disclosure printout, you see that the signal contains long peri-ods of artifact that might be included in the heart rate measurements, then you can relabel those periods as artifact in the Trends window. Once relabeled as artifact, any signals that the software identified as QRS complexes within that time period will no longer be included in the heart rate calculations or the arrhythmia counts.
To relabel a section as artifact, open the Trends window and, using the mouse to drag from the time-of-day at the start of the artifact to the time-of-day where it ends, select the period you want to relabel arti-fact. It will turn pink. Then press the Arti-fact button. When the confirmation window appears, click Yes to relabel it artifact.
To close the confirmation window and cancel the relabel, click No.
Note: When oximetry data is present the artifact button can only be used to artifact SpO2 data. If you need to artifact HR data, you will need to do this on the Page screen.
The Oximetry Trend
For oximetry patients only, the trend screen contains oximetry data, including (1) a color-coded trend line (colored the same as the beat labels) of SpO2 data on a scale from 60 to 100 percent saturation and (2) a white trend showing pulse oximetry data.
On the trend screen, the Desat(uration) On and Off buttons appear. This allows you to manually identify desaturation events that were not identified automatically. To cre-ate a new desaturation event, drag across the Trend window from the beginning of the event to the end. The trend is high-lighted in magenta. Press Desat On to identify that period as a desaturation event; the event is automatically entered in the
Desaturation table in the Tables window. You can undo the change in the Trends
window by dragging to select it again and then pressing Desat Off.
Reviewing Saved StripsIn addition to printing out full disclosure, the report can include full-size, 7.5-sec-ond, 25 mm/sec strips on a background grid. Four types can be saved automati-cally: Minimum HR, Maximum HR, Event/Diary entries, and a sample strip for each hour of the recording. You can also manually save strips while reviewing the Holter in the Page window (see “Saving sample strips for the report” earlier in this chapter).
To review the saved strips before printing the report, click Saved Strips in the Holter menu.
The Saved Strips window displays a min-iature version of the strips 12 at a time. Each is labeled with its strip label and the time-of-day at which it occurred. If you have saved lots of strips manually in the Page window, you can page through them using either the PageUp and PageDown keys or clicking on the up and down arrows of the scroll bar.
The strips are initially sorted by strip label. If you would rather review them ordered by time-of-day, select Time from the choices in the Sort field.
Changing the active strip
At any time, there is only one active strip, the strip outlined in blue. Three fields above the strips refer specifically to the active strip and cannot be changed. Those
fields include time-of-day, a strip number, and heart rate.
To change the active strip, click on the one you want so that the outline surrounds that one. You can also change the active strip by clicking the List button in the toolbar to open the List window. The List window lists each strip label and corresponding heart rate in order of time-of-day. To dis-play a particular strip from the list, click on the appropriate entry on the list and press OK, or double-click on the entry. To exit without changing the active strip, press Cancel.
Editing a strip label
To change the label of the active strip, click on Edit in the toolbar. The Edit win-dow opens; it includes a field with the cur-rent label of the strip and the heart rate of the ECG in the strip.
You can either type over the existing strip label in the Description field or select an alternate label by clicking on the arrow at the right end of the Description field and selecting a label from the displayed list.
To change the heart rate on the strip, click on the HR field and type over the existing entry.
When you have completed your changes, click OK to save those changes and exit; click Cancel to exit without saving any changes.
If you decide to delete one or more of the strips from the final report, you can do that in the Saved Strips window. To delete one strip in the Multiple strip display, click on it to make that strip the active one, then click Delete in the toolbar. To delete more than one strip, click on the first strip to make it the active strip; in addition to the blue highlight around the strip, there is also a yellow highlight around the time-of-day, indicating that the strip is selected. Click on any additional strips you want to delete, then click Delete in the toolbar. All of the selected strips (as indicated by the yellow highlights) are now deleted.
When you delete a strip, its label becomes red; strips with red labels are not included in the printed report. To retrieve a deleted strip, click on it and then click Delete in the toolbar again; the label text changes back to yellow.
To delete all of the strips displayed, click the button labeled Del/Undel All. All of the strip labels turn red. To retrieve all of the strips displayed, click the button again.
Deleting channels from a strip
To delete one or more channels of a strip, but not the entire strip, click on the strip to make it active. Then, click on one of the check boxes labeled Channel 1, 2 and 3. For a particular strip, if a check is present, the channel will be included; if a box is not checked, the channel will be deleted.
To delete the same channel from all strips, delete the channel from the active strip, then click All. When the Confirm window appears, click Yes to delete the channel(s) from all strips. Click No to cancel the All command.
Replacing a strip with an alternative
The maximum and minimum heart rate strips that are saved automatically by the software can be replaced by an alternative. The software selects sample strips for those types automatically. If you would prefer to select a different one (perhaps because the selected one contains artifact), click on the strip to make it active; the Alternatives button appears.
When you click Alternatives, the Alterna-tives window opens, displaying other choices for that label. The strips are sorted by heart rate, with the current selection the first one, in the upper left corner.
To select a different strip, click on the strip and then the Select new Alternative button. The window closes and the new strip appears in the Saved Strips window. To exit from the Alternatives window without changing the strip, click the Back to Saved Strips button.
Measuring
The data fields in the center of the toolbar - HR (2 RR), Time, and the ST indicators for each channel - contain data calculated based on the two blue calipers in the active strip, just as they do in the Page window. As you drag the blue calipers, those fields change, reflecting the new caliper posi-tions.
To measure a two-beat heart rate, place the calipers two RR intervals apart; the mea-surement appears in the HR (2 RR) field. To measure ST in any of the channels, position the left caliper in the isoelectric area of the PR interval and the right caliper where you want to make the ST measure-ment; the measurements for each channel appear in the appropriate fields.
To move the calipers keeping them the same distance apart, click the check box next to Both and then drag the calipers. Click Both again to remove the mark and move them separately.
To keep the calipers in the same locations as you move through different screens of ECG, click the check box next to Lock; the calipers will stay in the indicated locations until you move them again. Click again to turn off.
Printing the ECG now
To print a strip of ECG centered on a dis-played beat, along with a page of full dis-closure of the surrounding rhythm, use the Print button. When the Print window opens, click the left button to print the cur-rent beat centered on the page of full dis-closure, or click the middle button to print with the beat on the first line. Click Cancel to close the window without printing.
Expanding the active strip
To view a strip more closely, either click Single in the toolbar or double-click on the strip. It then fills the Saved Strips window. Each beat is labeled with either the heart rate (BPM) or the length (in milliseconds) of the RR interval following the beat.
The blue measurement calipers and the related data fields work in this window as described in the previous section, “Mea-suring.”
All other buttons and fields work in the Expanded display just as they do in the Multiple strip display. Use PageUp and
PageDown to display the other strips.To return to the Multiple strip display, click Multiple in the toolbar.
Note: Saved Strips are re-compiled after every update or re-analysis, so be sure to make changes to the automatically saved strips only after you have completed all other editing. Any editing of strips that occurs before an update or re-analysis will be lost.
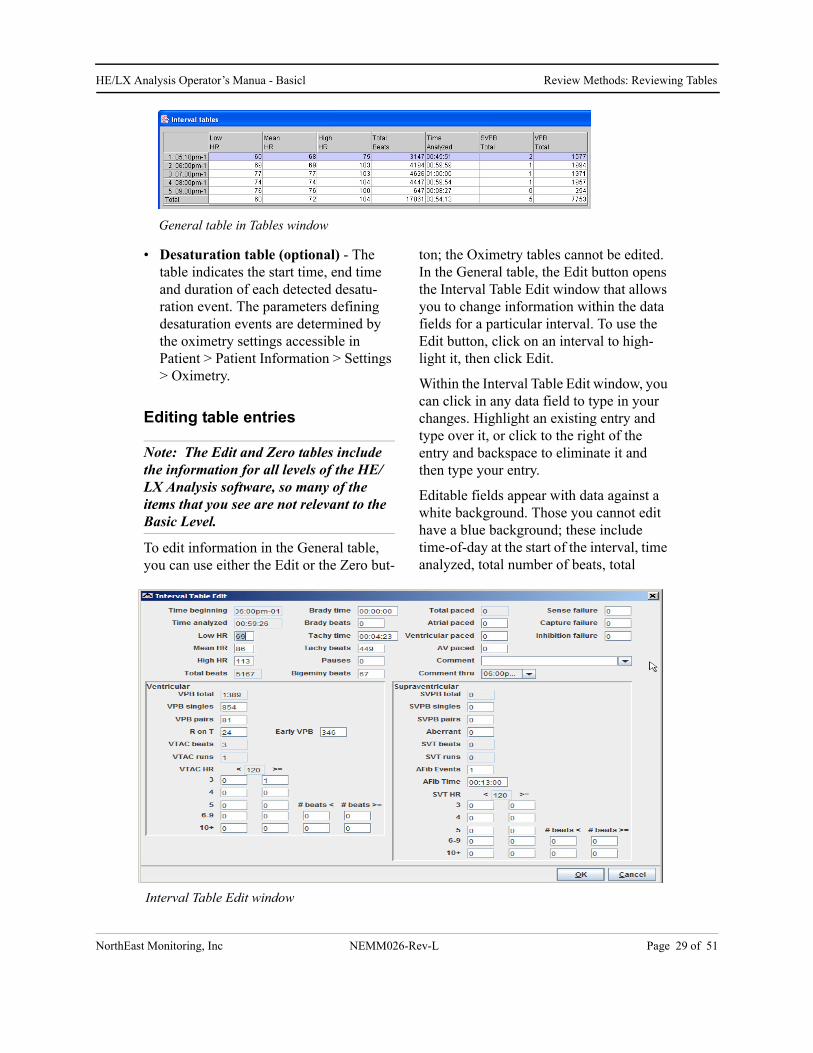
Reviewing TablesThe Tables window consists of a General table and optional Oximetry tables (the Oximetry tables appear only for recordings with oximetry data):
• General - This is an interval table that lists the time-of-day at the start of the interval; the low, mean and high heart rates calculated during the interval (see Appendix A for details of heart rate calculations); the total number of beats identified and counted in the interval (this excludes periods of artifact); the amount of time analyzed (this also excludes artifact); the total number of SVPBs; and the total number of VPBs.
• SpO2/HR summary (optional) - The table lists minimum, maximum and mean SpO2 and heart rate values for the monitored period.
• SpO2 summary (optional) - The table indicates how much time (and percentage of the monitored period) was spent within certain SpO2 ranges.
• Heart rate summary (optional) - The table indicates how much time (and percentage of the monitored period) was spent with certain heart rate ranges.
• Desaturation table (optional) - The table indicates the start time, end time and duration of each detected desatu-ration event. The parameters defining desaturation events are determined by the oximetry settings accessible in Patient > Patient Information > Settings > Oximetry.
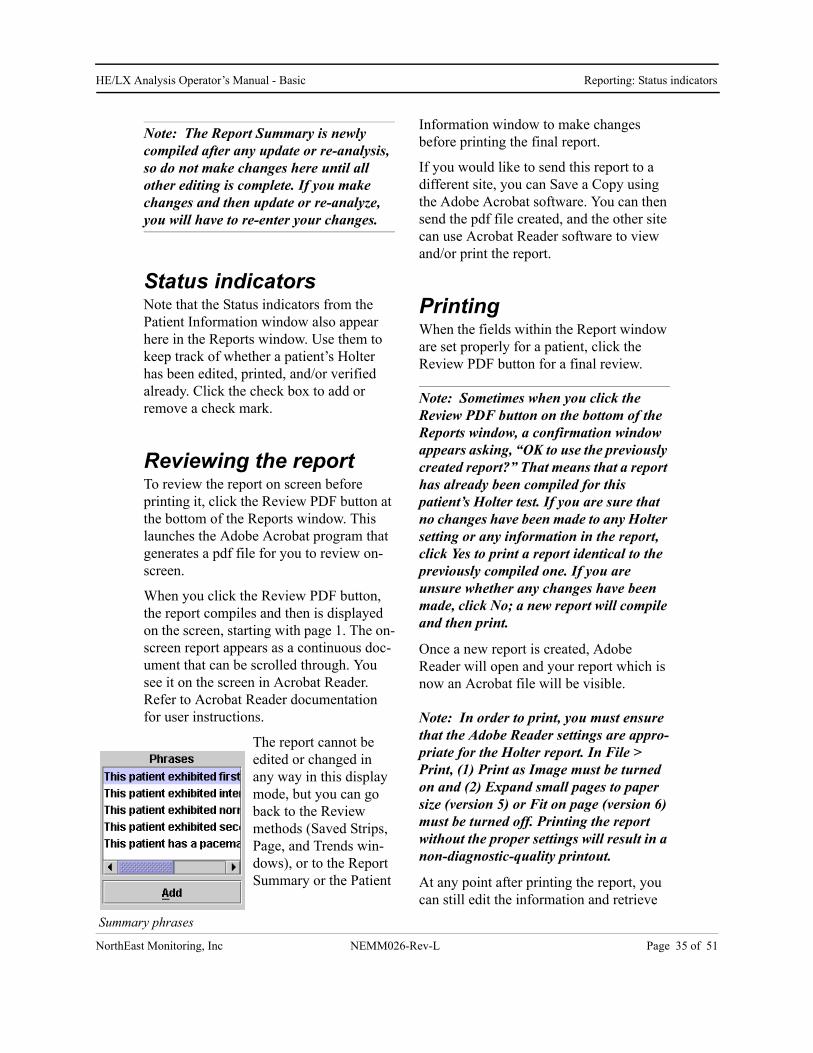
Editing table entries
Note: The Edit and Zero tables include the information for all levels of the HE/LX Analysis software, so many of the items that you see are not relevant to the Basic Level.
To edit information in the General table, you can use either the Edit or the Zero but-
ton; the Oximetry tables cannot be edited. In the General table, the Edit button opens the Interval Table Edit window that allows you to change information within the data fields for a particular interval. To use the Edit button, click on an interval to high-light it, then click Edit.
Within the Interval Table Edit window, you can click in any data field to type in your changes. Highlight an existing entry and type over it, or click to the right of the entry and backspace to eliminate it and then type your entry.
Editable fields appear with data against a white background. Those you cannot edit have a blue background; these include time-of-day at the start of the interval, time analyzed, total number of beats, total
paced beats, total VPB count, total VTAC runs, total VTAC beats, total SVPB count, total SVT runs, total SVT beats, and the VTAC and SVT heart rates. The total beat counts are not editable because they are calculated from other field data present in the table; as you make changes to the other fields, the total counts change appropri-ately.
To save your changes and exit, click OK. To exit without saving changes, click Can-cel.
Note: The VPB and SVPB total beat counts are the only ectopy data that appear in the General table in the Tables window. To change those totals, you must enter new data in the singles, pairs or runs fields.
To completely eliminate all information within an interval, use the Zero button, which opens the Interval Table Zero win-dow. In that window, each data field has an associated check box that determines whether to include or exclude the data for that field in the table. To zero data for a particular field, click on the check box so that a check mark appears. Click again to remove the check mark.
Click on as many data fields as you want zeroed out, then click OK to exit. Click Cancel to exit without saving any changes.
Select/deselect all buttons are available for each section. Use them to turn on or off all data fields within a section - general infor-mation, ventricular or supraventricular.
Note: Be sure to make any changes to the tables carefully. Incorrect infor-mation entered in this window can cause inconsistencies in the printed report.
Printing the General table
To print the table, click Print to open the Print window, which should list your printer type and default to one copy. Click OK to print. Click Cancel to close the win-dow without printing.
Closing the Tables window
Click OK to close the Tables window.
Interval Table Zero window
st Monitoring, Inc NEMM026-Rev-L Page 30 of 51
4. REPORTING The HE/LX Analysis software generates printed reports composed of report modules that can be included or excluded, along with full disclosure of all or part of the Holter data. Modules can be selected individu-ally, and include the first page with clerical information, the second page containing typed comments, and a list of diary entries for the patient, along with sample strips in standard 25 mm/second format. Full dis-closure of any interval can also be included. If oximetry data was recorded for the patient, oximetry mod-ules can also be included in the printed report.
NorthEa
w
Final Report
Choosing report modules
To access the report modules that can be included in the final printed report, select Reports from the Review toolbar to open the Reports window. The modules that are available for the current patient are listed in the right half of the Reports window; if the optional Oximetry modules appear, oximetry data was saved during the recording. The modules include:
• Patient Information. This is the standard front page, with a report heading, the information entered in the Patient Information window, and the Report Summary.
• Comments Page. This also contains some clerical information about the patient, along with a large area for comments that were typed in the Comment window of the Report Summary.
• List of Diary Events. This lists the time-of-day and symptom for each entry in the Diary Symptoms window accessible from the Patient Information window.
• Full-Sized Strips. This presents the sample strips in a 25 mm/second format, with three strips per page.
• Full Disclosure Strips. Full Disclosure Strips. This report will create a page for each manually saved strip. Each page will include a full-sized strip at the top with 6 minutes of full disclosure below.
• Oxy and HR Trends - 24 hours (optional). This prints a compressed trend of oximetry Report module list in Reports windo
st Monitoring, Inc NEMM026-Rev-L Page 31 of 51
NorthEa
HE/LX Analysis Operator’s Manual - Basic Reporting: Final Report
and heart rate data, with 24 hours across one page.
• Oxy and HR Trends - 2 hours (optional). This prints an expanded trend of oximetry and heart rate data, with 2 hours across each page.
• Oxy and HR Summaries (optional). This table presents the minimum, maximum and mean SpO2 and heart rate values for the monitored period.
• Oxy Values with Full Disclosure (optional). This prints two-channel full disclosure of the ECG annotated with SpO2 values.
• Oxy Trend with Full Disclosure (optional). This prints full disclosure of the ECG, along with a trend of the SpO2 data at that time.
• Oxy Respiration - Full Disclosure (Apnea Patients Only)
To include a module in the report, the check box next to the module name in the Reports window must contain a check mark. Click an empty box to add a check mark, and click a check mark to remove it. To turn all of the modules on or off, click the All On/Off check box under the report module list; to change them all again, click the All On/Off check box again.
Including a heading on the front page of the report
The Patient Information module of the report includes a report heading so that you can customize the report for your facility. The heading consists of five lines of free-form text, with up to 34 characters per line. To enter text in a line, click on the field and type your entry. Click on each field in
turn and type. You can leave any line blank.
If your address comes up automatically, but you would like to change it for a partic-ular patient, click on the field, use the Delete/Backspace keys to clear what is there, and then type your entry.
To select an address from a different con-figuration (i.e., one you entered previously, but did not select when you started this new patient), click the List button. That opens the Report Headings window listing your options. Click your choice to high-light it, then click Copy to close the win-dow and replace the address.
Selecting which strips print in the report
Although both manually saved (those saved using the Keep button in the Review windows) and automatically saved strips appear in the Saved Strips window, they do not all need to be included in the final report. To include just the automatically saved strips, open the Reports window and select Automatic in the Saved strips field. To include just the manually saved strips, select Manual for that field. To include both types, select Both.
Report heading in Reports window
Choices for Saved strips
st Monitoring, Inc NEMM026-Rev-L Page 32 of 51
NorthEa
HE/LX Analysis Operator’s Manual - Basic Reporting: Final Report
w
If the final report is printed including either the half-sized or the full-sized strip module, it will include only those strips designated in the Saved strips field of the Reports window.
Full disclosure
Full disclosure is a printout of all the ECG recorded during the Holter monitoring period, in a miniaturized format. Each page is annotated with time-of-day along the left margin.
You can print full disclosure in a variety of formats based on the channels printed and the amount of time printed on each page. Full disclosure can be printed for a single channel (channel 1 or 2 or 3) or for two channels together on a page (channels 1 and 2, or channels 1 and 3, or channels 2 and 3). It can be printed with 30 minutes of ECG per page or 60 minutes.
Determining what to print in full disclosure
To request a full disclosure printout, select Reports from the Review toolbar. In the Reports window, there is a section with settings that control full disclosure. It includes three fields:
• Time per page check boxes. At the top of the section are two check boxes labeled 30 min/page and 60 min/page. To print full disclosure, there must be a check mark in one of these check boxes. Click on the check box to make a check mark appear in it; click on the other check box to put the check mark there and remove it from the first check box. To eliminate a check mark, click again on the check box.
• Channel(s) field. To indicate what channel(s) to print in full disclosure,
select an entry from the Channel field. Click on the arrow to display your choices, and then click on your selection.
• Intervals to include. Full disclosure can be printed for each hourly interval, all of the hourly intervals, or whatever combination you select. For each Holter test, the Intervals field lists all hourly intervals in the recording. To include an interval in the full disclosure printout, click on the check box next to the time-of-day at the beginning of the interval. Click on as many intervals as you would like to print. To eliminate an interval from the printout, click on the check box to get rid of the check mark. To check all intervals on or off, click on the All On/Off check box below the interval list.
Note: The time per page check boxes control how much total ECG is printed per page. If you choose to print two channels of ECG, the 30 min/page setting will print both channels during a 15-minute time period, and the 60 min/page setting will print both channels of a 30-minute time period.
Reviewing the Report SummaryA report summary is printed on the front page of the printed report. An optional comment page can be printed as the second page. To review and edit the information that appears on those pages, select Reports > View Summary.
Four different front pages can appear, based upon the type of patient that you are reviewing:
• Standard
• Oximetry
• 6-Minute Walk Assessment
• Sleep Apnea report (for Oxy patients with AHI#).
Information in the Standard Report Sum-mary includes:
• the length of time the patient wore the Holter recorder
• start time
• mean heart rate, calculated by dividing the total number of beats by the time analyzed
• maximum heart rate measured, based on a four-beat running average
• time-of-day at which the maximum heart rate was observed
• minimum heart rate measured, based on a four-beat running average
• time-of-day at which the minimum heart rate was observed
If oximetry data was recorded for the patient, the oximetry Report Summary appears.
Editing the Report summary
The View Summary window displays the front page as it will appear on the bottom of the first page of the report. Every char-acter can be edited, if you choose to do so. You can select the text and then delete it or type over it, or you can simply add to the information that is already there.
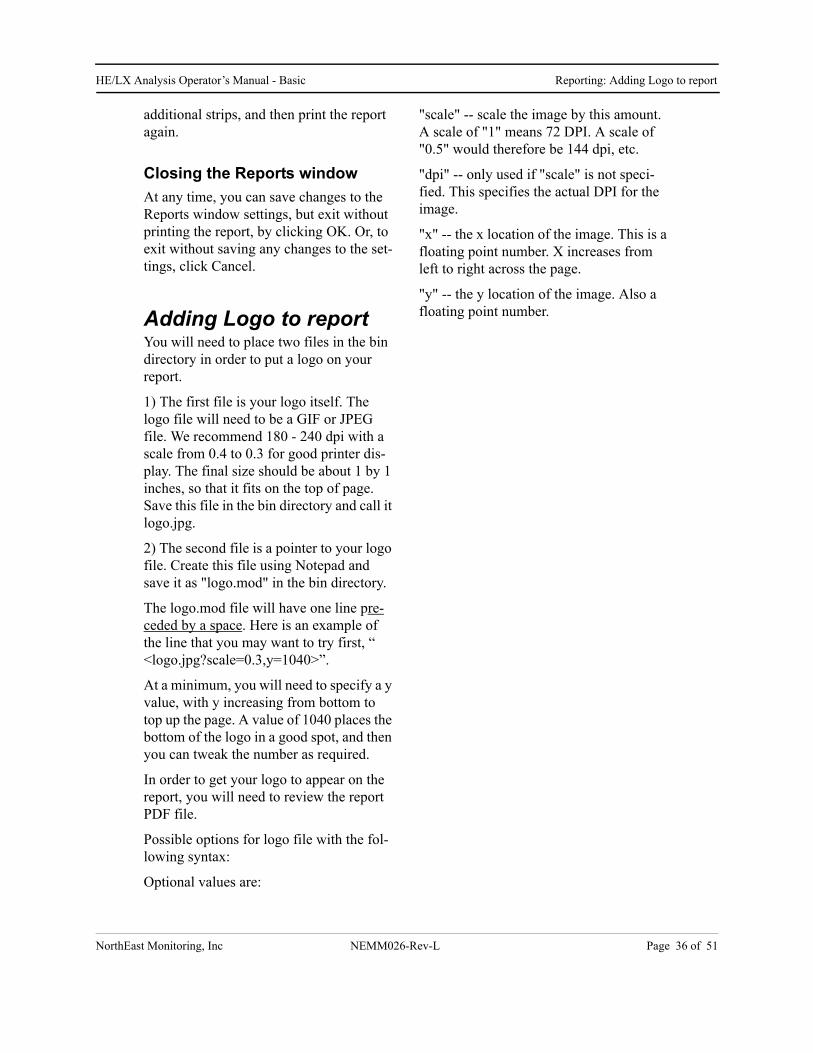
To add comments to the end of the sum-mary, click after Comments: and then either type the comment or select a line from the Phrases window in the left por-tion of the window; after selecting the phrase, click Add to copy it over into the Comments area.
The Phrases list appears only if you entered at least one sentence in Patient > Preferences > Summary phrases.
Note: Because the printed report includes the information from the Report summary exactly as it appears here in the Report Summary window, be sure to make changes carefully.
To access the additional Comment win-dow, click the Comments tab, then type the information you would like to appear on the Comments page of the report (typically page 2). Click on the Summary tab to return to the previous Report Summary window, the one that appears on the front page.
If you start making changes to the text in the Report Summary window, but then decide you would like to revert to the orig-inal information, click the Reset button; your changes to the Summary window will be deleted and the text will return to the original.
When the information in the window appears as you would like it, click OK to save your changes and exit. Click Cancel to exit without saving your changes.
st Monitoring, Inc NEMM026-Rev-L Page 34 of 51
NorthEa
HE/LX Analysis Operator’s Manual - Basic Reporting: Status indicators
Summa
Note: The Report Summary is newly compiled after any update or re-analysis, so do not make changes here until all other editing is complete. If you make changes and then update or re-analyze, you will have to re-enter your changes.
Status indicatorsNote that the Status indicators from the Patient Information window also appear here in the Reports window. Use them to keep track of whether a patient’s Holter has been edited, printed, and/or verified already. Click the check box to add or remove a check mark.
Reviewing the reportTo review the report on screen before printing it, click the Review PDF button at the bottom of the Reports window. This launches the Adobe Acrobat program that generates a pdf file for you to review on-screen.
When you click the Review PDF button, the report compiles and then is displayed on the screen, starting with page 1. The on-screen report appears as a continuous doc-ument that can be scrolled through. You see it on the screen in Acrobat Reader. Refer to Acrobat Reader documentation for user instructions.
The report cannot be edited or changed in any way in this display mode, but you can go back to the Review methods (Saved Strips, Page, and Trends win-dows), or to the Report Summary or the Patient
Information window to make changes before printing the final report.
If you would like to send this report to a different site, you can Save a Copy using the Adobe Acrobat software. You can then send the pdf file created, and the other site can use Acrobat Reader software to view and/or print the report.
PrintingWhen the fields within the Report window are set properly for a patient, click the Review PDF button for a final review.
Note: Sometimes when you click the Review PDF button on the bottom of the Reports window, a confirmation window appears asking, “OK to use the previously created report?” That means that a report has already been compiled for this patient’s Holter test. If you are sure that no changes have been made to any Holter setting or any information in the report, click Yes to print a report identical to the previously compiled one. If you are unsure whether any changes have been made, click No; a new report will compile and then print.
Once a new report is created, Adobe Reader will open and your report which is now an Acrobat file will be visible.
Note: In order to print, you must ensure that the Adobe Reader settings are appro-priate for the Holter report. In File > Print, (1) Print as Image must be turned on and (2) Expand small pages to paper size (version 5) or Fit on page (version 6) must be turned off. Printing the report without the proper settings will result in a non-diagnostic-quality printout.
At any point after printing the report, you can still edit the information and retrieve
st Monitoring, Inc NEMM026-Rev-L Page 35 of 51
ry phrases
NorthEa
HE/LX Analysis Operator’s Manual - Basic Reporting: Adding Logo to report
additional strips, and then print the report again.
Closing the Reports window
At any time, you can save changes to the Reports window settings, but exit without printing the report, by clicking OK. Or, to exit without saving any changes to the set-tings, click Cancel.
Adding Logo to reportYou will need to place two files in the bin directory in order to put a logo on your report.
1) The first file is your logo itself. The logo file will need to be a GIF or JPEG file. We recommend 180 - 240 dpi with a scale from 0.4 to 0.3 for good printer dis-play. The final size should be about 1 by 1 inches, so that it fits on the top of page. Save this file in the bin directory and call it logo.jpg.
2) The second file is a pointer to your logo file. Create this file using Notepad and save it as "logo.mod" in the bin directory.
The logo.mod file will have one line pre-ceded by a space. Here is an example of the line that you may want to try first, “ <logo.jpg?scale=0.3,y=1040>”.
At a minimum, you will need to specify a y value, with y increasing from bottom to top up the page. A value of 1040 places the bottom of the logo in a good spot, and then you can tweak the number as required.
In order to get your logo to appear on the report, you will need to review the report PDF file.
Possible options for logo file with the fol-lowing syntax:
Optional values are:
"scale" -- scale the image by this amount. A scale of "1" means 72 DPI. A scale of "0.5" would therefore be 144 dpi, etc.
"dpi" -- only used if "scale" is not speci-fied. This specifies the actual DPI for the image.
"x" -- the x location of the image. This is a floating point number. X increases from left to right across the page.
"y" -- the y location of the image. Also a floating point number.
st Monitoring, Inc NEMM026-Rev-L Page 36 of 51
5. PREFERENCESYou can customize certain parts of the HE/LX Analysis software to better suit the needs of your facility. The customization options range from entering the names of physicians who order Holter tests - so that you don’t have to type them in each time - to which Review window you want to come up automatically at the end of analysis.
NorthEast Monito Page 37 of 51
ring, Inc NEMM026-Rev-L
Preferences windowTo open the Preferences window, select Patient > Preferences. The following options are available:
Draw grid
You can choose whether or not there is a background grid behind the Expanded strip dis-played in the Page window. Click on the Draw grid check box to change the setting. A check mark indicates that a light grid will appear. No check mark means that the grid will not appear.
Faxable report
When checked, gray backgrounds will be suppressed so that the report can be faxed.
After analysis show
This field allows you to deter-mine which window is dis-played upon the completion of analysis. Your choices include any of the Review windows and the Reports window. To change the setting, click on the arrow in the field to display the list of choices, then click on your selection.
Physician and Interpreting physician entries can be entered, edited and deleted here, allowing you to make a selection from a list instead of typing the physician names for each patient in Patient Informa-tion. Additionally, if you turn on the Save new Physician or Interpreting physician Preference setting described earlier in this chapter, you can add new names to the list automatically when entering new physi-cians in the Patient Information window.
To create an entry, click on the “Add new item” button, go to the new line and enter the item. Hit the Enter button on the key-board to save and add more if you like.
To exit without saving changes, click Can-cel. To edit just click on a line and then update, and to delete an entry, click on the trash can next to line you want to remove. Click OK to exit the screen when finished.
Summary phrases
You are able to customize entries for the Comments area of the Report Summary section of the printed report using this but-ton. Edit the items using the same instruc-tions found for the physician screen above.
The sentences on this screen are available for you to select when you display Reports > View Summary, so that you don’t need to re-type common phrases.
st Monitoring, Inc NEMM026-Rev-L Page 38 of 51
6. ARCHIVE PATIENTS
Before the Patient List directory is full, you will want to archive and delete patient records to make room for new ones. You can choose to do this manually or it can be automated to run on a regular basis.
The HE/LX Patient Archive Tool
NorthE
HE/LX Patient Archive is accessible by going to the File > Open/New > Patient List and clicking the Archive button at the bottom of the screen. The Archive tool has two tabs - Archive Patients and Restore Patients.
Archiving a patient consists of two steps: 1) copy the patient to the Archive folder and 2) delete the patient from the Patient List. Once archived, if you need to go back to a patient who has been Archived and deleted from the Patient List, you can go to the Archive folder and restore the patient back to the Patient List.
Archive Type
From the toolbar, you can select an Archive Type. Archive Type “Full”, will copy all patient data, including the entire Holter recording and report; and Archive Type “Report only” will save an electronic version of the patient’s Holter report, including ECG strips, but not the recording. Only by doing an “Full” Archive, can the patient’s Holter data be restored and reanalyzed.
Compression Level
Increase the compression level to save disk space when archiving. The more compressed the file, the longer archiving will take.
Archive Patients TabThe HE/LX Patient Archive Tool will initially open with the “Archive Patients” tab selected. Once opened, all patients who can be archived will be highlighted in blue. A patient is high-lighted in blue when:
1. They have been analyzed2. They have a report3. They have never been archived previously,
or their information has been updated since they were last archived.
If you want to override the highlighted patients, you can hold the Shift-key and click on any directory in order to manually select or deselect it. When finished, click the “Archived Selected Patients” button at the bottom of the screen and the selected patients will be copied to the Archive folder.
Note: If a Patient is opened and viewed, but not updated, the system will perceive this patient as being updated and show that the patient needs to be archived again. To ensure that this does not become a problem for you, be sure to wait to archive a patient until you are sure that they will most likely not be viewed or reviewed again.
Delete Patient Records
Once archived, you will want to delete the patients from the Patient List in order to make room for new patients. The Archived check box, labeled “A” on the Patient List, will show you which patients have been archived and can be deleted at this time.
Customizing Screens
Just like the primary Patient List, you can customize any of the archive lists by chang-ing, moving
and resizing columns. Select columns by right-clicking on any of the column headings and then on “Update Columns.” You can also search on each list by typing into the Search box at top of the screen.
Restore Patients TabYou can only restore patients when a Full Archive type has been performed.
To restore a patient that has been archived and deleted from the Patient List, select the Restore Patients tab on the HE/LX Patient Archive Tool. When selected, it will be blue. You will now see a searchable list of all archived records on the right. Select the archived patient you want to restore on the right, and an empty patient directory on the left. Then click the Restore Selected Record at the bottom of the screen to copy the patient back to the Active Patient List.
Delete record after Restore
At this time, if you want to delete the Archived record of the patient you just restored, you can go to the toolbar and select Archive > Delete Selected Archive Record.
Report only Archive
If you archived patients using the “Report Only”
option, you will not be able to restore those patients as they no longer have the ECG file. Instead, you can View the patient’s report by clicking on the View button at the bottom of the screen.
Restore “Full” Archived Records
Restore Patient Tab
e Patient Tab
st Monitoring, Inc NEMM026-Rev-L Page 41 of 51
NorthEa
HE/LX Analysis Operator’s Manual - Basic Archive Patients: Auto Archive
Auto ArchiveThe Archive process consists of two actions, both of which can be run automat-ically on a schedule or initiated by you by clicking the Auto Archive button from the Archive Window. The two pieces to archiving are:
1. Copy a patient from the Patient List to Archive after a defined number of days that the patient has a report created or modified
2. Delete the patient from the Patient List after a defined number of days after the patient has been Archived and no subsequent changes to the patient have been made.
Scheduling Auto Archive
You can schedule the Archive program to run in the background. You can do this by setting up a Scheduled Task from Control Panel > Administrative Tools. The com-mand that should be entered where “c:nm” is the location where the HE/LX Analysis is installed:
Java must be installed for the Archive pro-gram to run. The Archive.ini file in that directory can be modified to meet your specific business needs.
Archive.ini
An Archive.ini file is included in the installation in the bin directory. The direc-tory where the archived files are saved can be changed here. Additionally, the number of days criteria used to Archive and/or Delete patients can be found and edited in this file. They are:
• AutoArchiveDays - the number of days after a patient has a report created that the patient will be copied to the archive directory. Make -1 to turn this feature off.
• AutoDeleteDays - The number of days after a patient is archived that the record will be deleted from the Patient List. Make -1 to turn this feature off.
Scheduled Task Example
st Monitoring, Inc NEMM026-Rev-L Page 42 of 51
7 LICENSING & UTILITIES
NorthEast
LicensingFor Permanent and Timed licensing, a physical HASP soft-ware key must be plugged into your PC or your network. When licensed to do so, a key can be shared by many users. The license file, license.ini, must be installed in the bin directory on each PC where HE/LX has been installed.
UtilitiesWhen installing the software, two additional utilities have been installed with the HE/LX Analysis Software: 1) HASPFinder and 2) Settings. Both utilities have been installed under “NorthEast Monitoring” programs list.
HASP Software Key and HASPFinder UtilityThe HASP software key must be plugged into your com-puter or a visible net-work, and a
license.ini file must exist for the HE/LX Analysis software to run. The HASPFinder utility will look up and show you if a NorthEast Monitoring HASP key is visible to the computer. HASPFinder will also tell you if the HE/LX Analysis has a license.ini file and if the license.ini file matches the HASP key.
Settings UtilityIn Settings, you can enter the names of both your facility and the primary user of your Holter software, along with five lines for the name and address that appear in the Reports window when you print a Holter report.
Changing Language
The drop-down box will show the list of languages that are currently supported in the software. To change the language used throughout HE/LX Analysis, make your selection from the drop-down menu asso-ciated with the Language field. In order to have the languages be presented through-out the system, you should now create a new configuration using your new lan-guage so that report names, etc. are correct throughout. The “Standard” configurations will always remain in English.
Number of Patients
To change the number of directories stored on the Patient List, you can enter a differ-ent number here. If you choose to increase the number, additional directories will be created, but if you need to decrease the number of directories, you will need Win-dows Explorer to do so, but be sure that the directories you are deleting are either empty or the patient data has already been archived.
NorthEast Monitoring recommends that you have no more than 500 patient directo-ries, as when more than 500 exist, the speed of the system may be compromised. See Chapter 6 for more information on Archiving patient directories.
Go to and Restore Demo Patient buttons
If there is ever a time that you are unable to start the software because of a problematic patient record, you can use the Go to Demo Patient button to open the software. If for some reason the demo patient has been deleted, you can first restore it using the Restore Demo Patient button.
Setting up Shared Network Patient DataBeware that this will slow down response time, depending on the speed of your network. If you choose to set up network patient data, do the following below.
First, determine the location and number of patient directories.
Then, on each client machine, open the h4w.ini file that is located in the c:\nm\bin directory and do the following:
2. Modify the line that immediately fol-lows [PatientParentDir]:
from: c:\nm\pat, xxxto the network path for the base of the patient directories followed by a comma and the number of directories that you choose to have created ini-tially.
Next, start the HE/LX Analysis software on a single client machine. It will create the number of directories you specified on the network machine. (The system may fail as there is no demo patient yet.)
Lastly, and very important, copy and paste the “demo” patient directory from the cli-ent machine to the patient directory on the network.
st Monitoring, Inc NEMM026-Rev-L Page 45 of 51
APPENDIX A - CALCULATION OF HEART RATE
NorthE
Types of heart ratesA variety of heart rate calculations are made by the HE/LX Analysis software. They include:
• Current heart rate
• Minute-by-minute heart rate
• Beat-by-beat heart rate
• Mean heart rate in intervals
• Mean heart rate for Holtered period
• Second heart rate
• Heart rate strips
Current heart rate
This is a complex function that takes the current beat and the beats preceding it into account. This weighted average follows these rules:
3. If the differences between the adjacent beats of the preceding four RR intervals are no more than 12 percent of the average RR interval for the previous beat and the beats are all normal, then the new average RR interval is the simple average of the previous four RR intervals.
4. If the previous four RR intervals were NOT bigeminy, VTAC or SVT AND the current RR interval is within 25 percent of the previous average AND the previous two beats were not ventricular AND the previous 10 beats were not supraventricular, then the new average RR interval is 1/8 of the current RR interval plus 7/8 of the previous average.
5. If the previous four RR intervals were NOT bigeminy, VTAC or SVT AND the current RR interval is not within 25 percent of the previous average OR any of the previous two beats were ventricular OR any of the previous 10 beats were supraventricular, then the new average is 1/32 of the current RR interval plus 31/32 of the previous average.
6. If the previous four RR intervals were bigeminy, VTAC or SVT, then the average RR interval is changed by 0.000087 seconds. It is increased if the current interval is longer than the previous interval, otherwise it is decreased.
ast Monitoring, Inc NEMM026-Rev-L Page 46 of 51
North
HE/LX Analysis Operator’s Manual - Basic Appendix A - Calculation of Heart Rate
Once the current average RR interval is determined, the current heart rate is calcu-lated as 60 divided by the current average RR interval, that is, current HR = 60/(current RR interval).
The current heart rate is used as the heart rate that appears in the heart rate data field for any displayed strip. This includes the heart rate associated with any strip in the Selected Strips window and in the printed report.
The current heart rate is also used to detect tachycardia and bradycardia. The onset of either is determined to be when the current heart rate reaches the tachycardia or brady-cardia settings in the Scanning Criteria win-dow.
The low and high heart rates reported in the Tables window and in the tables of the printed report refer to the lowest and highest current heart rate calculated during the inter-val.
Heart Rate calculation limits
The absolute limits are 20 and 300 (3 sec-onds to 0.2 seconds). If the “additional dead time” is not set to zero, then this upper limit can be lowered further. If the “additional dead time” is set to 0.1 or greater, then the HR upper limit is = 30 / (additional dead time).
Minute-by-minute heart rate
The heart rate plotted in the Trends window is a minute-by-minute heart rate. It is calcu-lated as 60 times the number of beats pro-cessed in the minute divided by the sum of all RR intervals of beats processed in the minute (in seconds).
Beat-by-beat heart rate
The heart rate associated with each beat in expanded displays whenever the Annotation field in the Preferences window is set to
Heart Rate is the beat-by-beat heart rate. It is calculated based on the RR interval follow-ing the labeled beat. Beat-by-beat heart rate equals 60 divided by RR interval, that is, HR = 60/(RR).
Mean heart rate in intervals
In the tables (in Tables window and printed report), the mean heart rate within each inter-val is calculated by dividing the number of beats in that interval by the amount of time processed within the interval.
Mean heart rate for Holtered period
In the Report Summary (in the Report Sum-mary window and printed report), the mean heart rate during the Holter test is the number of beats counted divided by the amount of time processed.
Second heart rate
The second heart rate is the heart rate associ-ated with a run of VTAC or SVT. It is calcu-lated as 120 divided by the sum of the current RR interval and the previous RR interval. The second heart rate appears in strips with VTAC or SVT in Selected Strips, the printed report, and the strip list, labeled HR2.
The second heart rate is used to determine where in the ventricular and supraventricular run tables a run of VTAC or SVT appears. The heart rate separating fast from slow runs is determined by the VTAC and SVT settings in Scanning Criteria, but the rate of each event is considered to be the second heart rate.
The second heart rate is also used to deter-mine which run is identified as the fastest run of VTAC and SVT.
East Monitoring, Inc NEMM026-Rev-L Page 47 of 51
NorthEa
HE/LX Analysis Operator’s Manual - Basic Appendix A - Calculation of Heart Rate
Heart rate strips
In the Critical Events window, there is a choice in the Type field called “HR strips.” This displays all ECG from the Holter test divided into 7.5-second strips. Each strip includes a time-of-day and a Strip HR. That Strip heart rate is the total number of RR intervals (including partial ones, but excluding artifact) within the strip divided by the sum of the RR intervals.
Defining dead-time
Dead-time is the amount of time (in sec-onds) after a detected QRS complex during which the software will not look for
another QRS complex. Generally, this helps to prevent the mis-identification of tall T-waves as QRS complexes.
The operator can add more time to the tailend of the dead-time using the Extra dead-time setting in the Scanning Criteria win-dow. Because the recovery time (i.e., thewidth of the T-wave) varies with heart rate,the dead-time built into the softwareadjusts based on the current heart rate. Athigher rates, the dead-time decreases, andat lower rates, the dead-time increases.:
Requirements:You will need the following in order to run LX Sleep - Apnea as part of your HE/LX Analysis software:
1. A HE/LX Analysis license that allows for LX Sleep. This license file comes with your software and once installed will be labeled license.ini.
2. An additional license file called license_AHI.ini. to enable LX Sleep. This file should be loaded into your c:\nm\bin directory or the bin directory where the HE/LX Analysis software was installed.
3. A Sentinel SuperPro USB dongle key to enable LX Sleep.
Installation:
Additional software requirements are:
• When installing HE/LX Analysis, do a “Complete” installation of the HE/LX Analysis software. The installation will require loading MATLAB and special Microsoft C++ software.
• Additionally, you will need to have Sentinel Protection Software installed. This software can be found on the install DVD under support_files or at nemon.com on the Technical Support page under Support Files.
• Under Support Files you can also copy the Dongletest.exe file to the bin directory of your installation. When run, Dongletest will confirm that the system can see the SuperPro USB dongle key.
TroubleshootingIf for some reason you cannot start the HE/LX software and are getting the message that there is no license, confirm that the license. ini and license_AHI.ini are set up correctly.
ast Monitoring, Inc NEMM026-Rev-L Page 49 of 51
NorthE
HE/LX Analysis Operator’s Manual- Basic Appendix C - Test Issues
Apnea Trend / AHI Probability chart
If you purchased the LX Sleep feature, and are using the OxyHolter Recorder, an apnea probability trend will appear at the below the Oximetry trend. The Apnea Trend will cal-culate an AHI# for a patient once Apnea analysis is run. A set of buttons labeled “Apnea” at the top of screen allows you calculate the AHI# and also allows you to turn on/off time periods from being included in the AHI (apnea probability index) analysis.
Only data highlighted in blue is considered when determining apnea probability or the AHI. To turn on or off data, highlight the area (turns pink) on the Apnea trend using your cursor, and press the appropriate - On or Off - button. Click Apnea -> Run Apnea to get the new AHI for the selected time period. HR or Oxy trend data that has been highlighted as being artifact, will be automatically excluded from the analysis.
Once an AHI# is calculated, you will see the updated Apnea trend and the Apnea Proba-bility Chart on the bottom of the screen. If your patient’s calculated AHI# is less than 5, no OSA has been detected. If the AHI# is 5 or greater, and less than 15, then OSA is possible. For patient’s with AHI# of 15 or greater, there is a high probability of OSA.
In order for the Apnea analysis to work, at least 4 hours of time must be included in the AHI calculation. By default, the system uses recording time between 9pm and 8am as the start and stop times, and you can override the start and stop times by highlighting the Apnea trend and using the Apnea On / Off buttons at the top of the screen. If for some rea-son the system is unable to calculate an AHI, it will return a message “AHI# cannot be cal-culated using selected Apnea trend” of “NaN” (not a number.) This is most likely because not enough time was included in the calculation of AHI either because of excessive arti-fact, especially on channel 1, or too short of a sleep period.
Apnea Analysis s
Apnea Analysis Outputs
ast Monitoring, Inc. NEMM026-Rev-L Page 50 of 51
APPENDIX C -TEST ISSUES
The following is a list of issues that have been identified in this version of the Basic level
NorthEast M
software:
1. When modifying the front page, a user cannot cut and paste from Microsoft Word. The user can cut and paste from Notepad.
2. If you use installer to Modify software, the desktop links may break. Running the installer again in Repair mode will fix the links.
3. The status window may not appear while analyzing local patients. 4. For Sleep patients, if the user changes the times that are included in Full Disclo-
sure on the Reporting screen, the AHI# will have to be recalculated. 5. For Sleep patients, if the user updates the trend, you will need to do a manual
Update before calculating AHI# as the system will update the data again once you leave the trend screen and the AHI calculation will be lost.
6. Desaturation Table - Right clicking and double-clicking on a line does not func-tion as advertised.