In last time, a recurring theme in work of laboratory medicine, the interference in laboratorytesting, which can drives to falsely results and which can leads to delay in disease recognition, havebeen assessed in works of laboratory.
1 Chapter 1 Variability of Bilirubin Values in Serum Samples with High Triglycerides; Interference or Congenital Liver Syndromes ABSTRACT Background In last time, a recurring theme in work of laboratory medicine, the interference in laboratory testing, which can drives to falsely results and which can leads to delay in disease recognition, have been assessed in works of laboratory. The aim of this work was to identify and to interpret the variability of bilirubin values in serum samples together with high values of Triglycerides and variable values of Cholesterol, for to exclude a congenital liver syndrome because of interference in serum, to patients which were presented in a private laboratory for the para-clinical controls. Method In our prospective study, in time of 30 days, we have analyzed 160 patients which performed 10 major tests; 5 substrates/chemistries: cholesterol, total bilirubin, conjugated bilirubin, un- conjugated bilirubin, triglycerides, 5 enzymatic tests, AST, ALT, ALP, LDH, GGT, measured on automatic analyzer Hitachi 912 and hepatic viral markers (Ag HBS, Anti HCV) performed on Elisa Analyzer. The additional samples, hemograms with differential count and reticulocytes, were accomplished on Coulter Analyzer with 22 hematological parameters. From the total patients 70 were females (20-30 years, mean age= 26, SD=2.6) and 90 males (25-36 year, mean age 30, SD=2.8). Results: Laboratory studies revealed the following: -to patients from cohort study, the healthy young patients with all normal analysis, were registered in 90 % percent (n=.144). -were registered in 6.8% of cases an increased of total bilirubin (average = 1.4-7.7 mg/dl, mean value =1.99 mg/dl, interval of reference = 0.2-1.0; CV= 0.13 p = 0.02 ) and an increase of un- conjugated bilirubin (average = 1-4.9 mg/dl, mean value =1.45 mg/dl, interval of reference = 0.3-0..7 mg/dl; CV=0.18, p=0.01), results correlated with normal liver enzymes, but with high triglycerides in values of past 243 mg/dl, in samples without macroscopic aspect of turbidity. After performing un-conjugated bilirubin tests, from samples with high triglycerides, in dilution 1/5, only 2.8% of tests were with normal values of un-conjugated bilirubin, (negative predictive value=66%) and 4% of tests have had the same high results of un-conjugated bilirubin, resulting a congenital liver syndrome, (positive predictive value=72%). Conclusions: Elevated values of triglycerides, correlated with increased levels of total bilirubin in these cases, can present a differential diagnosis with liver congenital syndromes with isolated high indirect bilirubin values (Gilbert's Syndrome or Crigler Najar Syndrome). Abbreviations: 1. CSN-Crigler Najar Syndrome 2. GGT-Gama-glutamyltransferase 3. G6PD-Glucose-6-Phosphatase 4. GS-Gilbert's Syndrome 5. UGT1A1- Uridine-diphosphate-glucuronosyltransferase isoform 1A1
Transcript
1
Chapter 1 Variability of Bilirubin Values in Serum Samples with High Triglycerides; Interference or Congenital Liver Syndromes ABSTRACT Background In last time, a recurring theme in work of laboratory medicine, the interference in laboratory testing, which can drives to falsely results and which can leads to delay in disease recognition, have been assessed in works of laboratory. The aim of this work was to identify and to interpret the variability of bilirubin values in serum samples together with high values of Triglycerides and variable values of Cholesterol, for to exclude a congenital liver syndrome because of interference in serum, to patients which were presented in a private laboratory for the para-clinical controls. Method In our prospective study, in time of 30 days, we have analyzed 160 patients which performed 10 major tests; 5 substrates/chemistries: cholesterol, total bilirubin, conjugated bilirubin, un-conjugated bilirubin, triglycerides, 5 enzymatic tests, AST, ALT, ALP, LDH, GGT, measured on automatic analyzer Hitachi 912 and hepatic viral markers (Ag HBS, Anti HCV) performed on Elisa Analyzer. The additional samples, hemograms with differential count and reticulocytes, were accomplished on Coulter Analyzer with 22 hematological parameters. From the total patients 70 were females (20-30 years, mean age= 26, SD=2.6) and 90 males (25-36 year, mean age 30, SD=2.8). Results: Laboratory studies revealed the following: -to patients from cohort study, the healthy young patients with all normal analysis, were registered in 90 % percent (n=.144). -were registered in 6.8% of cases an increased of total bilirubin (average = 1.4-7.7 mg/dl, mean value =1.99 mg/dl, interval of reference = 0.2-1.0; CV= 0.13 p = 0.02 ) and an increase of un-conjugated bilirubin (average = 1-4.9 mg/dl, mean value =1.45 mg/dl, interval of reference = 0.3-0..7 mg/dl; CV=0.18, p=0.01), results correlated with normal liver enzymes, but with high triglycerides in values of past 243 mg/dl, in samples without macroscopic aspect of turbidity. After performing un-conjugated bilirubin tests, from samples with high triglycerides, in dilution 1/5, only 2.8% of tests were with normal values of un-conjugated bilirubin, (negative predictive value=66%) and 4% of tests have had the same high results of un-conjugated bilirubin, resulting a congenital liver syndrome, (positive predictive value=72%). Conclusions: Elevated values of triglycerides, correlated with increased levels of total bilirubin in these cases, can present a differential diagnosis with liver congenital syndromes with isolated high indirect bilirubin values (Gilbert's Syndrome or Crigler Najar Syndrome). Abbreviations: 1. CSN-Crigler Najar Syndrome 2. GGT-Gama-glutamyltransferase 3. G6PD-Glucose-6-Phosphatase 4. GS-Gilbert's Syndrome 5. UGT1A1- Uridine-diphosphate-glucuronosyltransferase isoform 1A1
2
Introduction Good communication between the laboratory staff and clinicians doctors is imperial as it is very important to provide the correct results of laboratory analyses to patients and also the laboratory staff must have the patient history in order to correlate assessed tests ([1). The bilirubin is the by product of the catabolism of heme. Normal disposition of bilirubin involves its transport to the liver where it is conjugated to the sugar molecule, glucuronic acid. The conjugation of bilirubin is catalyzed by the enzyme bilirubin UDP-glucuronyltransferase (bilirubin-UGT), [Figure 1].
Figure 1 The bilirubin conjugated to glucuronate is catalyzed by the enzyme Bilirubin UDP-glucuronyltransferase (Bilirubin-UGT).
The tests for liver "function" consist in assessing aminotransferases (ALT and AST), total bilirubin( TB), conjugated bilirubin(Bc) and unconjugated bilirubin( Bu), LDH, GGT, albumin, and prothrombin time. Of these tests, only the albumin, the albumin / total protein, the bilirubin and prothrombin time reflect the hepatic function. For other functions of liver, such as drug metabolism, nutrient storage, intermediary metabolism, the enzymes ALP, GGT and 5'-nucleotidase, are most useful as markers of cholestatic liver injury. All 3 of these enzymes are glycosylphosphatidylinositol-anchored membrane proteins (2.3, 4).
Causes of hepatitis are many, including viruses (e.g., hepatitis A, B, and C), toxins (e.g., acetaminophen), alcohol, ischemia, Reye syndrome, and autoimmune diseases. Aminotransferase can often be increased by as much as 50 times the upper reference limit in acute viral, ischemic, and toxic hepatitis, whereas in alcoholic hepatitis the increases are generally <10-fold. The usually
3
higher value for ALT than for AST is most likely due to the exclusively cytoplasmic distribution of ALT and the longer half-life period in the blood (approximately 50 h) than for AST (approximately 16 h). The exception is alcoholic liver disease, in which the AST/ALT ratio is often >2. Regardless the cause, chronic hepatitis is characterized by milder and fluctuating increases in the aminotransferases. Other hepatic causes for the increase in aminotransferases include hemochromatosis, nonalcoholic fatty liver disease, and Wilson disease (5, 6).
Genetic abnormalities of liver bilirubin were registered as a percent of 5% of the general population. Depending on the etiology, jaundices may include:
1. Jaundices by shunt (are rare) as a result of accelerated erythropoiesis after bone marrow disorders resulting in early destruction of immature red elements. (Reye Syndrom),(7).
2. Jaundices of production appear behind some massive hemolysis, due to corpuscular abnormalities (Hereditary Sferocytosis, Paroxysmal Hemoglobinuria Nocturne, Glucose 6 Phosphatase deficiency (G6PD) or extra-corpuscular hemolysis of red cells (toxic syndromes, auto-immune anemia, hemoglobinopathies).
3. Congenital jaundice of transport which is characterized by the decrease or absence of some intracellular protein transport of bilirubin (lack of endothelial receptor for albuminin in liver cells, lack of organic anion binding protein, lack of endoplasmic reticulum ligands from liver cells, for bilirubin molecules.). 4. Jaundice of conjugation, which is due by the reduced levels or absence of uridil-glicuronil-transferze enzyme. The Gilbert Syndrome (GS) is caused by an approximately 70%-75% reduction in the glucuronidation activity of the enzyme Uridine-diphosphate-glucuronosyltransferase isoform 1A1 (UGT1A1). The gene that encodes UGT1A1 normally has a promoter region TATA which contains the allele A (TA6) TAA. GS is most commonly associated with homozygous A (TA7) TAA alleles ([8). If this enzyme UGT1A1 is missing in fetal hepatocytes cause Crigler Najar syndrome (CNS). Crigler Najar syndrome is a rare disorder affecting the level of conjugated bilirubin (Bc) The disorder means an inherited non-hemolytic jaundice, often leading to brain damage to infants. This syndrome is divided into two types: type I and type II. Crigler-Najjar syndrome, type II differs from type I in several aspects: -bilirubin levels are generally below 345 µmol/l ((10 – 20.1 mg/dl); [Bilirubin in mg/dl x 17.1 = Bilirubin in µmol/l)]; thus some cases are only detected later in life because of lower levels of serum bilirubin, kernicterus is rare in type II and mon-conjugate bilirubin constitutes the largest fraction of bile conjugates (10). 5. Jaundices of secretion, in which normally exist the transport and the proper conjugation of bilirubin in fetal hepatocytes, but its delivery from liver cells is blocked by lipofuscin pigment which can make biliary obstruction in lthe liver (Dubin Johnson syndrome) or deposition of pigment in biliary intra-hepatic way (Rotor Syndrome). Dubin-Johnson syndrome is a very rare genetic disorder. In order to transmit the inherited condition, a parent must have a copy of the defective gen. Mild jaundice, which may not appear until puberty or adulthood is the only symptom of Dubin-Johnson syndrome (11). Scope
4
The aim of this work was to identify and to interpret the variability of Bilirubin values in serum samples together with high values of Triglycerides and variable values of Cholesterol, to avoid the loss of congenital liver syndromes in diagnosis of laboratory, because of the interference of analyts in samples of patients which have presented recently in a private laboratory for a routine para-clinical control. Material and Method In our prospective study, in time of 30 days, we have analyzed 160 patients which performed 10 major tests; 5 substrates/chemistries: cholesterol, total bilirubin, conjugated bilirubin, unconjugated bilirubin, triglycerides, 5 enzymatic tests, AST, ALT, ALP, LDH, GGT, measured on automatic analyzer Hitachi 912 and hepatic viral markers (Ag HBS, Anti HCV) performed on Elisa Analyzer. The additional samples, hemograms with differential count and reticulocytes, were accomplished on Coulter Analyzer with 22 hematological parameters. From the total patients 70 were females (20-30 years, mean age= 26, SD=2.6) and 90 males (25-36 year, mean age 30, SD=2.8). The chosen patients for this study did not have food or drinks at least 4 hours before the tests, the alcohol use has been estimated at more less 50 mg daily and patients had not taken medications for at least last two month before the tests, therefore it has been prevented any possibility that can increase bilirubin results in performed tests in dates of study. The samples were not kept for more than 5 days at -20º C in sample cups with 100 micro-liter volume, stored to dark. All the conditions of storage were respected as it is known that Bilirubin is light-sensitive and it breaks down to light. The interpretation of analysis was made after the principle of medicine based on evidence, by correlating of clinical conclusions of specialist physicians with results of liver tests, to the patients which presented medical letters in laboratory. During the physical examination it was revealed a healthy-appearing physic with no obvious abnormalities and on their medical letter was recorded that the sclera was un-icteric, the abdomen was soft, flat, without organomegaly and swelling of eyelids. The patients have not been in the evidence with an acute or chronic liver disease, cardiovascular, chronic metabolic or endocrine disease. All the results obtained were validated after it was accomplished calibrations of analyzer, internal [Table1, 2].
5
CHOLESTEROL
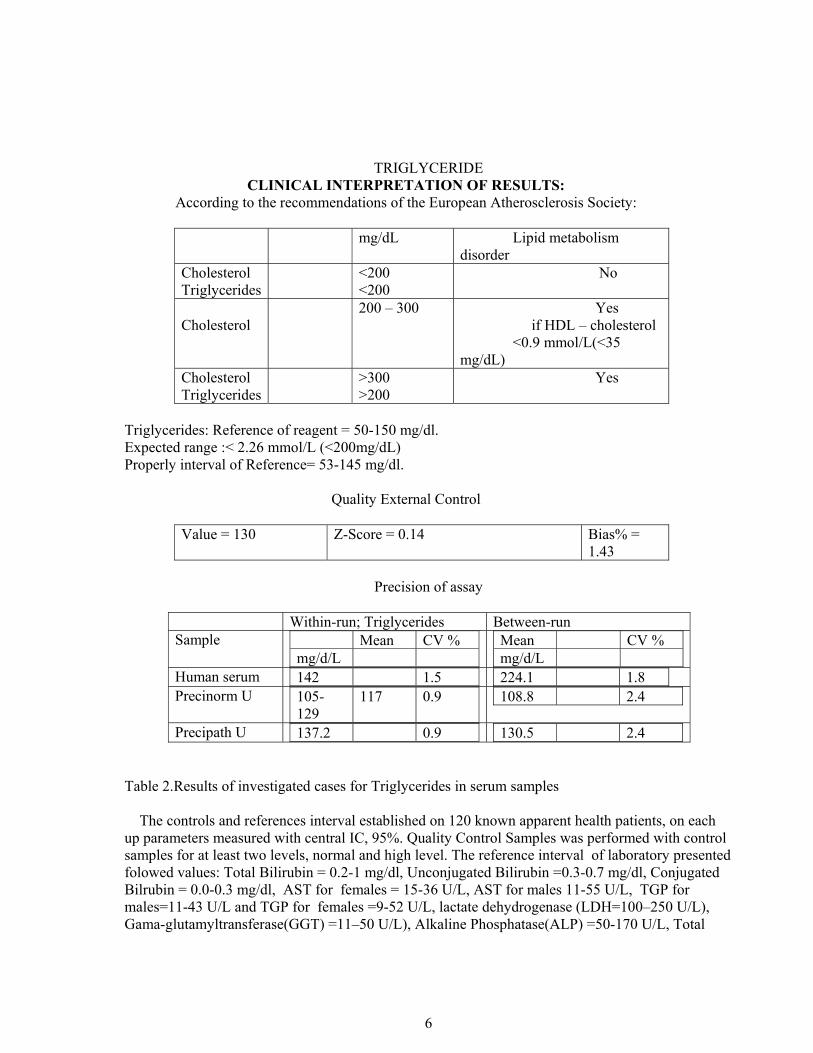
CLINICAL INTERPRETATION OF RESULTS: According to the recommendations of the European Atherosclerosis Society:
mg/dL Lipid metabolism disorder
Cholesterol Triglycerides
<200 <200
44 case = 26.4% No
Cholesterol
200 – 300 11 cases = 6.6% Yes if HDL – cholesterol <45 mg/dL for women and < 35% for men
Triglycerides: Reference of reagent = 50-150 mg/dl. Expected range :< 2.26 mmol/L (<200mg/dL) Properly interval of Reference= 53-145 mg/dl.
Quality External Control
Value = 130 Z-Score = 0.14 Bias% =
1.43
Precision of assay
Within-run; Triglycerides Between-run Sample Mean CV %
mg/d/L
Mean CV % mg/d/L
Human serum 142 1.5 224.1 1.8 Precinorm U 105-
129 117 0.9
108.8 2.4
Precipath U 137.2 0.9 130.5 2.4 Table 2.Results of investigated cases for Triglycerides in serum samples The controls and references interval established on 120 known apparent health patients, on each up parameters measured with central IC, 95%. Quality Control Samples was performed with control samples for at least two levels, normal and high level. The reference interval of laboratory presented folowed values: Total Bilirubin = 0.2-1 mg/dl, Unconjugated Bilirubin =0.3-0.7 mg/dl, Conjugated Bilrubin = 0.0-0.3 mg/dl, AST for females = 15-36 U/L, AST for males 11-55 U/L, TGP for males=11-43 U/L and TGP for females =9-52 U/L, lactate dehydrogenase (LDH=100–250 U/L), Gama-glutamyltransferase(GGT) =11–50 U/L), Alkaline Phosphatase(ALP) =50-170 U/L, Total
7
Cholesterol=109-220mg/dl, HDL=36-60 mg/dl, LDL=48-130 mg/dl and Triglycerides=53-145 mg/dl.. Results: Laboratory studies revealed the following: -to patients from cohort study, the healthy young patients with all normal analysis, were registered in 90 % percent (n=.144). -were registered in 6.8% of cases an increased of total bilirubin (average = 1.4-7.7 mg/dl, mean value =1.99 mg/dl, interval of reference = 0.2-1.0; CV= 0.13 p = 0.02 ) and an increase of un-conjugated bilirubin (average = 1-4.9 mg/dl, mean value =1.45 mg/dl, interval of reference = 0.3-0..7 mg/dl; CV=0.18, p=0.01), results correlated with normal liver enzymes, but with high triglycerides in values of past 243 mg/dl, in samples without macroscopic aspect of turbidity. After performing un-conjugated bilirubin tests, from samples with high triglycerides, in dilution 1/5, only 2.8% of tests were with normal values of un-conjugated bilirubin, (negative predictive value=66%) and 4% of tests have had the same high results of un-conjugated bilirubin, resulting a congenital liver syndrome, (positive predictive value=72%). On a parallel study of a cohort of 120 adolescent patients (12-18 ages), apparently healthy person, without evidences of any pediatric disease, all investigations of periodic control of analysis were normally and only 6 (5%) from cases were presented a isolated high un-conjugated bilirubin, suggesting Gilbert's syndrome which will be confirmed by cytogenetic studies. Discussions Spectral interference and the results of laboratory show that not only the choice of a methods is important on the analyzer, but and also how these methods have been adapted. By looking into these conditions carefully, it is sometime necessary to find a mod of solving for the problem and thereby a simple solution to correct it. If the different factors can do errors of the reaction, the user can chose a sample blank or not, can chose a secondary wavelength and such the influence of the interferences can be better kept under control. During the study was have particularly noted the poorly effective biochromatic procedures, the choice of the secondary wavelength did not always prove useful, and thus the «corrections» of samples were often done in an effective dilution. True high isolated values of bilirubin with mild jaundice, in different environmental factors, can affect the liver, pregnancy symptoms and can made worse in body by ingest of alcohol, pills in special contraceptive, and can increase the complications of infections and altering the physical and physical effort(12), [Table 3].
Table 3.Diseases and conditions with pre-hepatic, hepatic and post-hepatic jaundice.
1*- Drug-induced jaundice: allopurinol, anabolic steroids, some antibiotics, antimalaria medications, azathioprin, chlorpropamide, cholinergics, codeine, diuretics, epinephrine, meperidine, methotrexate, methyldopa, MAO inhibitors, morphine, nicotinic acid, birth control pills, phenothiazines, quinidine, rifampin, steroids, sulfonamides, and theophylline or decrease bilirubin measurements as barbiturates, caffeine, penicillin, and high-dose salicylates such as aspirin (2).
Elevated values of triglycerides, correlated with increased levels of total bilirubin in these cases, can present a differential diagnosis with liver congenital syndromes, with isolated high indirect bilirubin. Gilbert's syndrome produces an elevated level of unconjugated bilirubin in the bloodstream but normally has no serious consequences and is quite frequently in the population, in the rate of 5-6% from normal cases. The mild jaundice may appear under conditions of exertion, stress, fasting, and infections but some time is usually asymptomatic. It has been reported that GS may contribute to an accelerated onset of neonatal jaundice, especially in the presence of increased hemolysis due in diseases like G6PD deficiency. The enzyme which is defective in GS (UGT1A1 is also responsible for the liver's ability to detoxify certain drugs.UGT1A.(9).
The total bilirubin increased in high values may be a sign of Crigler-Najjar syndrome, Gilbert's disease, hemolytic anemia, hepatitis, physiological jaundice (normal in newborns) and thus the an additional analysis of the tests of Bilirubin may be performed. Hemolysis can be excluded by a full blood count, lactate dehydrogenase levels and the absence of reticulocytosis, elevated reticulocytes in the blood would usually be observed in haemolytic anemia. Conjugated bilirubin with increased values may indicate: cirrhosis , Dubin-Johnson syndrome (very rare) ,hepatitis intra-hepatic cholestasis (buildup of bile in the liver) due to any cause (11), [Table 4].
9
PARAMETER
TOTAL BIL
DIRECT BIL
INDIRECT BIL
AST; ALT LDH;GGT;ALP
RETIC. COUNT
VIRAL MARKERS
Normal Status
0.5-1.3 0-0.2 0.3-1.1 N 0.5-1.2%
Negative
Pre-hepatic Jaundice
↑
N ↑
N or ↑ ↑ -
Hepatic Jaundice
↑
↑
↑
↑↑
N +_
Gilbert Syndrome
↑
N ↑
N N -
Cligler-Najiar Syndrome
↑
↑
↑
N N -
Dubin Jonson Syndrome
↑
↑
↓
N N -
Pos-hepatic Jaundice
↑
↑
↓
AST ↑; ALT;↑; LDH ↑; GGT ↑; ALP ↑;
N -
Hemolitic Jaundice
↑ ↓ ↑
↑ AST, ALT, LDH;
↑ -
Interference of Tryglicerides
↑
N ↑
N N -
Table 4 Variability of Bilirubin Tests in Hepatic Jaundice*, Acute Hepatitis, Active Chronic Hepatitis, Chronic Persistent Hepatitis, Cirosis, Colestatic Syndromes, Liver Malignant Diseases or Metastasis.
It is good to know that Hitachi analyzer with a photocolorimetric system detects in sera samples the bilirubin measured on wavelengths of 546 nm (540-560) and by enzymatic method PAP, the Cholesterol and Triglycerides are measured on 505 nm wavelengths, (480-520) nm, in the same spectral region which exhibit the most interferences. For to avoid the misleading results are possible thee means. The first involves selection of methods that show minimal interferences. A second approach involves use of computerized techniques; common tools which include using of mathematical index delta checks, which can detect unlikely changes from previous results, and thirdly auto-verification rules for to detect medically unlikely results. If selected appropriately procedures, these rules call attention to sample results with a high-likelihood of being misleading (13).
Also in the laboratory must be detected the common interferences and assess their potential clinical impact, to troubleshoot pre–analytical sources of error that can lead to discrepant results, laboratory scientists must to identify interferences of tests from exogenous sources, such as drugs or herbal medicine and to implement strategies that can help manage test interferences. If the interference is the cause of a discrepant result, old–fashioned human detective work must to solve the problem (14).
10
Many of today's highly automated laboratory instruments have built–in mechanisms that help laboratories to identify samples integrity, to identify the test results that can are outside specified reference range and to identify outliers which require further investigations. These tools helps us to ensure accurate and precise testing, but can not always pick up problems caused by tests interferences and it is often hard to identify the cause, therefore is required an old–fashioned human technique for to detect the problem. Conclusions: High values of triglycerides can increase level of total bilirubin, Bu, Bc, and in laboratory must make a differential diagnosis with a form of hepatic congenital syndromes with isolated high bilirubin values The laboratory physician must detect the common interferences and he must to make the review of potential clinical impact. The pre–analytical sources of errors that can lead to discrepant results and for this we must implement strategies that can help to manage the test interferences.
REFERENCE
1. Young D. Effects of preanalytical variables on clinical laboratory tests. 3rd ed 2007; 1917: p AACC Press Washington (DC).
2. Blanckaret N, Gollan J, Schimid R. Bilirubin diglucuronide synthesis by a UDP-glucuronic acid dependent enzyme system in rat liver microsomes (hepatic metabolism/coniugation/bile pigments/glycosides/UDP glucuronosyltransferase. Medical Sciences.1979; 76(4): 2037-2041
3. Dufour DR. Burtis CA, Ashwood ER, Bruns DE, eds. Liver Disease, Tietz textbook of clinical chemistry and molecular diagnostics, 4th ed Elsevier Saunders Philadelphia 2006; p:1777-1847
4. Clarke, W, Dufour, D. R., Editors (2006). Contemporary Practice in Clinical Chemistry, AACC Press, Washington, DC. Pp 272-275
5. Lott JA, Wolf PL. Alanine and Aspartate aminotransferase (ALT and AST). Clinical enzymology: a case-oriented approach. Field Rich and Associates New York1986; p:111-138
6. Krishnamurthy S, Kevin M. Korenbla, Scott G M. Persistent Increase in Aspartate
Aminotransferase in an Asymptomatic Patient, Clinical Case Study. Clin Chem 2009; 55:1573-
1575
7. Thomas T, Kenneth A, Siegesmund P, Gerald V, and all. Reye Syndrome, A Correlated
Electron Microscopic, Viral and Biochemical Observation. JAMA 1975; 232(13):1339-1346
8. Bosma PJ, Chowdhury JR, Bakker C, Gantla S, et al. "The genetic basis of the reduced expression of bilirubin UDP-glucuronosyltransferase 1 in Gilbert's syndrome". New England Journal of Medicine 1995; 333 (18): 1171–5
9. Monaghan G, Ryan M, Seddon R, Hume R, et all. Genetic variation in bilirubin UPD-glucuronosyltransferase gene promoter and Gilbert's syndrome". Lancet1996: 347 (9001): 578–81.
11
10. Raijmakers MT, Jansen PL, Steegers EA, Peters. Association of human liver bilirubin UDP-glucuronyltransferase activity, most commonly due to a polymorphism in the promoter region of the UGT1A1 gene". Journal of Hepatology 2000; 33 (3): 348–351. 11. Berk PD, Korenblat KM. Approach to the patient with jaundice or abnormal liver test results. In: Goldman L, Ausiello D, eds. Cecil Medicine 2007. 23rd ed. Elsevier Saunders, Philadelphia (PA); chapt.150. 12. Kasper DL, Braunwald E, Fauci AS, Hauser SL, Longo DL, Jameson JL eds, (2005) Harrison's Principles of Internal Medicine, 16th Edition, McGraw Hill pp 1822-1833. 13. Lacher D. A. Relationship between delta checks for selected chemistry tests. Clin Chem 1990; 36: 2134-2136. 14. Henry’s Clinical Diagnosis and Management by Laboratory Methods. 21st ed. McPherson R, Pincus M, eds. Philadelphia, PA: Saunders Elsevier: 2007, pp: 271-274; 992-99.
12
Chapter 2
Variability of Biological Parameters in Blood Samples between two Consecutive Schedules of Hemodialysis
ABSTRACT Background Anemia, as a factor of diagnosis and prognosis in variety diseases, is an independent risk factor for morbidity and mortality in an array of common disorders to seniors, ills of acute or chronic renal diseases. The aim of this study was to identify the values and changes of hematological and biochemical parameters in blood samples between two consecutive schedules of hemodialysis and to assess the effect of plasma osmolality on errors of platelets count, to the hospitalized patients admitted in hospital with diagnosis chronic renal diseases complicated with chronic renal failure. Method The prospective study of laboratory was performed on 90 known patients with chronic kidney diseases( CKD) complicated with chronic renal failure(CRF), admitted in hospital, prior to undergoing schedules of dialysis, (55 men and 35 women), in average ages 35-65 years (mean, age 50, SD= +_2). The patients were analyzed once a month, all at the same day, to connection and after connection of hemodialysis schedules, in medical internal department. A routine anemia screening tests were used as HGB, HCT, erythrocytes indexes (MCV, MCH, MCHC, RDW), Reticulocytes count (RET %), being performed using an automated analyzer (Coulter HMX with 22 parameters) and for specific biochemical parameters in chronic renal failure were assessed serum iron, total iron binding capacity(TIBC), index saturation transferring ( IST), usually and specific biochemical tests: Glucose, Urea nitrogen, Creatinine, Sodium, Potassium, E CO2, on a dry chemistry analyzer Vitros 700(Ortho Diagnostics), Johnson $ Johnson. Three methods were used to assess platelet counts of hemodialysis patients: optical microscopy, peripheral blood smear and the user of the cytometry principle with impedance principle (VIC) by Coulter HNX hematological analyzer Results: From total patient in our study, a minority of patients, 36 patients (40%) had normal results for all hematological tests under monitoring treatment of specialty. In type of anemia from kidney chronic diseases, an additional 16 (18%) patients had normal HGB and HCT, but low MCV or MCH ((mean value 72 fL, SD= 2.1) or MCH (mean value 24.3pg, SD= 1.6). Other 28 patients (31%) had mild anemia (HGB decreased but > 106 g/L), while only 10 patients (11%) have had severe anemia. All individuals in the group with severe anemia had low RET (mean value 1.2%, range 0.5-1.5%), and RPI in mean value of <1.4, indicating a hypo-regenerative type of anemia. To the 54 patients with anemia of chronic kidney diseases (ACKD) and chronic renal failure( CRF) were registered in 30.90% of cases normal TIBC values (mean value 282 microgram/ d L, SD=2.5), low RPI in mean value of 1.33, low IST in mean value of 7.62%, with middle ineffective erythropoiesis and moderate iron deficiency anemia (IDA) and to 19.10 % of patients with ACKD and CRF associated with renal inflammations, were calculated low RPI, in mean value of 1.21, high TIBC value (mean value 468 microgram/d L, SD =2.4) and low IST in mean value of 6.5%, with severe ineffective erythropoiesis and severe IDA. In biochemical field, in this study on this cohort of hemodialysis patients, was obtained the variability of plasma osmolality past normal individual values (310 Osm/l), in the samples taken from the patients with chronic renal failure because of high values of Urea nitrogen (mean value 112 mg%; 40 mmol/L; SD = 2.40); Creatinine (mean value 5.5 mg/%;
13
4.85 mmol/L); SD=0.15); Sodium (mean value 170 mmol/L; SD=0.14); Potassium (mean value 14.5 mmol/l; SD=2.88); E CO2 (mean value 11 mmol/L; SD=0.26). The platelet count determined on the peripheral blood smear was used to complement data from the quantitative methods and provided morphological information. The performance of the methods of platelets count was assessed by Z score = < 1 = optic performance; 1 < Z < 2 = good performance; 2 < Z < 3 = satisfactory performance and Z > 3 = unsatisfactory performance. The differences were observed by use of optical microscopy in pre-dialysis, (mean value X⎯=261 x 10³μl; p = 0.020; SD=7.1; %Diff= 5.90; Z score=3.90) and post-dialysis, (mean value X⎯ 167 x 10³μl; p = 0.6; SD=4.2; %Diff= -7.10; Z score= -2.90), because of changes of morphology of platelets ( platelets ghost) in high plasma osmolality The suspect cases with hemolytic anemia were verified on biochemistry panel (unconjugated bilirubin, LDH) and in hematological field by direct test Coombs(DET), indirect test Coombs, reticulocytes presented in elevated number and also urobilinogen increased in urine analysis. Conclusions The anemia of hospitalized patients with chronic or acute renal diseases undergoing hemodialysis exists in our study in 60% from studied cases and must be managed of laboratory medicine in collaborative with the clinician. A routine anemia screening should be recommended using HGB, HCT and erythrocytes indexes MCV, MCH, MCHC and must be redefined the anemia by these common parameter for patients with renal diseases with CRF. An iron panel (serum iron, TIBC, IST% and RPI) is useful in identify of anemia from chronic kidney diseases associated with iron deficiency anemia. In platelets count the accuracy of the automatic method ensures a high quality count of hemodialysis patients. We concluded that it is needed of clinical guideline for the management of anemia in the patients with chronic renal diseases Abbreviations: ACD - Anemia of Chronic Disease; CFR- Chronic Renal Failure; CBC-complete blood count; CHr -reticulocyte hemoglobin; EPO -erythropoietin; HGB-hemoglobin; HCT - hematocrit; IDA - iron deficiency anemia; IST - index saturation transferrin; MA -megaloblastic anemia; MCV -mean cell volume; MCH - mean cellular hemoglobin; MCHC -mean cell hemoglobin concentration; RPI-Reticulocyte Production Index; TS - transferrin saturation; RDW 0 red cell distribution width; RET - reticulocyte count; SI - serum iron; sTR - soluble transferrin receptor; TIBC - total iron binding capacity
14
Introductiion Epidemiologic studies have suggested that anemia may be associated with poorer outcomes in a variety of disorders. The WHO criteria define anemia by hemoglobin (HGB) concentration of < 130 g/L for adult men and<120 g/L for adult females. A number of studies have reported differential distributions of anemia by age and sex, but less attention has been devoted to disparities in anemia by race. According to NHANES III estimates, older non-Hispanic blacks were 3 times more likely to have anemia compared to older non-Hispanic whites (27.8% vs 9.0%), (1). Nonetheless, recent evidence indicates that even mild anemia is independently associated with increased risk of recurrent falls, poorer physical function, hospitalization, and mortality in older adults (2, 3). Similar disparities in anemia prevalence have been observed in other population-based studies of older blacks and whites (4, 5).These observations have led some to consider race-specific criteria for defining anemia (6). A recent study in Iceland defined mild anemia as a hemoglobin concentration between 10.0 and 11.9 g/dL in women and between 10.0 and 12.9 g/dL in men (7). This cross sectional analysis provides evidence of anemia in 36.7% of hospitalized patients, and shows an association among anemia, poor nutritional status, and inflammation (8). Future research on anemia in the elderly should focus on the age-related physiologic changes underlying this condition and whether anemia correction can reduce anemia-associated risks, and improve quality of life (9, 10). Erythrocytes indices, derivatives from value of HGB and numbers of erythrocytes was used in correlation with serum iron to establish grades and types of anemia and was pathological results of these indices was noted as first signals of latent anemia in hematological diseases. Mean corpuscular volume (MCV) measures the mean or average size of individual red blood cells. To obtain the MCV, the hematocrit is divided by the total RBC count.
The MCV is an indicator of the size of red blood cells. MCV is measured in cubic micrometers or fento-liters (Reference values: adult men: 80-94 fl, women: 81-99 fl). Mean corpuscular hemoglobin (MCH) measures the amount, or the mass, of hemoglobin present in one RBC. The weight of hemoglobin in an average cell is obtained by dividing the hemoglobin by the total RBC count.
MCH is expressed in picograms of hemoglobin per cell (pg/L, 1 pg = 10-12 g). (Reference values: adult men; MCH = 27 - 31 pg, women = 27-30 pg). Mean corpuscular hemoglobin concentration (MCHC) measures the proportion of each cell taken up by hemoglobin. MCHC = Hemoglobin (g/L) / Hematocrit (%). The results are reported in percentages, reflecting the proportion of hemoglobin in the RBC. The hemoglobin is divided by the hematocrit and multiplied by 100 to obtain the MCHC. (Reference values: adults: MCHC = 32- 36 %} RDW (red cell distribution width) reflects the size distribution of the erythrocyte population. The hematological instrument calculates it as a coefficient of variation (CV). RDV = Standard Deviation of red cells size distribution / MCV. (Reference values: adults RDW = 11.5 - 15.5) The aim of this study was to identify the values and changes of hematological and biochemical parameters in blood samples between two consecutive schedules of hemodialysis and assesses the effect of plasma osmolality on errors of platelets count, to the hospitalized patients admitted in hospital with diagnosis chronic renal diseases complicated with chronic renal failure. Method The prospective study of laboratory was performed on 90 known patients with chronic kidney diseases ( CKD) complicated with chronic renal failure(CRF), admitted in hospital, prior to
15
undergoing schedules of dialysis, (55 men and 35 women), in average ages 35-65 years (mean, age 50, SD= +_2).The patients were analyzed once a month, all at the same day, to connection and after connection of hemodialysis schedules, in medical internal department.. For diagnosis of specific anemia of chronic renal diseases, laboratory tests included hemoglobin (HGB), hematocrit (HCT), white blood cells and platelets count, differential count and red cell indices (mean cell volume (MCV), mean cellular hemoglobin (MCH), mean corpuscular hemoglobin concentration (MCHC) red cell distribution width (RDW), being performed using an automated analyzer (Coulter HMX with 22 parameters) and for specific biochemical parameters in chronic renal failure as serum iron, total iron binding capacity, and index saturation transferrin ( IST), usually and specific biochemical tests: Glucose, Urea nitrogen, Creatinine, Sodium, Potassium, E CO2, was used a dry chemistry analyzer Vitros 700(Ortho Diagnostics), Johnson $ Johnson. Reticulocyte count (RET %) was calculated after microscopic analysis of brilliant cresyl blue stained slides, (normal ranges adult: 0.5 - 1.5%). To evaluate rate of erythropoiesis, the Reticulocyte Production Index (RPI) was calculated using the formula: [RPI = RET% x HCT patient /45 /reticulocyte time maturation], where maturation time (reticulocytes survival days in peripheral blood) was considered 1 day for HCT 36-45%, 1.5 days for HCT 26-35%, 2 days for HCT 16- 25% and 2.5 days for HCT < 15%. Reference interval for RPI in healthy individuals is 1.0-2.0; and RPI < 2 in a person with anemia indicates ineffective erythropoiesis, while values > 2 indicate compensation for decreased red cell survival (bleeding, hemolysis) (11). Three methods were used to assess platelet counts of hemodialysis patients: optical microscopy, peripheral blood smear and user of the cytometry principle with impedance principle (VIC) by Coulter HNX hematological analysis. For to avoid systematic errors during platelets count by optical microscopy, a method of direct counting in the Burker-Turk chamber( hemacytometer) has been recommended for use in parallel with determination of the number of platelets counted on peripheral blood smear, ( by optical microscopy). Calculation of the platelets counted in the Burker-Turk chamber considers the height of the chamber and the surface of the middle square of the chamber to yield a value of 0.2mm²(12). The calculation formula for hemacytometer cell counts determines the number of cells within 1μL (1 mm³) of blood. To make this determination, the total number of cells counted must be corrected for the initial dilution of blood and the volume of diluted blood used. The standard dilution of blood for platelet counts is 1:100; therefore the dilution factor is 100. The volume of diluted blood used is based on the area and depth of the counting area. The area counted is 2 mm² and the depth is 0.1 mm; therefore the volume factor is 0.2 mm³. Total number of cells counted • dilution factor • 1/volume factor = cells/mm³ (cells/mm³= cells/μL or cells/μL • 10³μL /L = cells x 109/L). Examples: 200 platelets counted on 2 mm² x 1000 = 200 000 platelets/mm³ Direct microscopy of the blood smear yields the number of thrombocytes count by counting those found between 1000 erythrocytes (5 microscopic fields of 200 red cells) multiplied by the number of erythrocytes/mm.³ and then divided /1000) with the results expressed as platelets/ mm³. The estimate of platelet count from slides uses a semi-quantitative method, whereby 1 platelet / oil immersion field is equivalent with 20 000 plt/mm³ [Figure 1].
16
Figure1. Examination area for thrombocites on microscopic slide In optical microscopy, one assesses a panoptic colored blood smear under the immersion objective (100 X). Most platelets have a dendritic aspect and fringe-like extension. Normal platelets have diameter of 2-4 microns on the blood smear with 70% alone, 20% in groups of 2 or 3 and 10% in larger groups or “big pools”. Correctly executed blood smear reveal microscopic fields on the oil-immersion objective with an average of 10 platelets as either isolated or grouped. Visualization of <5 platelets on the microscopic field connotes thrombocytopenia while >40 indicates thrombocythemia (13). Platelets are typically disk-shaped with a more dense central (granular) area and a peripheral (crystalline) area with functional dendritic fringes [14]. If activated by toxic metabolic factors, platelets become more spherical, which can yield a decrease in the intensity of the image in the microscopic lenses, due to light transmission and diffusion through samples. When platelets are activated, they become spherical with a hypogranular cytoplasm and release small particles. This
17
may lead to the erroneous detection of platelets when using the microscopy owing to their deformed morphology. Recognizing erroneous results of platelet counts is especially critical for a consistent decision in the diagnosis of disseminated intravascular coagulation (DIC) and for clinical decision making regarding transfusion. The platelet count is an indispensable parameter in the DIC scoring system proposed by the International Society on Thrombosis and Hemostasis Sub-Committee of the Scientific and Standardization Committee on DIC, in which platelet counts of less than 100 × 103/μL (100 × 109/L) and less than 50 × 103/μL (50 × 109/L) would score 1 and 2 points, respectively. [15, 16] The samples were assessed for platelet count by statistical parameters: [SD = ��(Xi- Xm )2 /n – 1; accuracy: (%Diff = X average – X target/ X mean x 100, with normal value until + − 25) and Z score( Z = X average-X target/SD, with normal value until +-2, R>0.95%), for average platelets 150-400 x10³/μl, 95% CI.]. Results: From total patient in our study, a minority of patients, 36 patients (40%) had normal results for all hematological tests under monitoring treatment of specialty. In type of anemia from kidney chronic diseases, an additional 16 (18%) patients had normal HGB and HCT, but low MCV or MCH ((mean value 72 fL, SD= 2.1) or MCH (mean value 24.3pg, SD= 1.6). Other 28 patients (31%) had mild anemia (HGB decreased but > 106 g/L), while only 10 patients (11%) have had severe anemia. All individuals in the group with severe anemia had low RET (mean value 1.2%, range 0.5-1.5%), and RPI in mean value of <1.4, indicating a hypo-regenerative type of anemia. To the 54 patients with anemia of chronic kidney diseases (ACKD) and chronic renal failure( CRF) were registered in 30.90% of cases normal TIBC values (mean value 282 microgram/ d L, SD=2.5), low RPI in mean value of 1.33, low IST in mean value of 7.62%, with middle ineffective erythropoiesis and moderate iron deficiency anemia (IDA) and to 19.10 % of patients with ACKD and CRF associated with renal inflammations, were calculated low RPI, in mean value of 1.21, high TIBC value (mean value 468 microgram/d L, SD =2.4) and low IST in mean value of 6.5%, with severe ineffective erythropoiesis and severe IDA. In biochemical field, in this study on this cohort of hemodialysis patients, was obtained the variability of plasma osmolality past normal individual values (310 Osm/l), in the samples taken from the patients with chronic renal failure because of high values of Urea nitrogen (mean value 112 mg%; 40 mmol/L; SD = 2.40); Creatinine (mean value 5.5 mg/%; 4.85 mmol/L); SD=0.15); Sodium (mean value 170 mmol/L; SD=0.14); Potassium (mean value 14.5 mmol/l; SD=2.88); E CO2 (mean value 11 mmol/L; SD=0.26). Prevalence of anemia to patients admitted in hospital for undergoing schedules of hemodialysiss have been registered in percents: 60% of cases, with normochromic-normocytic anemia, 30% of cases with microcytic-hypochomic anemia and nutritional iron deficiency, 7% of cases with aplastic anemia and 3% with macrocytic and vitamin B12 deficiency. In cases with microcytic-hypochomic anemia and nutritional iron deficiency were registered by this study that mean corpuscular volume (MCV) of red cells decreases below normal value before that the hemoglobin to be decreased under normal value. Iron deficiency anemia associated with ACKD was presented in three forms: -Prevalent anemia with low serum ferritin (SF), when ferritin descends in early stages of iron deficiency, before changes of concentration of hemoglobin concentration, size of erythrocyte, level of iron serum value, with high TIBC (8%), -Latent anemia with low SF and low circulating serum iron, TIBC is increased, urine iron is low and erythrocytes with low iron in content have aspect of hypochromic red blood cells (10%), -Installed anemia with deficiency of erythropoiesis, low ferritin (< 50 microgram/L) in bone morrow, TSI < 16% in serum iron and hypochromic and microcytic erythrocytes (12%), [17,18]. When the aspect Iron/TIBC is less than 15%, we have had the certain diagnostic of ACKD associate with IDA. Low serum iron, serum ferritin increased and low TIBC means ACD. Low serum iron, low serum ferritin and TIBC increased means IDA (19).
18
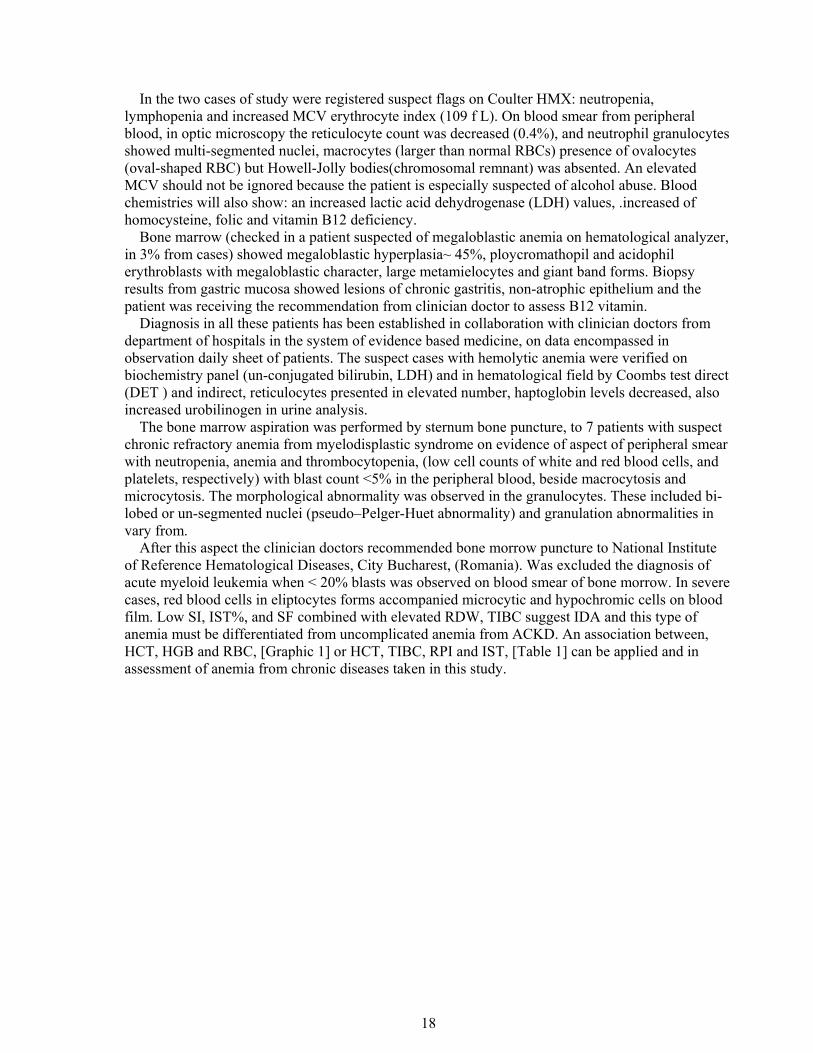
In the two cases of study were registered suspect flags on Coulter HMX: neutropenia, lymphopenia and increased MCV erythrocyte index (109 f L). On blood smear from peripheral blood, in optic microscopy the reticulocyte count was decreased (0.4%), and neutrophil granulocytes showed multi-segmented nuclei, macrocytes (larger than normal RBCs) presence of ovalocytes (oval-shaped RBC) but Howell-Jolly bodies(chromosomal remnant) was absented. An elevated MCV should not be ignored because the patient is especially suspected of alcohol abuse. Blood chemistries will also show: an increased lactic acid dehydrogenase (LDH) values, .increased of homocysteine, folic and vitamin B12 deficiency. Bone marrow (checked in a patient suspected of megaloblastic anemia on hematological analyzer, in 3% from cases) showed megaloblastic hyperplasia~ 45%, ploycromathopil and acidophil erythroblasts with megaloblastic character, large metamielocytes and giant band forms. Biopsy results from gastric mucosa showed lesions of chronic gastritis, non-atrophic epithelium and the patient was receiving the recommendation from clinician doctor to assess B12 vitamin. Diagnosis in all these patients has been established in collaboration with clinician doctors from department of hospitals in the system of evidence based medicine, on data encompassed in observation daily sheet of patients. The suspect cases with hemolytic anemia were verified on biochemistry panel (un-conjugated bilirubin, LDH) and in hematological field by Coombs test direct (DET ) and indirect, reticulocytes presented in elevated number, haptoglobin levels decreased, also increased urobilinogen in urine analysis. The bone marrow aspiration was performed by sternum bone puncture, to 7 patients with suspect chronic refractory anemia from myelodisplastic syndrome on evidence of aspect of peripheral smear with neutropenia, anemia and thrombocytopenia, (low cell counts of white and red blood cells, and platelets, respectively) with blast count <5% in the peripheral blood, beside macrocytosis and microcytosis. The morphological abnormality was observed in the granulocytes. These included bi-lobed or un-segmented nuclei (pseudo–Pelger-Huet abnormality) and granulation abnormalities in vary from. After this aspect the clinician doctors recommended bone morrow puncture to National Institute of Reference Hematological Diseases, City Bucharest, (Romania). Was excluded the diagnosis of acute myeloid leukemia when < 20% blasts was observed on blood smear of bone morrow. In severe cases, red blood cells in eliptocytes forms accompanied microcytic and hypochromic cells on blood film. Low SI, IST%, and SF combined with elevated RDW, TIBC suggest IDA and this type of anemia must be differentiated from uncomplicated anemia from ACKD. An association between, HCT, HGB and RBC, [Graphic 1] or HCT, TIBC, RPI and IST, [Table 1] can be applied and in assessment of anemia from chronic diseases taken in this study.
19
20
HTC %
RPI
TIBC microgram/d L
IST %
35 - 30 1.52 225 29.1
29 - 25 1.33 282 7.62
24 - 18 1.21 468 6.5
Table 1 Correlation between Hematocrit (HTC), Reticulocytes Production Index (RPI) Total Iron Binding Capacity (TIBC) and Index Saturation Transferrin (IST) in Anemia of Chronic Renal Failure The platelet count determined on the peripheral blood smear was used to complement data from the quantitative methods and provided morphological information. The comparison between the platelet counts on the Coulter HMX (mean value X⎯ = 233 x 10³μl; p=0.028; SD=2; % Diff=0.90; Z score = - 0.30) and by optical microscopy (X⎯ = 250 x 10³μl; p=0.029; SD= 2.6; %Diff = -3.6; Z score =0.40) yielded similar values in a control group (120 male and female healthy subjects, ages 25-55 years (mean age 40). For the dialysis patients, we found that results for platelet counts with the Coulter HMX, before and after hemodialysis were similar: (pre-dialysis mean X⎯= 230 10³ μl; p=0.024; SD=3.45; % Diff = -4.53; Z score =2.5; post dialysis mean X⎯= 245 x 10³μl; p=0.034; SD=2.1; %Diff = 6.34; Z score = 0.10) but differences appeared if counting was done using optical microscopy (pre-dialysis mean X⎯=261 x 10³μl; p = 0.020; SD=7.1; %Diff= 5.90; Z score=3.90); post-dialysis mean X⎯ = 167 x 10 ³μl; p = 0.6; SD=4.2; %Diff= -7.10; Z score= -2.90), [Table 2].
X⎯ 167 x 10 ³ µl; p = 0.6; SD=4.2; %; Diff= -7.10;
Z score= -2.90
Microscopy slides
Patients disconnected from dialysis devices
,,,,,,,,,,,,,,,,,,,,,,,,,,,,,,,,,,,,,,,,,,,,,,,
X⎯ =190 x10³ µl;CV=4.6%; SD= 8.74; %Diff =18;
Z score =7.60;
Table 2 Assessment of performances for methods used in platelets count to patients with Chronic Renal Failure, undergoing dialysis
The latter results may be attributable to the variability of plasma osmolality in the samples taken from the patients with chronic renal failure: Glucose (98mg%; 5.44mmol/L; SD=2.80);
Table 3.Values of biochemical and hematological parameters in blood samples from patients with Chronic Renal Failure, undergoing the schedules of dialysis
23
Legend: color red-high values, color blue-normal values, color white-low values.
The performance of devices used was assessed by Z score = < 1 = optic performance; 1 < Z < 2 = good performance; 2 < Z < 3 = satisfactory performance and Z > 3 =unsatisfactory performance. In parallel, we assessed platelet count using the peripheral blood smear and found that it provided information that was complementary to the other methods, especially with respect to morphological aspects of platelets. Counting thrombocytes on slide from
24
peripheral blood smear is necessary in quantitative platelet disorders, as isolated thrombocytopenia: immune versus non-immune, thrombocytopenia associated with other hematological abnormalities or in differential diagnosis with platelet clump, thrombocytosis and qualitative disorders, as giant platelets (megathrombocytes), platelet inclusion or granule abnormalities, bizarre in shape and size.
The control group to 40 potential health persons (20 adult men and 20 adult females),on hematological analyzer Coulter HMX, was next results (mean value), form men: WBC=9700/dL, RBC=4500 000/dLHGB=13,9g/dL, MCV= 90 f L, RDW=13.5%, MCV = 29 f L, MCHC = 34%) and for women WBC=95/dL, RBC=4200 000/dL, HGB=12,5g/dL, MCV= 80 f L, RDW=14.5%, MCV = 27 f L, MCHC = 30%) [Sensitivity = (35/ 40) x 100 = 87.50%].
In biochemistry field, normal results of the same group control were registered next results: Creatinine, 1.2 mg/dl, with SD=0.15,CV%=29, accuracy [Z] =-1.36; Iron, 100 microgram/dl, SD=2.88, CV%=1.8, Z=-0.56; Phosphate, 27.mEq/dl, SD=0.14.CV%=2.2, Z=-0.8; Urea, 40mg/dl, SD=2.40, CV=2.2, Z=-0.13; Uric acid, 8mg/dl, SD=0.26; CV=3.2, Z=-0.79; [Normal Z = ±2 in Control of Levey Jennings Chart.]. The precision to our cohort in study was registered as next results: CV < 2% for RBC, CV < 1% for HGB and CV < 2% for HCT, (Accuracy: r > 0.95 for HGB and HCT, 95% CI), mean SD=2.2 and p=0.04 for HGB, mean SD = ± 2.5 and p < 0.05 for MCV in CBC, MCHC with CV =2%, MCH with CV=1.5%, RDW with CV = 3%. [Specificity = (124/140) x 100 = 88%]. Positive predictive value (107/124) = 86%. Functional ID was closely related to the production of hypochromic red cells, and measurement of red cells hemoglobinization provides a sensitive method for determining the quantity of circulating iron incorporated into the red blood cells which, reflect recent changes in erythropoiesis.
Discussions:
Diagnosis in all these patients has been established in collaboration with clinician doctors from department of hospitals in the system of evidence based medicine, on data encompassed in observation daily sheet of patients. Anemia of chronic kidney (ACKD) diseases associated with the iron deficiency (IDA) was microcytic and hypochromic, especially once the HGB level fall below 100g/L and HCT are somewhat lower that seen in normochromic, normocytic anemia from chronic diseases(ACKD). Proportion of hypochromic red cells is a time average marker, was similar in anemic patients like glucose, HbA1c in diabetes patients. The marker for IDA, hypochromic erythrocytes, has been investigated for every patient, on blood film slide, May Gunwald stain. The hypochromic cells >10% were considered functional ID, in correlation with iron. Various cut off values for functional ID is reported in literature ranging from 2% to 10% of hypocromic cells (17).
Measuring of TIBC was made as an indirect method of assessing transferrin and provided comparable information [18]. TSI indicates the percent of iron binding sites on transferring that is carrying iron. TSI is derived from a calculation using the formula: [(SI/TIBC) x100] and TSI is generally considered to be the most sensitive laboratory test for detecting altered iron metabolism in hereditary hemochromatosis (HH). It may be elevated prior to significant deposition of tissue iron. TS levels increase as additional iron is accumulated. A drawback to using the TS is that it is dependent on performing both the SI and TIBC.
Current guidelines from the American College of Physicians include a normal level of TSI encompassed between 20-40%, a cut off level of TSI >55% identifying iron overload and TSI < 15% meaning IDA. Red distribution width (RDW) is a mathematical expression of size variation used to
25
quantify anisocytosis. The higher the RDW means the greater the anisocytosis. Increased RDW may be an early indication of iron deficiency, where it may precede the onset of microcytosis. These measurements, known as erythrocyte or red blood cell indices, provide an important information about various types of anemia. If the MCV is low, the cells are microcytic or smaller than normal. Microcytic red blood cells have been seen in iron deficiency anemia and thalassemia minor. If the MCV is high, the cells are macrocytic, or larger than normal. Macrocytic red blood cells were associated with pernicious anemia or folic acid deficiencies. If the MCV is within the normal range, the cells are referred to as normocytic and nomocytic anemia was met with more frequency in chronic diseases/inflammation, small MCH under 27% show hypocromic erythrocytes, frequently encountered in IDA. In the same correlation with MCHC less than 32% indicates that the red blood cells are deficient in hemoglobin concentration. This situation is most often seen with iron deficiency anemia. RDW is a measurement of anisocytosis. IDA and thalassemia are both microcytic-hypochromic anemia. As screening tests for discovery of anemia to elderly we used, beside additional tests, erythrocytes indexes such as MCV, MCH, and RBC number to distinguish this anemia types. MCH is just the equivalent of Retyculocites –Hemoglobin (Ret-He) that indicates the long term of life span of erythrocytes. Both serum transferrin receptor and erythrocyte zinc protoporphyrin have been demonstrated to be useful in a variety of clinical situations. Serum transferrin receptor can be best used in diagnosing iron disorders, especially for patients with pathologies that may affect iron metabolism. Erythrocyte zinc protoporphyrin can be best used as a primary screening test for assessing iron status, especially in patients likely to have uncomplicated iron deficiency hemoglobin status and life span of erythrocytes (18). Other anemia, most notably thalassemia, are also characterized by low MCV, MCH, MCHC and additional tests are needed for confirmation of thalassemia Patient with a ratio target cells/normal cells > 1% in low power field and with >20% microcytic red cells on blood film ( magnification x 400), were suspicious for beta-thalssemia. RBC count result higher in thalassemia minor group in comparison with IDA. Microcytic, hypochromic and polyglobulia are more evident in thalassemia minor compared with IDA and hemoglobin and hematocrit can be normally but only MCV and MCH decreased in thalassemia silent carrier [Graphic 3].
26
The bone morrow hemosiderrin and microscopic bone marrow examination have been recommended in clinical management in most elderly patients with anemia in Mielodysplastic Syndrome (MDS) The problems in diagnostic anemia occurs when the iron reserves are depleted or not. The peptide hormone Hepcidin appears to play a central role in the pathogenesis of the anemia of chronic disease, but is extremely difficult to measure in the serum. Thus the "anemia of chronic disease" may include patients with a variety of patho-physiological mechanisms. The peptide hormone Hepcidin, secreted by the liver, controls plasma iron concentration by inhibiting iron export from macrophages cells(cut off, 15 ng/d L, Elisa method). The effect of Hepcidin is to increase intracellular iron stores in ACD, decreased dietary iron absorption and decrease circulating iron concentration in chronic anemia from inflammations and infections [19]. In chronic renal failure (CRF), the peripheral blood smear can reveal activated thrombocytes with fingers( burr cells) as isolated cells or organized in groups. By contrast, with diabetic ketoacidosis, one can see the reverse phenomenon, thrombocytes that are isolated, with round shape form and without activated fringes [Figure 2].
27
It is interesting that platelet activation markers were associated with the severity of DIC and erroneous platelet counts, suggesting that platelet activation is a potential source for the inter-method variation in platelet counts. More attention needs to be given to improve the accuracy of platelet counts, especially in clinical conditions with high levels of platelet activation. It is well known that white light is comprised of luminous waves with different wave lengths of 750-250 nm. Optical microscopy uses light diffraction but can have light reflection, refraction, diffusion and dispersion phenomena, especially through media with non-homogenous densities. Thus, it has been recommended that one conduct platelet counts using phase-contrast microscopy, which helps eliminate such light interference phenomena because it the image is formed by a diffraction process in two stages: incident light diffraction and diffraction of the light refracted in the objective. The optical conventional techniques used for platelet counting have limits that are influenced by the human eye, especially for detection of objects <5 microns. Thus, the modern trend is to replace optical systems and introduce some electronic optical systems. Electronic microscopy with Beta rays and wave lengths thousands of times smaller than the white light gives a higher power of resolution and thus, analyzers well-suited for platelet count in
28
biological fluids are ones that use either of two methods: WCS technology of impedance (Volume, Conductivity and Scatter Light), {Graphic 4} and WOC analysis by laser ray (White Cell Optical Count), (20), [Graphic 5]
29
In WCS, the fat within the cell membrane behaves as an object that facilitates generation of an electronic impulse with amplitude proportionated as the cell volume and helps create a potential difference next to the count cleft Since VCS technology includes a highly accurate measure of cell volume, we can use this information to correct the conductivity and scatter signals. The result of this volumetric compensation is a pair of measurements that are very powerful, and unique to Beckman Coulter. The HMX Coulter Analyzer utilizes the Coulter principle to provide cellular information for the complete WBC differential. The system measures the amount of light “lost” due to diffraction and absorbance as compared to full transmission when no cell is present. The signals collected are converted into voltage pulses and are processed. The size and shape of the voltage pulses are equivalent to the unique nuclear and morphologic structure of the cells being analyzed conductivity offers information about opacity, which is directly proportional to cell density (21). In WOC technology the laser light measures cellular elements in 4 specific angles and every angle of light scatter from 0° through 90° is influenced by cellular size. The low angles are the most affected, and are often used as an indirect estimation of cellular size. The zero angle measures the dimension of cells and impedance is used to count RBC corpuscles > 36 fL and platelets, corpuscles with the dimensions between 2-20 fL (22). The main elements that maintain the plasma osmolality in normal values (310 Osm/l) are; Na, K, urea and glucose. Serum osmolality is normal whenever the osmotic pressure set by urea and glucose is negligible and the Na+ concentration can largely define osmolality [Osm = 2.1 x conc Na mEq/L).Whenever the level of plasma urea or glucose is high, the osmolality becomes: 2.1 (Na + K) mmol/L + urea mg% / 2.8 + glucose mg% /18.02), result expressed in Osm /L
30
([23). In metabolic states with high osmolality (e.g. from chronic renal failure), errors in platelet counts occur in optical microscopy due to the double refraction phenomenon. This phenomenon occurs because particles <5μ create reflection, refraction, diffusion and diffraction of light through environments with different properties (ε) and in solutions with higher osmolality. The diffraction of rays by objects < 5μ are not sufficiently dispersed and only a part of the issued light falls on the object from the objective of microscope. The angle comprised between the rays which delimit the light cone represents the numerical aperture(A) and the resolution power or the spectral separation power, dependent of light diffraction (D), light wave length (L) and numerical aperture (A) , (D = L / A ), (24). Optical instruments contain light separation media that are non-homogenous, including glass (ocular, objectives, prisms, air) and thus yield losses in the intensity of the incidence, reflection, refraction and diffraction rays through the media crossed by them. After the expression: S = [n1 - n2/n1 x n2]², where “n” represent the refraction index from the environment, the losses of the incidental ray, because of interference, is 4% from the intensity of incidental fascicle (25). Platelets with dimensions <2μ and are met by light rays, with a very high speed of propagation through liquid environments may not be seen in optical microscopy if increased osmolarity concentrations are present. In accordance with Huygens interference principle, clefts S1 and S2 become secondary oscillation sources. The sources of secondary vibration of the light generated waves can overlap between the interference areas and fringes, thus yielding what is termed the interference domain. Thus, the average of the intensity values of the object light image in the ocular may has the range between 0 value and 4 ‘e” (e= ¹/4nS) in the minimal, respectively, maximum interference phase. The minimal intensity state of the light reflected on the object in order to create its reversed image in the ocular leads image loss for the human eye. The normal thrombocytes having the diameter of 2-4 microns, create reflection, refraction, diffusion and diffraction of light through microscopy and become more less visible to manual counting. There has been some debate over which counting principle, between the impedance and optical methods, measures platelet counts more accurately. Some studies suggested that the accuracy of the optical methods was superior for thrombocytopenic specimens, while recent studies demonstrated the impedance method to be more accurate for samples from patients undergoing cytotoxic chemotherapy (26). Conclusions The anemia of hospitalized patients with chronic or acute renal diseases undergoing hemodialysis exists in our study in 60% from studied cases and must be managed of laboratory medicine in collaborative with the clinician. A routine anemia screening should be recommended using HGB, HCT and erythrocytes indexes MCV, MCH, MCHC and must be redefined the anemia by these common parameters. An iron panel (serum iron, TIBC, IST% and RPI) is useful in differentiating anemia of chronic disease from iron deficiency. By this study the anemia can be defined as a decrease of HGB and or hematological indexes with 10%from initial normal values, with cut of 117g/L HGB for men and 108g/L HGB for women. The methods used to assess platelet counts of hemodialysis patients, optical microscopy, peripheral blood smear and use of the cytometry principle with impedance principle (VIC), yielded similar results with samples from normal subjects but the accuracy of the automatic method ensures a high quality count of hemodialysis patients. The all three methods yielded similar results with samples from normal subjects and that the accuracy of the automatic method ensures a high quality count but apparently not so, for patients post-dialysis. Examination of the peripheral blood smear appears to offer important advantages, in particular for dialysis patients, so as to assess for qualitative as well as quantitative changes in platelets in such
31
patients. We concluded that should be a clinical guideline for the management of anemia in the elderly with chronic renal diseases. REFERENCES 1. Guralnik JM, Eisenstaedt RS, Ferrucci L, Klein HG, Woodman RC. Prevalence of anemia in persons 65 years and older in the United States: evidence for a high rate of unexplained anemia. Blood 2004; 104:2263–2268 2. Blanc B, Finch CA, Hallberg L, et al. Nutritional anemia: report of a WHO Scientific Group. WHO Tech Rep Ser 1968; 405:1–40. 3. Salive ME, Cornoni-Huntley J, Guralnik JM, et al. Anemia and hemoglobin levels in older persons: relationship with age, gender, and health status. J Am Geriatri Soc 1992; 40:489–4964 4. Zakai NA, Katz R, Hirsch C, et al. A prospective study of anemia status, hemoglobin concentration, and mortality in an elderly cohort: the Cardiovascular Health Study. Arch Intern Med 2005; 165:2214–2220 5. Pan WH and Habicht JP. The non–iron-deficiency-related difference in hemoglobin concentration distribution between blacks and whites and between men and women. Am J Epidemiol 1991; 134:1410–1416 6. Beutler E and Waalen J. The definition of anemia: what is the lower limit of normal of the blood hemoglobin concentration? Blood 2006; 107:1747–175 7. Riva E, Tettamanti M, Mosconi P, Apolone G, Gandini F et al. Association of mild anemia with hospitalization and mortality in the elderly: the Health and Anemia population-based study. Haematologica. 2009; 94(1):22-8 8. Ramel A, Jonsson PV, Bjornsson S, Thorsdottir I. Anemia, nutritional status, and inflammation in hospitalized elderly. Nutrition. 2008; 24(11-12):1116-22 9. Eisenstaedt R, Penninx BW, Woodman RC. Anemia in the elderly: current understanding and emerging concepts. Blood Rev. 2006; 20(4):213-26. 10. Adamson J W. Longo D L. Mc Graw H. Braunwald E. Anemia and polycythemia et all. Harrison's Principles of Internal Medicine. New York 2001; 15th Edition 11. ACP CPSC Tools: Reticulocyte Production Index. American College of Physicians. Internal Medicine/ Doctor1s for Adults 1999, 2000 12. Brecher G, Cronkite EP. Morphology and enumeration of human blood platelet. J Appl Physiol.1995; 3:365. 13. Moreno A, Menke D. Assessment of platelet numbers and morphology in the peripheral blood smear. Clin Lab Med 2002; 22(1): 193-213.
32
14. Bennett J M, Rogers G. Practical Diagnosis of Hematological Disorders, 2-th Edition. Let Thrombocytes. Chicago: ASCP Press 2006; p: 301 – 311. 15. Seon Young Kim, Ji-Eun Kim, Hyun Kyung Kim, ; Kyou-Sup Han, Cheng Hock Toh. Accuracy of Platelet Counting by Automated Hematologic Analyzers in Acute Leukemia and Disseminated Intravascular Coagulation: Potential Effects of Platelet Activation. American Journal of Clinical Pathology 2010; 134(4):634-647. 16. Segal HC, Briggs C, Kunka S, et al. Accuracy of platelet counting haematology analysers in severe thrombocytopenia and potential impact on platelet transfusion. Br J Haematol. 2005;128:520–525. 17. Steensma DP, Tefferi A. Anemia in the elderly: how should we define it, when does it matter, and what can be done?. Mayo Clin Proc 2007; 82(8): 958-66. 18. Labbé RF, Dewanji A. Iron assessment tests: transferrin receptor vis-à-vis zinc. ClinBiochem 2004; 37 [3]: 165-174. 19. Knezevic V. Differentiation of Anemia from Chronic Diseases (ACD) with Anemia from Iron Deficiency (IDA).[ Abstract p136]. 10-16 Meeting of Balkan ClinicalLaboratory Federation 2008; p. 162. 20. Hennessy M, Buckley T. C, Leadon D, Scott C. S. Automated analysis of blood samples from thoroughbred horses with the Abbott cell DYN 3500 (CD3500) hematology analyzer. Comparative Hematology International 2006(3); 8 21. Hickerson DH, Bode AP. Flow cytometry of platelets for clinical analysis. Hematol Oncol Clin North Am. 2002;16: 421–454. 22. Hervig T, Haugen T, Liseth K, et al. The platelet count accuracy of platelet concentrates obtained by using automated analysis is influenced by instrument bias and activated platelet components. Vox Sang.2004; 87:196–203. 23. Mehdi R, Kiarash R. K. Comparison of methods for calculating serum osmolality: multivariate linear regression analysis, Clin. Chem.Lab 2005; 43: 635-640. 24. David W Piston. Concepts in Imaging and Microscopy, Choosing Objective Lens: The importance of Numerical Aperture and Magnification in Digital Optical Microscopy Biol Bull 1998; (1); 4: 195:-199. 25. Sterian P. Fizica. Chap, Interferenta luminii. Ed Did si Ped Bucuresti 2008; p: 302-401. 26. Briggs C, Harrison P, Machin SJ. Continuing developments with the automated platelet count. Int J Lab Hematol 2007; 29(2): 77-87.
33
Chapter 3 Significance of Neutrophil Alkaline Phosphatase versus Isoenzymes ALP in Acute Diseases or Chronic Diseases ABSTRACT
This paper describes how high levels of alkaline phosphatase (ALP) in serum may be explained
by an increasing level of bone alkaline phosphatase (BAP) and neutrophil alkaline phophatase
(NAP) in patients with benign and malignant bone diseases and inflammatory syndromes, as well as
in acute or chronic leukaemia.
Increased ALP levels can be caused by both bone and liver diseases but identify of exact cause
can be very difficult. In this case, additional ALP isoenzyme tests can be performed for an accurate
determination of the cause.
In diferent diseases, some times, it is possible to distinguish the different forms of ALP, produced
by different types of tissues in the body. If it is not an apparent clinical sign and symptom or whether
the source of a high ALP is a liver disease, or a bone disease, other biochemical tests may be
performed to determine which isoenzyme of ALP is increased in the blood, and thus it is possible the
identify of diseased tissue. Additionally, in order to differentiate between Leukemoid Reactions and
Acute or Chronic Leukemia, the testing for alkaline phophatase of neutrophil type (NAP) must be
performed.
After completing this article, readers should understand the importance of alkaline phosphatase
isoenzymes, which are the various types of ALP isoenzymes and how their levels can be aid in
distinguishing between bone and liver diseases, as well as between the different types of acute
leukemia.
ABBREVIATIONS
1. ALP –Alkaline phosphatase
2. AST – Aspartate aminotransferase
3. ALT – Alanine aminotrasferase
4. BAP – Bone Alkaline Phosphatase
5. NAP – Neutrophil Alkaline Phophatase
6. HAP – Hepatic Alkaline Phosphatase
7. GGT – Gamma-glutamil-transferase
34
Introduction
Alkaline phosphatase (ALP) is an enzyme found in several tissues throughout the body,
including liver, bone, kidney, bowel, and in the placenta of pregnant women. Each type of tissue
produces a distinct form of ALP, called, isoenzyme. The activity of ALP from serum is normally a
composite of the bone, liver, kidney isoenzymes ALP and ocazional intestinal isoenzyme ALP.
Isoenzymes ALP determination may help the clinician doctors to determine the organ/tissue of
patients, responsible for an alkaline phosphatase elevation in serum sample [1).
There are probably more variations in the way in which alkaline phosphatase is assayed than any
other enzyme. In the he reference range ALP, (120-700 U/L for children in age until 3 years, 49- 587
U/L for children in age of 4-19 years and 45-115 U/L for children in age > 19 years ), the
laboratory values of alkaline phophatase must be carefully interpreted to any person in function of
the age, to children, males and females. Therefore, the reporting units vary from place to place.
Increased serum alkaline phosphatase is seen in states of increased osteoblastic activity
(hyperparathyroidism, osteomalacia, primary and metastatic neoplasm), hepatobiliary diseases
characterized by some degree of intra or extra-lever cholestasis, and in sepsis, chronic inflammatory
bowel disease, and thyrotoxicosis
However, the highest concentrations of ALP are present in the cells that comprise the bone and
liver. In the liver, it is found on the edges of the cells that join to form the bile ducts - tiny tubes that
drain bile from the liver to the bowels, where it help digest fat in the diet. (2). ALP in bone ( BAP)
is produced by special cells called osteoblasts, which are involved in the formation of bone tissue.
BAP reflect the biosynthetic activity of these bone-forming cells. BAP has been shown to be a
sensitive and a reliable indicator of bone metabolism.
Neutrophil cells found in peripheral blood may be an important source of increased levels of
neutrophil alkaline phophatase (NAP). For an accurate diagnosis, neutrophil alkaline phophatase
caused by leukemoid reactions must be distinguished from other types of serum alkaline phosphatase
isoenzymes, such as bone alkaline phosphatase (BAP) and hepatic-bile alkaline phosphatase (HAP),
because they can all be increased in certain pathological conditions.
An alternative reason for elevated ALP activity is hyper-reactivity of the osteoblast involved in
remodeling bone. The most striking elevation of bone ALP is due to Paget`s diseases. Metastatic
bone cancer involving osteoblast also gives rise to very elevated bone ALP.
Elevated levels of alkaline phosphatase (ALP) in the blood are most commonly caused by liver
disease. The liver form ALP is associated with biliary epithelium and becomes elevates in
cholestatic processes. The levels of the enzyme can be greatly increased, for example, in cases where
35
one or more bile ducts are blocked. Smaller increases in ALP levels are seen in liver cancer and
cirrhosis – when accompanied by drugs toxic to the liver – as well as in hepatitis. Any condition
causing excessive bone formation, including bone disorders such as Paget's disease, and others
such as rheumatoid arthritis and healing fractures, can cause increased ALP levels.
When a patient shows evidence of liver disease, a very high ALP level will tell the doctor that the
person’s bile ducts are somehow blocked. ALP levels are often high in people with cancer that has
spread to the liver or the bone, and doctors can further test to see whether this has happened. If other
liver tests, such as total bilirubin (TBIL), aspartate amino-transferase (AST), or alanine-amino-
trasferase (ALT) also show high levels, the increased ALP is usually coming from the liver. In this
case, the level of gamma-glutamil-transferase (GGT), which is secreted in the same place as hepatic
alkaline phosphatase (HAP), is also high. HAP from the liver represents 60% of the total serum ALP
and must be differentiated from other types of serum ALP. If calcium and phosphorus values
are abnormal, the ALP is usually coming from the bone. If it is not clear for signs and
symptoms, or from other routine tests, whether the high ALP is due to liver or bone, then a test for
ALP isoenzymes may be necessary to distinguish between bone and liver ALP (3).
Decreased serum alkaline phosphatase may not be clinically significant. However, decreased
serum levels have been observed in hypothyroidism, scurvy, kwashiokor, achrondro-plastic
dwarfism, deposition of radioactive materials in bone, and in the rare genetic condition
hypophosphatemia.
Body of review
Total Serum ALP
Normal values of total ALP in blood serum vary according to age: 120-700 U/L for small
children, 90-190U/L for adult males and 85-165 U/L for adult females. Higher values, past the
laboratory reference limits, can be seen in pathology of the liver, such as acute and chronic hepatitis,
hepatic cirrhosis, biliary obstruction and stasis longer than 24 hours, benign and malignant bone
diseases, hyperparathyroidism, duodenal ulcer, and in metastases. Children and adolescents normally
have higher ALP levels than adults because of their growing bones and ALP is often very high
during a growth spurt, which occurs at different ages in boys and girls. ALP levels are also very high
in patients who take certain drugs, especially drugs that treat psychiatric disorders. Other drugs may
also affect ALP levels: for example, oral contraceptives may cause a decrease in ALP levels, while
anti-epileptics may cause an increase.
In healthy adults, most of the alkaline phosphatase (ALP) activity in serum derives from liver
ALP and bone ALP (4). Neutrophil ALP (NAP) is detectable in differentiated neutrophils and
36
monocytes and is the product of the liver/bone/kidney-type ALP gene (5), NAP mRNA and enzyme
activity are induced by treatment of neutrophils with granulocyte colony-stimulating factor (G-CSF).
Fosa et al. (6}, reported leukocytosis and increase serum ALP in response to G-CSF treatment and
suggested that increased serum ALP activity was related of the enzyme form the increased number
of leukocytes. NAP is released into blood stream, perhaps through leakage of ALP from damaged or
dead neutrophils.
ALP Isoenzymes
The following types of ALP isoenzymes are found in the human body:
- NAP: Alkaline phosphatase originating from neutrophil leukocytes. NAP appears not to be
involved in serum ALP activity in healthy individuals; however, both the protein concentration and
the enzyme activity increase in cases of bacterial infection (7).
- HAP: Hepatic-bile alkaline phosphatase. HAP is usually evaluated along with other tests for liver
disease. In some forms of liver disease, such as hepatitis, HAP is usually much less elevated than
AST and ALT. When the bile ducts are blocked (usually by gallstones, scars from previous
gallstones or surgery, or by cancers), ALP and bilirubin may be increased much more than AST or
ALT. The HAP isoenzime may also be increased in liver cancer, as well as in cholestasis,
cholangiocarcinoma, primary tumors of the liver, and metastases of the liver.
-BAP: Bone alkaline phosphatase. BAP is a glycoprotein that is found on the surface of osteoblasts.
BAP has been shown to be a sensitive and reliable indicator of bone metabolism. BAP may be
increased in some bone diseases, such as Paget's disease – where bones become enlarged and
deformed and in certain cancers that spread to the bone. If a person is being successfully treated for
Paget's disease, then BAP levels will decrease and return to normal over time. Also, if someone with
bone or liver cancer responds to treatment, BAP levels should decrease. Low levels of BAP may be
observed temporarily after blood transfusions or heart bypass surgery. A deficiency in zinc may also
cause decreased levels of BAP (8). Increased bone-type ALP should not be misdiagnosed as
representing a pathologic condition, such as: thyroid disease (hyperthyroidism), in which there is
osteomalacia; hyperparathyroidism (either primary or secondary); chronic renal failure with renal
osteodystrophy; diabetes mellitus with osteomyelitis, metastatic cancer in which there is
osteoblastic activity, such as prostate cancer or in the alendronate treatment in women with
osteoporosis (9).
-PLAP: Placental ALP (also known as ALP Regan isoenzyme). The placental ALP levels can be
increased in the third trimester of pregnancy, as well as in placental malignancy. The levels of
another related isoenzyme, called placental-like alkaline phosphatase 2 (ALPPL2), are also increased
37
in many types of cancer; its levels can be measured after the serum is heated to 56 C* for 10 minutes
(10).
-ALPI: ALP, intestinal. Intestinal ALP is increased in cirrhosis and in blood group O or B,
segregated [11, 12]. The intestinal form of ALP is determined by sensitivity to phenylalanine.
Duodenal ALP has normal value until 90 U/L. This type of ALP is higher in cirrhosis of liver, intra-
liver colestasis, enteritis, and chronic hemodialysis.
Methods of measurement of ALP and its isoenzymes
Methods of measurement of ALP include:
1. Serum ALP activity can be measured by the method of the Japanese Society of Clinical Chemistry
[13]. Serum ALP isoenzymes are separated electrophoretically with Titan III supporting media.
2. Immune-enzymatic method: a mouse monoclonal antibody specific to BAP is used on an immune-
enzymatic assay, and the antibody-antigen (Ab-Ag) complex is measured on a luminescence
analyzer. Normal values of BAP by this measurement are below 90 U/L, (30% of total ALP (14).
3. Colorimetric method: p-nitrophenol reagent absorbs wavelengths of light in the 400 nm region; the serum sample diffuses into the underling layer of Vitros slide and the color of the reaction is monitored by reflectance spectrophotometry. The rate of change in reflection density is converted to enzyme activity. The normal ALP range of the study was: 36-126 U/L. Some metabolic components and drugs (e.g. bilirubin, methotrexate, nitrofurantoin, etc.) that significantly absorb light in the 400 nanometers region can cause a special interference. A compilation of this information is available in the literature (Clinical guide to laboratory tests, edited by Norbert W. Tietz, published 1983 by W.B. Saunders).
4. Semi-quantitative method for determination of NAP
1 In the neutrophils of healthy individuals, ALP is localized predominantly to the secretory vesicles. On blood smears, stained Leonard-Israels-Wilkinson, lysosomes from granulocytes appear as dark-blue or black grains in the cytoplasm of the cells [15]. The interpretation of the reaction will be according to the score until 100 segmented granulocytes, in which the intensity of the colored grains will be recorded on a scale from 1-4. The score of Leukocyte Alkaline Phosphatase will be given by
38
the product between the number of counted cells and the percentage (%) values. Normal scores are between 60 and 100 [16] The characteristics of the neutrophil alkaline phosphatase (NAP) and the calculated score according to intensity of color from granulocytic granules after observation of Kaplow are emphasised in [Table 1].
Number of cells
Percent of cytoplasm volume occupied of color
Intensity of color from granulocytic granules Normal score
Intensity of cytoplasm from granulocytic cells stained Leonard-Israels-Wilkinson ALP score
0 -------- Absent =60 Absent = 0
1+ 50 Small = 20 Mild =20
2+ 50-80 Small = 14
Mild to powerful = 28
3+ 80-100 Mild = 5 Powerful = 15
4+ ,,,,,,,,,,,,,, Sum
100 ,,,,,,,,,,,,,,,,
Strong = 1 ,,,,,,,,,,,,,,,,,,,,,,,,, 100
Very powerful = 4 ,,,,,,,,,,,,,,,,,,,,,,,,,,,,,,, 67
Table 1. Characteristics of the neutrophil alkaline phosphatase (NAP) and the calculated score according to intensity of color from granulocytic granules (Observation of Kaplow) Note that the NAP enzyme must be examined only in segmented and un-segmented neutrophils
and eosinophils, in time what the basophiles are NAP negative and must not be counted toward the
ALP score. The NAP allows for the appreciation of normal or pathological chemical activity IN
neutrophils, which would appear to have normal morphology in microscopic analysis and even
though they might seem normal under the microscope, they have a modified chemical content with
altered functionality [Figure 1].
39
Fig 1. Leukocytes with positive reactions, Leonard-Israels-Wilkinson stain. Alkaline phosphatase in lysosomes of stained granulocytes with positive reaction, + and ++, showing as black granules. In the left up, a neutrophil granulocyte without alkaline phosphatase The steps of technical laboratory method using a SIGMA kit (www.sigmaaldrich.com) for determination of NAP activity are following: Fixing of the blood sample with a solution of alcohol-phenol, in a 9:1 ratio; incubate with glicero-phosphate substrate; add 2% cobalt nitrate, and then wash the slides; add ammonium sulfate solution, calcium, sulfur black; then the blood smear is stained with May Grunwald Giemsa (17).
40
Discussion
NAP appears not to be involved in serum ALP activity in healthy individuals; however, both the
protein concentration and the enzyme activity increase in cases of bacterial infection (7).
A Leukemoid reaction is an excessive but reactive outpouring leukocytes with the appearance of
immature forms (blast, myelocytes, metamyelocytes) but this must to be distinguished from
leukemia. The Leukemoid reaction appears in response to infection, toxic, inflammatory or
neoplastic disorders. It may be acute or chronic and rarely limphocytic.
Major associated diseases are severe or chronic infection in acute phase, especially in children, severe hemolysis, and various solid tumors (especially of breast, kidney, lung, metastatic cancer), and ills arrive in Point of care department. The total leukocyte count is typically 50.000- 100.000/mm³. The granulocytes in May Grunwald stain display predominant toxic granulation, (Dohle bodies) and ALP is extremely high. The high ALP in Leukemoid reactions, lack of the so- called Philadelphia (Ph⎯) chromosome or very low score NAP or zero score NAP in acute or chronic leukemia, are usually adequate to distinguish Leukemoid reaction, with leukocytosis that is unaccompanied by immature form, from Myelocytic leukemia (CML).The NAP semi-quantitative method is a methods cheaper in const than other modern method. Increased NAP activity in some myeloproliferative diseases, such as polycythemia vera (PV), is
related to the presence of increased numbers of AP transcripts (18). Granulocytes from healthy
individuals and patients with PV or CML (chronic myelogenous leukemia) preferentially express
bone-type ALP transcripts. NAP activity is substantially decreased in hematopoietic stem cell
disorders such as CML and paroxysmal nocturnal hemoglobinuria (19).
In myelopoiesis, NAP production in neutrophils is induced by GCS-F, and NAP is released into
the bloodstream, perhaps through leakage of ALP from damaged or dead neutrophils. Fossa et al.
(6), reported leukocytosis and increased serum ALP in response to GCS-F treatment and suggested
that increased serum ALP activity was related to release of the enzyme from the increased numbers
of leukocytes. Neutrophils were reported to be the source of increased serum ALP activity in
experiments in which GCS-F was administered to rats (18). On a microscopy smear, granulocytes
display predominant toxic granulations, Dohle bodies, and in serum there is elevated NAP. In
mature granulocytes from CML, NAP decreases until “0”, and will appear after chemotherapy.
The PNA score [ Table 2], has a macroscopic internal control, by comparision a two slides with
41
blood smear colored Leonard-Israels-Wilkinson stain, in which, a slide is a sure pozitv control , with blood from a patint with sepsis and another sure negativ slide, with blood from a healthly person.It is known that some drugs can influence the activity of alkaline phospatase, like cortizol, contraceptives and conditions of phisical stress. In the case of leukocytosis, NAP levels allow for the distinction between CML, where NAP is absent, and PV, where NAP is increased past the normal interval. It is also possible to distinguish between secondary polycythemia, where NAP is decreased, and PV, where NAP is highly increased. (20).
Additionally, NAP levels allow clinicians to distinguish between various types of acute leukemia,
un-treated with cortisol drugs:
A) In Myeloblastic Acute Leukemia, NAP has zero or low values in mature neutrophils.
B) In Limphoblastic Acute Leukemia, NAP is decreased in mature neutrophils.
C) In Hairy Cell Leukemia with severe neutropenia, NAP is very high.
D) In Non-Hodgkin Acute Lymphoma, NAP is decreased, whereas in Hodgkin Lymphoma, NAP
has very high values. In children, the HAP value is increased in CML. In Trisomy 21 and
Mongolism, NAP is increased because of the chromosomes surplus.
Low or undetectable alkaline phosphatase activity is a relatively uncommon finding. Errors of
decrease of alkaline phosphatase activity can occur in the absence of bivalent cations which are
necessary as cofactors in reaction. In a review of almost 70 000 alkaline phosphatase results for
adult, mainly male, patients, Lum found low activity in only 0.19% (21). In half of the cases
reviewed, there was no explainable cause for the low results. The most common explainable cause
was cardiac surgery; malnutrition and magnesium deficiency were the next most common causes.
All of these causes can be associated with either low levels of cations, such as zinc, or the presence
of chelators, such as citrate, in transfusions that lower alkaline phosphatase activity.
Clinically apparent causes of low alkaline phosphatase levels include the rare congenital disorder
hypophosphatemia, use of estrogens (including estrogen-containing oral contraceptives), and severe
hypothyroidism. Low alkaline phosphatase activity is also seen in fulminant hepatitis due to Wilson
disease.
Conclusions
Direct evidence of the biochemical and immunochemical properties of ALP in the sera of patients with leukocytosis is needed for better diagnosis. In general, testing for the various isoenzymes is
42
very important for an accurate, ahead-of-time diagnosis and should be considered when signs and symptoms fail to give a clear answer. We have proposed to national and international congresses of laboratory medicine (SRML/EFCC//IFCC), along years, the assessment of laboratory ALP results, by different methods, to help clinicians make the correct decisions concerning newly treatment of patients in hospitals.
Questions and answers:
1. Pathological conditions can increase the levels of the following isoenzyme(s):
A. NAP and HAP
B. HAP only
C. BAP only
D. NAP, HAP, and BAP
2. Which of the following is not an ALP isoenzyme?
A. NAP
B. PLAP
C. LDH
D. ALPI
3. ALP levels in a mature female are elevated and further testing shows that BAP levels are also
elevated. These results indicate that:
A. The patient is healthy and is going through a growth spurt
B. The patient could be suffering from a bone disease or a cancer spread to the bone
C. The bile ducts are blocked, causing the elevated BAP levels
D. The patient is in the third trimester of pregnancy and the placental ALP is increased
4. NAP values are useful in distinguishing between (choose all that apply):
A. Policythemia vera and Secondary policythemia
B. Different types of bone cancer
C. Acute and Chronic Limphocytic Leukemia
D. Liver diseases and Obstructive biliary disease
5. Low ALP activity is seen in the following case(s) (choose all that apply):
A. Malnutrition and magnesium deficiency
B. Bone or liver disease
43
C. Acute leukemia
D. Leukemoid reaction
Correct answer; D, C B, A, A REFERENCES 1. Moss DW. Alcaline phosphatase isoenzymes. Clin Chem 1982; (28): 2007-2016 2. Udristoiu A. Bioenergetica celulara normala si maligna. Bucuresti, Targu Jiu: Ed. Academica Brancusi 2002; (1): 200-239
3. Lab Tests Online (2011). AACC, USA, accessed on 02/26/2011, http://labtestonline.org/understanding/analytes/alp/multiprint.html>www.aacc.org<
4. Van Hoof VO, De Broe ME. Interpretation and clinical significance of alkaline phosphatase isoenzyme patternS. Clin Lab Sci.1994; 31:197-293.
5. Sato N, Takahashi Y, Asano S. Preferential usage of the bone-type leader sequence for the transcripts of liver/bone/kidney-type alkaline phosphatase gene in neutrophilic granulocytes. Blood 1994; 83: 1093-110 6. Fosa S, Poulsen J, Aaserud A. Alkaline Phophatase and Lactate Dehydrogenase changes during leukocytosis induced by G-CSF in testicular cancer. Lancet 1992; 9:340-1544 7. Karlsson A, Khalfan L, Dahlgren C, Stigbrand T, Follin P. Neutrophil alkaline phosphatase activity increase in bacterial infections is not associated with a general increase in secretory vesicle membrane components. Infect Immun. 1995; 63:911-916 8. Kress C. Bone Alkaline Phosphatase, methods of quantification and clinical utility. J Clin Ligand Assay. 1998; 21:139-148 9. Garnero P, Darte C, Delmas PD. A model to monitor the efficacy of alendronate treatment to woman with the osteoporosis using a biochemical marker of bone turnover. Bone 1999; 24: 603-609 10. Lange PH, Millan JL, Stigbrand T, Vessella RL, Ruoslahti E, Fishman WH (August 1982). "Placental alkaline phosphatase as a tumor marker for seminoma". Cancer Res 1982; (8): 3244–3247 11. Domar U, Hirano K, Stigbrand T. Serum levels of human alkaline phosphatase isozymes in relation to blood groups. Clin Chim Acta 1991; 203(2-3):305-313
12. Nakata N, Tozawa T. The ABO blood groups-dependent reference intervals for serum alkaline phosphatase isozymes and total activity in individuals 20-39 years of age. Cell Biology 2006; 7: 20
44
13. Masakazu I, Jinko I, Akihiro T, Masato M. Japanese Society of Clinical Chemistry, recommendation methods for measurement of human serum enzyme activity-alkaline phosphatase. Jpn Clin Chem. 2004; (33 Sup):78a-96a. 14. Kress C. Bone Alkaline Phosphatase, methods of quantification and clinical utility. J Clin Ligand Assay. 1998; 21:139-148 15. Kaplow S L. Leukocyte alkaline Phophatase cytochemistry: applications and methods. Annals of the New York Academy of Science 2006; (2); 55 16. L. T. Butt L.T, Strafford N. Papilloma of the bladder in the chemical industry. Analytical methods for the determination of benzidine and β-naphthylamine, recommended by A.B.C.M. sub-committee. Chemical Technology and Biotechnology 2007; (12): 6 17. Rosner F, Schreiber ZR, Parise F. Leukocyte Alkaline Phosphatase, Fluctuations with Disease Status in Chronic Granulocytic Leukemia. Arch Intern Med 1972; 130 (6):892-894. 18. Tsuruta T, Tani K, Hoshika A, Asano S. Alkaline phosphatase, defensive gene expression and effect of myeloid cell growth factors in normal and leukemic cells. Leuk Lymphoma. 1999; 32:237-47 19. Kato Y, Yamamoto M, Ikegami J et all. A possible mechanism of increased serum alkaline phosphatase activity in rats given of granulocytes colony-stimulating factor. Exp Anim 1996; 45:23-32 20. Stewart C. Leukocyte alkaline phosphatase in myeloid maturation. Pathology 1974; 6: 287-293 21. Lum G. Significance of low serum alkaline phosphatase activity in a predominantly adult male population. Clin Chem. 1995; 41:515–18
45
Chapter 4
From Metabolic Syndrome to Normal Status
ABSTRACT Objective The aim of this work was to find a standard physical exercise which would allow patients with clinical and paraclinical signs of Metabolic Syndrome (MS) to attain a normal Body Mass Index (BMI) and, good Waist Hip Ratio (WHR) values, as well as normalized levels of parameters from lipid metabolism. Design Patients showing signs of MS were assessed using a biochemical analyzer (Hitachi 912 - Roche Diagnostics) – analyses were done for the the principal biochemical parameters of lipid metabolism: Total Cholesterol (CO), Triglycerides (Try), HDL-CO and LDL-CO. Subject In addition to the standard program of physical effort, in the department of kineto-therapy from ambulatory of hospital, to all patients from longitudinal study, were assessed on a biochemical analyzer Hitachi 912 (Roche Diagnostics, USA), the principal biochemical parameters of lipid metabolism: Total Cholesterol (CO), .Triglycerides (Try) and, fractions of Total Cholesterol, HDL and LDL. Results Before the standard exercise program, based solely on the biochemical tests, 23% of the patients showed a healthy lipid metabolism, 28% of the patients present high LDL and low HDL, indicating the onset of the atherosclerotic process, another 14 were cases which showed atherosclerotic index and LDL/HDL > 3.5 for men, and >2.5 for women, another 5% were cases with predictive values of coronary risk, .CO/HDL >5, and the remaining 30% were patients with dis-lipid syndrome type 2-4,with high Cholesterol and Triglycerides. After 3 months of standard physical effort, from the total patients in study, 64 patients (80%), both males and females, obtained normalized biochemical results, a good Body Mass Index (BMI) and, a normal health status (normal Qualitative Index HOMA). The other 20% of the patients did not have satisfactory results. Conclusion The diet/exercise combination presented in this study proved to be a very good treatment for MS and, he patients who failed to respond to this therapy will require drugs recommended of clinicians, in addition to exercising and, dieting.. Key words: metabolic syndrome, obesity, hypocaloric diet, physical exercise, adipokines, adiponectin, leptin Abbreviations: BMI=Body Mass Index; MS=Metabolic Syndrome; TNF=Tumor Necrosis Factor; .IW=Ideal weight; WHR=Waist to Hip Ratio; THR =Target Heart 86Rate METs = .Metabolic equivalents.
46
Introduction In all developed countries, as well as in developing ones, the number of obese individuals diagnosed with insulin resistance (IR) has quickly risen above 40% in last years. IR is a patho-physiological state characterized by a subnormal physiological response to insulin concentrations; this state precedes the development of Metabolic Syndrome (MS). Insulin resistance is often considered to be a pre-diabetic condition. However, studies shown that the progression of pre-diabetes to diabetes can be .prevented by a combination of weight loss and increased physical activity. Although IR can be determined through a variety of methods, these methods are difficult to apply in the everyday clinical practice and, thus it is easier to monitor the clinical and para-clinical parameters for MS (1). Clinical Signs of MS: 1. Obesity with Body Mass Index (BMI) of > 30 for women and > 35 for men, calculated as [Weight (Kg)]/[Height (m)]2. 2. Waist > 90 centimeters for women and >85 centimeters for men measured at half distance between the xyphoide appendix and the navel. According to APTT3 Guidelines using Asian-specific waist circumferences cut-offs, there is a 63% increase in the risk type 2 diabetes if these values are exceeded. 3. Qualitative Insulin Sensitivity Check Index (QUICKI) for measuring insulin sensitivity (inverse of insulin resistance). 4. Waist to Hip Ratio (WHR), calculated as the Waist Circumference/Hip Circumference (measured between the two trochanters) >0.95 for women and > 0.85 for men, appreciating the abdominal fat (2). 5. WAIST/ BMI >3cm/Kg. 6. HOMA Qualitative Index >2 when liver fat is measured by tomography [Graphic 1].
47
Para-clinical analysis of MS: Blood Glucose, (fast blood sugar) > 120 mg/dl, as a signal of insulin resistance in non-diabetic obese persons; Liver enzymes: AST, ALT, GGT, ALKP with 20-40 units above normal as a120 signal of fatty liver; AST/ALT< 1 in non-alcoholic fat; Serum Pseudo-Cholinesterase > 9000 U/L, for the appreciation of a dysfunctional liver, Adipokines, Uric acid, Dis-lipid syndromes, Interleukin 18 and, PCR (3). Additional signs of MS: As previously mentioned, IR is characterized by a subnormal physiological response to insulin concentration within the reference interval. The uptake of glucose by skeletal muscles and adipocyte cells is mediated by the GLUT4 glucose transporter. The deposition of glucose by the GLUT4 receptor is the rate-limiting step in glucose uptake and is controlled by insulin. In the case of insulin resistance, GLUT4 expression is down regulated in adipose tissue, resulting in a decreased absorption of glucose. Fatty liver disease is emerging as a component of MS and its indicators include elevated levels of liver-enzymes (AST, ALT, ALP, CHE, GGT), and AST/ALT ratio smaller than 1; all of these predict the development MS. There is a well-established relationship between GGT level and triglycerides level in MS. Scope The aim of this work was to find a program of standard physical exercise which would allow patients – with clinical and para-clinical signs of Metabolic Syndrome (MS) to obtain the ideal weight (IW) for an adult man which can be calculated as a function of the height in centimeters (H) and age (A), using the formula: IW = 50 + 0.75( H-150) + (A-20)/4, [for women, IW x 0.9], normal Body Mass Index (BMI) and Waist Hit Ratio (WHR) values, along wit normalized levels of lipid metabolism parameters. This experimental study was recommended to patients with signs of Metabolic Syndrome who did not practice any systemic sports.
48
Method The patients showing signs of MS (45 adult females and 35 adult males, (mean age 145 20-50 years) applied a combined treatment consisting of a hypocaloric diet – less than 2500 kcal/day – and a program of physical exercise on fitness bike (24 rotations per minute, 20 min/day, 4-5 days/week) for 3 months. During the physical exercise, the average heart rate (HR) was 110-120 beats/minute (BPM). The exercise was consisted in a number of 26 rotations /minute, on the fitness bike, all time of exercise [Graphic 2].
The energy consumed on exercise was calculated to be10 kcal/minute [Graphic 3].
49
The study used a fitness bike which allowed the investigator to record in mean value the intensity of the physical effort (fitness bike Pegas - Pedalux 3, Factory Tohan, town Brasov, Romania. Patients showing signs of MS were assessed using a biochemical analyzer (Hitachi 912 -Roche Diagnostics) – analyses were done for the principal biochemical parameters f lipid metabolism: Total Cholesterol (CO), Triglycerides (Try), HDL-CO and LDL-CO. Results Before the standard exercise program, based solely on the biochemical tests, 23% of the patients showed a healthy lipid metabolism, 28% of the patients presented high LDL and low HDL, indicating the onset of the atherosclerotic process, another 14% were cases which showed atherosclerotic index and LDL/HDL > 3.5 for men, and >2.5 for women, another 5% were cases with predictive values of coronary risk, CO/HDL >5,and the remaining 30% were patients with dis-lipid syndrome type 2-4, with high Cholesterol and Triglycerides. Scheduled physical effort, (20 minutes/day), on a fitness bike, pedaling with a force of 7-8 kg*m/s2, at a rate of 24 rotations/minute, with an average cardiac rate of 110-120 beats/minute allowed each patient to burn about 400 kcal/day. The exercising Regimen can be accompanied by a dietary reduction of 400 kcal daily [Table 1].
Table 1.Calorific ration/day in function of age and weight in the normal activity In addition, two jogging sessions of 5-6 km, twice a week, would lead to the consumption of an additional 200-300 kcal/session (7).
The target heart rate (THR), which determined the intensity of exercises, was generally recommended based on resting heart rate (HR rest) and on heart rate during physical effort (HRP), which must be 60% to 80% of the values characteristic of aerobic metabolism. The THR ranges were calculated (using Karvonen approach) as follows: THR = (HRP × 60%) + HRR (e.g. THR = (110 × 0.60) + 70 = 136 bpm or, (110 × 0.80)175 + 70 = 158 bpm). Therefore, a THR range would be 136-158 bpm or a pulse count of 22-26 beats/10 seconds (14). The energy consumption per minute, when jogging, can be calculated using the formula: E (Kcal) = 0.8 x (v) + 0.5 were “v” is jogging speed (3.5-6.5 km/h). Metabolic equivalents (METs), were useful units when recommending walking180 exercises. By definition, METs is a unit of energy or level of oxygen used at rest (10). MET = VO2 of 3.5 mL/kg/min). However, recent studies indicate that the average resting MET level in subjects with coronary heart disease is 23% to 36% lower than the standard value of 3.5 mL/kg/min (14). Nevertheless, most people walking at 2 km/hour require 2 METs, and for 3 Km/hour, they require 3-4 METs. When one consults a common MET table, an exercise intensity of 6.2-8.0 METs is equivalent to a slow walk-jog combination exercise, hiking with a backpack, hill climbing, and numerous other moderately vigorous activities. Exercise intensity may be customized to the individual (exercise prescription) based upon their metabolic response to progressive exercise if the VO2max and the anaerobic threshold (AT) or ventilatory threshold (VT) is determined. By definition, the VT may be described as the level of oxygen consumption (VO2) at which a significant Increase in anaerobic metabolism occurs, as evidenced by an increase in blood lactate levels and respiratory responses to the increasing exercise workload. The total energy delivered by the body Q, (Kcal) can be calculated by theoretical estimation: Q (Kcal) = (Oxygen consumption/minute x isocaloric coefficient) – (CO2`) x 4.85. The lipids energetic consumption (QL, in kcal) can be estimated from the equation: Q1= CO2`- (17.35 x MSC x 4.85), where CO2` = 4.83 x [5.9 + W + 151 + 10 X p] and, MSC being 20% of the total body mass, W is the patient’s weight (in Kg), and P is the power of pedaling on the stationary bicycle (Watts/min). For an efficient exercise, the lipid energetic consumption must exceed 7 Kcal/minute. After 3 months of following the exercising regimen, from the total number of patients involved in the study, 64 of patients (80%), males and females, obtained a good Body Mass Index (BMI), a good Waist to Hip Ratio (WHR), a normal health status (normal Qualitative Index HOMA), and normalized biochemical results: Total Cholesterol, (mean) value = 169.5 mg/dL, SD =2.13, p = 0.005, reference interval = 114-225 mg/dL), Triglycerides, (mean value = 99 mg/dL, p = 0.04, SD = 2.92, reference interval = 53-145 mg/dL), HDL (mean value = 63 mg/dL, SD = 2.60, reference interval = 36-60 mg/dL) and LDL, ( mean value = 89 mg/dL, SD = 2.88, reference interval =48-130 mg/dL). The other 20% of the patients did not have satisfactory results. The patients who failed to respond to this therapy will require drugs recommended of clinicians, in addition to exercising and dieting. Discussions Previous studies have found a significant interaction between GGT and triglycerides in predicting prevalent diabetes, suggesting that the association between triglycerides and diabetes might only be marginally influenced by GGT concentrations. Furthermore, Lim et al. (4) have found a strong interaction between GGT (>44 U/L) and BMI (> 35 kg/m2) when predicting diabetes, suggesting that GGT must be used as a predictor of MS developing liver fat, insulin resistance, and fibrosis Central abdominal fat showed a stronger correlation with QUICK Index in overweight women and men (2). Adipokines, insulin resistance, high blood glucose levels, high level of liver enzymes, high-sensitivity CRP lipid profile and Homeostasis Model Assessment (HOMA) Index greater than 2 was considered candidates for MS status (6). The Adipokines family includes: Adiponectin, Leptin, Tumor Necrosis Factor-alpha (TNF-α) and Resistin (5). Adiponectin, the only fat cell-secreted
51
hormone that is paradoxically decreased in cases obesity, has insulin sensitizing effects and is correlated with the waist circumference of men and women. An increase in Adiponectin points to a decrease in visceral fat. Mediterranean-style diet and increased physical activity causes decreases in BMI with significantly increased Adiponectin concentration. Discovered in 1994, Leptin is a protein composed of 146 amino acids, synthesized in the adipose tissue under the skin. Leptin was identified as being the product of Ob genes. Hepatic resistance to Leptin causes steatosis and the increase of gluconeogenesis. Levels of Leptin are dependent on BMI in function of the dimension of adipose cells and can be considered a marker for insulin resistance. It has been shown that smoking modulates Leptin and is associated with metabolic profiles with increased chronic heart diseases (CHD), obesity, HOMA index (HI) greater than 2 and poor peripheral insulin activity (8). Resistin, discovered in 2001, is expression from a gene located in white fat tissue and in the immuno-competent cells. High BMI, excess adipose tissue, and high level of insulin coexist are accompanied by high levels of Resistin (9). Uric acid has been shown to decrease endothelial nitric oxide production (NO), and to lead to endothelial dysfunction and insulin resistance. Consequently, uric acid leads to vascular inflammation and artery damage, which in turn lead to increased risk of diabetes and atherosclerosis (6). Dis-lipid Syndromes involve high density lipoprotein (HDL) below normal values (<35 mg/dl for men and <248 45 mg/dl form women), low density lipoprotein (LDL) > 130 mg/dl, Total Cholesterol 249 >240 mg/dl, Triglycerides>150 mg/dl, Total Cholesterol/HDL ratio >5, LDL/HDL ratio >2.5 for women and >3.5 for men, high Apo-B protein in the plasma. CD36 receptor is a scavenger receptor for oxidized LDL (ox LDL) in apoptotic cells and in macrophages. CD36 facilitates the formation of foam cells and is a fatty acid transporter in muscle and in liver cells. Expression of CD36 is up-regulated by ox-LDL, hyperglycemia, and insulin resistance (5). Two comprehensive reviews found little evidence for an intensity threshold for changes in HDL cholesterol, LDL cholesterol, or triglycerides, although most studies did not control for exercise volume, frequency, and/or duration and were conducted at intensities ≥40%VO2max. Similar methodological limitations pertain to studies evaluating blood pressure, glucose intolerance, and insulin resistance. Several studies suggest that exercise intensity does not influence the magnitude of loss of body weight or fat stores, but these data are also confounded by variability in exercise volume and other factors (10). The abnormal mitochondrial function (and morphology) in adipocytes leads to a reduced rate of beta-oxidation of fatty acids. The overloading of adipocytes with non esterified fatty acids induces mitochondrial damage, leading to a vicious cycle. Human pre-adipocytes in all stages of differentiation spontaneously secrete IL-18. IL-18 releas from adipocytes of obese patients exceeds by some 3-fold that from adipocytes of non obese patients (8). The American College of Sports Medicine (ACSM) recommends that most adults engage in moderate intensity cardio-respiratory exercise training for at least 30 min/day, at least 5 days a week, for a total of over 150 minutes of exercise per week. The physical exercises should contain vigorous-intensity cardio-respiratory exercise training for at least 20 min/day on at least 3 days of the week (≥75 min/week), or a combination of moderate and vigorous intensity exercise to achieve a total energy expenditure of over 500-1000 Kcal/min/week. On 2–3 days/week, adults should also perform resistance exercises for each of the major muscle groups, and neuro-motor exercise involving balance, agility, and coordination. The exercise program should be modified according to the individual's habitual physical activity, physical function, health status, exercise responses, and stated goals (10). In a parallel with the our study, 75 young healthy individuals, members of a sporting club, (Tennis Club Bucharest), have been tested on the same ergonomic bike in order to get an idea of the effort capacity and calorie consumption of healthy individuals (as a baseline). The table shows all of the registered values, as well as the results follow-up from calculations. The same formulas can use in
52
any such calculations, for both healthy and obsess individuals who follow a fitness program, irrespective of age.
Sex
/ N
umbe
r pe
rson
s
Mea
n ag
e
Mea
n W
eigh
t (kg
)
VO
2 /m
in
Hea
rt R
ate
(BP
M)
Res
pira
tory
rat
e/m
in
Inde
x O
2/pu
lse
Eq.
res
pir
resp
irat
ory
Kca
l / m
in
Wat
ts
M /15
29 65 3.1 120-130 35 18.7 21.4 13.6 212
M/ 10
25 63 2.7 144-150 40 17.1 24.2 12.6 196
M/ 20
17 61 2.2 140-150 45 14.1 30.3 10.4 179
F/ 12
23 52 2.1 140-150 50 13.3 32.5 9.7 147
F/ 18
20 50 2.0 150-160 60 9.5 38.1 8.3 122
F/ 5
17 48 1.9 150-160 60 8.8 38.8 7.8 114
Table 2. The results of energetic investigations during aerobic-anaerobic exercise performed by athletes on the ergonomic bike Legend: VO2 = Oxygen consumption Index oxygen pulse = VO2 2/heart beat (> 18.7 for ideal performance) Respiratory equivalent = Expiratory volume/ VO2 ( 28±3 for ideal performance)
Expiratory volume = Current Volume x Heart Rate Current Volume = 37% of body weight (Kg). Corroborating evidence is provided by a study of sedentary subjects who walked at a self-selected pace with fixed volume (10,000 steps per day, 3 days/week) and improved lipoprotein profiles and expression of genes involved in reverse lipid transport, without accompanying changes in body weight and total body fat. Further, a study of 16 pairs of same-sex twins with discordant physical activity patterns found that greater volumes of exercise were associated with lower total, visceral, liver, and intramuscular body fat, with the active twin having on average 50% less visceral fat and 25% less subcutaneous abdominal fat compared with the inactive twin (11). In addition, increased levels of IL-18 may predict the development of Metabolic Syndrome; this prediction can be verified by checking for metabolic risk factors such as high BMI, high systolic
53
blood pressure, and low physical activity. Also high-sensitivity CRP (hs-CRP) has been associated with increased adiposity and a few studies have demonstrated that CRP is associated with IR, independent of obesity. The persons with hs-CRP > 3mg/L and BM I > 30 had a very high prevalence of IR (76.2%), whereas those with hs-CRP < 1mg/ L and BMI < 25 had the lowest prevalence of IR (6.5%), (12). Beyond the minimal amount of 15 minutes of daily exercise, each additional 15-30 minutes was associated, throughout years of exercising, with a further reduction in all cause mortality risk by 4%, (95% CI, 2.5 - 7.0) and in all-cancer mortality risk by 1% (95% CI, 0.3 - 4.5). These benefits of exercise were seen in all age groups, in both sexes, and in persons at risk for cardiovascular disease. Compared with individuals in the low volume group, inactive persons had a 17% increased risk for mortality (HR, 1.17; 95% CI, 1.10 - 1.24). The knowledge that more of 15 min per day of exercise on most days of the week can substantially reduce an individual's risk of dying could encourage many more individuals to incorporate a small amount of physical activity into their busy lives (13, 14). Conclusion The diet / exercise combination presented in this study proved to be a very good treatment for MS and every physician should recommend this regimen, or a similar one, to patients who show signs of MS. For the patients which have had not shown good results from exercising on the fitness medicinal bike a drug treatment will be necessary: administration of Leptin drug, Leptin gene, promoter drug, in addition to physical exercising and dieting. REFERENCES 1. Koenig W, Meisinger C. Uric acid, type 2 diabetes, and cardiovascular diseases:fueling the common soil hypothesis?. Clin Chem. 2008; 54: 231-233. 2. Mathur R., Stoppler M.C. Metabolic Syndrome. MedicineNet.com/. Accessed, September 9, 2011 3. Bjerrum JT, Nielsen OH, Hao F, Tang H, et.al. Metabonomics in ulcerative colitis: diagnostics, biomarker identification, and insight into the pathophysiology. J. Proteome Res. 2009; 9(2):954–962. 4. Lim JS. A strong interaction between GGT and obesity on the risk of prevalent type 2 Diabetes. Clin Chem. 2007; 53:1092-1108. 5. Handberg A, Levin K, Højlund K, Beck-Nielsen H. Identification of the Oxidized Low-Density Lipoprotein Scavenger Receptor CD36 in Plasma; A Novel Marker of Insulin Resistance. Circulation. 2006; 114: 1169-1176. 6. Sinha. MK, Traci Xiao SQ. Analytical Validation and Biological Evaluation of a High-Molecular Weight Adiponectin on ELISA. Clin Chem. 2007; 53: 2144-2151. 7. Udristioiu A. Cicloergometrul si Sanatatea. Bucuresti. Edit. Medicala. 2007; (1): 5-45. 8. Kratz M, Eckardstein AV, Fobker M, Buyken A, et al. The Impact of Dietary Fat Composition on Serum Leptin Concentrations in Healthy Nonobese Men and Women. The Journal of Clinical Endocrinology & Metabolism. 2002; 87(11):5008–50149. 9. Janke J, Engeli S, Gorzelniak K, Luft FC, et al. Resistin Gene Expression in Human Adipocytes Is Not Related to Insulin Resistance. Obesity Research. 2002; 10: 1–5.
54
10. Barclay L. Moderate Exercise for 15 Minutes Daily Improves Survival. Journal of the American College of Cardiology. 2011; 8: 1560-1575. 11. Kaminsky L.A, Whaley MH. Effect of interval type exercise on excess post-exercise oxygen consumption (EPOC) in obese and normal-weight women. Medicine in Exercise,Nutrition, and Health. 1993; 2: 106-111. 12. Reyes M, Diaz E, Blanco E, Levia L, et al. Relationship of Adiposity and Insulin Resistance Mediated by Inflammation in a Group of Overweight and Obese Chilean Adolescents. Nutr J. 2011; 10: 14. 13. Smith MC, Naughton L. The effects of intensity of exercise on excess post-exercise oxygen consumption and energy expenditure in moderately trained men and women. European Journal of Applied Physiology. 1993; 67: 420-425. 14. Suleman A. Exercise Prescription. http://reference.medscape.com/. Updated, December 10, 2010.
55
Chapter 5
Frequency of Sub-clinical Dysfunctions on Thyroid to Ambulatory Control
ABSTRACT The thyroid dysfunction, in special the insufficiency of thyroid caused be deficiency in iodide, is a worldwide problem. In sub-clinical thyroid disease, thyroid stimulating hormone (TSH) is situated in” gray zone “on the border of overt thyroid disease. Aim: The goal of this work is to emphasis frequency in ambulatory controls of sub-clinical dysfunction of thyroid gland and un-respected relation of reverse proportion between thyroid hormones, stimulating hormone thyroid, (TSH) and, tetra iodide-tiroxin, (T4), in thyroid disease, among the adults without a specific treatment. Material and Method: This study of laboratory represents a back-up from the computer of Analyzer Immulite to a number of 160 patients to which were assessed by chemiluminescence the values of thyroid hormone in time of 3 months. During the period of study from 160 patients, 140 were females and only 20 were men with range 17-52 years. Results: In sub-clinical hypothyroidism, with normal level T4, the patients` TSH level which were above the limit reference range, from 4.12 micro IU/ml until 10 micro IU/ml , have been in 18,75% percent. In sub-clinical hyperthyroidism, with T4 normal value, TSH level which was under the limit of reference, with values 0.40-0.2 micro IU/ml have been only in 2.10% percent. In this study we noted that hypothyroidism is more common that in of post-menopausal women with 22% showing evidence of hypothyroidism that can has significant clinical consequences. Conclusion: Sub-clinical hypothyroidism in which TSH of third generation is elevated past 4 micro IU/ml, but FT4/FT3 is normal, is believed to be a subtle and early indicator of thyroid dysfunction. For the evidence of sub-clinical hyperthyroidism we have need of more studies. Abbreviations; 1. TSH- thyroid stimulating hormone 2. T4-tetra iodide-tiroxin 3. TPO-Ab- thyroid peroxidase antibody 4. T3-Thriiodide-tiroxine 5. BV-Biological variation
56
Introduce In the majority of patients, thyroid disease symptoms are subtle in presentation to medics, so only biochemical testing or biopsy-pathologic evaluation can detects the disorder. Several studies have defined the prevalence of sub-clinical hypothyroidism in women as more that five times that of overt disease, ranging from 8% to 21% in various population studies. Because the signs and symptoms of hyperthyroidism are vague or non-specific, many cases are not diagnosed. As used in context of the current debate, sub-clinical thyroid` dysfunction, is a condition diagnosed almost entirely based on laboratory measurements. Most the often sub-clinical concept refers to a form of disease in which patients are asymptomatic and/or not require treatment TSH which can falls outside of the normal reference range but his or her level of free-thyroxine (FT4) or free-thriiodothyroxine (FT3) remains within in reference range. Such patients may or may not be symptomatic and the question of need for treatment is one a primary disputes in the current debate. Aim The goal of this work is to emphasis frequency in ambulatory controls of sub-clinical dysfunction of thyroid and frequency of un-respected relation of reverse proportion between thyroid hormones TSH--T4, in thyroid disease among the adults without a specific treatment. Material and Method To the number of 160 patients assessed TSH and T4 values to patients presented in ambulatory controls in time of 3 months and the links between these parameters. Measurements of circulating TSH have been used as a primary test for differential diagnosis of sub-clinical hypothyroidism and hyperthyroidism. When a patient has had normal FT4 and slightly raised TSH on two or more occasions at least 3 months apart, he has be suggested to measure and thyroid peroxidase antibody (TPO-Ab), on a further repeat analysis because of transient elevation of TSH can also be seen in non-thyroidal illness. Principle of Procedure: Was used -Analyzer of Biochemistry, IMMULITE/ 1000 and Third Generation TSH reagent with chemi-lumiscence immune-assay. Were rejected opalescent samples, with presence of triglycerides in concentration past 300mg/dl, sera hemolysis with presence of packet blood cells in concentration past 30 micro IU/ml, bilirubin past 2mg/dl, samples with clots, blood collection tubes with anticoagulant and additive.. The samples was not storage more 5 days at 2-8 * in sample cups with 100 micro liter volume. Quality Control Samples was used by sample pools with least two levels, low and high of TSH and TSH values between 0.02-0.4 micro I.U/ml was further evaluated as a borderline hyperthyroidism illness. Our study of laboratory represents a back-up from computer of Analyzer Immulite/1000, running by immunoassay thyroid hormone TSH,T3,T4,assessing values and links between these parameters, to a number of 160 patients, in last 3 months /2005 which went for control to endocrinology department, in Ambulatory of County Hospital. The criteria for to include patients in this study were these with normal T4 level and with TSH level above the reference range(0.4-4 micro IU/ ml,) but less than 10 micro IU/ml with a least one previous TSH level in this range. Patients with known thyroid disease were excluded. Results: Expected normal values, established for TSH reagent prospects were: euthyroid 0.4-4 micro IU/ml, hyper-thyroid <0.02 micro IU/ml , hypothyroid from 7.1 to 75 micro IU /ml .in mean value
57
of 69 micro IU/ml. For T4 normal values after prospect were 5.2-12.5 microgram/d L and for T3 normal values in prospect were 70-150 ng /L. Intra-assay Precision TSH/T4/T3. Was calculated biological variability (BV), in our area geographic to 0.26 with CV=16%, values for TSH, values of 0.14 BV and 1.8% CV for T4, and 0.75 BV with CV=0.74 values for T3. TSH references intervals was established to persons which not was made detectable thyroid auto-antibodies, no personal or family history of thyroid dysfunction, no visible or palpable of thyroid dysfunction, no medication (except estrogen). The reference interval from our Laboratory or TSH was established to 0.61-3.81 micro IU/ml values and for T4 to 5.7-11.9 ng/L and for T3 to 81.2-163 ng/L. During the period of the study, 140 patients were females and only 20 were men. The mean age was 36.7 ng/L years with a range/ 17-52 years [Table 1].
TESTS Normal values from
reagent prospects Intervals of References
Biological variability
TSH 0.4-4 micro IU/ml 0.6-3.81 micro IU/ml
1.62+-0.26 CV=16%
T4 5.2-12.5 ng/ L 5.7-11.9 ng/L 1.71+_0.14 CV=1.8
T3 70-170 5.2-12.5 ng/ L
81.2-163 ng/L 101.1+-0.75 CV=0.74
Table 1 Intra-assay precision of laboratory for TSH, T3 and T4 In sub-clinical hypothyroidism a patients` TSH level which had values above the upper limit of reference has been 18.75%, per cent and in sub-clinical hyperthyroidism, TSH which level below the limit of reference of range has been 2.1%, per cent. We noted that hypothyroidism is more common in of post-menopausal women in 22% showing evidence of hypothyroidism that can have significant clinical consequences. Discussion: Most of the current methods are capable of achieving a functional sensitivity in value 0.02 micro IU/ml or less which is the necessary for detecting the full range of TSH values observed in hyperthyroidism. With level of sensitivity it is possible to distinguish the profound TSH suppression of severe Graves` thyrotoxicosis where TSH<0.01, micro IU/ml from lesser degrees of TSH suppress (0.01-0.1 micro IU/ml), observed in mild hyperthyroidism and some patients with a non-thyroidal illness (NTI), [Figure 1].
58
Figure 1.The levels of serum TSH, T4 in normal and dysfunctions of thyroid It is now recognized that TSH measurement is a more sensitive test that FT4 for detecting both hypo and hyperthyroidism, in ambulatory patient (provided that the TSH method has a functional sensitivity <-0.02 micro IU/ml.). Thyroxin T4, the principal thyroid hormone normally circulates in peripheral blood at a level of approximately 5.2-12.5 ng/L Current data from specialty lecture were established the cut off to 0.5-5 micro IU/ml (6). Exception to this parallelism between thyroid status and total T4 concentration are found however in patients with abnormal levels of thyroid-binding proteins (TBG). Level of TBG is known to be altered under various physiological, pharmacological and genetic conditions. Thus elevated T4 level may be obtained when TBG is high, as in pregnancy, acute intermittent porphyria, hyper-protein, hereditary TBG elevation and in patients undergoing estrogen therapy or taking oral contraceptive which were not assessed in this study. Total T4 levels may be depressed and TSH normal when TBG level are low, as in nephro-hepatic, gastrointestinal and neo-plastic disorders, in acromegaly, hypo-protein and hereditary developing non-thyroidal illness (NTI). TBG deficiency and patients undergoing androgen, testosterone or anabolic steroid therapy and the same, this kind of patients was not assessed. Free thyroid index mean T4 *T3 Uptake value /10, a widely used indicator of thyroid status. Expected values from specialty lecture, was 5.2-12.5 ng/L with average of 7.7. In our Laboratory Index T4*T3 Uptake value /100 was calculated to 7.81 value. The frequency of these T4 assay artifacts suggest that TSH or TSH/T4 relationship is more reliable thyroid parameter to use that an estimate of T4 alone (Chart 1}.
59
Chart 1.Causes of concordant and discordant relation between TSH, T4 and thyroidal illness. In our laboratory, when a patients has had normal FT4 and slightly raised TSH on two or more occasion at least 3 months have been suggest measurement of thyroid antibodies on farther repeat specimen and to institute treatment for patients with TSH between 5-10 micro.IU/ml ,for to prevent clinical hypothyroidism, as a patient with high-risk.
60
Increased serum triglyceride levels, low serum albumin concentrations or prolonged assay incubation at 37*and non-esterified fatty acid with high concentration >3mmol/L will increase FT4 by displacing the hormone from TBG and these patients were rejected fro this study.T3-Hormone under normal physiological conditions represents approximately 5% of the thyroid hormones in serum. Numerous conditions unrelated to thyroid disease may cause abnormal T3 values. Consequently total T3 values should not be used on their own in establishing the thyroid status of an individual. The levels of serum T4, TSH and other clinical findings must be considered very well [Figure 2].
61
Figure 2.The oscillation of TSH values and T4 in mild hyperthyroidism and non-thyroidal Illness (NTI). The terms non-thyroidal illness or NTI as well as “euthyroid sick “or low T4 syndrome, with normal TSH and T3, are often used to describe this subset of patient. Both T4 and TSH
62
measurements are most reliable way for distinguishing true primary thyroid dysfunction (concordant T4/TSH with reverse –proportional) from transient abnormalities resulting from NTI discordant T4 and TSH in normal value [Figure 3].
63
Figure 3.Primary thyroid dysfunction (concordant T4/TSH with reverse –proportional)
64
Conclusion: Sub-clinical hypothyroidism, in which TSH is elevated, but T4/T3 is normally, is believed to be an early indicator of thyroid dysfunction. Third generation TSH assay with functional sensitivity below 0.02 micro UI/d L are recommended as the most sensitive and specific tests for detecting thyroid dysfunction in ambulatory. References 1. Vicky L, Katherine H, Joan W. Clinical Consequences and Diagnosis of Hypothyroidism, Journal of the American Society for Clinical Laboratory Science 2004; 17: 24 2. Rawlins I, Roberts I,. Performance Characteristics of Six Third Generation Assays for Thyroid-Stimulating Hormone, International Journal of Molecular Diagnostics and Laboratory Medicine "Clinical Chemistry 2004; 04:12 3. Demers L, Spencer C. Laboratory Support for the Diagnosis and Monitoring of Thyroid Disease, Thyroid Guidelines 2004; 10:18 4. Guides, Immulite/ Immulite 1000, Third Generation TSH, T3, T4, Hypo and hyperthyroidism. PILKTS 2004; 04: 23 5. Briston P, Sincalair D. Antibodies to Thyroid Peroxidase (TPOAb) in serum from patients with slightly raised Thyrotroponim (TSH) levels, UK, Clinical Laboratory 2004; 50 :363-386. 6. Coculescu M. New cut off established for TSH value on subclinical thyroid disease. Balkan Conference of Laboratory Medicine (BCLF), 8-th Edition, Bucharest/10/23-26/2011
65
Chapter 6
Relation between LDH and Mg as Factors of Interest in the Monitoring and Prognoses of Cancer
ABSTRACT
The aim of this study was to evaluate the correlation between the serum levels of lactate dehydrogenase (LDH) and magnesium (Mg) in patients with diagnosed malignant diseases. We analyzed these parameters on a cohort of patients (n = 75) comprising males (n= 36) and females (n=39) with a mean age of 57 years (SD= 12.5).
Results
In this study, 55 patients (73%) who received cancer therapy exhibited normal serum levels of Mg (normal value = 1.60-2.3 mg/dL; mean value = 2.2 mg/dL; SD = 0.2; p = 0.02). In contrast, 12 patients (16%), recently diagnosed with a malignant disease, who had not been treated, displayed high levels of serum Mg(mean value = 2.89 mg/dL). High serum LDH levels were observed in patients with recently diagnosed malignant diseases or unfavorable responses to cancer therapy (range = 240-1330 U/L; mean value = 787 U/L; SD =1.33; p = 0.002; normal values = 135-225 UL).
Conclusion
The total serum LDH and Mg levels can be used as markers for the onset of malignant diseases and for monitoring the response to cancer therapy.
Introduction Magnesium, which is the second most abundant intracellular cation after potassium, has an essential role in the regulation of numerous cellular functions and enzymes, including ion channels, metabolic cycles and signaling pathways. Despite significant recent progress, the mechanisms by which cells regulate Mg homeostasis and Mg transport remains poorly understood. The reasons for the major fluxes of Mg2+ in either direction across the plasma membrane of mammalian cells following metabolic stimulus and how these mechanisms are altered under specific pathological conditions are currently unknown.. The aim of this work was to evaluate the correlation between the serum levels of lactate dehydrogenase (LDH) and magnesium (Mg) in patients with recently diagnosed malignant diseases, whether undergoing treatment or not, among patients with diagnosed malignant diseases who were admitted to the oncology department of a county hospital. Methods We analyzed a cohort of patients (n = 75) comprising males (n = 36) and females (n =39) with a mean age of 57 years (SD = 12.5) who had cancer and were admitted to the oncology department. These patients were closely monitored twice weekly during treatment with specific cytostatic drugs of induction (using fluorouracil, leucovorin, oxaliplatin or rituximab) and once weekly during consolidation therapy, using specific analyses for different cancers. In addition, with the cooperation of the doctors and the patients, we performed beside hematological and biochemical tests, the CBC with differential counts, the levels of creatinine, uric acid, ions and electrolytes (potassium, chloride, calcium) and serum LDH and Mg, which may serve as markers for monitoring the progression of malignant diseases. The hematological parameters were assessed using a Beckman Coulter HMX analyzer, USA, with a total of 22 parameters, and microscopic slides. The biochemical parameters were measured using a Vitros 250 dry chemistry analyzer (Johnson & Johnson, USA) using the slides for multi-layer spectrophotometry measurements. We excluded patients with non-neoplastic pathologies or diseases that can induce increased serum levels of Mg and LDH. The excluded diseases included acute or chronic renal failure (CRF), ischemic heart disease, lung infarction, liver cirrhosis, acute or chronic hepatitis, massive muscle injury, megaloblastic anemia and severe syndromes that are associated with respiratory failure. Before receiving specific treatments, all patients were diagnosed at the Oncology Institute of the Fundeni Hospital in Bucharest. The physicians from the county hospital had prescribed to patients only the cancer therapy recommended by the Oncology Institute. Among the patients, 8 patients were diagnosed with lung cancer, 18 patients were diagnosed with breast cancer, 19 patients were diagnosed with genital cancer, 23 patients were diagnosed with colorectal cancer, 5 patients were diagnosed with chronic lymphocytic leukemia (CLL), 1 patient was diagnosed with acute promyelocytic leukemia (LAM-3) and 1 patient was diagnosed with chronic monocytic leukemia (CMoL). The complete blood count, blood biochemistry assays, chest and whole body radiography, echocardiography and thoracic ultrasound and/or abdominal computed tomography (CT) scans were performed for each patient to establish the type of cancer. The May-Grunwald-Giemsa method was used to determine the microscopic appearance of peripheral blood lymphocytes from patients with incipient leukemia who had not received prior treatment or a hematopoietic stem cell transplant (HSCT). Morphologically, in B-cell CLL, the cells resembled normal clonal B cells that had arrested during B cell differentiation between the pre-B cell and mature B cell stages. An initial panel of monoclonal antibodies was used to determine the immune phenotypes of the subgroups of differentiated T cells and B cells.
67
Activated B lymphocytes in CLL patients were defined as CD5+/CD19+ cells that expressed CD23 and/or CD38 as surface markers. Activated T cells in patients with T-cell CLL were identified using CD7, CD5, CD3, CD2, CD4, CD8, and CD45 RO. The sample stability was maximal at one hour at 15-25°, in conformity with the conditions of the delivery of samples for the primary sample collection, following the instructions of the manufacturer and respecting the Procedures of Collection of Diagnostic Blood Specimens by Venipuncture, NCCLS Document H4-A3 Wayne, PA: NCCLS; 1991. We excluded samples from the study based on the following criteria: an icteric index > 65 for conjugated bilirubin and an icteric index > 37 for un-conjugated bilirubin, hemolysis with an H index > 400, turbidity for triglycerides > 300 mg/dl and serum containing para-proteins (multiple myeloma). The diagnosis of LAM-3 was made based on blood smears, the examination of bone marrow (BM) aspirates, the evaluation of promyeloblasts (greater than 30% in BM), and the presence of a specific immune phenotype. Immunocytochemical detection was performed to confirm the diagnosis of LAM-3 using FAR Leukemia kits (Italy), and there were positive results for the peroxidase reaction for promyelocytes, myelocytes, granulocytes, and peripheral blood cells (POX+) and negative results for the peroxidase reaction for the blast cells. We performed the leukocyte alkaline phosphatase reaction using a SIGMA kit (www.sigmaaldrich.com) to determine the neutrophil alkaline phosphatase (NAP) levels in granulocytes (negative or low values in LAM-3) and to evaluate the alpha-naphthyl-esterase reaction in monocytes cells (positive results indicate CMoL). Results Among the patients, physicians diagnosed 8 patients with lung cancer, 18 patients with breast cancer, 19 patients with genital cancer, 23 patients with colorectal cancer, 5 patients with chronic lymphocytic leukemia (CLL), 1 patient with acute promyelocytic leukemia (LAM-3) and 1 patient with chronic monocytic leukemia (CMoL). The results were interpreted for each patient based on medical history, clinical and para-clinical examinations and other signs of malignant diseases. Among the patients in this study, 55 patients (73%) exhibited normal serum levels of Mg (normal range value = 1.60-2.3 mg/dL; mean value = 2.2 mg/dL; SD = 0.2; p = 0.02) following cancer therapy. Six patients (8%) exhibited low levels of Mg (range = 0.60-1.50 mg/dL; mean value = 1.05 mg/dL). However, 12 patients (16%) displayed high levels of serum Mg (range =2.6-3.27 mg/dL; mean value = 2.89 mg/dL). The levels of serum lactic dehydrogenase (LDH) were also evaluated in patients newly diagnosed with cancer and in patients with unfavorable responses to the cancer therapy (range = 240-1330 U/L; mean value = 787 U/L; SD =1.33; p = 0.002; normal values 135-225 U/L), (Table 1).
68
Serum LDH and Mg levels of patients with newly diagnosed malignant diseases
Serum LDH and Mg levels of patients in the remission stage of malignant disease following cancer therapy
Serum LDH and Mg levels of patients with unfavorable responses to cancer therapy
Lung Cancer Mean value: LDH =1270 Mg =2.85
Lung Cancer Mean value: LDH = 254 Mg =1.60
Lung Cancer Mean value: LDH = 1330 Mg =1.26
Breast Cancer Mean value: LDH = 1250 Mg =2.55
Breast Cancer Mean value: LDH =250 Mg =1.80
Breast Cancer Mean value: LDH = 1260 Mg =0.87
Genital Cancer Mean value: LDH = 1245 Mg =2.72
Genital Cancer Mean value: LDH =260 Mg =1.88
Genital Cancer Mean value: LDH =1260 Mg =0.36
Colorectal Cancer Mean value: LDH = 1250 Mg =2.70
Colorectal Cancer Mean value: LDH =250 Mg =1.7
Colorectal Cancer Mean value: LDH =1260 Mg =0.63
Acute and Chronic Leukemia Mean value: LDH = 1290 Mg =3.75
Acute and Chronic Leukemia Mean value: LDH = 255 Mg = 2.05
Acute and Chronic Leukemia Mean value: LDH =1330 Mg =1.6
Table 1 Serum LDH and Mg levels of patients with malignant diseases; Normal value in healthy patients: LDH = 135-225 U/L, Mg = 1.6-2.3 mg/dL Discussion Approximately 60% of magnesium ions (1215 mg/dl) are stored in tissues, and approximately 40% of magnesium ions (972 mg/dL) contribute to intermediary metabolism. Among these ions, approximately 70% (680 mg) exist in the free form, Mg2+, whereas the other 30% of ions (292 mg/dl) are bound to proteins (especially albumin), citrate, phosphate and other complexes. The magnesium serum levels are kept constant within very narrow limits (0.65-1.05 mmol/dL; 1.58-2.25 mg/dL). Regulation occurs in the kidneys, especially via the ascending loop of Henle [1, 2, 19]. Biological membranes are impermeable to Mg2 (and other ions). Therefore, transporter proteins must facilitate the flow of Mg2+ into and out of cells or intracellular compartments (Figure 1).
69
Figure 1 Evaluation of the CorA periplasmic loop model: The refined region is highlighted in blue. The conserved glutamate residues are colored in red. A hydrated Mg2+ is favorably docked at the entrance of the pore (colored magenta). A magnesium ion progressively removes nearly all of the water via a selective pore before the magnesium ion is released on the far side of the membrane. These changes occur with low rates of ligand exchange in an inner coordination complex comprising water and Mg2+ [3, 21]. The transport mechanisms depend on the 3-D structure of the complex that is formed via the hydration of the Mg2+
70
ion in an aqueous environment. The inner shell of this complex comprises 6 water molecules that are relatively tightly bound, and the second shell comprises 12-14 water molecules [12]. The pore is a funnel-shaped homopentamer with two transmembrane helices per monomer composed of carbohydrate and lipid chains. The channel is formed by an inner group of 5 helices and is gated by bulky hydrophobic residues (Figure 2).
Figure 2. The structure of the conserved protein kinase core: apha Protein kinases have a characteristic bilobal fold. The N-terminal lobe (N-lobe) contains five beta strands (1 through 5; colored teal) and a universally conserved aC-helix. The C-lobe is mostly helical (colored red). An ATP molecule is bound to a deep cleft between the lobes. The catalytically important loops are colored yellow. (b) N-lobe structure. The Gly-rich loop coordinates the phosphates within ATP. Three conserved glycine residues are shown as red spheres. Lys72 from the beta 3 strand couples the
71
phosphates and the alpha C-helix. Catalytic and regulatory machinery binds the rigid helical core of the C-lobe. The extended activation segment (colored dark red) contains a phosphorylation site that is bound to b9 (K189) and the HRD-arginine (R165). The P+1 loop accommodate the P+1 residue of the peptide substrate that is docked to the peptide-binding groove. The cytoplasmic neck of the pore is surrounded by a ring of highly conserved positively charged residues on the outside of the funnel (Figure 3), [22].
72
The transient receptor potential melastatin cation channel 6 (TRPM6) forms a Mg2+ permeable pore. TRPM6 has an active cytosolic kinase domain and is considered a master regulator of cellular Mg2+ homeostasis. Another transient receptor potential melastatin cation channel, TRPM7, is an important cytosolic protein kinase that is implicated in magnesium transport across the cell membrane and plays a crucial role in proliferating stem cells. The genetic deletion of TRPM7 in B cells results in Mg2+deficiency and severe growth impairment, which can be rescued by supplementation with excess extra-cellular Mg. The mRNA expression of the selective Mg2+ transporter MagT1 is up-regulated in TRPM7 (-/-) cells. Furthermore, the over-expression of MagT1 in TRPM7 (-/-) cells augments Mg (+) uptake and improves growth behavior in the absence of excess Mg [4, 5, 23, 24, 25, 26, 27, 28, 29]. The magnesium ion (Mg²+) is critical for maintaining the positional integrity of closely clustered phosphate groups. These clusters appear in numerous distinct parts of the cell nucleus and cytoplasm. The Mg²+ maintains the integrity of nucleic acids, ribosomes and proteins. In addition, this ion acts as an oligo-element with role in energy catalysis [6]. Biological cell membranes and cell walls exhibit poly-anionic charges on the surface. This finding has important implications for the transport of ions, particularly because different membranes preferentially bind different ions. Both Mg²+ and Ca²+ regularly stabilize membranes by cross-linking the carboxylated and phosphorylated head groups of lipids. Malignant cells use Mg²+ ions in metabolism more frequently than normal cells do and promote the uptake of magnesium from stores in normal tissues, including bones and muscles. The serum Mg level is increased via Mg²+ release from malignant tissues in patients with malignant disease prior to treatment with cytostatic drugs. In this study was observed that in malignant diseases the serum Mg values are high, normal or low independent of the serum LDH values, which are increased during the onset of malignant diseases. LDH levels remain elevated following the initial cytostatic treatment until cancer remission. In cells, the immediate energy sources involve glucose oxidation. In anaerobic metabolism, the donor of the phosphate group is adenosine triphosphate (ATP), and the reaction is catalyzed via the hexokinase or glucokinase: Glucose +ATP-Mg²+ = Glucose-6-phosphate (ΔGo = - 3.4 kcal/mol with hexokinase as the co-enzyme for the reaction). [7] Mg²+ helps fix ATP in the active centers of co-enzymes and other kinases that are ATP dependent. Glucose-6-phosphate accumulates in the cell and follows the sequence of glycolide degradation. The process of converting glucose-6-phosphate into fructose-6-phosphate is catalyzed via the enzyme phosphoglucomutase with the co-factor ATP-Mg²+. The conversion of glucose-6-phosphate into fructose-6-phosphate is a reversible reaction because of small energy difference (ΔGo = (- 4 kcal/mol). In the following step, the conversion of G-6-phosphate into F-1-6-bisphosphate is mediated by the enzyme phosphofructokinase with the co-factor ATP-Mg²+. This reaction has a large negative free energy difference and is irreversible under normal cellular conditions. In the second step of glycolysis, phosphoenolpyruvic acid in the presence of Mg²+ and K+ is transformed into pyruvic acid. In cancer cells or in the absence of oxygen, the transformation of pyruvic acid into lactic acid alters the process of glycolysis. Lactate dehydrogenase (LDH) is an enzyme that is localized to the cytosol of human cells and catalyzes the reversible reduction of pyruvate to lactate via using hydrogenated nicotinamide deaminase (NADH) as co-enzyme. The causes of high LDH and high Mg levels in the serum include
73
neoplastic states that promote the high production of intracellular LDH and the increased use of Mg²+ during molecular synthesis: Pyruvate acid>> LDH/NADH >>Lactate acid + NAD). LDH is released from tissues in patients with physiological or pathological conditions and is present in the serum as a tetramer that is composed of the two monomers LDH-A and LDH-B, which can be combined into 5 isoenzymes: LDH-1 (B4), LDH-2 (B3-A1), LDH-3 (B2-A2), LDH-4 (B1-A3) and LDH-5 (A4). The LDH-A gene is located on chromosome 11, whereas the LDH-B gene is located on chromosome 12. The monomers differ based on their sensitivity to allosteric modulators. They facilitate adaptive metabolism in various tissues. The LDH-4 isoform predominates in the myocardium, is inhibited by pyruvate and is guided by the anaerobic conversion to lactate. Total LDH, which is derived from hemolytic processes, is used as a marker for monitoring the response to chemotherapy in patients with advanced neoplasm with or without metastasis. [8] The number of chromosome copies in malignant tumors can be correlated with the total serum LDH values. LDH levels in patients with malignant disease are increased as the result of high levels of the isoenzyme LDH-3 in patients with hematological malignant diseases and of the high level of the isoenzymes LDH-4 and LDH-5, which are increased in patients with other malignant diseases of tissues such as the liver, muscle, lungs, and conjunctive tissues. High concentrations of serum LDH damage the cell membrane. In aerobic glucose metabolism, the oxidation of citric acid requires ADP and Mg²+, which will increase the speed of the reaction: Iso-citric acid + NADP (NAD) --- isocitrate dehydrogenase (IDH) = alpha-ketoglutaric acid (Figure 4).
74
Figure 4. Citric acid cycle: Steric arrangement of the dehydrogenase enzymes based on the NADH/NAD forms. In the Krebs cycle (the citric cycle), IDH1 and IDH2 are NADP+-dependent enzymes that normally catalyze the inter-conversion of D-isocitrate and alpha-ketoglutarate (α-KG). The IDH1 and IDH2 genes are mutated in > 75% of different malignant diseases. Two distinct alterations are caused by tumor-derived mutations in IDH1 or IDH2: the loss of normal catalytic activity in the production of α-ketoglutarate (α-KG) and the gain of catalytic activity to produce 2-hydroxyglutarate (2-HG). [9]
75
This product is a competitive inhibitor of multiple α-KG-dependent dioxygenases, including demethylases, prolyl-4-hydroxylase and the TET enzymes family (Ten-Eleven Translocation-2), resulting in genome-wide alternations in histones and DNA methylation. [10] IDH1 and IDH2 mutations have been observed in myeloid malignancies, including de novo and secondary AML (15%–30%), and in pre-leukemic clone malignancies, including myelodysplastic syndrome and myeloproliferative neoplasm (85% of the chronic phase and 20% of transformed cases in acute leukemia). [11] The energetic sum of anaerobic glycolysis is ΔGo = -34.64 kcal/mol. However, a glucose molecule contains 686 kcal/mol, and the energy difference (654.51 kcal) allows the potential for un-controlled reactions during carcinogenesis. The transfer of electrons from NADPH in each place of the conserved unit of energy transmits conformational exchanges in the mitochondrial ATPase. The reaction ADP³+ P²¯ + H²-- ATP + H2O is reversible. The terminal oxygen from ADP binds the P2¯ by forming an intermediate pentacovalent complex, resulting in the formation of ATP and H2O. This reaction requires Mg²+ and an ATP-synthetase, which is known as the H+-ATPase or the Fo-F1-ATPase complex. Intracellular calcium induces mitochondrial swelling and aging. The proliferation of osteoclast cells occurs when the intracellular Ca/Mg ratio is 3/2. Mg2+ generally interacts with substrates via the inner coordination sphere, stabilizing anions or reactive intermediates, binding ATP and activating molecules for nucleophilic attack [12]. At room temperature, water molecules in a liquid such as the blood in the heart pulse and move in the same plane (twisting) or in and out of the plane (rocking). The main changes in the inter-atomic distance are between the atoms of the bridge fragment O-H. During excitation, the total length of distance between the H and O atoms is increased by 0.3 A. The van der Waals forces create a distance of 2-3 A and depend on the steric energy (0.04* 10-³ mV), [13, 14, 20]. The energy of oscillation for the hydrogen atom in water is 0.04*10-5 mV. The difference between the excited state (J=E¹) and the ground state (J=Eº) for the hydrogen atom is 1 x 0.059 mV. The energy supply (Eº + 0.059 mV) from a magnesium ion, which transfers the activation energy of Mg to the electron in water, increases the pH in the system. The excited state of trans-conformation indicates that the angle of the O-H increases from the ground-state angle of 105 degrees to 108 degrees (Graphic 1).
76
Graphic 1. Energy of reverse spin in water with hydrated ion magnesium The energy of isomerization is accounted for by the P-Pº status. Because of the electron redistribution from the central oxygen ion in the water molecule H-O-H, the O½ ion binds two ions of H+ to generate more energy and remains in this state for an extended period as a biological memory. The energy of distilled water is displayed by the polarization of the molecules H-O- H±, which changes the pH and the electrostatic potential ÐU = 0.04 mV. The process of de-excitation occurs via the emission of photons in the infrared range [15, 30]. Normally, cells in the body communicate via intra-cytoplasmic channels and maintain the energetic potential across cell membranes, which is 1-2.5 µmol of ATP in the form of ATP-ADP/ATP-ADP-IMP. These normal energetic values occur during normal cell division. If the intra-cellular and extra-cellular levels of Mg2+ are high, the extra-cellular charges of the cells will not be uniformly distributed. This change in distribution induces a high net positive charge for the cell and induces a loss of contact inhibition via the electromagnetic induction of oscillation [16, 17, 18]. Thereafter, malignant cells become invasive and metastasize.
77
Conclusions In the current study, we showed that high serum levels of Mg and LDH were detected in patients with newly diagnosed or established malignant diseases (lung cancer, neoplasm of the bladder, LLC, and chronic monocytic leukemia). Normal levels of Mg with moderately increased LDH levels were observed in all patients who had cancer that was in the regression phase following good responses to a specific cancer therapy. Low levels of Mg with high levels of serum LDH were observed in all patients with poor prognosis and metastases. The total serum level of LDH, which is released by cytolytic cells during the progression of malignant diseases, and the serum Mg level can be used as markers for monitoring treatment responses in patients with neoplasm with or without metastasis.
78
79
-References 1. Walter F, Boron P. Medical Physiology: A Cellular and Molecular Mg Approach. Elsevier/Saunders, Medical Physiology 2005; p: 871-875. 2. Popescu M P. Cellular magnesium homeostasis (Review). Arch Biochem and Biophysics 2011; 5: 10. 3. Lunin VV, Dobrovetsky E, Khutoreskaya G, Zhang R, et al. Crystal structure of the CorA Mg2+ transporter. Nature 2006; (440); p: 833-907. 4. Nadler MJS, Hermosura M.C, Inabe K, Perraud, AL et al. LTRPC7 is a Mg. ATP-regulated divalent cation channel required for cell viability. Natur 2001; 411; (6837): 590–595. 5. Walder RY, Landau D, Meyer P, Shalev, H et al. Mutation of TRPM6 causes familial hypomagnesemia with secondary hypocalcemia. Nature Genetics 2005; (2): 171–174. 6. Black C.B, Cowan, J.A. Magnesium-dependent enzymes in nucleic acid biochemistry. The Biological Chemistry of Magnesium1995; p: 735-739. 7. Udristioiu A. Bioenergetics of normal and malign cells. Edit. Academic Brancusi Targu Jiu 2002; p: 45-55; 136-240. 8. Harison`s Principle of Internal Medicine-On line; Chapter Nutrition-17th, London Ed. 2008. 9. Hartmann C, Meyer J, Balss J. Capper D, et al. Type and frequency of IDH1 and IDH2 mutations are related to astrocytic and oligodendroglial differentiation and age: a study of 1,010 diffuse gliomas. Acta Neuropathol 2009; 118: 464-474. 10. Raymakers R.A, Langemeijer S.M., Kuiper R.P, Berends M, et al. Acquired mutations in TET2 are common in myelodysplastic syndromes. Nat. Genet 2009; 41; 838–849. 11. Wagner K, Damm F, Gohring G., Gorlich K et al. Impact of IDH1 R132 mutations and an IDH1 single nucleotide polymorphism in cytogenetically normal acute myeloid leukemia: SNP rs11554137 is an adverse prognostic factor. J. Clin. Oncol.2010; 28: 2356–2364. 12. Kehres, DG, Maguire, ME. Structure, properties and regulation of magnesium transport proteins". BioMetals 2002; (3): 261–270. 13. Potier L, Urbina P. Single electron pump based on changing effect. Europhis Lett.1992; (17); p: 154-244. 14. Okorokov L.A, Lichko L.P, Kadomtseva M, Kholodenko V.P Energy-dependent transport of manganese into yeast cells and distribution of accumulated ions". European Journal of Biochemistry 1997 (2): 373–377. 15. Roland K. H, Bindereif A, Schön A. The Lewis acidity of Mg2+ (pKa 11.4). Handbook of RNA Biochemistry: Student Edition. Science 2009; p: 310-330. 16. Chien MM, Zahradka CE, Newel MC, Fred JW. Fas induced in B cells apoptosis require an
80
increase in free cytosolic magnesium as in early event. J Biol Chem.1999; 274: 7059-7066. 17. Thomas N Seyfried; Laura M Shelton.Cancer as a Metabolic Disease. Nutr Metab 2010; 7: 7 18. Milionis H J, Bourantas C L, Siamopoulos C K, Elisaf MS. Acid bases and electrolytes abnormalities in Acute Leukemia. Am J Hematol 1999; (62): 201-207. 19. Stefano A, Roinel N, Rouffignac C, Wittner M. (1993). Transepithelial Ca2+ and Mg2+ transport in the cortical thick ascending limb of Henle's loop of the mouse is a voltage-dependent process. Renal Physiology and Biochemistry 1993; (4): 157–166.
20. Spagnoli D, Jeremy P. Parker A, Parker S. The Structure and Dynamics of Hydrated and
21. Dalmas O. Magnesium selective ion channels. Biophys J 2007; 93:3729-3. 22. Dalmas O Sructural dynamics of the magnesium-bound conformation of CorA in a lipid bilayer Structure 2010:868-78. 2010. 23. Montell C. Mg2+ Homeostasis: The Mg2+ inefficient TRPM Channel Enzymes. Current Biology 2003(20): 799–801. 24. Runnels L.W, Yue L, Clapham D.E. The TRPM7 channel is inactivated by PIP2 hydrolysis". Nature Cell Biology 2002 (5): 329–336. 25. Monteilh-Zoller M.K, Hermosura M.C, Nadler M.J. TRPM7 provides an ion channel mechanism for cellular entry of trace metal ions. Journal of General Physiology 2003; (1):49–60. 26. Chubanov V, Waldegger S, Schnitzler M., Vitzthum H. Disruption of TRPM6/TRPM7 complex formation by a mutation in the TRPM6 gene causes hypomagnesemia with secondary hypocalcemia. PNAS 2004 (9): 2894–2899. 27. Voets T, Nilius B, Hoefs S, Droogmans G. TRPM6 forms the Mg2+ influx channel involved in intestinal and renal Mg2+ absorption. Journal of Biological Chemistry 2004;(1):19–25. 28. Runnels LW, Yue L, Clapham DE. TRP-PLIK, a bifunctional protein, with kinase and ion channel activities. Science 2001 (5506): 1043–1047. 29. Meij IC, Knoers NV, Cochat P, Sulakova T. Familial hypomagnesaemia with hypercalciuria and nephrocalcinosis maps to chromosome 3q27 and is associated with mutations in the PCLN-1 gene. European Journal of Human Genetics 2000 (6): 414–422. 30. Kurkdjian A, Guern J. Intracellular pH measurement and importance in cell activity. Annual Plant Molecular Biology 1989; 1: 271–303.
81
Chapter 7
A New Approach of Abnormal Apoptosis Implicated in Malignancy and Autoimmunity
Abstract Auto-reactive cells which escape from natural apoptosis represent a continuous threat of potential autoimmune response. Abnormal apoptosis can play a role in negative selection of B and T lymphocytes that escaped the self-reactive nature, and so, apoptosis could represent an additional source of auto-antibody. Increased activity of T cells (CD3 +, CD4 +, or Th1 helper)) will, at a high serum level, cause a high expression of various types of inflammatory interleukins: IL1-β, IL2. The most important regulatory mechanisms of apoptosis in T and B cells are: death receptor cells, CD 95(Fas), TNF tumor necrosis, caspases, family Bcl-2 proto-oncogenes, Bax gene, p53 tumor suppressor gene, and NF-κB nuclear factor of transcription and micro RNAs (miRNAs). The “decision” to undergo programmed cell death is made only in the presence of extrinsic or intrinsic apoptotic messengers. Extrinsic inductors are ligands – cytokines – that bind to death receptors (DRs) found on the cells’ surface, while intrinsic inductors come from the mitochondria or from the nucleus cells. Article type: Mini-review Article Key words: Tumor suppressor gene P53; Rheumatoid arthritis; Systemic lupus erythematosus; Tumor necrosis factor; Zeta-chain-associated protein kinase 70; Micro RNAs, Hematopoietic Stem
82
Introduction Apoptosis and autoimmunity share essential similarities in their cell-damage mechanisms. However, apoptosis is a normal process which ensures the permanent renewal of cells, while autoimmunity is an abnormal process that can lead to serious health issues. [1]. Body of Review The Extrinsic Pathway of Apoptosis: Apoptosis is induced by the signal molecules – known as ligands – which are released by other cells, and which bind to the trans-membrane death receptors of the target cell. For example, the immune system’s natural killer cells posses the Fas ligand (FasL) on their surface: the binding of the FasL to Fas receptors (a death receptor) on various target cells will trigger the aggregation of multiple receptors on the surface of that target cell. [2] The aggregation of these receptors then leads to the recruitment of an adapter protein, known as Fas-associated death domain protein (FADD), on the cytoplasmic side of the receptors. FADD, in turn, recruits caspase-8 (an initiator protein), forming the death-inducing signal complex (DISC). The Intrinsic Pathway of Apoptosis: The intrinsic pathway is triggered by cellular stress – specifically, mitochondrial stress caused by various factors, such as DNA damage. The stress signal will cause the pro-apoptotic proteins found in the cytoplasm – BAX (pro-apoptotic, cytoplasmic protein) and BID – to bind to the outer membrane of the mitochondria and signal the release of the internal mitochondrial content. However, the signal of BAX and BID is not enough to trigger a full release of the mitochondrial content: BAK, a pro-apoptotic protein found in the mitochondria, is also needed to fully promote the mitochondrial release; it is important to note that the mitochondrial content also includes cytochrome C. Besides cytochrome C, the mitochondrial content released also contains the apoptosis inducing factor (AIF) which facilitates DNA fragmentation, preventing the activity of the inhibitors of apoptosis (IAP) [3, 4, 30]. Caspase Activity Caspase activity in apoptotic cells may lead to a presentation of cryptic epitopes or neo-epitopes to which the immune system is not tolerant. Citrulinated, acetylated, and phosphorylated forms of antigens may lead to increased immunogenicity. The initiator procaspase-9 is the main upstream enzyme in the apoptotic cascade. Down the enzymatic cascade, there is an amplification of the initial caspase activity until the key reactions are reached: cleavage of proteins that normally hold DNAase in its inactive form, cleavage of poly-ADP-ribose-polymerase, cleavage of nuclear laminas. Mitochondria have a fundamental position in executing apoptosis induced by intracellular signals. When cells are stressed due to physical signals, chemical stimulus, hypoxia, or cytokines, mitochondria release pro-apoptotic proteins, including cytochrome C. Following its release into the cytoplasm, cytochrome C forms a complex with the high-energy-molecule, adenosine triphosphate (ATP) and with the enzyme Apaf-1. In turn, this newly formed complex will activate caspase-9, an initiator protein, which then interacts with the cytochrome C-ATP-Apaf-1 complex to form an apoptosome. The apoptosome activates caspase-3, the effector protein which then initiates the cellular degradation. Apoptosis as a Cause for Cancer A dysfunctional apoptotic pathway may lead to the development of cancers. Due to the sensitivity of the intrinsic pathway, tumors arise more often through the intrinsic pathway than the extrinsic pathway [5]. A very common cause of malignant tumors through the intrinsic pathway is a mutation in the p53 protein (tumor-suppressor protein). Besides regulating apoptosis, p53 also regulates the checkpoints of the cell cycle, DNA repair, senescence, and genomic integrity [6]. A mutation causes the p53 gene to lose any of its functions will inevitably lead to carcinogenesis by letting the cell grow indefinitely, without any regulation [Figure 1].
83
Fig.1.The p53 gene has been mapped in chromosome 17. In the cell, p53 protein binds DNA, stimulating another gene to produce the protein p21 that interact with cycle cell in division, stimulating a protein of stop division (cdk2). Another important factor in carcinogenetic process is the balance between the pro-apoptotic and anti-apoptotic members of the Bcl-2 family. In a tumor cell, a mutation in the Bcl-2 gene results in increased expression will suppress the normal function of the pro-apoptotic proteins BAX and BAK, leading to malignancy [5]. On the other hand, a mutation in the BAX or BAK genes can cause a down-regulation of expression, causing the cell to lose the ability to regulate apoptosis, once again, leading to cancer cells. The inhibitor of apoptosis (IAP) family genes, which encode negative regulatory proteins, can prevent apoptotic cell death. [Figure 2]
84
Figure 2. In a tumor cell, a mutation in the Bcl-2 gene results in increased expression will suppress the normal function of the pro-apoptotic proteins BAX and BAK, leading to malignancy [5]. On the other hand, a mutation in the BAX or BAK genes can cause a down-regulation of expression, causing the cell to lose the ability to regulate apoptosis, once again, leading to cancer cells. The inhibitor of apoptosis (IAP) family genes, which encode negative regulatory proteins, can prevent apoptotic cell death.
85
In the normal cell, the p53 protein binds DNA, stimulating another gene to produce a protein called p21, which interacts with a cell division stimulating protein (cdk2) [11]. When p21 forms a complex with cdk2, the cell cannot pass through to the next stage of cell division, and remains arrested in G1 [7]. The p53 protein product of a TP53 mutant gene cannot bind DNA in an effective way, and as a consequence, the p21 protein is not made available to act as the stop signal for the cell cycle/cell division. Therefore, cells divide uncontrollably and form tumors. [4] Not surprisingly, there is an increased frequency in the amplification of the ubiquitin ligases protein (MDM2) involved in the mechanism for the down regulation of p53 activity through ubiquitin-dependent proteosomal degradation of p53 [36]. P53 has been shown to promote hematopietic stem cells (HSCs) quiescence and self-renewal with recent studies showing that deficiency of p53 likely promotes acute myeloid leukemia (AML) by eliminating its ability to limit aberrant self-renewal in hematopoietic progenitors. Micro RNAs (miRNAs) are small non-protein-coding RNAs that regulate gene expression by inhibiting the translation or catalyzing the degradation of target mRNAs. Since the first miRNA, lin-4, was identified in 1993, miRNAs have been shown to play critical roles in the regulation of many biological processes including cell differentiation, proliferation, and apoptosis, with significant influences on normal and malignant hematopoiesis [32]. Given the many shared properties of HSCs and leukemic stem cells (LSCs), perhaps it is not surprising that these miRNAs that regulate HSC function also likely play important roles in the AML LSC. It is important to note, however, that while overexpression of some of these miRNAs in the normal hematopoietic system induces AML or myeloproliferative-like disorders, none of the published studies to date directly address the role of miRNAs in the LSCs [32]. In a study comparing expression of 154 miRNAs in 50 primary AML samples with CD34+ cells, selected hematopoietic progenitors, miR-34a was found to be up regulated. This is an intriguing observation, since miR-34a has been identified as a P53 target with pro-apoptotic functions. Thus, it is interesting to speculate that miR-34a may regulate p53 activity, thereby contributing to leukemic stem cells (LSC) development, quiescence, or resistance to therapy. Given the many shared properties of HSCs and LSCs, perhaps it is not surprising that these miRNAs that regulate HSC function also likely play important roles in the AML LSC. It is important to note, however, that while overexpression of some of these miRNAs in the normal hematopoietic system induces AML or myeloproliferative-like disorders, none of the published studies to date directly address the role of miRNAs in the LSCs [33]. The myelodysplastic syndromes (MDS) are associated with a risk for progression to AML, and recent studies have suggested a role for miRNA dys-regulation in this process. A common subtype of MDS characterized by an interstitial deletion of chromosome 5q is characterized by refractory anemia, variable neutropenia, and a normal or high platelet count with megakaryocytic dysplasia. Starczynowski and colleagues recently evaluated the expression of miRNAs located on the common deleted region on chromosome 5q, and identified miR-145 and miR-146a as consistently down regulated in MDS with deletion (5q) chromosome [34]. Multiple mechanisms such as increased stability of the protein and increased transcription of the gene can account for elevated p53 expression. Recent findings indicate that c-Myc/Max heterodimers can bind to an essential CA(C/T) GTG-containing site in the p53 promoter and elevate its expression. In recent works of research was showed that elevated mutant p53 expression is due to deregulated c-Myc gene expression. Was demonstrate that the human p53 promoter is trans-activated by high c-Myc expression and repressed by high max-expression. In examining the relative levels of c-Myc and p53 in human Burkitt's lymphomas and otherB-lymphoid lines, were found that there is a correlation between the levels of c-Myc protein and p53 mRNA expression. In particular, cells that express very low levels of c-Myc protein also express low levels of p53mRNA, while cells that express high levels of c-Myc tend to express high levels of p53 mRNA [37].
86
New cancer therapies In experimental models, disrupting the MDM2–p53 interaction restored p53 function and sensitized tumors to chemotherapy or radiotherapy. [8] This strategy could be particularly beneficial in treating cancers that do not harbor TP53 mutations. For example in hematologic malignancies, such as multiple myeloma, chronic lymphocytic leukemia (CLL), acute lymphoblastic leukemia (ALL), acute myeloid leukemia (AML), and Hodgkin's disease, the induction of p53 – using a small MDM2-inhibitor molecule, nutlin-3 – can induce the apoptosis of malignant cells. Nutlins are a group of cis-imidazoline analogs, first identified by Vassilev et al. [8], which have a high binding potency and selectivity for MDM2. Crystallization data have shown that nutlin-3 mimics the three residues of the helical region of the trans-activation domain of p53 (Phe19, Trp23 and Leu26), which are conserved across species and critical for binding to MDM2. [9]. Nutlin-3 displaces p53 by competing for MDM2 binding. It has also been found that nutlin-3 potently induces apoptosis in cell lines derived from hematologic malignancies, including AML, myeloma, ALL, and B-cell CLL [10]. A large cohort study of primary CLL, done on over 100 patients, examined the samples from the patients for a response to MDM2 inhibition. The study found direct correlation between wild-type TP53 status and MDM2 inhibitor-induced (nutlin-3 and MI-219) cytotoxicity across various CLL subtypes. This response was not predicted by other biomarkers used clinically for CLL, including in B cells, expression of the zeta-chain-associated protein kinase 70 (ZAP70), un-mutated immunoglobulin variable genes, and mono-allelic ATM (ataxia telangectazica mutated gene) loss. The protein ZAP70 is a member of the protein-tyrosine kinase family. ZAP70 is normally expressed in T cells and natural killer cells, and has a critical role in the initiation of T-cell signaling. ZAP70 in B cells is used as a prognostic marker in identifying different forms of chronic lymphocytic leukemia (CLL). Some studies showed that patients with cancer make antibodies against p53 proteins, but the frequency and magnitude of this response is still under debate. [12]. However, a large number of patients with cancer did produce p53-reactive T cells [15]. The results from these studies served as a good reason to attempt the vaccination of patients using p53-derived peptides, and a several clinical trials are currently in progress. The most advanced work used a long synthetic peptide mixture derived from p53 (p53-SLP; ISA Pharmaceuticals, Bilthoven, the Netherlands) [13, 14, 15]. The vaccine is delivered in the adjuvant setting and induces T helper type cells. However, the response may not be potent enough to result in clinical benefit as a mono-therapy: This indicated that these p53-specific T-helper responses are not polarized. Therefore, approaches are being investigated to promote a stronger and more correctly polarized response using both DNA-based and dendritic cell-delivered p53 vaccines [Figure 3].
87
Figure 3. In experimental models, disrupting the MDM2–p53 interaction restored p53 function and sensitized tumors to chemotherapy or radiotherapy FasL and Oxidative Stress in Apoptotic Events The main death receptor (DR), named CD95 (Fas), as well as CD 120a (TNF-R1), DR3, DR4, DR5, and DR6, are responsive to cytokines belonging to the tumor necrosis factors (TNF-α, lymphotoxin, Fas ligand (FasL}, Apo-13). The link between apoptosis and TNF activity shows why abnormal production of TNF plays an important role in several autoimmune diseases: rheumatoid arthritis (RA), multiple sclerosis (MS), diabetes mellitus, ulcerative colitis [16]. Fas ligand (FasL) is a type II membrane protein which belongs to the tumor necrosis factor (TNF) family. FasL induces apoptosis in target cells bearing the receptor Fas. The role of the Fas-FasL system has been best characterized in the immune system: interactions between Fas and FasL are functionally involved in tissue-specific regulation of various immune processes: for example, FasL expression has been detected in immune-privileged organs, such as the eye and the testis, which are protected from destructive immune responses by inducing the apoptosis of infiltrating Fas-bearing immune cells. Endothelial cells express Fas, but are normally resistant to Fas-mediated apoptosis [2, 31]. Oxidative stress has been shown to alter various aspects of endothelial functions: increase in endothelial adhesiveness to neutrophils via protein-kinase-C-activation-dependent pathways, increase in the production of platelet-activating factor, as well as in the expression of intracellular adhesion molecule-1. Thus, up-regulation of FasL expression on the endothelium may contribute to anti-inflammatory reactions by reducing leukocyte transmigration in tissues. Recent and previous studies have shown that increased oxidative stress induces FasL expression by T-lymphocytes, microglial cells, and intestinal epithelial cells, suggesting that oxidative stress is involved in the FasL-mediated apoptotic mechanism of Fas-bearing target cells [17, 18; 19, 31].
88
H2O2 is one of the most important oxidant agents derived from leukocytes and endothelial cells. It exerts a toxic effect on susceptible cells at high concentrations, but alters cell functions at low concentrations, by modulating signal transduction pathways in certain cells, including endothelial cells [19]. Cigarette smoke is an important source of oxidative agents, including H2O2, and is thought to be a significant risk factor for chronic endothelial damage leading to atherosclerosis [20, 21]. However, the mechanism for oxidative-stress-induced FasL expression is still unclear. A previous report documented an association between oxidative-stress-induced FasL expression and the NF-κB nuclear transcription factor. The functional role of NF-κB has not been fully demonstrated [22]. Two NF-κB binding sites are located at positions -537 to -521 and -57 to -47, respectively, relative to the transcription start site of the human CD95L promoter. [23]. High levels of soluble CD95 were found in rheumatoid arthritis (RA): these high levels contribute to the inhibition of apoptosis of synoviocytes and, inflammatory cells. An inadequate apoptosis due to defective CD95 may promote an extended survival of synoviocytes; additionally their responsiveness to CD95L is decreased by TGFβ, IL1-β, and TNF-α. Simultaneously, expression of CD95 and its ligand causes apoptotic cells death by paracrine or autocrine mechanism and during inflammation, IL1-β and interferon-1α induce massive CD up-regulation [24]. High rate of apoptosis can overload the phagocytic capacity and may trigger an autoimmune reaction, through the presentation of nucleosomes to the immune system. Apoptosis also plays a role in negative selection of B and T lymphocytes that escaped the self-reactive nature; again, in this case, apoptosis can be a source of auto-antibodies. Elevated activity of the receptor CD3 +, CD4 + or Th1 helper cells will be induced by high serum level of interleukins (ILs): IL1-β, IL2 and TNF [25]. Apoptosis as a Cause for Auto-Immunity In various cell types, tumor necrosis factor (TNF-α) induces either cell death, or mitogenesis, through different signaling pathways. The blockade of TNF-α, induced K+ channel activity effectively and prevented NF-κB nuclear translocation and binding to DNA, diminishing the cells survival. [26]. Inhibition of K+ channel activity with specific channel blockers results in attenuation of the cell cycle in the G1 phase. TNF-α also induces mRNA expression of various K+ channel types during a systemic inflammatory response, as well as tumor cell proliferation in brain and other cancer types. In the case of systemic lupus erythematosus (SLE), more than 40 genes have been identified as possible causes for the disease. There are three different groups of genes that are responsible for pathogenic process. A category of genes codes for molecules that have an impact on the clearance of apoptotic cells. When these accumulate, the production of ANA by auto-reactive lymphocytes is stimulated. The second group codes for molecules that may act be thwarting the deletion of self-reacting B cells and T cells [28]. The third group codes for molecules that amplify or modulate lymphocyte signaling and expansion. The studies performed in the last 10 years suggest that the neonatal wave of beta cells apoptosis might activate auto-antigens necessary for triggering Th-4 in systemic lupus erythematous [29]. In systemic auto-immune diseases, in particular SLE, auto-antibodies have been found against a range of intra-cellular antigens. This suggests that the humoral response may be driven by products from apoptotic cells, highlighting the nucleosomes as self-generating potential antigens. The antinuclear antibodies (ANA) may be present in response to antigens such as double-stranded DNA (dsDNA), extractable nuclear antigen Sm (UI RNP), nucleosomic (chromatin) antigen mixture of DNA molecules, histones (H2A, H2B, H3, H4), and nucleoplasma nucleomatrix antigens: SS-A, and SS-B. The production of TNF plays an important role in several autoimmune diseases, such as: rheumatoid arthritis, multiple sclerosis, diabetes mellitus and, autoimmune colitis.
89
Conclusion Apoptosis has traditionally been thought of as non-inflammatory process which does not induce an immune response. However, recent studies indicate that apoptotic cells can be involved in autoimmune processes. In some cases the cells can display auto-reactive antigens on their surface blebs, can activate T cells and B cells, and can induce the formation of auto-antibodies. The most important cell-regulatory mechanisms of apoptosis in mammalian T cells and B cells are: death receptors, caspases, mitochondria, the Bcl-2 family proto-oncogene, tumor suppressor gene TP53, TNF, and nuclear translocation factor, NF-Κb and recently MicroRNAs (miRNAs) which are small non-coding RNAs that act at the posttranscriptional level to regulate protein expression. REFERENCES 1. Grodzitsky T, Elcon KB. Apoptosis: A case where too much or too little can lead to autoimmunity. MSJN 2002; 49: 208-219. 2. Saratoy S, Badrawy T, Koth S. Expression of CD95 (FAS/APO-1) in Non-Hodgkin Lymphoma. E. J. of Surgery 2002; 21(3): 963-969. 3. Warrell DA, Cox TM, John D. Chp. Apoptosis in Health and Diseases. Andrew H, Wyllie J, Mark J. Oxford textbook of Medicine, Oxford Medical 2003; 4:121-128. 4. Yau P. Apoptosis. The Science Creative Quarterly 2001; 6: 10-15. 5. Martin R. Cell suicide for beginners. Nature 1998; 396: 119-122. 6. Csipo I, Montel AH, Hobbs JA, Morse PA, et al. Effect of Fas+ and Fas- target cells on the ability of NK cells to repeatedly fragment DNA and trigger lysis via the Fas lytic pathway. Apoptosis 1998; (3):105-114. 7. Schmitt CA, Fridman JS, Yang M, Baranow E, Hoffman RM, Lowe SW. Dissecting p53 tumor suppressor functions in vivo. Cancer Cell 2002; 1: 289-291. 8. Kojima, K, Konopleva M, Samudio IJ, Shikami M, et al. MDM2 antagonists induce p53- dependent apoptosis in AML: implications for leukemia therapy. Blood 2005; 106(9): 3150–3159. 9. Wade M, Wang YV, Wahl GM. The p53 orchestra: Mdm2 and Mdmx set the tone. Trends Cell Biol 2010; 20: 299–309. 10. Secchiero P, Voltan R, Iasio GM, Melloni E, et al. The oncogene DEK promotes leukemic cell survival and is down regulated by both Nutlin-3 and chlorambucil in B-chronic lymphocytic leukemic cells. Clin Cancer Res 2010; 16: 1824–1833. 11. Udristioiu A, Florescu C, Popescu MA. Cojocaru M. High Concentration of anaerobic ATP implicated in aborted apoptosis from CLL. LabMed 2010; 41: 203-208. 12. Vojtesek B, Kovarik J, Dolezalova H, Nenutil R, et al. Absence of p53 autoantibodies in a significant proportion of breast cancer patients. Br J Cancer 1995; 71: 253–256.
90
13. Speetjens F, Kuppen P, Welters M, Essahsah F, et al. Induction of p53-specific immunity by a p53 synthetic long peptide vaccine in patients treated for metastatic colorectal cancer. Clin Cancer Res 2009 15: 1086–1095. 14. Shangary S, Qin D, Mc Eachern D, Liu M, et al. Temporal activation of p53 by a specific MDM2 inhibitor is selectively toxic to tumors and leads to complete tumor growth inhibition. Proc. Natl Acad. Sci 2008; 105: 3933–3938. 15. Van der Burg SH, Cock K, Menon AG, Franken KL, et al. Long lasting p53-specific T cell memory responses in the absence of anti-p53 antibodies in patients with respected primary colorectal cancer. Eur. J. Immunol 2001; 31: 146–155. 16. Topic E. New Trends in Classification, Monitoring and Management of Autoimmune Diseases. Handbook, Chp. 3: Bozic B, Rozman B Apoptosis and Autoimmunity. The 5-th FESCC Continuous Postgraduate Course in Clinical Chemistry, Dubrovnik 2005; 5: 11-24. 17. Adrain C, Creagh EM, Martin SJ. Caspases, their role in cell death and cell survival. Molecular Biology Intelligence 2002; 1: 41-51. 18. Csipo I, Montel AH, Hobbs JA, Morse PA, Brahmi Z. Effect of Fas+ and Fas- target cells on the ability of NK cells to repeatedly fragment DNA and trigger lysis via the Fas lytic pathway. Apoptosis 1998; 3: 105-114. 19. Suzuki M, Aoshiba K, Nagai A. Oxidative stress increases Fas ligand expression in endothelial cells. J. Inflamm 2006; 3:11. 20. Ramage L, Jones AC, Whelan CJ. Induction of apoptosis with tobacco smoke and related products in A 549 lung epithelium cells in vitro. J. Inflamm 2006; 3: 13. 21. Bauer MC, Vogt M, Los M, Siegel J et al. Role of reactive oxygen intermediates in activation induced CD95 (APO-1/Fas) ligand expression. J Biol Chem 1998; 273(14): 8048-8055. 22. Laur O, Dern K, Krammer PH. T cell activation-induced and HIV tat-enhanced CD95 (APO-1/Fas) ligand transcription involves NF-kappaB. Eur J Immunol 2010; 30(2): 661-70. 23. Diogo GB, Resende MF, Mill JG, Mansur AJ. Nuclear Factor (NF) κB polymorphism is associated with heart function in patients with heart failure. BMC Medical Genetics 2010; 11: 89. 24. Livolsi A, Busuttil V, Imbert V, Abraham RT, Peyron JF. Tyrosine phosphorylation-dependent activation of NF-κB. Requirement for p56 LCK and ZAP70 protein tyrosine kinases. Eur. J. Biochem 2001; 5: 1508–1515. 25. Topic E. New Trends in Classification, Monitoring and Management of Autoimmune Diseases. FESCC, EFCC, Postgraduate Course. Chpt: Autoimmune aspects of pregnancy and infertility. Bozic B, Rozman B. Handbook. 2005; 5:17-23. 26. Ling Wang, Peter Reinach, Luo Lu. TNF-α promotes cell survival through stimulation of K+ channel and NFκB activity in corneal epithelial cells. Exp Cell Res 2005; 15(1): 30-48.
91
27. Hoffman RW. T cells in pathogenesis of systemic lupus erythematous. Clinical Immunology 2004; 113: 4-13. 28. Kaplan MJ. Apoptosis in systemic lupus erythematous. Clinical Immunology 2004; 112: 210- 218. 29. Illei G, Tackey E, Lapteva L. Biomarkers in systemic lupus erythematous. Arthr Rheum 2004; 50: 2048-2065. 30. Mary K.L. Collins RL. The control of apoptosis in mammalian cells. Trends in Biochemistry 1993; 8: 307-309. 31. Scaffidi C, Fulda S, Srinivasan A, Friesesn C et al. Two CD95 (APO-1/Fas) Signaling Pathways. Embo Journal 1998; 17: 1675-1687. 32. Chung S, Hu W, Park C. The role of microRNAs in hematopoietic stem cell and leukemic stem cell function. Therapeutic Advances in Hematology 2011; 5(2): 317-334. 33. Zhao X, Ren G, Liang Li, Phillip Ai. IFNgamma Induces Expansion of Hematopoietic Progenitor Cells. The Journal of Immunolog 2010; 184: 36-39. 34. Starczynowski DT, Morin R, McPherson A, Lam J . Genome-wide identification of human microRNAs located in leukemia-associated genomic alterations Blood 2011; 117(2): 595-607. 35. Chung S, Hu W, Park C. The role of microRNAs in hematopoietic stem cell and leukemic stem cell function. Therapeutic Advances in Hematology 2011; 5(2): 317-334. 36. Vassilev LT, Vu TB, Graves B, Carvajal D, et al. In vivo activation of the p53 pathway by small molecule antagonists of MDM2. Sci 2004; 303(5659): 844-848. 37. Roy B, Beamon J, Balint E, Reisman D. Transactivation of the Human p53 Tumor Suppressor Gene by c-Myc/Max Contributes to Elevated Mutant p53 Expression in Some Tumors. Molecular.
92
Chapter 8
ANEMIA BY VITAMIN B12 AND LATENT IRON DEFICIENCY
-A case of Laboratory-
ABSTRACT
The history of pernicious anemia was “an illustrative case” of the development and progress
of medicine.
The aim of this work is to illustrate a difficult diagnostic in vitamin B12 deficiency because
of using of multivitamin preparations to a patient with unknown etiology of anemia.
History: a 70 year old engineer, following 8 years vegetable – dietary, was admitted to the county
hospital, in neurology department, with diagnostic of poli-radiculonevrites, received in ward the
treatment with milgama (containing 250 micro-gram multivitamin). After a lipotimia status the
3. Ulleland M. Direct Assay for Cobalamin Bound to Transcobalamin (Holo-Transcobalamin) in
Seum, Clinical Chemistry 2002; (8); 3: 526 – 532.
4. Nexo E. Quantification of Transcobalamin, a Marker of Vitamin B 12 Deficiency. Clinical
Chemistry 2004;(8); 3: 561-562 .
5. Association of Cognitive Impairment with Combination of Vitamin B12-Related Parameters.
Clinical Chemistry 2011; (57); 10: 1436-1443.
Chapter 9
High concentrations of anaerobic ATP implicated in aborted apoptosis from CLL ABSTRACT
Background Apoptosis is an energy related process, in contrast with necrosis that occurs in the absence of adenosine-triphosphate (ATP). The main objective of the study was to assess intracellular ATP concentrations in B lymphocytes from patients with chronic lymphocytic leukemia (CLL), in comparison with ATP concentrations from B and T cells from patients with malignant diseases or non-malignant diseases, with allergic conditions. Material and method Using a Luminometer LKB analyzer, on principle of bioluminescence, we examined 75 patients (50 males and 25 females) with the following diagnoses: 25 patients (mean age 55 ± 0.5)) with
101
allergic diseases (chronic allergic rhinitis, allergic dermatitis, chronic allergic asthma), 25 patients (mean age 58 ±1.8) with nonhematopoietc malignant diseases (lung cancer, bone metastasis) and 25 patients with confirmed diagnosis of CLL. Control group consisted of 120 healthy patients (mean ages 40.02 ±12.01). Results In the healthy male and female subjects, the mean concentration of ATP in 1 x 10⁶ lymphocytes /ml of normal peripheral blood, T lymphocytes had was 1.39 µM ATP and in B lymphocytes the concentration was 0.35 µM ATP/ml [SD = 0.41, p= 0.030]. The mean concentration of ATP in 1 x 10⁶ activated peripheral blood T lymphocytes from patients with allergic diseases was 3.12 µM ATP/ml and in B lymphocytes the mean concentration was 0.79 µM ATP/ml [SD= 0.56, p = 0.034]. From patients with malignant diseases, the concentration of ATP in 1 x 10⁶ activated peripheral blood T lymphocytes/ml had a mean value of 3.06 µM ATP and the mean concentration of ATP in activated 1 x 10⁶ peripheral blood B lymphocytes/ml was 0.17 µM ATP [SD= 0.45, p = 0.05]. The mean concentration of ATP in 1 x 10⁶ activated peripheral blood malignant CLL B lymphocytes/ml was 4.33 µM ATP but was only 0.09 µM ATP [SD= 1.5, p< 0.05] in T lymphocytes from these patients. A strong correlation was observed between the concentration of ATP of T lymphocytes from patients with malignant diseases and ATP concentration of B lymphocytes from samples of patients with CLL (r= 0.99) and a good correlation was observed between T lymphocytes (Th) from allergic diseases and T lymphocytes (Ts) from malignant diseases (r = 0.94). Conclusion Blocked apoptosis from malignant diseases may be due to high ATP concentration originating from anaerobic metabolism. The difference of energy between anaerobic ATP in B lymphocytes from CLL and aerobic ATP in T lymphocytes from normal status in value of 2.68 µM ATP, as an energetic transfer between B and T cells, initiates carcinogenesis by suppression of anti oncogene proteins, especially p53 protein. Further studies are necessary to detect to patients with high concentrations of ATP and the mutations, translocations or deletions of the p53 gene, which is located on chromosome 17, using FISH technology. Abbreviations APTT-Adenosine-triphosphate; CLL-Chronic Lymphocytic Leukemia; FISH-Fluorescence in situ hybridization; HIF-1 -Hypoxia inducible factor 1; PIK3- Phosphoinositide-3 kinase; TNF-Tumor necrosis factor; TNFƒÑ, TGFƒß
Introduce
Chronic lymphocytic leukemia, (also known as "chronic lymphoid leukemia" or CLL), is a type
of leukemia or cancer of the white blood cells, lymphocytes. The cells accumulate mainly in the
bone marrow and blood. Morphologically, these cells resemble mature lymphocytes in the
peripheral blood. In the majority of patients with chronic CLL the cells are clonal B cells arrested in
the B-cell differentiation pathway between pre-B cells and mature B cells. Only 2-5% of patients
with chronic CLL exhibit a T-cell phenotype. In CLL the DNA of a B cell is mutated so that it can't
fight infection, but it grows out of control and crowds out the healthy blood cells that can fight
infection. Theoretical studies have suggested that elevated concentration of adenosine-triphosphate
102
(ATP) in malignant B cells lymphocytes from CLL impair P53 gene to induce apoptosis of cells.
Apoptosis is regulated by a cascade of proteins called caspases that are present in all cells forms as
pro-form. After cleavage, caspases become active and initiate pathways leading to apoptosis. The
pro-apoptotic proteins Bax, Bad, Bak and Bid induce programmed cell death. Death resistance of
hypoxia takes place on at least two levels, within mitochondria and the cytosol. Accumulation of
Bax in the mitochondria causes the release of cytochrome C in cytosol that is strongly reduced
under hypoxic environment conditions [Figure 1]. Apoptosis, performed within the extrinsic
pathway, is initiated by death ligands, such as Fas ligand or tumor necrosis factor (TNF), which
ultimately leads to the activation of caspases 8 and 3 and the activation of apoptosis protein
activating factor (APAF). All hematopoietic cells, especially lymphoid cells, express Bcl-2, mainly
in the nucleus and endoplasm reticulum. The oncogene Bcl-2 may be a general suppressor of genes
that directly regulate apoptosis.
Scope The main objective of the study was to measure the intracellular ATP concentrations in B lymphocytes from patients with CLL, and compare to ATP concentrations in B and T cells from healthy patients and patients with other malignant diseases or non-malignant diseases. Materials and methods The measurement of ATP was made by standard principle of bioluminescence on automatic analyzer LKB, using ATP monitoring reagent, ATP Standard, (106 Mol ATP/ ml), buffer solution Tris-EDTA, TCA-EDTA lyse. All results were statistically analyzed by Excel program. T lymphocytes were obtained from the peripheral blood of healthy individual and from hospitalized patients with selected diseases from the departments of Internal Medicine and Oncology. Patient cohort was a total of 75 patients (50 males and 25 females) consisting of the following groups were examined: 25 patients (mean ages 55 ± 0.5)), with allergic diseases (allergic rhinitis, allergic dermatitis , chronic allergic asthma), 25 patients( mean ages 58 ± 1.8 ) with nonhematopoietc
103
malignant diseases ( lung cancer, bone metastasis) and 25 patients with confirmed hematopoietic malignant disorders, in diagnosis of CLL. In addition, 120 blood samples from apparently healthy donors (mean ages 40.02 ±12.01) were also examined. The May Grunwald-Giemsa method was used to determine the microscopic appearance of peripheral blood lymphocytes from patients with incipient CLL disease, who had not had any treatment or hematopoietic stem cell transplantation (HSCT).Morphologically, the cells resembled normal mature clonal B cells arrested in the B- cell differentiation pathway intermediate between pre-B cells and mature B cells lymphocytes although slightly larger, and more fragile when smeared onto a glass slide(smudge cells)Lymphocytes were separated from peripheral blood by centrifugation in a Ficoll gradient for 20 minutes at 2000 rcf/ minute. Lysis of lymphocytes with TCA-EDTA was performed after cell counts were adjusted to 1 x 10⁶ lymphocytes /ml of plasma. An initial panel of monoclonal antibodies was used to immune-phenotype T cells and their subgroups and B cells and their subgroups. Immune-cytochemical detection of antigen was made using the ABC-AP, APAAP method. Activated B lymphocytes were defined as CD19 + cells, CD20, CD21, and CD23 and or CD138 surface marker. Activated T cells were identified with CD7, CD5, CD3, CD2, CD4, CD8 and CD45RO. The phenotype suggestive of B-CLL or monoclonal B cell lymphocytes was approximately equal numbers of CD5+ and CD19+ lymphocytes. For monitoring diagnosis and prognosis of CLL, the samples were sent to the National Institute of Reference Oncology, Fundeni. Expected values to cytogenetic results [7] will the deletion13q chromosome that can occurs in more than 50% of patients and trisomy 12, which can occurs in about 60 of patients. Individual13q14 abnormalities have a relatively benign disease that usually manifests as stable or slowly progressive isolated lymphocytosis. Deletion in the short arm of chromosome 17 is associated with rapid progression, short remission, and decreased overall survival in chronic CLL. The 17p13 deletions are associated with loss of function of the tumor suppressor gene p53 and deletions of
104
bands 11q22-q23, associated with extensive lymph node, involvement aggressive disease and shorter survival. In the differential diagnosis of CLL we included: -Hairy cell leukemia, which is moderately positive for surface membrane immunoglobulins of multiple heavy-chain classes and is typically negative for CD5 and CD21. -CLL should also be distinguished from pro-lymphocytic leukemia, in which more than 65% of the cells are morphologically less mature pro-lymphocytes. - Proymphocytic leukemia has a typical phenotype that is positive for CD19, CD20, and surface membrane immunoglobulin but one half will be negative for CD5.
Large granular lymphocytic leukemia has a natural killer (NK) cell phenotype (CD2, CD16, CD56)
or a T-cell immune-type (CD2, CD3, CD8 -Pattern of positively for CD19, CD20, and the T-cell antigen CD5 is shared only by mantle cell
lymphoma and these cells generally do not express CD23.
Results: In the healthy male and female subjects, the mean concentration of ATP in 1 x 10⁶ lymphocytes /ml of normal peripheral blood T lymphocytes had was 1.39 µM ATP and in B lymphocytes the concentration was 0.35 µM ATP/ml [SD = 0.41, p= 0.030]. The mean concentration of ATP in 1 x 10⁶ activated peripheral blood T lymphocytes from patients with allergic diseases was 3.12 µM ATP/ml and in B Lymphocytes the mean concentration was 0.79 µM ATP/ml [SD= 0.56, p = 0.034]. From patients with malignant diseases, the concentration of ATP in 1 x 10⁶ activated peripheral blood T lymphocytes/ml had a mean value of 3.06 µM ATP and the mean concentration of ATP in activated B lymphocytes/ml was 0.17 µM ATP [SD= 0.45, p = 0.05]. The mean concentration of ATP in 1 x 10⁶ activated peripheral blood malignant CLL B lymphocytes/ml was 4.33 µM ATP but
105
was only 0.09 µM ATP [SD= 1.5, p < 0.05] in T lymphocytes from these patients. A strong correlation was observed between the concentration of ATP of T lymphocytes from patients with malignant diseases and ATP concentration of B lymphocytes from samples of patients with CLL (r= 0.99) and a good correlation was observed between T lymphocytes (Th) from allergic diseases and T lymphocytes (Ts) from malignant diseases (r = 0.94). The difference of energy between anaerobic ATP in B lymphocytes from CLL and aerobic ATP in T lymphocytes from healthy subjects have been calculated in value of 2.68 µM ATP and suggests the process of carcinogenesis [Table 1].
Discussion Otto Warburg observed that many cancers lose their capacity for mitochondrial respiration, limiting ATP production to anaerobic glycolytic pathways [1]. The phenomenon is particularly prevalent in aggressive malignancies, most of which are also hypoxic. Hypoxia induces a stochastic imbalance between the numbers of reduced mitochondrial species vs. available oxygen, resulting in increased reactive oxygen species (ROS) whose toxicity can lead to apoptotic cell death. Mechanism involves inhibition of glycolytic ATP production via a Randle-like cycle while increased uncoupling renders cancers unable to produce compensatory ATP from respiration-.generation in the presence of intact tricarboxylic acid (TCA) enzyme. One mitochondrial adaptation to increased ROS is over-expression of the uncoupling protein 2 (UCP2) that has been reported in multiple human
Table1. The concentrations of μM APT in malignant and chronic diseases contented in 106 lymphocytes / ml, from peripheral blood
106
cancer cell lines [2-3]. Increased UCP2 expression was also associated with reduced ATP production in malignant oxyphilic mouse leukemia and human lymphoma cell lines [4]. Hypoxia reduces the ability of cells to maintain their energy levels, because less ATP is obtained from glycolysis than from oxidative phosphorylation. Cells adapt to hypoxia by activating the expression of mutant genes in glycolysis. Severe hypoxia causes a high mutation rate, resulting in point mutations that may be explained by reduced DNA mismatch repairing activity. The most direct induction of apoptosis caused by hypoxia is determined by the inhibition of the electron carrier chain from the inner membrane of the mitochondria. The lack of oxygen inhibits the transport of protons and thereby causes a decrease in membrane potential. Cell survival under conditions of mild hypoxia is mediated by phosphoinositide-3 kinase (PIK3) using severe hypoxia or anoxia, and then cells initiate a cascade of events that lead to apoptosis. After DNA damage, a very important regulator of apoptosis is the p53 protein. This tumor suppressor gene has mutations in over 60% of human tumors and acts as a suppressor of cell division. The growth-suppressive effects of p53 are considered to be mediated through the transcriptional trans-activation activity of the protein. In addition to the maturational state of the clonal tumor, the prognosis of patients with CLL is dependent of genetic changes within the neoplastic cell population. The genetic changes can be identified by fluorescent probes to chromosomal using a technique referred to as fluorescent in situ hybridization (FISH). Chromosomal evaluation using FISH can identify certain chromosomal abnormalities of CLL that have prognostic significance. Deletion of part of the short arm of chromosome 17 (del 17 q), with target the cell cycle regulating protein p53, is particularly deleterious. This abnormality is found in 10% of patients with CCL and has a pour prognosis. Deletion of long arm of chromosome 13(del 13q) is the most common genetic abnormality in CLL with roughly 50% of patients exhibiting this effect. These patients have the best prognosis and most will live many years without the need for therapy. Agents damaging DNA may increase the expression of p53 and its trans-activation activity, suggesting that p53 acts to
107
protect cells against the accumulation of mutants and their subsequent conversion to a malignant status. Protein p53, in its normal form, acts in stopping the cell division whenever damage to a cell’s DNA is detected, thus giving the cells the possibility of repairing DNA before the errors would duplicate and be passed on to the daughter cells. Antibodies to human p53 have been detected in patients with cancer. These antibodies are highly specific for malignant diseases and are rarely detected in healthy donors or patients having benign diseases. This immune response is correlated with the presence of a p53 gene mutation, leading to the accumulation of an ineffective p53 protein in tumor cells[ 8] with either tridimensional structure; Over-expression of normal p53 protein can result either in G1 arrest, mediated by p21 protein [ or in the induction of apoptosis [ 9 ]. Also hypoxia itself ca also prevent apoptosis by inducing the expression of the anti apoptotic protein IAP-2. A typical response to the hypoxic environment, by hypoxia inducible factor 1, [ 6] for example, is expression of insulin-independent GLUT [5] triggered by HIF 1α [6] insuring maximum glucose uptake for glycolytic ATP generation. Conclusions: Blocked apoptosis from malignant diseases may be due to high ATP concentration originating from anaerobic metabolism. The difference of energy between anaerobic ATP in B lymphocytes from CLL and aerobic ATP in activated T lymphocytes from normal status and non-malignant diseases was 2.68 µM ATP, as an energetic transfer between T and B cells, initiates carcinogenesis by suppression of anti oncogene proteins, specially p53 protein. Further studies are necessary to detect to patients with high concentrations of ATP the mutations, translocations or deletions of the p53 gene that is located on chromosome 17, using FISH technology. REFERENCES 1.Warburg O. On the origin of cancer cells. Science 1956; 123 (3191):309-314 PubMed Abstract ; Publisher Full Text 2.Giardina TM, Steer JH, Lo SZ, Joyce DA. Uncoupling protein-2 accumulates rapidly in the inner mitochondrial membrane during mitochondrial reactive oxygen stress
108
in macrophages. Biochim Biophys Acta 2008, 1777(2):118-129. PubMed Abstract | Publisher Full Text 3. Horimoto M, Resnick MB, Konkin TA, Routhier J, Wands JR, Baffy G. Expression of uncoupling protein-2 in human colon cancer. Clin Cancer Res 2004; 10 (18 Pt1):6203- 6207. PubMed Abstract | Publisher Full Text 4. Randle PJ, England PJ, Denton RM. Control of the tricarboxylate cycle and it interactions with glycolysis during acetate utilization in rat heart. Biochem J 1970; 117(4):677-695. PubMed Abstract | PubMed Central Full Text 5. Gillies RJ, Robey I, Gatenby RA. Causes and consequences of increased glucose metabolism of cancers. J Nucl Med 2008; 49(Suppl 2):24S-42S. PubMed Abstract | Publisher Full Text 6. Denko NC: Hypoxia, HIF1 and glucose metabolism in the solid tumour. Nat Rev Cancer 2008; 8(9):705-13. PubMed Abstract | Publisher Full Text 7. Bennett J M. Practical of Diagnosis of Hematologic Disorders. Lett. Molecular Prognostic Factors in Non – Hodgkin Lymphoma, Chronic Lymphocytic Leukemia, Chicago, ASCP Press 2006; p.615 – 671 8. Whibley C, Pharoah P, Hollstein M. P53 Polymorphism: Cancer Implications. Nat Rev Cancer 2009; (2): 95-107 9. Udristoiu A. Bioenergetica celulara normala si maligna. Bucuresti, Targu Jiu, Editura Academica Brancusi 2002; p. 200-239.
109
Contents Chapter 1 Variability of Bilirubin Values in Serum Samples with High Triglycerides; Interference or Congenital Liver Syndromes,,,,,,,,,,,,,,,,,,,,,,,,,,,,,,,,,,,,,,,1-11 Chapter 2 Variability of Biological Parameters in Blood Samples between two Consecutive Schedules of Hemodialysis ,,,,,,,,,,,,,,,,,,,,,,,,,,,,,,,,,,,,,,,,,,,,,,,,,,,,,,,,,,,,,,,,,,,,,,,,,,,,,,,,,,,,,,,,,,, ,,,,,,,,,,,,,,,,,,,,,,,,,,,,12-32 Chapter 3 Significance of Neutrophil Alkaline Phosphatase versus Isoenzymes ALPin Acute Diseases or Chronic Diseases, ,,,,,,,,,,,,,,,,,,,,,,,,,,,,,,,,,,,,,,,,,,,,,,,,,,,,,,,,,,,,,,,,,,,,,,,,,,,,,,, ,,,,,,,,,,,,,,,,,,,,,,,,,,,,33-44 Chapter 4 From Metabolic Syndrome to Normal Status,, ,,,,,,,,,,,,,,,,,,,,,,,,,,,,,,,,,,,,,,,,,,,,,,,,,,,,,,,,,,,,,45-54 Chapter 5 Frequency of Sub-clinical Dysfunctions on Thyroid to Ambulatory Control ,,,,,,,,,,,,,,,,,55-64 Chapter 6 Relation between LDH and Mg as Factors of Interest in the Monitoring and Prognoses of Cancer,,,,,,,,,,,,,,,,,,,,,,,,,,,,,,,,,,,,,,,,,,,,,,,,,,,,,,,,,,,,,,,,,,,,,,,,,,,,,,,,,,,,,,,,,,,,,,,,,,,,,,,,,,,,,,,,,,,,,,,,,,,,,,, 65-80 Chapter 7 A New Approach of Abnormal Apoptosis Implicated in Malignancy and Autoimmunity,,,,,,,,,,,,,,,,,,,,,,,,,,,,,,,,,,,,,,,,,,,,,,,,,,,,,,,,,,,,,,,,,,,,,,,,,,,,,,,,,,,,,,,,,,,,,,,,,,,,,,,,,,,,,,,,,,, 81-91 Chapter 8 Anemia by Vitamin B12 and Latent Iron Deficiency-A case of Laboratory-,,,,,,,,,,,,,92-100 Chapter 9,,,,,,,,,,,,,,,,,,,,,,,,,,,,,,,,,,,,,,,,,,,,,,,,,,,,,,,,,,,,,,,,,,,,,,,,,,,,,,,,,,,,,,,,,,,,,,,,,,,,,,,,,,,,,,,,,,,,,,,,,,,100-108 High concentrations of anaerobic ATP implicated in aborted apoptosis from CLL Contents,,,,,,,,,,,,,,,,,,,,,,,,,,,,,,,,,,,,,,,,,,,,,,,,,,,,,,,,,,,,,,,,,,,,,,,,,,,,,,,,,,,,,,,,,,,,,,,,,,,,,,,,,,,,,,,,,,,,,,,,,,,, 109