Heme dynamics and trafficking factors revealed by genetically encoded fluorescent heme sensors David A. Hanna a,1 , Raven M. Harvey a,1 , Osiris Martinez-Guzman a , Xiaojing Yuan b,c , Bindu Chandrasekharan a , Gheevarghese Raju a , F. Wayne Outten d , Iqbal Hamza b,c , and Amit R. Reddi a,2 a School of Chemistry and Biochemistry and Parker Petit Institute for Bioengineering and Biosciences, Georgia Institute of Technology, Atlanta, GA 30332; b Department of Animal and Avian Sciences, University of Maryland, College Park, MD 20740; c Department of Cell Biology and Molecular Genetics, University of Maryland, College Park, MD 20740; and d Department of Chemistry and Biochemistry, University of South Carolina, Columbia, SC 29208 Edited by Sabeeha S. Merchant, University of California, Los Angeles, CA, and approved May 2, 2016 (received for review December 4, 2015) Heme is an essential cofactor and signaling molecule. Heme acquisition by proteins and heme signaling are ultimately reliant on the ability to mobilize labile heme (LH). However, the properties of LH pools, including concentration, oxidation state, distribution, speciation, and dynamics, are poorly understood. Herein, we elucidate the nature and dynamics of LH using genetically encoded ratiometric fluorescent heme sensors in the unicellular eukaryote Saccharomyces cerevisiae. We find that the subcellular distribution of LH is heterogeneous; the cytosol maintains LH at ∼20– 40 nM, whereas the mitochondria and nucleus maintain it at concentrations below 2.5 nM. Further, we find that the signaling molecule nitric oxide can initiate the rapid mobiliza- tion of heme in the cytosol and nucleus from certain thiol-containing factors. We also find that the glycolytic enzyme glyceraldehyde phos- phate dehydrogenase constitutes a major cellular heme buffer, and is responsible for maintaining the activity of the heme-dependent nuclear transcription factor heme activator protein (Hap1p). Alto- gether, we demonstrate that the heme sensors can be used to reveal fundamental aspects of heme trafficking and dynamics and can be used across multiple organisms, including Escherichia coli , yeast, and human cell lines. heme sensors | heme trafficking | heme dynamics | nitric oxide | glyceraldehyde phosphate dehydrogenase H eme (iron protoporphyrin IX) is an essential protein cofactor and signaling molecule (1–11). The canonical view of heme is that it is a static cofactor buried in the active sites of hemoproteins. This view point is irreconcilable with the fact that all heme- dependent processes, from heme acquisition by proteins to heme signaling, require the dynamic mobilization of heme. However, heme mobilization has never been monitored, and the mechanisms that mediate it are poorly understood. The hydrophobicity and cytotoxicity of heme necessitate that its concentration is tightly regulated and buffered to low levels, creating an apparent paradox when trying to conceptualize the movement of heme to client he- moproteins or for heme-based signal transduction (5, 12). The total heme quota is the sum of the exchange inert and labile heme (LH) pools. Inert heme, which is unavailable for new heme-dependent processes, is more abundant and represents the large fraction of heme that is associated with high-affinity he- moproteins like cytochromes and globins. The LH pool, which is available for hemoproteins and heme signaling, is far less abundant and buffered by unknown factors (12). The properties of LH pools, including concentration, speciation, oxidation state, distribution, and dynamics, are paramount for understanding how cells assimilate this essential nutrient, but are poorly understood. The current lack of understanding of LH is, in large part, due to the dearth of tools available to probe it. Herein, we report genetically encoded ratiometric fluorescent heme sensors and deploy them in the unicellular eukaryote Saccharomyces cerevisiae (Baker’s yeast) to elucidate the nature and dynamics of LH. We find that LH is buffered at a concen- tration of 20–40 nM in the cytosol and less than 2.5 nM in the nucleus and mitochondria. Further, we find that the signaling molecule nitric oxide (NO) can initiate the rapid mobilization of heme in the cytosol and nucleus from certain thiol-containing factors. By integrating our heme sensors with genetic screens, we also find that the glycolytic enzyme glyceraldehyde phosphate dehydrogenase (GAPDH) is responsible for buffering intracellular heme and regu- lating the activity of the nuclear heme-dependent transcription factor heme activator protein (Hap1p). Altogether, these results reveal fundamental aspects of heme trafficking and dynamics, providing fresh insight into the cellular management of this essential nutrient. Results Design and Characterization of Heme Sensors. The first-generation heme sensor, HS1, consists of a heme-binding domain, the His/Met coordinating 4-alpha-helical bundle hemoprotein cytochrome b 562 (Cyt b 562 ) (13), fused to a pair of fluorescent proteins, EGFP and Katushka 2 (mKATE2), that are expected to exhibit heme-sensitive and -insensitive fluorescence, respectively (Fig. 1A). Holo-Cyt b 562 is a fluorescence resonance energy transfer (FRET) acceptor for EGFP (14, 15) [excitation (ex.) = 488 nm, emission (em.) = 510 nm] but not mKATE2 (16) (ex. = 588 nm, em. = 620 nm) (SI Appendix, Fig. S1). Thus, HS1 was designed as an excitation- emission ratiometric probe (17) in which the ratio of heme-sensi- tive EGFP fluorescence to heme-insensitive mKATE2 fluorescence Significance All heme-dependent functions require the mobilization of labile heme (LH), of which there is little understanding of its nature and dynamics. To probe LH pools, we developed genetically encoded fluorescent heme sensors and deployed them in the unicellular eukaryote Saccharomyces cerevisiae. We find that LH is relatively abundant in the cytosol, but exceedingly low in the mitochondria and nucleus. Further, we find that LH can be mobilized by sig- naling molecules like nitric oxide. We also find that the glycolytic enzyme glyceraldehyde phosphate dehydrogenase constitutes a major heme buffer and is responsible for regulating the activity of a heme-dependent transcription factor. Altogether, our work will have profound implications for understanding the mecha- nisms of heme utilization. Author contributions: D.A.H., R.M.H., O.M.-G., X.Y., B.C., F.W.O., I.H., and A.R.R. designed research; D.A.H., R.M.H., O.M.-G., X.Y., B.C., G.R., F.W.O., and A.R.R. performed research; D.A.H., R.M.H., O.M.-G., X.Y., B.C., G.R., F.W.O., and A.R.R. contributed new reagents/ analytic tools; D.A.H., R.M.H., O.M.-G., X.Y., B.C., F.W.O., I.H., and A.R.R. analyzed data; and D.A.H., R.M.H., and A.R.R. wrote the paper. Conflict of interest statement: I.H. is the founder and President of Rakta Therapeutics, Inc., a company involved in the development of heme transporter-related diagnostics. He declares no other competing financial interests. This article is a PNAS Direct Submission. See Commentary on page 7296. 1 D.A.H. and R.M.H. contributed equally to this work. 2 To whom correspondence should be addressed. Email: [email protected]. This article contains supporting information online at www.pnas.org/lookup/suppl/doi:10. 1073/pnas.1523802113/-/DCSupplemental. www.pnas.org/cgi/doi/10.1073/pnas.1523802113 PNAS | July 5, 2016 | vol. 113 | no. 27 | 7539–7544 CELL BIOLOGY SEE COMMENTARY
Transcript
Heme dynamics and trafficking factors revealed bygenetically encoded fluorescent heme sensorsDavid A. Hannaa,1, Raven M. Harveya,1, Osiris Martinez-Guzmana, Xiaojing Yuanb,c, Bindu Chandrasekharana,Gheevarghese Rajua, F. Wayne Outtend, Iqbal Hamzab,c, and Amit R. Reddia,2
aSchool of Chemistry and Biochemistry and Parker Petit Institute for Bioengineering and Biosciences, Georgia Institute of Technology, Atlanta, GA 30332;bDepartment of Animal and Avian Sciences, University of Maryland, College Park, MD 20740; cDepartment of Cell Biology and Molecular Genetics,University of Maryland, College Park, MD 20740; and dDepartment of Chemistry and Biochemistry, University of South Carolina, Columbia, SC 29208
Edited by Sabeeha S. Merchant, University of California, Los Angeles, CA, and approved May 2, 2016 (received for review December 4, 2015)
Heme is an essential cofactor and signalingmolecule. Heme acquisitionby proteins and heme signaling are ultimately reliant on the ability tomobilize labile heme (LH). However, the properties of LH pools,including concentration, oxidation state, distribution, speciation, anddynamics, are poorly understood. Herein, we elucidate the nature anddynamics of LH using genetically encoded ratiometric fluorescentheme sensors in the unicellular eukaryote Saccharomyces cerevisiae.We find that the subcellular distribution of LH is heterogeneous; thecytosol maintains LH at ∼20–40 nM, whereas the mitochondria andnucleus maintain it at concentrations below 2.5 nM. Further, we findthat the signaling molecule nitric oxide can initiate the rapid mobiliza-tion of heme in the cytosol and nucleus from certain thiol-containingfactors. We also find that the glycolytic enzyme glyceraldehyde phos-phate dehydrogenase constitutes a major cellular heme buffer, andis responsible for maintaining the activity of the heme-dependentnuclear transcription factor heme activator protein (Hap1p). Alto-gether, we demonstrate that the heme sensors can be used to revealfundamental aspects of heme trafficking and dynamics and can beused across multiple organisms, including Escherichia coli, yeast, andhuman cell lines.
Heme (iron protoporphyrin IX) is an essential protein cofactorand signaling molecule (1–11). The canonical view of heme is
that it is a static cofactor buried in the active sites of hemoproteins.This view point is irreconcilable with the fact that all heme-dependent processes, from heme acquisition by proteins to hemesignaling, require the dynamic mobilization of heme. However,heme mobilization has never been monitored, and the mechanismsthat mediate it are poorly understood. The hydrophobicity andcytotoxicity of heme necessitate that its concentration is tightlyregulated and buffered to low levels, creating an apparent paradoxwhen trying to conceptualize the movement of heme to client he-moproteins or for heme-based signal transduction (5, 12).The total heme quota is the sum of the exchange inert and
labile heme (LH) pools. Inert heme, which is unavailable for newheme-dependent processes, is more abundant and represents thelarge fraction of heme that is associated with high-affinity he-moproteins like cytochromes and globins. The LH pool, whichis available for hemoproteins and heme signaling, is far lessabundant and buffered by unknown factors (12). The propertiesof LH pools, including concentration, speciation, oxidation state,distribution, and dynamics, are paramount for understandinghow cells assimilate this essential nutrient, but are poorly understood.The current lack of understanding of LH is, in large part, due to thedearth of tools available to probe it.Herein, we report genetically encoded ratiometric fluorescent
heme sensors and deploy them in the unicellular eukaryoteSaccharomyces cerevisiae (Baker’s yeast) to elucidate the natureand dynamics of LH. We find that LH is buffered at a concen-tration of 20–40 nM in the cytosol and less than 2.5 nM in thenucleus and mitochondria. Further, we find that the signaling
molecule nitric oxide (NO) can initiate the rapid mobilization ofheme in the cytosol and nucleus from certain thiol-containing factors.By integrating our heme sensors with genetic screens, we also findthat the glycolytic enzyme glyceraldehyde phosphate dehydrogenase(GAPDH) is responsible for buffering intracellular heme and regu-lating the activity of the nuclear heme-dependent transcription factorheme activator protein (Hap1p). Altogether, these results revealfundamental aspects of heme trafficking and dynamics, providingfresh insight into the cellular management of this essential nutrient.
ResultsDesign and Characterization of Heme Sensors. The first-generationheme sensor, HS1, consists of a heme-binding domain, the His/Metcoordinating 4-alpha-helical bundle hemoprotein cytochrome b562(Cyt b562) (13), fused to a pair of fluorescent proteins, EGFP andKatushka 2 (mKATE2), that are expected to exhibit heme-sensitiveand -insensitive fluorescence, respectively (Fig. 1A).Holo-Cyt b562 is afluorescence resonance energy transfer (FRET) acceptor forEGFP (14, 15) [excitation (ex.) = 488 nm, emission (em.) = 510nm] but not mKATE2 (16) (ex. = 588 nm, em. = 620 nm) (SIAppendix, Fig. S1). Thus, HS1 was designed as an excitation-emission ratiometric probe (17) in which the ratio of heme-sensi-tive EGFP fluorescence to heme-insensitive mKATE2 fluorescence
Significance
All heme-dependent functions require the mobilization of labileheme (LH), of which there is little understanding of its nature anddynamics. To probe LH pools, we developed genetically encodedfluorescent heme sensors and deployed them in the unicellulareukaryote Saccharomyces cerevisiae. We find that LH is relativelyabundant in the cytosol, but exceedingly low in the mitochondriaand nucleus. Further, we find that LH can be mobilized by sig-naling molecules like nitric oxide. We also find that the glycolyticenzyme glyceraldehyde phosphate dehydrogenase constitutes amajor heme buffer and is responsible for regulating the activityof a heme-dependent transcription factor. Altogether, our workwill have profound implications for understanding the mecha-nisms of heme utilization.
Author contributions: D.A.H., R.M.H., O.M.-G., X.Y., B.C., F.W.O., I.H., and A.R.R. designedresearch; D.A.H., R.M.H., O.M.-G., X.Y., B.C., G.R., F.W.O., and A.R.R. performed research;D.A.H., R.M.H., O.M.-G., X.Y., B.C., G.R., F.W.O., and A.R.R. contributed new reagents/analytic tools; D.A.H., R.M.H., O.M.-G., X.Y., B.C., F.W.O., I.H., and A.R.R. analyzed data;and D.A.H., R.M.H., and A.R.R. wrote the paper.
Conflict of interest statement: I.H. is the founder and President of Rakta Therapeutics,Inc., a company involved in the development of heme transporter-related diagnostics. Hedeclares no other competing financial interests.
This article is a PNAS Direct Submission.
See Commentary on page 7296.1D.A.H. and R.M.H. contributed equally to this work.2To whom correspondence should be addressed. Email: [email protected].
This article contains supporting information online at www.pnas.org/lookup/suppl/doi:10.1073/pnas.1523802113/-/DCSupplemental.
provides a readout of cellular heme independent of sensorconcentration.HS1 was adapted from a previously reported EGFP-Cyt b562
integral fusion protein, CG6, that exhibits >99% efficient FRETbetween EGFP and heme (18). mKATE2 was appended to the Nterminus of CG6 with a GlySer linker. Titration of ferric andferrous heme into an aqueous buffered solution [20 mM NaPi,100 mM NaCl (pH 8.0)] of 0.5 μM purified HS1 resulted in visibleabsorbance spectra indicative of heme coordination (SI Appendix,Fig. S2), and quenched EGFP fluorescence (∼10-fold decrease insignal), with minimal perturbation to mKATE2 fluorescence(∼20% decrease in signal) (Fig. 1 B–D). Both oxidized and reducedheme quench the fluorescence of EGFP and mKATE2 to similardegrees and the change in fluorescence as a function of [heme]evinces a 1:1 heme/HS1 stoichiometry (Fig. 1 D and F).HS1-ferric heme dissociation constants, Kd
III, were determinedby direct titration of hemin chloride into HS1 over a broad pHrange (pH 5–8), and found to be 3 nM between pH 6.0 and 7.5 (SI
Appendix, Fig. S3 A–C). At pH 8.0, the 10 nM KdIII value for HS1 is
identical to the KdIII values previously reported for Cyt b562 (13)
and CG6 (18). HS1-ferrous heme dissociation constants, KdII
values, were too tight to measure by direct titration and are lessthan 1 nM.Because previous estimates for the concentration of the LH
pool are highly varied between nanomolar and micromolar values(12), we generated heme sensors with altered heme binding af-finities. One variant, HS1-M7A, which was generated by replacingthe heme axial Met7 ligand of Cyt b562 with Ala (SI Appendix, Fig.S2), exhibits fluorescence properties similar to the fluorescenceproperties of HS1 and binds heme in a 1:1 stoichiometry (Fig. 1 Eand F). HS1-M7A binds ferrous heme with a Kd
II value of 25 nMbetween pH 6.0 and 7.5 (SI Appendix, Fig. S3 D–F). The HS1-M7AKd
III values are very weak, determined to be 0.5–2.0 μM over a pHrange of 5.0–8.0 (SI Appendix, Fig. S3F). The Kd
II value of HS1-M7Ais similar in magnitude to previous estimates of the “regulatory”heme pool, 10–100 nM (12, 19), as well as the affinities of proteins thatmay respond to this pool, including the heme-dependent tran-scription factor Rev-erbβ (20) and constitutive heme oxygenase-2(HO-2) (21) (SI Appendix, Fig. S3G).Both HS1 and HS1-M7A are selective for ferrous heme over
other metals, protoporphyrin IX, and the heme degradationproducts bilirubin and biliverdin (SI Appendix, Fig. S4 A and B).Further, apo- and ferrous heme-bound HS1 and HS1-M7A exhibitpH-independent EGFP/mKATE2 fluorescence ratios betweenpH 6.5 and 9.0, but are markedly pH-dependent below pH 6.5(SI Appendix, Fig. S4 C and D). The fluorescence ratio of HS1and HS1-M7A is independent of protein concentration between10 nM and 1 μM, suggesting that the sensors do not aggregateover these concentrations (SI Appendix, Fig. S4E). Ferrous hemebinding to HS1 and HS1-M7A is reversible because competitionwith excess apo-Cyt b562 restores the fluorescence ratio to apo-sensor (SI Appendix, Fig. S5).
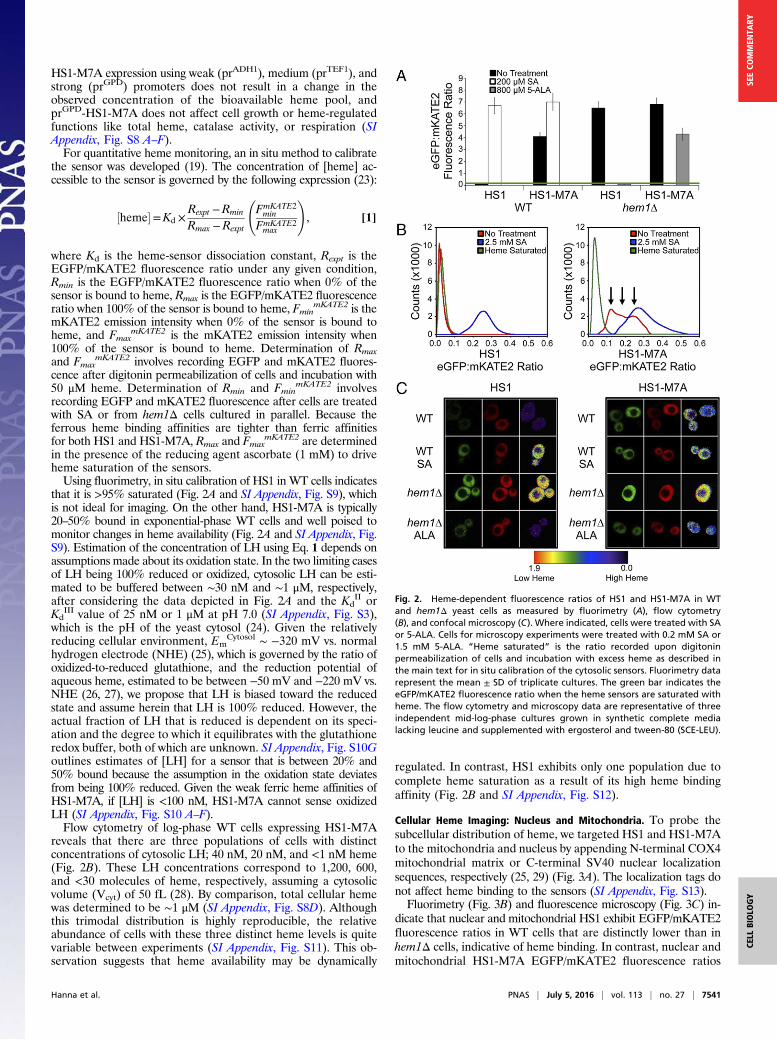
Cellular Heme Imaging: Cytosol. Using fluorimetry (Fig. 2A), flowcytometry (Fig. 2B), and fluorescence microscopy (Fig. 2C), wefind that HS1 and HS1-M7A can be used to sense endogenousLH in a quantitative manner. Fluorimetry (Fig. 2A) and fluores-cence microscopy (Fig. 2C) of WT yeast cells expressing cytosolicHS1 and HS1-M7A indicate an EGFP/mKATE2 ratio that ismarkedly reduced in comparison to heme-deficient hem1Δ cells,which lack 5-aminolevulinic acid (5-ALA) synthase, the firstenzyme in the heme biosynthetic pathway (22). The difference inHS1 and HS1-M7A fluorescence ratios in WT cells reflects theirdifferential heme binding affinities (vida infra).The HS1 and HS1-M7A EGFP/mKATE2 fluorescence ratios
in hem1Δ cells decrease when heme synthesis is initiated due tosupplementation with 5-ALA (Fig. 2 A and C) in a dose-dependentmanner (SI Appendix, Fig. S6 C and D), which is consistent withincreased heme binding. Excess 5-ALA does not reduce HS1-M7Afluorescence ratios to the same extent as HS1. This effect is be-cause excess 5-ALA (1.5 mM) results in intracellular heme levelssimilar to WT cells (SI Appendix, Fig. S6E); strict control of hemebiosynthesis does not allow for endogenous heme levels that aresufficient to saturate the low-affinity heme sensor HS1-M7A.Conversely, the HS1 and HS1-M7A EGFP/mKATE2 fluorescenceratios in WT cells increase upon supplementation with the hemebiosynthesis inhibitor succinylacetone (SA) (Fig. 2 A–C) in a dose-dependent manner (SI Appendix, Fig. S6 A and B), which isconsistent with decreased heme binding (2). A variant of HS1with His102 and Met7 heme-coordinating ligands mutated to Ala,HS1-M7A,H102A, and an mKATE2-EGFP fusion protein lackingthe Cyt b562 domain do not exhibit heme-dependent changes influorescence ratio, indicating that heme iron coordination to HS1is required for cellular heme sensing (SI Appendix, Fig. S7).The heme sensor does not itself perturb heme metabolism
and is a reliable reporter for endogenous LH. Titration of
Fig. 1. Design and heme-dependent fluorescence properties of the hemesensors. (A) Molecular model and design principles of the heme sensor, HS1.The model is derived from the X-ray structures of mKATE [Protein Data Bank(PDB) ID code 3BXB] and CG6 (PDB ID code 3U8P). Ferric heme-dependentchanges in the normalized fluorescence emission spectra of HS1 at pH 8.0upon excitation of EGFP (B, ex. = 488 nm) and mKATE2 (C, ex. = 588 nm) areillustrated. Normalized changes in EGFP (ex. = 488 nm, em. = 510 nm) andmKATE2 (ex. = 588 nm, em. = 620 nm) fluorescence upon titration of hemeinto 0.5 μM HS1 (D) and HS1-M7A (E) at pH 8.0 are illustrated. (F) Change inEGFP/mKATE2 fluorescence ratios for HS1 and HS1-M7A upon titration ofheme. All titration data are fit to 1:1 heme/protein binding models.
7540 | www.pnas.org/cgi/doi/10.1073/pnas.1523802113 Hanna et al.
HS1-M7A expression using weak (prADH1), medium (prTEF1), andstrong (prGPD) promoters does not result in a change in theobserved concentration of the bioavailable heme pool, andprGPD-HS1-M7A does not affect cell growth or heme-regulatedfunctions like total heme, catalase activity, or respiration (SIAppendix, Fig. S8 A–F).For quantitative heme monitoring, an in situ method to calibrate
the sensor was developed (19). The concentration of [heme] ac-cessible to the sensor is governed by the following expression (23):
½heme�=Kd ×Rexpt −Rmin
Rmax −Rexpt
FmKATE2min
FmKATE2max
!, [1]
where Kd is the heme-sensor dissociation constant, Rexpt is theEGFP/mKATE2 fluorescence ratio under any given condition,Rmin is the EGFP/mKATE2 fluorescence ratio when 0% of thesensor is bound to heme, Rmax is the EGFP/mKATE2 fluorescenceratio when 100% of the sensor is bound to heme, Fmin
mKATE2 is themKATE2 emission intensity when 0% of the sensor is bound toheme, and Fmax
mKATE2 is the mKATE2 emission intensity when100% of the sensor is bound to heme. Determination of Rmaxand Fmax
mKATE2 involves recording EGFP and mKATE2 fluores-cence after digitonin permeabilization of cells and incubation with50 μM heme. Determination of Rmin and Fmin
mKATE2 involvesrecording EGFP and mKATE2 fluorescence after cells are treatedwith SA or from hem1Δ cells cultured in parallel. Because theferrous heme binding affinities are tighter than ferric affinitiesfor both HS1 and HS1-M7A, Rmax and Fmax
mKATE2 are determinedin the presence of the reducing agent ascorbate (1 mM) to driveheme saturation of the sensors.Using fluorimetry, in situ calibration of HS1 in WT cells indicates
that it is >95% saturated (Fig. 2A and SI Appendix, Fig. S9), whichis not ideal for imaging. On the other hand, HS1-M7A is typically20–50% bound in exponential-phase WT cells and well poised tomonitor changes in heme availability (Fig. 2A and SI Appendix, Fig.S9). Estimation of the concentration of LH using Eq. 1 depends onassumptions made about its oxidation state. In the two limiting casesof LH being 100% reduced or oxidized, cytosolic LH can be esti-mated to be buffered between ∼30 nM and ∼1 μM, respectively,after considering the data depicted in Fig. 2A and the Kd
II orKd
III value of 25 nM or 1 μM at pH 7.0 (SI Appendix, Fig. S3),which is the pH of the yeast cytosol (24). Given the relativelyreducing cellular environment, Em
Cytosol ∼ −320 mV vs. normalhydrogen electrode (NHE) (25), which is governed by the ratio ofoxidized-to-reduced glutathione, and the reduction potential ofaqueous heme, estimated to be between −50 mV and −220 mV vs.NHE (26, 27), we propose that LH is biased toward the reducedstate and assume herein that LH is 100% reduced. However, theactual fraction of LH that is reduced is dependent on its speci-ation and the degree to which it equilibrates with the glutathioneredox buffer, both of which are unknown. SI Appendix, Fig. S10Goutlines estimates of [LH] for a sensor that is between 20% and50% bound because the assumption in the oxidation state deviatesfrom being 100% reduced. Given the weak ferric heme affinities ofHS1-M7A, if [LH] is <100 nM, HS1-M7A cannot sense oxidizedLH (SI Appendix, Fig. S10 A–F).Flow cytometry of log-phase WT cells expressing HS1-M7A
reveals that there are three populations of cells with distinctconcentrations of cytosolic LH; 40 nM, 20 nM, and <1 nM heme(Fig. 2B). These LH concentrations correspond to 1,200, 600,and <30 molecules of heme, respectively, assuming a cytosolicvolume (Vcyt) of 50 fL (28). By comparison, total cellular hemewas determined to be ∼1 μM (SI Appendix, Fig. S8D). Althoughthis trimodal distribution is highly reproducible, the relativeabundance of cells with these three distinct heme levels is quitevariable between experiments (SI Appendix, Fig. S11). This ob-servation suggests that heme availability may be dynamically
regulated. In contrast, HS1 exhibits only one population due tocomplete heme saturation as a result of its high heme bindingaffinity (Fig. 2B and SI Appendix, Fig. S12).
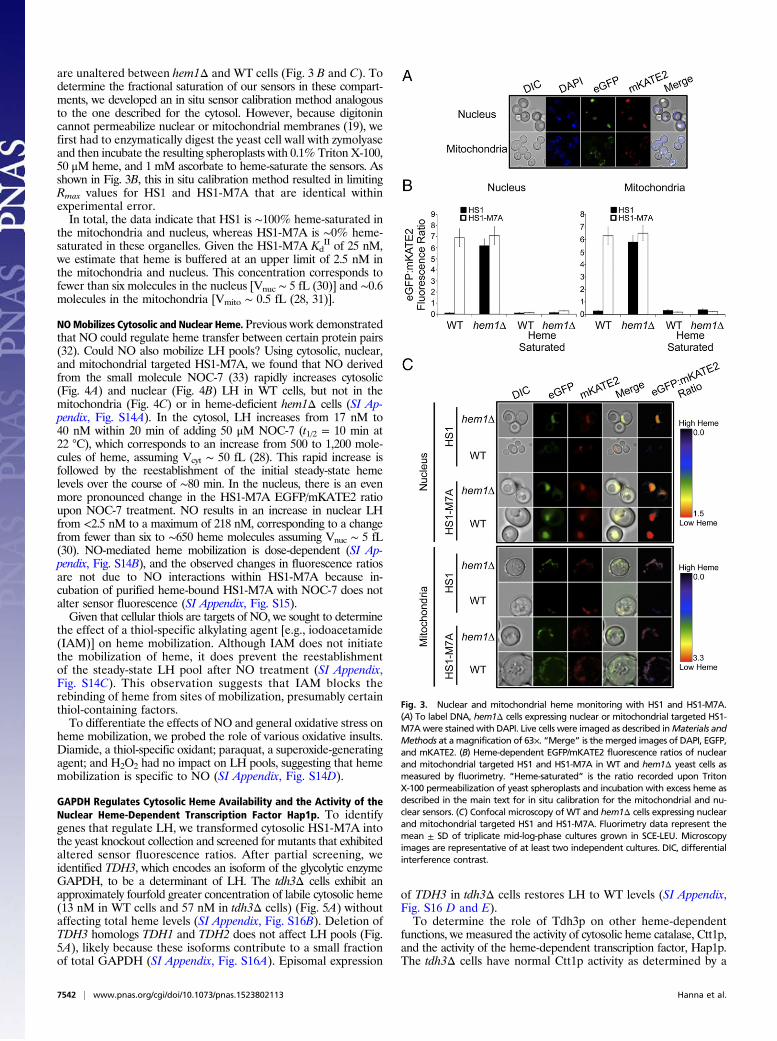
Cellular Heme Imaging: Nucleus and Mitochondria. To probe thesubcellular distribution of heme, we targeted HS1 and HS1-M7Ato the mitochondria and nucleus by appending N-terminal COX4mitochondrial matrix or C-terminal SV40 nuclear localizationsequences, respectively (25, 29) (Fig. 3A). The localization tags donot affect heme binding to the sensors (SI Appendix, Fig. S13).Fluorimetry (Fig. 3B) and fluorescence microscopy (Fig. 3C) in-
dicate that nuclear and mitochondrial HS1 exhibit EGFP/mKATE2fluorescence ratios in WT cells that are distinctly lower than inhem1Δ cells, indicative of heme binding. In contrast, nuclear andmitochondrial HS1-M7A EGFP/mKATE2 fluorescence ratios
Fig. 2. Heme-dependent fluorescence ratios of HS1 and HS1-M7A in WTand hem1Δ yeast cells as measured by fluorimetry (A), flow cytometry(B), and confocal microscopy (C). Where indicated, cells were treated with SAor 5-ALA. Cells for microscopy experiments were treated with 0.2 mM SA or1.5 mM 5-ALA. “Heme saturated” is the ratio recorded upon digitoninpermeabilization of cells and incubation with excess heme as described inthe main text for in situ calibration of the cytosolic sensors. Fluorimetry datarepresent the mean ± SD of triplicate cultures. The green bar indicates theeGFP/mKATE2 fluorescence ratio when the heme sensors are saturated withheme. The flow cytometry and microscopy data are representative of threeindependent mid-log-phase cultures grown in synthetic complete medialacking leucine and supplemented with ergosterol and tween-80 (SCE-LEU).
Hanna et al. PNAS | July 5, 2016 | vol. 113 | no. 27 | 7541
are unaltered between hem1Δ and WT cells (Fig. 3 B and C). Todetermine the fractional saturation of our sensors in these compart-ments, we developed an in situ sensor calibration method analogousto the one described for the cytosol. However, because digitonincannot permeabilize nuclear or mitochondrial membranes (19), wefirst had to enzymatically digest the yeast cell wall with zymolyaseand then incubate the resulting spheroplasts with 0.1% Triton X-100,50 μM heme, and 1 mM ascorbate to heme-saturate the sensors. Asshown in Fig. 3B, this in situ calibration method resulted in limitingRmax values for HS1 and HS1-M7A that are identical withinexperimental error.In total, the data indicate that HS1 is ∼100% heme-saturated in
the mitochondria and nucleus, whereas HS1-M7A is ∼0% heme-saturated in these organelles. Given the HS1-M7A Kd
II of 25 nM,we estimate that heme is buffered at an upper limit of 2.5 nM inthe mitochondria and nucleus. This concentration corresponds tofewer than six molecules in the nucleus [Vnuc ∼ 5 fL (30)] and ∼0.6molecules in the mitochondria [Vmito ∼ 0.5 fL (28, 31)].
NOMobilizes Cytosolic and Nuclear Heme. Previous work demonstratedthat NO could regulate heme transfer between certain protein pairs(32). Could NO also mobilize LH pools? Using cytosolic, nuclear,and mitochondrial targeted HS1-M7A, we found that NO derivedfrom the small molecule NOC-7 (33) rapidly increases cytosolic(Fig. 4A) and nuclear (Fig. 4B) LH in WT cells, but not in themitochondria (Fig. 4C) or in heme-deficient hem1Δ cells (SI Ap-pendix, Fig. S14A). In the cytosol, LH increases from 17 nM to40 nM within 20 min of adding 50 μM NOC-7 (t1/2 = 10 min at22 °C), which corresponds to an increase from 500 to 1,200 mole-cules of heme, assuming Vcyt ∼ 50 fL (28). This rapid increase isfollowed by the reestablishment of the initial steady-state hemelevels over the course of ∼80 min. In the nucleus, there is an evenmore pronounced change in the HS1-M7A EGFP/mKATE2 ratioupon NOC-7 treatment. NO results in an increase in nuclear LHfrom <2.5 nM to a maximum of 218 nM, corresponding to a changefrom fewer than six to ∼650 heme molecules assuming Vnuc ∼ 5 fL(30). NO-mediated heme mobilization is dose-dependent (SI Ap-pendix, Fig. S14B), and the observed changes in fluorescence ratiosare not due to NO interactions within HS1-M7A because in-cubation of purified heme-bound HS1-M7A with NOC-7 does notalter sensor fluorescence (SI Appendix, Fig. S15).Given that cellular thiols are targets of NO, we sought to determine
the effect of a thiol-specific alkylating agent [e.g., iodoacetamide(IAM)] on heme mobilization. Although IAM does not initiatethe mobilization of heme, it does prevent the reestablishmentof the steady-state LH pool after NO treatment (SI Appendix,Fig. S14C). This observation suggests that IAM blocks therebinding of heme from sites of mobilization, presumably certainthiol-containing factors.To differentiate the effects of NO and general oxidative stress on
heme mobilization, we probed the role of various oxidative insults.Diamide, a thiol-specific oxidant; paraquat, a superoxide-generatingagent; and H2O2 had no impact on LH pools, suggesting that hememobilization is specific to NO (SI Appendix, Fig. S14D).
GAPDH Regulates Cytosolic Heme Availability and the Activity of theNuclear Heme-Dependent Transcription Factor Hap1p. To identifygenes that regulate LH, we transformed cytosolic HS1-M7A intothe yeast knockout collection and screened for mutants that exhibitedaltered sensor fluorescence ratios. After partial screening, weidentified TDH3, which encodes an isoform of the glycolytic enzymeGAPDH, to be a determinant of LH. The tdh3Δ cells exhibit anapproximately fourfold greater concentration of labile cytosolic heme(13 nM in WT cells and 57 nM in tdh3Δ cells) (Fig. 5A) withoutaffecting total heme levels (SI Appendix, Fig. S16B). Deletion ofTDH3 homologs TDH1 and TDH2 does not affect LH pools (Fig.5A), likely because these isoforms contribute to a small fractionof total GAPDH (SI Appendix, Fig. S16A). Episomal expression
of TDH3 in tdh3Δ cells restores LH to WT levels (SI Appendix,Fig. S16 D and E).To determine the role of Tdh3p on other heme-dependent
functions, we measured the activity of cytosolic heme catalase, Ctt1p,and the activity of the heme-dependent transcription factor, Hap1p.The tdh3Δ cells have normal Ctt1p activity as determined by a
Fig. 3. Nuclear and mitochondrial heme monitoring with HS1 and HS1-M7A.(A) To label DNA, hem1Δ cells expressing nuclear or mitochondrial targeted HS1-M7Awere stained with DAPI. Live cells were imaged as described inMaterials andMethods at amagnification of 63×. “Merge” is the merged images of DAPI, EGFP,and mKATE2. (B) Heme-dependent EGFP/mKATE2 fluorescence ratios of nuclearand mitochondrial targeted HS1 and HS1-M7A in WT and hem1Δ yeast cells asmeasured by fluorimetry. “Heme-saturated” is the ratio recorded upon TritonX-100 permeabilization of yeast spheroplasts and incubation with excess heme asdescribed in the main text for in situ calibration for the mitochondrial and nu-clear sensors. (C) Confocal microscopy of WT and hem1Δ cells expressing nuclearand mitochondrial targeted HS1 and HS1-M7A. Fluorimetry data represent themean ± SD of triplicate mid-log-phase cultures grown in SCE-LEU. Microscopyimages are representative of at least two independent cultures. DIC, differentialinterference contrast.
7542 | www.pnas.org/cgi/doi/10.1073/pnas.1523802113 Hanna et al.
native in-gel colorimetric assay for catalase (34) (SI Appendix, Fig.S16C). On the other hand, tdh3Δ cells have a defect in Hap1pactivity as measured using a transcriptional reporter that employsEGFP driven by the CYC1 promoter, a Hap1p target gene (9) (Fig.5B). In total, our data indicate GAPDH is involved in bufferingcytosolic heme and regulates the activity of Hap1p, presumablyby acting as a source for heme.
Validation of Sensors in Escherichia coli and HEK293 Cells.To broaden theutility of HS1, we tested its applicability in other cell lines, includingE. coli and human embryonic kidney HEK293 cells (SI Appendix, Fig.S17). In HEK293 cells, flow cytometry and fluorescence microscopydemonstrate that HS1 and HS1-M7A exhibit EGFP/mKATE2fluorescence ratios that are distinctly lower when cells are cultured inheme-replete media relative to heme-deficient (HD) media con-taining SA (HD + SA) (SI Appendix, Fig. S17 A–E). Similarly, hemesensor fluorescence ratios in E. coli exhibit heme-dependent changes.A heme-deficient ΔhemA strain lacking glutamyl-tRNA reductase,which catalyzes the first step in porphyrin synthesis, is a 5-ALAauxotroph. The ΔhemA strain showed a higher EGFP/mKATE2fluorescence ratio after growth shift to media lacking 5-ALA (SIAppendix, Fig. S17F). In total, HS1 can be used to probe hemephysiology across multiple model organisms and cell lines.
DiscussionThe mobilization of LH underlies all heme-dependent processes,including heme acquisition by client proteins and heme-basedsignal transduction. However, the properties of the LH pool arepoorly understood. To address this fundamental gap in heme cellbiology, we developed genetically encoded ratiometric heme sen-sors and deployed them in Baker’s yeast to probe key charac-teristics of the LH pool, including its concentration, subcellulardistribution, buffering factors, and dynamics.The cytosol has more LH (∼20–40 nM) than the nucleus or
mitochondria (<2.5 nM). Further, the cell-to-cell heterogeneity incytosolic heme suggests its availability may be dynamically regulated(Fig. 2B). Given the subcellular distribution of heme, we proposethat once heme is biosynthesized in the mitochondrial matrix, a frac-tion of heme transits to the cytosol and acts as a reservoir forsignaling and/or a heme source for proteins.The mitochondria, which have a very high demand for heme
and are the site of heme biosynthesis, have exceptionally lowquantities of LH, less than 2.5 nM or fewer than one molecule. Bycomparison, total ferrous heme in the yeast mitochondria has beenestimated to be ∼30 μM, or ∼9,000 molecules (28). Taken to-gether, this low amount of mitochondrial LH suggests that mi-tochondrial heme is tightly regulated and trafficked in a manner
that limits its availability. This observation is consistent with theidentification of mitochondrial heme metabolism complexes thattraffic heme via transient protein–protein interactions, therebycircumventing the LH pool (35).The nucleus also limits LH to less than 2.5 nM or fewer than six
molecules. This low amount of nuclear LH is not surprising, giventhe cytotoxicity of heme and proximity to genetic material (5, 12).However, this observation raises the question of how nuclearheme-regulated transcription factors acquire heme, given that theheme-regulatory motifs (HRMs) of many heme-dependent tran-scription factors, including Hap1p in yeast, exhibit micromolaraffinities for heme (11). Factors like Hap1p may acquire hemefrom transient increases in LH due to active signaling processes.Indeed, this concept is supported by our demonstration that sig-naling molecules like NO can result in a >10-fold increase innuclear LH (Fig. 4B). An alternative possibility is that the hemeaffinities of many HRM-containing proteins are mischaracterized.For instance, a reevaluation of the heme dissociation constants ofthe HRM-containing transcription factor Rev-erbβ found thatheme binds 100-fold tighter than previously estimated, with Kd
III
and KdII of ∼20 nM vs. 2–6 μM (20).
Our observation that subcellular [LH] is heterogeneous standsin striking contrast to a recent report by He and coworkers (19)that used a heme chaperone-based FRET sensor (CISDY-9) forheme in human cell lines. In that work, cytosolic, mitochondrial,and nuclear heme were all reported to be ∼25 nM. The deviationbetween our two results needs to be clarified but could reflectorganismal variation, difficulty in calibrating CISDY-9 in organ-elles, or uncertainties in LH oxidation state.We demonstrate, for the first time to our knowledge, that LH
is dynamic and can be mobilized by signaling molecules like NO(Fig. 4 and SI Appendix, Fig. S14). Although previous studieshave indicated that H2O2 and NO can regulate heme transferbetween specific protein pairs (32, 36), our results suggest thatNO can mobilize cell-wide LH pools to regulate heme-dependentprocesses in multiple compartments. The mechanism of NO-mediated hememobilization is unknown, but likely involves S-nitrosationof certain hemoproteins and heme dissociation (32, 37).NO-mediated heme mobilization provides insights into NO
physiology, including NO-dependent inflammatory responses. Bothheme and NO regulate inflammation, but through distinct mech-anisms (8, 38, 39). Our work indicates that NO can promote in-flammation via heme mobilization. Indeed, previous observationsin endothelial cells found that NO elevates cellular iron due toenhanced activity of the heme-degrading enzyme, HO (40). Thisobservation was proposed to occur as a result of NO-induced hemerelease from hemoproteins. Our current studies are the first, to ourknowledge, to provide direct support for this model.
Fig. 5. Tdh3p regulates intracellular heme availability and Hap1p activity.(A) Fluorimetric determination of EGFP/mKATE2 fluorescence ratios of the indicatedyeast strains expressing HS1-M7A. Rmin and Rmax were determined to be 6.1 (fromthe hem1Δ strain) and 0.2 (from in situ calibration with digitonin), respectively.(B) Hap1p activity in the indicated strains as measured by a transcriptional re-porter that used EGFP driven by the CYC1 promoter, a Hap1p target gene. Alldata represent the mean ± SD of triplicate mid-log-phase yeast extract-peptone-dextrose media supplemented with ergosterol and tween-80 (YPDE) cultures.
Fig. 4. NO-dependent mobilization of LH. WT cells expressing cytosolic(A), nuclear (B), or mitochondrial (C) HS1-M7Awere incubatedwith 50 μMNOC-7,and eGFP/mKATE2 fluorescence ratios were monitored by fluorimetry. Thedata represent the mean ± SD of triplicate mid-log-phase cultures grown in SCE-LEU. The red and black lines indicate the fluorescence ratios of HS1-M7A whenit is 0% and 100% saturated with heme as derived from hem1Δ cells expressingHS1-M7A orWT cells expressing HS1, respectively. This approach for determiningRmax is validated by the fact that the eGFP/mKATE2 fluorescence ratio of HS1-M7A that is saturated with heme from the in situ calibration methods is identicalwithin experimental error to HS1 (Fig. 3B and SI Appendix, Fig. S9).
Hanna et al. PNAS | July 5, 2016 | vol. 113 | no. 27 | 7543
Our findings that GAPDH and NO regulate heme availabilityand mobilization are highly reminiscent of and supported by pre-vious studies demonstrating that GAPDH and NO cooperate tocontrol heme insertion into nitric oxide synthase (32). As such, it istempting to speculate that Tdh3p is the source of NO-mobilizedheme. However, NO-dependent heme mobilization is unaffectedin tdh3Δ cells (SI Appendix, Fig. S18).Altogether, the HS1s can be applied across prokaryotes and
eukaryotes to probe heme trafficking, signaling, and dynamics invarious physiological contexts.
Materials and MethodsAll cell lines, culture conditions, reagents, and methods are described in SIAppendix, SI Materials and Methods. Yeast strains used in this study werein the BY4741 genetic background. The ΔhemA E. coli strains were in the
MG1655 background. HEK293 cells were obtained from A. Oyelere (GeorgiaInstitute of Technology). The genes for mKATE2 and CG6 used to constructHS1 were purchased from GENESCRIPT and codon-optimized for expression inE. coli and S. cerevisiae or humans. Standard published methods for proteinexpression and purification (18), heme binding studies (20, 27), fluorimetry,UV/visible spectroscopy, microscopy, flow cytometry, immunoblotting(41), catalase activity (34), oxygen consumption (41), total heme analysis(42), and cell growth are outlined in SI Appendix, SI Materials andMethods.
ACKNOWLEDGMENTS. We thank Profs. C. Fahrni, B. Gibney, and A. Medlockfor critical reading of the manuscript, A. Shaw and Dr. D. Bourassa forassistance with microscopy, and J. Ashworth for help with preliminarystudies. This work was supported by NIH Grant ES025661 (to A.R.R. and I.H.),National Science Foundation CAREER Award MCB 1552791 (to A.R.R.), andfunds from the Georgia Institute of Technology (to A.R.R.).
1. Severance S, Hamza I (2009) Trafficking of heme and porphyrins in metazoa. ChemRev 109(10):4596–4616.
2. Shen J, et al. (2014) Iron metabolism regulates p53 signaling through direct heme-p53interaction and modulation of p53 localization, stability, and function. Cell Reports7(1):180–193.
3. Raghuram S, et al. (2007) Identification of heme as the ligand for the orphan nuclearreceptors REV-ERBalpha and REV-ERBbeta. Nat Struct Mol Biol 14(12):1207–1213.
4. Ghosh S, et al. (2013) Extracellular hemin crisis triggers acute chest syndrome in sicklemice. J Clin Invest 123(11):4809–4820.
5. Chiabrando D, Vinchi F, Fiorito V, Mercurio S, Tolosano E (2014) Heme in pathophysiology:A matter of scavenging, metabolism and trafficking across cell membranes. FrontPharmacol 5:61.
6. Keel SB, et al. (2008) A heme export protein is required for red blood cell differentiationand iron homeostasis. Science 319(5864):825–828.
7. Haldar M, et al. (2014) Heme-mediated SPI-C induction promotes monocyte differentia-tion into iron-recycling macrophages. Cell 156(6):1223–1234.
8. Dutra FF, Bozza MT (2014) Heme on innate immunity and inflammation. FrontPharmacol 5:115.
9. Mense SM, Zhang L (2006) Heme: A versatile signaling molecule controlling the activitiesof diverse regulators ranging from transcription factors to MAP kinases. Cell Res 16(8):681–692.
10. Hou S, Reynolds MF, Horrigan FT, Heinemann SH, Hoshi T (2006) Reversible binding ofheme to proteins in cellular signal transduction. Acc Chem Res 39(12):918–924.
11. Zhang L, Guarente L (1995) Heme binds to a short sequence that serves a regulatoryfunction in diverse proteins. EMBO J 14(2):313–320.
12. Sassa S (2004) Why heme needs to be degraded to iron, biliverdin IXalpha, and carbonmonoxide? Antioxid Redox Signal 6(5):819–824.
13. Robinson CR, Liu Y, Thomson JA, Sturtevant JM, Sligar SG (1997) Energetics of hemebinding to native and denatured states of cytochrome b562. Biochemistry 36(51):16141–16146.
14. Takeda S, Kamiya N, Nagamune T (2003) A novel protein-based heme sensor con-sisting of green fluorescent protein and apocytochrome b(562). Anal Biochem 317(1):116–119.
15. Takeda S, Kamiya N, Arai R, Nagamune T (2001) Design of an artificial light-harvestingunit by protein engineering: cytochrome b(562)-green fluorescent Protein chimera.Biochem Biophys Res Commun 289(1):299–304.
16. Shcherbo D, et al. (2009) Far-red fluorescent tags for protein imaging in living tissues.Biochem J 418(3):567–574.
17. Bregestovski P, Arosio D (2012) Green fluorescent protein-based chloride ion sensors forin vivo imaging. Fluorescent Proteins II: Application of Fluorescent Protein Technology, edJung G (Springer, Berlin), Vol 12, pp 99–125.
18. Arpino JA, et al. (2012) Structural basis for efficient chromophore communication andenergy transfer in a constructed didomain protein scaffold. J Am Chem Soc 134(33):13632–13640.
19. Song Y, et al. (2015) A Genetically Encoded FRET Sensor for Intracellular Heme. ACSChem Biol 10(7):1610–1615.
20. Gupta N, Ragsdale SW (2011) Thiol-disulfide redox dependence of heme binding andheme ligand switching in nuclear hormone receptor rev-erbbeta. J Biol Chem 286(6):4392–4403.
21. Fleischhacker AS, et al. (2015) The C-terminal heme regulatory motifs of heme oxy-genase-2 are redox-regulated heme binding sites. Biochemistry 54(17):2709–2718.
22. Ness F, et al. (1998) Sterol uptake in Saccharomyces cerevisiae heme auxotrophicmutants is affected by ergosterol and oleate but not by palmitoleate or by sterolesterification. J Bacteriol 180(7):1913–1919.
23. Grynkiewicz G, Poenie M, Tsien RY (1985) A new generation of Ca2+ indicators withgreatly improved fluorescence properties. J Biol Chem 260(6):3440–3450.
24. Orij R, Postmus J, Ter Beek A, Brul S, Smits GJ (2009) In vivo measurement of cytosolic andmitochondrial pH using a pH-sensitive GFP derivative in Saccharomyces cerevisiae revealsa relation between intracellular pH and growth. Microbiology 155(Pt 1):268–278.
25. Hu J, Dong L, Outten CE (2008) The redox environment in themitochondrial intermembranespace is maintained separately from the cytosol and matrix. J Biol Chem 283(43):29126–29134.
26. Conant JB, Tongberg CO (1930) The oxidation-reduction potentials of hemin andrelated substances: I. The potentials of various hemins and hematins in the absenceand presence of pyridine. J Biol Chem 86:733–741.
27. Reddi AR, Reedy CJ, Mui S, Gibney BR (2007) Thermodynamic investigation into themechanisms of proton-coupled electron transfer events in heme protein maquettes.Biochemistry 46(1):291–305.
28. Garber Morales J, et al. (2010) Biophysical characterization of iron in mitochondriaisolated from respiring and fermenting yeast. Biochemistry 49(26):5436–5444.
29. Tsang CKL, Liu Y, Thomas J, Zhang Y, Zheng XF (2014) Superoxide dismutase 1 acts as anuclear transcription factor to regulate oxidative stress resistance. Nat Commun 5:3446.
30. Jorgensen P, et al. (2007) The size of the nucleus increases as yeast cells grow.Mol BiolCell 18(9):3523–3532.
31. Rafelski SM, et al. (2012) Mitochondrial network size scaling in budding yeast. Science338(6108):822–824.
32. Chakravarti R, Aulak KS, Fox PL, Stuehr DJ (2010) GAPDH regulates cellular hemeinsertion into inducible nitric oxide synthase. Proc Natl Acad Sci USA 107(42):18004–18009.
33. Maragos CM, Wang JM, Hrabie JA, Oppenheim JJ, Keefer LK (1993) Nitric oxide/nucleophile complexes inhibit the in vitro proliferation of A375 melanoma cells vianitric oxide release. Cancer Res 53(3):564–568.
34. Baureder M, Hederstedt L (2012) Genes important for catalase activity in Enterococcusfaecalis. PLoS One 7(5):e36725.
35. Medlock AE, et al. (2015) Identification of the Mitochondrial Heme MetabolismComplex. PLoS One 10(8):e0135896.
36. Kathiresan M, Martins D, English AM (2014) Respiration triggers heme transfer fromcytochrome c peroxidase to catalase in yeast mitochondria. Proc Natl Acad Sci USA111(49):17468–17473.
37. Weichsel A, et al. (2005) Heme-assisted S-nitrosation of a proximal thiolate in a nitricoxide transport protein. Proc Natl Acad Sci USA 102(3):594–599.
38. Bucci M, et al. (2005) Endothelial nitric oxide synthase activation is critical for vascularleakage during acute inflammation in vivo. Proc Natl Acad Sci USA 102(3):904–908.
39. Predonzani A, Calì B, Agnellini AH, Molon B (2015) Spotlights on immunological ef-fects of reactive nitrogen species: When inflammation says nitric oxide. World J ExpMed 5(2):64–76.
40. Yee EL, Pitt BR, Billiar TR, Kim YM (1996) Effect of nitric oxide on heme metabolism inpulmonary artery endothelial cells. Am J Physiol 271(4 Pt 1):L512–L518.
41. Reddi AR, Culotta VC (2013) SOD1 integrates signals from oxygen and glucose torepress respiration. Cell 152(1-2):224–235.
42. Woods JS, Simmonds PL (2001) HPLC methods for analysis of porphyrins in biologicalmedia. Curr Protoc Toxicol Chapter 8:Unit 8.9.
7544 | www.pnas.org/cgi/doi/10.1073/pnas.1523802113 Hanna et al.