Quantitative Hemodynamic Effects of Heart Rate in Aortic Regurgitation By TERRANCE P. JUDGE, M.D., J. W. KENNEDY, M.D., LOWELL J. BENNETT, M.D., ROBERT E. WILLS, M.D., JOHN A. MURRAY, M.D., AND JOHN R. BLACKMON, M.D. SUMMARY The hemodynamic effect of varying heart rate was studied in eight patients with aortic regurgitation. At the subjects' resting sinus rhythm and at a higher heart rate induced with right atrial pacing, left ventricular and aortic pressures and Fick cardiac outputs (FCO) were measured, and left ventricular biplane angiocardiograms were performed. Left ventricular volumes and left ventricular minute flow (LVMF) were determined from the angiograms. Regurgitant flow was quantitated by subtracting the FCO from LVMF. Increased heart rate produced highly significant reductions in the left ventricular end-diastolic pressure (LVEDP), left ventricular end-diastolic volume, and stroke volume. End-diastolic circumferential stress (EDCS) and end- diastolic load (EDL) were abnormally high at resting sinus rhythm and were markedly decreased with increased heart rate. FCO increased, but no significant changes were observed in either the LVMF or the regurgitant flow per minute. Bradyeardia in aortic regurgitation may cause pulmonary congestion secondary to high LVEDP and may accelerate left ventricular dilatation secondary to markedly elevated EDCS and EDL. The possible benefits of preventing bradyeardia in aortic regurgitation by chronic demand pacing is currently being tested. Additional Indexing Words: Atrial pacing Circumferential stress Rheumatic heart disease Quantitative INCE THE TIME of Corrigan in 1832 it Jhas been noted that patients with aortic regurgitation tolerate exercise relatively well and conversely they may develop symptoms of pulmonary congestion at rest.' Previous at- tempts to define the hemodynamic events responsible for these observations are not in agreement. Warner and Toronto2 using a dye- dilution method to estimate aortic backflow demonstrated that regurgitant flow per stroke and per unit time was diminished at increased From the Department of Medicine, Division of Cardiology, University of Washington School of Medicine, and Veterans Administration Hospital, Seattle, Washington. Address for reprints: J. W. Kennedy, M.D., Vet- erans Administration Hospital, Seattle, Washington. Received August 25, 1970; revision accepted for publication April 28, 1971. Circulation, Volume XLIV, September 1971 Left ventricular end-diastolic load angiocardiography heart rates. Rothlin et al.,3 using the same dye technique, concluded that an increased heart rate in severe aortic regurgitation increases the forward flow while diminishing the regurgi- tant flow per minute. These changes were not seen in mild and moderate aortic regurgita- tion. Brawley and Morrow4 studied the effect of heart rate in six patients at the time of operation using electromagnetic flowmeters on the ascending aorta to measure forward and regurgitant flows. They found no consistent changes in either total forward or regurgitant flows per minute as the heart rates were increased by pacing. The present study was carried out to measure the effect of changing heart rate in aortic regurgitation utilizing quantitative an- giocardiographic methods in unanesthetized subjects. 355 by guest on May 22, 2018 http://circ.ahajournals.org/ Downloaded from
Transcript
Quantitative Hemodynamic Effectsof Heart Rate in Aortic Regurgitation
By TERRANCE P. JUDGE, M.D., J. W. KENNEDY, M.D., LOWELL J. BENNETT, M.D.,
ROBERT E. WILLS, M.D., JOHN A. MURRAY, M.D.,
AND JOHN R. BLACKMON, M.D.
SUMMARYThe hemodynamic effect of varying heart rate was studied in eight patients with
aortic regurgitation. At the subjects' resting sinus rhythm and at a higher heart rate
induced with right atrial pacing, left ventricular and aortic pressures and Fick cardiacoutputs (FCO) were measured, and left ventricular biplane angiocardiograms were
performed. Left ventricular volumes and left ventricular minute flow (LVMF) were
determined from the angiograms. Regurgitant flow was quantitated by subtractingthe FCO from LVMF. Increased heart rate produced highly significant reductions inthe left ventricular end-diastolic pressure (LVEDP), left ventricular end-diastolicvolume, and stroke volume. End-diastolic circumferential stress (EDCS) and end-diastolic load (EDL) were abnormally high at resting sinus rhythm and were markedlydecreased with increased heart rate. FCO increased, but no significant changes were
observed in either the LVMF or the regurgitant flow per minute.Bradyeardia in aortic regurgitation may cause pulmonary congestion secondary to
high LVEDP and may accelerate left ventricular dilatation secondary to markedlyelevated EDCS and EDL. The possible benefits of preventing bradyeardia in aorticregurgitation by chronic demand pacing is currently being tested.
INCE THE TIME of Corrigan in 1832 itJhas been noted that patients with aortic
regurgitation tolerate exercise relatively welland conversely they may develop symptoms ofpulmonary congestion at rest.' Previous at-tempts to define the hemodynamic eventsresponsible for these observations are not inagreement. Warner and Toronto2 using a dye-dilution method to estimate aortic backflowdemonstrated that regurgitant flow per strokeand per unit time was diminished at increased
From the Department of Medicine, Division ofCardiology, University of Washington School ofMedicine, and Veterans Administration Hospital,Seattle, Washington.
Address for reprints: J. W. Kennedy, M.D., Vet-erans Administration Hospital, Seattle, Washington.
Received August 25, 1970; revision accepted forpublication April 28, 1971.
Circulation, Volume XLIV, September 1971
Left ventricular end-diastolic loadangiocardiography
heart rates. Rothlin et al.,3 using the same dyetechnique, concluded that an increased heartrate in severe aortic regurgitation increases theforward flow while diminishing the regurgi-tant flow per minute. These changes were notseen in mild and moderate aortic regurgita-tion. Brawley and Morrow4 studied the effectof heart rate in six patients at the time ofoperation using electromagnetic flowmeters onthe ascending aorta to measure forward andregurgitant flows. They found no consistentchanges in either total forward or regurgitantflows per minute as the heart rates wereincreased by pacing.The present study was carried out to
measure the effect of changing heart rate inaortic regurgitation utilizing quantitative an-giocardiographic methods in unanesthetizedsubjects.
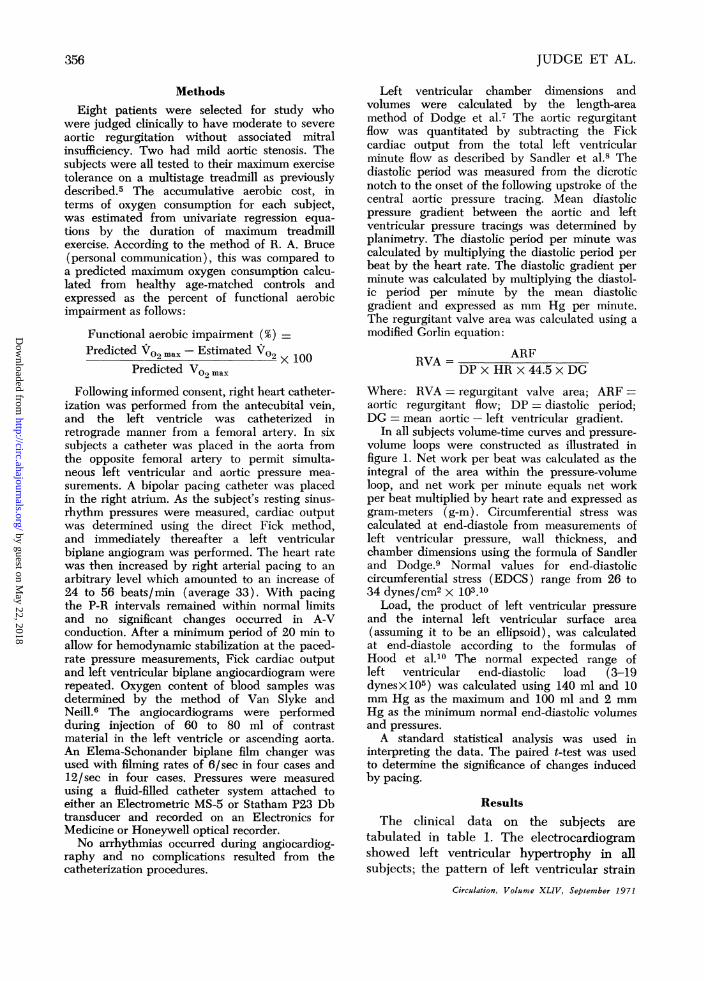
were judged clinically to have moderate to severeaortic regurgitation without associated mitralinsufficiency. Two had mild aortic stenosis. Thesubjects were all tested to their maximum exercisetolerance on a multistage treadmill as previouslydescribed.5 The accumulative aerobic cost, interms of oxygen consumption for each subject,was estimated from univariate regression equa-tions by the duration of maximum treadmillexercise. According to the method of R. A. Bruce(personal communication), this was compared toa predicted maximum oxygen consumption calcu-lated from healthy age-matched controls andexpressed as the percent of functional aerobicimpairment as follows:
Functional aerobic impairment (%)
Predicted -2max-Estimated V02 x 100
Predicted V02 max
Following informed consent, right heart catheter-ization was performed from the antecubital vein,and the left ventricle was catheterized inretrograde manner from a femoral artery. In sixsubjects a catheter was placed in the aorta fromthe opposite femoral artery to permit simulta-neous left ventricular and aortic pressure mea-
surements. A bipolar pacing catheter was placedin the right atrium. As the subject's resting sinus-rhythm pressures were measured, cardiac outputwas determined using the direct Fick method,and immediately thereafter a left ventricularbiplane angiogram was performed. The heart ratewas then increased by right arterial pacing to an
arbitrary level which amounted to an increase of24 to 56 beats/min (average 33). With pacingthe P-R intervals remained within normal limitsand no significant changes occurred in A-Vconduction. After a minimum period of 20 min toallow for hemodynamic stabilization at the paced-rate pressure measurements, Fick cardiac outputand left ventricular biplane angiocardiogram wererepeated. Oxygen content of blood samples was
determined by the method of Van Slyke andNeill.6 The angiocardiograms were performedduring injection of 60 to 80 ml of contrastmaterial in the left ventricle or ascending aorta.An Elema-Schonander biplane film changer was
used with filming rates of 6/sec in four cases and12/sec in four cases. Pressures were measuredusing a fluid-filled catheter system attached toeither an Electrometric MS-S or Statham P23 Dbtransducer and recorded on an Electronics forMedicine or Honeywell optical recorder.No arrhythmias occurred during angiocardiog-
raphy and no complications resulted from thecatheterization procedures.
Left ventricular chamber dimensions andvolumes were calculated by the length-areamethod of Dodge et al.7 The aortic regurgitantflow was quantitated by subtracting the Fickcardiac output from the total left ventricularminute flow as described by Sandler et al.8 Thediastolic period was measured from the dicroticnotch to the onset of the following upstroke of thecentral aortic pressure tracing. Mean diastolicpressure gradient between the aortic and leftventricular pressure tracings was determined byplanimetry. The diastolic period per minute wascalculated by multiplying the diastolic period perbeat by the heart rate. The diastolic gradient perminute was calculated by multiplying the diastol-ic period per minute by the mean diastolicgradient and expressed as mm Hg per minute.The regurgitant valve area was calculated using amodified Corlin equation:
RVA = ARFDP x HR x 44.5 x DG
Where: RVA - regurgitant valve area; ARFaortic regurgitant flow; DP - diastolic period;DG - mean aortic - left ventricular gradient.
In all subjects volume-time curves and pressure-volume loops were constructed as illustrated infigure 1. Net work per beat was calculated as theintegral of the area within the pressure-volumeloop, and net work per minute equals net workper beat multiplied by heart rate and expressed asgram-meters (g-m). Circumferential stress wascalculated at end-diastole from measurements ofleft ventricular pressure, wall thickness, andchamber dimensions using the formula of Sandlerand Dodge.9 Normal values for end-diastoliccircumferential stress (EDCS) range from 26 to34 dynes/cm2 x 103.10
Load, the product of left ventricular pressureand the internal left ventricular surface area(assuming it to be an ellipsoid), was calculatedat end-diastole according to the formulas ofHood et al.10 The normal expected range ofleft ventricular end-diastolic load (3-19dynesX105) was calculated using 140 ml and 10mm Hg as the maximum and 100 ml and 2 mmHg as the minimum normal end-diastolic volumesand pressures.A standard statistical analysis was used in
interpreting the data. The paired t-test was usedto determine the significance of changes inducedby pacing.
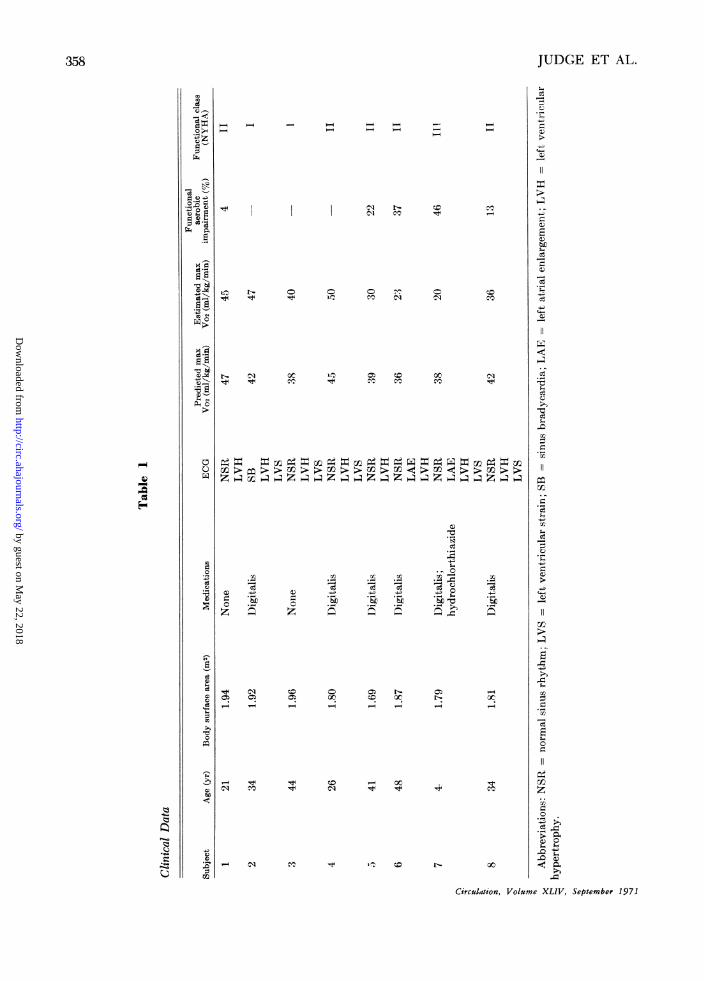
ResultsThe clinical data on the subjects are
tabulated in table 1. The electrocardiogramshowed left ventricular hypertrophy in allsubjects; the pattern of left ventricular strain
Figure 1(A) Left ventricular volume during an average cardiac cycle at resting sinus rhythm (closedline and dots) and at the higher heart rate induced with atrial pacing (dashed line and opencircles). The dots and circles represent measurements from a single pair of biplane films, andthe data are collected from three consecutive beats. The reduction in LVEDV and strokevolume at the higher heart rate is easily appreciated. (B) Pressure-volume loops during anaverage cardiac cycle at resting sinus rhythm and atrial pacing. Moving counterclockwise fromthe lower left corner of each loop, the horizontal portion moving to the right representsdiastolic filling; the vertical ascent on the right is isovolumetric contraction; the horizontalline moving to the left is ventricular ejection; and the vertical descent on the left is isovolu-metric relaxation. The increase in volume during isovolumetric relaxation is due to aorticregurgitation. Note the reduction in LVEDP, LVEDV, and stroke volume at the higher heartrate (subject 2).
was present in five and left arterial enlarge-ment in two. Comparing the subject's esti-mated to predicted maximum oxygen con-sumption it was found that three subjects hadno functional aerobic impairment, one hadminimal impairment (4%), and four weremoderately impaired (13-46%). This assess-ment of functional capacity compared wellwith the New York Heart Association classifi-cation. Both subjects in functional class Ishowed no aerobic impairment, and the onesubject in functional class III showed thehighest degree of aerobic impairment (46%).The hemodynamic measurements at normal
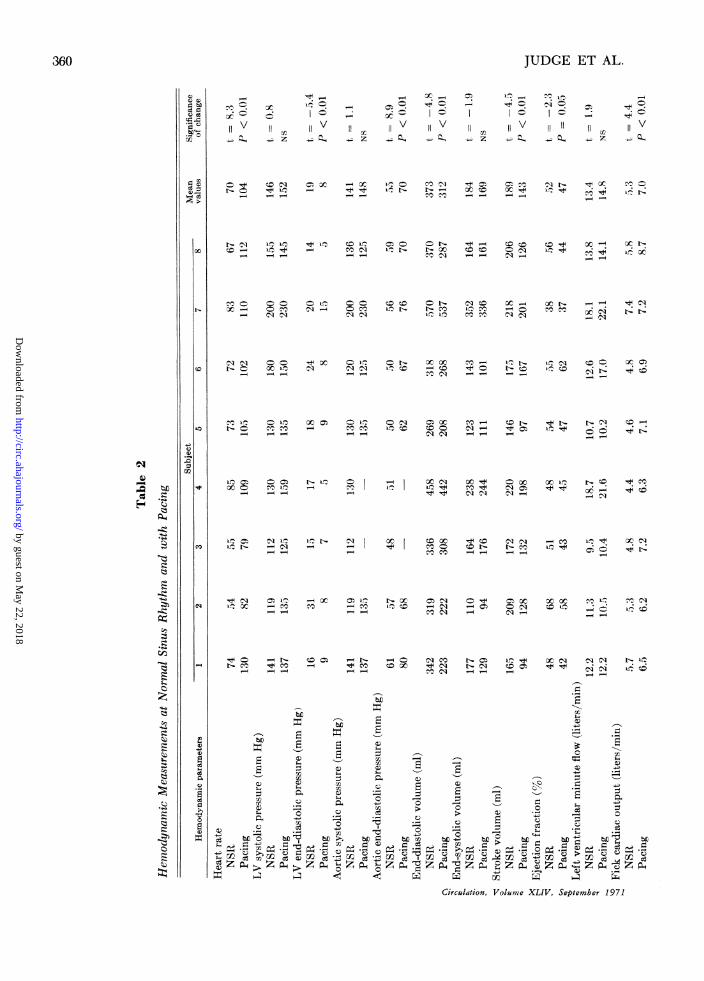
sinus rhythm and at the higher heart rateinduced by atrial pacing in the eight subjectsare listed in table 2. The last columns in thetable represent mean values for the group andthe statistical significance of the changesobserved at the higher heart rate. The heartrate at normal sinus rhythm ranged from 54 toCirculation, Volume XLIV, September 1971
85 (mean = 70) and with pacing increased to79 to 130 (mean = 104).
Left ventricular systolic (LVSP) and end-diastolic pressures (LVEDP) and their re-spective changes with atrial pacing arerepresented in figure 2. LVSP rose in five andfell in three with the increased heart rate. Inall subjects at their resting heart rates,LVEDP was abnormally elevated, rangingfrom 14 to 31 mm Hg. With atrial pacingLVEDP was reduced in all and became nor-mal in seven of the eight subjects, the meanvalue falling significantly from 19 to 8 mmHg (P<0.01).
In six of the eight subjects aortic and leftventricular pressures were measured simul-taneously. Peak aortic systolic pressures forthese six subjects did not change significantlywith pacing. The aortic pressure at end-diastole for this group rose significantly from55 to 70 mm Hg (P<0.01).
Left ventricular systolic pressure and left ventricular end-diastolic pressure in each subjectwith their respective changes with atrial pacing. In this and the subsequent figures thesubjects are identified by number. The open bar in the center represents the normal ranlgefor that parameter. Note the consistent fall in LVEDP at the higher rate.
Left ventricular end-diastolic volume(LVEDV), end-systolic volume (LVESV),and stroke volume with their respectivechanges with atrial pacing are represented infigure 3. Resting LVEDV was markedlyelevated in all subjects, ranging from 269 to570 ml, and consistently fell with increasedheart rate. As a group, the average LVEDVfell from 373 to 312 ml (P < 0.01). TheLVESV did not change significantly withpacing. Left ventricular stroke volume was
consistently and significantly reduced in allsubjects with the increased heart rate. Theejection fraction (percent of end-diastolicvolume ejected in one beat) fell slightly inseven of eight subjects with pacing. As a
group it fell from 52 to 47%, a borderlinesignificant change (P = 0.05).The left ventricular minute flow (LVMF),
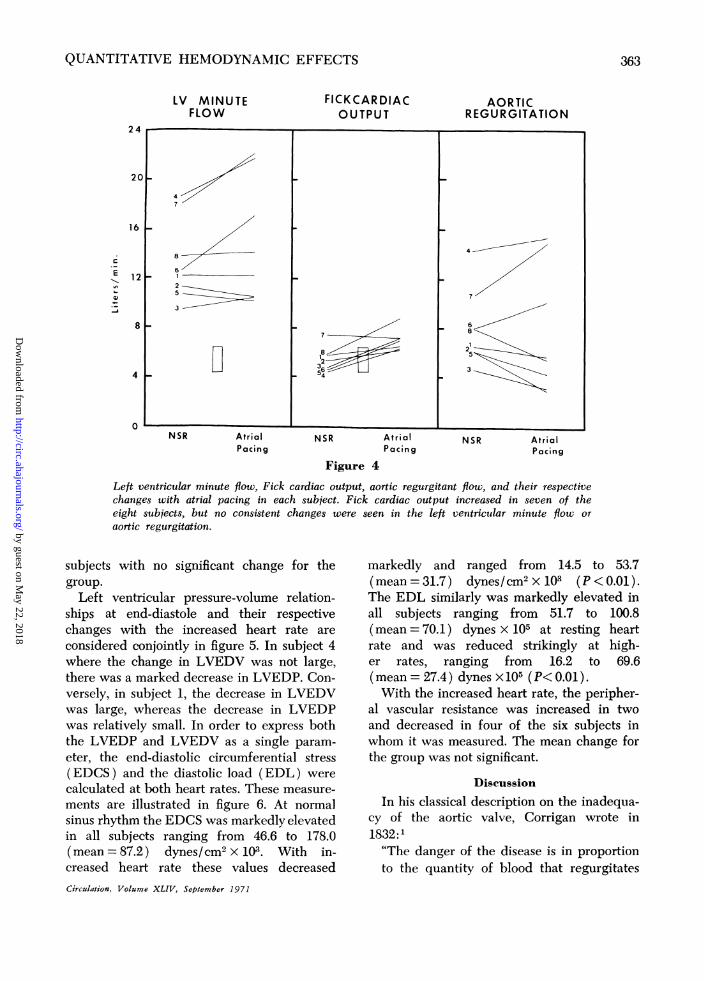
forward (Fick) cardiac output (FCO), andaortic regurgitant flow are shown on figure 4.LVMF increased in four subjects, fell slightlyin subjects no. 2 and 5, and remained
Crculation, Volume XLIV, September 1971
essentially the same in subjects no. 1 and 8. Asa group, the LVMF did not change signifi-cantly. Seven of the eight subjects had a
normal forward cardiac output at their restingsinus rate, ranging from 4.4 to 5.7 liters/min,and in one subject (no. 7) it was slightlyelevated at 7.4 liters/min. With atrial pacing
the forward cardiac output increased in seven
and fell minimally in subject no. 7. The mean
increased from 5.3 to 7.0 liters/min (P <0.01). The aortic regurgitant flow per min-ute ranged from 4.7 to 14.3 liters/min at theresting heart rates. With pacing there was no
consistent change in regurgitant flow per
minute, decreasing in five and increasing inthree subjects. As a group, the mean changewas not significant. There was a tendencyhowever for those with moderate aorticregurgitation to decrease their regurgitantflow at the higher heart rate (subjects 1, 2, 3,5, and 8) and those with severe aorticregurgitation to increase the regurgitant flow(subjects 4, 6, and 7) with pacing. The
Left ventricular end-diastolic volume, end-systolic volume, stroke volume, and their respectivechanges induced by atrial pacing in each subject. Note the consistent fall in LVEDV andstroke volume at the higher rate.
volume of regurgitant flow per stroke, how-ever, decreased in seven and increased min-imally in subject no. 7. The mean regurgitantflow per stroke for the group fell from 111 to73 ml (P< 0.01).As expected, the diastolic period per beat
decreased at the higher rate, from a mean of0.54 to 0.34 sec. Diastolic period per minutealso consistently fell with pacing from 36.6 to33.9 sec. The aortic-left ventricular mean
diastolic gradient was measured in six of theeight subjects and was increased in all six atthe higher heart rate. The average mean
diastolic gradient for the group increased from55 to 66 mm Hg (P<0.O1). This change isconsistent with the decrease in left ventricularend-diastolic pressure and the elevation ofaortic end-diastolic pressure seen in all sub-jects at higher heart rates. The diastolicgradient per minute is representative of theforce per unit time (1 min) acting to cause
the regurgitant flow. This did not change
significantly, increasing in four and decreasingin two of the six subjects in whom it was
measured.The calculated regurgitant valve area did
not act as a fixed orifice with the increasedheart rate increasing in three and decreasingin three of the six subjects in whom it was
measured. As a group, however, the average
regurgitant valve area did not change signifi-cantly.As mentioned, stroke volume decreased at
the higher rate in all subjects, but leftventricular systolic pressure rose in five of theeight subjects. The resultant left ventricularnet stroke work was increased in two anddecreased in six subjects at the higher heartrate. In two subjects where it increased (no. 3and 4), the relatively small decrease in strokevolume was offset by a larger increase in leftventricular systolic pressure. Net work per
minute increased in four and decreased in fourCirculation, Volume XLIV. September 1971
Figure 4Left ventricular minute flow, Fick cardiac output, aortic regurgitant flow, and their respectivechanges with atrial pacing in each subject. Fick cardiac output increased in seven of theeight subjects, but no consistent changes were seen in the left ventricular minute flow or
aortic regurgitation.
subjects with no significant change for thegroup.
Left ventricular pressure-volume relation-ships at end-diastole and their respectivechanges with the increased heart rate are
considered conjointly in figure 5. In subject 4where the change in LVEDV was not large,there was a marked decrease in LVEDP. Con-versely, in subject 1, the decrease in LVEDVwas large, whereas the decrease in LVEDPwas relatively small. In order to express boththe LVEDP and LVEDV as a single param-
eter, the end-diastolic circumferential stress(EDCS) and the diastolic load (EDL) were
calculated at both heart rates. These measure-
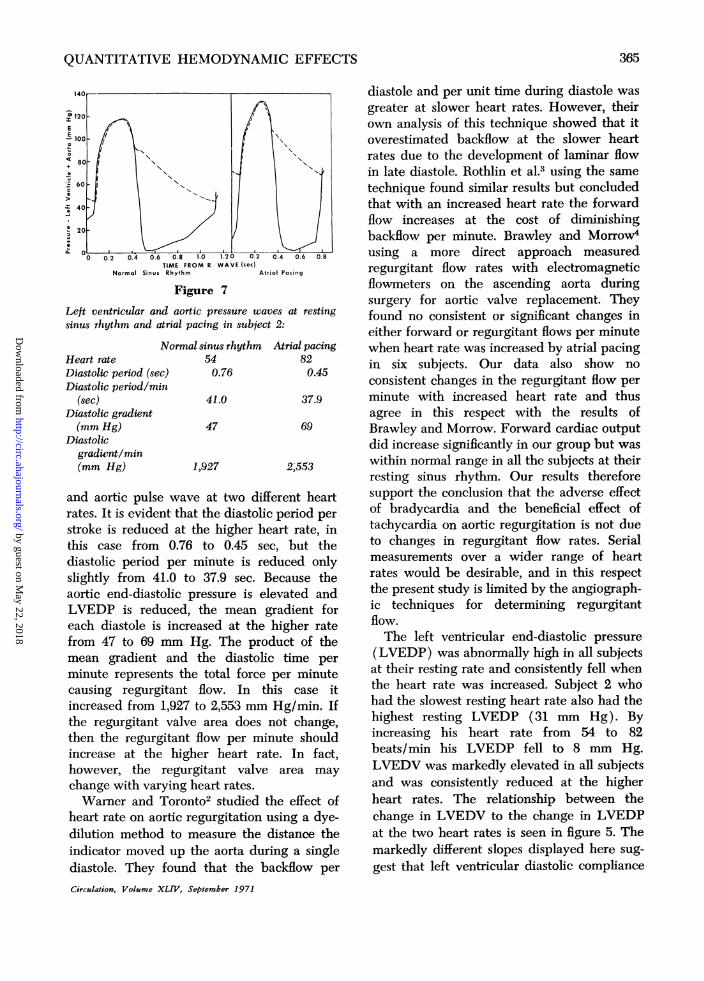
ments are illustrated in figure 6. At normal
sinus rhythm the EDCS was markedly elevatedin all subjects ranging from 46.6 to 178.0(mean = 87.2) dynes/cm2 x 103. With in-creased heart rate these values decreased
markedly and ranged from 14.5 to 53.7(mean=31.7) dynes/cm2x103 (P<0.01).The EDL similarly was markedly elevated inall subjects ranging from 51.7 to 100.8(mean = 70.1) dynes x 105 at resting heartrate and was reduced strikingly at high-er rates, ranging from 16.2 to 69.6(mean = 27.4) dynes x 105 (P< 0.01).With the increased heart rate, the peripher-
al vascular resistance was increased in twoand decreased in four of the six subjects inwhom it was measured. The mean change forthe group was not significant.
Discussion
In his classical description on the inadequa-cy of the aortic valve, Corrigan wrote in1832:'"The danger of the disease is in proportionto the quantity of blood that regurgitates
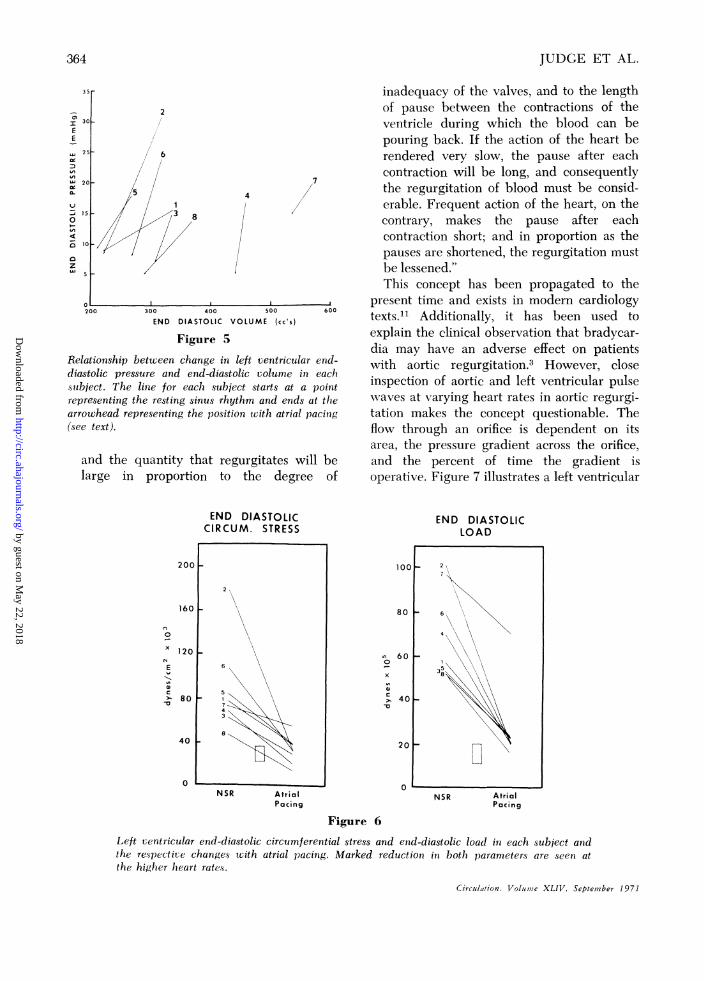
Relationship between change in left ventricular end-diastolic pressure and end-diastolic volume in eachsubject. The linie for each subject starts at a pointrepresenting the resting sinus rhythm and ends at thearrowhead representing the position with atrial pacing(see text).
and the quantity that regurgitates will belarge in proportion to the degree of
inadequacy of the valves, and to the lengthof pause between the contractions of theventricle during which the blood can bepouring back. If the action of the heart berendered very slow, the pause after eachcontraction will be long, and consequentlythe regurgitation of blood must be consid-erable. Frequent action of the heart, on thecontrary, makes the pause after eachcontraction short; and in proportion as thepauses are shortened, the regurgitation mustbe lessened."This concept has been propagated to the
present time and exists in modern cardiologytexts.1' Additionally, it has been used toexplain the clinical observation that bradyear-dia may have an adverse effect on patientswith aortic regurgitation.3 However, closeinspection of aortic and left ventricular pulsewaves at varying heart rates in aortic regurgi-tation makes the concept questionable. Theflow through an orifice is dependent on itsarea, the pressure gradient across the orifice.and the percent of time the gradient isoperative. Figure 7 illustrates a left ventricular
END DIASTOLICCIRCUM. STRESS
NSR AtrialPacing
100
80 I
a)
60 F
401
20
0
END DIASTOLICLOAD
2
6
358
NSR AtrialPacing
Figure 6
Left ventricular end-diastolic circumferential stress and end-diastolic load in each subject andthe respective changes with atrial pacing. Marked reduction in both parameter's are seen atthe higher heart rates.
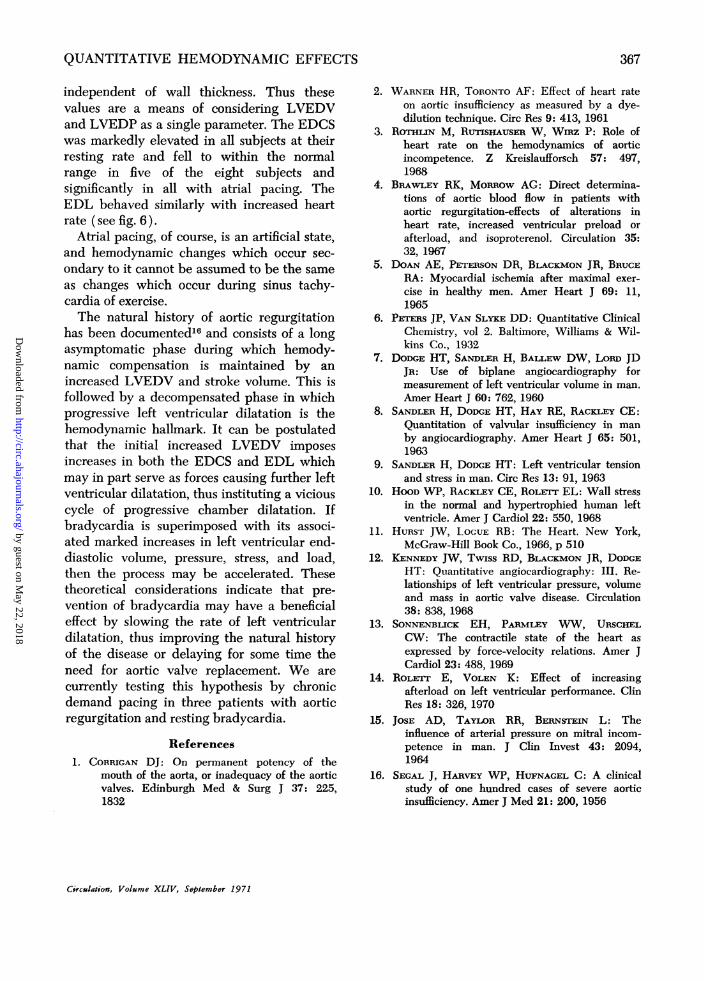
TIME FROM R WAVE (sec)Normal Sinus Rhythm Atrial Pacing
Figure 7
Left ventricular and aortic pressure waves at restingsinus rhythm and atrial pacing in subject 2:
N
Heart rateDiastolic period (sec)Diastolic period/min
(sec)Diastolic gradient(mm Hg)
Diastolicgradient/min(mm Hg)
ormal sinus rhythm Atrial pacing54 820.76 0.45
41.0 37.9
47 69
1,927 2,553
and aortic pulse wave at two different heartrates. It is evident that the diastolic period per
stroke is reduced at the higher heart rate, inthis case from 0.76 to 0.45 sec, but thediastolic period per minute is reduced onlyslightly from 41.0 to 37.9 sec. Because theaortic end-diastolic pressure is elevated andLVEDP is reduced, the mean gradient foreach diastole is increased at the higher ratefrom 47 to 69 mm Hg. The product of themean gradient and the diastolic time per
minute represents the total force per minutecausing regurgitant flow. In this case itincreased from 1,927 to 2,553 mm Hg/min. Ifthe regurgitant valve area does not change,then the regurgitant flow per minute shouldincrease at the higher heart rate. In fact,however, the regurgitant valve area may
change with varying heart rates.Warner and Toronto2 studied the effect of
heart rate on aortic regurgitation using a dye-dilution method to measure the distance theindicator moved up the aorta during a singlediastole. They found that the backflow per
Circulation, Volume XLIV, September 1971
diastole and per unit time during diastole wasgreater at slower heart rates. However, theirown analysis of this technique showed that itoverestimated backflow at the slower heartrates due to the development of laminar flowin late diastole. Rothlin et al.3 using the sametechnique found similar results but concludedthat with an increased heart rate the forwardflow increases at the cost of diminishingbackflow per minute. Brawley and Morrow4using a more direct approach measuredregurgitant flow rates with electromagneticflowmeters on the ascending aorta duringsurgery for aortic valve replacement. Theyfound no consistent or significant changes ineither forward or regurgitant flows per minutewhen heart rate was increased by atrial pacingin six subjects. Our data also show noconsistent changes in the regurgitant flow perminute with increased heart rate and thusagree in this respect with the results ofBrawley and Morrow. Forward cardiac outputdid increase significantly in our group but waswithin normal range in all the subjects at theirresting sinus rhythm. Our results thereforesupport the conclusion that the adverse effectof bradycardia and the beneficial effect oftachycardia on aortic regurgitation is not dueto changes in regurgitant flow rates. Serialmeasurements over a wider range of heartrates would be desirable, and in this respectthe present study is limited by the angiograph-ic techniques for determining regurgitantflow.The left ventricular end-diastolic pressure
(LVEDP) was abnormally high in all subjectsat their resting rate and consistently fell whenthe heart rate was increased. Subject 2 whohad the slowest resting heart rate also had thehighest resting LVEDP (31 mm Hg). Byincreasing his heart rate from 54 to 82beats/min his LVEDP fell to 8 mm Hg.LVEDV was markedly elevated in all subjectsand was consistently reduced at the higherheart rates. The relationship between thechange in LVEDV to the change in LVEDPat the two heart rates is seen in figure 5. Themarkedly different slopes displayed here sug-gest that left ventricular diastolic compliance
is highly variable in this disease. Thus sub-ject 1 showed a large change in LVEDV anda relatively small change in LVEDP suggest-ing a high compliance value; whereas, subject4 showed a large change in LVEDP and a
very small change in LVEDV suggesting lowcompliance. LVEDP in aortic regurgitation istherefore determined by the amount of aorticregurgitation per beat, the heart rate, the end-diastolic volume, and the compliance of thediastolic left ventricular cavity. It is evidentfrom these hemodynamic studies that theLVEDP alone cannot be used as a parameterto judge the functional characteristics of theleft ventricle or as a guide to the severity ofaortic regurgitation without consideration ofthese other variables. The lack of correlationbetween LVEDP and LVEDV in aorticregurgitation has been reported previouslyfrom this laboratory.12 Our data suggest thatthe adverse effect of bradyeardia in aorticregurgitation is due to high left ventricularend-diastolic pressure and associated pulmo-nary congestion.
In addition to the LVEDV, the strokevolume also fell in all subjects, and theejection fraction fell in seven of the eightsubjects. This is consistent with the Starlingprinciple in which a decreased end-diastolicfiber length (decreased end-diastolic volume)is associated with a decrease in the extent offiber shortening during contraction therebyreducing the ejection fraction. This was notthe case in subject 6 where the ejection frac-tion increased from 55 to 62% at the higherrate. This subject was the only one to demon-strate a marked reduction in afterload at thehigher heart rate reducing his peak left ven-
tricular systolic pressure from 180 to 150 mmHg. It is reasonable to conclude that the im-provement in left ventricular function imposedby the reduction in afterload more than offsetthe Starling effect resulting in an increasedejection fraction. The beneficial effect of a
reduced afterload has been demonstrated inboth isolated cardiac muscle'3 and in theintact heart.'4
Subject 7 differed from the group in severalrespects. Clinically he was the most incapaci-
tated, with a functional aerobic impairment of46%. His very large LVEDV and high LVEDPchanged little with the increased heart rate,and his low ejection fraction did not signifi-cantly change at the higher rate. Additionally,his regurgitant flow increased markedly andhis Fick cardiac output actually fell at thehigher heart rate. Perhaps these observationsare characteristic of severe chronic aorticregurgitation and reflect changes in ventricu-lar compliance or marked depression ofventricular function.As a group, no significant changes were
observed in the calculated regurgitant valveareas at the increased heart rate, but moderatedegrees of change were noted in each of thesix subjects in whom it was measured.Brawley and Morrow4 also documentedmoderate but not directionally consistentchanges in the aortic regurgitant valve areawith increasing heart rates. Marked changes inthe calculated regurgitant orifice under dy-namic conditions have also been reported inthe mitral area.15 Calculated regurgitantorifices are best considered as functionalplastic areas which change throughout thediastolic period in response to continuouslychanging pressure gradients and flows.Although left ventricular stroke volume was
reduced in all subjects at the higher heart rate,the effect of pacing on the left ventricularsystolic pressure was variable. The resultantchange in net stroke work (pressure-volumework) was not consistent, increasing in twoand decreasing in six subjects. Net work perminute did not significantly change in thegroup, increasing in four and decreasing infour subjects.The most striking changes occurring in this
study were seen in the end-diastolic circum-ferential stress (EDCS) and end-diastolicload (EDL). The EDCS is that force presentin the end-diastolic myocardial wall per unitcross-sectional area and is directly propor-tional to pressure and volume and inverselyproportional to wall thickness. The EDL is theforce acting on the total internal surface areaof the ventricle at end-diastole and is directlyproportional to pressure and volume but
independent of wall thickness. Thus thesevalues are a means of considering LVEDVand LVEDP as a single parameter. The EDCSwas markedly elevated in all subjects at theirresting rate and fell to within the normalrange in five of the eight subjects andsignificantly in all with atrial pacing. TheEDL behaved similarly with increased heartrate (see fig. 6).
Atrial pacing, of course, is an artificial state,and hemodynamic changes which occur sec-ondary to it cannot be assumed to be the sameas changes which occur during sinus tachy-cardia of exercise.The natural history of aortic regurgitation
has been documented16 and consists of a longasymptomatic phase during which hemody-namic compensation is maintained by anincreased LVEDV and stroke volume. This isfollowed by a decompensated phase in whichprogressive left ventricular dilatation is thehemodynamic hallmark. It can be postulatedthat the initial increased LVEDV imposesincreases in both the EDCS and EDL whichmay in part serve as forces causing further leftventricular dilatation, thus instituting a viciouscycle of progressive chamber dilatation. Ifbradyeardia is superimposed with its associ-ated marked increases in left ventricular end-diastolic volume, pressure, stress, and load,then the process may be accelerated. Thesetheoretical considerations indicate that pre-vention of bradycardia may have a beneficialeffect by slowing the rate of left ventriculardilatation, thus improving the natural historyof the disease or delaying for some time theneed for aortic valve replacement. We arecurrently testing this hypothesis by chronicdemand pacing in three patients with aorticregurgitation and resting bradyeardia.
References1. CORRIGAN DJ: On permanent potency of the
mouth of the aorta, or inadequacy of the aorticvalves. Edinburgh Med & Surg J 37: 225,1832
2. WARNER HR, TORONTO AF: Effect of heart rateon aortic insufficiency as measured by a dye-dilution technique. Cire Res 9: 413, 1961
3. ROTHLIN M, RusnHAusER W, Wmz P: Role ofheart rate on the hemodynamics of aorticincompetence. Z Kreislaufforsch 57: 497,1968
4. BRAWLEY RK, MoRmow AG: Direct determina-tions of aortic blood flow in patients withaortic regurgitation-effects of alterations inheart rate, increased ventricular preload orafterload, and isoproterenol. Circulation 35:32, 1967
5. DOAN AE, PETERSON DR, BLACKMON JR, BRUCERA: Myocardial ischemia after maximal exer-cise in healthy men. Amer Heart J 69: 11,1965
6. PhcrETS JP, VAN SLYKE DD: Quantitative ClinicalChemistry, vol 2. Baltimore, Williams & Wil-kins Co., 1932
7. DODGE HT, SANDLER H, BALLEW DW, Lonn JDJR: Use of biplane angiocardiography formeasurement of left ventricular volume in man.Amer Heart J 60: 762, 1960
8. SANDLER H, DODGE HT, HAY RE, RACKLEY CE:Quantitation of valvular insufficiency in manby angiocardiography. Amer Heart J 65: 501,1963
9. SANDLER H, DODGE HT: Left ventricular tensionand stress in man. Circ Res 13: 91, 1963
10. HOOD WP, RACKLEY CE, ROLETT EL: Wall stressin the normal and hypertrophied human leftventricle. Amer J Cardiol 22: 550, 1968
11. HURST JW, LOGUE RB: The Heart. New York,McGraw-Hill Book Co., 1966, p 510
12. KENNEDY JW, Twiss RD, BLACKMON JR, DODGEHT: Quantitative angiocardiography: III. Re-lationships of left ventricular pressure, volumeand mass in aortic valve disease. Circulation38: 838, 1968
13. SONNENBLICK EH, PARMLEY WW, URSCHELCW: The contractile state of the heart asexpressed by force-velocity relations. Amer JCardiol 23: 488, 1969
14. RoLETT E, VOLEN K: Effect of increasingafterload on left ventricular performance. ClinRes 18: 326, 1970
15. JOSE AD, TAYLOR RR, BERNsTEIN L: Theinfluence of arterial pressure on mitral incom-petence in man. J Clin Invest 43: 2094,1964
16. SEGAL J, HARvEY WP, HUFNAGEL C: A clinicalstudy of one hundred cases of severe aorticinsufficiency. Amer J Med 21: 200, 1956
http://circ.ahajournals.org/content/44/3/355located on the World Wide Web at:
The online version of this article, along with updated information and services, is
http://circ.ahajournals.org//subscriptions/
is online at: Circulation Information about subscribing to Subscriptions:
http://www.lww.com/reprints Information about reprints can be found online at: Reprints:
document. Permissions and Rights Question and Answer
of the Web page under Services. Further information about this process is available in thewhich permission is being requested is located, click Request Permissions in the middle columnClearance Center, not the Editorial Office. Once the online version of the published article for
can be obtained via RightsLink, a service of the CopyrightCirculationoriginally published in Requests for permissions to reproduce figures, tables, or portions of articlesPermissions: