12
Henderson Global Investors Analyst Briefing September 2015 Roger Thompson Chief Financial Officer Miriam McKay Head of Investor Relations

Henderson Global Investors Analyst Briefing
September 2015
Roger Thompson
Chief Financial Officer
Miriam McKay
Head of Investor Relations

2
1H15 1H14 Change
3 year investment
performance¹ 83% 86%
Net flows £5.6bn £5.0bn
Total AUM £82.1bn £74.7bn
Underlying PBT² £117.4m £90.7m
Underlying
diluted EPS² 8.9p 6.8p
Interim dividend
per share 3.10p 2.60p
1H15 highlights
Strong investment performance
Net inflows of £5.6bn
AUM increased to £82.1bn
Increased underlying profit and EPS
Share buyback launched to deploy
excess capital for shareholder benefit
1 Percentage of funds, asset-weighted, outperforming relevant metric.
² Based on continuing operations.
3
40
50
60
70
80
90
100
1 Jan 15 Market/FX Net flows Disposals &transfers
Acquisitions 30 Jun 15
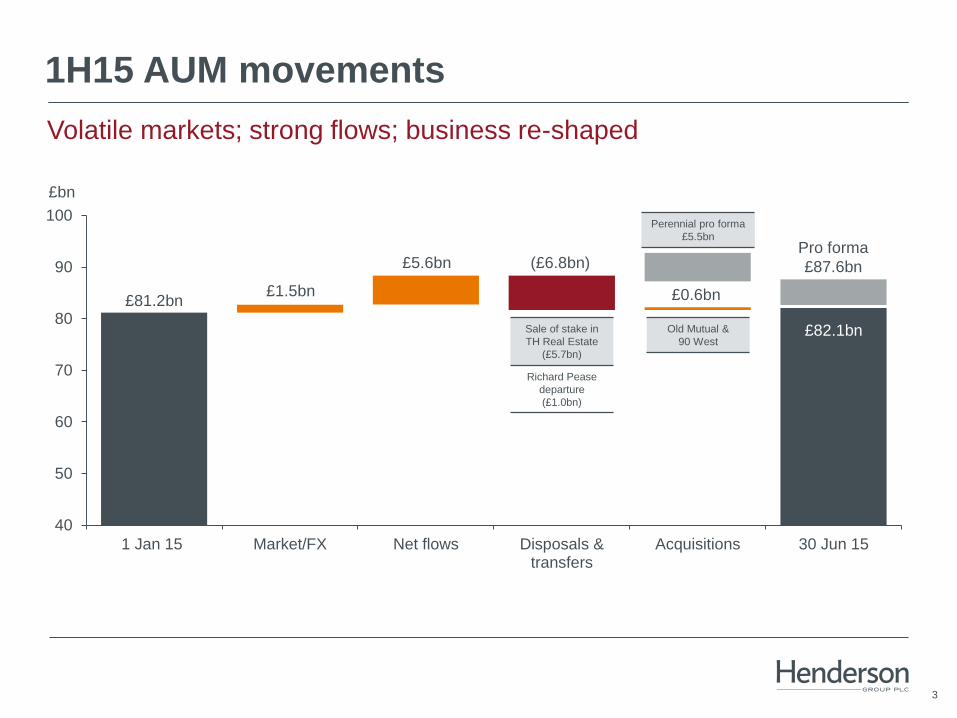
1H15 AUM movements
Volatile markets; strong flows; business re-shaped
£5.6bn
£bn
£82.1bn
Pro forma
£87.6bn
£81.2bn £1.5bn
Sale of stake in
TH Real Estate
(£5.7bn)
Richard Pease
departure
(£1.0bn)
Old Mutual &
90 West
Perennial pro forma
£5.5bn
(£6.8bn)
£0.6bn

4
Core capabilities AUM² 1 year1,2 3 years1,2
European Equities £18.2bn
Global Equities £26.0bn
Global Fixed Income £20.6bn
Multi-Asset £5.1bn
Alternatives £12.2bn
Total £82.1bn
1st quartile/outperform/positive 2nd quartile 3rd quartile 4th quartile/underperform/negative
1 Percentage of funds, asset-weighted, that are outperforming based on the relevant metric: peer quartile ranking for Retail, positive for absolute return, positive versus
benchmark for institutional. 2 Data as at 30 Jun 15.
Consistently strong investment performance
83% of funds outperformed over three years
91%
69%
80%
93%
100%
90%
79%
54%
70%
87%
83% 76%
5
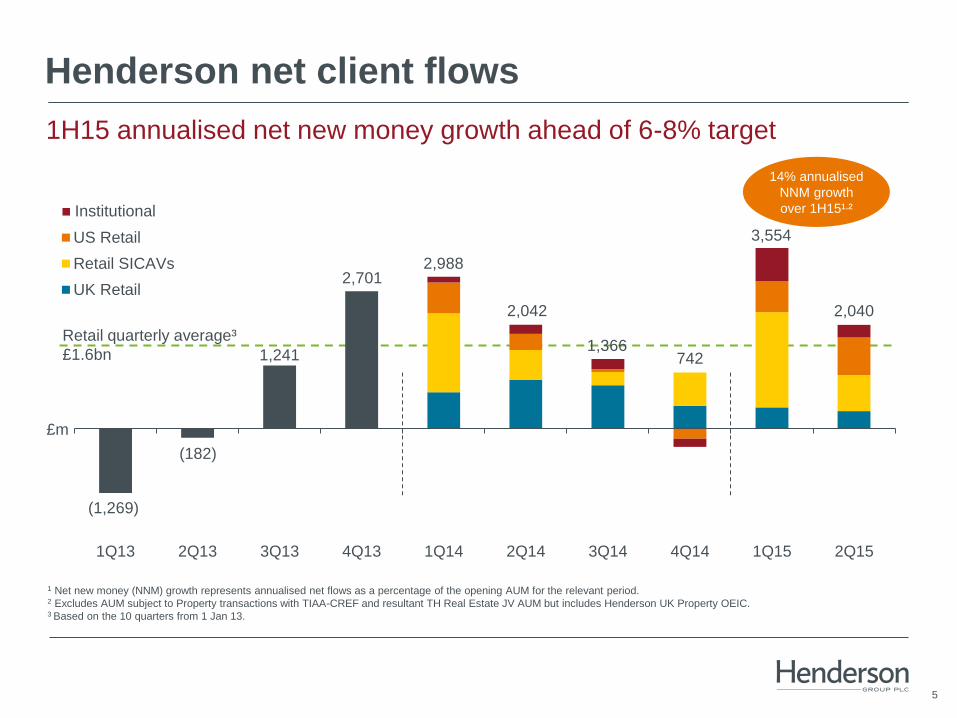
1Q13 2Q13 3Q13 4Q13 1Q14 2Q14 3Q14 4Q14 1Q15 2Q15
US Retail
Retail SICAVs
UK Retail
Henderson net client flows
1H15 annualised net new money growth ahead of 6-8% target
(1,269)
(182)
1,241
2,701 2,988
2,042
£m
Institutional
1 Net new money (NNM) growth represents annualised net flows as a percentage of the opening AUM for the relevant period. 2 Excludes AUM subject to Property transactions with TIAA-CREF and resultant TH Real Estate JV AUM but includes Henderson UK Property OEIC. 3 Based on the 10 quarters from 1 Jan 13.
1,366 742
3,554
Retail quarterly average³
£1.6bn
2,040
14% annualised
NNM growth
over 1H15¹,²

6
Management fee margins
bps
Note: Management fees and margins are calculated on total AUM, excluding JV AUM where the AUM is neither contracted to Henderson nor sub-advised to Henderson.
55.1
75.0
33.8
56.5
75.0
38.9
56.3
74.0
29.5
57.8
74.0
30.2
56.7
74.1
27.9
0.0
10.0
20.0
30.0
40.0
50.0
60.0
70.0
80.0
Total management fee margin Management fee margin - Retail Management fee margin - Institutional
FY11
FY12
FY13
FY14
1H15

7
Operating margin and compensation ratio
Operating leverage starting to come through
42.4 41.4
45.4 44.8 44.7 44.5
34.8 34.1
35.7 35.0 35.5
36.3
25
30
35
40
45
50
FY11 FY12 FY13 1H14 FY14 1H15
Compensation ratio¹, ²
Operating margin³
%
1 All prior periods have been restated to reflect the exclusion of finance income from the denominator and certain costs such as training and recruitment costs from staff expenses. 2 Total staff compensation and benefits from continuing operations, divided by net fee income from continuing operations. 3 Net fee income from continuing operations less total operating expenses from continuing operations, divided by net fee income from continuing operations.

8
Capital management
• Active management of our cash and capital resources
• Options for capital deployment • Invest organically in growth
• Invest in inorganic growth
• Return capital to shareholders
• Initiation of share buyback programme in 2H15, based on strong cash flows
and capital strength
• Shares to the value of £25.0m to be bought across LSE and ASX listings, by
year end

9
Strategy is delivering
0
20
40
60
80
100
120
140
AUMFY13¹
Net newmoney
Market/FX
Acquisitions AUMFY18¹
£bn
1 Excludes AUM subject to Property transactions with TIAA-CREF and resultant TH Real Estate JV AUM but includes Henderson UK Property OEIC.
£63.7bn
Target: 6-8% pa
18mths to Jun 15:
13% pa
AUM
doubled
Target: 4-6% pa
18mths to Jun 15:
6% pa
Target: 2-4% pa
18mths to Jun 15:
1% pa
• Above industry net new money growth
• Strong investment performance
• Carefully targeted investment • Investment management capabilities
• Client relationships
• Global platforms
• Operational leverage
• Disciplined use of capital
10
Market backdrop and regulatory environment
Market backdrop
• Market fundamentals relatively
positive
• Investor confidence remains
fragile
• Key issues for clients • Positioning for rate rises and the
end of QE
• Fixed income liquidity
Regulatory environment
• Increased scrutiny of asset
managers, specifically in Europe
• Implementation of far-reaching
regulatory change
• Regulation is consuming
increasing amounts of
management time and headcount
11
Outlook – September 2015
• Flows “normalised” in July and were slightly positive in August
• We remain cautious about the outlook for industry flows in 3Q15
• Henderson remains well positioned to outperform the market • Active investment management philosophy delivering excellent investment
performance for clients
• Increasingly diverse client base and product line
• Growing brand recognition
• We remain focused on delivering our long-term goals

12
Q&A


