42
Hendrik F. Hamann et al. T.J. Watson Research Center, New York, USA Cognitive Internet of Things * Steve Lohr, NY Times, “Data-ism”

Hendrik F. Hamann et al.T.J. Watson Research Center, New York, USA
Cognitive Internet of Things
* Steve Lohr, NY Times, “Data-ism”

©2015 IBM Corporation 27 April 20162
Outline
Trends - Internet of Things Research experimental platform for Cognitive IoT
IoT sensornetworks
Physical model complexity reduction
Energy efficiency in buildings / data centers
Simulation andmodel outputs
Situation-dependent, machine-learnt, multi-model blending
Renewable energy forecasts / Pollution managements
Satellite observations and IoT sensors
Statistical tuned evapo-transpiration model
Water efficiency and yields in agriculture
“Big” Data
Physical Analytics
Application & Solution
©2015 IBM Corporation 27 April 20163
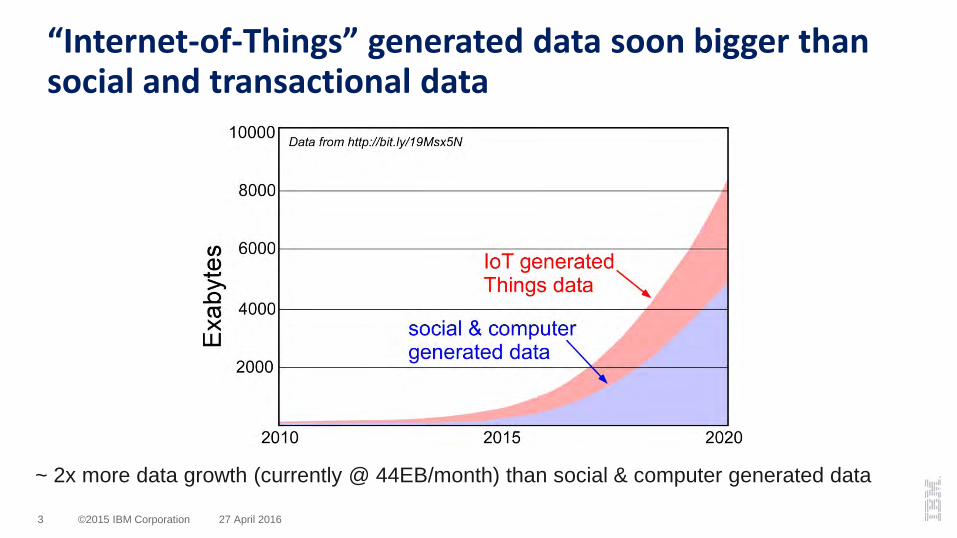
“Internet-of-Things” generated data soon bigger than social and transactional data
~ 2x more data growth (currently @ 44EB/month) than social & computer generated data

©2015 IBM Corporation 27 April 20164
Data from remote sensors is exploding
Number of satellite launches are growing exponentially− Many countries have re-started major satellite programs (China, Europe, India etc.)− Cube satellites, Nano-satellites
Drones, cell phone with hyper-spectral cameras
Satellites around the Earth

©2015 IBM Corporation 27 April 20165
The physical world is being digitized….
Auckland, New Zealand seen at 30 cm resolution. Photo: DigitalGlobe

©2015 IBM Corporation 27 April 20166
Traditional (physical) industries are being transformed by (IoT) data
Industry Past – Selling a Product Future - Service
Healthcare Diabetes pumps Diabetes care
Agriculture Seeds Crop yields
Consumer Packaged goods Nutrition
Automotive Cars Transportation
… … …
IT Industry Computers Computation
McKinsey, GE, IBM, Cisco et al. estimate hundreds of billions dollar savings/efficiency improvements in the next 10 years
©2015 IBM Corporation 27 April 20166

©2015 IBM Corporation 27 April 20167
Watson IoT is a brand new IBM business unit headquartered in Munich, Germany
1. Watson Analytics• Physical Analytics
Industry solutions
2. Security, Privacy and Trust• IBM Security 360
3. Platforms• Bluemix
IBM Research prototypes and develops new technologies and solutions
My role…Pioneered Physical Analytics in Research the last 1o years

©2015 IBM Corporation 27 April 20168
But “closing-the-loop” for complex systems will require more “physical” intelligence
Gap
©2015 IBM Corporation 27 April 20168
©2015 IBM Corporation 27 April 20169
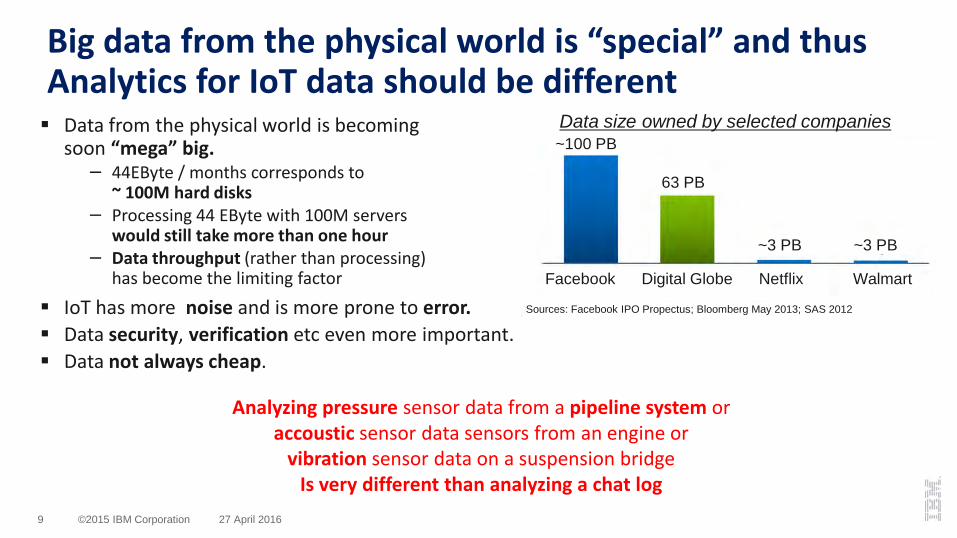
Big data from the physical world is “special” and thus Analytics for IoT data should be different Data from the physical world is becoming
soon “mega” big.− 44EByte / months corresponds to
~ 100M hard disks− Processing 44 EByte with 100M servers
would still take more than one hour− Data throughput (rather than processing)
has become the limiting factor
~100 PB
63 PB
~3 PB ~3 PB
Facebook Digital Globe Netflix Walmart
Sources: Facebook IPO Propectus; Bloomberg May 2013; SAS 2012
Data size owned by selected companies
IoT has more noise and is more prone to error. Data security, verification etc even more important. Data not always cheap.
Analyzing pressure sensor data from a pipeline system or accoustic sensor data sensors from an engine or
vibration sensor data on a suspension bridgeIs very different than analyzing a chat log

©2015 IBM Corporation 27 April 201610
Internet of Things 1.0
(Big) Statistical Analytics
Physical &Engineering
Models
Physical Analytics lies between IoT 1.0, physics-based modeling and big data analytics
Highly inter disciplinary with many interesting research topics Statistical learning under physical constraints Model complexity reduction Situation-dependent, machine-learnt multi-
model blending Graph theory and statistical physics Parallelizing physical models for data-intensive
computation …..
Feed learning back to improve understanding of the underlying physics
Cogn
itive
IoT
©2015 IBM Corporation 27 April 201611
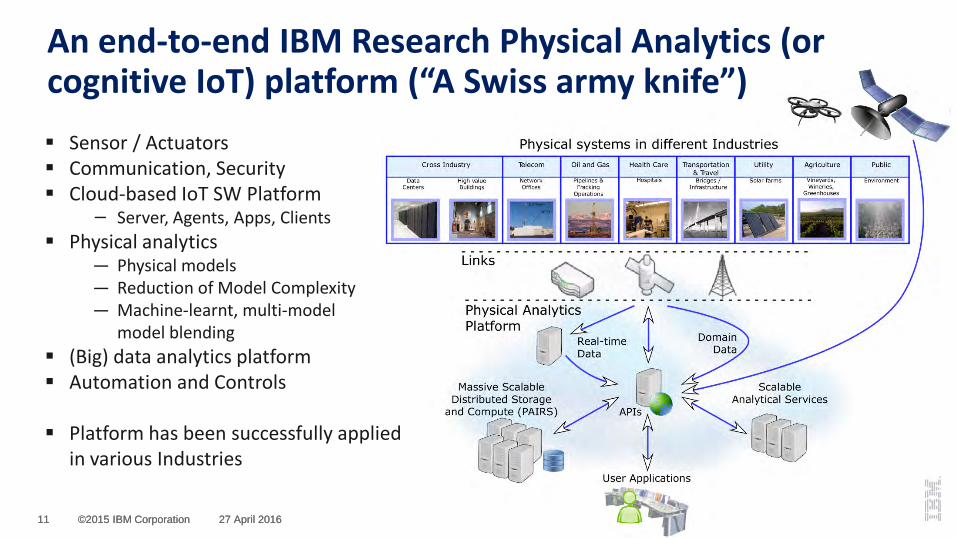
An end-to-end IBM Research Physical Analytics (or cognitive IoT) platform (“A Swiss army knife”) Sensor / Actuators Communication, Security Cloud-based IoT SW Platform
− Server, Agents, Apps, Clients Physical analytics
— Physical models— Reduction of Model Complexity— Machine-learnt, multi-model
model blending (Big) data analytics platform Automation and Controls
Platform has been successfully applied in various Industries
©2015 IBM Corporation 27 April 201611
©2015 IBM Corporation 27 April 201612
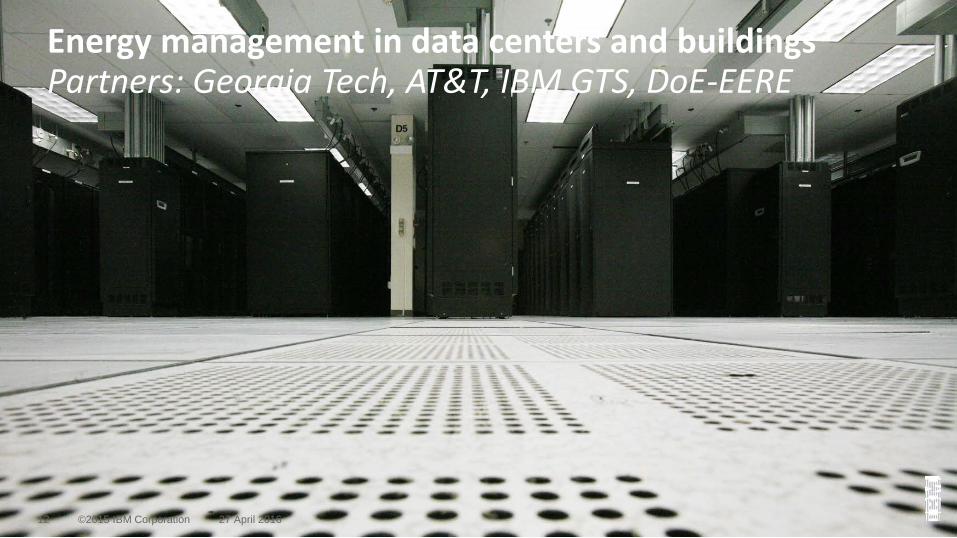
Energy management in data centers and buildingsPartners: Georgia Tech, AT&T, IBM GTS, DoE-EERE
©2015 IBM Corporation 27 April 201612

©2015 IBM Corporation 27 April 201613
PA platform applied to energy management in data centers and buildings
©2015 IBM Corporation 27 April 201613
Sensor / Actuators Communication, Security Cloud-based SW Platform
− Server, Agents, Apps, Clients Physical analytics
— Physical models— Reduction of Model Complexity— Machine-learnt, multi-model
model blending (Big) data analytics platform Automation and controls

©2015 IBM Corporation 27 April 201614
Data Centers are energy hogs
DCs consume ~ 3% of US electricity Annual growth of 15% is unsustainable
(doubles every 5 years) Up to 50% of all energy in data centers
is used for cooling
DC energy demand is surging because ofo insatiable IT demand, which has outpaced
power-performance improvementso power-limited core technology

©2015 IBM Corporation 27 April 201615
Deployed in >180 data centers world-wide Almost 1M sensors supported Example deployment*
− 4300 thermal sensors− 250 pressure sensors− 612 flow sensors− 300 humidity sensors− 1200 power/current sensors− 80 air condition unit controllers
Large-scale sensor & actuator mesh networks deployed around the world
IBM “Mote” provides wireless mesh network communication of sensors and actuators
*for a 10000 m2 data centers

©2015 IBM Corporation 27 April 201616
Energy efficiency improvements require real-time 3D heat distributions? How to get from here….
Sensors Reporting

©2015 IBM Corporation 27 April 201617
Energy efficiency improvements require real-time 3D heat distributions? …to there
©2015 IBM Corporation 27 April 201618
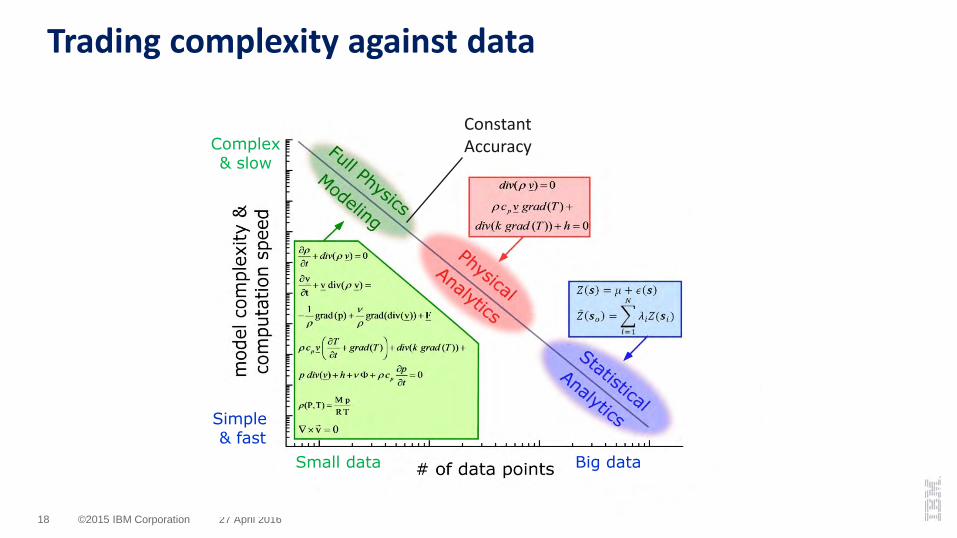
Trading complexity against data
Constant Accuracy
Small data Big data
Simple & fast
Complex & slow
©2015 IBM Corporation 27 April 201619
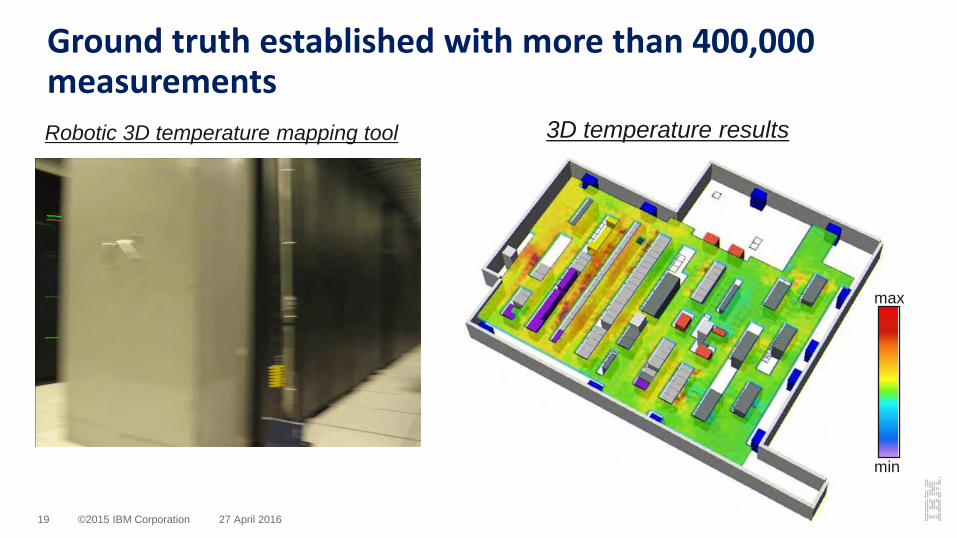
Ground truth established with more than 400,000 measurementsRobotic 3D temperature mapping tool
min
max
3D temperature results

©2015 IBM Corporation 27 April 201620
RMS errors using different modeling approaches
All modeling with the same computational infrastructure
Constant Accuracy
Model complexity can be very effectively reduced and computation time increased using sensor data as boundary conditions.
0

©2015 IBM Corporation 27 April 201621
Operational CFD for (near) real-time heat distributions
~80K ft2 data center Full heat maps every 2 mins Heat distributions show in real-time show overheated
and overcooled areas, which provides energy efficiencies opportunities.
~150 m

©2015 IBM Corporation 27 April 201622
Automatic controlling of cooling saves energyCooling Unit Status and Utilizations
To date: > 900 M kWhour annually savings in WW deployments
Bef
ore:
9 a
mTemperature DistributionsAf
ter:
5 p
m
©2015 IBM Corporation 27 April 201623
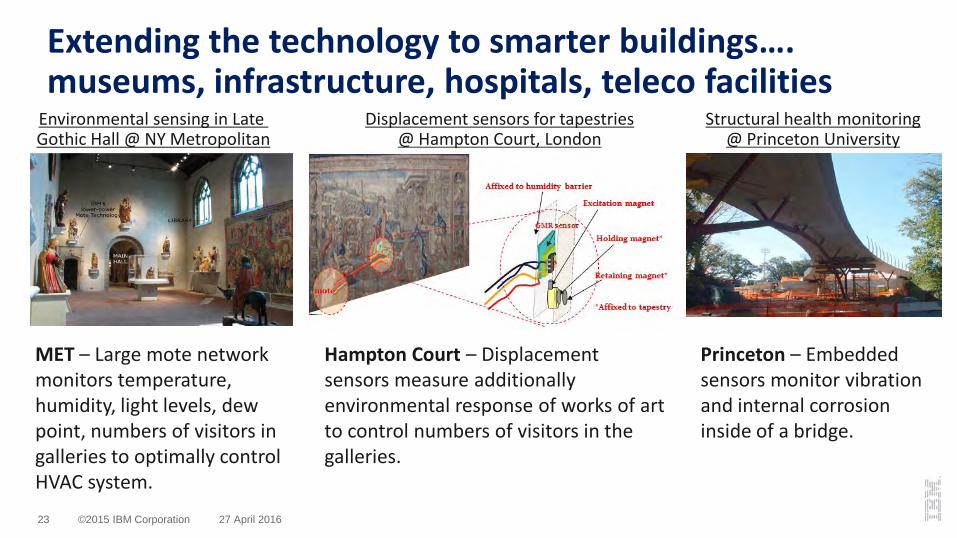
Extending the technology to smarter buildings…. museums, infrastructure, hospitals, teleco facilities
Environmental sensing in Late Gothic Hall @ NY Metropolitan
MET – Large mote network monitors temperature, humidity, light levels, dew point, numbers of visitors in galleries to optimally control HVAC system.
Hampton Court – Displacement sensors measure additionally environmental response of works of art to control numbers of visitors in the galleries.
Displacement sensors for tapestries @ Hampton Court, London
Princeton – Embedded sensors monitor vibration and internal corrosion inside of a bridge.
Structural health monitoring@ Princeton University

©2015 IBM Corporation 27 April 201624
Forecasting renewable energy generationPartners: NREL, ANL, Northeastern, ISO-NE, DoE-Sunshot
©2015 IBM Corporation 27 April 201624

©2015 IBM Corporation 27 April 201625
PA platform applied to forecasting and managing of renewable energy
©2015 IBM Corporation 27 April 201625
Sensor / Actuators Communication, Security Data Management Cloud-based SW Platform
− Server, Agents, Apps, Clients Physical analytics
— Physical models— Reduction of Model Complexity— Machine-learnt, multi-model
model blending (Big) data analytics platform Automation and controls

©2015 IBM Corporation 27 April 201626
Intermittency of renewable energy poses a major problem for the power grid
Example: Solar
Powerneeds
6 days of solar power production Solar power variability:- Minute by minute fluctuating- Mainly affected by local cloud coverage
Forecasting and managing of renewable energy are critical for stability of the power grid.
©2015 IBM Corporation 27 April 201627
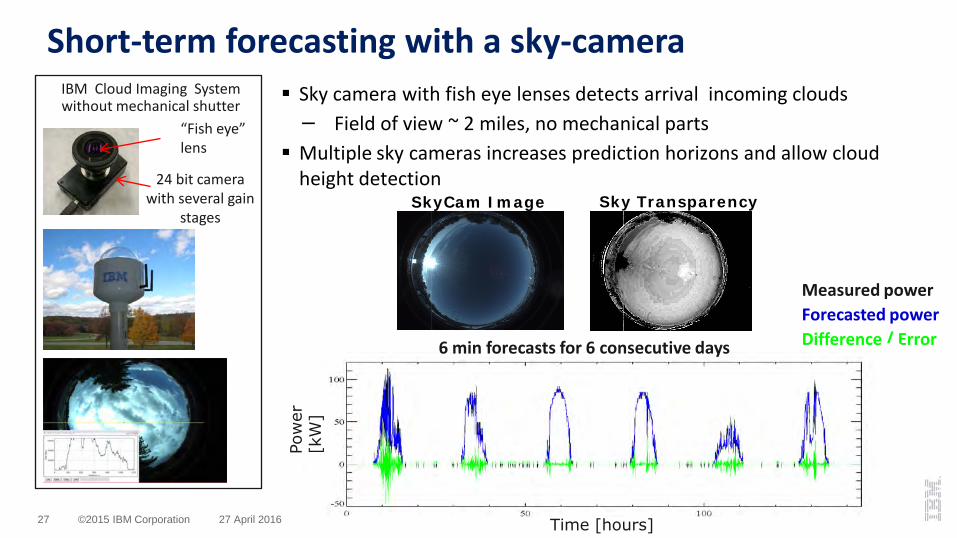
IBM Cloud Imaging Systemwithout mechanical shutter
“Fish eye” lens
24 bit camerawith several gain
stages
Sky camera with fish eye lenses detects arrival incoming clouds− Field of view ~ 2 miles, no mechanical parts Multiple sky cameras increases prediction horizons and allow cloud
height detectionSky TransparencySkyCam Image
Short-term forecasting with a sky-camera
Measured powerForecasted powerDifference / Error6 min forecasts for 6 consecutive days
Time [hours]
Pow
er
[kW
]

©2015 IBM Corporation 27 April 201628
Expanding the forecast horizon - Big Data from various sources and models Persistence:
— Real-time power data— Weather station data
Lagrangrian Forecast Models:− Sky camera model− Satellite-based (GOES), advection models− Time-series models
Weather Forecast Models:− Rapid Refresh (RAP)− Hi-Resolution Rapid Refresh (HRRR)− Short-Range Ensemble Forecast (SREF) − North American Mesoscale Forecast (NAM)− Global Forecast System (GFS)− European Center for Medium range Weather
Forecasting (ECMWF) Climate Models:
− Climate Forecasting System (CFS)

©2015 IBM Corporation 27 April 201629
Key Idea: Situation-dependent, machine-learning based multi-model blending creates a “super” model
Hurricane Ike path forecasts from 9 different weather models*
*M.J. Brennan, S.J. Majumdar, Weather and Forecasting 26, 848 (2011)An Examination of Model Track Forecast Errors for Hurricane Ike (2008) in the Gulf of Mexico
Different forecasting models provide varying accuracies depending on time horizon, location, weather situation etc.
Apply deep machine learning / “adaptive mixture of experts” techniques to dynamically blend different forecasts as a function of time horizon, location, weather situation etc
System continuously learns, adjusts and improves.

©2015 IBM Corporation 27 April 201630
Improving accuracy using situation dependent, machine-learnt, multi-model blending
Example, NAM solar irradiance forecast o Depends strongly GHI and solar zenith angle.o The two parameters create four categories of situations
below.
Question: Which model is more accurate, when, where, under what weather situation?o Apply functional analysis of variance to understand
1st,2nd,3rd, ….order errors
o Model accuracy can depend strongly on “weather situation” category.
o “Weather situation” is determined using a set of parameters including forecasted ones on which model error depends on strongly.
Irradiance forecast (W/m2)
Zenith(Deg)
Forecast Error
(W/m2)

©2015 IBM Corporation 27 April 201631
High forecasting accuracy using situation dependent, machine-learnt, multi-model blending
Italy; 1.935 MW Fixed Array
0.00%
1.00%
2.00%
3.00%
4.00%
5.00%
6.00%
7.00%
8.00%
MAP
E
Vendor
IBM
In average more than 35% more accurate than next best input model
Forecast for wind, solar, hydro from minutes to months ahead
Regional, local and probabilistic forecasts
©2015 IBM Corporation 27 April 201632
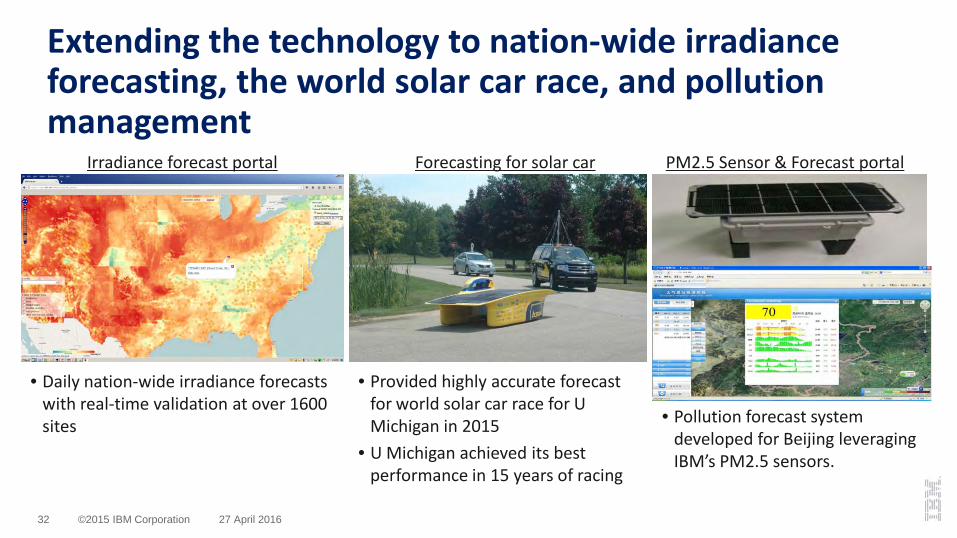
Extending the technology to nation-wide irradiance forecasting, the world solar car race, and pollution management
• Daily nation-wide irradiance forecasts with real-time validation at over 1600 sites
Irradiance forecast portal
• Provided highly accurate forecast for world solar car race for U Michigan in 2015
• U Michigan achieved its best performance in 15 years of racing
Forecasting for solar car
• Pollution forecast system developed for Beijing leveraging IBM’s PM2.5 sensors.
PM2.5 Sensor & Forecast portal

©2015 IBM Corporation 27 April 201633
Precision AgriculturePartners: Gallo Wineries, Netafim, KSU
©2015 IBM Corporation 27 April 201633

©2015 IBM Corporation 27 April 201634
PA platform applied to precision agriculture
©2015 IBM Corporation 27 April 201634
Sensor / Actuators Communication, Security Data Management Cloud-based SW Platform
− Server, Agents, Apps, Clients Physical analytics
— Physical models— Reduction of Model Complexity— Machine-learnt, multi-model
model blending (Big) data analytics platform Automation and controls

©2015 IBM Corporation 27 April 201635
Spatio-temporal intra-field variability limits yield, water efficiency and quality
Large intra-field variability (measured during harvest) “limits” total crop yield Changes by 2x within less of 20 meters
Harvester with yield measurementand GPS
10 acre yield map
If the low performing parts of field can be improved to the “current” average, then yield, water efficiency and quality can be drastically improved.

©2015 IBM Corporation 27 April 201636 ©2015 IBM Corporation 27 April 201636
©2015 IBM Corporation 27 April 201637
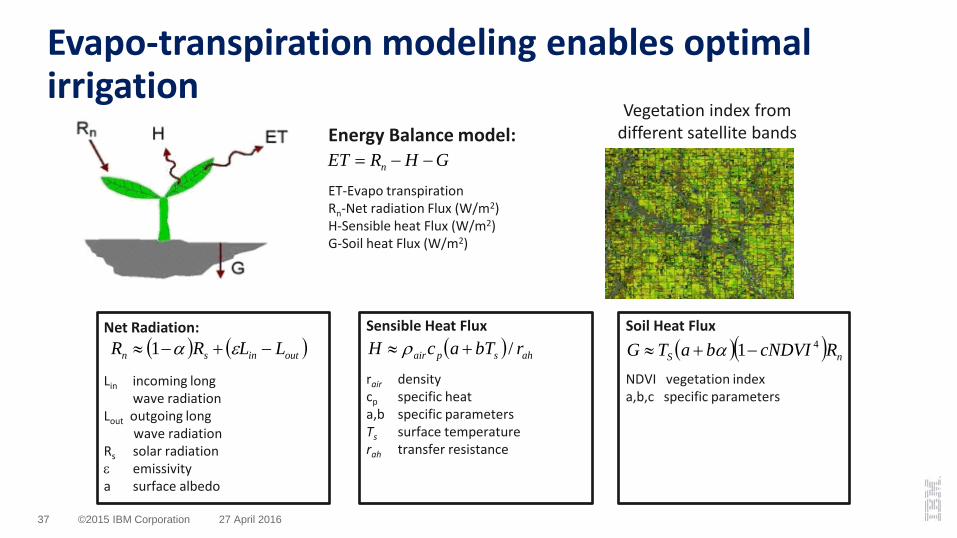
Evapo-transpiration modeling enables optimal irrigation
Net Radiation:
Lin incoming long wave radiation
Lout outgoing long wave radiation
Rs solar radiationε emissivitya surface albedo
Sensible Heat Flux
rair densitycp specific heata,b specific parametersTs surface temperaturerah transfer resistance
Soil Heat Flux
NDVI vegetation indexa,b,c specific parameters
Vegetation index from different satellite bandsEnergy Balance model:
ET-Evapo transpirationRn-Net radiation Flux (W/m2)H-Sensible heat Flux (W/m2)G-Soil heat Flux (W/m2)
GHRET n −−=
( ) ( )outinsn LLRR −+−≈ εα1 ( ) ahspair rbTacH /+≈ ρ ( )( ) nS RcNDVIbaTG 41−+≈ α

©2015 IBM Corporation 27 April 201638
Multiple data sources are fused in big geo-spatial data platform to support scalable physical analytics
IBM
Clo
udU
sers

©2015 IBM Corporation 27 April 201639
Yield maps after 2 years of closed loop precision irrigation show significant improvements
26% more yield 10-22 % higher water efficiency 50 % higher uniformity 2x improved quality index (Brix value)*
yield water

©2015 IBM Corporation 27 April 201640
More about IBM’s precision agriculture work
This year's winner was a collaborative experiment by E. & J. Gallo and IBM, whose approach used a variable-rate irrigation system across separate quadrants of a 31-acre Cabernet Sauvignon vineyard. The result decreased vineyard spatial variability and increased water-use efficiency without compromising quality during a period of historic drought.

©2015 IBM Corporation 27 April 201641
Physical Analytics @ IBM Research
Levente Klein(Physical Modeling)
Vanessa Lopez(Mathematics,) Siyuan Lu
(Machine learning)
Hendrik Hamann( Physical Analytics)
Michael Schappert(Embedded System)
Fernando Marianno(Software Architect)
Xiaoyan Shao(Electrochemistry,
Data scientist) Jun Song Wang(Sensing)
Josphine Chang(Sensor Platform, IoT)
Theodore van Kessel(Oil and Gas & Instrumentation)
Bertrand Marchand(Solar Forecasting)
Conrad Albrecht(Physics and Computation
Heidelberg PhD)
Marcus Freitag(Precision Agriculture)
Ramachandran Muralidhar(Corrosion Science & Pollution Modeling)
and many more
Oki Gunawan(Solar and Robotics)
Golnaz Badr(Precision Agriculture)
Bruce Elmegreen(Astrophysics, Traffic)
Wang Zhou(Robotics, drones)

©2015 IBM Corporation 27 April 201642
Conclusion
Data from the physical world is growing faster than any other data source and will be soon the biggest data set.
Combination of big data and physical modeling provides unique opportunities:o Simplifying and operationalizing physical models (example: building energy
efficiency) o Creating “super-models” to provide deeper understanding of physics/chemistry
of models (example: renewable forecasting)o Providing science-based decision support (example: precision agriculture)o ….


