Page 1
Here Be Dragons: Cycling the Rural-Urban Mobility Interface
Jean Gelwicks, Brenda Guild, John Rowlandson, Island Pathways Broadening Cycling Markets
National Mobility Summit Tuesday 1 Nov 2011
[email protected]
http://www.velo-village2012.blogspot.com
Page 2
In-a-Nutshell
• Salt Spring Island
• Island Pathways - its focus & work effort
• The 2010 Cycling Survey
• Next Steps
Page 3
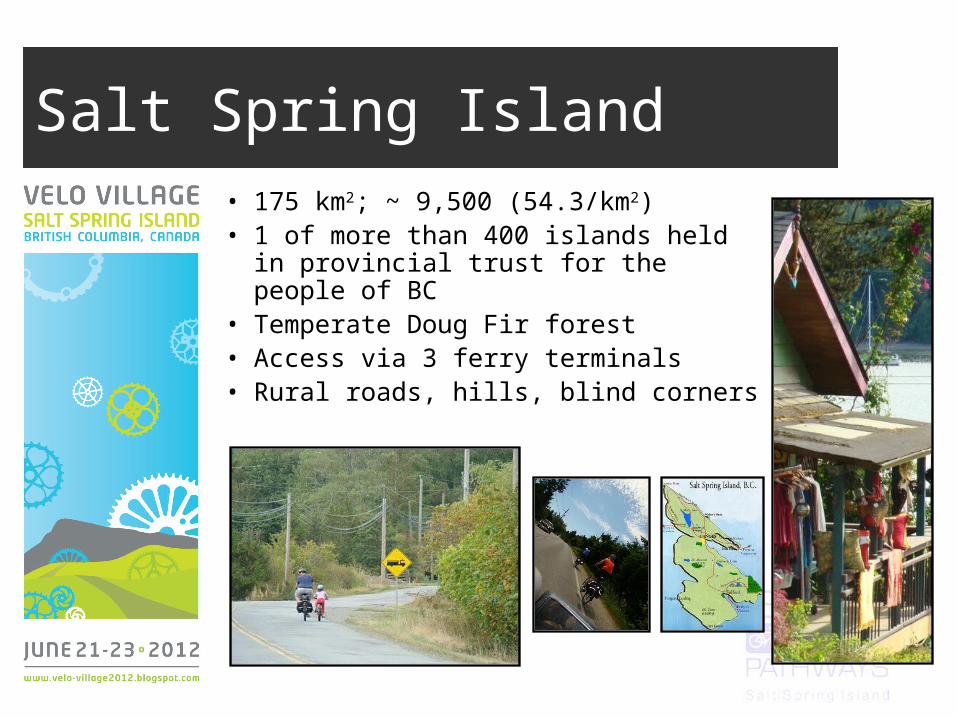
Salt Spring Island
• 175 km2; ~ 9,500 (54.3/km2)• 1 of more than 400 islands held in
provincial trust for the people of BC• Temperate Doug Fir forest • Access via 3 ferry terminals• Rural roads, hills, blind corners
Page 6
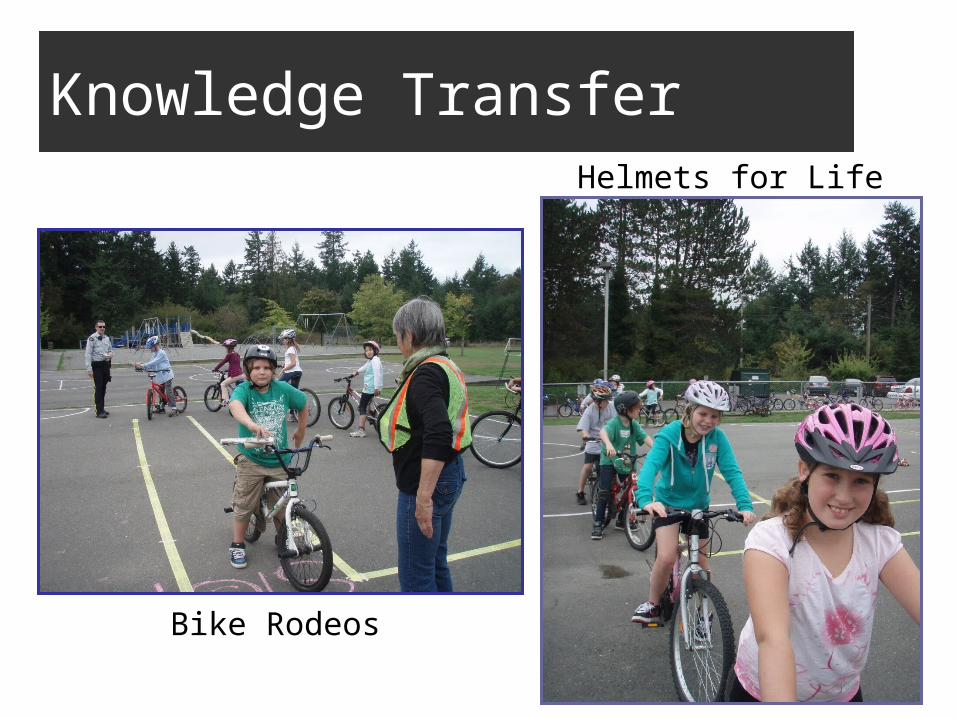
Knowledge Transfer
Bike Rodeos
Helmets for Life
Page 7
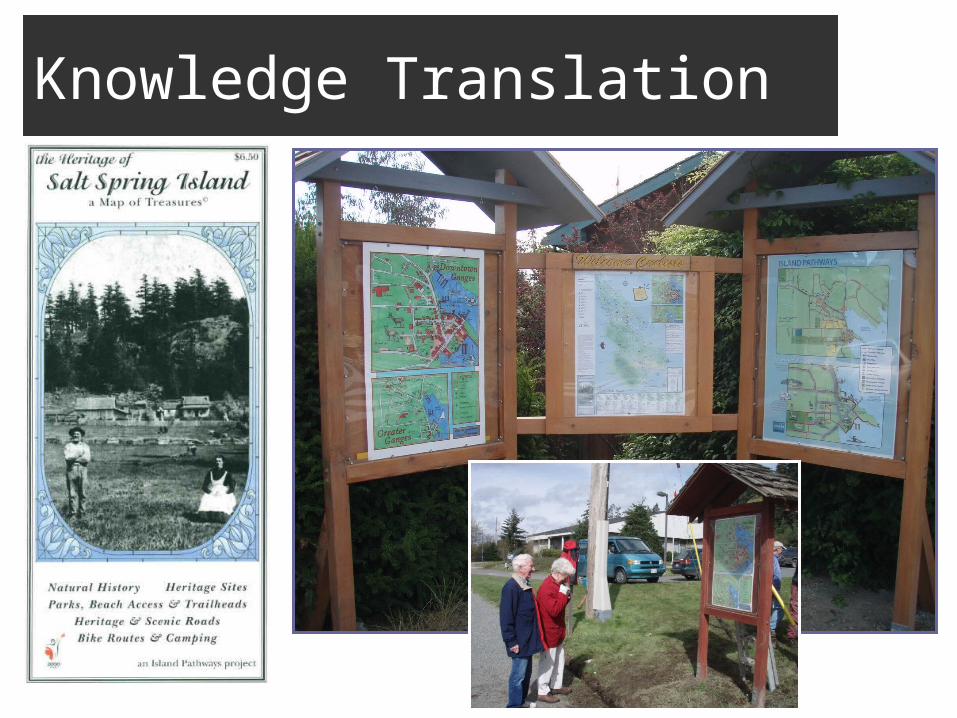
Knowledge Translation
Page 8
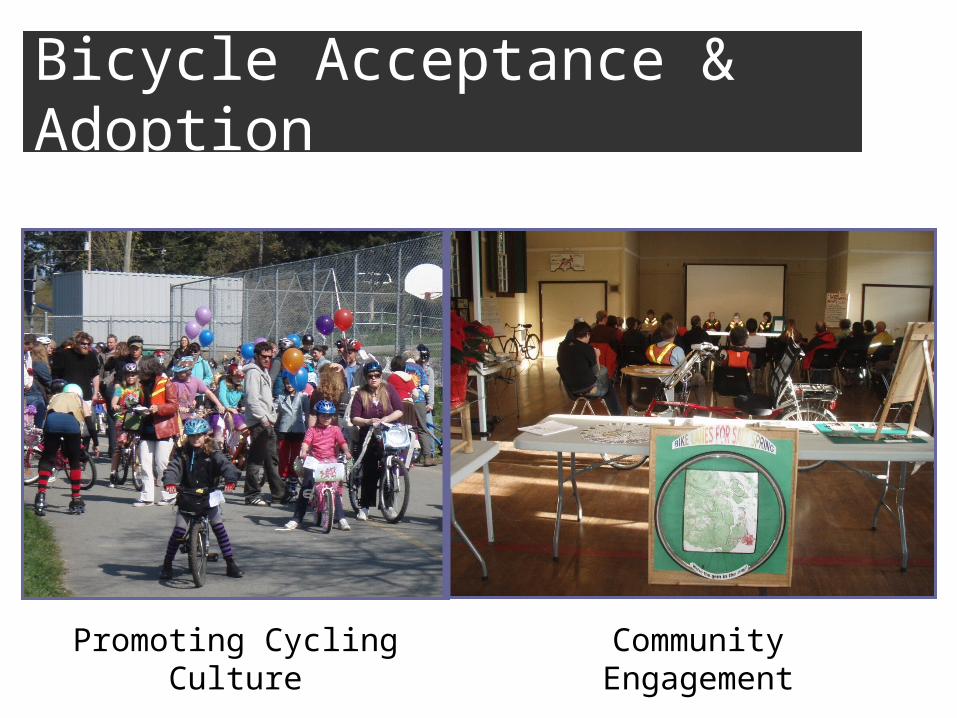
Bicycle Acceptance & Adoption
Promoting Cycling Culture Community Engagement
Page 9
AdvocacyResearch
Bicycle Working Group
http://www.ssi-bicycleworkinggroup.blogspot.com/
+
Page 10
Why bother?
• Ferry costs• Carbon footprint• Traffic congestion• Fossil fuel dependency• Population health & fitness• Cycle Tourism opportunities
Translate the success of Québec’s La Route Verte to the Salish Sea Regional Trail Network (SSRTN)
Page 11
Island Pathways Cycling Survey
• Supported by a partnerships with the Salt Spring Island Transportation Commission
• 1 Aug to 30 Sept 2010• Sample = 432 (on & off-island cohorts)
Island Cyclists Visiting Cyclists
Page 12
Key Findings
• Island Cyclists– 12.6% ranked bicycles
as their most frequent mode of transport
– 35% ride all seasons and in all weather conditions (49% all seasons/fair weather)
– 53% ride between 1-4 days/wk
– 14% ride 5 or more days per week
– 6.4% ride electric bikes
– 76% of respondents said they would ride more if they felt “safer on the road”
– 67% recommended enhanced shoulders or bike lanes to improve cycling safety
Page 13
Key Findings
• Visiting Cyclists– 56% arrive from Vancouver or Victoria; 12% (VI);
11% (USA)– 65% said they cycled in all seasons & all weather– 49% said they rode 5 or more days/week– 61% said they had cycled on SSI 4 or more
times in the past– 31% said they heard about SSI by word of mouth– 60% said that bike lanes or bike paths would
improve the cycling experience on Salt Spring Island
Page 14
Key Findings (3)
• Associations – Women less likely to ride all seasons/all
weather (35% vs 64%)– Women were more likely to be very
dissatisfied with cycling safety (55% vs 45%)
– Women were more likely to be very dissatisfied with cycling security (61% vs 40%)
– Men were more likely to be unsatisfied with BC Ferries signage (59% vs. 41%)
– On average women say they spend about $75.00 more than men ($192.88 vs. $118.56)
Page 15
Alignment
• What the brain trust says:– Factors contributing to Pedestrian &
Bicycle Crashes on Rural Highways - (3,000 bike crashes in 5 states). Rural two-lane roads least safe for cyclists (US FHA, 2010)
– Amoros et al: French trauma registry (n=13,684; 1996-2008) - country cyclists most likely to be severely injured (BMC Public Health, Aug 2011)
– “Women are an indicator species for the vitality of cycling as an activity” (Dill, 2011)
Page 16
Primary Takeaways
• Cycling safety and security are key barriers to resident and visiting cyclists
• Improvements to cycling infrastructure will stimulate growth in the volume of local & itinerant cyclists
Page 17
Next Steps (1)
• Keep Learning– 2011 follow-up with young people
Page 18
Next Steps (2)
• Advocate for cycling infrastructure– Accelerate partnerships with Island
transportation management planning principals
• Mobilize MOTI/Islands Trust LOA• Increase public awareness of bike lane
development• Identify bike lane hotspots &
opportunities
Page 19
Next Steps (3)
• Positive Leverage– Invite the world to cycle on Salt Spring
Island– Demonstrate the rural cycling value
proposition to decision-makers– Mobilize the community to make Salt
Spring the most welcoming place for cyclists on the planet, if only for 3 days
Page 20
QuickTime™ and a decompressor
are needed to see this picture.
Timing
June 2012
15 24 2926
2321
Page 21
Cyclo-tour Value Proposition
Focus on Rural Mobility
3 days of Bicycle Heaven-on-Earth!
1000 - 1500 Cyclists On SSI