ETEROGENEITY OF VARIANCE OF MILK YIELD AMONG HERDS AND APPLICATION OF ADJUSTMENT FACTORS FOR SIRE AND COW EVALUATION IN KENYAN FRIESIAN CATTLE, j] BY / GODFREY ALATI/OLUKOYE B.SC. AGRIC. (HONOURS) , UNIVERSITY OF NAIROBI. A THESIS SUBMITTED IN PARTIAL FULFILLMENT FOR THE DEGREE OF MASTER OF SCIENCE IN ANIMAL SCIENCE , UNIVERSITY OF NAIROBI, 1994. Wl
Transcript
ETEROGENEITY OF VARIANCE OF MILK YIELD AMONG HERDS AND APPLICATION OF ADJUSTMENT FACTORS FOR SIRE AND COW
EVALUATION IN KENYAN FRIESIAN CATTLE, j]
BY
/GODFREY ALATI/OLUKOYEB.SC. AGRIC. (HONOURS) , UNIVERSITY OF NAIROBI.
A THESIS SUBMITTED IN PARTIAL FULFILLMENT FOR THE DEGREE OF MASTER OF SCIENCE IN ANIMAL SCIENCE , UNIVERSITY OF NAIROBI,
1994.
Wl
11
DECLARATION:This thesis is my original work and has not been
presented for a degree in any other University.
GODFREY ALATI OLUKOYE
DATE: oj? -<R4
This thesis has been submitted for examination with our
approval as University supervisors.
1. Signed: Date: ^ C U j 31,
DR. R.O. MOSI.
DR. J.J. OTIM.
Ill
DEDICATION
To Elijah, Mathews, Antony and Gay Atichi, my late brothers and above all, GOD for His Glory and Grace.
IV
ACKNOWLEDGEMENTS
I am most grateful to my University supervisors, Drs. R.O. MOSI and J.J. OTIM for their able guidance, counsel, discussions,
friendliness, constructive criticism and consistent interest they
displayed towards this work throughout the study period.
I owe my appreciation to the Kenya Milk Records and the
Livestock Recording Centre for granting permission to use their
Friesian cattle records for this work, to Mr. B.A.O. INYANGALA for initial data entry and computer work. I am indebted to Mr. A.M. OKEYO
and Mr. J.W. WAKHUNGU for their tireless assistance in data analysis.
Thanks are also due to all other staff of the Department of Animal Production who assisted in one way or another to make this study a
success. I extend my sincere appreciation to my family and friends
for their prayers and support which kept me going in difficult times.
This study was made possible through a scholarship provided by the University of Nairobi.
V
TABLE OF CONTENTSTOPIC PAGE tTITLE ........................................................... (i)
TABLE OF CONTENTS................................................ (v)
LIST OF TABLES............................................... (vii)LIST OF FIGURES.................................................(ix)
LIST OF APPENDICES............................................. (x)ABSTRACT.........................................................(xi)
CHAPTER is INTRODUCTION..................................... 1
CHAPTER 2: LITERATURE REVIEW................................32.1 Level and variation of milk yield......................... 32.2 Heterogeneity of variance of milk yield and its
implication to cattle evaluation.......................... 62.3 Causes of heterogeneity of variance of milk yield........ 9
2.3.1 Year and season of calving............................. 9
2.3.2 Parity and age at calving............................. 112.3.3 Lactation length and calving interval.................142.3.4 Herd................................................... 16
2.4 Use of additive and multiplicative adjustment factors...17
2.4.1 Adjustment factors for parity and lactation length...19
CHAPTER 3: MATERIALS AND METHODS......................... 2 2
3.1 Source and description of the data.......................223.2 Husbandry practices.......................................23
3.3 Data preparation.......................................... 2 4
3.4 Data analyses............................................. 28
3.5 Computation of adjustment factors for lactation lengthand parity................................................ 3 0
3.6 Analyses of heterogeneity of variance of milk yield..... 32
ABSTRACT.Production and reproduction records of Kenyan Friesian cows
obtained at the Kenya Milk Records (KMR) , covering the period 1968 - 1984 , were used to study heterogeneity of variance of 305 - day milk
yield and to develop parity and lactation length adjustment factors.
Two different methods of multiplicative correction factors and linear
regression were used to standardize milk yield to 305 day equivalent.
Coefficients of variation and standard deviations across herds were
used to test heterogeneity of variance. A fixed effect least squares model was used to analyse the contribution of fixed effects to
heterogeneity of variance of milk yield, while lactation length and
parity adjustment factors were developed by ratio method.
The least squares means for 305M, 305L- day and annual milk
yields were 2740.3 ± 10.37 kg, 2813.2 ± 11.08 kg and2722.8 ± 12.88 kg respectively. Significant heterogeneity of variance
of milk yield was found to exist between herds. Year of calving,
herd, herd class, parity, calving interval and lactation length
affected milk yields significantly and contributed to heterogeneity
of variance. Season of calving did not influence milk yield. Age
within parity affected 305 day milk yields significantly but not annual milk yield. Average herd standard deviation and coefficient of
variation after correcting for the fixed effects were 672.2 Kg and
26.7% respectively, while scaled standard deviations between herds
were 180 kg and 3.4% . Use of parity adjustment factors reduced the
CV of 305m day milk yield from 24% to 20%, while the amount of
variation accounted for by parity reduced from 82% to 23% .
xii
It was concluded that heterogeneity of variance of milk yield .
should be accounted for in sire and cow evaluation. The scaling of
observations within individual herds by sample standard deviation
minimises heterogeneity of variance and increases accuracy of
selection. Adjustment factors for lactation length and parity were
proposed as possible means of using all lactation records in sire and
cow evaluation in Kenya.
1
CHAPTER l: INTRODUCTION.The basic assumption in sire and cow evaluation in Kenya is
that the variance of milk yield is homogenous among herds. However,
lactations of individual cows within and between herds are affected
by genetic and non-genetic factors which lead to differences in
milk yields and consequently heterogeneity of variance. In order to
develop appropriate lactation length and parity adjustment factors
for use in sire and cow evaluations, it is necessary to account for
the heterogeneity of variance. This can, to a large extent, be
achieved through adjusting for most of the factors that affect milk yields.
Lactation length in the tropics is mainly dependent on the management within herds and partly the genotype. This was the basis
of developing lactation length correction factors by the Kenya Milk
Records. However, in developing these factors, only lactations
lasting from 199 to 305 days were considered. Considering the fact that lactation lengths of less than 199 days are common in Kenya, these factors appear to be unrealistic.
The hypothesis tested in this study was that variance of milk
yield between Kenyan Friesian herds is not significantly
heterogenous to warrant the use of adjustment factors in sire and
cow evaluation. The specific objectives of the study were:
i) To investigate the level of heterogeneity of variance of 305 -
day milk yield between Kenyan Friesian herds.
ii) To identify and evaluate factors that cause heterogeneity ofvariance between herds.
iii) To examine the possibility of using appropriate adjustment
factors to improve sire and cow evaluation.
2
3
CHAPTER 2: LITERATURE REVIEW.Much of the genetic change in milk production is attributed to
selection of progeny-tested bulls,either as sires of a new
generation of bulls or of cows. The efficiency of sire selection
can be increased by accurately identifying those cows with the
highest genetic potential and then entering their bull calves into
a well designed A. I testing programme. Sire and cow evaluations
are, however, greatly hampered if variances between herds are
heterogenous.This chapter reviews literature on causes of heterogeneity of
variance between herds and its influence on sire and cow
evaluation. The review also covers the different methods used in adjusting for the systematic environmental effects on milk yields.
2.1 LEVEL AND VARIATION OF MILK YIELD.Although means of milk yield serve as a rough guide to the
production potentials of various cattle breeds, differences in the
management of different herds complicate the comparison of these
means (Wakhungu, 1988). Table 1 presents the mean milk yields of various breeds raised in tropical and subtropical areas. Most of
the herds with high milk yields were institutional herds (Marples and Trail, 1967; Kabuga and Agyemang, 1984; Mwai and Mosi, 1991).
Some of the herds (Kabuga and Agyemang, 1984) had imported heifers
and their records were included in the analyses as heifers or cows.
High production levels in institutional herds were attributed to
the genetic and overall management superiority. Table 1 also shows
4Table 1 Mean milk yields of various breeds raised in tropical and
subtropical areas.
Location Breed Yield(Kci)
CV% Reference Remarks
Kenya Jersey 2153 29 Kiwuwa (1974) 1st three lactations- Friesian 2806 - •• 1st three lactations
Kenya Sahiwal 1662 34.4 Wakhungu (1988) 1st six lactationsKenya Friesian 2822
(us) 44 Mosi (1984) 1st five lactations•• It 2885
(s) 39 II 1st five lactationsKenya Friesian 4062 20.26 Mwai and Mosi
(1991) 1st seven lactationsUganda Jersey 2006 21.8 Marples and Trail
(1967) 305 - day«« Friesian 3201 18.7 II •I
n Guernsey 2309 23.9 " "Ghana Friesian 3878 - Kabuga and Agyemang
(1984) 305 - dayIndia Friesian 1775 - Arora and Sharma
(1983) 1st lactationTanzania Jersey 1892 34.4 Katyega (1988) 1st four lactations
Key: us : unselected; s: selected
the high coefficients of variation within and between breeds for
milk yield, explicable mainly by genetic and environmental (e.g
5
nutrition and management) differences.
Annual milk yield per cow takes into account its productive
and reproductive performance. Dairy farmers are usually interested
in the net annual income which is derived from total annual milk
yield sales less the total annual inputs. Cunningham and Syrstad
(1987) reported annual milk yields of 1842, 1612 and 1539 kg for
Friesian, Brown swiss and Jersey crosses. The high annual milk yield of Friesian crosses was attributed to high lactation milk yield (2165 kg) despite long calving interval (429 days). Mwai and
Mosi, (1991) estimated annual milk yield of Kenyan Friesian cattle
at Naivasha to be 4122 kg. This exceptionally high production level
was probably due to the high actual milk yield (4062 kg) attributed
to good feeding and management coupled with genetic superiority.
Njubi (1990) reported mean annual milk yield of 1692 kg for Jerseys
in the sub-humid coastal zone of Kenya. The low annual milk yield
relative to that of Friesian breed was attributed to low actual milk yield (1788 kg) despite the short calving interval (408 days).
It follows therefore that the Friesian and its crosses have
high lactational and annual milk yields compared to other exotic
breeds despite their long calving intervals. Improvement in
nutrition and management is expected to lead to higher milk yields,
reduced calving intervals and consequently higher annual milk
yields. However, differences in nutrition and management are reflected in different herd production levels.
6
2.2 HETEROGENEITY OF VARIANCE OF MILK YIELD AND ITS IMPLICATION TOCATTLE EVALUATION.Both phenotypic and genetic differences between individuals
are considered by geneticists as the raw material for improvement.
The differences are measured and expressed as the variance
(Falconer,1989) . When the variances are not alike, they are said to
be heterogenous and heterogeneity of variance is then said to
exist. The use of Best Linear Unbiased Prediction (BLUP) or similar
procedures in predicting breeding values of sires and cows assumes that the variance of milk yield is homogenous between herds
(Brotherstone and Hill,1986; Garrick and Vleck,1987). BLUP also
assumes knowledge of variances of the random effects (sire, cow and
error terms) and accounts for differences in genetic merit of sires
between different herds (Rege and Mosi, 1989). However,published
evidence suggests the presence of systematic changes in variance components associated with mean level of herd performance (Vleck et
al.,1988). Many workers have reported an increase in phenotypic
variance of milk yield with increasing level of herd production (Danell,1982; Veer and Vleck,1987; Weller et al.1987). Correlations
between herd variability and mean production have been reported as
positive and moderate, falling in the range of 0.21 to 0.49 (Meinert et al.,1988a). These findings invalidate the normal
assumption that between and within-herd variance is homogenous among herds.
The impact of heterogeneity of variance on animal evaluations
and selection has been examined by several workers. Everett et al.
7
(1982) found that among herds of equal genetic merit,herds with
greater variance had a higher proportion of cows achieving elite
status than herds with lower variance. Powell et al. (1983)
reported similar findings. In the latter study, it was found that
among herds of equal sire merit, herds with higher production level
had greater variance attributed to better nutrition and management.
In a simulation study on selection among herds with heterogenous
variance, Hill (1984) reported the fraction of animals that would
be selected from the more variable groups under differing intensities of selection. The proportion selected from the high
variance group increased as both selection intensity and standard deviation increased. In his review, Vinson (1987) noted that
heterogenous herd variance causes genetic evaluations for high
producing cows in high variance herds to be exaggerated. Evidence
presented in these studies suggests that herd phenotypic variance influences the proportions of animals selected from the different
herds, with extreme animals being found in high variance herds.
In the contemporary comparison method,now routinely used in
Kenya in evaluating dairy sires (Philipsson et al.,1988; Rege and
Mosi,1989), the comparison is made within years.The method assumes
that genetic differences between herds are not large enough to interfere with the sire's breeding value estimation and that variances of milk yield are homogenous between herds
(Hickman,1977). But research with production traits has
demonstrated that regressions of daughter yield on sire predicted
difference can vary drastically between herds (McDaniel and
8
Corley, 1967; Powell and Norman,1984; Meinert et al., 1988b). There
are also genetic and environmental differences between herds due to
use of different bulls by different herds, management factors and
nutrition (Rege and Mosi,1989; Vercoe and Frisch,1990). All these
factors contribute to differences in production levels between
herds. Using evaluations based on progeny tests,Wilhelm and Mao
(1989) showed that young bulls selected from herds with low milk
yield variance were genetically superior to those selected from herds with high variance. They also observed that predicted
transmitting abilities for young bulls selected from low variance
herds were less biased, while those of bulls selected from high
variance herds were inflated probably due to genotype - environment
correlation.Similar findings have been reported by Garrick and
Vleck (1987), who observed a reduction in the accuracy of sire
evaluation due to heterogeneity of variance of milk yield between
herds. Thus, heterogenous variances have to be accounted for in
sire evaluation.
In cow evaluation, information about an individual cow and its✓relatives is combined into a cow index and is expressed as breeding
value (Brotherstone and Hill,1987). Different methods are used
worldwide in cow indexing. The use of a cow genetic index for dam
selection is complicated by heterogenous variances arising from
differences in levels of production between herds (Hill,1984;
Brotherstone and Hill,1986; Vinson,1987; Wilhelm and Mao,1989). Yet
for its efficient use , the index has to reflect the genetic merit
of the cow correctly irrespective of the level of herd production.
9
Heterogenous phenotypic variation is mainly attributed to genetic
and environmental causes (Short et al.,1990). Differences between
herds in culling levels and breeding skills make it difficult to
eliminate genetic inter-herd variation. However, the use of A. I
sires across herds or assumption of a fixed amount of genetic variation in herds may eliminate inter-herd genetic differences.
Environmental differences may be eliminated by within herd
corrections (Mosi,1984). These findings suggest the need to account
for heterogeneity of variance to minimize the effects of variation in herd yield level on the index values. This would overcome the
bias in evaluations and remove disproportionate selection that
results from heterogenous variances.
2.3 CAUSES OF HETEROGENEITY OF VARIANCE OF MILK YIELD.Milk yield and composition are as a result of many factors
within the cow and environment. Farmers can alter many factors to
increase milk yield and improve its composition, while some factors are beyond the farmers' control. Factors which influence
milk yield also contribute to the heterogeneity of variance of milk
yield between herds. Among these factors are, herd, year and season of calving, parity, lactation length, calving interval and age at calving.
2.3.1 YEAR AND SEASON OF CALVING.The effect of year of calving on production traits of dairy
cattle raised in the tropics is well documented ( Rege and
10
Mosi,1989; Gupta et al., 1990; Mbap and Ngere,1991; Mchau and
Syrstad,1991). In some studies, year of calving has been found to account for upto 65% of the variation in milk yield (Kabuga and Agyemang, 1984). Management, climatic and genetic factors (Rege and
Mosi,1989) are the major causes of yearly variation in dairy cattle
performance. In the tropics, rainfall is the major climatic factor
that influences pasture quality and availability. Animals that
calve down during unfavourable years with reduced pasture supply
perform poorly (Mbap and Ngere,1989). However, supplementation and
better management improves herd performance. Due to differences in
supplementation and management levels between herds, variation in
herd performance still occur (Short et al.,1990). However, the
effects of management and climate are usually confounded.
Consequently, it is important to identify and classify the real causes of year effects.
Reports on the influence of season on production performance of cattle raised in the tropics are inconsistent. Some studies have
reported significant effects of calving season on milk yield
(Krishnaiah et al.,1988; Katochi et al.,1990; Mwai and Mosi,1991), while others (Murdia and Tripathi,1990; Gupta et al. 1990 and
Yeotikar and Deshpande, 1990) have found non-significant season
effects.Differences in herd management, breed, method of analysis,
distribution of records among seasons and years included in the
analyses could explain the inconsistency. Supplementation of
animals during the dry season may lead to non-significance of the
season effects. In Kenya, Wakhungu (1988) observed that although
11
season of calving did not have a significant influence on milk
yield, cows calving in the short rainy season had the highest milk
yield while those that calved in the long rainy season had the
lowest. He attributed this to the small part of lactation supported
by the high quality pasture for 'cows which calved in the long rainy
season. Those that calved during the short rains were advantaged by
the long rains which coincided with their lactation period.
Despite the inconsistent results, there is need to include season
in analytical models so as to remove the biases in milk yields
recorded in different herds in different seasons. However, it is
important that in every analysis, seasons are definite such that
they reflect the true climatic pattern of the environment.
2.3.2 PARITY AND AGE AT CALVING.The significant effects of parity on milk yield are well
documented (Wakhungu,1988; Rege and Mosi,1989; Mbap and
Ngere,1991). Table 2 presents a summary of the influence of parity on milk yields of various breeds in tropical and subtropical areas.
Several workers have reported an increase in milk yield with
increased parity upto a maximum, followed by a gradual decline in
later parities (Mosi,1984; Juma and Jajo,1986; Mchau and
Syrstad,1991). This could be due to differences in heifer and cow
nutrient partitioning for growth, maintenance and lactation. Gyawu et al. (1988) have reported an unusual peak milk yield occurrence
in the second lactation in Holstein cattle in Ghana.
In Kenya, Mwai and Mosi (1991) reported a peak yield occurrence in
W&Vi
BTmi t V
12Table 2 Influence of Parity on milk yields of cattle raised in
tropical and sub-tropical areas.
Location Breed Influence Parity of peak Referenceyield
Kenya Sahiwal significant 4 Kimenye (1978)Kenya Sahiwal significant 4 Wakhungu (1988)India F X Hariana significant 3 Biswas et al.(1982)Kenya Friesian significant 5 Mosi (1984)Kenya Friesian significant 5 Rege and Mosi (1989). India R and cross-
bred cows non-sign - Dhumal et al.(1989)India J X Hariana significant 3 Panda and Sandhu (1983)India H-F XBengal significant 4 •«
Kenya Friesian significant 4 Mwai and Mosi (1991)India Karan Fries significant 5 Singh and Tomar (1991)
Key: F : Friesian; J : Jersey; H-F : Holstein- Friesian; R : RedKandhari; H : Holstein
the fourth parity. This contradicts earlier findings of Mosi (1984)
and Rege and Mosi (1989) , who reported peak yield in the 5th parity.
Mwai and Mosi (1991) attributed this early attainment of peak
production to fast growth and development achieved through the long
term and consistent breeding for dairy characteristics in their country of origin. Besides, they used lactation records of only one
herd with superior feeding and management programmes. Contrary to
this, studies of Mosi (1984) and Rege and Mosi (1989) involved the
National Friesian population and thus included many herds with
13
differential feeding and management programmes. It appears that
milk yield by the same cow changes with parity. Consequently, this
leads to heterogeneity of variance between and within herds.
Development of appropriate parity adjustment factors could minimise
this heterogeneity of variance and thus increase the accuracy of
sire and cow evaluation.Milk yield of a cow is also influenced by the number of years
it has lived (actual age). However, most studies emphasize specific
effects of age at first calving on milk yield. It is argued that
age at first calving which is closely related to generation
interval, influences response to selection and determines how early
in life an animal's breeding value may be estimated (Mukasa- Mugerwa, 1989) . The few studies on the effects of actual age on milk
yield have all reported its significant influence (Kiwuwa ,1974;
Mosi ,1984; Parekh and Singh , 1987 and Mwai and Mosi ,1991)
Martinez et al. (1990) observed that under practical conditions,
the relationship between milk yield and age cannot be separated
from the effect of selection. Milk yield from an individual cow increases with advancing age to maturity and then declines steadily
(Syrstad,1965). Compared to a mature cow, a heifer's production
ability is limited by the incomplete body and udder development. The rate at which milk yield increases with age is also dependent
on nutrition and management. Marshall et al.(1990) observed that an earlier relative calving date was associated with increased cumulative feed energy intake. Due to the different levels of
feeding and management between herds, animals born on the same
14
date tend to have different rates of growth and consequently attain
weight at first service at different times. This leads to
differences in the levels of milk yields between herds with
corresponding differences in variances. Age effect should be
corrected for in the analytical models for milk yield. This can
allow the use of all records for genetic evaluations. The
correction should preferably be on within parity basis to avoid the confounding effects of actual age with those of parity.
2.3.3 LACTATION LENGTH AND CALVING INTERVAL.The genetic correlation between milk yield and lactation
length of cattle raised in the tropics is in the range of 0.32 to
0.87 (see Table 3) indicating that under tropical conditions, this
correlation is highly variable. The high positive genetic
correlation means that selection for lactation length may be
achieved indirectly by selecting for milk yield. The corresponding
high positive phenotypic correlation means that high milk yields
are associated with long lactations with subsequent increase in
phenotypic variance. The magnitude of the correlation depends on
the breed, management and whether the calves have been allowed to
suckle or not (Kimenye, 1978; Wakhungu,1988) . Management may reduce
lactation length by not milking cows beyond a certain lactation
period. In such cases, lactation milk yield is determined more by
maximum daily yield than lactation length. Thus, differences in
milking days for the various herds lead to different milk yields
and hence heterogeneity of variance of milk yield. To minimise the
15Table 3 Reported genetic (rg) and phenotypic (rp) correlation of
milk yield with lactation length for various breeds in tropical and subtropical areas.
Friesian Kenya 0.50 (1) 0.61 ( 1 ) Mosi (1984)•• ft 0.32 (2) 0.14 (2) If
tf
Sudanese
•« 0.62 (3) 0.44 (3) ««
cattle Sudan 0.87 - Alim (1960)ff
Jamaica
•• 0.86 Alim (1962)
Hope Jamaica - 0.64 Schneeberger et al.(1982)
Key1 : First lactation2 : Second lactation3 : Third lactation
heterogeneity of variance, there is need to develop appropriate
lactation length adjustment factors.
Documentation on the relationship between preceding calving
interval and the current milk yield of tropical cattle is inconsistent. Some studies (Galukande et al., 1962; Wakhungu ,1988) have reported a significant correlation while others ( Singh and
Desai, 1961; Biswas et al. 1982 and Strandberg and Danell 1989)
16
have not. Higher milk yield per lactation is associated with longer
postpartum intervals to first service (Berger et al., 1981;
Wakhungu,1988), longer service period (Hansen et al.,1983) and more
days open (Seykora and McDaniel, 1983) . Large variations in calving
intervals and hence milk yields are more of managerial practices
than the genotype of the animal. Consequently, these lead to
heterogeneity of variance of milk yield between herds. Milk yields should therefore be adjusted for the effects of preceding calving
interval especially when they are short. Otherwise when they are
long, their effect is minimised because the cow has more than enough rest.
2.3.4 HERD.Marked differences exist between herds in the level of milk
production. An accurate knowledge of the underlying causes of these
differences is important in dairy cow and sire evaluation (Vercoe
and Frisch, 1990) . The magnitude of the effect of herd on milk yield
is well documented. In some studies, the herd effect has been found
to account for upto 30% of the total variation (Mosi, 1984).
Both genetic and several identifiable non-genetic factors contribute to differences between herds in milk yields ( Agasti et
al.,1988; Vercoe and Frisch,1990) . The genetic component is caused
mainly by the effect of additive genes. The environmental variation
is mainly through nutrition, disease incidence and management
practices within herds (Frisch and Vercoe,1986; Brotherstone and
17
Hill, 1986; Wakhungu,1988) . Good levels of feeding tend to stimulate
milk yield while underfeeding has the opposite effect. Cows that
calve in good body condition usually have enough energy reserve for
increased production. Besides, the ability of different farmers to cope with fluctuating nutrient supply during adverse weather
conditions is usually reflected in the mean milk yields of the
different herds. The differences in milk yields consequently lead
to heterogenous variances that should be accounted for in sire and
cow selection by fitting herd as a factor in the analytical model.
2.4 USE OF ADDITIVE AND MULTIPLICATIVE ADJUSTMENT FACTORS .Systematic environmental effects such as parity,age, herd,
season and year of calving can be accounted for by use of
appropriate adjustment factors (Chauhan et al.l990;Funk et
al.,1991). The adjustments can be made either additively or
multiplicatively (Emanuelson,1985) . Several criteria for assessing the effectiveness of correction methods have been suggested. They
include unremoved variation, bias in sire predictions, interactions of certain effects with herd-year and residual variance ignoring interactions (Searle and Henderson, 1960) .
For additive correction factors,the increases or decreases in milk production due to the effect of an environmental factor are
assumed to be of the same magnitude for all cows (Chauhan, 1988) .
Using records of Swedish dairy cattle, Emanuelson (1985) concluded that additive adjustments were most appropriate in the first
parity, whereas multiplicative adjustments were effective in later
18
parities. Multiplicative correction factors are appropriate when
scalar effects lead to unequal subclass variances (Chauhan,1988) .
Fimland et al. (1972), using the criteria of herd-year-season by
age and herd-year by season of calving interactions, compared
additive and multiplicative factors. They reported that with
multiplicative factors, the interaction variance was smaller for
age effects but larger for season of calving. Dempfle and Hagger
(1979) found that there were substantial differences between the estimates of age effects in low versus high producing herds but the
multiplicative correction factors for any age specific class were
quite similar. They concluded that a single set of multiplicative
correction factors for all herds would be more useful than additive
factors. Contradictory findings were reported by Funk et al. (1991) who observed that multiplicative adjustment often does not equalize variation for classes due to scaling problems. For example,for milk
yield, a multiplicative factor of 1.15 adjusted 6000 kg to 6900 kg
(+900 kg) and 9000 kg to 10,350 kg ( + 1350 kg). Thus, with
multiplicative adjustment, the corrected milk yields tended to be
inflated. They however concluded that for milk yield,multiplicative adjustment is preferable because variance tends to increase with the mean.
Other studies ( Janson, 1980; Saxena et al. 1991) have found
negligible differences in the effectiveness of the two methods of adjustment. It should, however, be realized that each of the two
methods has limitations and therefore, the method to use depends among other factors, on the effects to be adjusted for.
19
2.4.1 ADJUSTMENT FACTORS FOR PARITY AND LACTATION LENGTH.Since parity is known to affect milk yield substantially, it
should be adjusted for when estimating genetic parameters and
breeding values (Mchau and Syrstad,1991). In the contemporary
comparison method of sire evaluation, although outdated, only first
lactation records are used (Philipsson et al,1988). This has the disadvantage that the number of records available for evaluation is
compromised. Furthermore, due to increased generation interval,
sires whose daughters have a slow growth rate may be left out. This is a likely occurrence in the tropics where management standards
and nutrient supply fluctuate. BLUP procedures incorporate later
cow lactations in sire and cow evaluation (Meyer, 1983) . But because
these procedures are quite demanding in terms of data structure and
computer running time and therefore, difficult to implement in most
developing countries (Mosi,1984), there is need to modify the
contemporary comparison method to include later lactations in sire
evaluation. This observation is supported by Beaudry et al. (1988)
who noted that later-lactation sire evaluations were more useful
than evaluations based on first lactations in the prediction of
total lifetime production. The genetic basis of this is the
"lactation development of a sire," that is, the performance of its daughters during the different lactations (Ron and Hillel,1983).
In calculating the cow genetic index, the cow's first
lactation and her later lactation information should all be incorporated (Hill and Swanson,1983; Brotherstone and Hill,1987;
20
Martinez et al. 1990). This is mainly because selection on a
multiparity cow index results in more genetic gain than selection
on first parity alone (Weller et al.,1987; Banos and Shook,1990).
This can be achieved by developing appropriate parity adjustment
factors that would permit the use of multiple records in both sire
and cow evaluation. The gain in accuracy could compensate for any
disadvantageous effects such as bias of proofs for any particular
group of bulls if parity is not included in the model.The handling and interpretation of lactation length in genetic
studies is rather controversial. Some authors (Ruvuna et al. 1984
; Shrivastava and Khan, 1989) have adjusted milk yield by the
phenotypic regression on lactation length. The linear regression method is based on the fact that cows are usually managed to have
a yearly calving so as to raise enough replacements.To meet this
objective, the cows are allowed to lactate for a maximum of 305
days with an optimal calving interval and dry period of 365 and 60
days respectively (Bar-Anan and Genizi,1981). Other workers
(Lindstrom and Solbu,1978) have used all the available records while others exclude from the analysis short lactations (<150 days)
considered "abnormal" (Madalena,1988). Ngere et al., (1973)
extended yield to mean lactation length for records terminated by loss of calf. They argued that such terminations were associated
with identifiable environmental disturbances. Kiwuwa et al. (1983)
excluded lactations shorter than 75 days as abnormal. However, the same authors concluded that lactations in which peak yields were
reached generally between 21 and 60 days and cows later voluntarily
21
dried up should be regarded as normal records, if no extraneous
factors led to the cessation of milk yield.
Heritability of lactation length is low (Madalena, 1988).
Njubi (1990) reported a value of 0.12± 0.056 in Kenyan Jersey
cattle while Lindstrom and Solbu (1978) reported a value of 0.09
for improved dairy breeds in Kenya. Hence, exclusion of short
lactations may not necessarily remove genetic variation in
lactation length. On the other hand, because short lactations in
the tropics are mainly managerial, there is need to include all
lactations in cow performance analyses. Based on this, the Kenya Milk Records (KMR) developed correction factors for lactation
length (Appendix 1) . However, the KMR considered only lactation
lengths of 199 days and above. It appears that the current KMR
factors for predicting lactation yield from uncompleted lactations
are not realistic. Besides, peak yields for tropical cattle have
been reported to occur within the second month of lactation (Bar-
Anan and Genizi, 1981) . Therefore, there is need to develop more
realistic extension factors for lactation length to accommodate
most lactations. These would provide unbiased estimates of the
production of cows at different lactation stages while at the same
time aiding the farmers in making breeding and management
decisions. This is more important in Kenya where the shapes of lactation curves are least understood.
22
CHAPTER 3: MATERIALS AND METHODS.3.1 SOURCE AND DESCRIPTION OF THE DATA:
Data for this study were obtained from the cow files maintained at the Kenya Milk Records (KMR), the organisation responsible for
official milk recording in the country. The records were made by the
Kenyan Friesian cows kept in commercial herds between 1968 and 1984.
The herds were mainly located in the medium and high potential zones
of Kenya, receiving mean annual rainfall of about 800-1000 and 1000-
1500 mm respectively.In total 5401 lactation records from 972 cows, kept in 60
different herds and served by 49 different sires were extracted. Each
record contained the following information :
- herd identification.
- individual cow identification.
- cow's date of birth ( day - month - year).- cow's date of calving ( day - month - year).- Lactation milk yield (kg).
- Lactation length ( days ).
- Lactation number ( parity ).
- Butter fat percent.
- Butter fat yield ( kg) .- Service sire.
Age at calving ( months ) and calving interval (days) were derived
variables. The records were built up for each cow and parturition.
The major limitation of this data was the unavailability of pedigree information on the cow and service sire.
23
3.2 HUSBANDRY PRACTICES.Different production systems were used. For herds kept in the
high potential areas, semi-intensive feeding system was practised.
Fodder was grown and was either grazed by the animals themselves or
cut and brought to the animals. Lactating cows were supplemented with rations such as maize meal and cotton seedcake. Calving was all-the-
year round, though majority of calves were born during the relatively dry months. On the other hand, most of the herds kept in medium
potential areas practised extensive grazing of natural pastures that
varied considerably in both quantity and quality.
Artificial insemination (A.I) was variably available to the herds. Due to the unreliability of the service, some herds used
natural service. Heifers were first bred according to age (at about
24 months). All female calves born in the herds were retained while
most bull calves were either sold to other farmers for breeding
purposes or castrated.
Similarly, cattle management practices varied between herds. Those in high potential areas practised better disease control than
those in medium potential areas. Routine vaccinations, deworming and
dipping were carried out on all the animals. Thus, animals were
protected against major diseases such as foot and mouth, rinderpest,
trypanosomiasis and tick borne diseases such as east coast fever.
Calf management practices such as dehorning, castration and removal of extra teats were carried out.
24
3.3 DATA PREPARATION:Data preparation was carried out using statistical packages and'
computer facilities of the Department of Animal Production, University of Nairobi. Derived variables and basic statistics were
obtained by the use of Panacea data base programme (Pan Livestock services, 1989) .
Lactations which were less than 60 days were excluded. A record
was also omitted if any of the following information was missing :
herd identification, cow identification, date of birth,year of birth,date of calving,year of calving,lactation number and lactation
milk yield. Of the 5401 lactation records, 4025 were available after
editing, for the derivation of adjustment factors, a reduction of about 25% . Only 24 of the original 32 herds were used in the
analysis of heterogeneity of variance. In this analysis, the minimum
number of records per herd was set at 10. Consequently, the number of records was further reduced to 3975. The structure of the data used in the study is summarized in Table 4.
The lactation milk yield was adjusted to a standard lactation of
305 days using multiplicative extension factors developed from the
data as detailed out in Section 3.5 and Table 15. This adjustment was
to eliminate variation in lactation lengths due to management. Annual milk yield (AMY) was calculated as:
AMY = LMY X 365Cl
where, Cl is the calving interval and LMY is the lactation milk yield. For heifers, the second calving intervals were credited to
25
Table 4 Structure of the data set for yield traits (305-day
and Annual milk yields).
EFFECT NumberTotal no. of records. 4025Cow 949Parity 6Year of calving 17
Season of calving 3Herd 32Herd class 3Calving interval 2507
Lactation length 4025
first calving and used in deriving AMY in the first lactation. The
underlying assumption was that the second and subsequent calving
intervals were approximately equal and very long and were also
assumed to be equal to the first calving interval of heifers.
The 32 herds were grouped into three main categories as set out
in Table 5, according to the distribution of herd means for annual milk yield ( low, medium and high ) . Parity classes were defined as
1st to 5th with 6th and subsequent parities being grouped into one subclass because of small numbers of observations (Table 6). Besides, the rate of decline in milk yields increased in parities 7 and above (Fig. 1) .
26
Table 5 Category of herds according to level of production.
HERD CATEGORY MEAN AMY NUMBER OF HERDS NUMBER OF RECORDS
A (LOW) < 2500 7 195
B (MEDIUM) 2500-3000 23 3405
C (HIGH) > 3000 2 425
Table 6 Actual milk yields ( ±s.e) by parity.
Parity No. of obser. Mean yield
1 1523 2282 ± 19.48
2 921 2690 ± 27.30
3 644 2966 ± 36.28
4 431 3132 ± 46.70
5 268 3159 ± 57.00
6 136 3167 ± 78.86
7 67 3049 ±112.40
8 28 2700 ±176.23
9 7 2400 ±274.11
Mea
n m
ilk
yiel
d (K
g)
27
FIG. 1: Unadjusted mean milk yield by parity.
■a— MEAN YIELD
Parity
28
Rainfall was the major climatic factor that influenced pasture
availability and quality in all herds which provided data for this
study. The pattern of rainfall distribution in most parts of the
country was bimodal. Due to this, it was considered appropriate to
divide the year into three calving seasons using the procedure of
Rege and Mosi (1989). These were :Season 1 :Long rains: March - May
Season 2 :Short rains: October - November
Season 3 :Dry Period : December - Feb; June - September.
3.4 DATA ANALYSES.Least Squares and Maximum Likelihood Statistical Programme
(Harvey, 1990) was used in the main data analyses. The contribution of
the fixed effects of year and season of calving, actual age at
calving within parity, herd, herd class and parity to heterogeneity
of variance were investigated by the following statistical model ( Model 1 ):
Model isYi jklmnoWhere;
M + H. + YRj + SNk + P t + bC.... + HCijklmno m + APnl + e •.., ijklmno
jklmno is the Annual or 305 day milk yield (Kg) of theoth lactation record of a cow which calved in the
ith herd in the jth year,kth season and mth herd class.
M is an underlying constant common to all records.
29
« i is the fixed effect of the ith herd (i= 1,2,3,...32).
Y R j is the fixed effect of the jth year (j = 1,2 ,3 , .. . , 17) .S N k is the fixed effect of the kth season (k = 1,2,3).
p , is the fixed effect of the 1th parity (1 = 1,2,3,4 ,5 ,6 ) .is the f ixed effect of the mth herd class (m = 1,2,3).
A P n , is the interaction effect between the nth age at calving,A, and the l1ch parity.
b is the partial regression coefficient of milk yieldon a covariate, C.
C ijk imno are covariates of age at calving, calving interval andlactation length.
e i jk im n 0 is t ie residual error term normally distributed withmean zero and variance o 2e
Actual age at calving was fitted together with other fixed effects as a linear regression within parity in a fixed model
(model 1). The effects of lactation length and calving interval on
milk yield were also investigated by fitting them as covariates in
model 1. Least square means of milk yield for lactation length
classes were fitted in model 2 to permit estimation of extension
factors. The following fixed model (model 2) was used for this purpose:Model 2 :VijHmnop = M + H, + YRj + SNk + P, + bCijk|mnop + HC„ + Ln + APol
e i j k l mnop
Where;
30
Yijkiimop is the lactation milk yield (Kg) of the pthlactation record of the a cow which calved in the ith herd in the jth year,kth season and mth herd class.
Ln is the fixed effect of the nth lactation length,sub-class ( n = 1,2,3,...35).
APol is the interaction effect between the oth age at calving,A and the 1th parity.
All other symbols were the same as those in Model 1, only that in
this analysis, the covariate lactation length was not fitted.
3.5 COMPUTATION OF ADJUSTMENT FACTORS FOR LACTATION LENGTHAND PARITY .
Multiplicative extension factors for lactation length were
computed and used to adjust the lactation yields to a standard
lactation of 305 days. The actual lactation periods were grouped into
35 subclasses of seven days each ( Table 15 ) . Lactation length
subclasses were treated as fixed effects and the data analysed with
a fixed effect model (model 2) in which lactation milk yield was a
dependent variable. This gave the least squares means (LSM) for the subclasses. The least squares means were then used to derive
multiplicative extension factors (MEF) using the following formula of Chauhan (1988):
Cj; Cm and Cm2 are the corresponding estimates of CV and
their unweighted mean and variance respectively.
The other symbols were as used in Equation 4.
The coefficients of variation of individual herds were scaled according to the herd mean using the formula:
34CV cv
•pop
Var(C V p o p ) Var
( C V i )
( 6 )
1 + 1Var
( C V p o p ) Var(cvj)Where ;
CV.CV
CV.
pop
is the scaled coefficient of variation.
is the coefficient of variation for the population( mean CV).
is the coefficient of variation for the ith herd and
When using these formulae for analyses of heterogeneity of variance, it was assumed that the heritability of milk yield was the same in
all herds. When sires have been widely progeny tested, it also
implies that the ratio of genetic to environmental variation within sire families is the same in all herds.
35
CHAPTER 4: RESULTS.4.1 LEVEL AND VARIATION OF MILK YIELD.
Table 7 presents the unadjusted means, standard deviations and coefficients of variation of various traits in the study. The least
square means and standard errors of 305M, 305L - day and annual milk
yields were 2740.3 ± 10.37 kg , 2813.2 ± 11.08 kg and 2722.8 ±
12.88 kg respectively. The corresponding coefficients of variation
were 24, 25 and 30 %, while standard deviations were 658, 703 and
817. Adjusted milk yields had higher means than unadjusted milk
yields given in Table 7. Also, 305M day mean milk yields were lower than the 305L -day mean milk yields.
Table 7 Unadjusted means, standard deviations (SD) andcoefficients of variation (CV) of various traits.
TRAIT NO. OF RECORDS MEAN SD CV %Lactation milk yield 4025 2528 kg 961 38Lactation length 4025 277 days 50 18Calving interval 2507 431 days 105 24Annual milk yield 4025 2218 Kg 938 42
4.2 HETEROGENEITY OF VARIANCE OF MILK YIELD.Tables 8 and 9 and figures 2 and 3 show within-herd variances,
standard deviations and coefficients of variation of 305M - day
milk yield. Generally, herds with higher average milk yields had
7 C
36
greater intra-herd variances and standard deviations. Similarly,
Table 9 shows that differences existed between herds in
coefficients of variation (CVs) with the CVs increasing with herd
production level. The herd average standard deviation and coefficient of variation of milk yield after correcting for the
fixed effects were 672.2 kg and 26.7% respectively. The scaled
standard deviations between herds were 18 0 kg and 3.4 % respectively. Table 9 also presents the scaled coefficients of
variation (CV*) . Compared to the within herd coefficient of
variation (CV,.) , the scaled coefficient of variation ( CV*) showed
little variation as indicated by the low standard deviation of3.4% .
37
Table 8 Within-herd variances and standard deviations (SD) of 305m - day milk yield.
Herd Mean S • d (S •) Variance di <sr sm>2(A) s / 2diCBS
Key: Sm is the population standard deviation.K is the number of herds.d. is the degrees of freedom for number of records, is the estimator of variance among the standard deviations.
3 2 4 1 1 .0 0
38
Table 9 Within-herd variances of coefficients of variation (CV) .
Herd Mean CV( (CV,)2 d, (CV,-CVm)2 CVm2/2d, (A-B)/K-l CV*
Key: 0.001175 is the estimator of variance among the coefficients of variation.
CV = CV is the population coefficient of variation.m pop r c
CV. is the coefficient of variationfor the ith herd.
di is the degrees of freedom for number ofrecords for the ith herd.
CV* is the scaled coefficient of variation.
S.D
(K
g)
39
FIG. 2: Standard deviation of 305 -day milk yield of herds.
Herd
(%)
AO
40
FIG. 3: Coefficient of variation of 305-day milk yield of herds.
Herd
4.3 CAUSES OF HETEROGENEITY OF VARIANCE OF MILK YIELD BETWEEN HERDS.
YEAR AND SEASON OF CALVING .Effects of year and season of calving , which are environmental,
are shown in Table 10. Year of calving influenced 305M~day, 305L - day and annual milk yields significantly (P<0.01) and accounted for 10,
12 and 8% of the total variation in the traits respectively. Figure 4 shows that there was a downward trend in milk yields between 1969
and 1976 but a general upward trend between 1976 and 1985 with some
decrease in 1979 and 1982. The least square constants in Appendix 5 also depict a similar trend in yearly variation of milk yields.
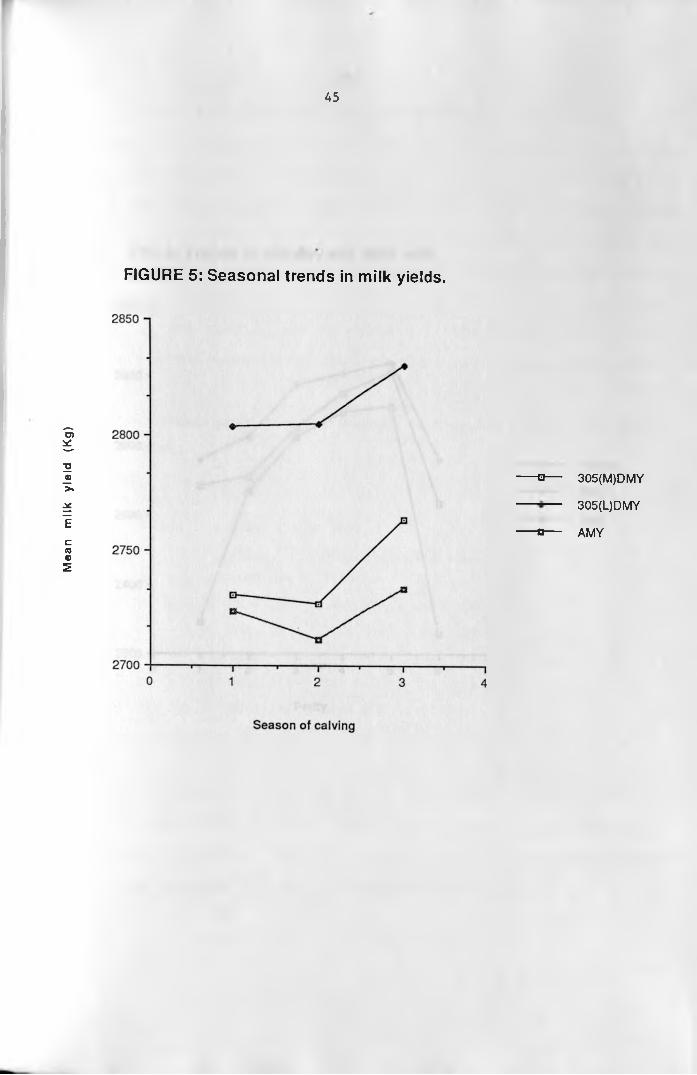
Season of calving did not affect 305M - day, 305L- day and annual
milk yields significantly (P>0.01), having accounted for only 2, 1and 1% of the total variation in these traits respectively. Although
season was not significant, Figure 5 shows that there is trend in
seasonal variation of milk yields. Cows calving in the short rainy
season produced the least amount of milk, while those calving in the dry season produced the most.
PARITY AND AGE AT CALVING.Table 10 presents the effects of parity and age at calving,
which are both genetic and environmental, on 305M -day, 305L - day and annual milk yields. Parity significantly affected 305M, 305L andannual milk yields (P<0.01) and accounted for 82, 64 and 27% of the
total variation in the traits respectively. The least squares means
and constants for parity displayed consistent trends (Tables 11 and
41
42
12). Milk yields increased at a decreasing rate upto the peak in the
5th parity (Fig. 6) after which they dropped drastically in the 6th parity, in which the yields roughly equalled those in the 1st parity.
Table 10. Influence of fixed effects on milk yield ( Model 1).
TRAIT S 0 U R C E O F V A R I A T I O N
YR SN PAR H HC AP Cl LLActual milk yield (KG) ** ns ** ** ** ** ** **
305M-day milk yield (KG) ** ns ** ** ** ** * * **
Annual milk yield (KG) ** ns ** ** ★ k ns ** **
305L-day milk yield (KG) ** ns ** ** ** * ** * *
KEY
** : P<0.01
* : P<0.05
ns : not significant (P>0.05)
YR : Year; SN:Season; PAR:Parity; HrHerd; HC:Herd class
according to production level; AP:Actual age within
parity; Cl:Calving interval and LL:Lactation length.
The highest and lowest rates of increase occurred between the second
and third and the fourth and fifth parities respectively. In the case
43
Age at calving within parity significantly influenced 305M - day
milk yield (P<0.01) and 305L - day milk yield (P<0.01) but not annual
milk yield (P>0.01). Age within parity effect accounted for 4, 3 and
1% of the total variation in the three respective traits.
Table 11 Least square means (LSM) for milk yields by parity and rates of change (in brackets) between parities.
of annual milk yield,the highest rate of increase occurred between
HERD.Herd and herd class, which are purely environmental,
significantly affected (P<0.01) 305M - day, 305L - day and annual
milk yields (Figure 7). Herd accounted for 32, 28 and 23% of the
48
total variation in these traits respectively. Least square means and constants for herd and herd class are given in Appendices 4 and 5 respectively. Herds in the high producing class, presumably with high
levels of feeding and management had the highest mean milk yields.
Mea
n m
ilk
yiel
d (K
g)
49
FIG. 7: Trends in mean milk yields of herds.
-a— 305(M)DMY
* ---- 305(L)DMY
AMY
Herd
50
4.4 ADJUSTMENT FACTORS FOR PARITY AND LACTATION LENGTH.Table 14 shows the parity adjustment factors developed in the
study using first parity and peak yield parity (5th parity) as
reference classes respectively. With first parity as the reference
class, the parity adjustment factors decreased gradually upto the
peak lactation, after which, they increased. On the other hand, using
mature lactation equivalent as the reference class, the factors above
the reference class decreased gradually while those below increased.
The use of parity adjustment factors developed in this study
decreased the CV of 305M day milk yield to 20% from the 24% which was
estimated without using the factors. The amount of variation
accounted for by parity reduced to 23% from the initial 82%. There
was a significant correlation of unity between milk yields corrected
for parity using these two approaches.
Extension factors developed in this study are shown in Table 15. The factors generally decreased with increasing lactation lengths.
The high and positive phenotypic correlation between 305M and 305L day
milk yields of 0.963 ±0.015 was not significantly different from one.
51
Table 14 Parity adjustment factors developed in the study.
CHAPTER 5: DISCUSSION.5.1 LEVEL AND VARIATION OF MILK YIELD.
The mean milk yields obtained in this study are consistent
with the estimates reported from previous local studies on Kenyan Friesian population (Kiwuwa, 1974; Mosi, 1984). They are, however,
lower than estimates obtained in other local investigations
(Marples and Trail, 1967; Mwai and Mosi, 1991). The lower milk yields obtained in this study may be mainly due to the highly
diverse management practices applied in the herds which were
studied. The high production level of the better managed herds was
mitigated by the low production levels obtained in the poorly
managed herds. In consequence, the overall level of production was
lowered.Estimates of the coefficients of variation obtained in the
study for the various traits were consistent with those reported
for Friesian cattle under comparable environments (Marples and
Trail, 1967; Mwai and Mosi, 1991). The estimates indicate the
existence of substantial variability and, therefore, improvement
opportunities through better nutrition and management programmes.
5.2 HETEROGENEITY OF VARIANCE OF MILK YIELD .The general increase in within-herd variances, standard
deviations and coefficients of variation with the level of herd
production clearly shows that the variance of milk yield was not
homogenous among the herds. This was confirmed by the significant
effect of herd and herd class on the yield traits studied.
54
It should, however, be noted that CVs and SDs were derived
variables and could thus be subject to errors. Nevertheless, they
both showed a trend similar to that given by the within-herd
variances. Similar findings were reported by Dong and Mao (1989)
and Short et al. (1990), who observed that SD increased with mean
milk yield. The heterogeneity of variance between herds was
explained by both genetic and environmental factors. The
differences in within-herd CVs observed could have been partly due
to preferential treatment of cows according to production level,
good conformation, high pedigree and hence monetary value,
sentimental reasons or a combination of these factors. Such
preferential treatment could favourably affect records of milk yield and increase within-herd variances and coefficients of
variation of milk yield.The significant differences in SDs between herds confirm that
the variances were not constant over observations and therefore
suggests heterogeneity of variance due to herd effect. Thus,
logarithmic transformation is inadequate in minimizing the
heterogeneity of variance. On the other hand, the fact that scaled within-herd coefficients of variation (CV*) had a standard
deviation of only 3.4 % imply that this approach could be effective
in minimizing heterogeneity of variance and therefore, permit
unbiased selection of animals. These findings are consistent with
those of Brotherstone and Hill (1986) and Graham et al. (1991) who observed that when heritabilities are the same in all herds,
scaling observations to a constant CV removes much of the
55
heterogeneity of variance of milk yield. It can therefore, be
concluded that, scaling by sample standard deviation reduces
heterogeneity of variance among herds.
5.3 CAUSES OF HETEROGENEITY OF VARIANCE OF MILK YIELDBETWEEN HERDS.
YEAR AND SEASON OF CALVING.The significant influence of year of calving on milk yields
and hence heterogeneity of variance observed in this study concurs
with results reported from previous studies in Kenya (Wakhungu,
1988; Rege and Mosi, 1989; Njubi, 1990). The differences between years in milk yields were due to corresponding fluctuations in feed
supplies, herd genetic levels and management. The downward trend in
milk yields between 1969 and 1976 was largely due to change in farm
ownership from the more skilled pre-independence farmers to the
unskilled indigenous farmers. Improvement in management by the new
farmers and consistent breeding programmes in large scale herds
possibly led to the increases observed from 1976. Adjustment of
lactation records for year of calving was, therefore, carried out
in this study to reduce heterogeneity of variance due to year
effects.
Season of calving had no significant effect on milk yields and
therefore contributed little to the variance. These findings agree
with those of Murdia and Tripathi (1990) and Gupta et al. (1990),
but contradict those of Katochi et al. (1990) and Mwai and Mosi
56
(1991) . Supplementation of the animals masked the true between season differences in feed availability in this study. This created
more uniformity in seasonal effect on milk yield. Also, the
classification of seasons according to the rainfall and
corresponding herbage production potential may not have been done
correctly to reflect the real situation. This could have been
possible if the same months in different years did have comparable climatic conditions. The highest milk yields recorded for cows
calving in the dry period was obviously due to the abundance of
forage in the subsequent wet season which they took advantage of.
PARITY AND AGE AT CALVING.As in the studies of Mbap and Ngere (1991); Mchau and Syrstad
(1991) and Mwai and Mosi (1991), parity significantly influenced
milk yields, leading to non-homogeneity of variance. The occurrence
of peak yield in the fifth parity is consistent with results
reported in previous studies (Mosi, 1984; Rege and Mosi, 1989) in
Kenya. The increase in milk yield from the first parity to the
fifth parity was due to differential partitioning of nutrients by
first calf heifers and cows. Whereas first calf heifers had to
provide for nutritive requirements for growth, maintenance and
lactation, cows had to provide for only maintenance and lactation.
The highest increases in 305 day milk yields observed between the
second and the third parities indicate the increasing physiological
maturity of the cow relative to the heifer. This was probably
achieved through reduction in energy allocation for growth.
57
The fact that age at calving was not significant for annual milk
yield imply that the magnitude of age effects decrease considerably after the second parity. Similar findings have been reported by
Syrstad (1965) and Mosi (1984), who observed that age effects were
more pronounced in first than in later parities. It is, therefore,
desirable to adjust for parity and age at calving in order to
reduce heterogeneity of variance of milk yield. However, adjustment
for effects of age on milk yield should be done within parities to avoid the confounding effects of actual age at calving with those of parity.
LACTATION LENGTH AND CALVING INTERVAL.The significant effect of preceding calving interval on milk
yields confirms the earlier findings of Wakhungu (1988) from Kenyan
Sahiwal data. Milk yields are expected to increase with increased
postpartum intervals to service because of the rest cows usually
have, which enables them to recover from previous lactational
stress. However, the degree of recovery can be greatly modified by
the feeding and management of the animals. Variability between
herds in levels of feeding and management result in heterogenous variances. Consequently, milk yields should be corrected for the
effects of calving interval. When this is done, other components of
calving interval such as dry period and lactation length have alsoto be considered.
58
HERD.Herd contributed significantly to the total variation and thus
confirmed the existence of differences between herds in milk
production. Similar results have been reported from previous
studies for breeds raised in the tropics and sub-tropics (Rege and
Mosi, 1989; Katochi et al. 1990; Lusweti, 1991). The observations
in this study were attributed to genetic and environmental factors.
Differences in herd genetic levels arose through the differential
use of bulls by herds in their breeding programmes and massive
importation and use of semen by some herds. Thus, milk yields
should be corrected for the herd effect.
5.4 PARITY ADJUSTMENT FACTORS.By adjusting the records for parity effect, using the factors
developed in this study, the CV of 305M day milk yield reduced by
17% while the amount of variance decreased by 71% . The implication
is that the factors could be used to adjust lactation records for
parity to improve comparison of cows in different parities. This
adjustment would also facilitate the use of multiple records in the
evaluations.
The high phenotypic correlation of unity between milk yields corrected using the two sets of adjustment factors imply that
either of the two sets of factors may be used. However, other
effects such as senility that increase with advancing age
(Matsoukas and Fairchild, 1975) and differences between herds in
the parity of peak yields should be considered before choosing the
59
set of adjustment factors to use. First parity yields may not vary
much within and between herds as the case may be with peak parity
yields. Therefore, a single set of adjustment factors based on
first parity yield would appear appropriate for all herds and herd levels. Adjustments based on first parity performance would have an
added advantage of reduced generation interval particularly in
progeny testing of sires.
Unlike the additive correction factors, multiplicative factors
take consideration of the fact that changes in milk production due to an environmental effect are not of the same magnitude. Thus,
compared to additive factors, multiplicative parity adjustment
factors developed in this study would appear more appropriate in
minimising heterogeneity of variance due to parity effects.
5.5 EXTENSION FACTORS FOR LACTATION LENGTH.The general decrease in the magnitude of the multiplicative
factors with increasing lactation length was expected. Shorter
lactations required larger factors to standardize the corresponding
yields to 305 day equivalent. However, the factors exhibited some
inconsistencies attributed to small sub-class numbers and the long interval (one week) between the sub-classes. Although the KMR factors (Appendix 1) appear to give a more consistent trend, they
were developed only for lactations of more than 198 days. They are,
therefore, considered to be unrealistic for Kenyan conditions where
shorter lactation records are common. On the other hand, the
extension factors developed in this study catered for shorter
60
lactation records resulting from prevailing diverse management
standards.The choice of 60 days as the minimum lactation length was
justified by the fact that peak yields for cattle raised in the tropics are known to occur within the second month (42 to 56 days)
of lactation (Bar-Anan and Genizi, 1981; Dhanoa,1981). Thus,
despite the inconsistencies, these factors could be more useful in
minimising heterogeneity of variance associated with variable
lactation lengths. However, there is need to develop more factors
using large data.Just as with linear regression, multiplicative correction
factors assume a linear relationship between milk production and
lactation length, while published evidence strongly indicate a
curvilinear relationship (Wood, 1980). Therefore, a better
understanding of the true lactation curves for the four main Kenyan
dairy breeds could lead to the development of more accurate extension factors for lactation length. With the availability of
accurate extension factors, it would not be necessary to discard
short lactation records discriminately. At the same time, the use
of extension factors for uncompleted lactations would enhance the
accuracy of cattle evaluations.The high and positive phenotypic correlation between the
adjusted 305 day milk yields derived using extension factors and
linear regression imply that both methods are equally effective for
this purpose. As to whether the extension factors are any better
than phenotypic regression of milk yield on lactation length was
61
not considered in this study. This question should be answered by a better understanding of the rank correlations of animals under the alternative correction method.
62
CHAPTER 6: CONCLUSIONS AND RECOMMENDATIONS.Within the limits of the data available and the procedures
employed in this study, the obtained results led to the following
conclusions and recommendations:
1. That significant heterogeneity of variance of milk yield
exists among the Kenyan Friesian herds which cannot be
attributed to chance as heterogeneity also exists in
coefficients of variation. It should therefore be accounted for in sire and cow evaluation in Kenya.
2. Scaling of observations within individual herds by sample
standard deviation and coefficient of variation can reduce
heterogeneity of variance among herds. This standardization
can enable breeders to compare animals on an equal basis.3. In the absence of any scientific procedure for bull- dam
evaluation in Kenya, the parity adjustment factors developed
would be useful in comparing cows of different parities. They
would also enable the use of multiple records in sire and cow
evaluation.
4. That the developed extension factors could be used to project
uncompleted lactations to 305-day equivalent to ensure more
accurate within breed evaluations, especially where the part
lactations are associated with identifiable environmental influences.
5. Development of lactation curves for the four main Kenyan dairy
breeds would facilitate development of more accurate extension
factors. The curves would also assist in herd management and
63
planning.There is need for further investigation into the effectiveness of the scaled coefficients of variation for adjusting the deviations from the herd means, in relation to sire and cow evaluation in Kenya.
64
CHAPTER 7
A g a s t i ,
A l i m , K.
A l i m , K
A r o r a ,
B a n o s , G .
B a r - A n a n ,
B e a u d r y ,
B e r g e r , P
: REFERENCES.
I.K.; Chowdhuri, G. ; Dhar, N.L. (1988) Genetic studies on some of the traits of milk production in the Jersey X Hariana crossbred cows. Indian J. Anim. Hlth., 27(1): 67-71.
A. (1960) Reproductive rates and milk yield of Kenana cattle in Sudan. J. Agric. Sci., 55: 183-188.
.A. (1962) Environmental and genetic factors affecting milkproduction of Butana cattle in the Sudan. J.Dairy Sci.,45: 242-247.
).N. and Sharma, J.S. (1983) Factors affecting some of theeconomic traits in Holstein-Friesian cattle. Indian Vet J.60(10): 820-823.
and Shook, G.E. (1990) Genotype by environment interaction and genetic correlation among parities for somatic cell count and milk yield.J. Dairy Sci., 73(9): 2563-2573.
R. and Genizi, A. (1981) The effects of lactation, pregnancy and calender month on milk records. Anim. prod., 33(3): 281-290.
T.F.; Cassel, B.G.; Norman, H.D. (1988) Relationships oflifetime profit to sire evaluations from first, all and later records. J. Dairy Sci., 71(1): 204-213.
.J.; Shanks, R.D.; Freeman, A.E. and Laben, R.C. (1981) Genetic aspects of milk yield and reproductive performance. J. Dairy Sci.,64:114-122.
affecting milk yield in Friesian- Hariana half- breds. Indian J.Anim. Sci., 52(3): 123-128.
Brotherstone, S. and Hill, W.G. (1986) Heterogeneity of variance amongst herds for milk production. Anim. Prod., 42(3): 297-303.
Brotherstone, S. and Hill, W.G. (1987) A retrospective evaluation of the weights in the cow genetic index. Anim. Prod., 44:355-361.
Chauhan, V.P.S.; Hagger, C.; Schmitz, F.; Kunzi, N. ; Crettenand, J.(1990) Models for adjusting for herd, year and season effects in dairy sire evaluation in small herds. Livest. Prod.Sci., 26(4): 245-261.
Chauhan, V.P.S. (1988) Additive versus multiplicative pre-corrections of dairy records for some environmental effects in sire evaluation. J. Dairy Sci., 71(1): 195-203.
Cunningham, E.P. and Syrstad, O. (1987) Crossbreeding Bos indicus and Bos taurus for milk production in the tropics. FAO . Anim. Prod. Hlth., Paper No. 68. Food and Agric. Organ., United Nations, Rome, Italy.
Danell, B. (1982) Interaction between genotype and environment in sireevaluation for milk production. Acta. Agric. Scand., 32(1): 33-46.
Dempfle, L. and Hagger, C. (1979) Investigations on efficiency and correction factors in sire evaluation. Z. Tierz. Ziichtungsbiol. , 96: 135.
Dhanoa, M.C. (1981) A note on an alternative form of lactation model of Wood.
66
Anim. Prod., 32: 349-351.
D h u m a l . M.V.; Sakhare, P.G.; Deshpande, K.S. (1989) Factors affecting lactation milk yield and lactation length in Red Kandhari and crossbred cows. Indian J. dairy Sci., 42(1): 102-104.
D o n g , M.C. and Mao, I.L. (1990) Heterogeneity of (Co)Variance and heritability in different levels of intra-herd milk production variance and of herd average. J. Dairy Sci., 73: 843.
Emanuelson, U. (1985) Studies on somatic cell counts in milk of Swedish dairy cows. 1. Adjustment for effect of stage of lactation. Acta, agric. Scand., 35(4) : 329-338.
E v e r e t t , R.W.; Keown, J.F. and Taylor, J.F. (1982) The problem ofheterogenous within herd error variances when identifying elite cows. J. Dairy Sci., suppl l.Pg 100 (Abst).
Falconer,D.S. (1989) An introduction to Quantitative Genetics,ThirdEdition Pg 125.Publishers: Longman Group.
Fimland, E.A.; Bar-Anan, R. and Harvey, W.R. (1972) Studies on dairyrecords from Israeli-Friesian cattle. 1. Influence of some environmental effects. Acta. Agric. Scand., 22: 34.
Frisch, J.E. and Vercoe, J.E. (1986) Nuclear and related techniques for improving productivity of indigenous animals in harsh environments. Proceedings of an advisory group meeting held in Ankara 3rd-8th June 1985 Pg 49-60, Vienna, Austria.
Funk, D.C.; Hansen, L.B.; Funk,D.A. (1991) Adjustment of linear type
67scores from Holstein classification for age and stage oflactation. J. Dairy Sc., 74(2): 645-650.
G a l u k a n d e , E.B.; Mahadevan, P. and Black, J.G. (1962) Milk production in the East African Zebu. Anim. Prod., 4: 329-336.
Garrick, D.J. and Vleck, L.D.van (1987) Aspects of selection for performance in several environments with heterogenous variances. J. Anim. Sci., 65(2): 409 - 421.
G r a h a m , N.J.; Smith, C. and Gibson, J.P. (1991) Investigation ofpreferential treatment for milk yield in Canadian Holsteins.Can. J. Anim. Sci., 71: 21-27.
G u p t a , K.; Dhillon, J.S.; Narang, M.P. (1990) Factors affecting first lactation milk production in Jersey cows. Indian J. Dairy Sci., 43(4): 462-465.
G y a w u, P.; Asare, K.; Karikari, P.K. (1988) The performance of imported Holstein -Friesian cattle and their progeny in the humid tropics. Bull. Anim. Hlth and Prod, in Afric., 36: 362-366.
H a n s e n , L.B.; Freeman, A.E. and Berger, P.J. (1983) Yield and fertilityrelationships in dairy cattle. J. Dairy Sci., 66: 293.
H a r v e y , W.R. (1990) User’s guide for LSMLMW least squares and maximumlikelihood computer programme. Ohio State University, Ohio.
H i c k m a n , C.G. (1977) Interpreting the results of dairy bull progeny testing by artificial insemination 2. Present method ofanalyzing daughter records. Worl Anim. Review., 23: 17-19.
r
Hill/ W.G. and Swanson, G.J.T (1983) A selection index for dairy cows. Anim.Prod., 37: 313-319.
Hill/ G. (1984) On selection among groups with heterogenous variance.Anim. Prod., 39: 473-477.
Janson, L. (1980) Studies on Fertility traits in Swedish dairy cattle.2.Genetic parameters. Acta. Agric. Scand., 30: 277.
Jasiorowski, H.A.; Stolzman, M. and Reklewski, Z. (1988) Theinternational Friesian Strain comparison trial. A world perspective. Pgs 132, 362.
Juma, K.H. and Jajo, S.H. (1986) Evaluation of factors affecting 305 - day milk yield in Friesian cattle. In: 3rd world congress on Genetics applied to Livestock Production, Lincoln, Nebraska, U.S.A,July,16-22, Pg 520-523.
K a b u g a , J.D. and Agyemang, G.K. (1984) Performance of Canadian Holstein- Friesian cattle in the humid forest zone of Ghana. 1. Milk production. Trop. Anim. Hlth and Prod., 16(2): 85-94.
Katochi, S.; Yadav, M.C.; Gupta, S. (1990) Non-genetic factors affecting lifetime production traits in Jersey cattle. Indian Vet. J.,67(6): 520-523.
K a t y e g a , P.M.J. (1988) Performance of Jerseys on the slopes of mount Meru, Tanzania. World Rev., 65: 24-30.
K i m e n y e , D. (1978) A genetic study of the Kenyan Sahiwal breed. Ph.D Thesis, University of Nairobi.
68
69Kiwuwa, G.H. (1974) Production characteristics of Friesian and Jersey dairy
cattle on privately owned farms in Kenya. E. Afric. Agric. For.J., 39: 289-297.
K i w u w a , G.H.; Trail, J.C.M.; Kurtu, M.Y.; Worku, G.; Anderson, F.M.;Durkin, J. (1983) Crossbred dairy cattle productivity in Arsi Region, Ethiopia. International Livestock Centre for Africa, ILCA Research Report No. 11, Addis Ababa, Ethiopia.
Krishnaiah, N.; Sankara, R.I.; Satyanarayana, G.; Murithy, S.R.A.(1988) Effect of parity and season on the peak yield and days to attain peak yield in Ongole crossbred cattle. Indian. J. DairySci., 41(2): 224-226.
Lindstrom, U.B. and Solbu, H. (1978) Studies on milk records from
Kenya II. Systematic effects on production traits. Z.Tierzuchtg Ziichtgsbiol., 95: 33-42.
Lusweti, C.E. (1991) Lactation curves of Holstein- Friesian and Jersey cows in Zimbabwe. S. Afri. J. Anim. Sci., 21(1): 11-15.
Madalena, F.E. (1988) A note on the effect of variation of lactation length on the efficiency of tropical cattle selection for milk yield. Theoretical and Applied Genetics, 76(6): 830-834.
Marples, H.J.S. and Trail, J.C.M. (1967) An analysis of a commercial herd of dairy cattle in Uganda. Trop. Agric. Trin., 44: 69-75.
Marshall, D.M.; Minqiang, W. ; Freking, B.A . (1990) Relative calving dateof first calf heifers as related to production efficiency and subsequent reproductive performance. J. Anim. Sci.,
7068(7): 1812-1817.
Martinez, M. L; Lee,A.J; Lin,C.V. (1990) Multiplicative age-seasonadjustment factors by maximum likelihood, gross comparisons and paired comparisons. J.Dairy Sci., 73(3)i819-825.
Matsoukas, J. and Fairchild, T.P. (1975) Effects of various factors on reproductive efficiency. J. Dairy Sci., 58: 540.
Mbap, S.T. and Ngere, L.O. (1989) Productivity of Friesian cattle in a subtropical environment. Tropical Agri., 66: 121-124.
Mbap, S .T ., and Ngere, L.O. (1991) Breed and environmental factorsaffecting the performance of some imported and crossbredcattle in Ibadan, Nigeria. Trop. Agri., 68(2): 181-185.
McDaniel, B.T. and Corley, E.L. (1967) Relationships between sire evaluations at different herd-mate levels. J. Dairy Sci., 50:735.
Mchau, K.W. an Syrstad, O. (1991) Production characteristic of Mpwapwa cattle.2. Shape of the lactation curve. World Anim. Review., 66(1): 4854.
Meinert, T.R. ; Pearson, R.E.; Vinson, W.E.; Cassel, B.G. (1988a) Prediction of daughters performance from dam's cow index adjusted for within herd variance. J. Dairy Sci., 71: 2220.
Meinert, T.R.; Pearson, R.E.; Vinson, W.E.; Cassel, B.G. (1988b) Effect of within herd variance and herd mean production on response to selection within herd. J. Dairy Sci., 71: 3405.
71M e y e r , K. (1983) Scope for evaluating dairy sires using first and
second lactation records. Livestock Prod. Sci., 10(6): 531-553.
M o s i , R.O. (1984) The use of milk records in cow evaluation and Dairy cattle improvement in Kenya. Ph.D Thesis, University ofWales.
Mukasa Mugerwa E.(1989) A female Bos indicusCentre for AfricaEthiopia.
review of reproductive performance of (Zebu) cattle. International Livestock
Monograph No. 6, ILCA, Addis Ababa,
Murdia, C.K. and Tripathi, V.N (1990) Influence of non-genetic factors on production traits in Jersey cattle. Indian J.Anim. Prod. and Management., 6(3): 140-144.
Mwai , A.O. and Mosi, R.O. (1991) Factors affecting 305 - day and annual milk yields of Dutch Friesian cows at the National Animal Husbandry Research Centre, Naivasha, Kenya. A paper presented at the Eastern and Southern Regional Animal Production Societies Conference in Harare, Zimbabwe, August, 1991.
N g e r e , L.O.; McDowell, R.E.; Bhattacharya, S. and Guha, H. (1973)Factors influencing milk yield of Hariana cattle. J. Anim. Sci.,36: 457-465.
N j u b i , D.M. (1990) Characterisation of pure bred Jerseys in the coastal sub- humid zone of Kenya. M.Sc. Thesis, University of Nairobi.
P a n d a , P.B. and Sandhu, D.P. (1983) Some genetic and non-genetic factorsaffecting milk production in cross-breds of Holstein and Jersey
72with Hariana and deshi Bengal cows. Indian Vet. J., 60(2): 99-106.
Pan Livestock Services. (1989) Panacea. Department of Agriculture, University of Reading, Reading, Berkshire, England.
Parekh, H.K.B. and Singh, R.K. (1987) Assesment of different methods of cowevaluation. Indian J. Dairy Sci., 40(2): 158-162.
Philipsson, J.; Mosi,R.O.; Mwangi,J.L.N and Rege,J.E.O (1988) Kenya artificial insemination rehabilitation programme report on thebreeding programme (1)* Central artificial insemination station, Kabete, Kenya.
Powell, R.L. and Norman, H.D. (1984) Response within herd to sireselection. J. Dairy Sci., 67: 2021.
Powell, R.L.; Norman, H.D. and Weinland, B.T. (1983) Cow evaluation at different milk yields of herds. J. Dairy Sci., 66: 148-154.
Rege, J.E.O. and Mosi, R.O. (1989) An analysis of the Kenyan Friesian Breed from 1968 to 1984: Genetic and environmental trends and related parameters of milk production. Bull. Anim. Hlth.Prod. Afric., 37: 267-278.
Ron, M. and Hillel, J. (1983) Genotype X Environment interaction in dairycattle and its role in breeding programmes. Theor. Appl. Genetics,66(2): 93-99.
Ruvuna, F.; Mao, I.L.; McDowell, R.E.; Gurnani, M. (1984) Environmental and Genetic variation in milk yield of Native cattle and crosses with Brown Swiss in India. J. Anim. Sci., 59(1): 74-85.
73Saxena, R.K.; Raheja,K.L.; Singh,A. (1991) Correction factors for
adjusting lactation milk yield for lactation length in Sahiwal. Indian J. Anim. Sc., 61(5):537-542.
Scneeberger, C.P.; Wellington, K.E. and McDowell, R.E. (1982) Performance ofJamaica Hope in commercial dairy herds in Jamaica. J.Dairy Sci.,65: 1364-1371.
Searle, S.R. and Henderson, C.R. (1960) Judging the effectiveness of age- correction factors. J. Dairy Sci., 43: 966.
Seykora, A.J. and McDaniel, B.T. (1983) Heritabilities and correlations of lactation yields and fertility for Friesians. J. Dairy Sci., 66:1486.
Short,T.H; Blake,R.W; Quaas,R.L; Vleck,L.D.Van. (1990) Heterogenouswithin-herd variance.1.Genetic parameters for first and second lactation milk yields of grade Holstein cows.J.Dairy Sci.,73(11):3312- 3320.
Shrivastava, G.K. and Khan, F.H. (1989) Simple regression factor for extending partial yields in Sahiwal cows. Indian vet. J.,66(4): 371-373.
Singh, S.B. and Desai, R.N. (1961) Inheritance of some economic characters in Hariana cattle. 1. Age at first calving 2. Peak yield 3. Milk yield 4. Lactation period. Indian J. Dairy Sci., 14:141-153.
Singh, R. and Tomar, S.S. (1991) Performance characteristics of Karan Fries cows. Indian J. Anim. Sci., 61(2): 192- 195.
74
S t r a n d b e r g , E. and Danell, B. (1989) Genetic and phenotypic parameters for production and days open in the first three lactations of Swedish dairy cattle. Acta. Agric. Scand., 39: 203.
S y r s t a d , O. (1965) Studies on dairy herd records. 2. Effect of age and season of calving. Acta. Agric. Sand., 15 : 31-64.
Veer, J.C.De and Vleck, L.D. van (1987) Genetic parameters for firstlactation milk yields at three levels of herd production. J. Dairy Sci., 70(7): 1434-1441.
Vercoe, J.E. and Frisch, J.E. (1990) Genotype and environment interaction with particular reference to cattle raised in the tropics. In:Proceedings: The 5th AAAP Animal Sciences Congress, May 27- June 1,1990, Taipei, Republic of China. In: Anim. Breed.Abst. 1991.
V i n s o n , W.E. (1987) Potential bias in genetic evaluations from differences in variation within herd. J. Dairy Sci., 70: 2450.
V l e c k , L.D.van.; Schneider, J.C.; Tassel, C.P.van (1988) Comparison ofheritability and variation for milk yield of registered and non- registered Holstein cows. J. Dairy Sci., 71(8): 2271-2277.
Wakhungu, J.W.(1988) Phenotypic, Genetic and Environmental trends in Kenya Sahiwal cattle. M.Sc. Thesis, University of Nairobi.
Weller, J.I.; Ron, M.; Bar-Anan, R. (1987) Effects of persistency and production on the genetic parameters of milk and fat yield in Israel- Holsteins. J. Dairy Sci., 70(3): 672-680.
75Wilhelm, A.E. and Mao, I.L. (1989) Relationships between characteristics of
herd bull dams and predicted transmitting ability of young bulls. J. Dairy Sci., 72: 2395-2401.
W o o d , P.D.P. (1980) Breed variations in the shape of lactation curve of cattle and their implications for efficiency. Anim. Prod., 31: 133-141.
Y e o t i k a r , S.S. and Deshpande, K.S. (1990) Factors affecting lactation milkyield in village cross-breds. Indian. J. Anim. Sc., 60(11):1390-1391.
76CHAPTER 8: APPENDICESAppendix 1 Factors used by Kenya Milk Records for correcting’