Universidad Polit ´ ecnica de Madrid Escuela T ´ ecnica Superior de Ingenieros de Telecomunicaci ´ on Trabajo Fin de Grado HETEROGENEOUS ARCHITECTURE FOR THE OPTIMIZATION OF LARGE-SCALE GRAPH PROCESSING DATA CENTRES Clara Luc´ ıa Alonso Mart´ ın 12 de Julio de 2015
Transcript
Universidad Politecnica de Madrid
Escuela Tecnica Superiorde Ingenieros de Telecomunicacion
Trabajo Fin de Grado
HETEROGENEOUSARCHITECTURE FOR THE
OPTIMIZATION OFLARGE-SCALE GRAPH
PROCESSING DATACENTRES
Clara Lucıa Alonso Martın
12 de Julio de 2015
Trabajo Fin de Grado
Tıtulo: Heterogeneous architecture for the optimizationof large-scale graph processing data centres
Autor: Dna. Clara Lucıa Alonso Martın
Tutor: D. Jose Manuel Moya Fernandez
Departamento: Ingenierıa Electronica
Los miembros del tribunal
Presidente: D. Ruben San-Segundo Hernandez
Vocal: D. Juan Antonio Lopez Martın
Secretario: D. Jose Manuel Moya Fernandez
Suplente: D. Pedro Jose Malagon Marzo
Acuerdan otorgar al Trabajo Fin de Grado la calificacion de:
Madrid, a de Julio de 2015
Fdo.:
Universidad Politecnica de Madrid
Escuela Tecnica Superior deIngenieros de Telecomunicacion
Trabajo Fin de Grado
HETEROGENEOUSARCHITECTURE FOR THE
OPTIMIZATION OFLARGE-SCALE GRAPH
PROCESSING DATACENTRES
Clara Lucıa Alonso Martın
12 de Julio de 2015
Abstract
With the Cloud Computing boom, there has been a growing increase of data processing
applications and therefore, achieving more efficiency in data processing data centers has
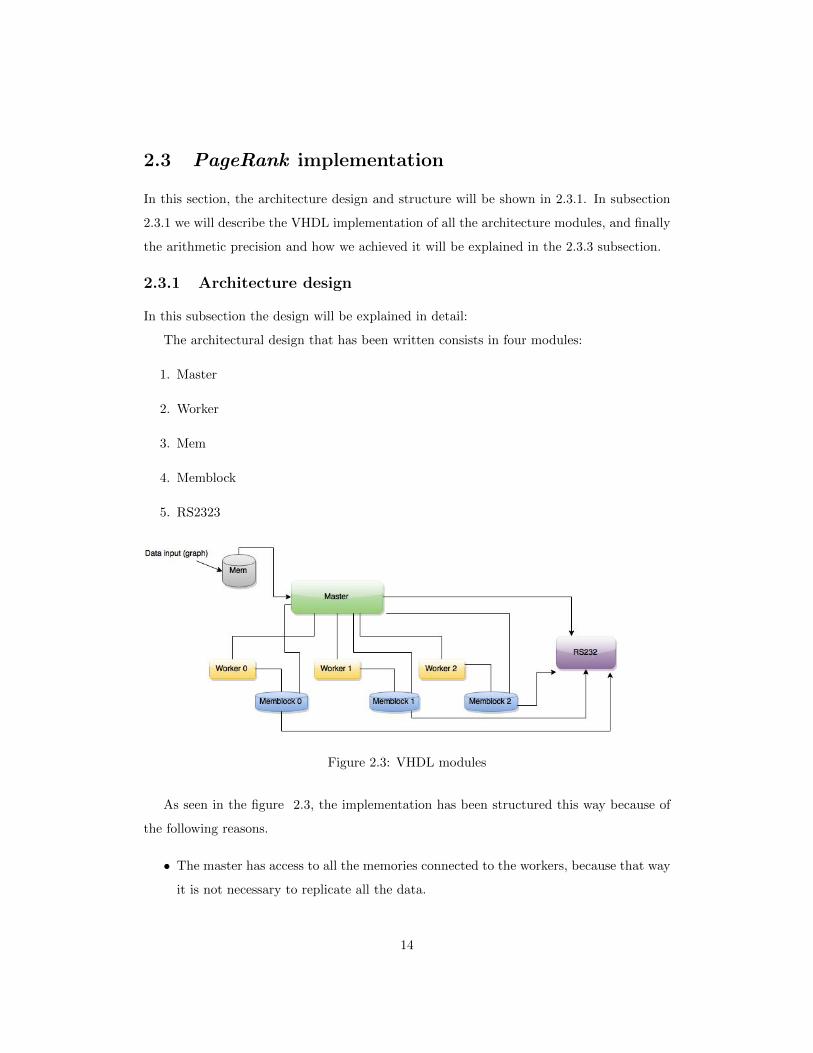
become more relevant. The object of this project is obtaining tools to analyze the viability
and cost-effectiveness of designing Data Centres specialized in processing data with adapted
cooling systems, architectures, etc.
Some data processing applications benefit from software architectures, while others can be
more efficient in hardware architectures. As there are already some software architectures
with very good results in graph processing such as XPregel, a hardware architecture will
be described in VHDL in this project, implementing Google’s PageRank in a scalable way.
This algorithm has been chosen due to the fact that it could be more efficient in hardware
architectures, because of its characteristics, that will be explained later in this abstract.
PageRank is used to measure the importance of a page web in the internet and its position
when you look for a keyword in Google’s search web. This algorithm is based on Graph
Theory; every web page being a vertex of a graph; and links between pages, the edges of
that graph.
In this project, an analysis of the state of the art will be performed first. XPregel
PageRank implementation is considered one of the most efficient graph processing systems
in time and energy. That is the reason why that implementation will be studied.
However, due to the fact that XPregel computes graph processing algorithms in general,
it does not take into account some of the specific characteristics of PageRank, so the imple-
mentation is not optimal, and therefore leaves some room for improvement. This is because
in PageRank, storing every message sent by one vertex is a waste of memory; they are all
the same and equal to their PageRank.
The design will be described in VHDL, taking into account the above mentioned PageRank
characteristic, avoiding the storage of the same message several times.
VHDL has been chosen because present operative system architectures do not scale in
an efficient way. The objective is to see whether the processing would be more efficient in a
new architecture.
1
The next step will be to write the code, making an scalable structure, because usually
millions of page webs or vertexes are involved in each iteration. Afterwards, the code
will be synthesised and tested in an FPGA. The last step will be the evaluation of the
implementation and of possible improvements to increase energy efficiency.
It was considered a reduction in energy consumption due to the fact that nowadays
large data processing is becoming increasingly relevant with Internet expansion,and the
new Internet of Things. This presents a big problem in large data centres because they
consume a lot of energy along with their cooling systems, so any reduction in this area is
crucial to continue expanding them or just keep them going more efficiently.
Resumen
Con el auge del Cloud Computing, las aplicaciones de proceso de datos han sufrido un
incremento de demanda, y por ello ha cobrado importancia lograr mas eficiencia en los Cen-
tros de Proceso de datos. El objetivo de este trabajo es la obtencion de herramientas que
permitan analizar la viabilidad y rentabilidad de disenar Centros de Datos especializados
para procesamiento de datos, con una arquitectura, sistemas de refrigeracion, etc. adap-
tados. Algunas aplicaciones de procesamiento de datos se benefician de las arquitecturas
software, mientras que en otras puede ser mas eficiente un procesamiento con arquitectura
hardware. Debido a que ya hay software con muy buenos resultados en el procesamiento
de grafos, como el sistema XPregel, en este proyecto se realizara una arquitectura hardware
en VHDL, implementando el algoritmo PageRank de Google de forma escalable. Se ha
escogido este algoritmo ya que podrıa ser mas eficiente en arquitectura hardware, debido a
sus caracterısticas concretas que se indicaran mas adelante.
PageRank sirve para ordenar las paginas por su relevancia en la web, utilizando para
ello la teorıa de grafos, siendo cada pagina web un vertice de un grafo; y los enlaces entre
paginas, las aristas del citado grafo.
En este proyecto, primero se realizara un analisis del estado de la tecnica. Se supone
que la implementacion en XPregel, un sistema de procesamiento de grafos, es una de las
mas eficientes. Por ello se estudiara esta ultima implementacion. Sin embargo, debido a que
Xpregel procesa, en general, algoritmos que trabajan con grafos; no tiene en cuenta ciertas
caracterısticas del algoritmo PageRank, por lo que la implementacion no es optima. Esto es
2
debido a que en PageRank, almacenar todos los datos que manda un mismo vertice es un
gasto innecesario de memoria ya que todos los mensajes que manda un vertice son iguales
entre sı, e iguales a su PageRank.
Se realizara el diseno en VHDL teniendo en cuenta esta caracterıstica del citado algo-
ritmo, evitando almacenar varias veces los mensajes que son iguales. Se ha elegido imple-
mentar PageRank en VHDL porque actualmente las arquitecturas de los sistemas operativos
no escalan adecuadamente. Se busca evaluar si con otra arquitectura se obtienen mejores
resultados.
Se realizara un diseno partiendo de cero, utilizando la memoria ROM de IPcore de Xillinx
(Software de desarrollo en VHDL), generada automaticamente. Se considera hacer cuatro
tipos de modulos para que ası el procesamiento se pueda hacer en paralelo. Se simplificara
la estructura de XPregel con el fin de intentar aprovechar la particularidad de PageRank
mencionada, que hace que XPregel no le saque el maximo partido.
Despues se escribira el codigo, realizando una estructura escalable, ya que en la com-
putacion intervienen millones de paginas web. A continuacion, se sintetizara y se probara
el codigo en una FPGA. El ultimo paso sera una evaluacion de la implementacion, y de
posibles mejoras en cuanto al consumo.
Keywords
PageRank, energy-aware data centres, Cloud Computing, VHDL, FPGA, graph processing.
Acknowledgements
To my family, who has been by my side all this time, and that has been a great support
during the project. To my tutor Jose Manuel Moya, and all the Green LSI members, specially
Pedro and Marina, who have been there through all the process to help me. Thanks for
letting me be a part of this research group and for helping me in every step along the way
of this project. I also want to thank my friends for being there by my side when I was so
stressed and nervous about presenting the project.
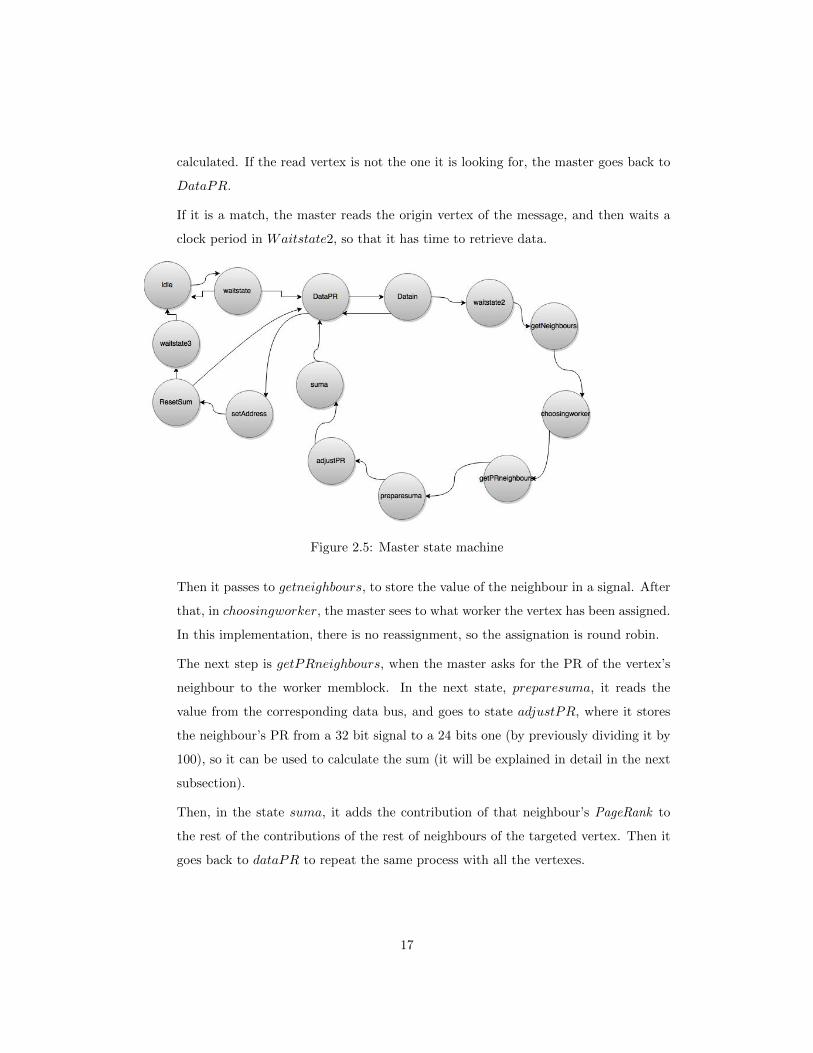
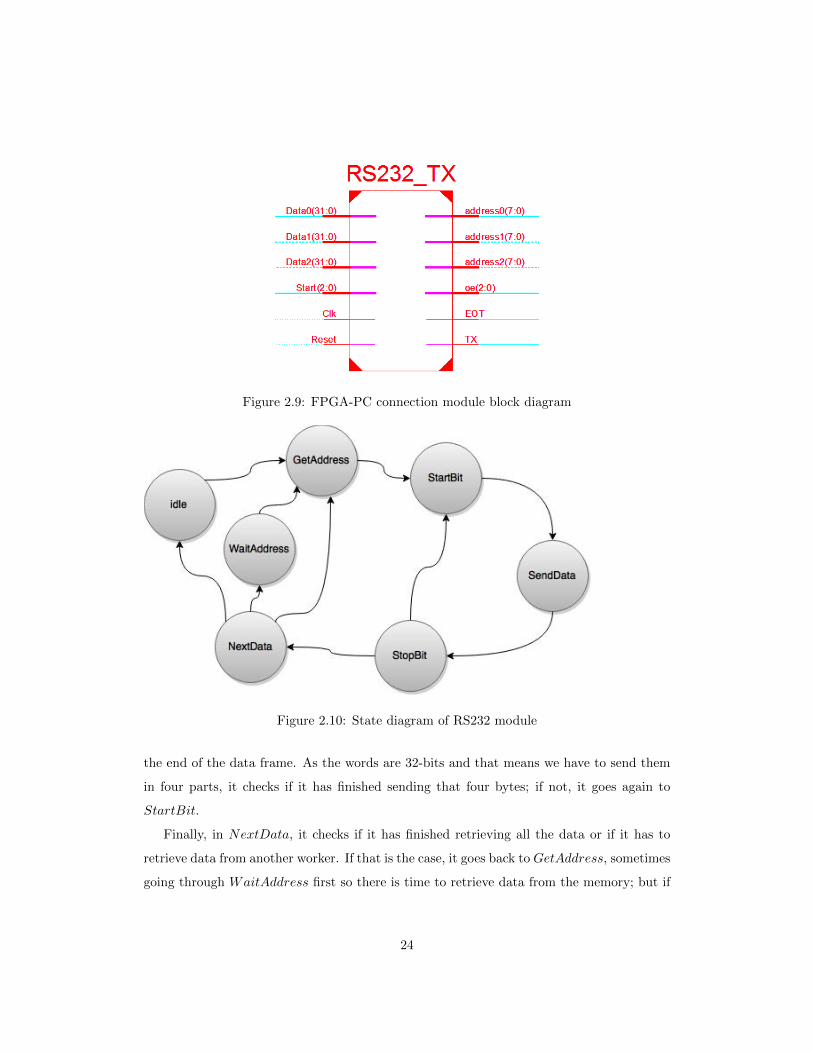
the end of the data frame. As the words are 32-bits and that means we have to send them
in four parts, it checks if it has finished sending that four bytes; if not, it goes again to
StartBit.
Finally, in NextData, it checks if it has finished retrieving all the data or if it has to
retrieve data from another worker. If that is the case, it goes back to GetAddress, sometimes
going through WaitAddress first so there is time to retrieve data from the memory; but if
24
it has finished, it goes indefinitely to idle.
In order to be able to see if the architecture was working correctly, we wanted to check
the output data (TX) with an oscilloscope. For that, we implemented the RS232 module
so it sends the output data again and again until it is reset. Otherwise, it was very difficult
to see the results in the oscilloscope, but in the final implementation, the RS232 module
would send the results only once.
So it is an automatic way of getting the results in the PC. When the algorithm converges,
the RS232 module begins getting the PageRank from the memblocks in order. That means,
in this architecture, that first it has address zero, and retrieves the data in every memory
for that address, then it increments that address to follow the same process again, and so
on until it reaches the number of vertexes in the graph.
To receive the data in the PC, a library from the Green LSI has been used. It is called
mod rs232 listen, and is a server that opens a socket, and receives the data trough the serial
port, given a transmission speed and a port. Then we have programmed a client in Python
that can connect to the mod rs232 listen socket to retrieve the data, joining the 4 bytes of
each data to print the PageRank results in the console.
2.5 Performance evaluation
The implementation has been simulated using the ISIM simulator, which is part of the Ise
Xillinx software [15]. To do that, a simple graph has been chosen, to easily check if the
results were correct. Due to the fact that the structure is scalable, if the results were correct
with a small graph, they would be correct too when computing large graphs.
The example graph is shown in the figure 2.11
It has been processed in XPregel too, in order to compare results, obtaining the following
PageRanks (see table 2.1):
See that the results in table 2.1 are coherent, because vertexes 0 and 1, which do not
have any back links, have the same PageRank, equal to 0.15/n, n being the number of
vertexes. Vertex 2 PageRank is the highest, because we can see it has the highest number
of backlinks. Finally it also makes sense that vertex 4 has a higher PageRank that vertex 3,
because each of them have only a backlink, but the one to vertex 3 is from vertex 1, which
25
Figure 2.11: Test graph
Table 2.1: XPregel results
Vertex PageRank
0 0.031 0.032 0.10186218753 0.042754 0.04816875
has the lowest PageRank, while the one to vertex four is from vertex 3, which has a higher
PageRank that vertex 1.
2.5.1 ISIM simulator
In this subsection, the simulation of the system in the Xillinx software will be explained in
depth1.
When testing the code in XPregel, the file in X10 called SimplePageRank.x10 has been
modified to get the results, including the number of iterations, the PageRank of the vertexes
in each iteration, the overall computing time and also in each iteration, and the memory
usage. In the simulation, we can see (figure 2.13) that whenever the master is computing,
the workers are in idle state and vice versa.
1This simulation has been done after changing the code to make arithmetic shifts in the register insteadof divisions, so the output data is slightly different because those changes result in a change of the dampingfactor, which can be varied.
26
Figure 2.12: Modules states caption
Note that in this example, worker zero has two vertexes (0 and 3), worker 1 has two
vertexes (1 and 4) but worker 2 has one vertex (2) because they have been assigned with
round-robin scheduling. Bearing that in mind, it makes sense that in the figure 2.12 can be
observed that the worker 2 ends computing before the others.
Figure 2.13: States caption zoomed out
In figure 2.6, it can be noted that the synchronisation time is higher in comparison with
the time the workers spend computing the vertexes. The synchronisation time gets higher
in proportion when the number of vertexes increases.
We can also see, in figure 2.14 that the PageRank of a vertex is stored in the memblock
connected to the worker to which the vertex is assigned. In the figure, the blue signals are
the vertex PageRanks. Note that this is the only figure of this section of the implementation
with d=0.85, so the results can be compared with those of the example graph described in
the previous subsection.
Note that the signal at the top (halt) is ”111”, that indicates that all workers have ended
computing their vertexes. So the value in the RAMs is the final value of their PageRanks,
which matches the values given by the XPregel system with a maximum error of 10−6.
In figure 2.15, we can see the states in which the worker has to compute. This capture
shows that worker zero signals (id is ”00”). The signal where we have the PageRank read
27
Figure 2.14: PageRank stored in memblocks
Figure 2.15: Worker states
from the memory to compare to the next one to know if the algorithm has converged
is shown behind signal sum and it is called pranterior. The sum, needed to calculate the
vertex PageRank, is showed in blue. Note that vote to halt is zero, so there is not any vertex
that does not have to be iterated the next superstep. Terminate is also zero, therefore the
worker has not ended computation.
We can see how it is computing the first vertex that it has assigned (in this case, as
it is worker 0, when i signal is two and it is done storing the last PageRank, it will stop
computing).
28
Figure 2.16 shows the same states zoomed in, to see more clearly the name of each state.
Note that halt is zero, so the worker has not ended computing. Although not shown in this
figure, compute would be at high level, that means the master is indicating the worker to
compute.
Figure 2.16: Zoomed in worker states
The master is shown in the Figure 2.17, where we can see how it is looking in the main
memory for a match with the current target vertex (2, in the red signal). The master
is summing the messages from all the neighbours to the targeted vertex, and the signal
neighbour indicated that it is summing the message (or the PageRank contribution) from
vertex 1 to 2 (in signal i). The graph would be stored in the following way (see table 2.2).
Table 2.2: Graph table
Source Target Weight
1 2 0.51 3 0.53 2 0.54 2 13 4 0.5
29
So therefore the first column is a match, and the master reads the weight, (0.5) (see
databusprin in green).
Figure 2.17: Initial master states
As the master has found the targeted vertex (figure 2.18), it has added to the messages
(sum) the multiplication of that weigh by the PageRank of the source vertex of that message.
It has done the same with all the vertex neighbours, until j became equal to the number of
memory addresses in the main memory. Then the master reads which vertex is the source,
in this case it is vertex 1 (because we are in the first entry of the main memory). Afterwards,
it stores the sum, adjusting the PR first so that the result of the multiplication fits in the
bits destined for the result.
In figure 2.19 we can see how the module RS232 retrieves the data from the memories, to
send it to the PC. The blue signal is the serial port, that is connected to the PC.
We connect a device, the PmodRS232 [3], to the FPGA JA ports, so it can connect to
a serial port in the PC.
The green signal is the data being transmitted at that moment, which is taken from the
memblocks. It puts the same address, at first zero, in each worker and goes retrieving the
data from that address in order (first worker0, then worker1...) until it reads the data from
30
Figure 2.18: Master states to calculate the sum of messages
Figure 2.19: RS232 module simulation
the last worker. Then, it increments the address and repeats the same process. As we can
see, the RS232 module will not start sending data until all workers have voted to halt.
Note that the time the systems spends computing and iterating the algorithm is way
smaller than the time it takes to communicate with the PC and send the data. The compu-
31
tation is done, in this case (in the simulation), in 6 us, while to retrieve data it takes around
1700 us.
Figure 2.20: RS232 module simulation zoom
In figure 2.20, we can see the same signals, zoomed on the states between two sendDatastates.
There is one bit to indicate the start of the transmission, and another to indicate its end.
If we zoom further (figure 2.21), we can see that there are still more states between
sendData states. These are very short in time and were explained in the previous subsection.
Figure 2.21: RS232 module: states in between
32
Chapter 3
Results and conclusions
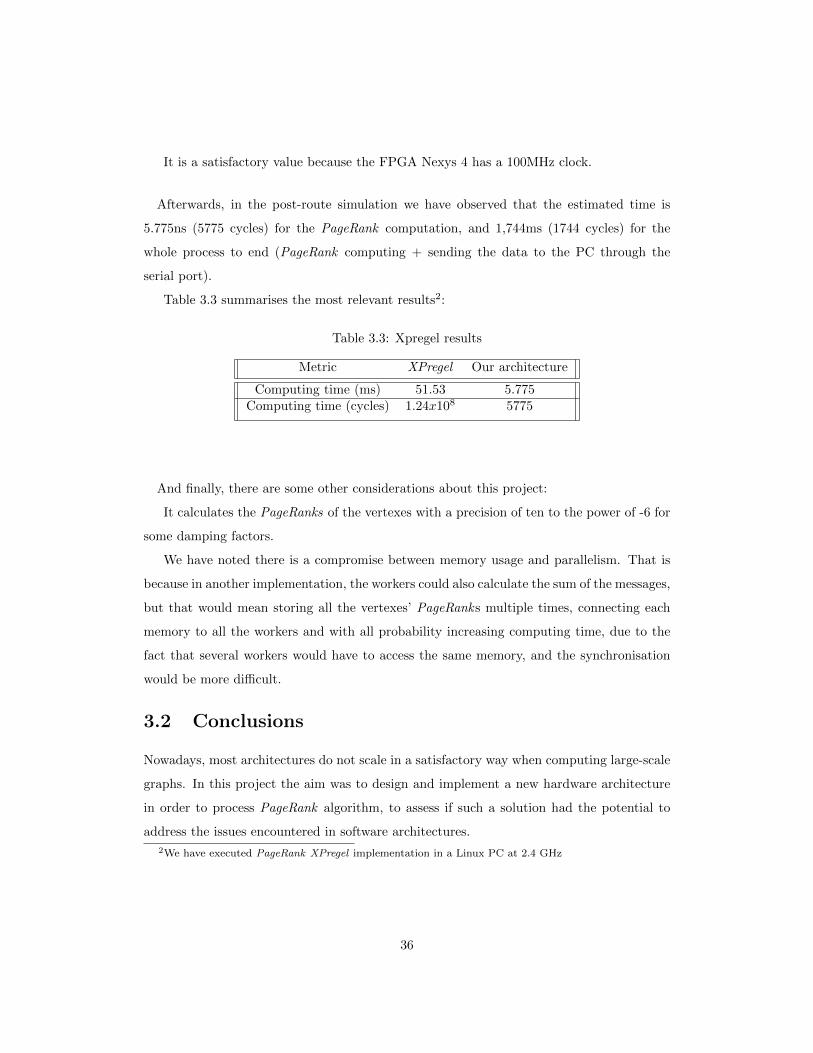
3.1 Results
We have compiled all the X10 libraries with Scalegraph, a graph processing library that
uses X10, a language for parallel computation, to compile afterwards the XPregel files that
contain the XPregel PageRank implementation. Then we have modified the code 1 to obtain
the time computing, memory usage and the PageRank results for each iteration. In the table
some of this results can be seen:
Table 3.1: XPregel PageRank results
Time computing (ms) Time computing (cycles) Memory used (MB)
51.53 1.74 · 108 1.32
We have designed and described an architecture in VHDL, using the Xillinx software,
specially the program ISE WEBPACK [15]. For an input graph given, that must be a coe
file (a graph file) introduced in the main memory, the system stores the results in the FPGA
memories, and sends then to the PC using RS232 protocol, to retrieve the results. It has
been simulated in the Xillinx softare, as seen in the performance evaluation chapter, and
then it has been synthesized:
HDL Synthesis Report Macro Statistics (This is the number of logic ports used for the
implementation)
1In this results section, all experiments have been carried out with a damping factor d=0.78125 in orderto achieve more precision while being able to make bit shifts instead of divisions in our architecture.
33
• # Multipliers : 3
• # Adders/Subtractors : 52
• # Registers : 51
• # Comparators : 56
• # Multiplexers : 391
• # Tristates : 270
• # FSMs : 5
This report also gives information about the used FPGA resources. This is the Device
utilisation summary:
• Slice Logic Utilisation:
Number of Slice Registers: 704
Number of Slice LUTs: 1155
Number used as Logic: 771
Number used as Memory: 384
Number used as RAM: 384
• Slice Logic Distribution:
Number of LUT Flip Flop pairs used: 1540
– Number with an unused Flip Flop: 836
– Number with an unused LUT: 385
– Number of fully used LUT-FF pairs: 319
Number of unique control sets: 30
• IO Utilisation:
Number of IOs: 4
Number of bonded IOBs: 4
34
• Specific Feature Utilisation:
Number of Block RAM/FIFO: 1
Number using Block RAM only: 1
Number of BUFG/BUFGCTRLs: 1
Number of DSP48E1s: 1
The utilisation of the FPGA resources is very low as expected (around 1 or 2%), because
we are only computing a 5 vertex graph.
The XPower Analyzer gives the estimated power consume, which can be seen in table 3.2
.
Table 3.2: XPower Analyzer results
On-chip Power(W)
Clocks 0.003Logic 0.004
Signals 0.005BRAMs 0.002DSPs 0.000IOs 0.003
Leakage 0.088Total 0.106
As we can see in table 3.2, most of the energy consumption is due to leakage, and the rest
depends on the design. It appears that the signals utilisation, registers, maybe the number
of states in the FSMs, etc is the energy bottleneck in this architecture. The next item that
has presented more energy consumption is the logic, which is also related to the way the
architecture is implemented.
Then we have implemented the design (Translate, Map, Place & Route) to finally generate
the bit stream file and configure the FPGA. It is a Nexys 4, from Digilent, and this is the
user manual [4]. In the Place & route report, we can see the following: